Structural and Magnetic Behavior of Oxidized and Reduced Fe Doped LiNbO3 Powders
by
 ,
,
Cesar D. Fierro-Ruiz
1, 
Oswaldo Sánchez-Dena
2 ,
,
Eva M. Cabral-Larquier
1,
José T. Elizalde-Galindo
1 and
Rurik Farías
1,* 1
Instituto de Ingeniería y Tecnología, Universidad Autónoma de Ciudad Juárez, Av. Del Charro 450 Norte, Ciudad Juárez, Chihuahua 32310, Mexico
2
Instituto de Física, Universidad Nacional Autónoma de México, Mexico City 04510, Mexico
*
Author to whom correspondence should be addressed.
Crystals 2018, 8(3), 108; https://doi.org/10.3390/cryst8030108
Submission received: 30 December 2017
/
Revised: 31 January 2018
/
Accepted: 6 February 2018
/
Published: 26 February 2018
(This article belongs to the Special Issue Lithium Niobate: Bulk Crystals, Composites, Thin Films and Nanocrystals)
Abstract
:Changes in structural and magnetic properties have been systematically induced in lithium niobate (LiNbO3) powders, Fe-doped with different concentrations and thermally treated in oxidized and reduced states. A rather strong ferromagnetic response at room temperature with a saturation magnetization of 0.96 Am2kg−1 was obtained for the higher utilized doping concentration, which is of the order of 1% mol. This may be considered a first report of the manifestation of ferromagnetism in nanocrystalline lithium niobate powders within the regime of very low Fe-doping concentrations. Post-thermal treatment in a controlled atmosphere is key for inducing and detecting this behavior, which can also be explained as the effective recombination of Fe impurities with oxygen vacancies in the surface of the material. Mechanochemical-calcination was employed for the synthesis of LiNbO3 powders and after that, a diffusion process of 0.44%, 0.89%, 1.47% and 2.20% mass of Fe2O3 was used in the Fe-doping. Oxidation and reduction processes were performed using a controlled atmosphere of ultra-high purity oxygen and hydrogen, respectively. X-ray diffraction and Raman spectroscopy were employed to characterize the materials. The magnetic properties were studied using Vibration Sample magnetometry and Electron Spin Resonance spectroscopy.
1. Introduction
Given the great variety of physical and chemical properties that can be ascribed to lithium niobate (LiNbO3; LN), it can be classified into several subclasses of materials. Ever since the pioneering work at Bell Laboratories—published in 1966 [1,2,3,4,5]—a myriad of well-known existent and potential applications of this material have been addressed, which are described elsewhere [6,7,8,9,10,11]. Interestingly enough, apart from its structure, the definition or description of LN is given in accordance with the particular property or application to be investigated. Effectively, LN can be labeled with any of the following: dielectric, uniaxial crystal, metallic oxide, ceramic, ferroelectric, pyroelectric, piezoelectric, photorefractive, photovoltaic, non-centrosymmetric non-linear medium and frequency converter, among others. The exacerbation/detriment of a property associated with each of these terms is to be tuned by proper control of point defects, either intrinsic or extrinsic [12,13,14,15]. Historically, this has been a major subject of interest for the scientific community involved in the study of LN.
Particularly important are the extrinsic point defects, such as ion-doped LN crystals, for which the intrinsic capabilities of the crystal might not only be improved but new ones could also arise [15]. That is the case with Co-doped LN (LiNbO3:Co) and Fe-doped LN (LiNbO3:Fe), for which the manifestation of ferromagnetism at room temperature has been previously reported [16,17,18]. Likewise, ferromagnetism can be induced in LN crystals by creating a rather large number of oxygen vacancies after chemical reduction [19]. Both trends hold at the nanoscale (Fe-doped), however, have the drawback of small magnetic coefficients. Díaz-Moreno et al. have reported a saturation magnetization MS = 0.017 Am2kg−1 for nanocrystalline LN (nLN), which is non-doped but annealed in Ar-5% H atmosphere in order to generate oxygen vacancies at the surface of the nanocrystals [20]. Furthermore, a maximum MS of 1.18 Am2kg−1 for Fe-doped nLN with 5% mol in doping concentration was reported by Li et al. [21].
In this work, we wish to report a substantial increment of ferromagnetic response in LN nanocrystals, induced by a proper combination of these two types of point extrinsic defects. A value of MS = 0.94 Am2kg−1 has been determined for a significant lower Fe concentration of the order of 1% mol, in contrast to the results presented by Li et al. [21]. The structural characterization and magnetic behavior associated with each type of defect are given. This investigation was conducted in three main stages: (1) synthesis of nLN, in the form of powders created by a mechano-chemical reaction, followed by a fixed calcination process, (2) diffusion process of Fe-dopant in the previously obtained LN powders via mixing and milling, using different mass percentages of the dopant and fixed thermal treatments for several hours and (3) reduction and oxidation processes by post-thermal annealing in a controlled atmosphere. Structure and phase formation were verified using X-ray diffraction (XRD) and Raman spectroscopy characterization techniques.
2. Experimental
2.1. Synthesis
In stage one, nanocrystalline LN (nLN) powders were obtained by a mechanochemical-calcination route [22,23]. High purity lithium carbonate Li2CO3 and niobium pentoxide Nb2O5 (Alpha Aesar) were used as starting reagents in a 1:1 molar ratio. The respective masses of precursors were thus determined, such that 3 g of LN are produced from the following balanced chemical equation:
Li2CO3 + Nb2O5 → 2LiNbO3 + CO2,
The high-energy milling process was carried out in a SPEX 800 mill, using nylon vials with YSZ balls; a powder/ball ratio of 0.1 was used for each sample preparation. The milling was performed in 30 min cycles with 30 min pauses to avoid excessive heat inside the milling chamber, until 120 min of effective milling time was reached. The resultant amorphous materials were calcined in a Thermo Scientific F21135 furnace at 850 °C for 120 min—no ramp was used during this stage and the samples were cooled down slowly to room temperature.
Afterwards, in stage 2, nLN was mixed with Fe2O3 powder at different rates: 0.44%, 0.89%, 1.47% and 2.20% of nLN mass. A 30 min milling was performed for the homogenization of particle size distribution and lowering of the energy on the surface of the mixture. Then, doping of Fe ions was carried out by means of diffusion after a thermal treatment for 60 h at 850 °C. Hereafter the resultant materials are referred to as nLN:Fe—0.44, nLN:Fe—0.89, nLN:Fe—1.47 and nLN:Fe—2.20. Assuming that all the Fe content in Fe2O3 enters into the LN structure and from simple calculations in mass percentages, the theoretical or ideal Fe-doping concentrations would respectively correspond to 0.167%, 0.333%, 0.550% and 0.833% mol. However, because these values were not measured, we prefer not to label our samples with them. Here, it is relevant to further discussion to emphasize that by no means does the actual Fe-doping concentration surpass 1% mol for any of the studied samples.
During the final stage, reduction and oxidation treatments were performed for 30 min at 850 °C in controlled atmospheres of ultra-high purity hydrogen (TTAH) and oxygen (TTAO), so that all Fe ions shared a common valence state. An—O (oxidized) or a—R (reduced) is added to the samples labeled in the previous stage. With the thermal annealings, we sought not only an enhancement of total ferromagnetism in the samples via a secondary contribution different from the Fe-doping but also the isolation of the structures’ changes as well as changes in the properties due to each type of defect.
2.2. Characterization and Magnetic Measurements
After the first stage was concluded, the formation of pure LN phases was confirmed from XRD and (non-polarized) Raman spectroscopy. The XRD patterns were recorded using a Panalytical X-Pert system (Almelo, The Netherlands) with a CuKa radiation source (λ = 1.54 ) at 40 keV and 30 mA in the 2θ range between 10° and 80°, at 0.02° steps every 4 s. COD 2101175 containing the supplementary crystallographic data of sample nLN have been deposited with The Crystallographic Open Database. This data can be obtained free of charge via [24]. The Raman spectra were collected in the range 100–1200 cm−1, with a 1 cm−1 resolution, using a WITEC Confocal-Raman microscopy (WITec Raman Imaging, Ulm, Germany) with 532 nm of excitation wavelength. Both experimental procedures were repeated after stage 1, at the end of stage 3, to study changes in the structure and their effect on the magnetic properties of the materials.
The ferromagnetic loops were measured with a Quantum Design VSM magnetometer (Quantum Design, Inc., San Diego, CA, USA) at room temperature and with a maximum applied field Hmax = 2.4 × 10⁶ Am−1. Ultimately, a final verification of some concepts at work was obtained from Electron Spin Resonance (ESR) spectroscopy studies. The ESR spectra of the synthesized powders were recorded at room temperature, using an ESR JEOL (JES-RE3X) (JEOL Ltd., Tokyo, Japan) spectrometer equipped with a cylindrical TE 011 mode cavity in X band (9.129076–9.130250 GHz) with a 100 kHz field modulation.
3. Results and Discussion
XRD patterns and Raman spectra of the produced nLN powders (stage 1) are shown in Figure 1. From the full width at half maximum (FWHM) of the broadening (0 1 2) peak and using the Scherrer equation [25], an average crystallite size of 658 was calculated (Figure 1a). Phase formation of pure LiNbO3 is also confirmed by the Raman spectra obtained (Figure 1b), which indeed resemble the vibrational modes of this crystalline system [26,27]. Furthermore, chemical composition (Li/Nb ratio) was determined through the quantification of Li content in the sample, cLi., which, according to Schlarb et al., obeys a linear relationship to the linewidth of the lowest frequency E(TO1) vibrational mode (154 cm−1) [28]. A Lorentzian fit was applied to this vibrational mode after deconvolution, using the Fytyk computational package [29]. A value of cLi = 49.3% mol Li was obtained. Although we recognize that perhaps this value does not represent the actual or real Li content of our sample—because polarized Raman spectroscopy experiments were not conducted as described in [28]—it does support the fact of the natural tendency of LN to have intrinsic defects, namely the combination of Li vacancies and NbLi antisites.
Quantification of the saturation magnetization coefficient (Ms) was also done during this first stage through experiments with a Vibrating Sample Magnetometer (VSM). A negligible Ms for nLN was observed, compared to Ms = 0.006 Am2kg−1 for the same nLN with a post-thermal treatment of controlled atmosphere in hydrogen (TTAH). The corresponding figure is omitted for the sake of a better visualization. This result is in agreement with the work of Díaz-Moreno et al. [20].
During experimental stage 2, neither characterization-related, nor magnetic experiments, were performed. Li et al. have already described the effect of Fe-doping on nanocrystalline LN [21]. In summary, a small shift of no more than 0.02° towards lesser values in 2θ is expected for the (0 1 2) peaks present in all our nLN:Fe samples. This trend has been related to a slight decrease in the lattice parameters and thus, to contraction of the cell volume noticeable only by structure refinement procedures. Moreover, in principle, no Fe-Nb substitution might be assumed for our samples at this stage. A relatively low Ms is also expected. From Raman spectra analysis and according to Y. Y. Li et al., Fe replaces Li first and then substitutes Nb at higher doping concentrations; the latter only observed in their study for the 5% mol case. The same work reports a change of an order of magnitude in Ms after the Fe-doping concentration exceeded 2% mol, which has been attributed to Fe-Li substitution.
After Fe-doping, final thermal treatments in a controlled atmosphere, TTAH and TTAO, were done in stage 3. Figure 2a,b shows the XRD patterns obtained for both cases, these are compared to samples without Fe-doping, respectively (black lines). Significant changes cannot be seen for the diffraction data of pure nLN (Figure 1a), that is, neither a single Bragg peak associated with LN was substantially diminished nor it was observed the presence of additional peaks corresponding to binary oxides or other phases associated to Fe. Hence, Fe enters the LN structure in a substitutional fashion, not interstitially; in other words, different solid solutions of nLN have taken place. Nevertheless, with the enlarged views of XRD patterns around the (0 1 2) peaks (Figure 2c,d) a significant shift of the order of 0.10° in 2θ can be noticed. This effect has been observed notwithstanding the fact that it has already been reported that lattice parameters do not change in lightly Fe-doped LiNbO3 [30]; as stated above, it has a close relationship with the contraction/relaxation of the cell volume, which has been quantitatively determined through Rietveld refinement analysis.
Figure 3 shows the calculated cell volumes as a function of the mass% in Fe2O3. Table 1 contains this information along with the relevant fitting parameters resultant from the Rietveld analysis described in Appendix A. In the case of nLN:Fe-O, a gradual decrease can be seen in the cell volume up to a Fe-doping concentration equivalent to a 1.47% mass of Fe2O3, then it stabilizes for the maximum utilized doping concentration. While a cell volume contraction has previously been addressed to an initial incorporation of Fe3+ ions into NbLi4+ and Li+ ions in Li sites, its stabilization through further inclusion (Fe2+ in this case) implies Nb5+ substitution in Nb sites [31,32]. Still, because of the low Fe-doping concentrations used in this investigation, we assume that Fe-Nb substitution has not occurred for all samples. Also, in contrast to the work of Y. Y. Li et al., in which it is stated that no Fe-Li substitution occurs for Fe-doping concentrations less than 2 mol% [21], we believe that it does exist whenever Fe is being doped into the LN structure, regardless of its molar concentration. In fact, it could be said that it always exists but is hardly seen without further TTAO.
The observed trend in Figure 3 would be a constant if no TTAO were conducted. Then, its origin cannot be any other than the partial or complete change of the valence state in Fe after TTAO: Fe2+ → Fe3+. To understand this statement, first it has to be recalled that for more than 25 years or so it has been known that Fe2+ and Fe3+ coexist in Fe-doped LN [33]. Recently the Fe2+/Fe3+ ratio has been found to be 0.15 in nanocrystalline Fe-doped LN (no post-thermal treatment) [30]. The ionic radii for Fe2+, Fe3+, Nb5+ and Li+ are 78, 64.5, 64 and 76 pm, respectively [12,34]. Thus, at low concentrations, not much effort is needed for Fe3+ ions to substitute NbLi4+ ions, as well as for Fe2+ ions to occupy Li vacancies. Neither of these would affect the lattice parameter abruptly, given the similarity between the ionic radii of elements that are interchanged. As Fe concentration increases gradually, all NbLi antisites become filled by Fe3+ ions and Li vacancies might be partially filled with Fe2+ and partially with Fe3+; in this case, a small contraction of the cell volume could be noticed. A further increment of Fe concentration would lead to both, Fe2+-Li and Fe3+-Li substitution, with the former causing a stronger contraction of the cell which Y. Y. Li et al. did not observe until a concentration of 2 mol% [21]. In this investigation, the application of TTAO homogenizes the valence state of Fe into Fe3+, causing a multitudinous decrease of ionic radii from 78 to 64.5 pm of all Fe ions present in Li sites, which in turn leads to a significant contraction of the cell volume. The small increment in the cell volume seen in the last point of the trend discussed so far (nLN:Fe-O) could be explained as to be caused by a partial change in the valence of the Fe ions; 2.20% mass of Fe2O3 and higher concentrations have sufficient Fe content so that the TTAO applied with the given experimental conditions cannot change its valence state completely. Finally, a similar discussion on the inverse (Fe3+ → Fe2+ by TTAH) could explain the relaxation-of-the-cell-volume behavior in the trend observed for the nLN:Fe-R samples. This case, however, does not necessarily imply Fe-Li substitution, although it is permissible since Fe-doping is prior to either TTAO or TTAH.
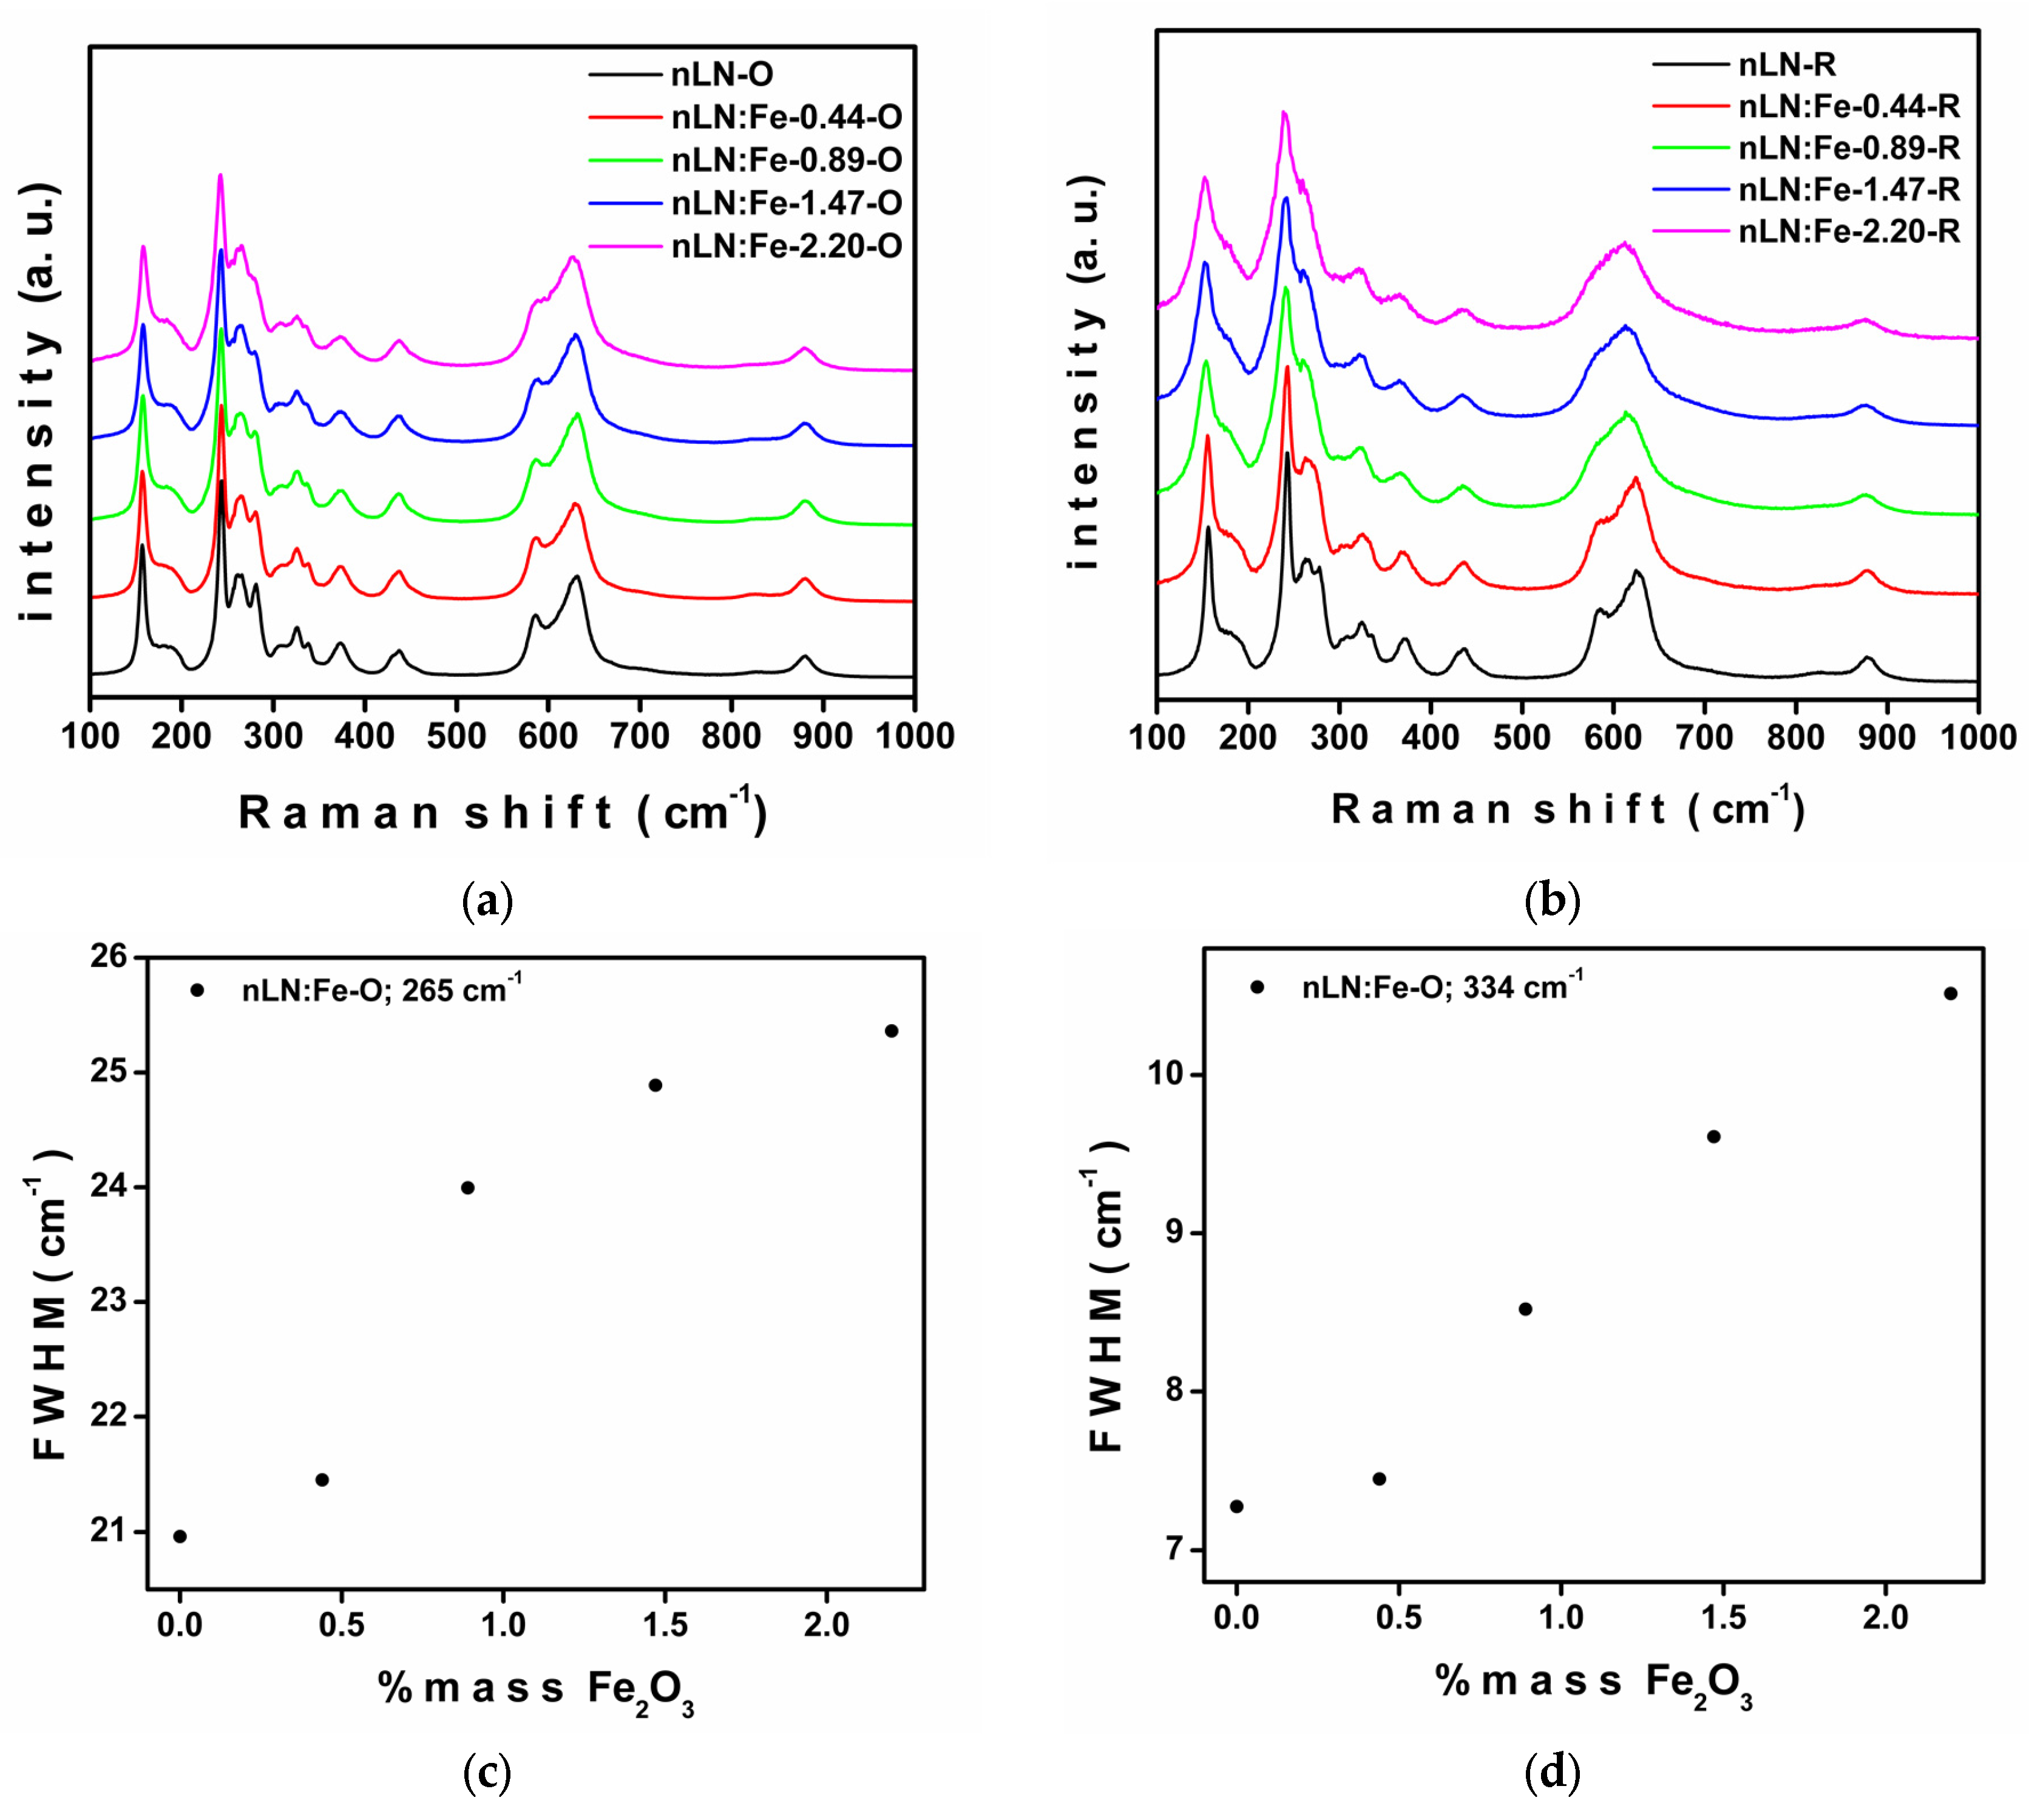
Raman spectra analysis has also been performed as an auxiliary tool to confirm the preliminary conclusions already given above. In short, there are three different vibrational modes which provide information about Fe-Li and Fe-Nb substitution in Fe-doped LN. Vibrational modes corresponding to peaks at 265 and 334 cm−1 are closely linked to Li cation displacements [26]. A consecutive broadening of these peaks with increasing Fe-doping concentration has been interpreted already as a trace for Fe-Li substitution [21]. On the other hand, the evidence for Fe-Nb substitution is to be found in progressive narrowing or intensity increment of the peak centered at 582 cm−1, which corresponds to vibrational mode E(TO8), closely linked to the Nb-O stretching mode [21]. The obtained results from Raman spectroscopy are shown in Figure 4. It can readily be seen that the changes presented between all the oxidized samples (Figure 4a) are much less than those presented between all the reduced samples (Figure 4b). According to C. Díaz-Moreno et al., the creation of oxygen vacancies at the surface comes along with TTAH, considerably affecting the vibrational modes within the structure [20]. Moreover, the broadening of the three peaks discussed above is evident in the reduced samples, supporting Fe-Li substitution while forbidding Fe-Nb substitution. These implications hold for the oxidized samples even though the broadenings of peaks 265 cm−1 (Figure 4c) and 334 cm−1 (Figure 4d) are not that easily seen. Here Fe-Li substitution appears to saturate at 2.20% mass of Fe2O3 and this was not observed in the case of the reduced samples.
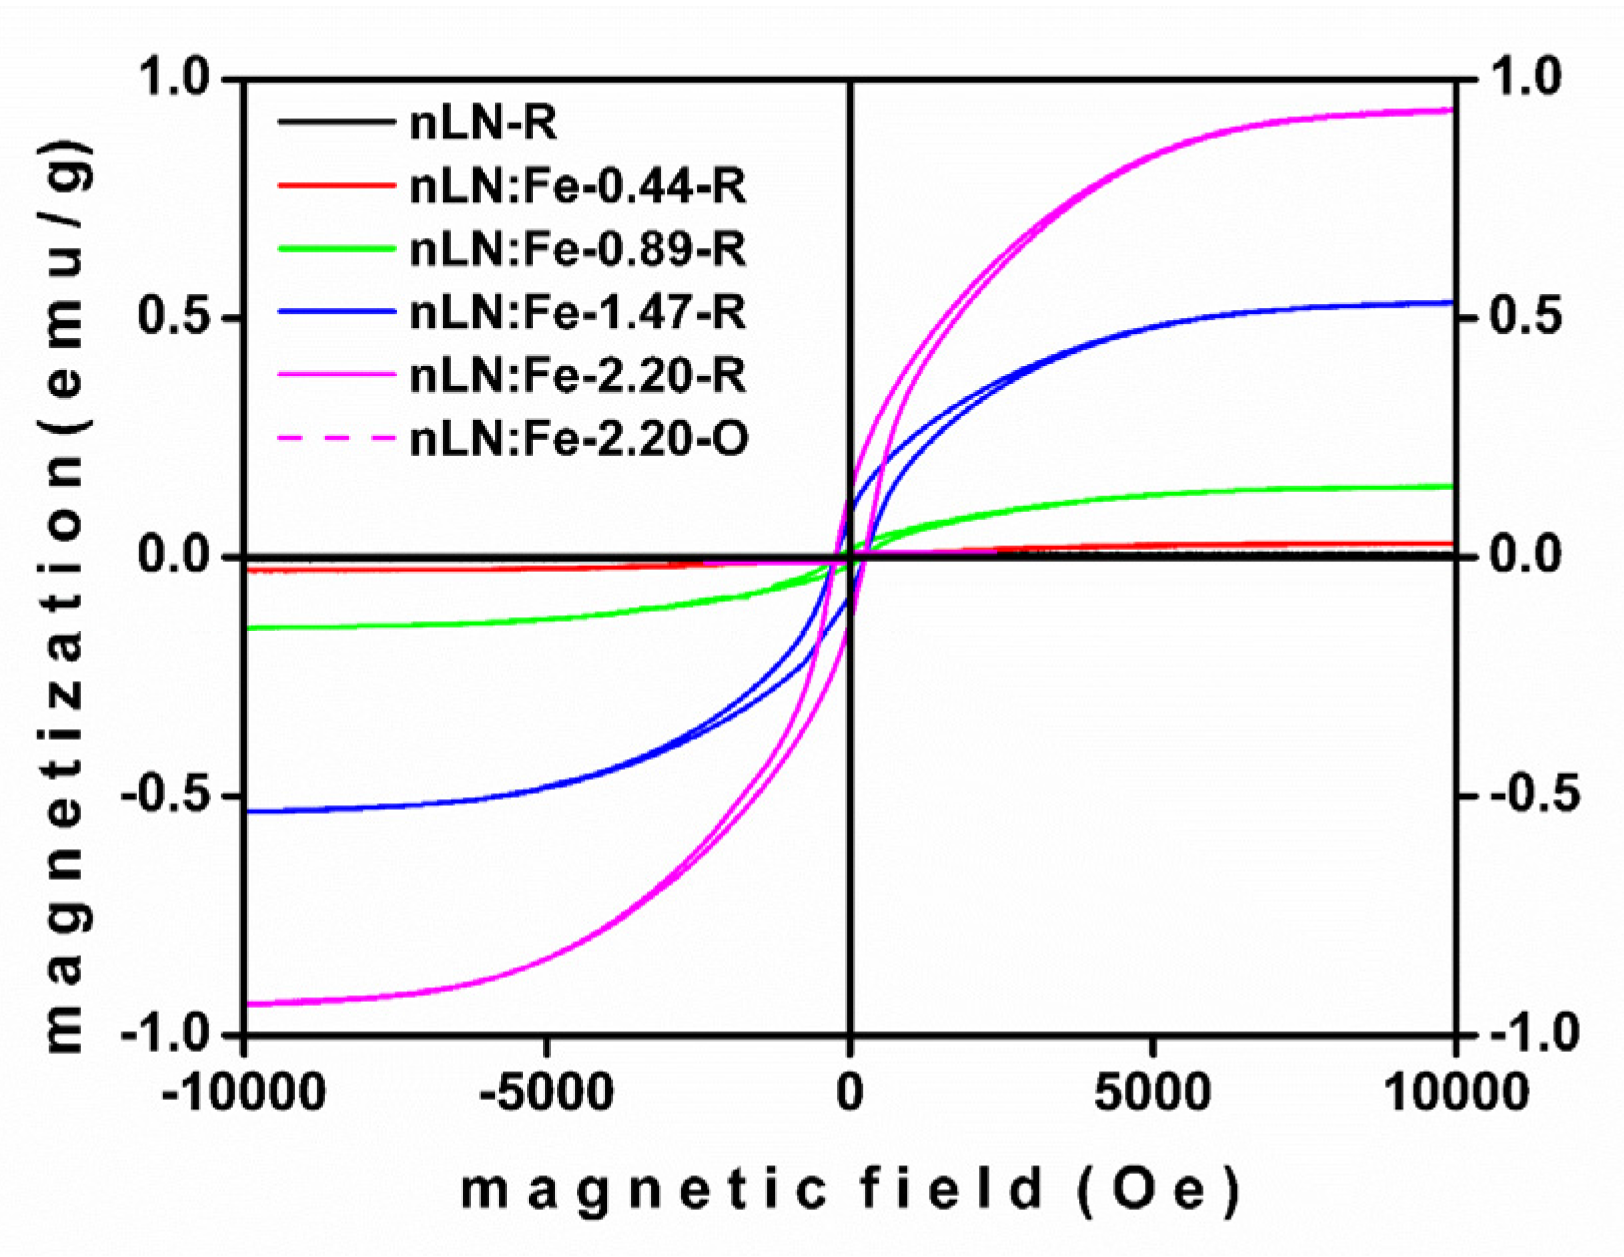
Figure 5 shows the comparison of the hysteresis loops for the reduced samples with different Fe-doped concentrations; the coercitive field, Hc, is constant for all samples with a value of 2 × 10⁴ Am−1 and a maximum MS = 0.94 Am2kg−1 for the highest doping concentration. Also, is presented the 2.20% mass of Fe2O3, for both valence states. It can readily be seen that the magnetization for TTHA is about two orders of magnitude higher than that of TTAO; this is the reason why a detailed analysis of the magnetic properties for samples after TTAO has been herein neglected. Figure 6a shows the expected growing behavior of the magnetization in terms of the doping concentration. Relative permeability was calculated for the sample with 2.20% mass of Fe2O3 using the equation and it was compared with the magnetization curve as seen in Figure 6b. The does not have a constant behavior and decreases as the applied magnetic field increases; this tendency is typical of the ferromagnetic materials. This behavior is similar for all samples, presenting a decrease of as the percentage of Fe diminution.
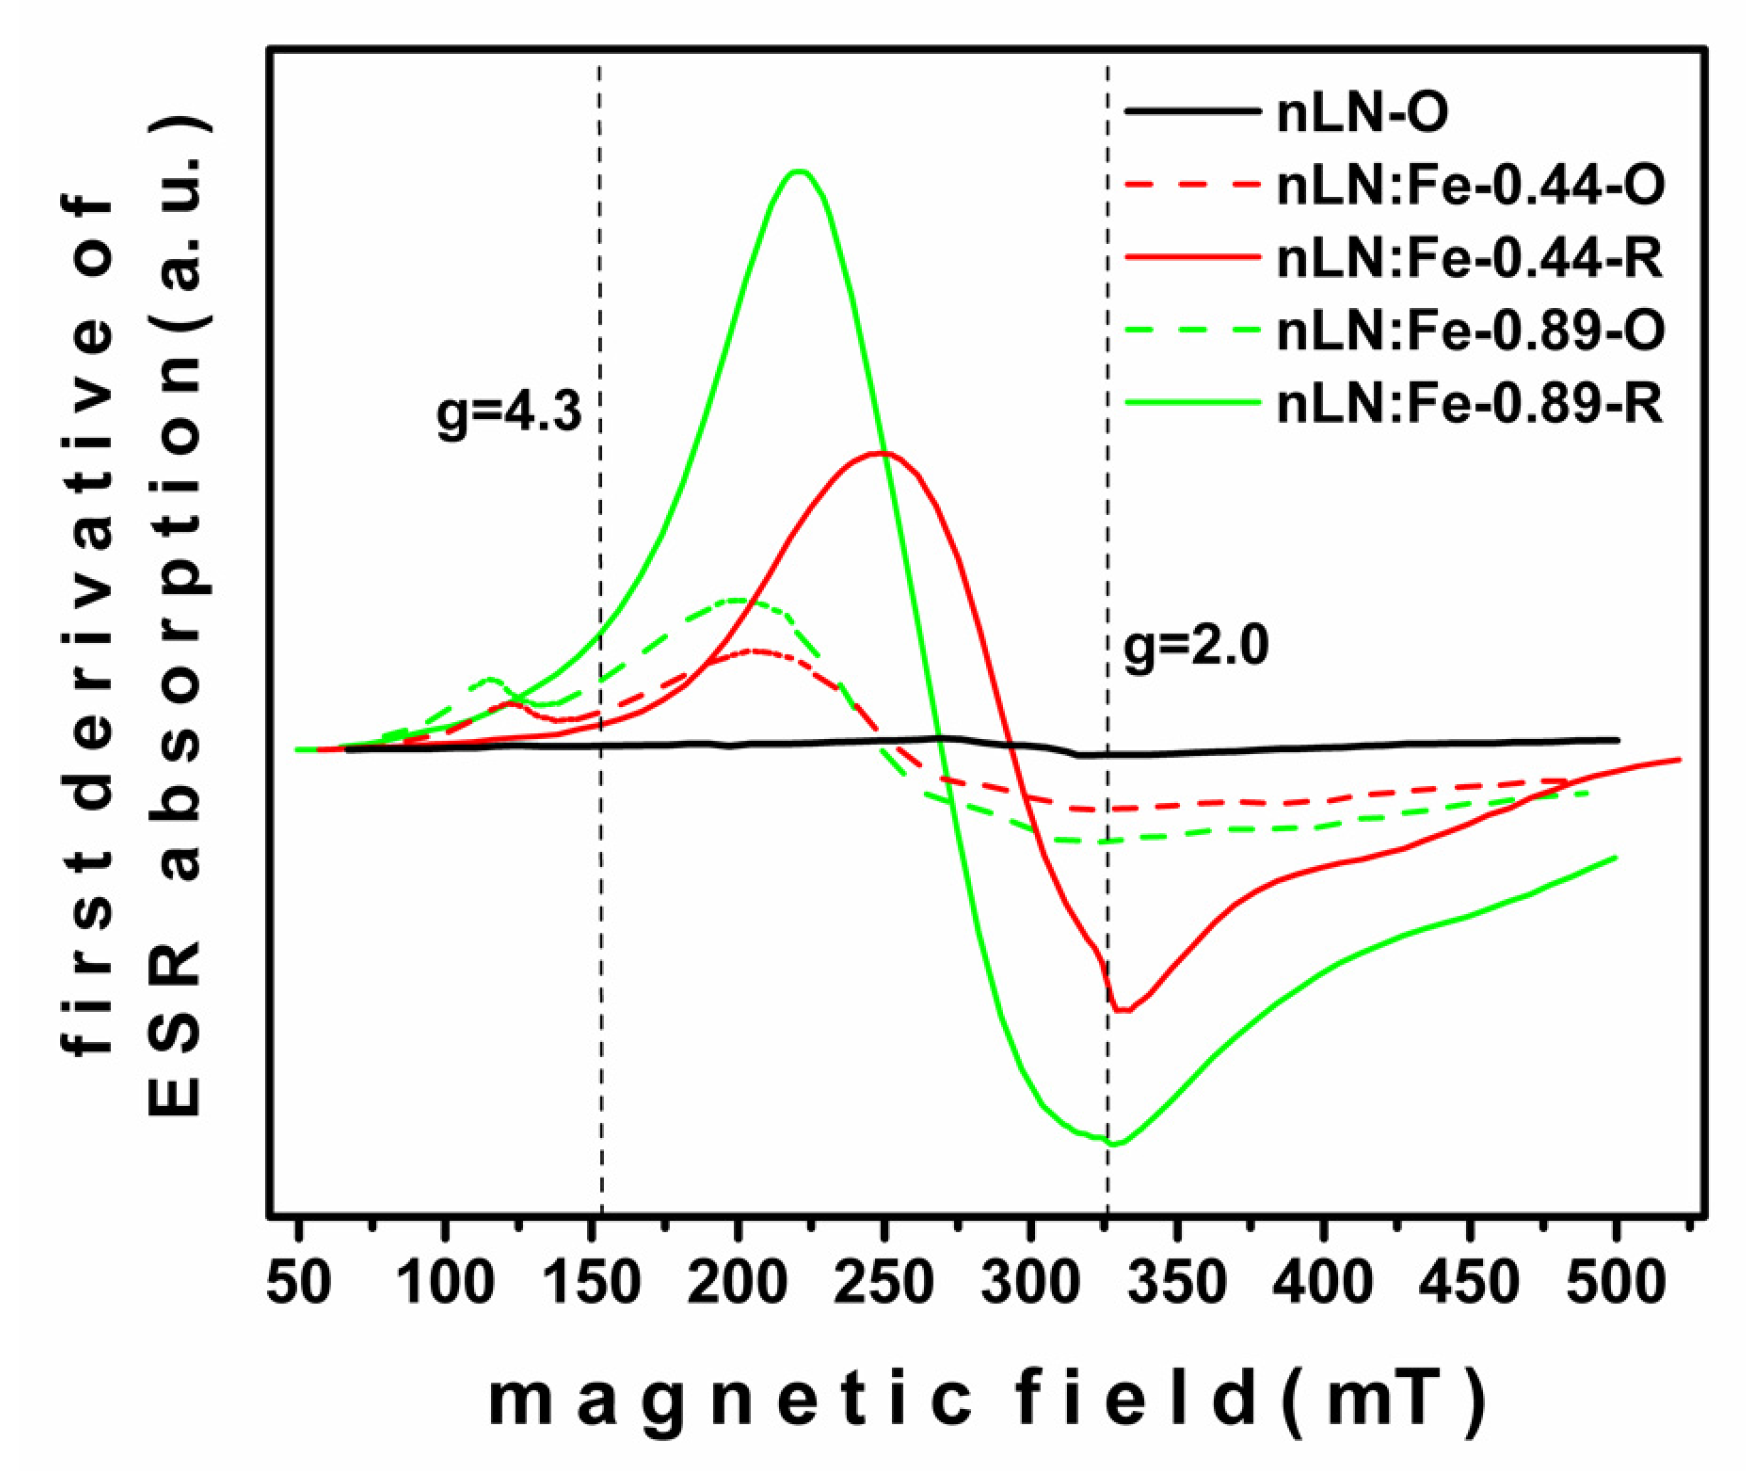
A better understanding of the change in the magnetic properties, from one thermal treatment to another, is to be extracted from the Electron Spin Resonance (ESR) spectroscopy results. These also serve to confirm the interpretation given above to the XRD results. The ESR spectra for samples nLN:Fe—0.44 and nLN:Fe—0.89 after the application of both thermal treatments, are shown in Figure 7. The black line corresponds to nLN without Fe-doping and it does not differ much from the one obtained for a tube used to hold the samples. These spectra are alike to those extracted from single crystal LN doped with a trace of iron (Fe3+), as one could have guessed (see Figures 1 and 2 in Ref. [35]). Nevertheless, a better similarity to ERS spectra obtained for some “65-million-year-old glasses and rocks from the Cretaceous-Tertiary boundary” can be noticed (Figures 1 and 2a–c) in Ref. [36]). Straightforwardly, from the analysis given by Griscom et al. (Discussion section in Ref. [36]), a local broadened maximum around g = 4.3 is an unmistakable trace for paramagnetic Fe3+ (g is defined by the equation , h is Planck’s constant, ν the spectrometer frequency, the Bohr magnetron and H is the magnitude of the applied magnetic field at resonance). Likewise, a value g = 2.0 placed in a zone between another local maximum followed by a local minimum (nearer to the minima) is a characteristic of a lesser contribution of Fe3+ to the spectra and, it is also very likely to imply a much stronger contribution arising from Fe2+ ions. Hence this being said, a bigger net magnetization observed for the continuous lines in Figure 7 has its origin from a major population of Fe2+ ions with respect to Fe2+ inside the LN structure, of which the application of TTAH is the main cause. Contrastingly, the application of TTAO promotes the transition Fe2+ → Fe3+ that shortens the net magnetization (non-continuous lines). Notwithstanding, in this case a shift of approximately 30 mT towards lower values of H is observed. This might come from a strong interaction of the Fe3+ ions with their surroundings as a result from the cell volume contraction, described above in the discussion given of XRD results. Finally, it is worth to mention that the obtained ESR spectra support the description derived from XRD and Rietveld analysis, that is, the contraction/relaxation of the cell volume for low Fe-doping concentrations as a response to a multitudinous change of the Fe ionic radii, caused and tuned by a proper post-thermal treatment.
4. Conclusions
The systematic generation of oxygen vacancies after Fe-doping in nanocrystalline lithium niobate (nLN) could result in an effective enhancement of its magnetic behavior at room temperature, in contrast to that in equivalent nLN materials restricted to the application of only one of these processes. The increment in the magnetic coefficients (0.96 Am2kg−1 at maximum) is likely to be rather large and unexpected and it could be attributed to two main mechanisms. On one hand, to a proper control of the state of valence for the Fe ions that adopt the LN structure (reduction). On the other, through isolation of changes in structure and vibrational modes in LN. Both of these can be simultaneously obtained with the application of a post-thermal treatment in a controlled atmosphere of ultra-high purity hydrogen (TTAH). These arguments have their basis in the exciting fact of the possibility of room temperature ferromagnetic behavior in Fe-doped nLN with low concentrations, observed herein for a concentration lesser than 1% mol. This subject must be further investigated, so that for instance, the threshold for the presence of ferromagnetic behavior in this type of materials is determined. Meanwhile, it seems to be clear now that in these concentration regimes, post-thermal treatment is a key point not only for the inducement of ferromagnetic properties but also for their detection and quantitative analysis.
Acknowledgments
The present work was supported by CONACyT and Universidad Autónoma de Ciudad Juárez (UACJ), which is gratefully acknowledged. The authors also wish to acknowledge the technical assistance of Jorge Barreto with the ESR experiments (Instituto de Física, Universidad Nacional Autónoma de México), and the revision of the final English text by Trisha Kumar.
Author Contributions
Cesar D. Fierro-Ruíz designed the experiments and performed the synthesis and structural characterization of the samples. Eva M. Cabral-Larquier participated in the processing of the samples. José T. Elizalde-Galindo made the measurements of the magnetic properties and helped with the correspondent analysis. Cesar D. Fierro-Ruíz and Oswaldo Sánchez-Dena analyzed the data and wrote the paper. Rurik-Farías conceived the original idea, contributed reagents and materials and edited the final manuscript.
Conflicts of Interest
All contributing authors declare no conflicts of interest. The founding sponsors had no role in the design of the study; in the collection, analyses, or interpretation of data; in the writing of the manuscript and in the decision to publish the results.
Appendix A
Rietveld refinement was performed using the computational package X’Pert HighScore Plus from PANalytical [37], version 2.2b (2.2.2), released in 2006. Instructions from the section named Automatic Rietveld Refinement from the HighScore Online Plus Help document were first followed and then adapted to study our samples. In short, an archive with information about the atomic coordinates of LN (“2101175.cif”) was downloaded for free from The Crystallographic Open Database [24]. This archive was inserted along with experimental data and the Rietveld analysis in “Automatic Mode” was executed, followed by iterative executions in “Semi-automatic Mode,” in which different “Profile Parameters” were allowed to vary until satisfactory agreement indices were obtained.
References
- Nassau, K.; Levinstein, H.J.; Loiacono, G.M. Ferroelectric Lithium Niobate. 1. Growth, domain structure, dislocations and etching. J. Chem. Phys. Solids 1966, 27, 839–888. [Google Scholar] [CrossRef]
- Nassau, K.; Levinstein, H.J.; Loiacono, G.M. Ferroelectric Lithium Niobate. 2. Preparation of single domain crystals. J. Chem. Phys. Solids 1966, 27, 989–996. [Google Scholar] [CrossRef]
- Abrahams, S.C.; Reddy, J.M.; Bernstein, J.L. Ferroelectric Lithium Niobate. 3. Single crystal X-ray diffraction study at 24 °C. J. Chem. Phys. Solids 1966, 27, 971–1012. [Google Scholar] [CrossRef]
- Abrahams, S.C.; Hamilton, W.C.; Reddy, J.M. Ferroelectric Lithium Niobate. 4. Single crystal neutron diffraction study at 24 °C. J. Chem. Phys. Solids 1966, 27, 1013–1018. [Google Scholar] [CrossRef]
- Abrahams, S.C.; Levinstein, H.J.; Reddy, J.M. Ferroelectric Lithium Niobate. 5. Polycrystal X-ray diffraction study between 24 °C and 1200 °C. J. Chem. Phys. Solids 1966, 27, 1019–1026. [Google Scholar] [CrossRef]
- Weis, R.S.; Gayklord, T.K. Lithium Niobate: Summary of physical properties and crystal structure. Appl. Phys. A 1985, 37, 191–203. [Google Scholar] [CrossRef]
- Arizmendi, L. Photonic applications of lithium niobate crystals. Phys. Status Solidi (a) 2004, 201, 253–283. [Google Scholar] [CrossRef]
- Peach, R.C.; Craig, D.; Lewis, M.F.; West, C.L.; Morgan, D.F.; Fedorov, V.A.; Korkishko, Y.N.; Ciplys, D.; Rimeika, R.; Hinkov, V. Acoustic wave propagation and properties. In EMIS Datareviews Series. Properties of Lithium Niobate, 1st ed.; Wong, K.K., Northstar Photonics Inc. USA, Eds.; The Institution of Electrical Engineers (INSPEC): London, UK, 2002; Volume 28, pp. 213–270. ISBN 0-85296-799-3. [Google Scholar]
- Sumets, M.P.; Dybov, V.A.; Ievlev, V.M. LiNbO3 Films: Potential application, synthesis techniques, structure, properties. Inorg. Mater. 2017, 53, 1361–1377. [Google Scholar] [CrossRef]
- Luo, R.; Jiang, H.; Rogers, S.; Liang, H.; He, Y.; Lin, Q. On-chip second-harmonic generation and broadband parametric down-conversion in a lithium niobate microresonator. Opt. Exp. 2017, 25, 24531–24539. [Google Scholar] [CrossRef] [PubMed]
- Sánchez-Dena, O.; García-Ramírez, E.V.; Fierro-Ruiz, C.D.; Vigueras-Santiago, E.; Farías, R.; Reyes-Esqueda, J.A. Effect of size and composition on the second harmonic generation from lithium niobate powders at different excitation wavelengths. Mater. Res. Express 2017, 4. [Google Scholar] [CrossRef]
- Volk, T.; Wöhlecke, M. Point defects in LiNbO3. In Springer Series in Materials Science. Lithium Niobate. Defects, Photorefraction and Ferroelectric Switching, 1st ed.; Hull, R., Osgood, R.M., Jr., Parisi, J., Warlimont, H., Eds.; Springer: Berlin/Heidelberg, Germany, 2009; Volume 115, pp. 9–50. ISBN 978-3-540-70765-3. [Google Scholar]
- Schirmer, O.F.; Thiemann, O.; Wöhlecke, M. Defects in LiNbO3—I. Experimental aspects. J. Phys. Chem. Solids 1991, 52, 185–200. [Google Scholar] [CrossRef]
- Malovichko, G.; Grachev, V.; Schirmer, O. Interrelation of intrinsic and extrinsic defects—Congruent, stoichiometric and regularly ordered lithium niobate. Appl. Phys. B 1999, 68, 785–793. [Google Scholar] [CrossRef]
- Kovács, L.; Kocksor, L.; Szaller, Z.; Hajdara, I.; Dravecz, G.; Lengyel, K.; Corradi, G. Lattice site of rare-earth ions in stoichiometric lithium niobate probed by OH− vibrational spectroscopy. Crystals 2017, 7, 230. [Google Scholar] [CrossRef]
- Song, C.; Zeng, F.; Shen, Y.X.; Geng, K.W.; Xie, Y.N.; Wu, Z.Y.; Pan, F. Local Co structure and ferromagnetism in ion-implanted Co-doped LiNbO3. Phys. Rev. B 2006, 73. [Google Scholar] [CrossRef]
- Song, C.; Wang, C.Z.; Yang, Y.C.; Liu, X.J.; Zeng, F.; Pan, F. Room temperature ferromagnetism and ferroelectricity in cobalt-doped LiNbO3 film. Appl. Phys. Lett. 2008, 92. [Google Scholar] [CrossRef]
- Zeng, F.; Sheng, P.; Tang, G.S.; Pan, F.; Yan, W.S.; Hu, F.C.; Zou, Y.; Huang, Y.Y.; Jiang, Z.; Guo, D. Electronic structure and magnetism of Fe-doped LiNbO3. Mater. Chem. Phys. 2012, 136, 783–788. [Google Scholar] [CrossRef]
- Yan, T.; Ye, N.; Xu, L.; Sang, Y.; Chen, Y.; Song, W.; Long, X.; Wang, J.; Liu, H. Ferromagnetism in chemically reduced LiNbO3 and LaTiO3 crystals. J. Phys. D Appl. Phys. 2016, 49. [Google Scholar] [CrossRef]
- Díaz-Moreno, C.; Farias, R.; Hurtado-Macias, A.; Elizalde-Galindo, J.; Hernandez-Paz, J. Multiferroic response of nanocrystalline lithium niobate. J. Appl. Phys. 2012, 111. [Google Scholar] [CrossRef]
- Li, Y.Y.; Chen, H.L.; Kuo, C.L.; Hsieh, P.H.; Hwang, W.S. Raman spectra and ferromagnetism of nanocrystalline Fe-doped Li0.43Nb0.57O3+δ. Ceram. Int. 2016, 42, 10764–10769. [Google Scholar] [CrossRef]
- Kong, L.B.; Chang, T.S.; Ma, J.; Boey, F. Progress in synthesis of ferroelectric ceramic materials via high-energy mechanochemical technique. Prog. Mater. Sci. 2008, 53, 207–322. [Google Scholar] [CrossRef]
- Suryanarayana, C. Mechanical alloying and milling. Prog. Mater. Sci. 2001, 46, 11–84. [Google Scholar] [CrossRef]
- Crystallographic Open Database. Information Card for Entry 2101175. Available online: http://www.crystallography.net/cod/2101175.html (accessed on 15 December 2017).
- Maeda, K.; Mizubayashi, H.B. Nanoscopic Architecture and Microstructure. In Springer Handbook of Materials Measurement Methods, 1st ed.; Czichos, H., Saito, T., Smith, L., Eds.; Springer: Berlin/Heidelberg, Germany, 2006; p. 221. ISBN 978-3-540-20785-6. [Google Scholar]
- Repelin, Y.; Husson, E.; Bennani, F.; Proust, C. Raman spectroscopy of lithium niobate and lithium tantalite. Force field calculation. J. Phys. Chem. Solids 1999, 60, 819–825. [Google Scholar] [CrossRef]
- Pezzotti, G. Raman spectroscopy of piezoelectrics. J. Appl. Phys. 2013, 113. [Google Scholar] [CrossRef]
- Schlarb, U.; Klauer, S.; Wesselmann, M.; Betzler, K.; Wöhlecke, M. Determination of the Li/Nb ratio in Lithium Niobate by Means of Birefringence and Raman Measurements. Appl. Phys. A 1993, 56, 311–315. [Google Scholar] [CrossRef]
- fytyk. Curve Fitting and Data Analysis. Available online: Fytyk.nieto.pl (accessed on 13 December 2017).
- Knabe, B.; Schütze, D.; Jungk, T.; Svete, M.; Assenmacher, W.; Mader, W.; Buse, K. Synthesis and characterization of Fe-doped LiNbO3 nanocrystals from a triple-alkoxide method. Phys. Status Solidi (a) 2011, 208, 857–862. [Google Scholar] [CrossRef]
- Shannon, R.D. Revised effective ionic radii and systematic studies of interatomic distances in halides and chalcogenides. Acta Cryst. 1976, A32, 751–767. [Google Scholar] [CrossRef]
- Ciampolillo, M.V.; Zaltron, A.; Bazzan, M.; Argiolas, N.; Sada, C.; Bianconi, M. Lithium niobate crystals doped with iron by thermal diffusion: Relation between lattice deformation and reduction degree. J. Appl. Phys. 2010, 107. [Google Scholar] [CrossRef]
- Rebouta, L.; da Silva, M.F.; Soares, J.C.; Hage-Ali, M.; Stoquert, J.P.; Siffert, P.; Sanz-García, J.A.; Diéguez, E.; Agulló-López, F. Lattice site of Iron in LiNbO3(Fe3+) by the PIXE/Chanelling Technique. EPL 1991, 14, 557–561. [Google Scholar] [CrossRef]
- Shannon, R.D.; Prewitt, C.T. Effective Ionic Radii in Oxides and Fluorides. Acta Cryst. 1969, B25, 925–946. [Google Scholar] [CrossRef]
- Towner, H.H.; Kim, Y.M.; Story, H.S. EPR studies of crystal field parameters in Fe3+:LiNbO3. J. Chem. Phys. 1971, 56, 3676–3679. [Google Scholar] [CrossRef]
- Griscom, D.L.; Beltrán-López, V.; Merzbacher, C.I.; Bolden, E. Electron spin resonance of 65-million-year-old glasses and rocks from the Cretaceous-Tertiary boundary. JNCS 1999, 253, 1–22. [Google Scholar] [CrossRef]
- Degen, T.; Sadki, M.; Bron, E.; König, U.; Nénert, W. The high score suite. Powder Diffr. 2014, 29, S13–S18. [Google Scholar] [CrossRef]
Figure 1.
nLN obtained at experimental stage 1: (a) XRD pattern. An average crystallite size of 658 was calculated; (b) non-polarized Raman spectra. A value of cLi = 49.3% Li was calculated.
Figure 1.
nLN obtained at experimental stage 1: (a) XRD pattern. An average crystallite size of 658 was calculated; (b) non-polarized Raman spectra. A value of cLi = 49.3% Li was calculated.
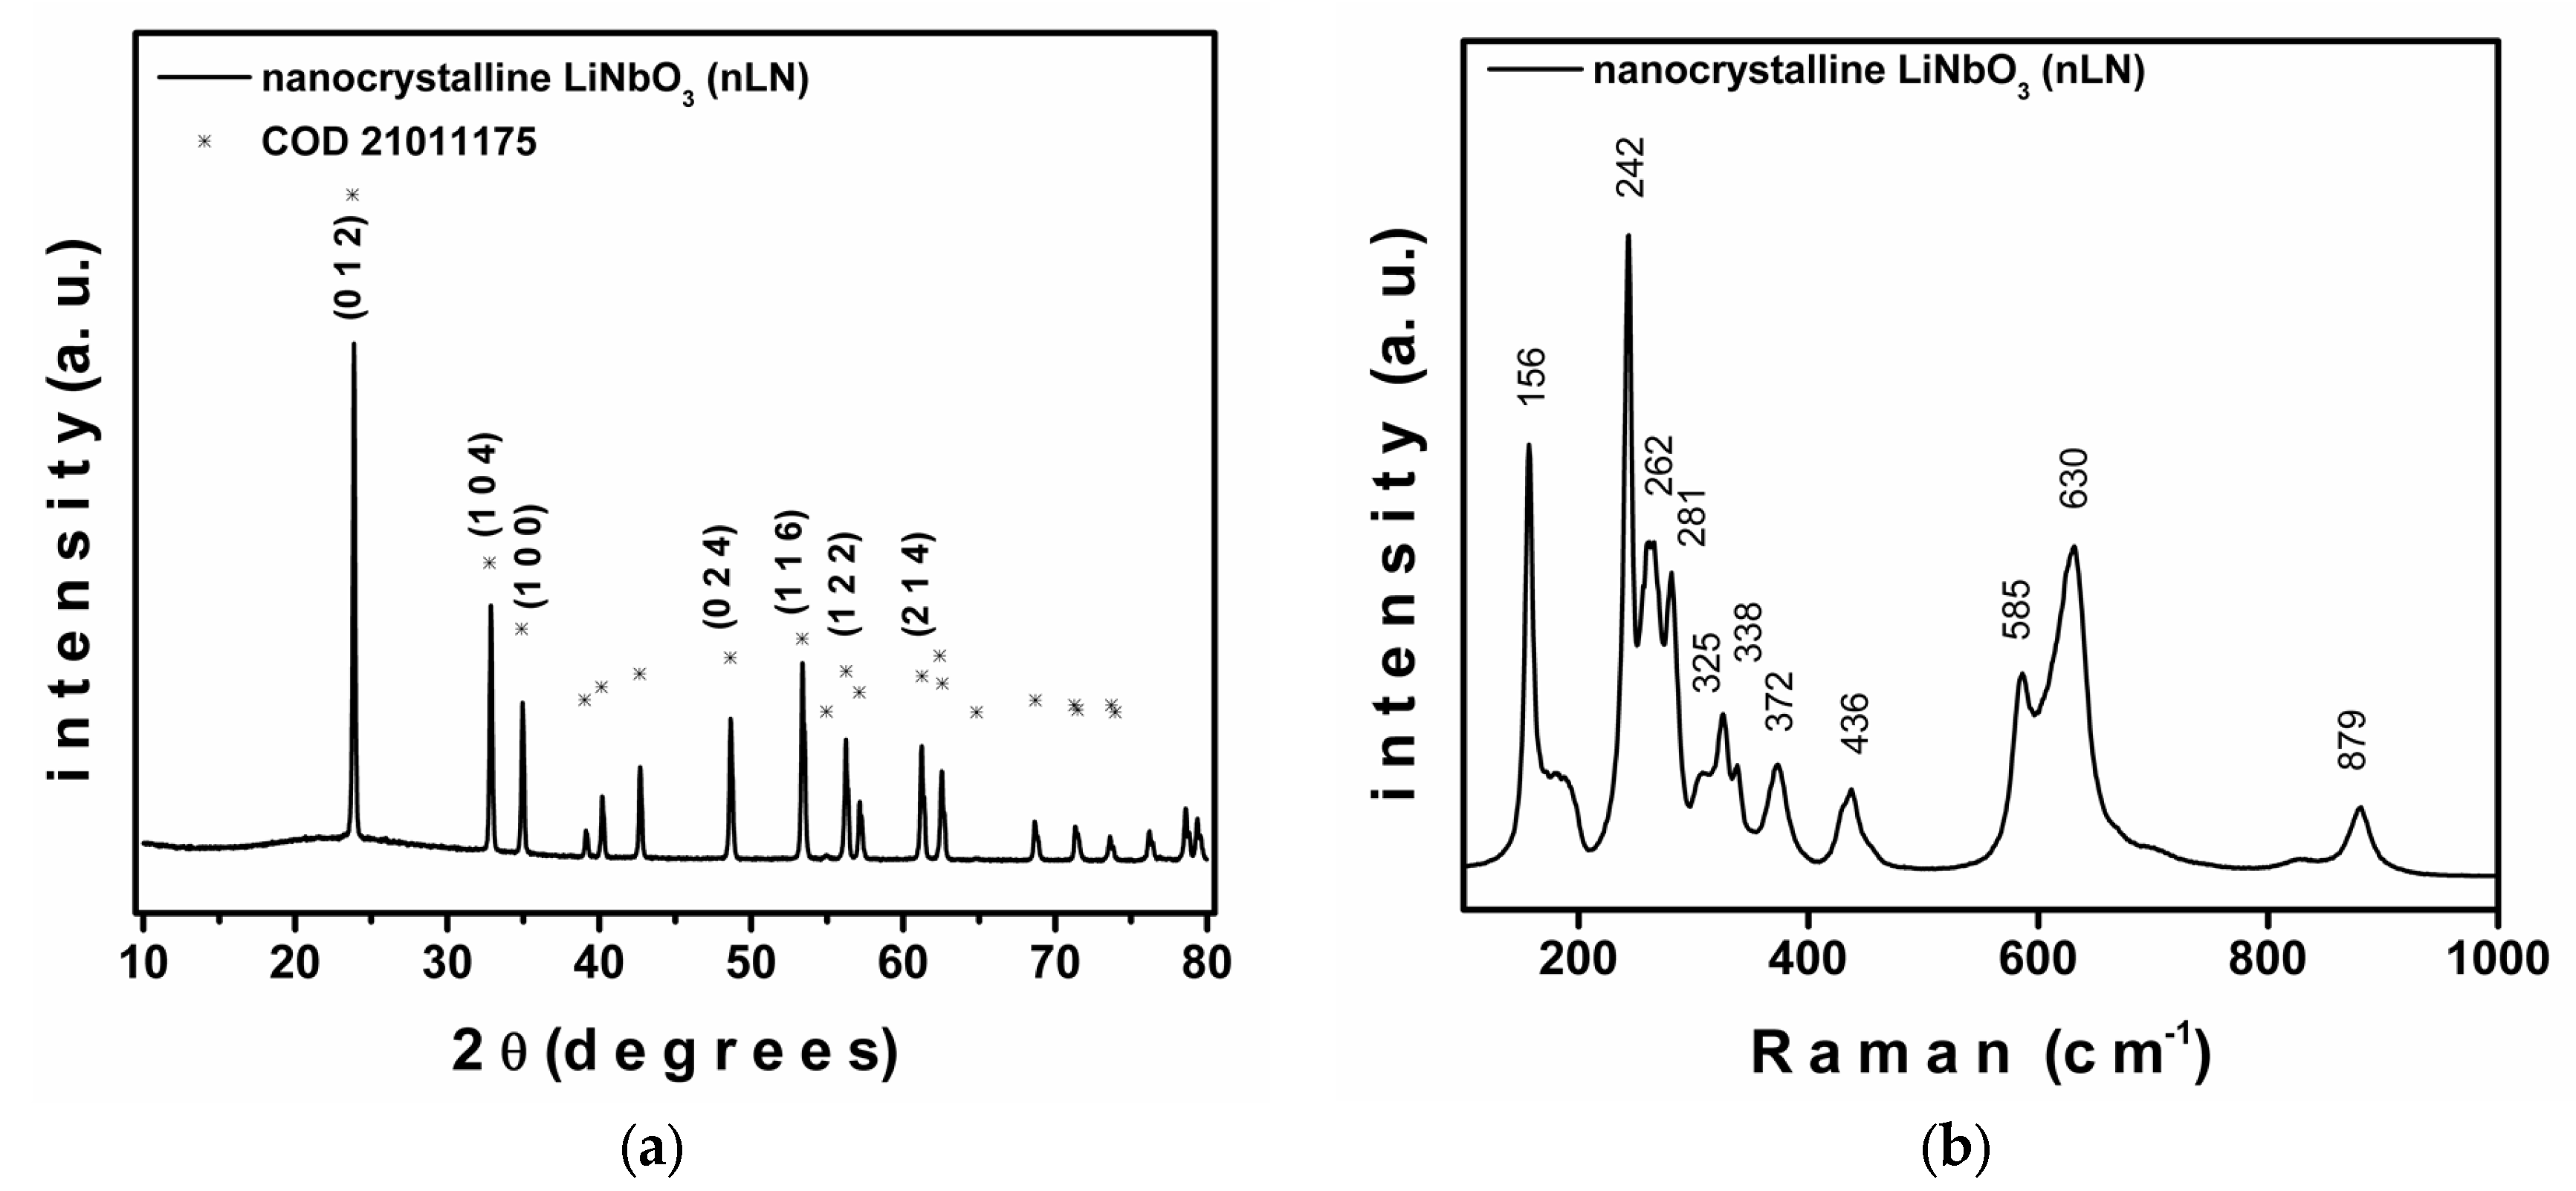
Figure 2.
X-ray diffraction patterns of samples obtained after Fe-doping and application of thermal treatments TTAH and TTAO: (a) Oxidized samples (TTAO); (b) Reduced samples (TTAH); (c,d) Enlarged view of the respective (0 1 2) Bragg peaks.
Figure 2.
X-ray diffraction patterns of samples obtained after Fe-doping and application of thermal treatments TTAH and TTAO: (a) Oxidized samples (TTAO); (b) Reduced samples (TTAH); (c,d) Enlarged view of the respective (0 1 2) Bragg peaks.
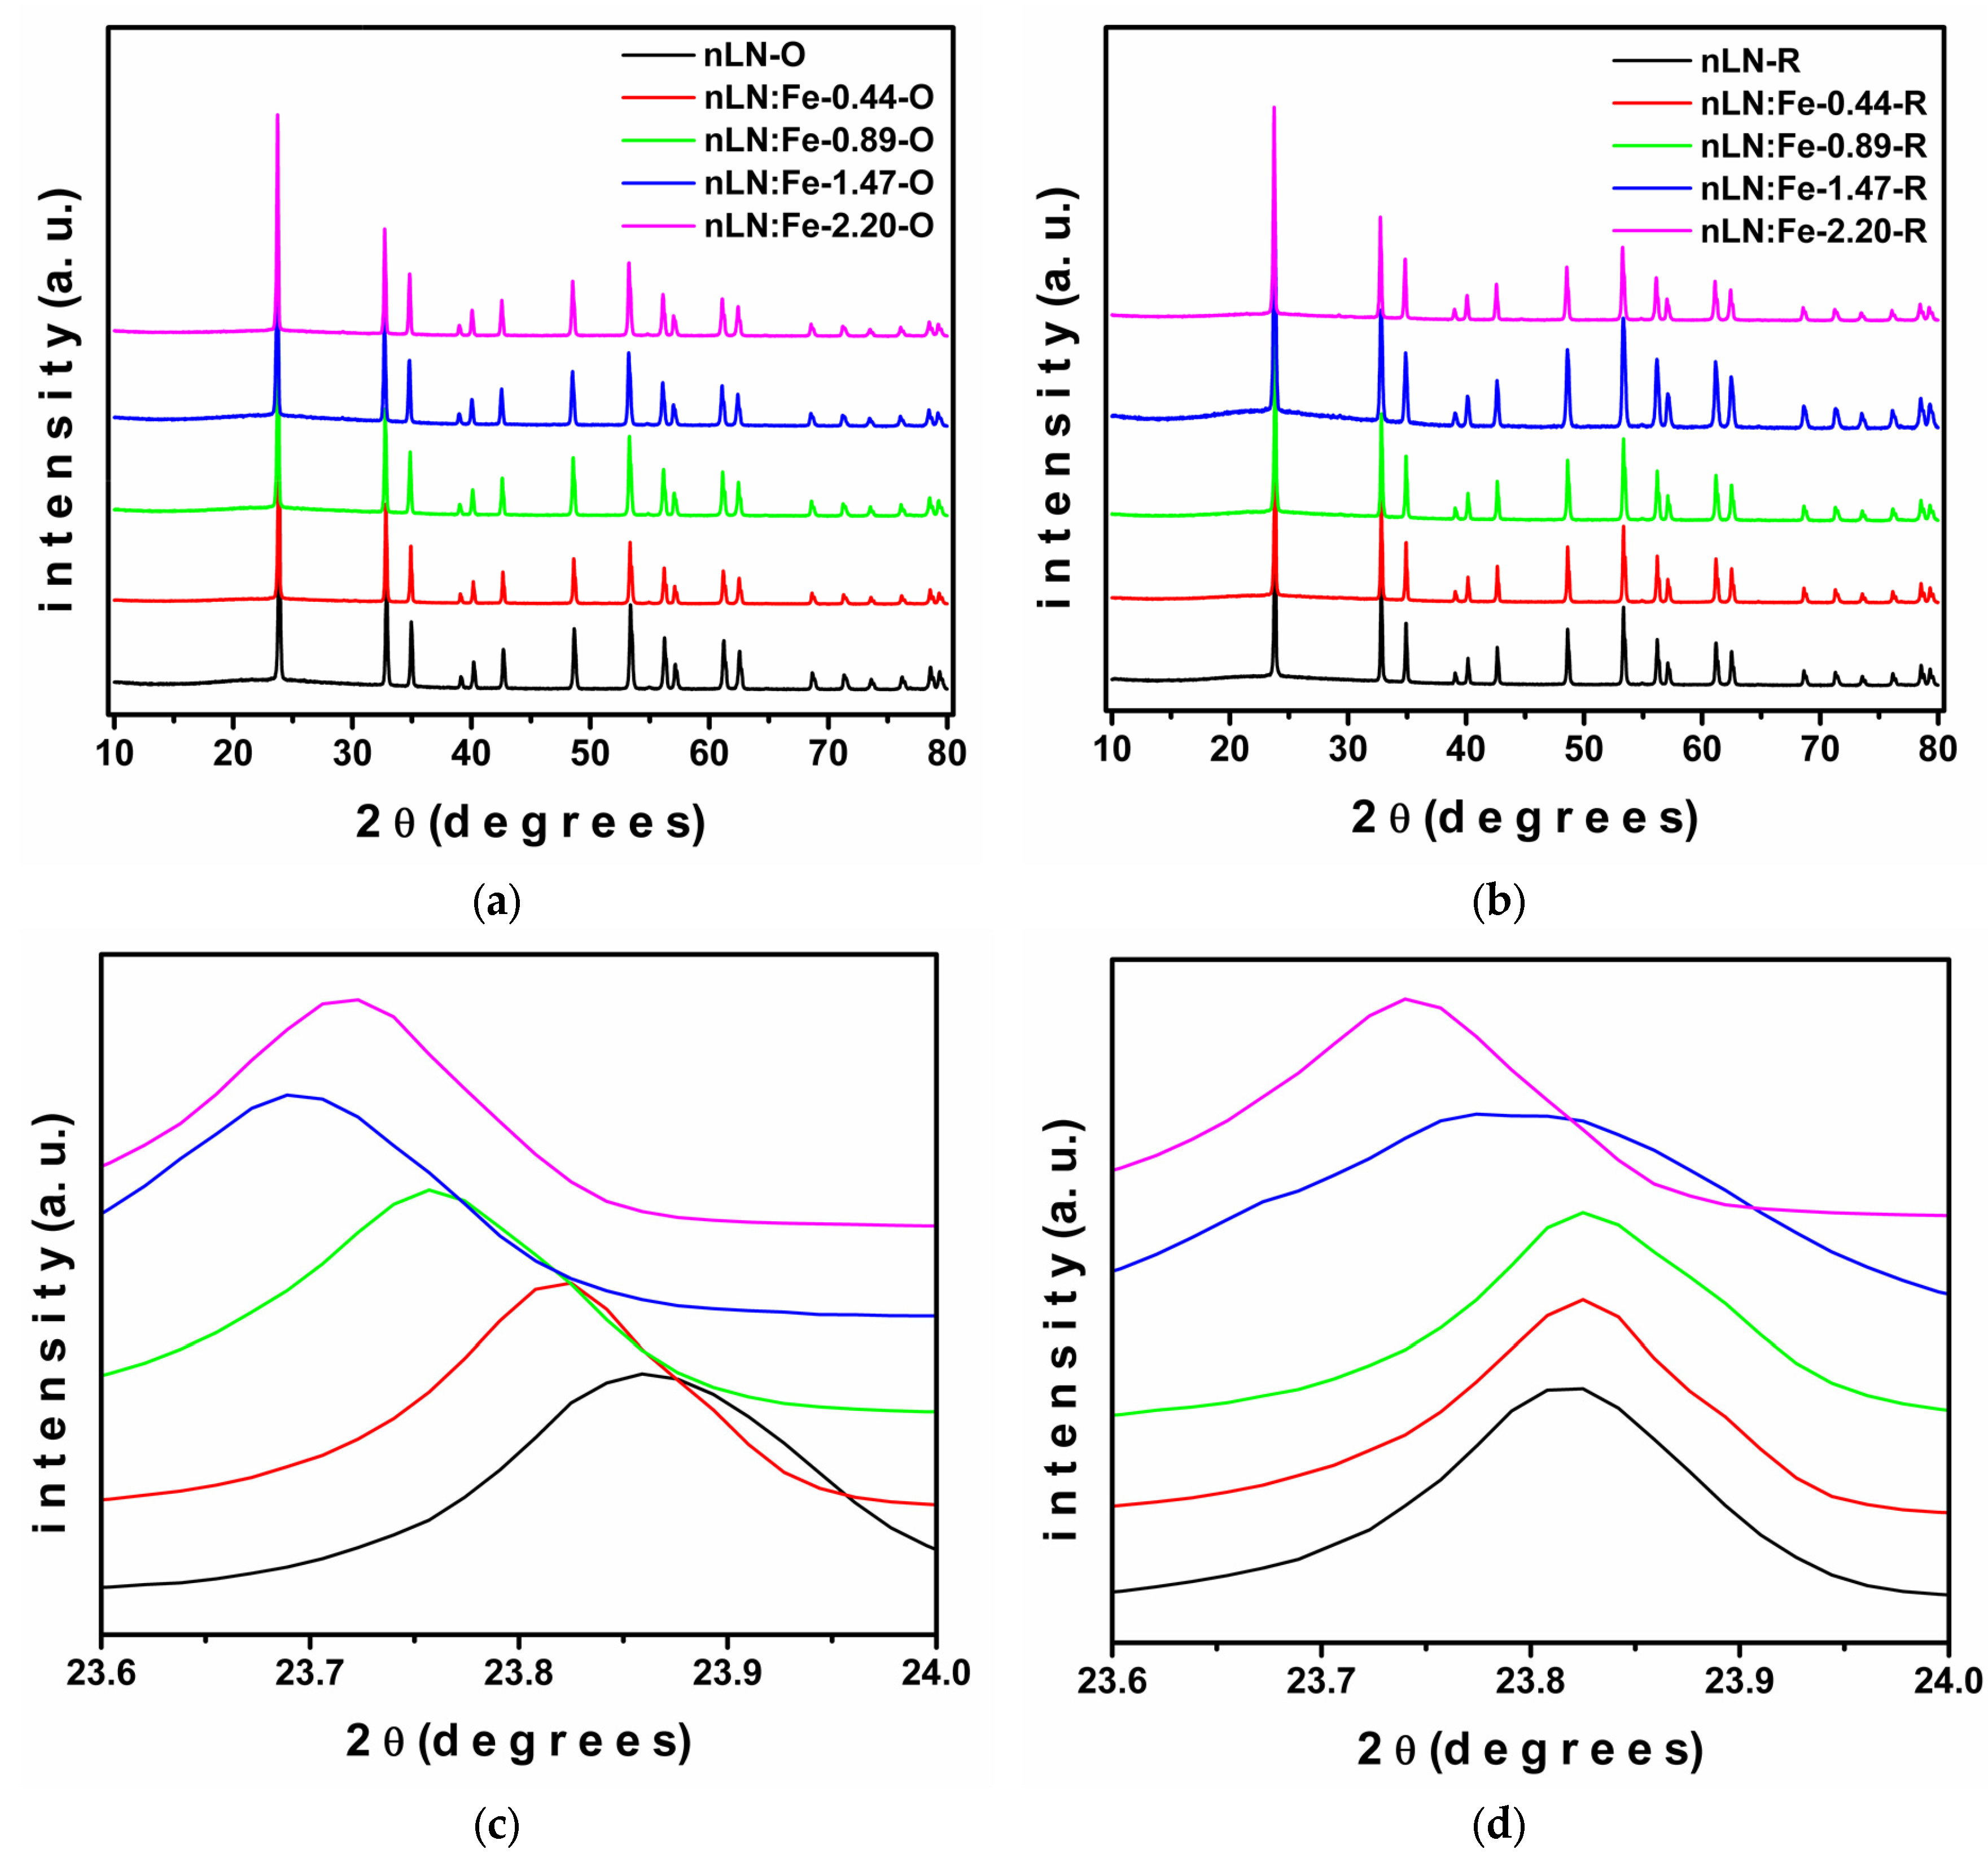
Figure 3.
Cell volume as a function of % mass of Fe2O3. Oxidized and reduced samples are in black squares and circles, respectively.
Figure 3.
Cell volume as a function of % mass of Fe2O3. Oxidized and reduced samples are in black squares and circles, respectively.
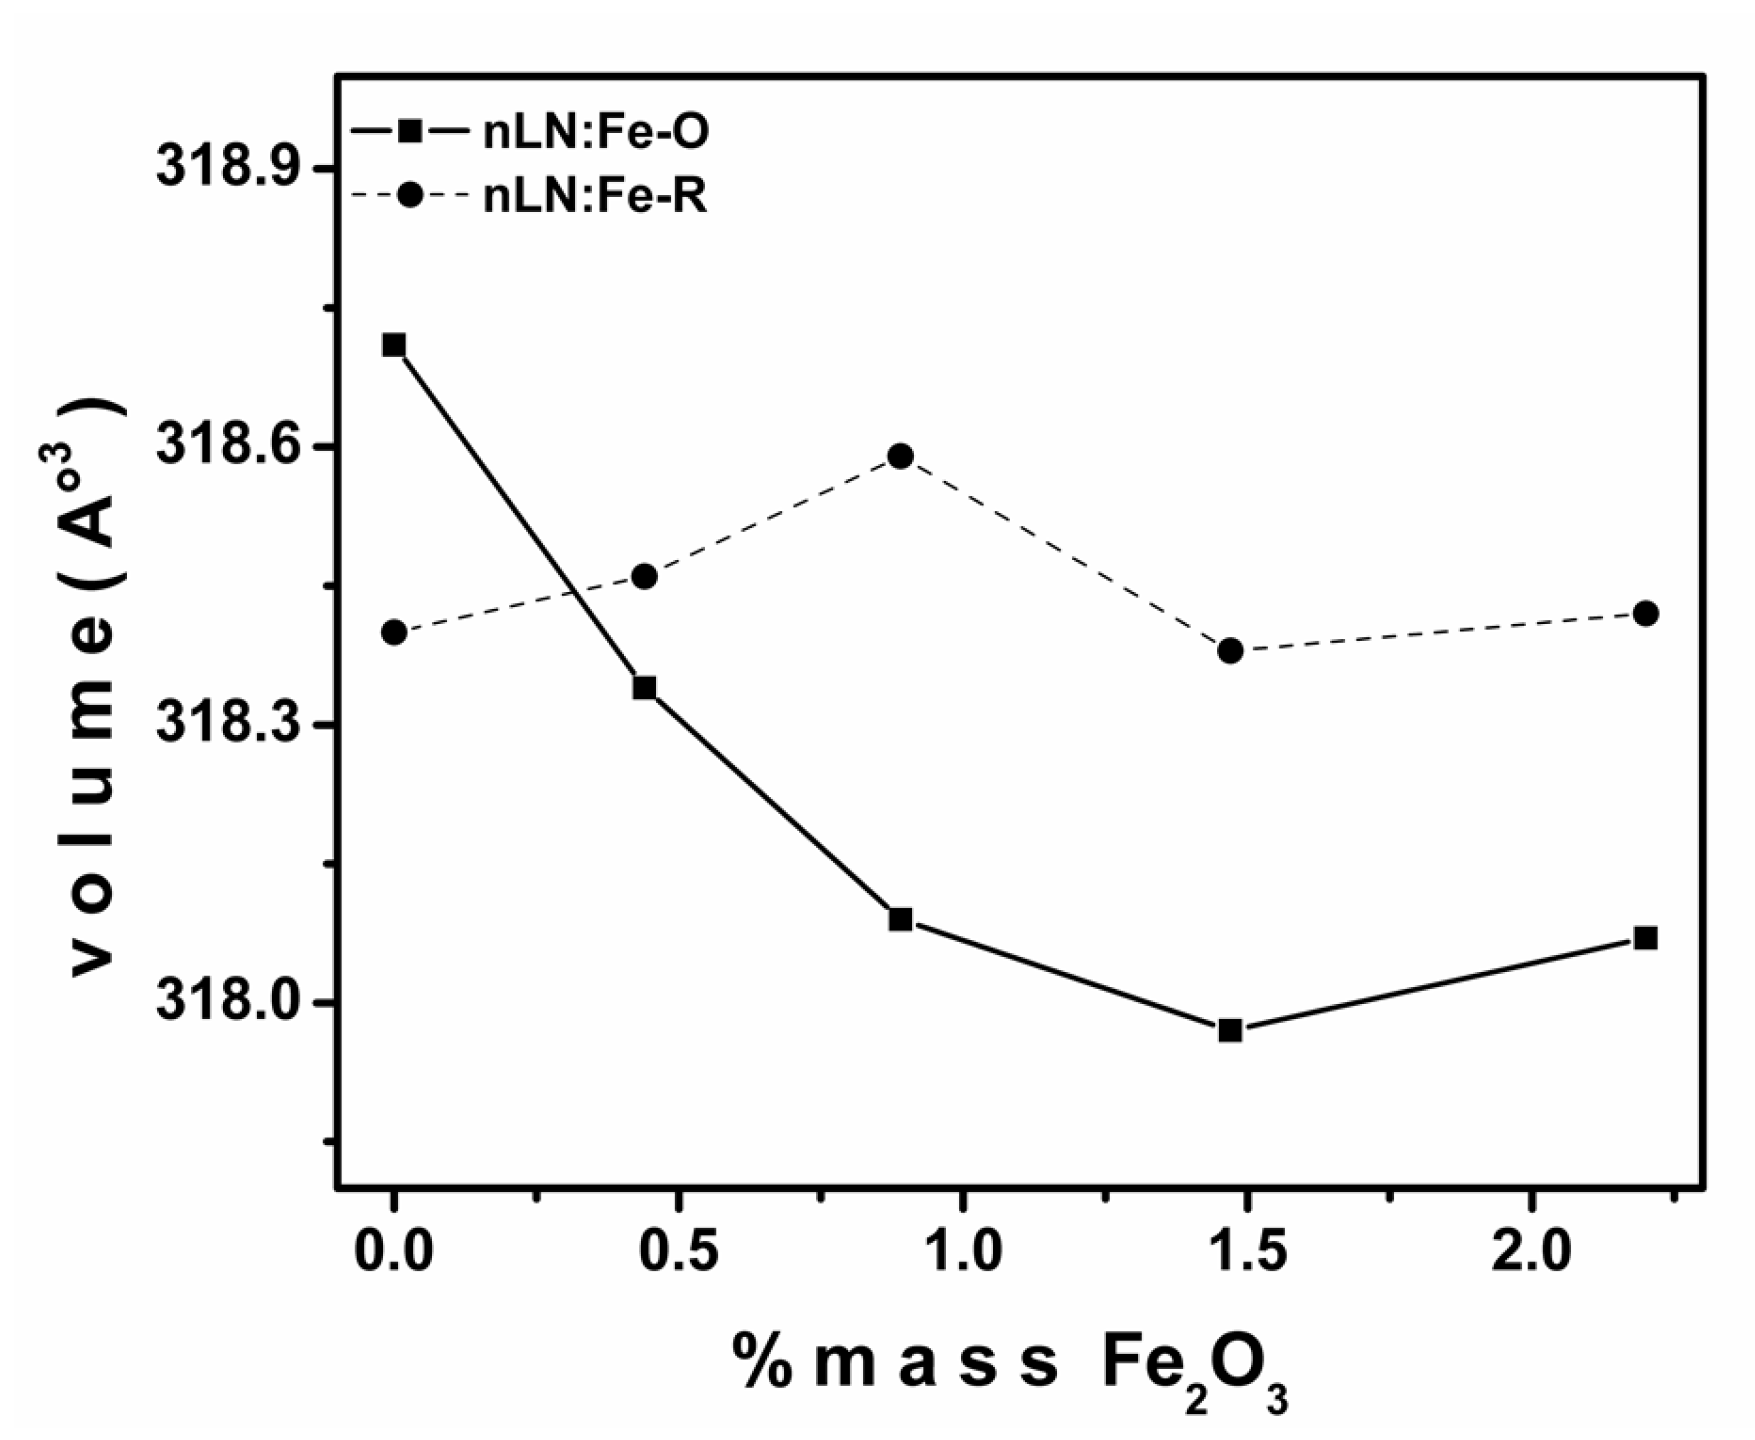
Figure 4.
Raman spectra of samples obtained after Fe-doping and application of thermal treatments TTAH and TTAO: (a) Oxidized samples (TTAO); (b) Reduced samples (TTAH); (c) Calculated FWHM’s for peaks around 265 cm−1 (oxidized samples); (d) Calculated FWHM’s for peaks around 334 cm−1 (oxidized samples).

Figure 5.
Comparison between the magnetic hysteresis loops of reduced samples with different Fe-doping concentration also is presented the hysteresis loop of oxidized sample with 2.20% of Iron.
Figure 5.
Comparison between the magnetic hysteresis loops of reduced samples with different Fe-doping concentration also is presented the hysteresis loop of oxidized sample with 2.20% of Iron.

Figure 6.
Magnetic properties of reduced samples obtained after Fe-doping: (a) Saturation of magnetization; (b) comparison between hysteresis curve and relative permeability.
Figure 6.
Magnetic properties of reduced samples obtained after Fe-doping: (a) Saturation of magnetization; (b) comparison between hysteresis curve and relative permeability.
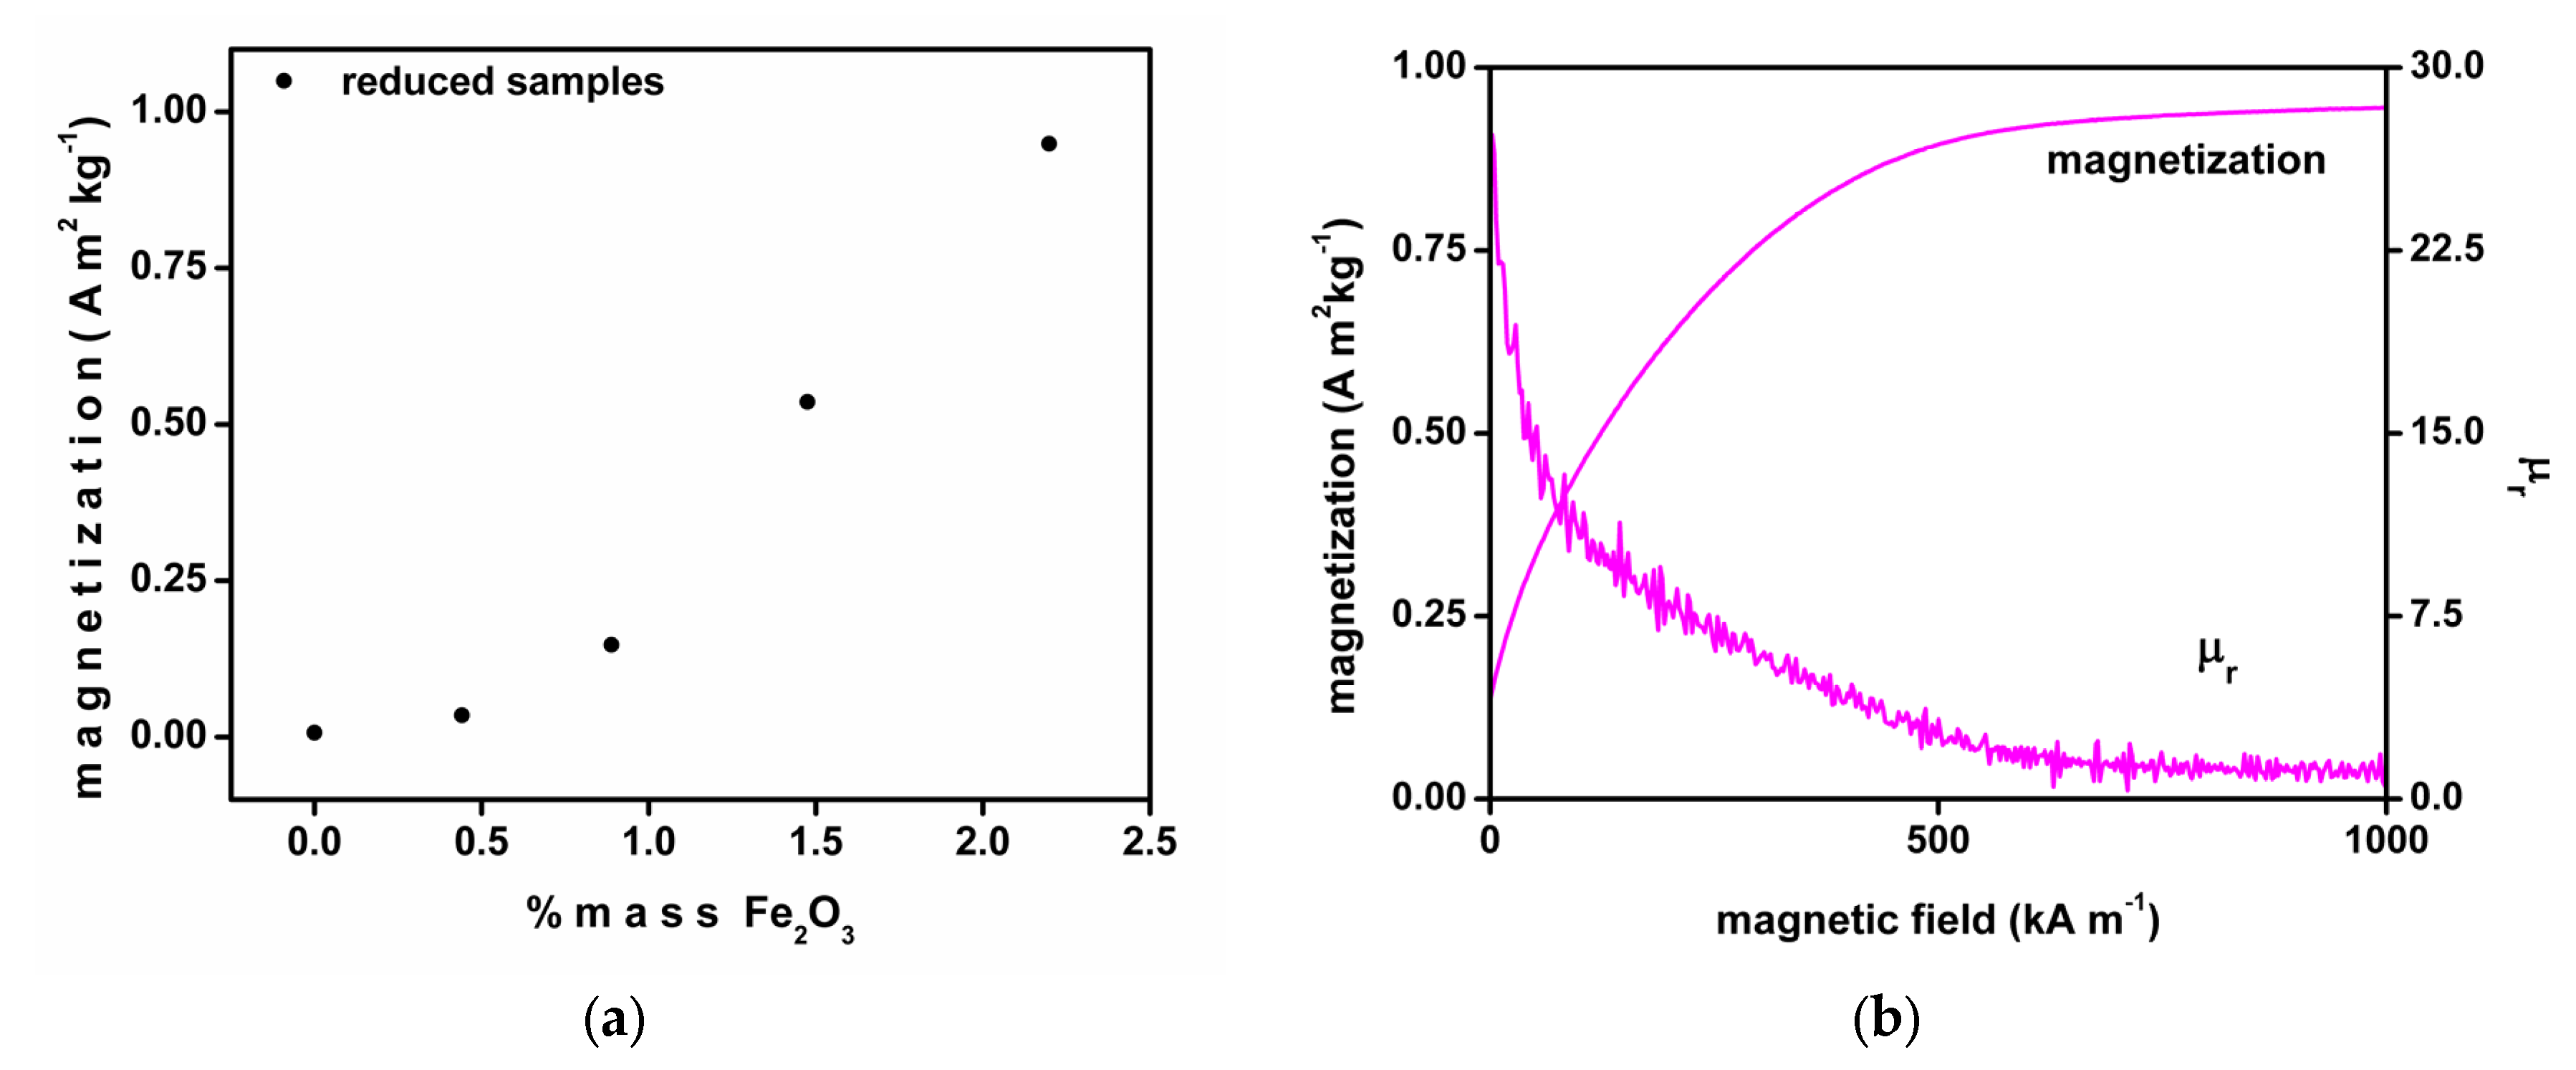
Figure 7.
ESR spectra arising from different Fe-doped LN samples with varying doping concentration and two different post-thermal treatments.
Figure 7.
ESR spectra arising from different Fe-doped LN samples with varying doping concentration and two different post-thermal treatments.


Table 1.
Refined lattice parameters and cell volumes, along with relevant agreement indices.
| Sample | a () = b () | c () | Cell Volume (3) | Weighted R Profile | Goodness of Fit |
|---|---|---|---|---|---|
| nLN-O | 5.15351 | 13.85655 | 318.70730 | 12.97 | 21.07 |
| nLN:Fe-0.44-O | 5.15117 | 13.85305 | 318.33790 | 12.89 | 24.94 |
| nLN:Fe-0.89-O | 5.15023 | 13.84717 | 318.08590 | 13.53 | 26.14 |
| nLN:Fe-1.47-O | 5.14999 | 13.84339 | 317.96950 | 13.03 | 22.69 |
| nLN:Fe-2.20-O | 5.15042 | 13.84527 | 318.06570 | 12.52 | 23.37 |
| nLN-R | 5.15154 | 13.85371 | 318.39860 | 14.25 | 27.32 |
| nLN:Fe-0.44-R | 5.15196 | 13.85424 | 318.46240 | 14.87 | 32.88 |
| nLN:Fe-0.89-R | 5.15349 | 13.84612 | 318.59460 | 13.45 | 24.15 |
| nLN:Fe-1.47-R | 5.15245 | 13.84793 | 318.37750 | 13.42 | 23.53 |
| nLN:Fe-2.20-R | 5.15265 | 13.84850 | 318.41600 | 12.48 | 23.14 |
© 2018 by the authors. Licensee MDPI, Basel, Switzerland. This article is an open access article distributed under the terms and conditions of the Creative Commons Attribution (CC BY) license (http://creativecommons.org/licenses/by/4.0/).
Share and Cite
MDPI and ACS Style
Fierro-Ruiz, C.D.; Sánchez-Dena, O.; Cabral-Larquier, E.M.; Elizalde-Galindo, J.T.; Farías, R. Structural and Magnetic Behavior of Oxidized and Reduced Fe Doped LiNbO3 Powders. Crystals 2018, 8, 108. https://doi.org/10.3390/cryst8030108
AMA Style
Fierro-Ruiz CD, Sánchez-Dena O, Cabral-Larquier EM, Elizalde-Galindo JT, Farías R. Structural and Magnetic Behavior of Oxidized and Reduced Fe Doped LiNbO3 Powders. Crystals. 2018; 8(3):108. https://doi.org/10.3390/cryst8030108
Chicago/Turabian StyleFierro-Ruiz, Cesar D., Oswaldo Sánchez-Dena, Eva M. Cabral-Larquier, José T. Elizalde-Galindo, and Rurik Farías. 2018. "Structural and Magnetic Behavior of Oxidized and Reduced Fe Doped LiNbO3 Powders" Crystals 8, no. 3: 108. https://doi.org/10.3390/cryst8030108
Note that from the first issue of 2016, this journal uses article numbers instead of page numbers. See further details here.