Structural and Electronic Properties of (TMTTF)2X Salts with Tetrahedral Anions

 ,
,
Abstract
:1. Introduction
2. Structural Considerations
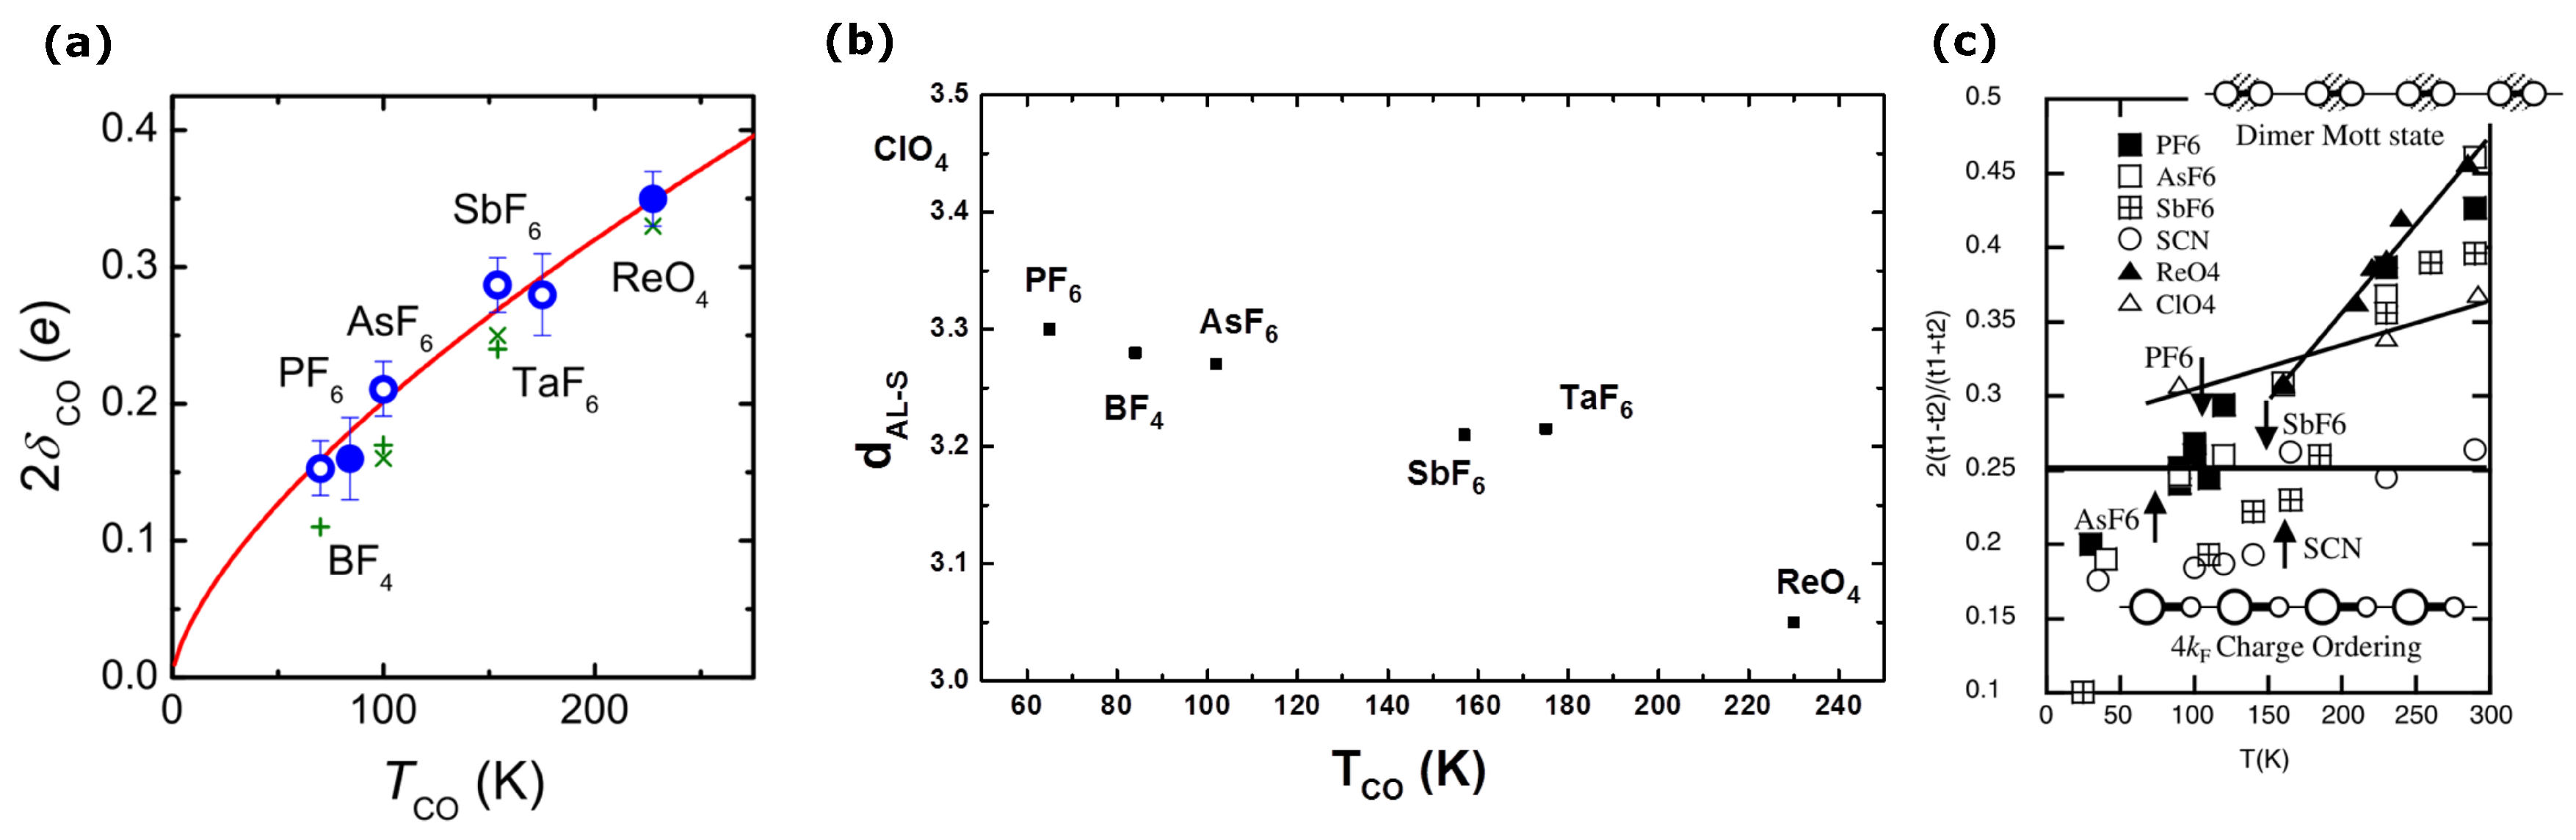
2.1. Charge Order
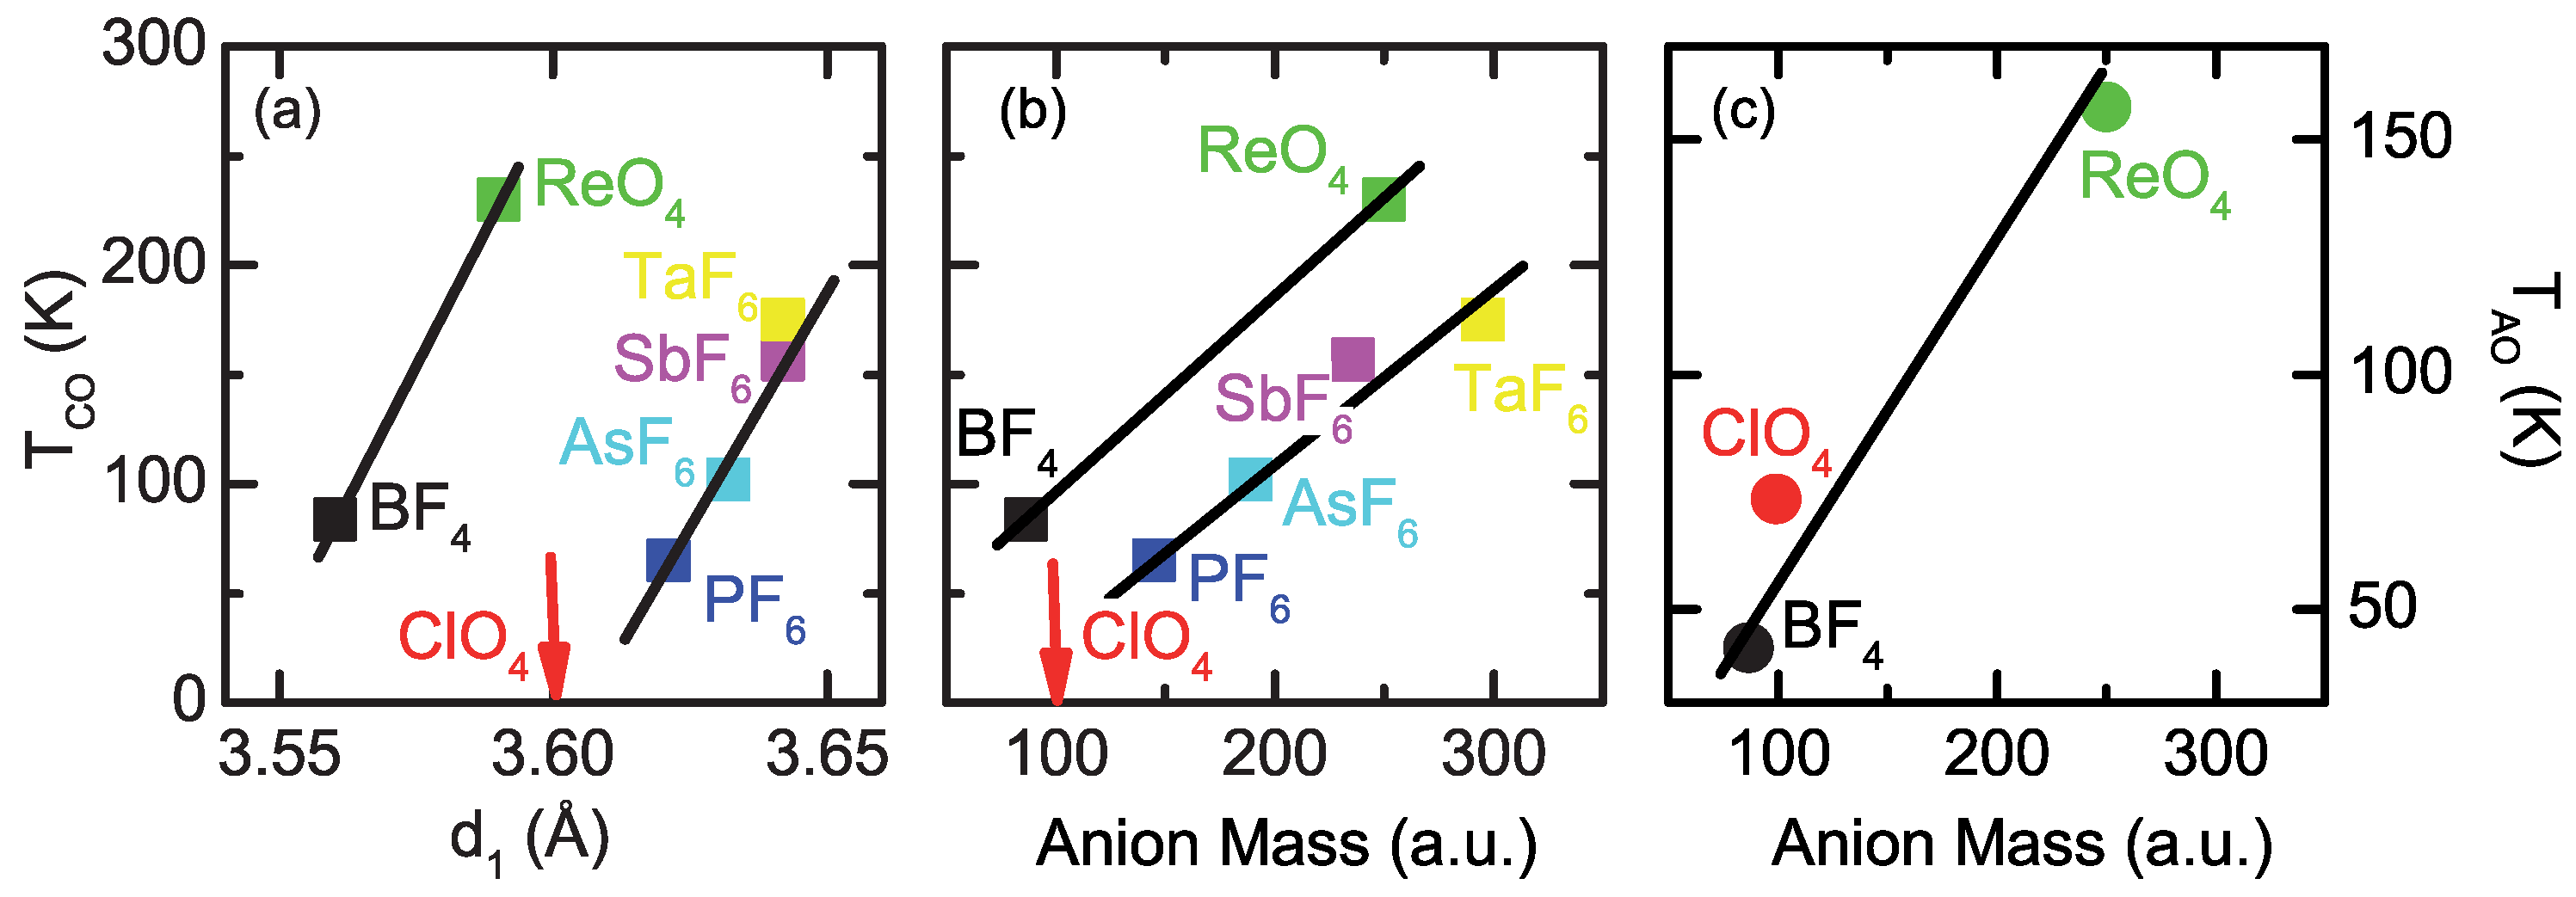
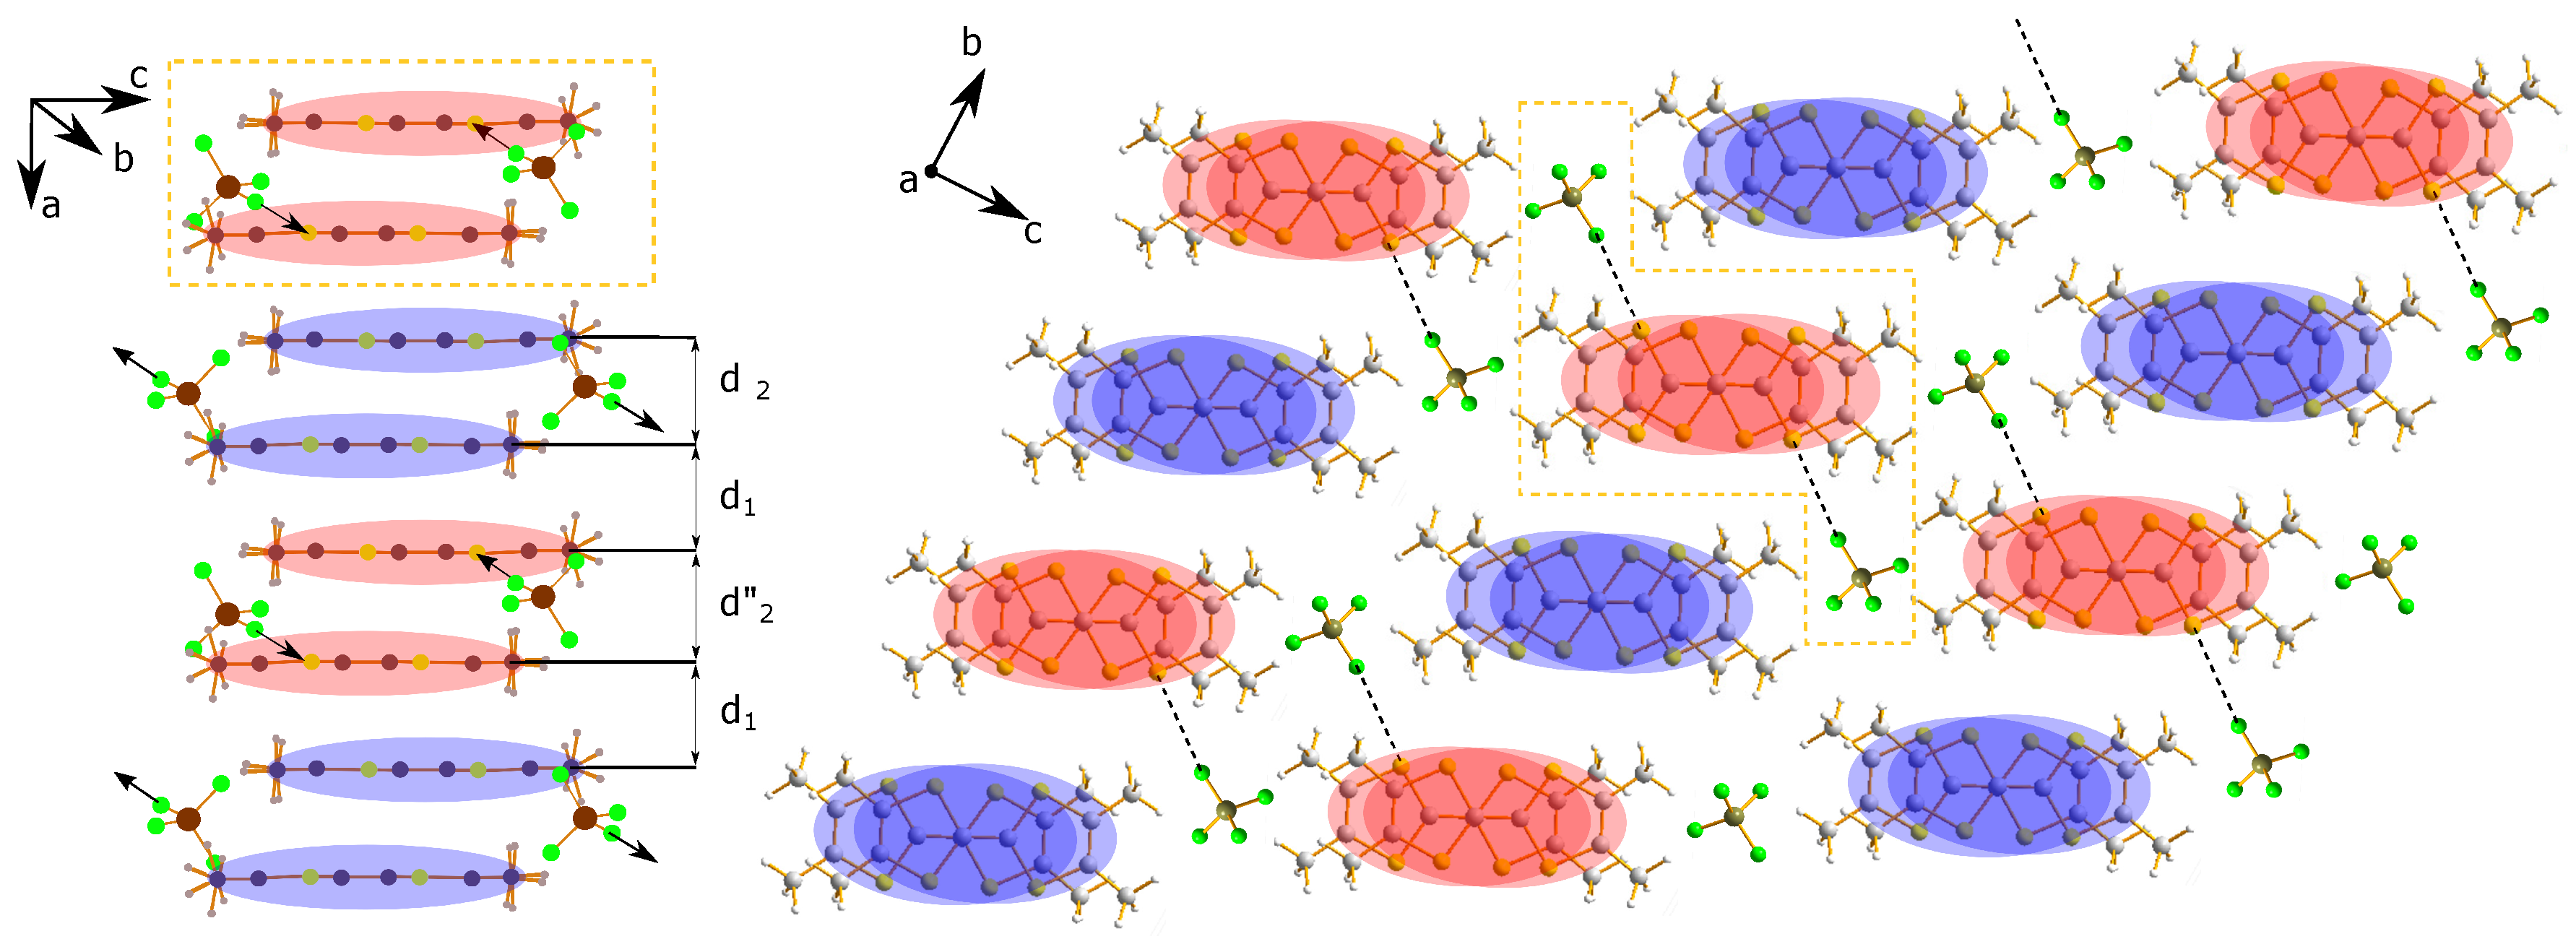
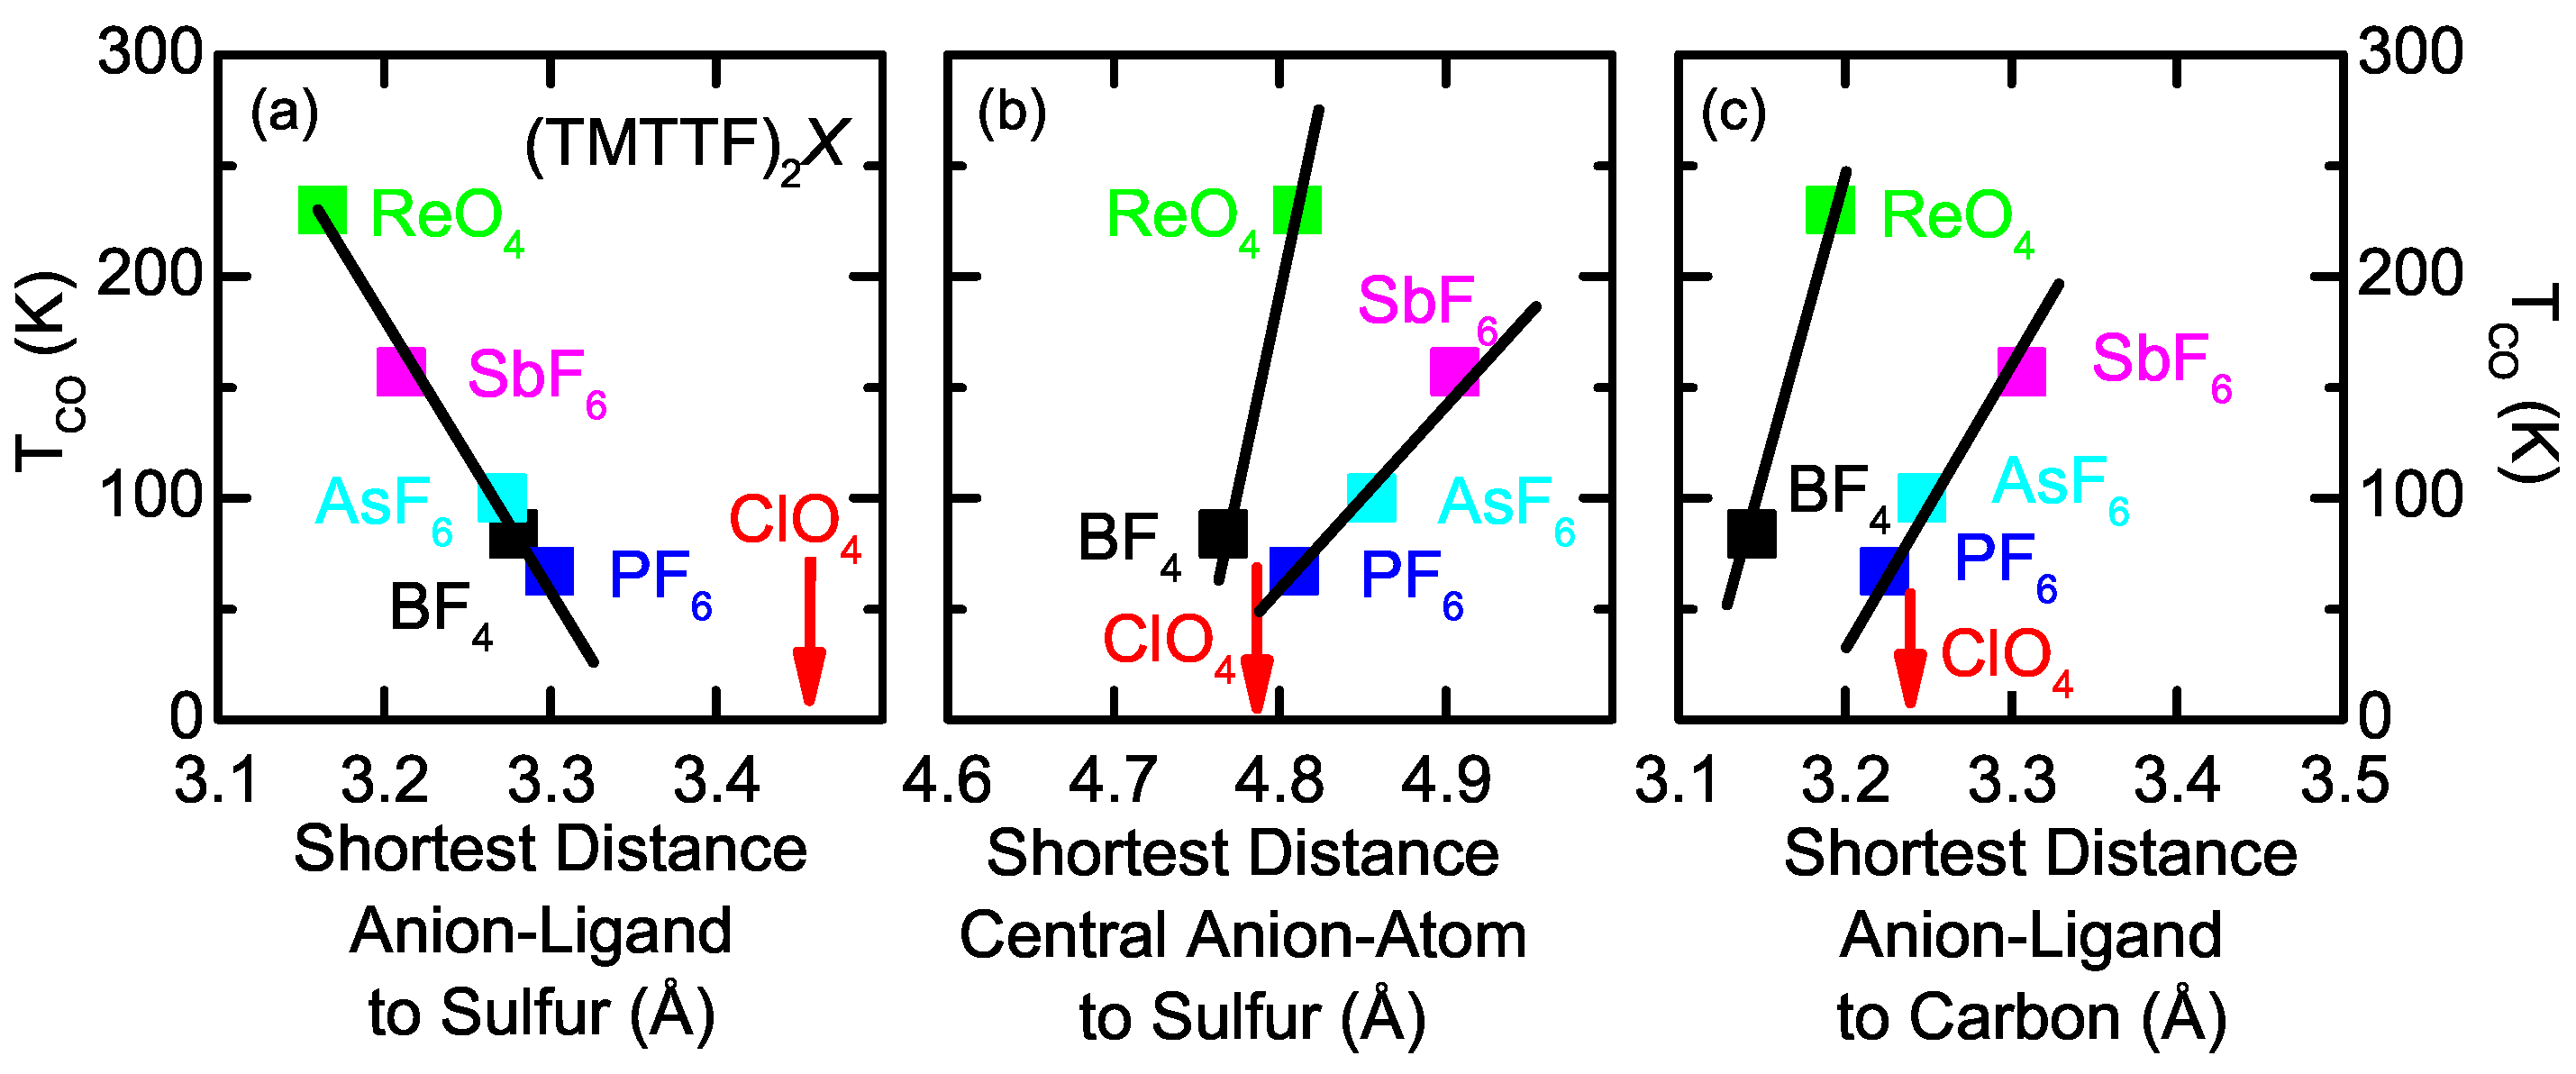
2.2. Anion Contribution to Charge Order
2.3. Anion Order
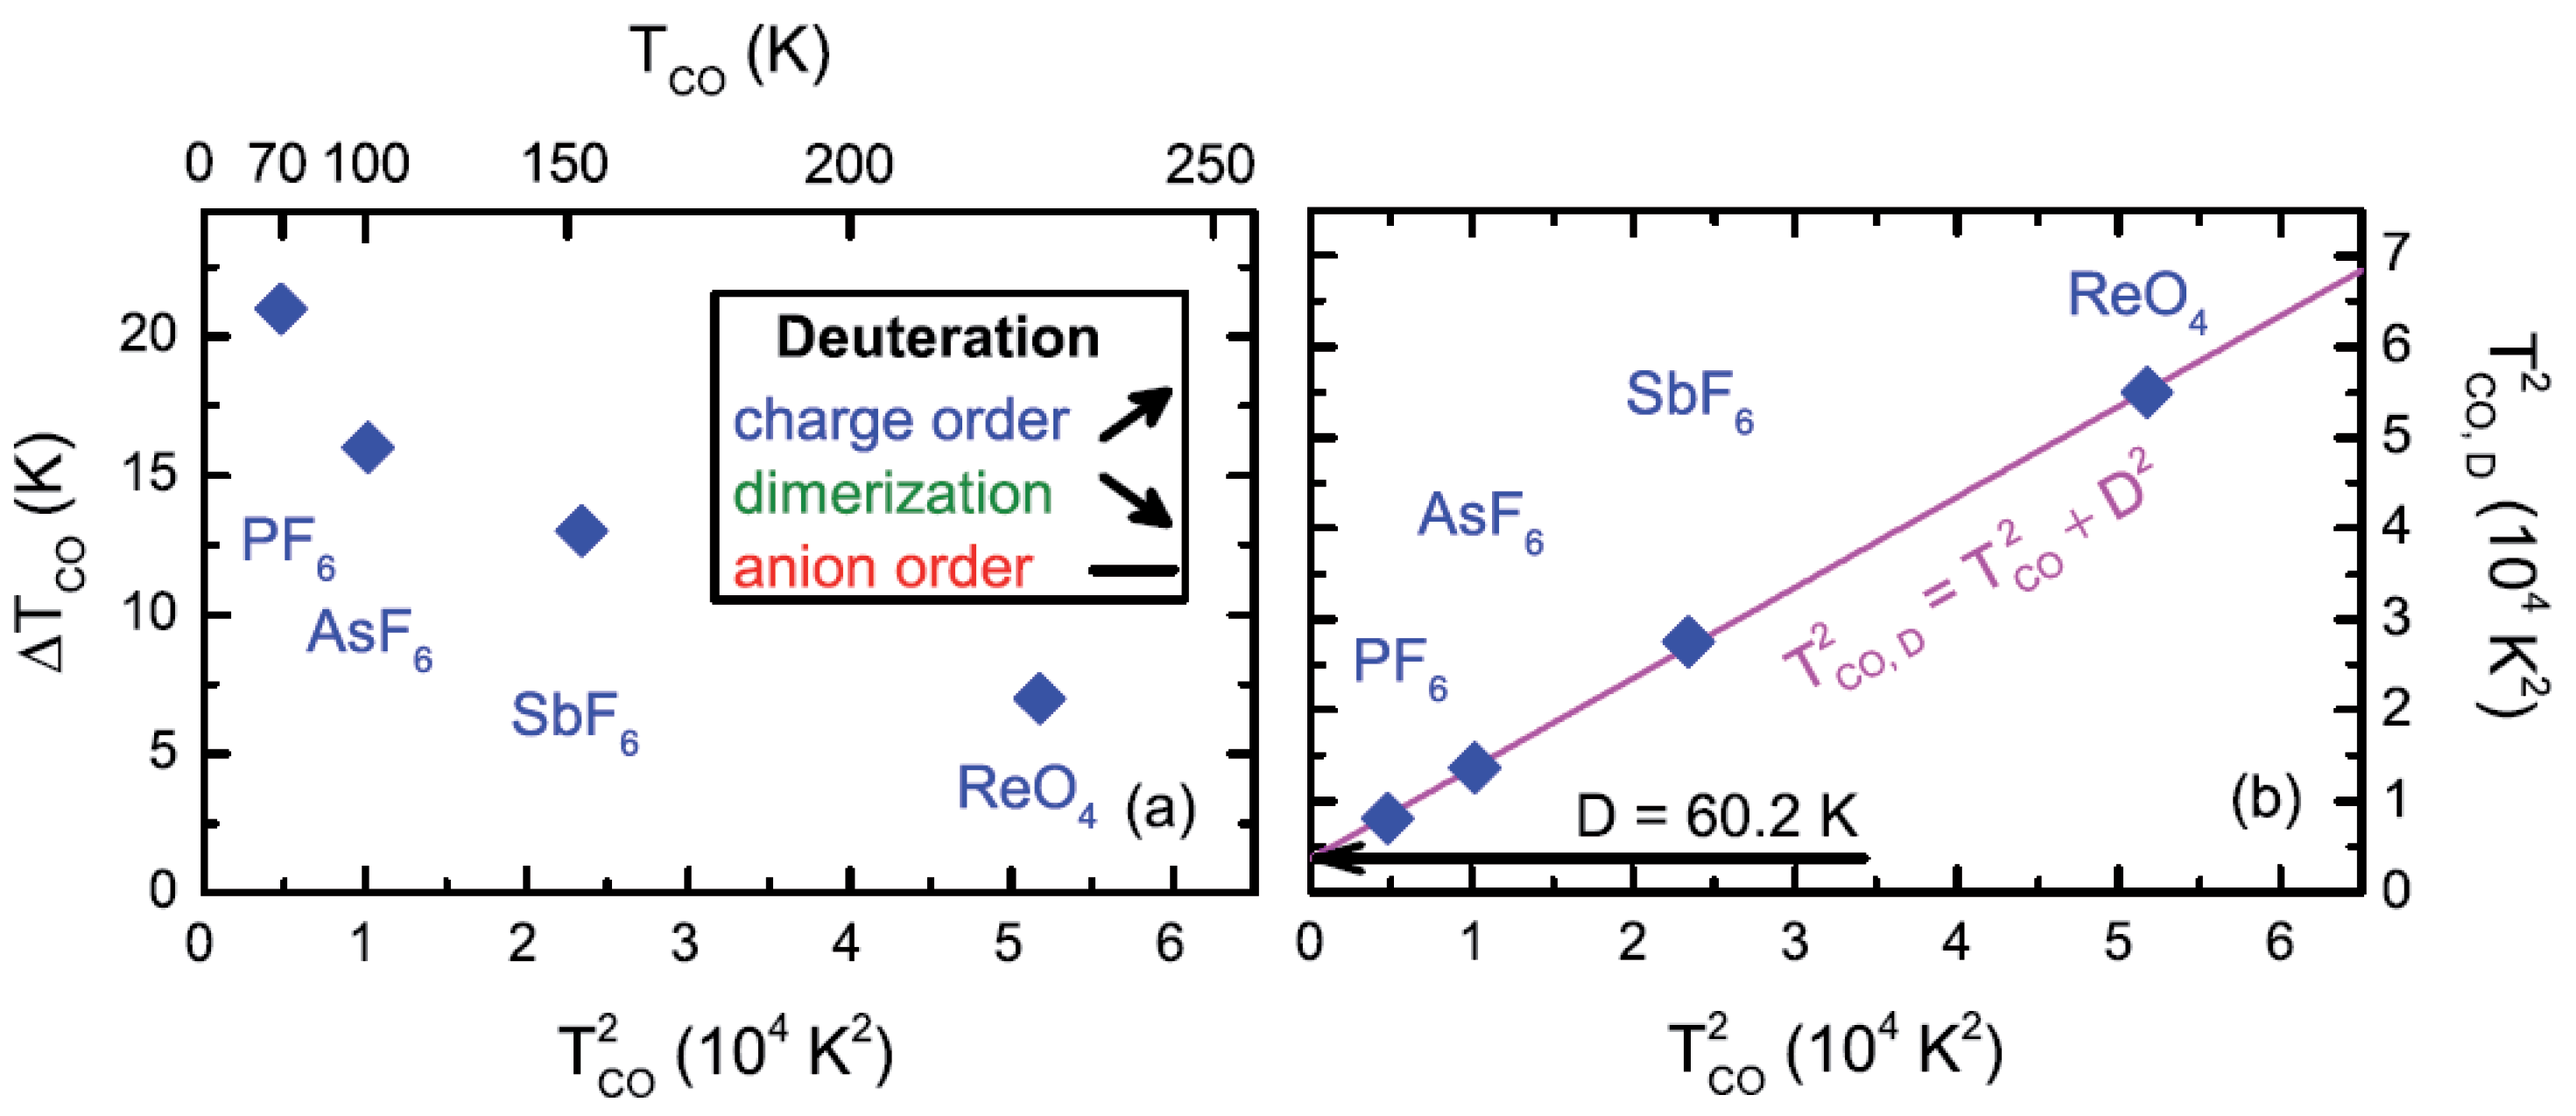
2.4. Deuteration
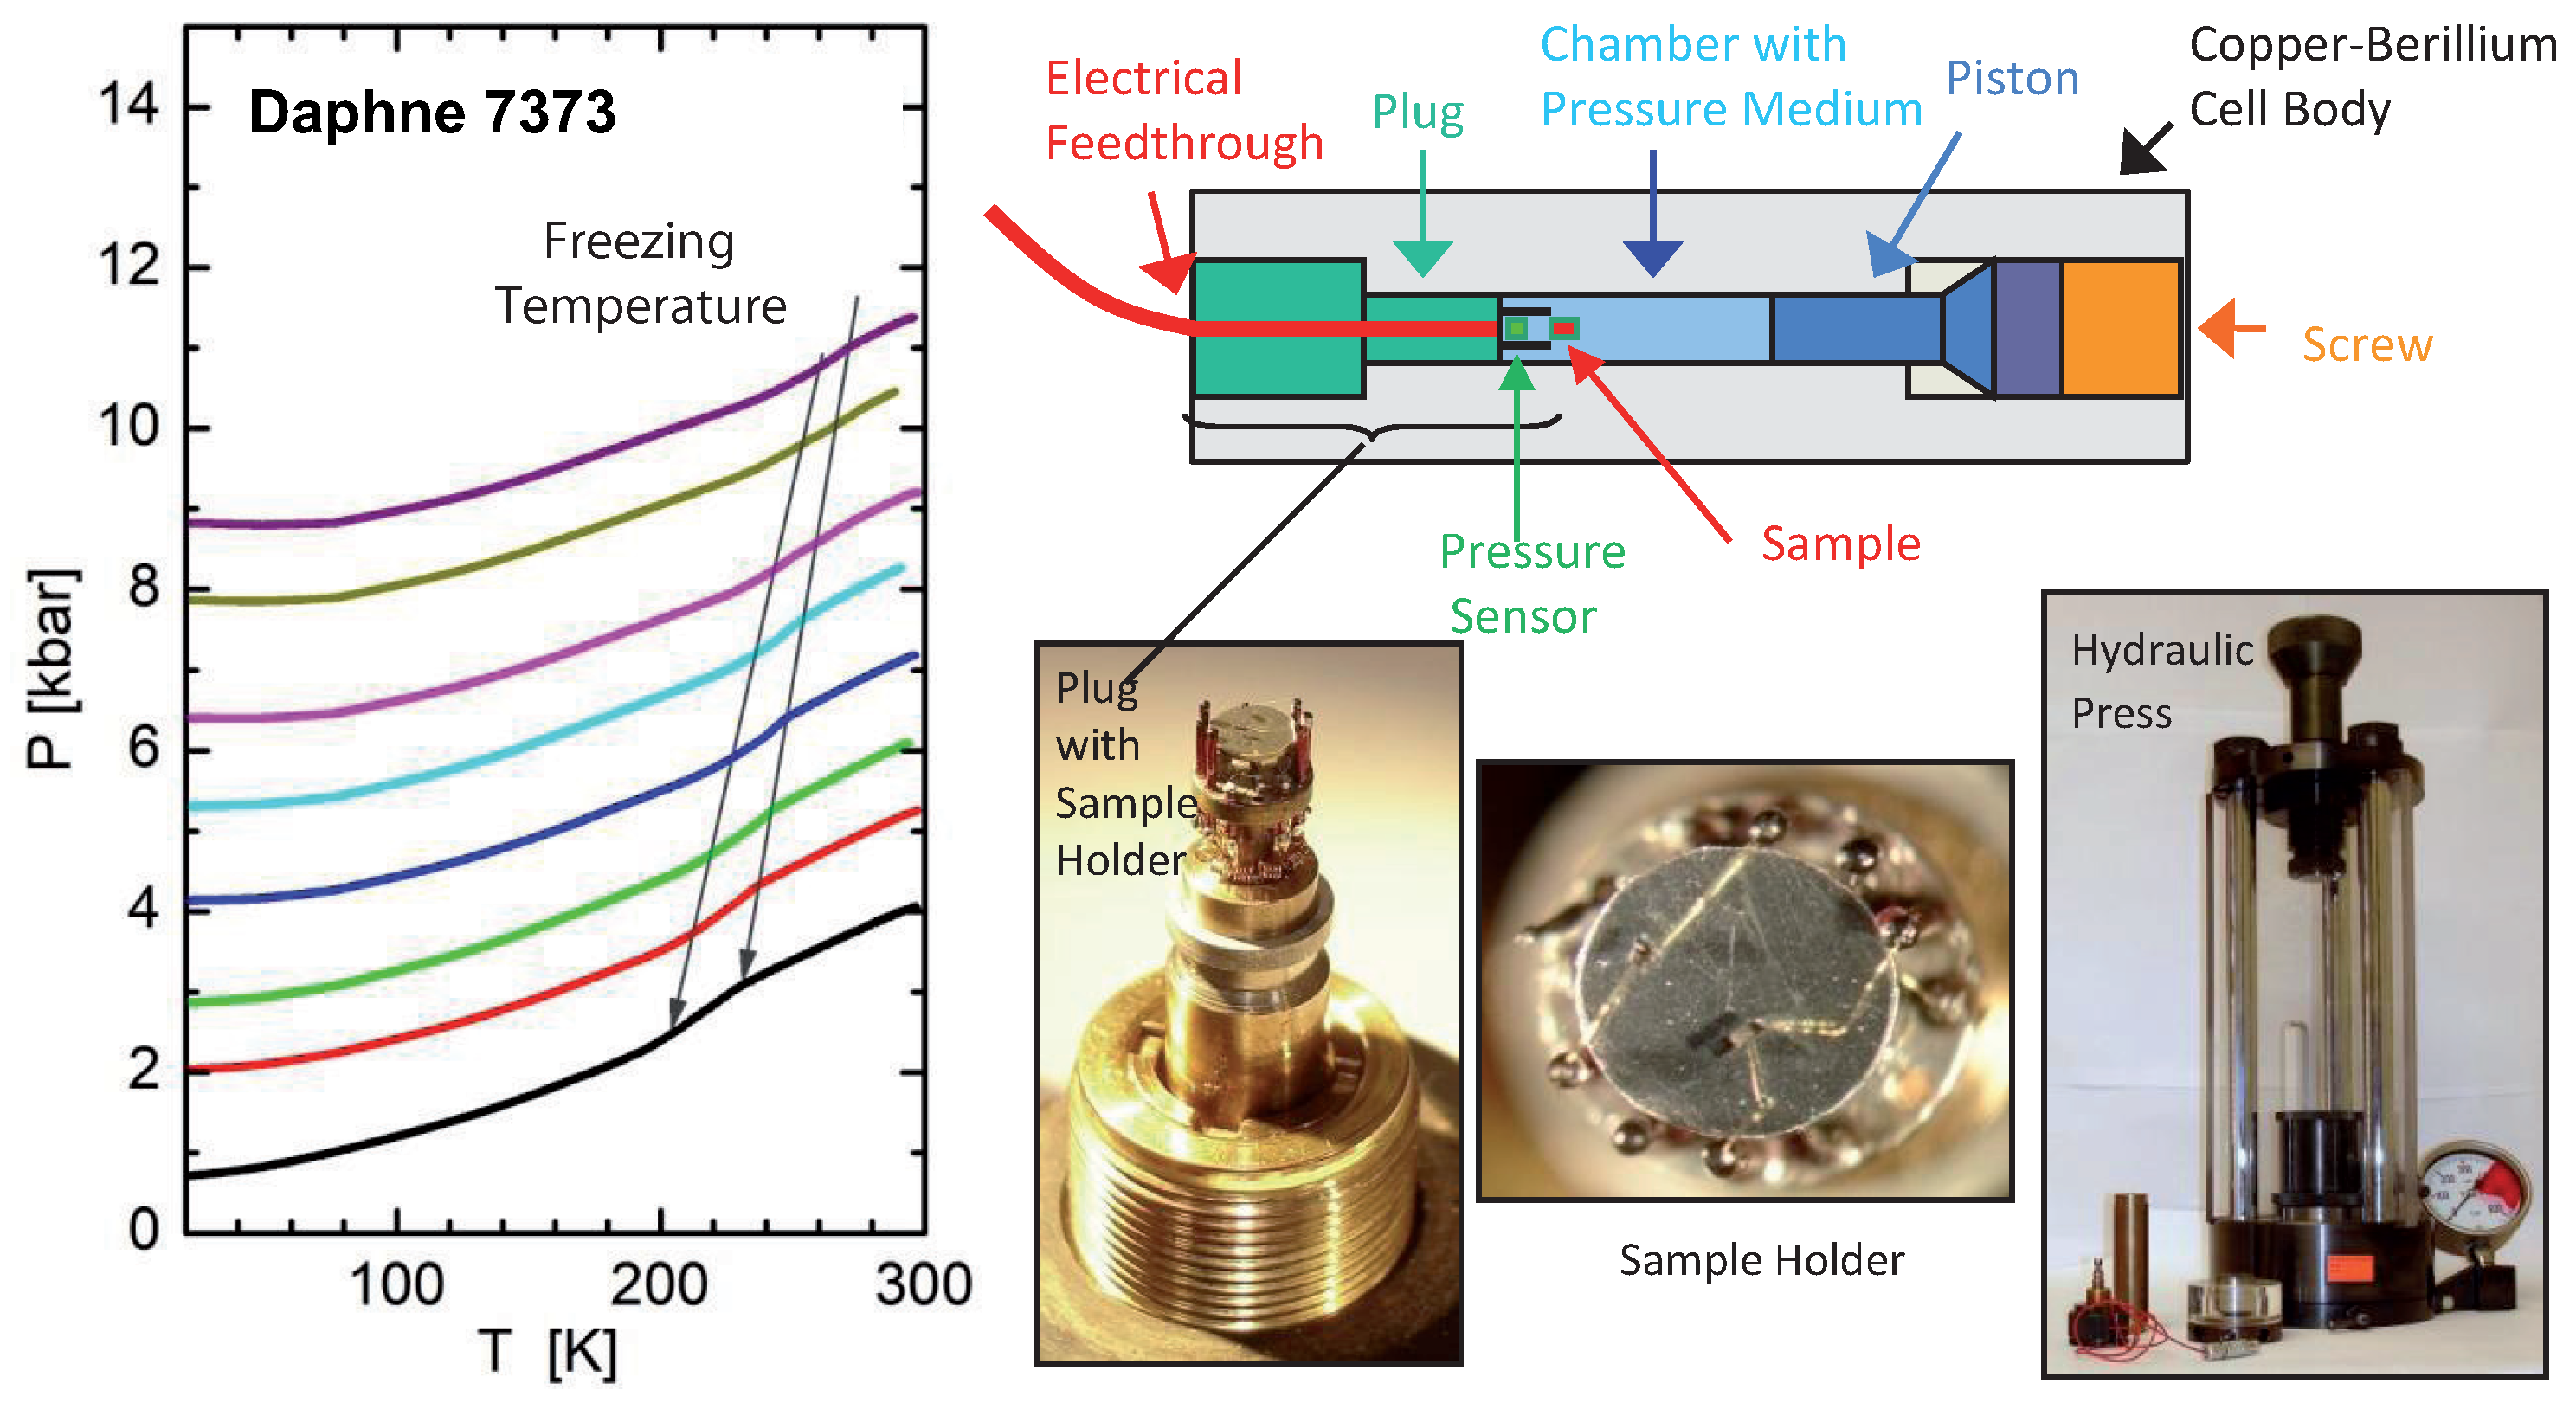
3. Experimental Details
4. Electrical Transport under Pressure
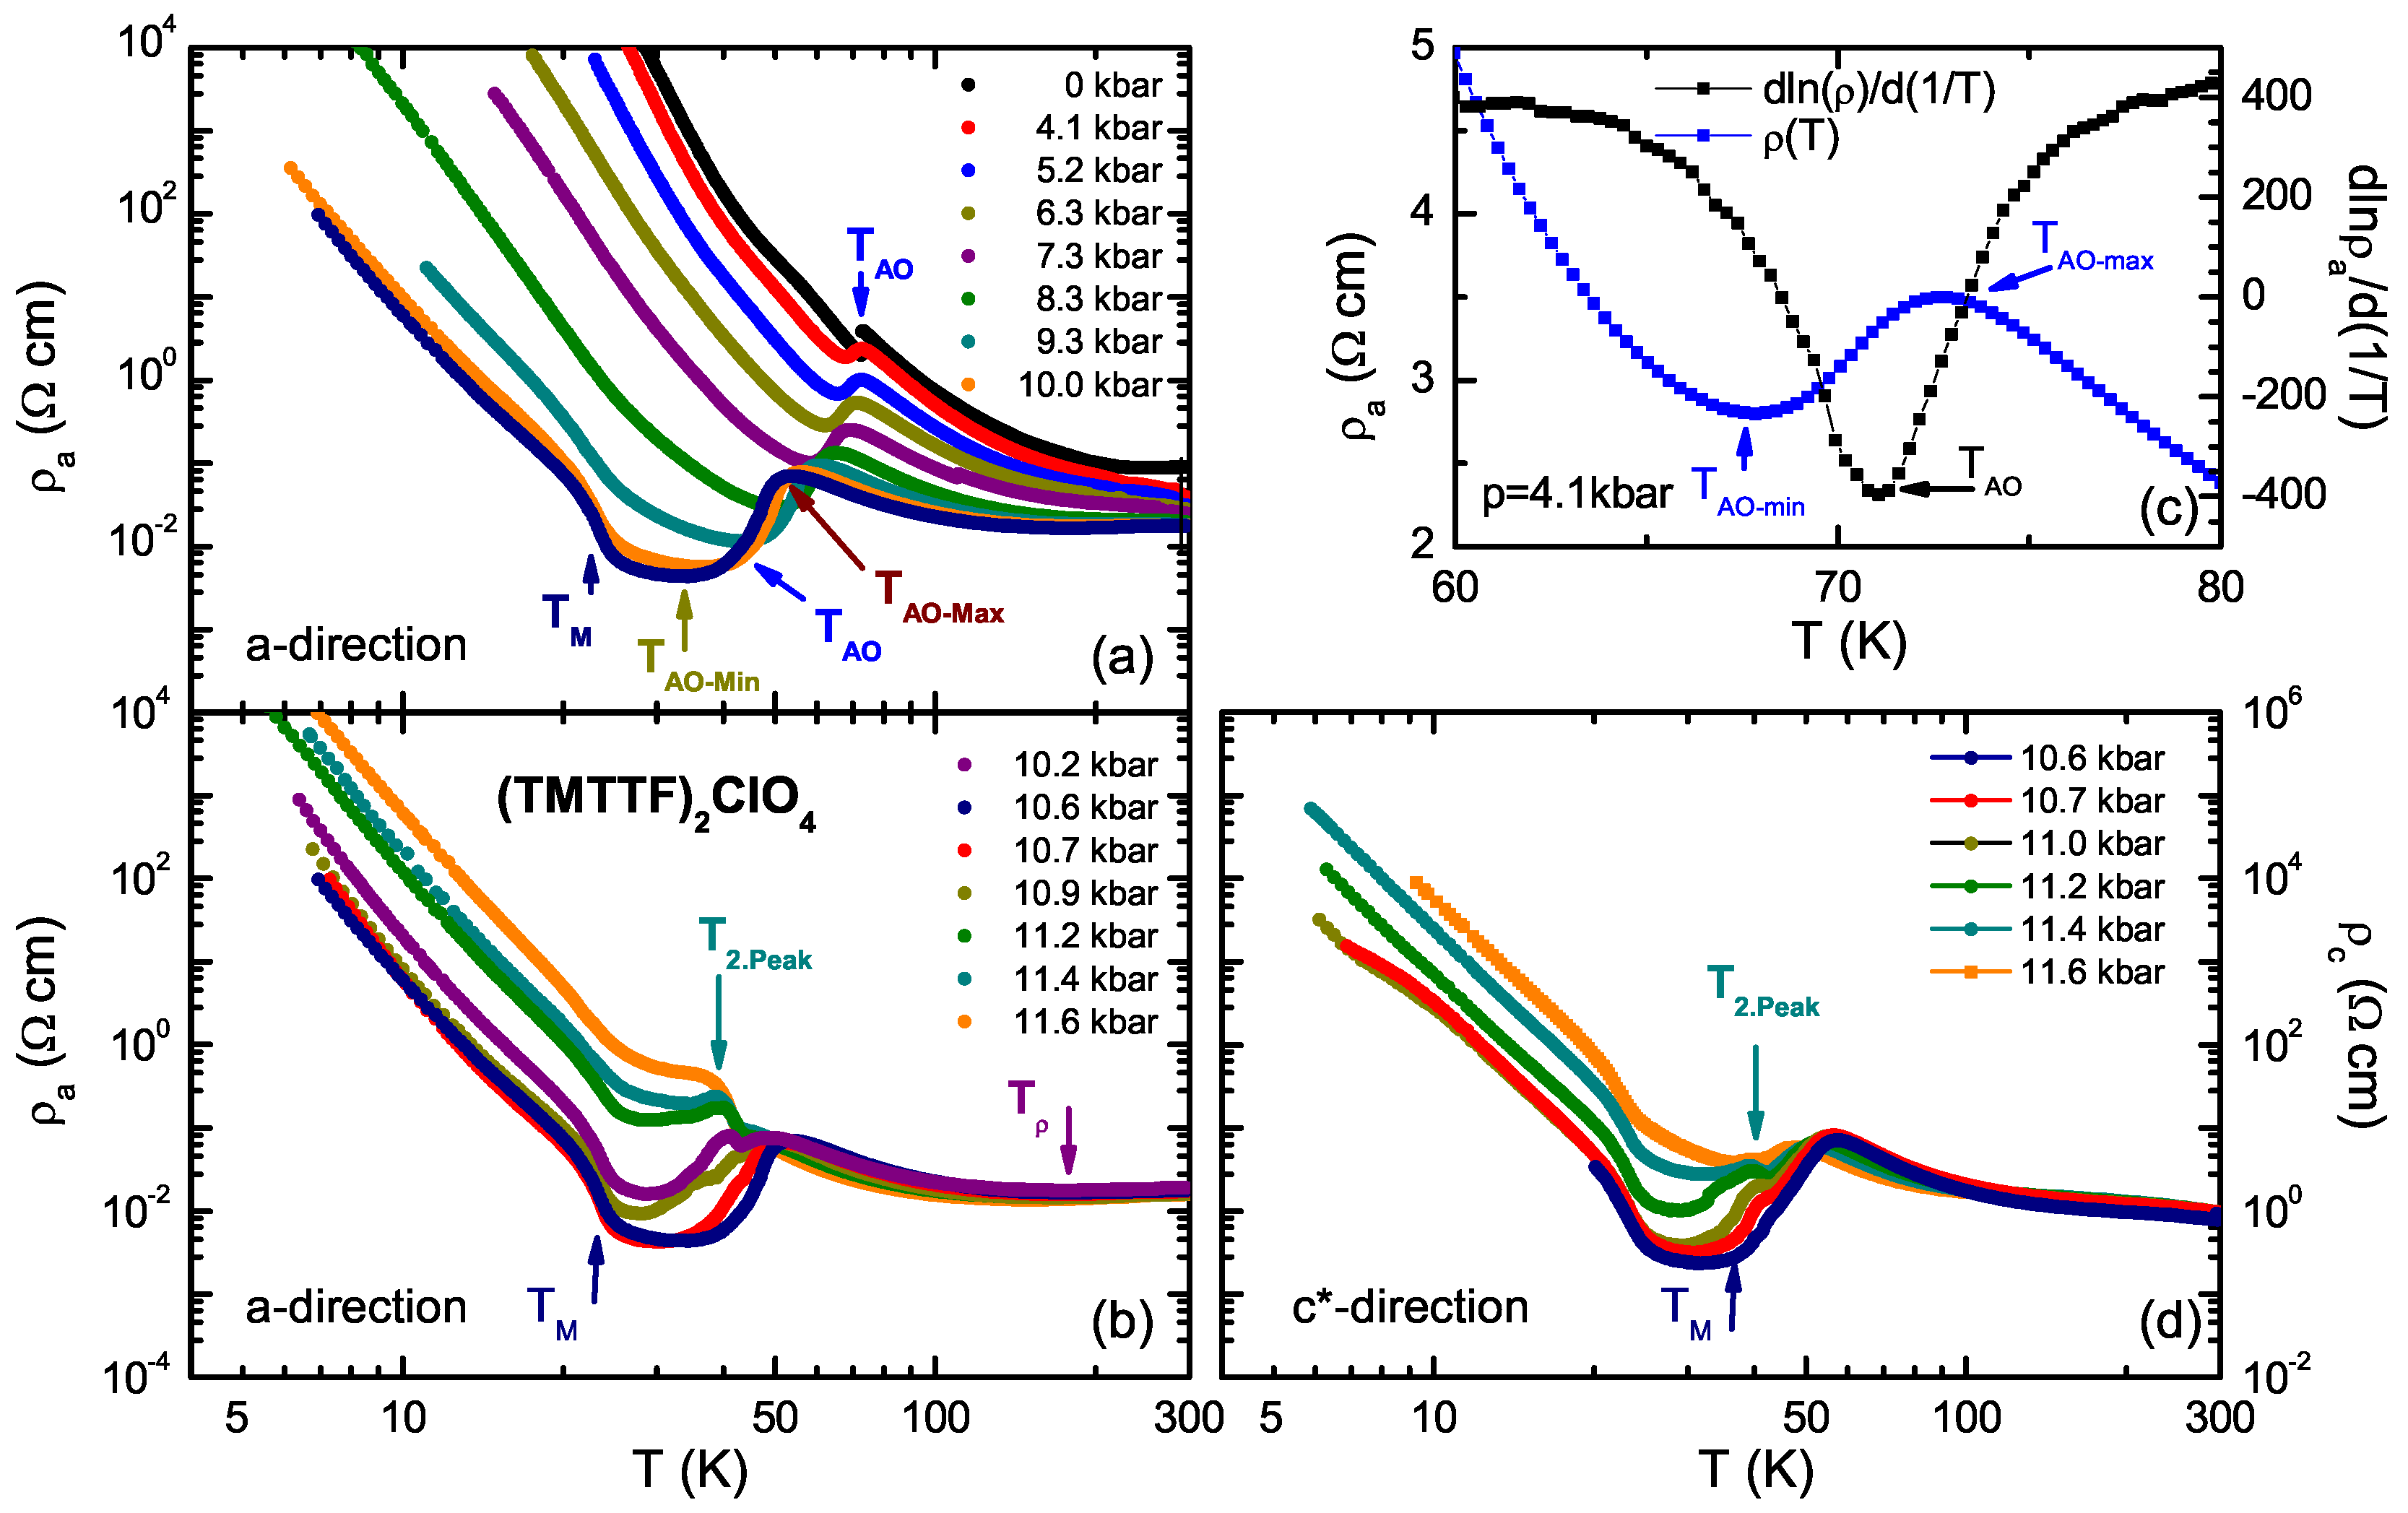
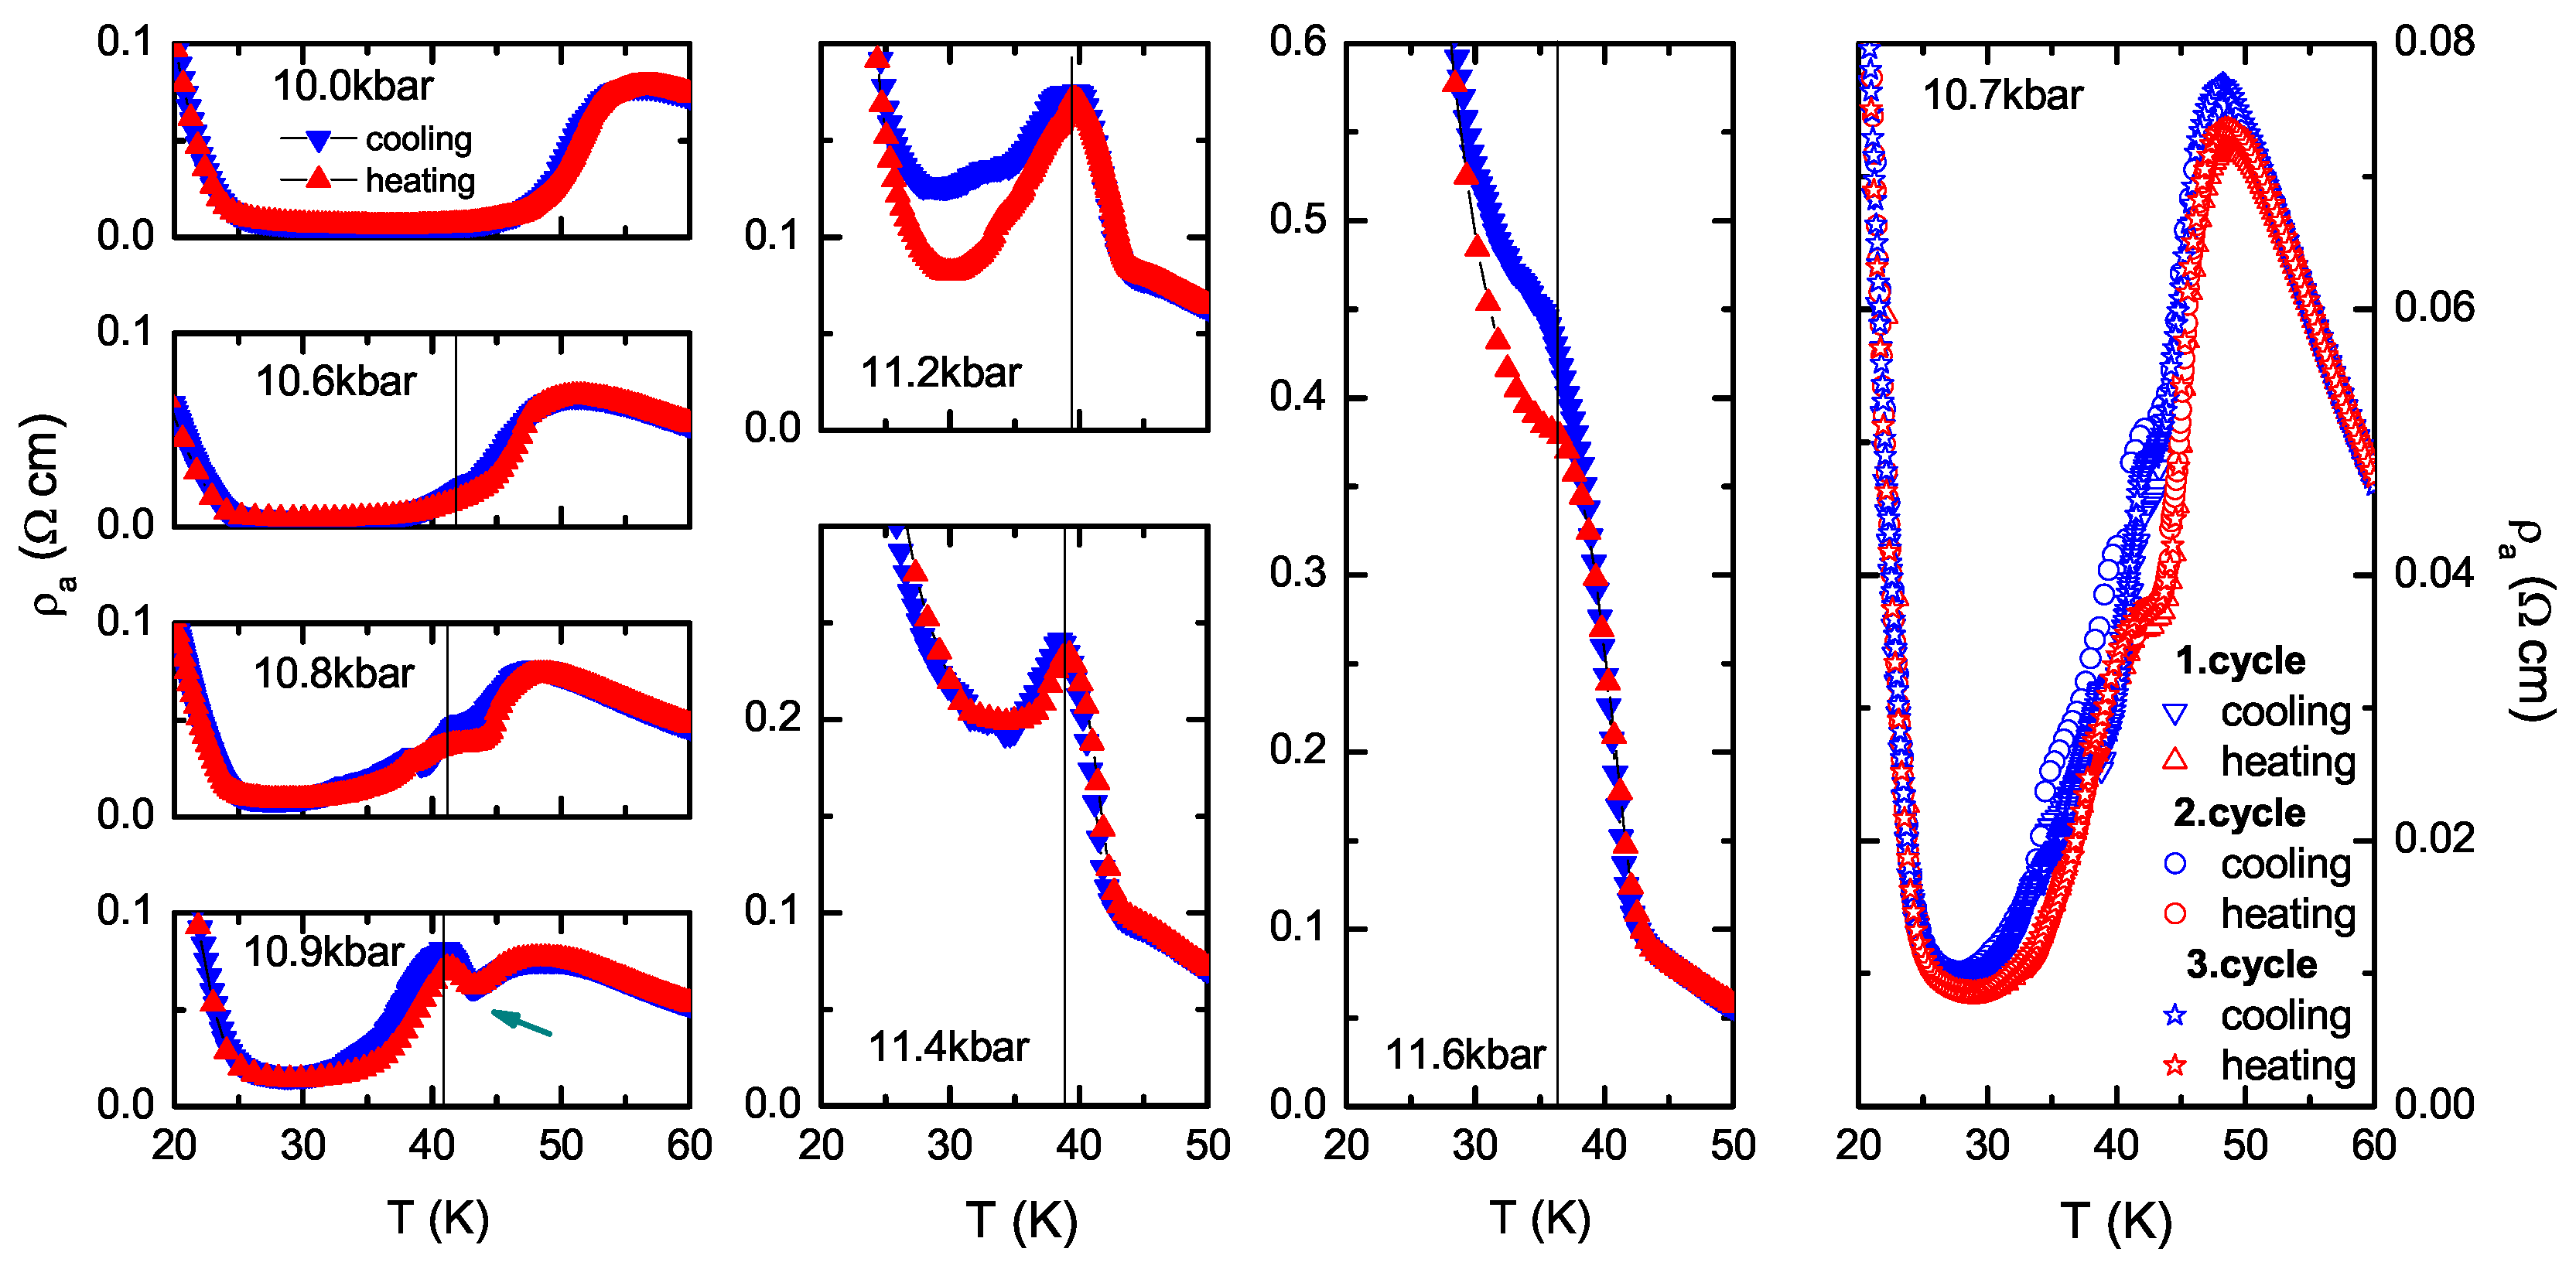
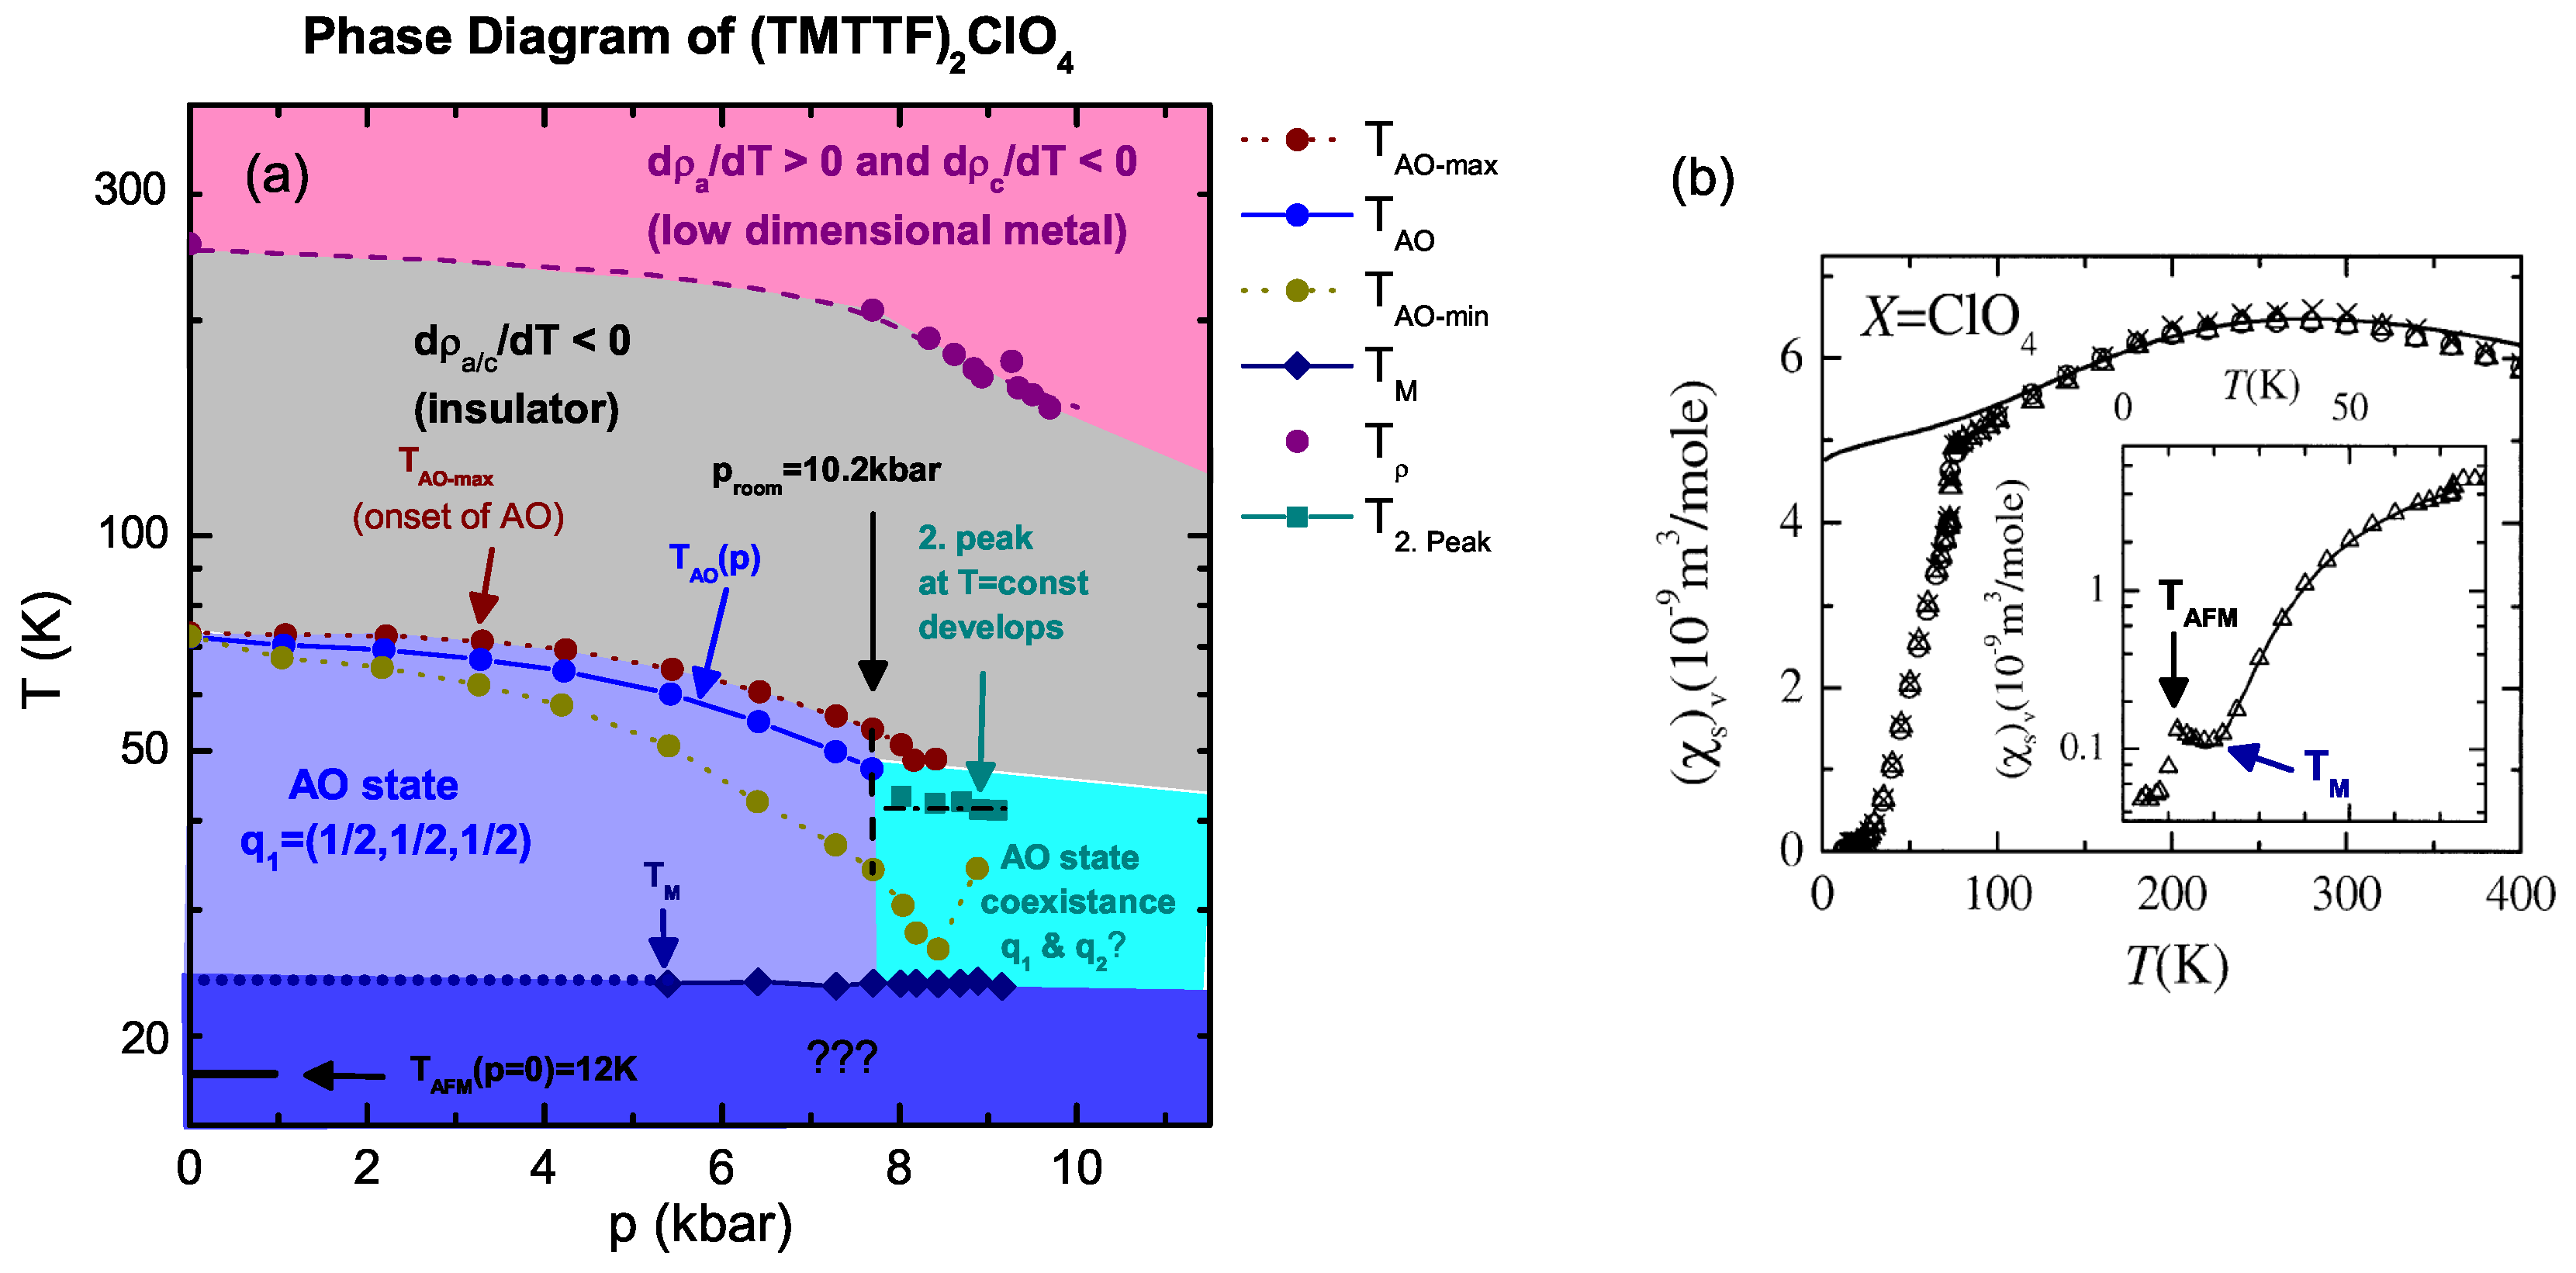
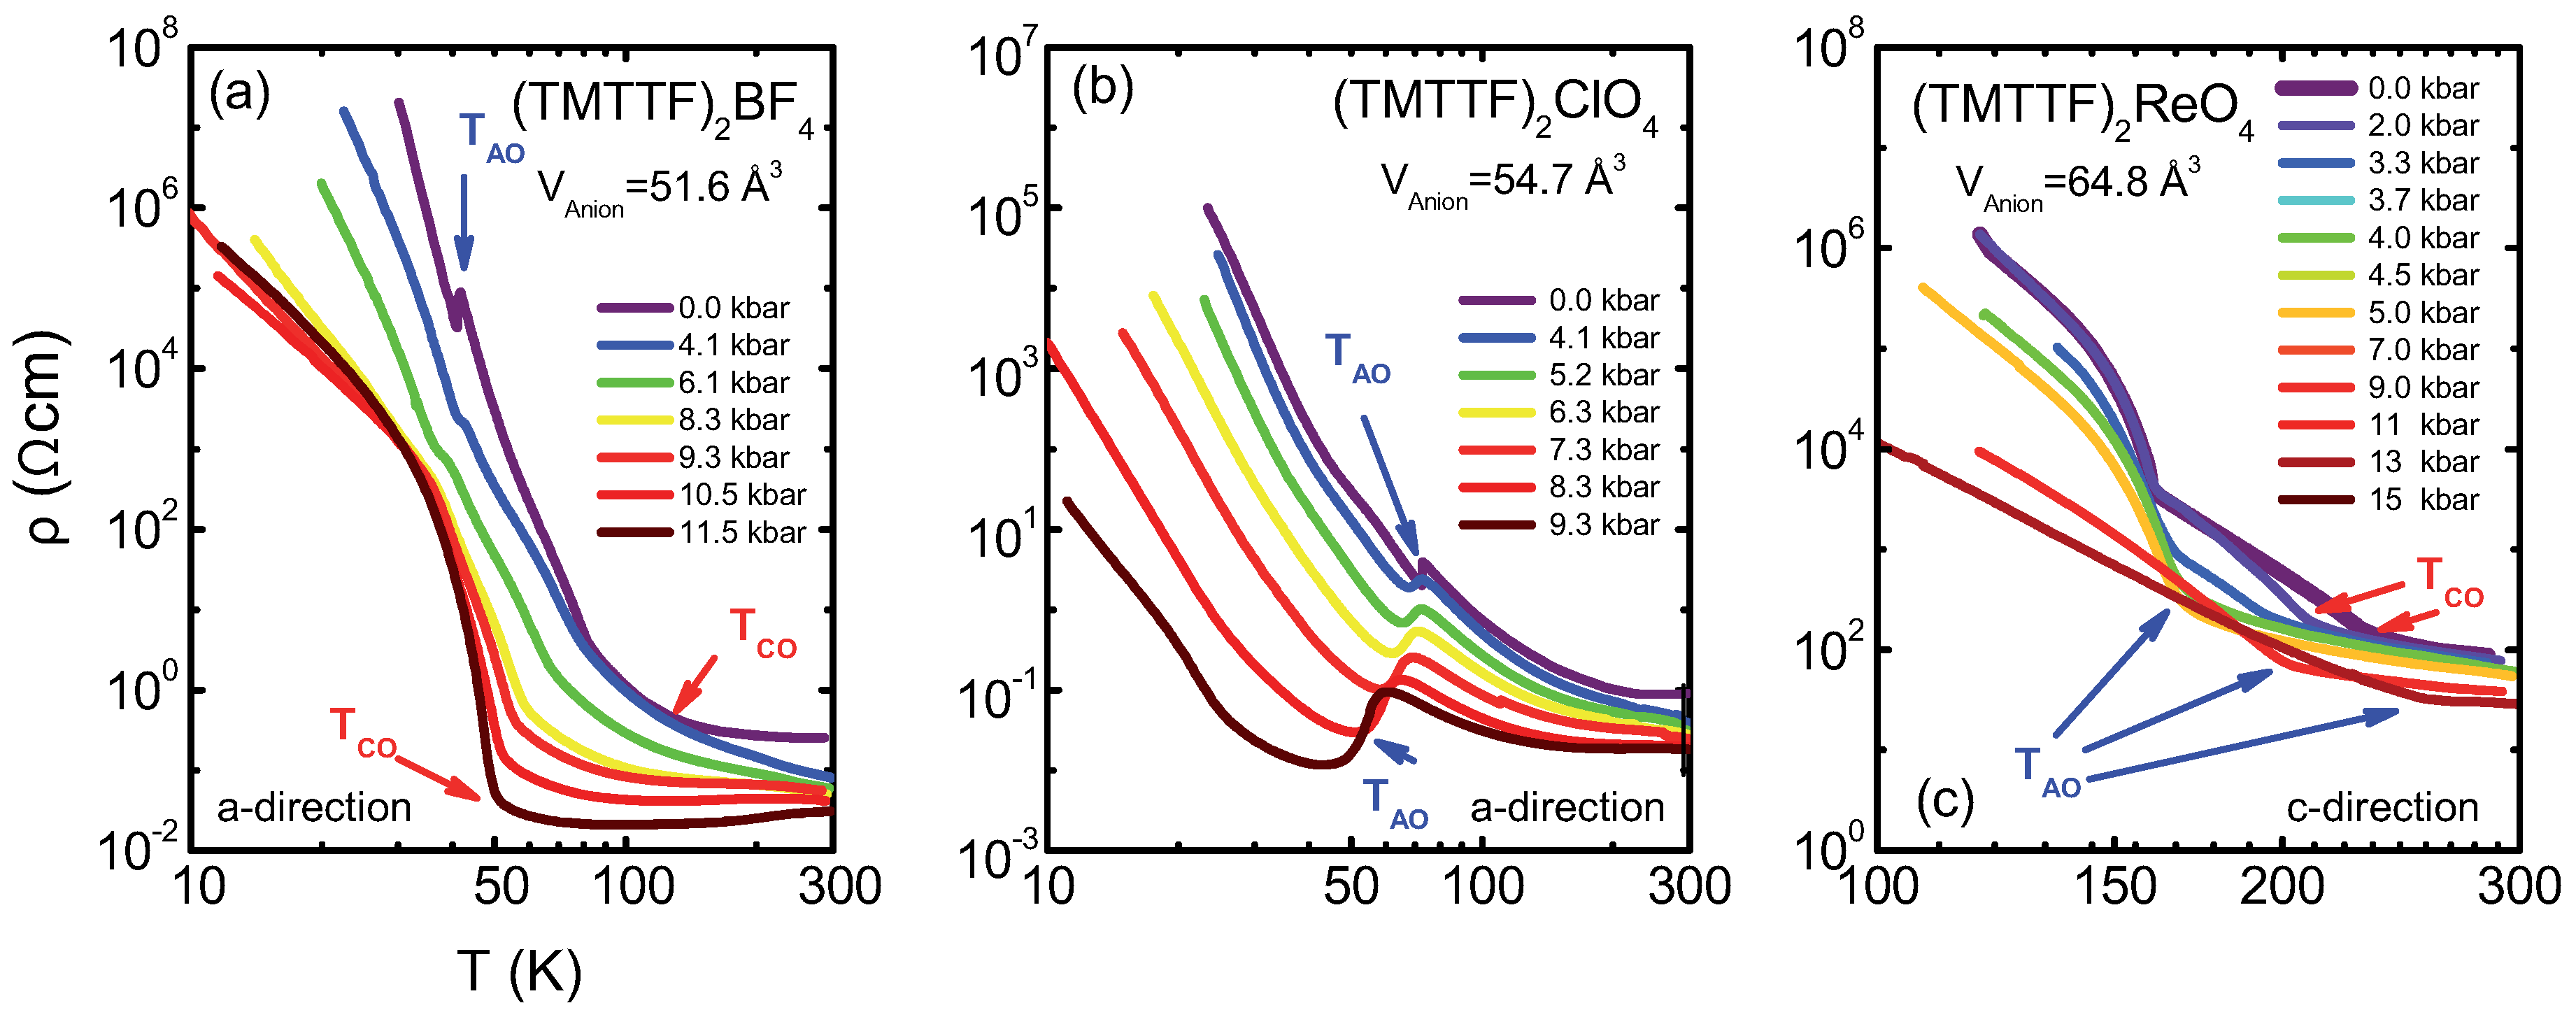
4.1. (TMTTF)ClO
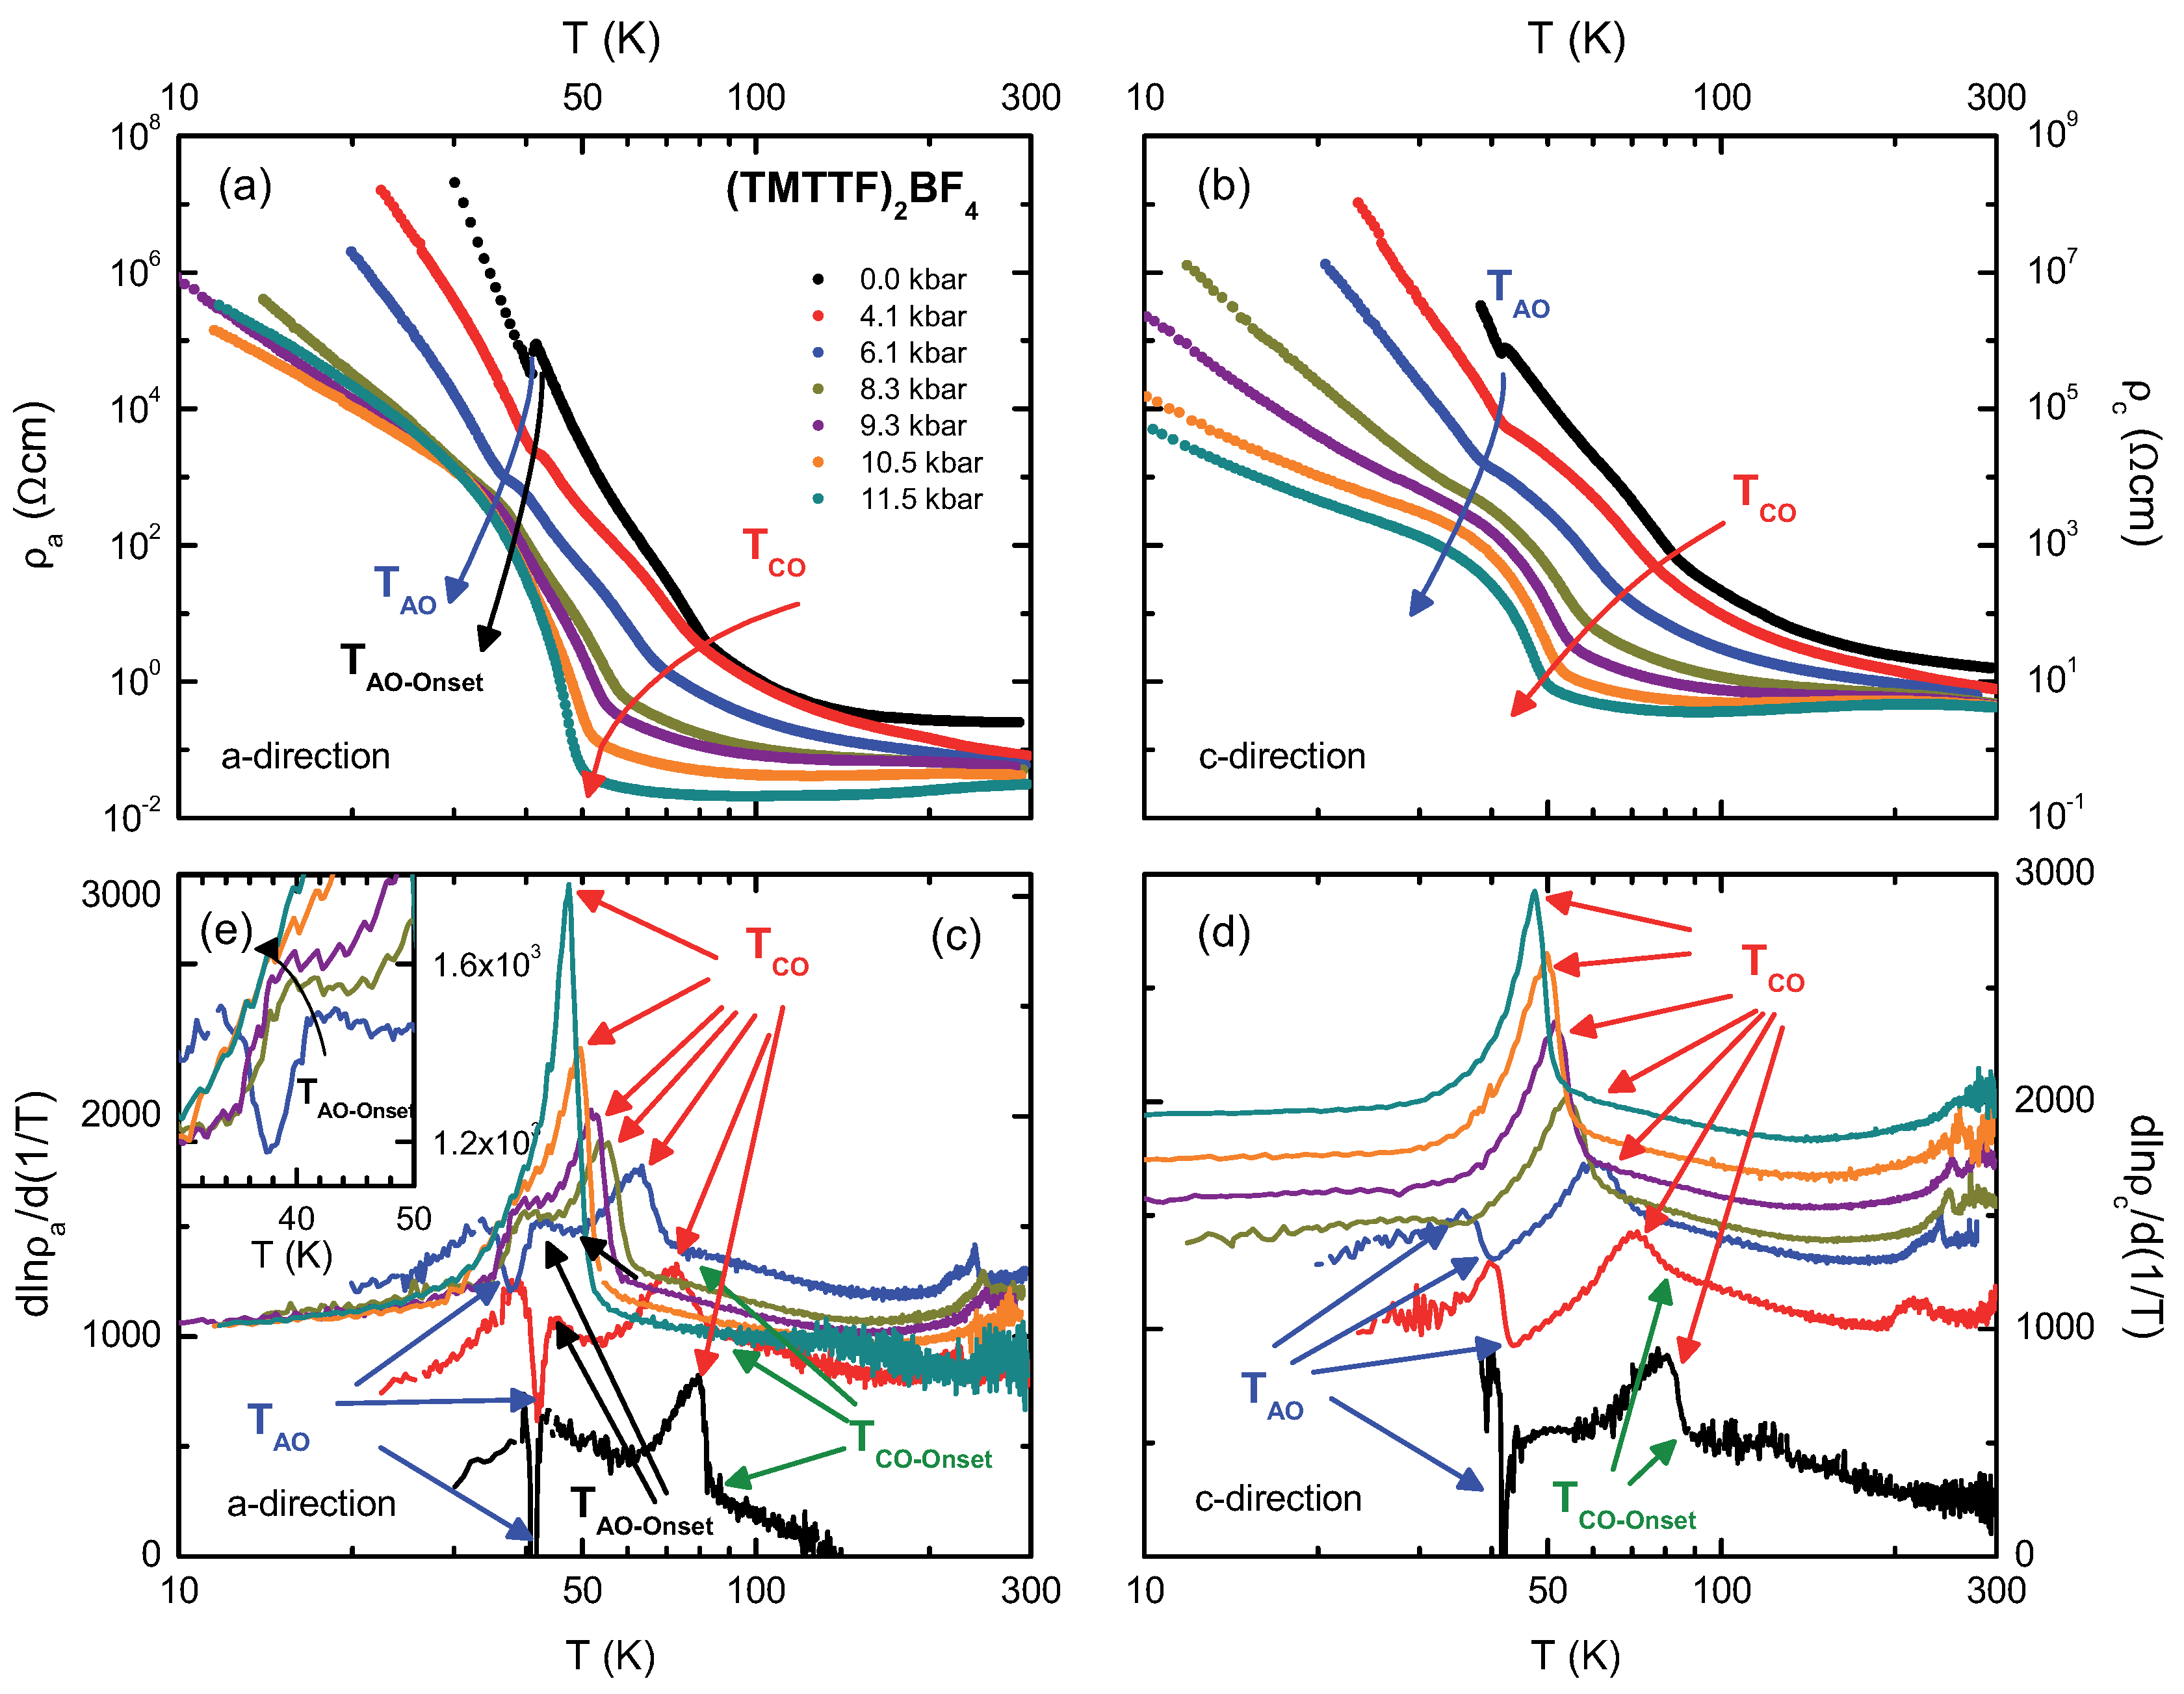
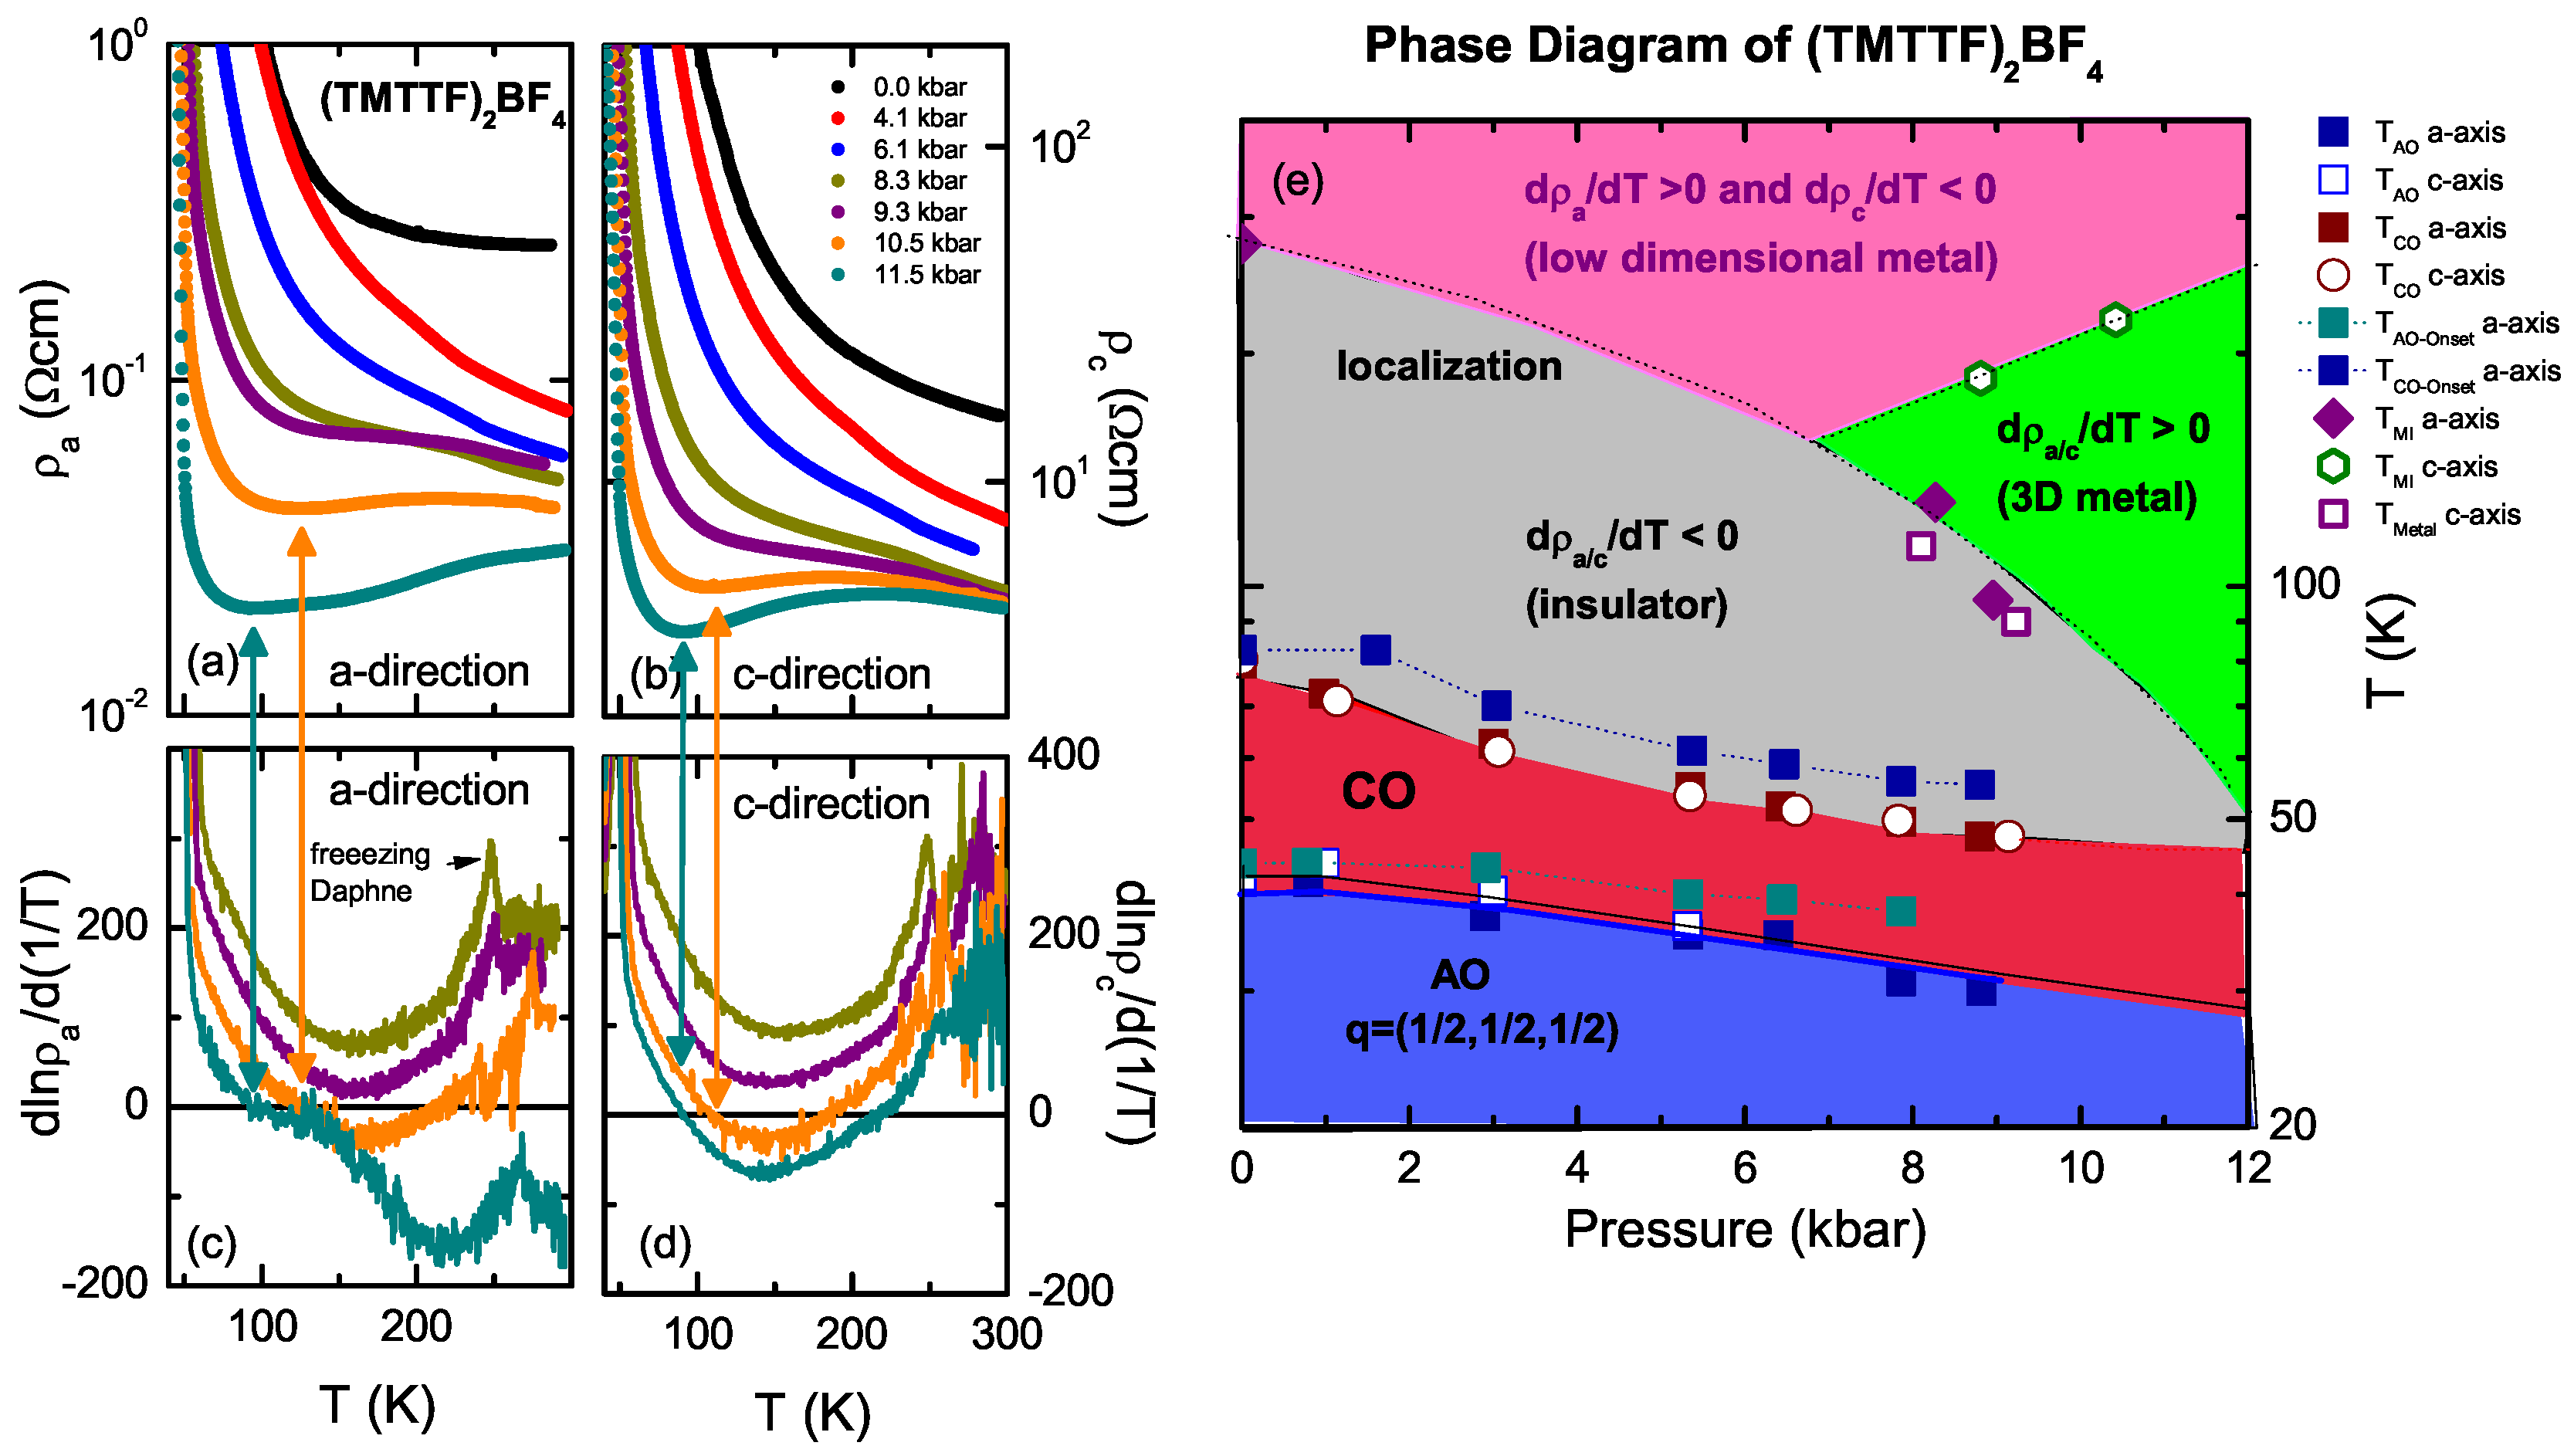
4.2. (TMTTF)BF
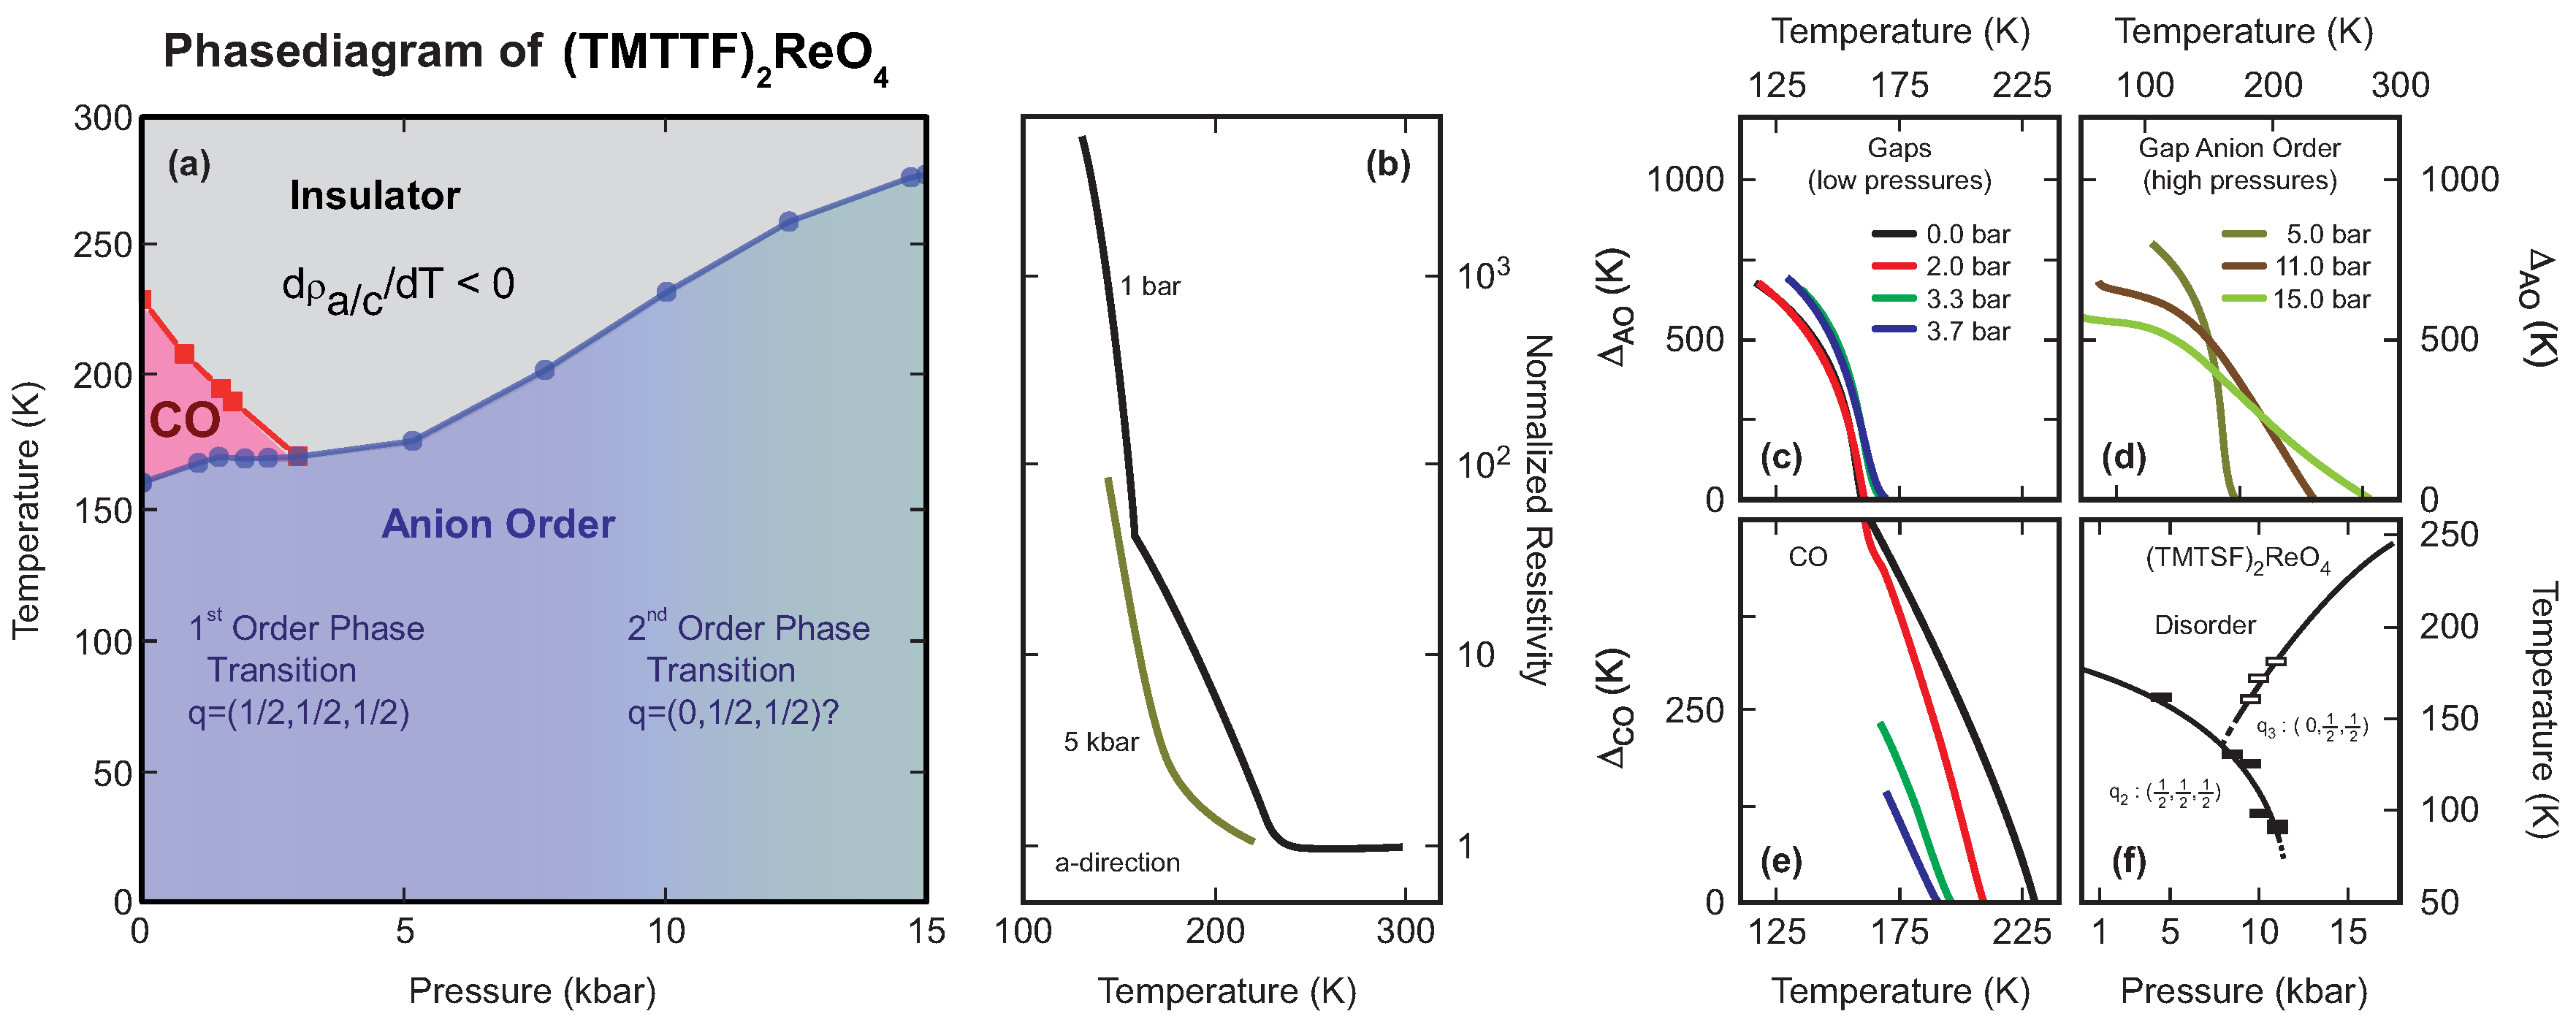
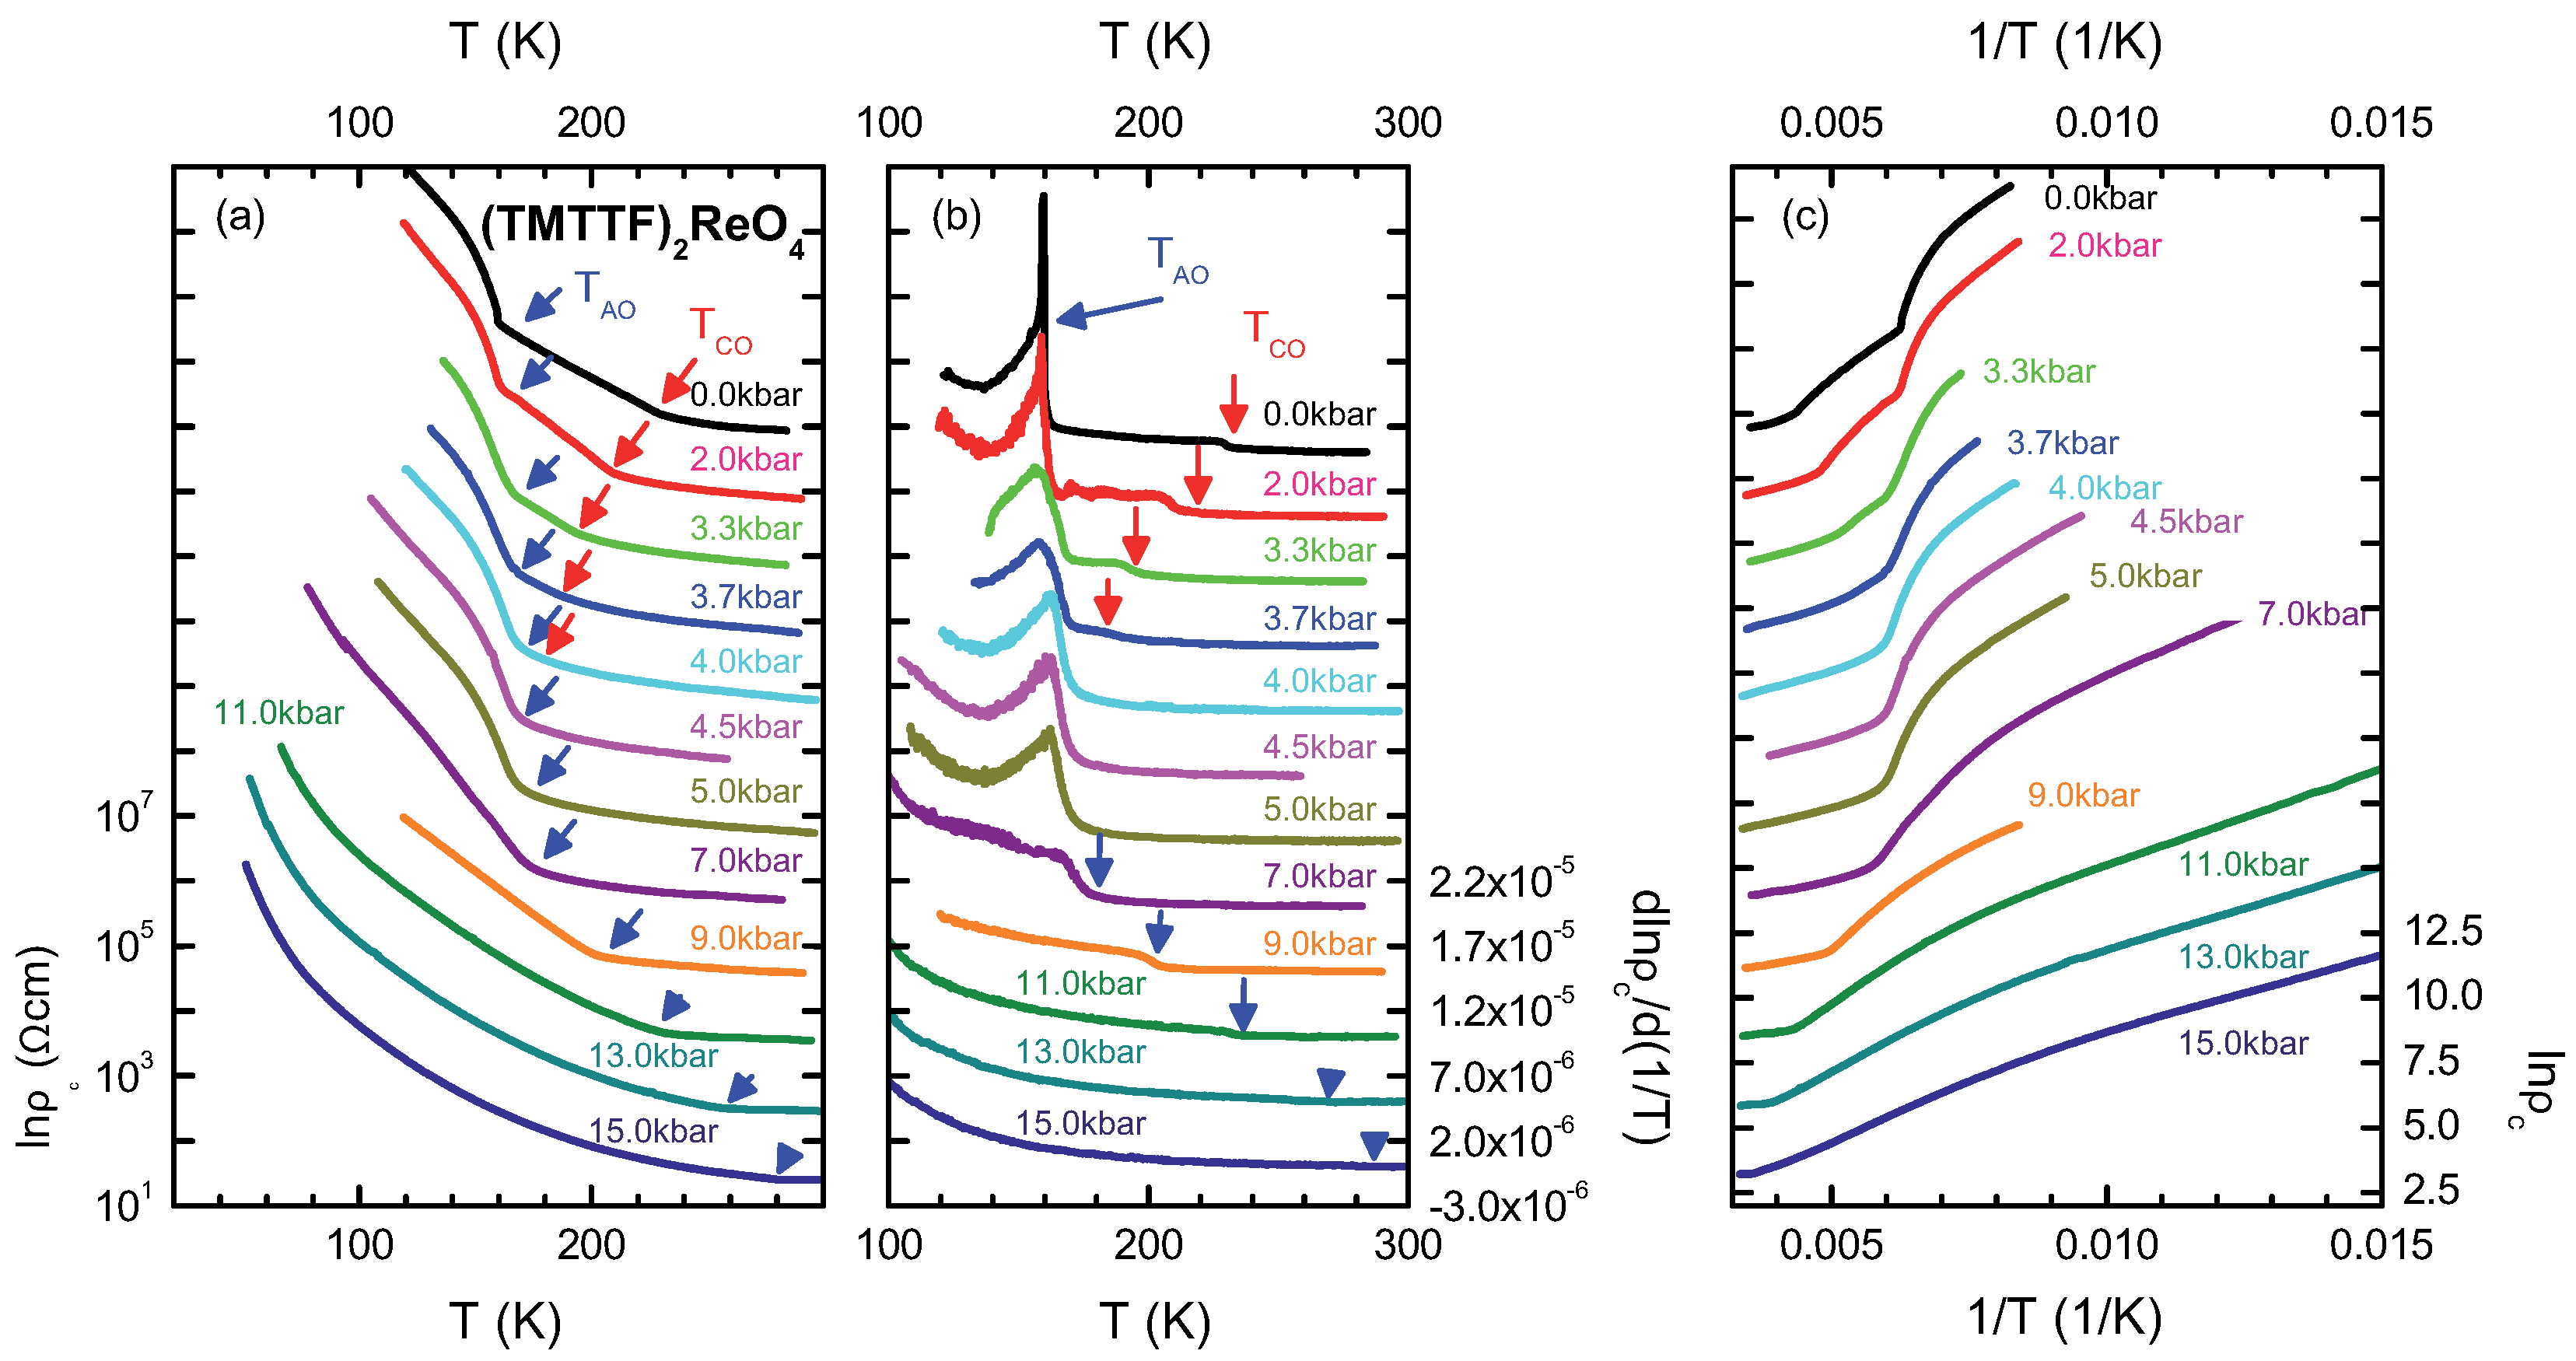
4.3. (TMTTF)ReO
4.4. Discussion
5. Dielectric Spectroscopy
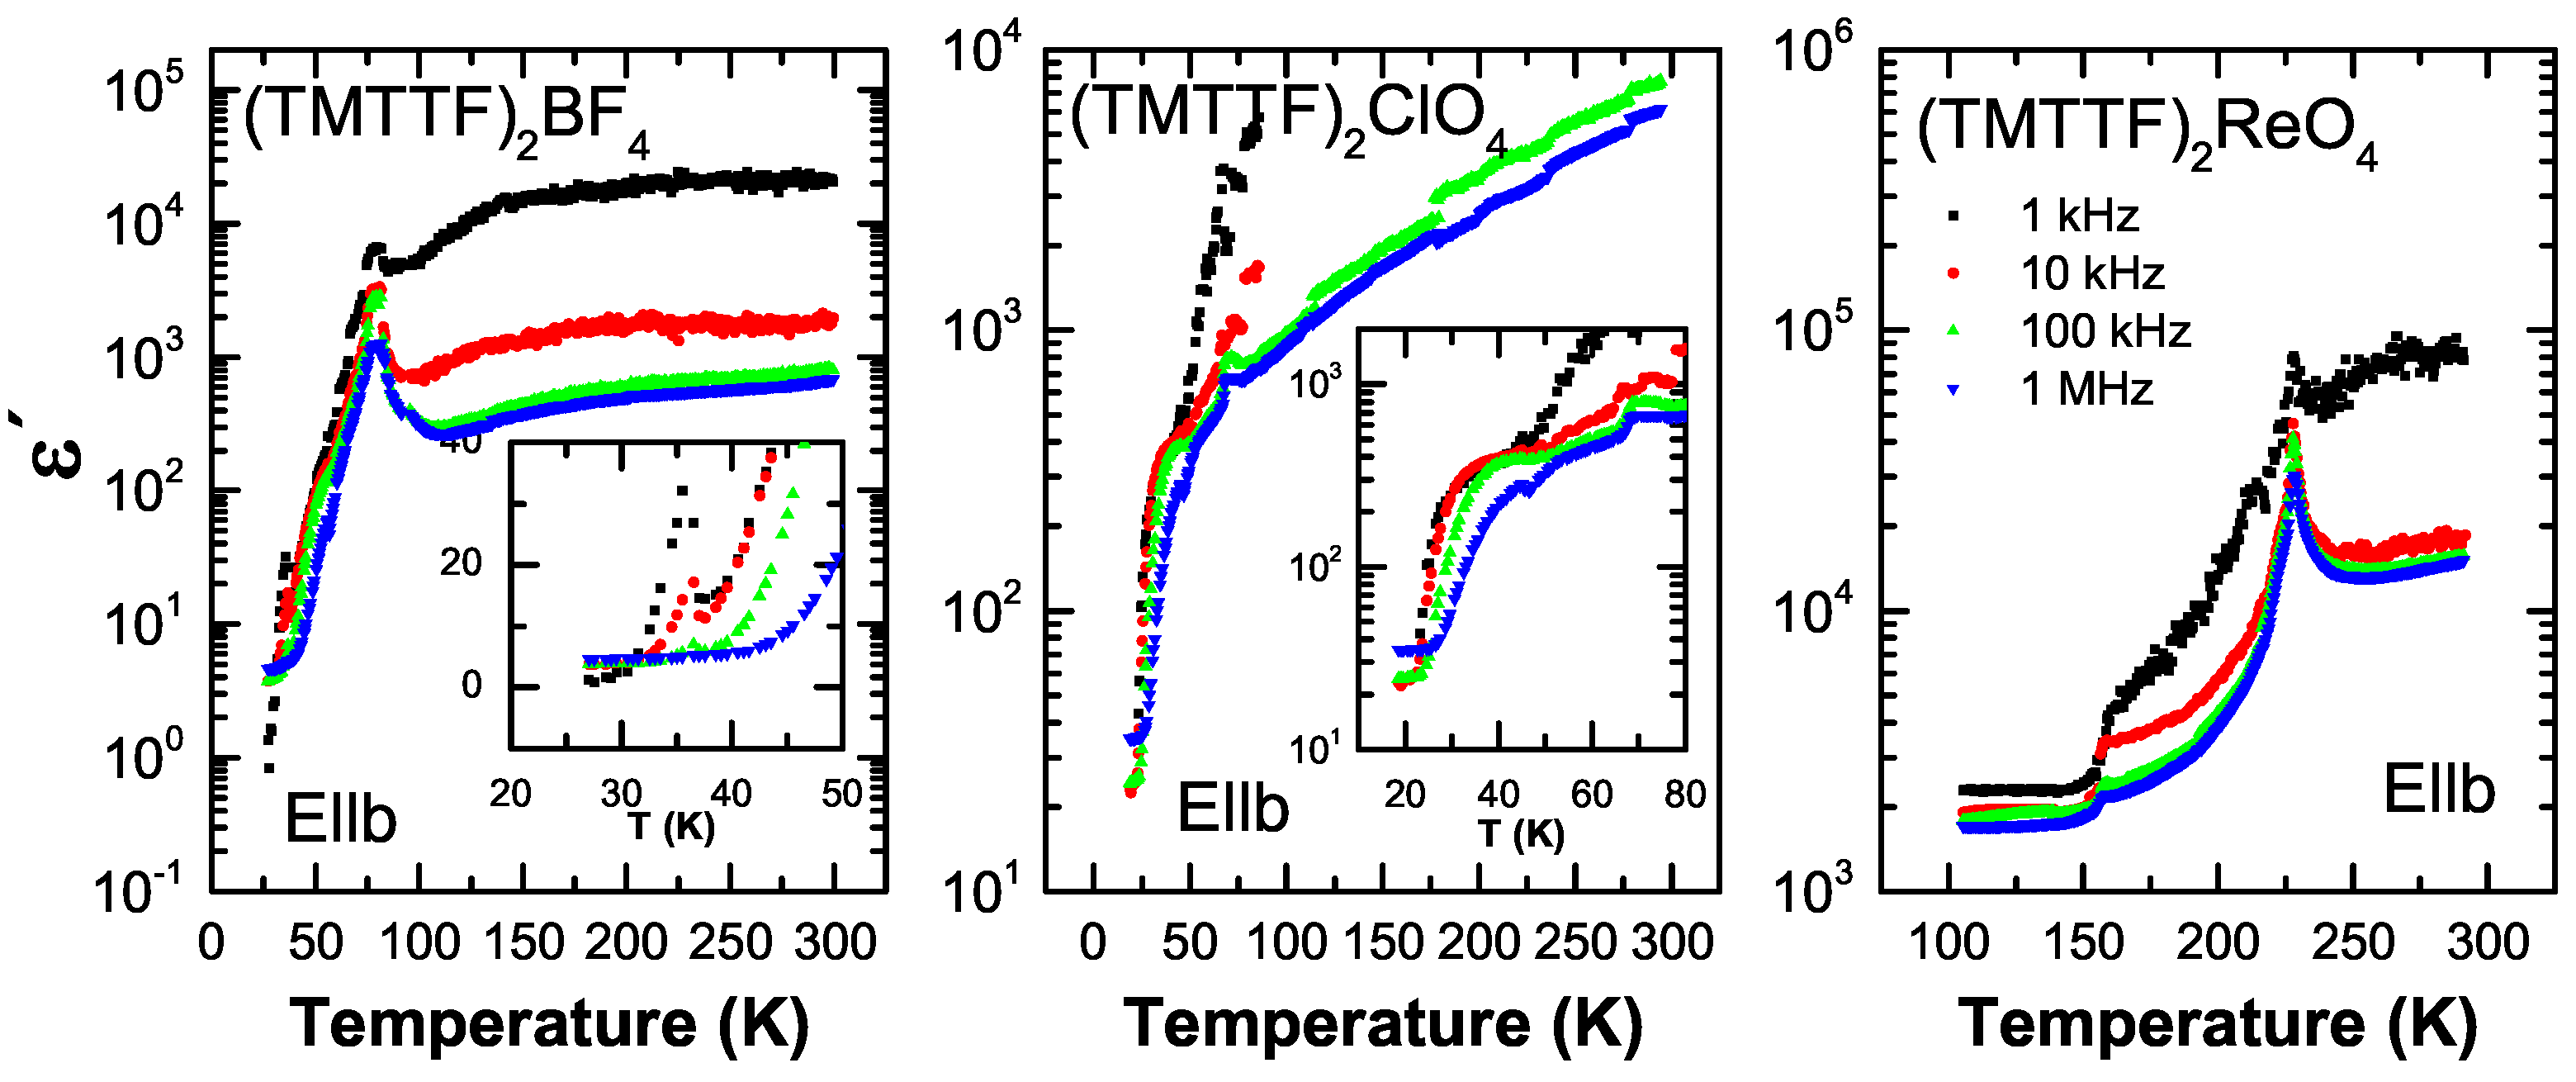
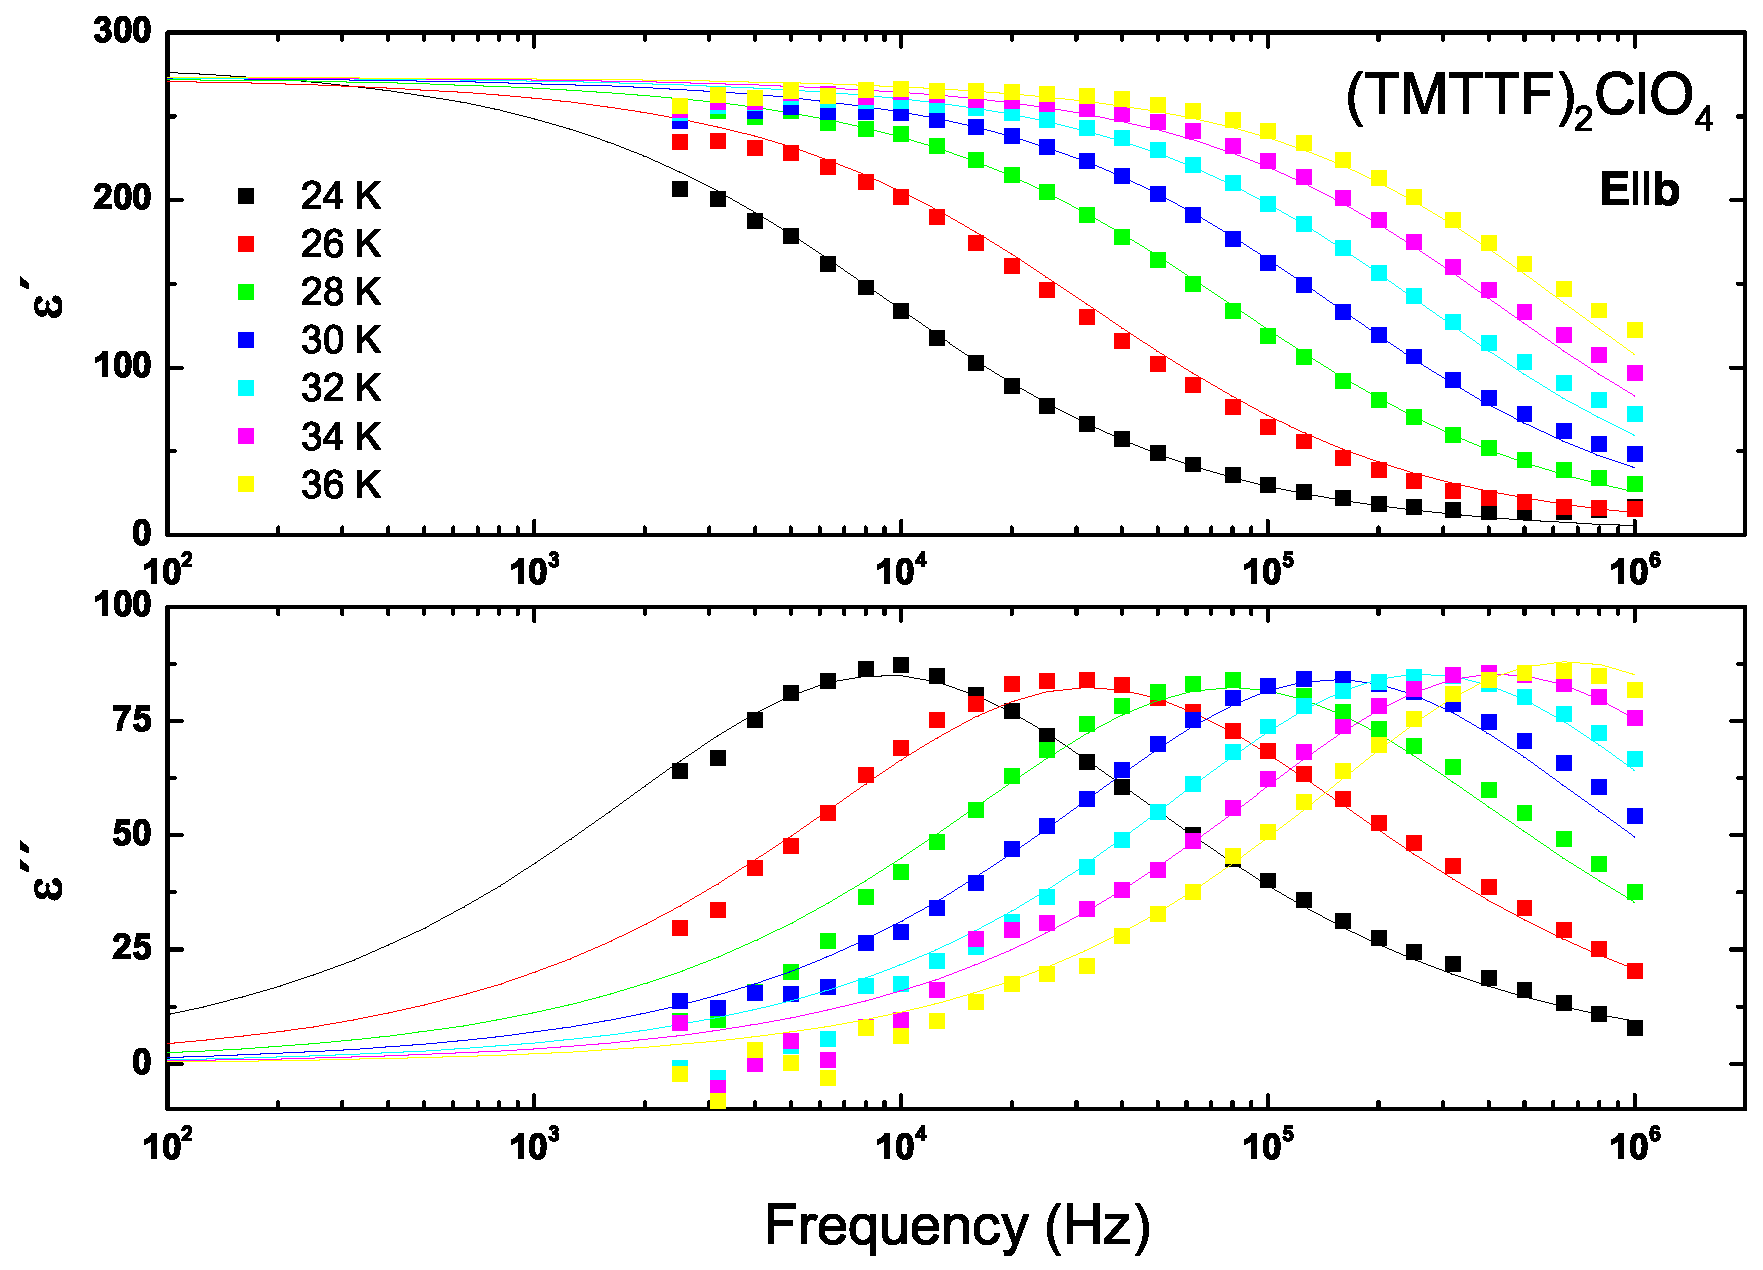
5.1. Results
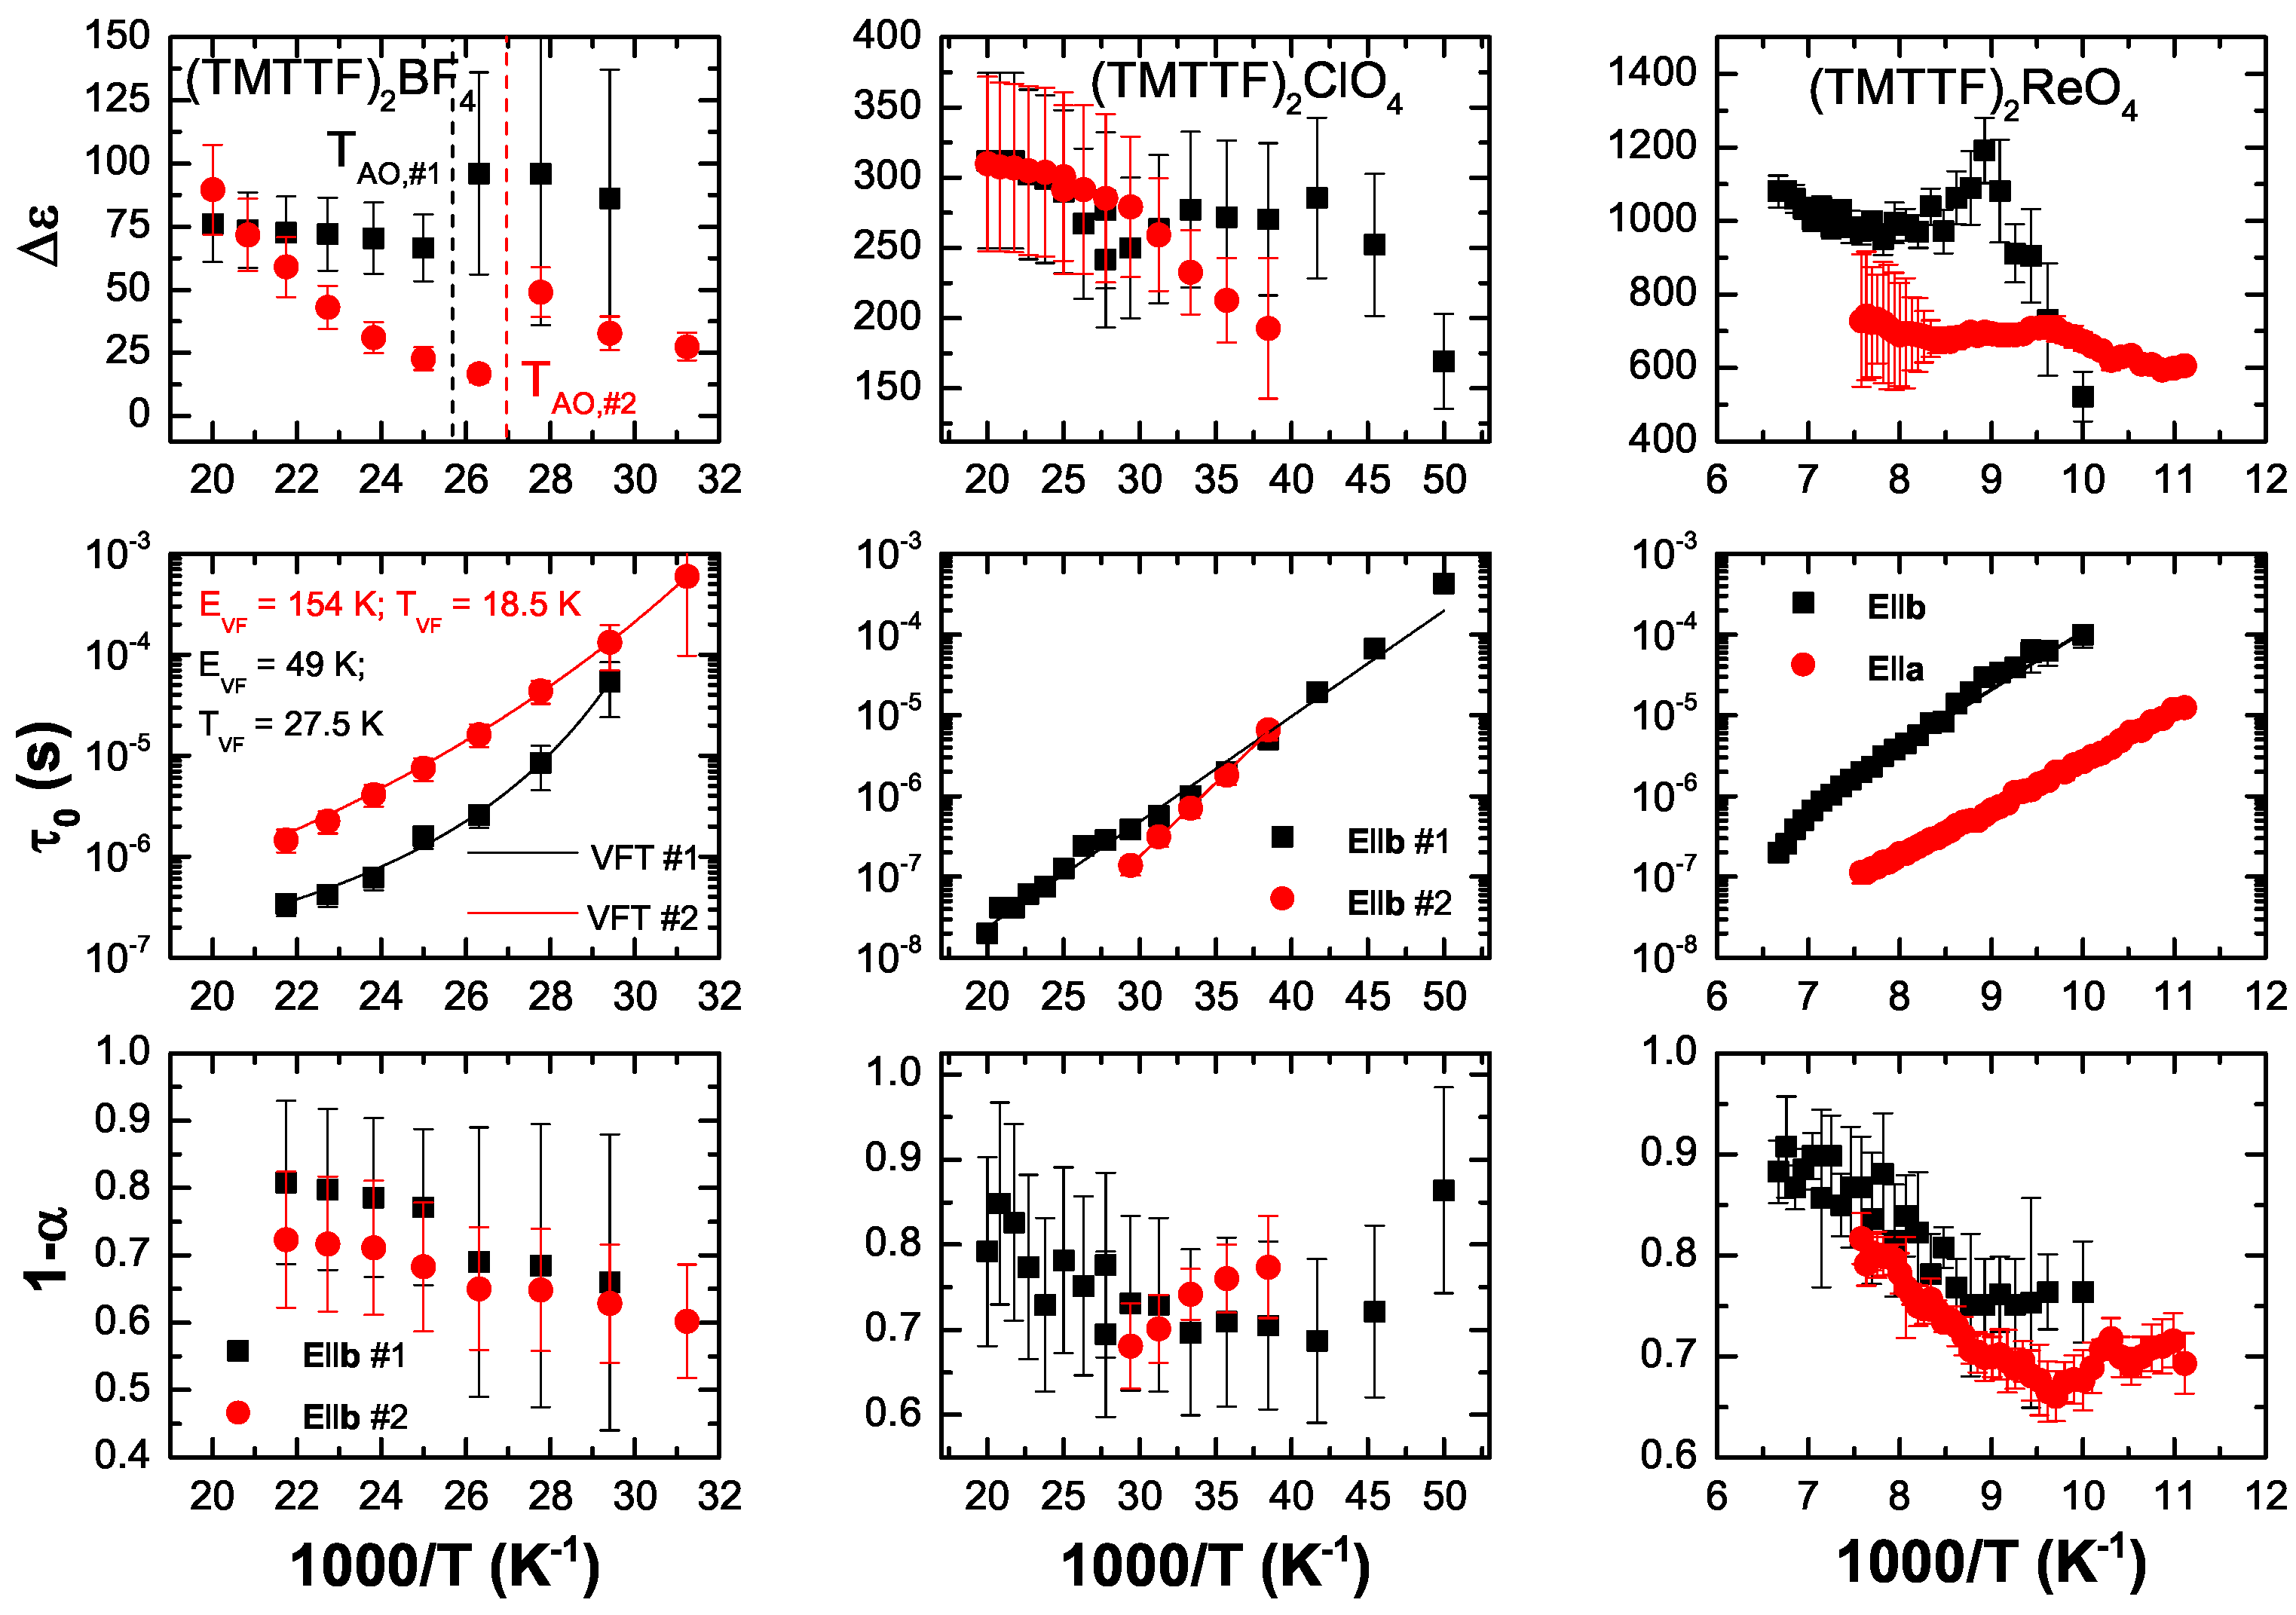
5.2. Analysis
5.3. Discussion
6. Conclusions
Acknowledgments
Author Contributions
Conflicts of Interest
Abbreviations
| TMTTF | tetramethyltetrathiafulvalene |
| TMTSF | tetramethyltetraselenafulvalene |
| CO | charge ordering |
| AO | anion ordering |
| NEXAFS | X-ray absorption near edge structure |
| NMR | nuclear magnetic resonance |
| ESR | electron spin resonance |
| DFT | density functional theory |
References
- Giamarchi, T. Quantum Physics in One Dimension; Clarendon Press: Oxford, UK, 2004. [Google Scholar]
- Dressel, M. Spin-charge separation in quasi one-dimensional organic conductors. Naturwissenschaften 2003, 90, 337–344. [Google Scholar] [CrossRef] [PubMed]
- Dressel, M. Ordering phenomena in quasi-one-dimensional organic conductors. Naturwissenschaften 2007, 94, 527–541. [Google Scholar] [CrossRef] [PubMed]
- Köhler, B.; Rose, E.; Dumm, M.; Untereiner, G.; Dressel, M. Comprehensive transport study of anisotropy and ordering phenomena in quasi-one-dimensional (TMTTF)2X salts (X=PF6,AsF6,SbF6,BF4,ClO4,ReO4). Phys. Rev. B 2011, 84, 035124. [Google Scholar] [CrossRef]
- Dressel, M.; Hesse, P.; Kirchner, S.; Untereiner, G.; Dumm, M.; Hemberger, J.; Loidl, A.; Montgomery, L. Charge and spin dynamics of TMTSF and TMTTF salts. Synth. Met. 2001, 120, 719–720. [Google Scholar] [CrossRef]
- Seo, H.; Hotta, C.; Fukuyama, H. Toward systematic understanding of diversity of electronic properties in low-dimensional molecular solids. Chem. Rev. 2004, 104, 5005–5036. [Google Scholar] [CrossRef] [PubMed]
- Jérome, D. The physics of organic conductors. Science 1991, 252, 1509–1514. [Google Scholar] [CrossRef] [PubMed]
- Granier, T.; Gallois, B.; Ducasse, L.; Fritsch, A.; Filhol, A. 4 K crystallographic and electronic structures of (TMTTF)2X salts (X−: , ). Synth. Met. 1988, 24, 343–356. [Google Scholar] [CrossRef]
- Iwase, F.; Sugiura, K.; Furukawa, K.; Nakamura, T. Electronic properties of a TMTTF-Family Salt, (TMTTF)2 TaF6: New member located on the modified generalized phase-diagram. J. Phys. Soc. Jpn. 2009, 78, 104717. [Google Scholar] [CrossRef]
- Liautard, P.B.; Peytavin, S.; Brun, G.M.M. Etude structurale du nitrate de tétraméthyltétrathiafulvaléne (TMTTF)2NO3. Acta Cryst. B 1982, 38, 2746–2749. [Google Scholar] [CrossRef]
- Kobayashi, H.; Kobayashi, A.; Sasaki, Y.; Saito, G.; Inokuchi, H. The crystal structure of (TMTTF)2ReO4. Bull. Chem. Soc. Jpn. 1984, 2025–2026. [Google Scholar] [CrossRef]
- Galigné, J.L.; Liautard, B.; Peytavin, S.; Brun, G.; Maurin, M.; Fabre, J.M.; Torreilles, E.; Giral, L. Structure cristalline du fluoroborate de tetramethyltetrathiafulvalene (TMTTF)2BF4 a 100 K et a temperature ambiante. Acta Cryst. B 1979, 35, 1129–1135. [Google Scholar] [CrossRef]
- Liautard, P.B.; Peytavin, S.; Brun, G. Structure du di(tétraméthyltétrathiafulvaĺenium)* perchlorate [(TMTTF)2ClO4], 2C10H12.. Acta Cryst. C 1984, 40, 1023–1026. [Google Scholar] [CrossRef]
- Liautard, P.B.; Peytavin, S.; Brun, G.; Maurin, M. Structural correlations in the series (TMTTF)2X. J. Phys. 1982, 43, 1453–1459. [Google Scholar] [CrossRef]
- Nogami, Y.; Ito, T.; Yamamoto, K.; Irie, N.; Horita, S.; Kambe, T.; Nagao, N.; Shima, K.; Ikeda, N.; Nakamura, T. X-ray structural study of charge and anion orderings of TMTTF salts. J. Phys. IV 2005, 131, 39. [Google Scholar] [CrossRef]
- Pouget, J.P.; Ravy, S. Structural aspects of the Bechgaard salts and related Compounds. J. Phys. I 1996, 6, 1501–1525. [Google Scholar] [CrossRef]
- Pouget, J.P. Structural aspects of the Bechgaard and Fabre salts: An update. Crystals 2012, 2, 466–520. [Google Scholar] [CrossRef]
- Rose, E.; Dressel, M. Coupling between molecular chains and anions in (TMTTF)2X salts. Physica B 2012, 407, 1787–1792. [Google Scholar] [CrossRef]
- Kistenmacher, T.J. Anion-donor coupling in (TMTSF)2X salts: Symmetry considerations. Solid State Commun. 1984, 51, 931–934. [Google Scholar] [CrossRef]
- Liautard, P.B.; Peytavin, S.; Brun, G.; Maurin, M. Structural studies and physical properties in the organic conductors series (TMTTF)2X and (TMTSF)2X. J. Phys. 1983, 44, C3-951–C3-956. [Google Scholar] [CrossRef]
- Kistenmacher, T.J. Cavity size versus anion size in (TMTSF)2X salts: Possible implications for the uniqueness of (TMTSF)2ClO4. Solid State Commun. 1984, 50, 729–733. [Google Scholar] [CrossRef]
- Thorup, N.; Rindorf, G.; Soling, H.; Bechgaard, K. The structure of di(2,3,6,7- tetramethyl-1,4,5,8-tetrathiafulvalenium hexafluorophosphate, (TMTSF)2PF6, the first superconducting organic solid. Acta Cryst. B 1981, 37, 1236–1240. [Google Scholar] [CrossRef]
- Pustogow, A.; Peterseim, T.; Kolatschek, S.; Engel, L.; Dressel, M. Electronic correlations versus lattice interactions: Interplay of charge and anion orders in (TMTTF)2X. Phys. Rev. B 2016, 94, 195125. [Google Scholar] [CrossRef]
- Coulon, C.; Delhaes, P.; Flandrois, S.; Lagnier, R.; Bonjour, E.; Fabre, J.M. A new survey of the physical properties of the (TMTTF)2X series. Role of the counterion ordering. J. Phys. 1982, 43, 1059–1067. [Google Scholar] [CrossRef]
- Beno, M.A.; Blackman, G.S.; Leung, P.C.W.; Williams, J.M. Hydrogen bond formation and anion ordering in superconducting (TMTSF)2ClO4 and (TMTSF)2AsF6. Solid State Commun. 1983, 48, 99–103. [Google Scholar] [CrossRef]
- Granier, T.; Gallois, B.; Fritsch, A.; Ducasse, L.; Coulon, C. 135 K crystallographic and electronic structure of (TMTTF)2SbF6. In Lower-Dimensional Systems and Molecular Electronics; Metzger, R.M., Day, P., Papavassiliou, G.C., Eds.; Springer: Boston, MA, USA, 1990; Volume 248, pp. 163–168. [Google Scholar]
- Subías, G.; Abbaz, T.; Fabre, J.M.; Fraxedas, J. Characterization of the anion-ordering transition in (TMTTF)2ReO4 by X-ray absorption and photoemission spectroscopies. Phys. Rev. B 2007, 76, 085103. [Google Scholar] [CrossRef]
- Chow, D.S.; Zamborszky, F.; Alavi, B.; Tantillo, D.J.; Baur, A.; Merlic, C.A.; Brown, S.E. Charge ordering in the TMTTF family of molecular conductors. Phys. Rev. Lett. 2000, 85, 1698–1701. [Google Scholar] [CrossRef] [PubMed]
- Zamborszky, F.; Yu, W.; Raas, W.; Brown, S.E.; Alavi, B.; Merlic, C.A.; Baur, A. Competition and coexistence of bond and charge orders in (TMTTF)2AsF6. Phys. Rev. B 2002, 66, 081103. [Google Scholar] [CrossRef]
- Nad, F.; Monceau, P.; Carcel, C.; Fabre, J.M. Charge ordering phase transition in the quasi-one-dimensional conductor (TMTTF)2AsF6. J. Phys. Condens. Matter 2000, 12, L435–L440. [Google Scholar] [CrossRef]
- Nad, F.; Monceau, P.; Carcel, C.; Fabre, J.M. Dielectric response of the charge-induced correlated state in the quasi-one-dimensional conductor (TMTTF)2PF6. Phy. Rev. B 2000, 62, 1753. [Google Scholar] [CrossRef]
- Nad, F.; Monceau, P.; Carcel, C.; Fabre, J.M. Charge and anion ordering phase transitions in (TMTTF)2X salt conductors. J. Phys. Condens. Matter 2001, 13, L717–L722. [Google Scholar] [CrossRef]
- Monceau, P.; Nad, F.Y.; Brazovskii, S. Ferroelectric Mott-Hubbard phase of organic (TMTTF)2X conductors. Phys. Rev. Lett. 2001, 86, 4080–4083. [Google Scholar] [CrossRef] [PubMed]
- Nagasawa, M.; Nad, F.; Monceau, P.; Fabre, J.M. Modification of the charge ordering transition in the quasi-one-dimensional conductor (TMTTF)2SbF6 under pressure. Solid State Commun. 2005, 136, 262–267. [Google Scholar] [CrossRef]
- Nad, F.; Monceau, P.; Kaboub, L.; Fabre, J.M. Divergence of the relaxation time in the vicinity of the ferroelectric charge-ordered phase transition in (TMTTF)2AsF6. EPL 2006, 73, 567–573. [Google Scholar] [CrossRef]
- Nad, F.; Monceau, P. Dielectric response of the charge ordered state in quasi-one-dimensional organic conductors. J. Phys. Soc. Jpn. 2006, 75, 1–12. [Google Scholar] [CrossRef]
- Hirose, S.; Kawamoto, A.; Matsunaga, N.; Nomura, K.; Yamamoto, K.; Yakushi, K. Reexamination of 13C-NMR in (TMTTF)2AsF6: Comparison with infrared spectroscopy. Phys. Rev. B 2010, 81, 205107. [Google Scholar] [CrossRef]
- Dressel, M.; Dumm, M.; Knoblauch, T.; Masino, M. Comprehensive optical investigations of charge order in organic chain compounds (TMTTF)2X. Crystals 2012, 2, 528–578. [Google Scholar] [CrossRef]
- Kitou, S.; Fujii, T.; Kawamoto, T.; Katayama, N.; Maki, S.; Nishibori, E.; Sugimoto, K.; Takata, M.; Nakamura, T.; Sawa, H. Successive dimensional transition in (TMTTF)2PF6 revealed by synchrotron X-ray diffraction. Phys. Rev. Lett. 2017, 119, 065701. [Google Scholar] [CrossRef] [PubMed]
- Nogami, Y.; Nakamura, T. X-ray observation of 2kF and 4kF charge orderings in(TMTTF)2ReO4 and (TMTTF)2SCN associated with anion orderings. J. Phys. IV 2002, 12, 145–148. [Google Scholar]
- Coulon, C.; Parkin, S.S.P.; Laversanne, R. Structureless transition and strong localization effects in bis-tetramethyltetrathiafulvalenium salts [(TMTTF)2X]. Phys. Rev. B 1985, 31, 3583–3587. [Google Scholar] [CrossRef]
- Yu, W.; Zhang, F.; Zamborszky, F.; Alavi, B.; Baur, A.; Merlic, C.A.; Brown, S.E. Electron-lattice coupling and broken symmetries of the molecular salt (TMTTF)2SbF6. Phys. Rev. B 2004, 70, 121101. [Google Scholar] [CrossRef]
- De Souza, M.; Foury-Leylekian, P.; Moradpour, A.; Pouget, J.P.; Lang, M. Evidence for lattice effects at the charge-ordering transition in (TMTTF)2X. Phys. Rev. Lett. 2008, 101, 19–22. [Google Scholar] [CrossRef] [PubMed]
- De Souza, M.; Pouget, J.P. Charge-ordering transition in (TMTTF)2X explored via dilatometry. J. Phys. Condens. Matter 2013, 25, 343201. [Google Scholar] [CrossRef] [PubMed]
- Foury-Leylekian, P.; Petit, S.; Andre, G.; Moradpour, A.; Pouget, J.P. Neutron scattering evidence for a lattice displacement at the charge ordering transition of (TMTTF)2PF6. Physica B 2010, 405, 95–97. [Google Scholar] [CrossRef]
- Dumm, M.; Abaker, M.; Dressel, M. Mid-infrared response of charge-ordered quasi-1D organic conductors (TMTTF)2X. J. Phys. IV (France) 2005, 131, 55–58. [Google Scholar] [CrossRef]
- Dumm, M.; Abaker, M.; Dressel, M.; Montgomery, L.K. Charge Order in (TMTTF)2PF6 Investigated by Infrared Spectroscopy. J. Low Temp. Phys. 2006, 142, 613–616. [Google Scholar] [CrossRef]
- Medjanik, K.; Chernenkaya, A.; Nepijko, S.A.; Ohrwall, G.; Foury-Leylekian, P.; Alemany, P.; Canadell, E.; Schonhense, G.; Pouget, J.P. Donor-anion interactions at the charge localization and charge ordering transitions of (TMTTF)2AsF6 probed by NEXAFS. Phys. Chem. Chem. Phys. 2015, 17, 19202–19214. [Google Scholar] [CrossRef] [PubMed]
- Rose, E.; Loose, C.; Kortus, J.; Pashkin, A.; Kuntscher, C.A.; Ebbinghaus, S.G.; Hanfland, M.; Lissner, F.; Schleid, T.; Dressel, M. Pressure-dependent structural and electronic properties of quasi-one-dimensional (TMTTF) 2 PF 6. J. Phys. Condens. Matter 2013, 25, 014006. [Google Scholar] [CrossRef] [PubMed]
- Jacko, A.C.; Feldner, H.; Rose, E.; Lissner, F.; Dressel, M.; Valentí, R.; Jeschke, H.O. Electronic properties of Fabre charge-transfer salts under various temperature and pressure conditions. Phys. Rev. B 2013, 87, 155139. [Google Scholar] [CrossRef]
- Roobottom, H.K.; Jenkins, H.D.B.; Passmore, J.; Glasser, L. Thermochemical radii of complex ions. J. Chem. Ed. 1999, 76, 1570–1573. [Google Scholar] [CrossRef]
- Kaabel, S.; Adamson, J.; Topic, F.; Kiesila, A.; Kalenius, E.; Oeren, M.; Reimund, M.; Prigorchenko, E.; Lookene, A.; Reich, H.J.; et al. Chiral hemicucurbit[8]uril as an anion receptor: Selectivity to size, shape and charge distribution. Chem. Sci. 2017, 8, 2184–2190. [Google Scholar] [CrossRef] [PubMed]
- Oka, Y.; Matsunaga, N.; Nomura, K.; Kawamoto, A.; Yamamoto, K.; Yakushi, K. Charge order in (TMTTF)2TaF6 by infrared spectroscopy. J. Phys. Soc. Jpn. 2015, 84, 114709. [Google Scholar] [CrossRef]
- Nakamura, T.; Furukawa, K.; Hara, T. 13C NMR analyses of successive charge ordering in (TMTTF)2ReO4. J. Phys. Soc. Jpn. 2006, 75, 013707. [Google Scholar] [CrossRef]
- Matsunaga, N.; Hirose, S.; Shimohara, N.; Satoh, T.; Isome, T.; Yamomoto, M.; Liu, Y.; Kawamoto, A.; Nomura, K. Charge ordering and antiferromagnetism in (TMTTF)2SbF6. Phys. Rev. B 2013, 87, 144415. [Google Scholar] [CrossRef]
- Świetlik, R.; Barszcz, B.; Pustogow, A.; Dressel, M. Raman spectroscopy evidence of domain walls in the organic electronic ferroelectrics (TMTTF)2X (X = SbF6, AsF6, PF6). Phys. Rev. B 2017, 95, 085205. [Google Scholar] [CrossRef]
- Pouget, J.P.; Moret, R.; Comes, R.; Bechgaard, K.; Fabre, J.M.; Giral, L. X-Ray diffuse-scattering study of some (TMTSF)2X and (TMTTF)2X salts. Mol. Cryst. Liq. Cryst. 1982, 79, 129–143. [Google Scholar] [CrossRef]
- Nad, F.Y.; Monceau, P.; Carcel, C.; Fabre, J.M. Charge odering in (TMTTF)2X salts. Synth. Met. 2003, 133, 265–267. [Google Scholar] [CrossRef]
- Pouget, J.P.; Moret, R.; Comes, R.; Bechgaard, K. X-Ray diffuse scattering study of superstructure formation in tetramethyltetraselenafulvalenium perrhenate (TMTSF)2ReO4 and nitrate (TMTSF)2NO3. J. Phys. Lett. 1981, 42. [Google Scholar] [CrossRef]
- Moret, R.; Pouget, J.P.; Comès, R.; Bechgaard, K. X-Ray scattering evidence for anion ordering and structural distortions in the low-temperature phase of di(tetramethyltetraselanafulvalenium) perrhenate [(TMTSF)2ReO4]. Phys. Rev. Lett. 1982, 49, 1008–1012. [Google Scholar] [CrossRef]
- Pouget, J.P.; Shirane, G.; Bechgaard, K.; Fabre, J.M. X-ray evidence of a structural phase transition in di-tetramethyltetraselenafulvalenium perchlorate [(TMTSF)2ClO4], pristine and slightly doped. Phys. Rev. B 1983, 27, 5203–5206. [Google Scholar] [CrossRef]
- Moret, R.; Ravy, S.; Pouget, J.P.; Comes, R.; Bechgaard, K. Anion-ordering phase diagram of di(tetramethyltetraselenafulvalenium) perrhenate, [(TMTSF)2ReO4]. Phys. Rev. Lett. 1986, 57, 1915–1918. [Google Scholar] [CrossRef] [PubMed]
- Coulon, C.; Delhaes, P.; Amiell, J.; Manceau, J.P.; Fabre, J.M.; Giral, L. Effect of doping (TMTSF)2ClO4 with TMTTF - I. Ambient pressure results : A competition between the different possible ground states. J. Phys. 1982, 43, 1721–1729. [Google Scholar] [CrossRef]
- Ilakovac, V.; Ravy, S.; Pouget, J.P.; Lenoir, C.; Boubekeur, K.; Batail, P.; Babic, S.D.; Biskup, N.; Korin-Hamzic, B.; Tomic, S.; et al. Enhanced charge localization in the organic alloys [(TMTSF)1-x(TMTTF)x]2ReO4. Phys. Rev. B 1994, 50, 7136–7139. [Google Scholar] [CrossRef]
- Tomic, S.; Auban-Senzier, P.; Jérome, D. Charge localization in [(TMTTF)0.5(TMTSF)0.5]2ReO4: A pressure study. Synth. Met. 1999, 103, 2197–2198. [Google Scholar] [CrossRef]
- Tomić, S.; Jérome, D.; Monod, P.; Bechgaard, K. EPR and electrical conductivity of the organic superconductor di-tetramethyltetraselenafulvalenium-perchlorate, (TMTSF)2ClO4 and a metastable magnetic state obtained by fast cooling. J. Phys. Lett. 1982, 43, 839–844. [Google Scholar] [CrossRef]
- Takahashi, T.; Jérome, D.; Bechgaard, K. Observation of a magnetic state in the organic superconductor (TMTSF)2ClO4: Influence of the cooling rate. J. Phys. Lett. 1982, 43, 565–573. [Google Scholar] [CrossRef]
- Ishiguro, T.; Murata, K.; Kajimura, K.; Kinoshita, N.; Tokumoto, H.; Tokumoto, M.; Ukachi, T.; Anzai, H.; Saito, G. Superconductivity and metal-nonmetal transitions in (TMTSF)2ClO4. J. Phys. Coll. 1983, 44, C3-831–C3-838. [Google Scholar] [CrossRef]
- Yonezawa, S.; Marrache-Kikuchi, C.A.; Bechgaard, K.; Jérome, D. Crossover from impurity-controlled to granular superconductivity in (TMTSF)2ClO4. Phys. Rev. B 2018, 97, 014521. [Google Scholar] [CrossRef]
- Parkin, S.S.P.; Mayerle, J.J.; Engler, E.M. Anion ordering in (TMTTF)2ReO4: A displacive transition. J. Phys. Colloq. 1983, 44, C3-1105. [Google Scholar] [CrossRef]
- Dumm, M.; Loidl, A.; Fravel, B.W.; Starkey, K.P.; Montgomery, L.K.; Dressel, M. Electron spin resonance studies on the organic linear-chain compounds (TMTCF)2X(C = S, Se; X = PF6, AsF6, ClO4, Br). Phys. Rev. B 2000, 61, 511–521. [Google Scholar] [CrossRef]
- Salameh, B.; Yasin, S.; Dumm, M.; Untereiner, G.; Montgomery, L.; Dressel, M. Spin dynamics of the organic linear chain compounds (TMTTF)2X (X=SbF6, AsF6, BF4, ReO4, and SCN). Phys. Rev. B 2011, 83, 205126. [Google Scholar] [CrossRef]
- Coulon, C.; Foury-Leylekian, P.; Fabre, J.M.; Pouget, J.P. Electronic instabilities and irradiation effects in the (TMTTF)2X series. Eur. Phys. J. B 2015, 88, 85. [Google Scholar] [CrossRef]
- Rohwer, A.; Dumm, M. Vibrational studies on TMTTF salts with non-centrosymmetric anions. To be published.
- Nad, F.; Monceau, P.; Nakamura, T.; Furukawa, K. The effect of deuteration on the transition into a charge ordered state of (TMTTF)2X salts. J. Phys. Condens. Matter 2005, 17, L399. [Google Scholar] [CrossRef]
- Furukawa, K.; Hara, T.; Nakamura, T. Deuteration effect and possible origin of the charge-ordering transition of (TMTTF)2X. J. Phys. Soc. Jpn. 2005, 74, 3288–3294. [Google Scholar] [CrossRef]
- Pouget, J.P.; Foury-Leylekian, P.; Le Bolloc’h, D.; Hennion, B.; Ravy, S.; Coulon, C.; Cardoso, V.; Moradpour, A. Neutron-scattering evidence for a spin-Peierls ground state in (TMTTF)2PF6. J. Low Temp. Phys. 2006, 142, 147–152. [Google Scholar] [CrossRef]
- Jérome, D.; Schulz, H. Organic conductors and superconductors. Adv. Phys. 1982, 31, 299–490. [Google Scholar] [CrossRef]
- Ishiguro, T.; Yamaji, K.; Saito, G. Organic Superconductors, 2nd ed.; Springer: Berlin, Germany, 1998. [Google Scholar]
- Kagoshima, S.; Nagasawa, H.; Sambongi, T. One-Dimensional Conductors; Springer: Berlin, Germany, 1988. [Google Scholar]
- Lebed, A. (Ed.) The Physics of Organic Superconductors and Conductors; Springer: Berlin, Germany, 2008. [Google Scholar]
- Dumm, M.; Dressel, M.; Loidl, A.; Frawel, B.; Starkey, K.; Montgomery, L. Magnetic studies of (TMTTF)2X (X=PF6, ClO4, and Br). Synth. Met. 1999, 103, 2068–2069. [Google Scholar] [CrossRef]
- Dumm, M.; Dressel, M.; Loidl, A.; Fravel, B.; Montgomery, L. Spin dynamics of organic linear chain compounds. Physica B 1999, 259–261, 1005–1006. [Google Scholar] [CrossRef]
- Lunkenheimer, P.; Loidl, A. Dielectric spectroscopy on organic charge-transfer salts. J. Phys. Condens. Matter 2015, 27, 373001. [Google Scholar] [CrossRef] [PubMed]
- Tomić, S.; Dressel, M. Ferroelectricity in molecular solids: A review of electrodynamic properties. Rep. Prog. Phys. 2015, 78, 096501. [Google Scholar] [CrossRef] [PubMed]
- Starešinić, D.; Biljaković, K.; Lunkenheimer, P.; Loidl, A. Slowing down of the relaxational dynamics at the ferroelectric phase transition in one-dimensional (TMTTF)2AsF6. Solid State Commun. 2006, 137, 241–245. [Google Scholar] [CrossRef]
- Brazovskii, S. Theory of the ferroelectric Mott-Hubbard phase in organic conductors. J. Phys. IV 2002, 12, 149–152. [Google Scholar] [CrossRef]
- Brazovskii, S. Ferroelectricity and charge-ordering in quasi-1d organic conductors. In The Physics of Organic Superconductors and Conductors; Lebed, A., Ed.; Springer: Berlin, Germany, 2008. [Google Scholar]
- Brazovskii, S.; Monceau, P.; Nad, F.Y. Critical dynamics and domain motion from permittivity of the electronic ferroelectric (TMTTF)2AsF6. Physica B 2015, 460, 79–82. [Google Scholar] [CrossRef]
- Giovannetti, G.; Nourafkan, R.; Kotliar, G.; Capone, M. Correlation-driven electronic multiferroicity in (TMTTF)2X organic crystals. Phys. Rev. B 2015, 91, 125130. [Google Scholar] [CrossRef]
- Brazovskii, S.; Monceau, P.; Nad, F. The ferroelectric Mott-Hubbard phase in organic conductors. Synth. Met. 2003, 137, 1331–1333. [Google Scholar] [CrossRef]
- Brazovskii, S. The theory for the ferroelectric Mott–Hubbard phase in organic conductors. Synth. Met. 2003, 133–134, 301–303. [Google Scholar] [CrossRef]
- Brazovskii, S. Theory of the ferroelectric phase in organic conductors: From physics of solitons to optics. J. Phys. IV 2004, 114, 9–13. [Google Scholar] [CrossRef]
- Lines, M.E.; Glass, A.M. Principles and Applications of Ferroelectrics and Related Materials; Clarendon Press: Oxford, UK, 1977. [Google Scholar]
- Blinc, R. The soft mode concept and the history of ferroelectricity. Ferroelectrics 1987, 74, 301–303. [Google Scholar] [CrossRef]
- De Souza, M.; Squillante, L.; Sônego, C.; Menegasso, P.; Foury-Leylekian, P.; Pouget, J.P. Probing the ionic dielectric constant contribution in the ferroelectric phase of the Fabre salts. Phys. Rev. B 2018, 97, 045122. [Google Scholar] [CrossRef]
- Dressel, M.; Grüner, G. Electrodynamics of Solids; Cambridge University Press: Cambridge, UK, 2002. [Google Scholar]
- Pinterić, M.; Ivek, T.; Čulo, M.; Milat, O.; Basletić, M.; Korin-Hamzić, B.; Tafra, E.; Hamzić, A.; Dressel, M.; Tomić, S. What is the origin of anomalous dielectric response in 2D organic dimer Mott insulators κ-(BEDT-TTF)2Cu[N(CN)2]Cl and κ-(BEDT-TTF)2Cu2(CN)3. Physica B 2015, 460, 202–207. [Google Scholar] [CrossRef]
- Pinterić, M.; Čulo, M.; Milat, O.; Basletić, M.; Korin-Hamzić, B.; Tafra, E.; Hamzić, A.; Ivek, T.; Peterseim, T.; Miyagawa, K.; et al. Anisotropic charge dynamics in the quantum spin-liquid candidate κ-(BEDT-TTF)2Cu2(CN)3. Phys. Rev. B 2014, 90, 195139. [Google Scholar] [CrossRef]
- Dressel, M.; Lazić, P.; Pustogow, A.; Zhukova, E.; Gorshunov, B.; Schlueter, J.A.; Milat, O.; Gumhalter, B.; Tomić, S. Lattice vibrations of the charge-transfer salt κ-(BEDT-TTF2Cu2(CN)3: Comprehensive explanation of the electrodynamic response in a spin-liquid compound. Phys. Rev. B 2016, 93, 081201. [Google Scholar] [CrossRef]
- Pinterić, M.; Lazić, P.; Pustogow, A.; Ivek, T.; Kuveždić, M.; Milat, O.; Gumhalter, B.; Basletić, M.; Čulo, M.; Korin-Hamzić, B.; Löhle, A.; et al. Anion effects on electronic structure and electrodynamic properties of the Mott insulator κ-(BEDT-TTF)2Ag2(CN)3. Phys. Rev. B 2016, 94, 161105. [Google Scholar] [CrossRef]
- Ivek, T.; Korin-Hamzić, B.; Milat, O.; Tomić, S.; Clauss, C.; Drichko, N.; Schweitzer, D.; Dressel, M. Collective excitations in the charge-ordered phase of α-(BEDT-TTF)2I3. Phys. Rev. Lett. 2010, 104, 206406. [Google Scholar] [CrossRef] [PubMed]
- Ivek, T.; Korin-Hamzić, B.; Milat, O.; Tomić, S.; Clauss, C.; Drichko, N.; Schweitzer, D.; Dressel, M. Electrodynamic response of the charge ordering phase: Dielectric and optical studies of α-(BEDT-TTF)2I3. Phys. Rev. B 2011, 83, 165128. [Google Scholar] [CrossRef]
- Voloshenko, I.; Herter, M.; Beyer, R.; Pustogow, A.; Dressel, M. Pressure-dependent optical investigations of Fabre salts in the charge-ordered state. J. Phys. Condens. Matter 2017, 29, 115601. [Google Scholar] [CrossRef] [PubMed]
Sample Availability: Samples of the (TMTTF) compounds are available from the authors. |


| Anion X | PF | AsF | SbF | TaF | BF | ClO | ReO |
|---|---|---|---|---|---|---|---|
| (K) | 67 | 102 | 157 | 175 | 84 | - | 230 |
| (K) | - | - | - | - | 41.5 | 73.4 | 157 |
| (Å) | 3.30 | 3.27 | 3.21 | 3.215 | 3.28 | 3.45 | 3.05 |
| (Å) | 3.621 | 3.632 | 3.642 | 3.642 | 3.56 | 3.60 | 3.59 |
| (Å) | 3.527 | 3.524 | 3.526 | 3.534 | 3.54 | 3.51 | 3.57 |
| (10) | 1.32 | 1.51 | 1.62 | 1.51 | 0.28 | 1.27 | 0.28 |
| 0.040 | 0.041 | 0.041 | - | 0.028 | 0.04 | - | |
| 0.230 | 0.110 | 0.298 | - | 0.336 | 0.616 | - | |
| (Å) | 676.6 | 697.7 | 702.9 | 706.52 | 648.5 | 654.8 | 679.5 |
| (pm) | 242 | 243 | 252 | 250 | 205 | 225 | 227 |
| (Å) | 70.6 | - | 81.8 | - | 51.6 | 54.7 | 64.8 |
| (au) | 144.96 | 188.91 | 235.75 | 294.94 | 86.80 | 99.45 | 250.21 |
| (TMTTF)BF | Sample 1 | Sample 2 |
|---|---|---|
| (K) | 49 ± 7 | 153.5 ± 11.5 |
| (K) | 27.5 ± 0.5 | 18.5 ± 0.5 |
| (s) | (2.5 ± 1.2) | (6.1 ± 2.5) |
| (K) | 30 | 25 |
| (TMTTF)ClO | Sample 1 | Sample 2 |
|---|---|---|
| (K) | 300 ± 10 | 420 ± 8 |
| (s) | (5.7 ± 1.9) | (6.0 ± 1.7) |
| (TMTTF)ReO | ||
|---|---|---|
| (K) | 1372 ± 4 | 1651± 27 |
| (s) | (3.1 ± 0.1) | (7.3 ± 1.6) |
© 2018 by the authors. Licensee MDPI, Basel, Switzerland. This article is an open access article distributed under the terms and conditions of the Creative Commons Attribution (CC BY) license (http://creativecommons.org/licenses/by/4.0/).
Share and Cite
Rösslhuber, R.; Rose, E.; Ivek, T.; Pustogow, A.; Breier, T.; Geiger, M.; Schrem, K.; Untereiner, G.; Dressel, M. Structural and Electronic Properties of (TMTTF)2X Salts with Tetrahedral Anions. Crystals 2018, 8, 121. https://doi.org/10.3390/cryst8030121
Rösslhuber R, Rose E, Ivek T, Pustogow A, Breier T, Geiger M, Schrem K, Untereiner G, Dressel M. Structural and Electronic Properties of (TMTTF)2X Salts with Tetrahedral Anions. Crystals. 2018; 8(3):121. https://doi.org/10.3390/cryst8030121
Chicago/Turabian StyleRösslhuber, Roland, Eva Rose, Tomislav Ivek, Andrej Pustogow, Thomas Breier, Michael Geiger, Karl Schrem, Gabriele Untereiner, and Martin Dressel. 2018. "Structural and Electronic Properties of (TMTTF)2X Salts with Tetrahedral Anions" Crystals 8, no. 3: 121. https://doi.org/10.3390/cryst8030121