Experimental Electron Density Distribution in Two Cocrystals of Betaines with p-Hydroxybenzoic Acid


Department of Chemistry, Adam Mickiewicz University, Umultowska 89b, 61-614 Poznań, Poland
*
Author to whom correspondence should be addressed.
Crystals 2018, 8(3), 132; https://doi.org/10.3390/cryst8030132
Submission received: 8 February 2018
/
Revised: 5 March 2018
/
Accepted: 8 March 2018
/
Published: 10 March 2018
(This article belongs to the Special Issue Experimental and Theoretical Electron Density Analysis of Crystals)
Abstract
:Experimental determination of electron density distribution in crystals by means of high-resolution X-ray diffraction allows, among others, for studying the details of intra- and inter-molecular interactions. In case of co-crystals, this method may help in finding the conditions of creating such species. The results of such analysis for two co-crystals containing betaines, namely trigonelline (TRG: nicotinic acid N-methylbetaine, IUPAC name: 1-methylpyridinium-3-carboxylate) and N-methylpiperidine betaine (MPB: 1-methylpiperidinium-1-yl-carboxylate) with p-hydroxybenzoic acid (HBA) are reported. TRG-HBA crystallizes as a hydrate. For both of the co-crystals, high-quality diffraction data were collected up to sinθ/λ = 1.13 Å−1. Hansen-Coppens multipolar model was then applied for modelling the electron density distribution and Atoms-In-Molecules approach was used for detailed analysis of interactions in crystals. A number of intermolecular interactions was identified, ranging from strong O-H···O hydrogen bonds through C-H···O to C-H···π and π···π interactions. Correlations between the geometrical characteristics of the contacts and the features of their critical points were analyzed in detail. Atomic charges show that in zwitterionic species there are regions of opposite charges, rather than charges that are localized on certain atoms. In case of MPB-HBA, a significant charge transfer between the components of co-crystal (0.5 e) was found, as opposed to TRG-HBA, where all of the components are almost neutral.
1. Introduction
Experimental charge density analysis, based on high-resolution X-ray data, is an appealing tool for researching structural properties in crystalline materials, and—although still not very common—became the mature method in solid-state studies (for instance, [1,2,3]). An area of particular importance is related to interactions, both intra- and intermolecular. In particular, the non-covalent interactions (especially, but not exclusively, hydrogen bonds), which play an essential role in many biological processes and occupy a central place in supramolecular and material chemistry, are a well-researched object of such studies [4]. Especially in this area, the favorite tool of the trade is Bader’s quantum theory of Atoms in Molecules, and analysis of the details of the gradient of electron density vector field (critical points, Laplacian at these points etc.). At least in principle this method can—also by analyzing the derivated properties, like energetics, potential, charges—allow, for instance, to build the hierarchy of the interactions [5].
We have performed high resolution diffraction studies of two molecular complexes of p-hydroxybenzoic acid (HBA) with betaines: trigonelline (N-methyl-3carboxypyridinium, hereinafter TRG or 1, this structure crystallizes as a hydrate) and N-methylpiperidine betaine (N-carboxymethyl-N-methylpiperidine, MPB or 2). Carboxybetaines, to which group both TRG and MPB belong, are zwitterionic compounds with positively charged quaternary ammonium group and negatively charged carboxylate group that may not be adjacent to the cationic site.
Standard diffraction data for both structures were reported already [6,7]. It has been found that trigonelline forms a hydrate of 1:1 complex TRG∙HBA, in which HBA is linked to carboxylate group of TRG by the COOH∙∙∙−OOC hydrogen bond. In the complex of MPB∙HBA, a formation of dimeric structures was reported. These dimers are created by four OH∙∙∙O hydrogen bonds between carboxylic and hydroxyl groups of HBA and both oxygen atoms of the carboxylate group of MPB. In both compounds, besides strong hydrogen bonds, a whole spectrum of noncovalent interactions of different strengths was found, for example OH∙∙∙O, CH∙∙∙C, CH∙∙∙π, π∙∙∙π etc. Therefore we decided that these two structures can be very interesting objects for investigation by more detailed, experimental charge distribution analysis.
It can be also noted that chemistry of betaines has become a subject of particular interest due to their properties and applications in biological research. TRG is especially interesting, due to its presence in several plants such as coffee beans, garden peas, hemp seed, and oats. Coffee (the second widely consumed drink in the world) contains trigonelline at levels higher than 1000 ppm, so it comes out that TRG is one of the most often consumed alkaloids [8]. Furthermore, trigonelline is known to have antidiabetic properties, positive influence on lipid profile, as well as neuroprotective, antimigraine, sedative, antibacterial, antiviral, and anti-tumor activities; it has been explored as a potential drug against Alzheimer’s or Parkinson’s diseases [9,10,11].
2. Materials and Methods
2.1. Data Collection and Reduction
High resolution X-ray data were collected at 100(1) K on an XCalibur diffractometer (Oxford Diffraction Limited, Oxfordshire, UK), equipped with Eos CCD area detector and graphite-monochromated MoKα radiation (λ = 0.71073 Å). Temperature was controlled with an Oxford instruments Cryosystems device (under nitrogen gas). Diffraction data were collected up to sinθ/λ = 1.13 Å−1 in 37 (1) and 25 (2) runs with different exposure times, depending on the θ angle. Integration of the intensities, data reduction, and Lorentz-polarization corrections were carried out with CrysAlisRed [12,13]. Accurate unit-cell parameters were determined by a least-squares fit of 33,067 (1), and 30,696 (2) reflections of highest intensity, chosen from the whole experiments. The reflection intensities were then scaled and merged with the program SORTAV [14]. Details on the crystal data collection, processing, and refinement can be found in Table 1. COD 300172 (1) and COD 300173 (2) contain the supplementary crystallographic data for this paper. These data can be obtained free of charge via http://www.crystallography.net/search.htm.
2.2. IAM Model Refinement
The crystal structures were solved with direct methods using SHELXT [15] and the independent atom model (IAM) refined by the full-matrix least-squares procedure on F2 with SHELXL-2013 (these procedures were performed within WinGX suite of programs) [16]. Scattering factors incorporated in SHELXL were also used. Non-hydrogen atoms were refined anisotropically, all of the hydrogen atoms were located in difference Fourier maps and freely isotropically refined.
2.3. Multipolar Modeling
Multipolar refinements were performed using Hansen-Coppens Multipolar Model [17] implemented in MoPro software [18,19]. In this model, the total electron density is divided in three parts:
where Pval is the valence population, Plm are the multipole populations, and κ and κ’ are the contraction/expansion coefficients for spherical and aspherical valence density, respectively. The two first terms are the spherically averaged core and valence electron densities of an atom and the third term corresponds to expansion/contraction of the non-spherical valence density. The core and spherical valence function is calculated from Hartree-Fock (HF) wave functions, while the radial function Rl is a Slater-type function:
An octapolar level of the multipole description was used for the C, N, and O atoms, while H atoms were refined up to dipole level. Scattering factors were derived from the Clementi & Roetti wave functions for all of the atoms [20].
In each case, the structure obtained from IAM refinement was used as input for the multipolar models. Refinement was performed against intensities in the whole experimental resolution range, using several different approaches in order to obtain the best model of electron density distribution. Refinement strategies for both compounds were similar, after initial refinement against all of the reflections, the positions and ADPs for non-hydrogen atoms were refined against high–order reflections, and then the positions of H atoms were normalized to standard neutron X-H distances. The anisotropic displacement parameters of the H atoms were estimated using SHADE server [21] and were kept fixed throughout the refinement procedure. In all of the further refinement cycles some constraints and restraints were applied. For 1, the kappa values for chemically equivalent C atoms in aromatic ring of HBA and for the chemically equivalent H atoms were constrained to have the same values. Multipole and monopole values were only restrained. In 2, only restraints for valence and multipole populations were used. The κ and κ’ parameters were refined for C, N, and O atoms; for H atoms, they were restrained at 1.13 for κ and 1.29 for κ’. In the following steps, Plm, Pval, κ, and κ’ were consecutively refined using all of the reflections and iterated until convergence. In further refinement steps, valence and multipole populations and kappa values were refined together. The valence populations and κ value for water molecule in 1 were refined separately.
2.4. Quality of the Model
The quality of the refinement results was validated by low values of Hirshfeld rigid bond test (cf. Supplementary Materials), [22] with the highest values (ΔZAB2)—in both structures for N1-C7 bond-equal 6 × 10⁻⁴ (1) and 5 × 10⁻⁴ (2), as well as by residual density analysis (RDA [23]) for the final model. This latter method, based on the fractal dimension of the residual electron density map, is used to detect the systematical errors and to provide quantitative description of the deficiencies of the model. After an appropriate refinement it should be “flat and featureless”. Graphical representations show (Supplementary Materials) that the plots for both 1 and 2 are symmetrical and regular, thus indicating the absence of serious systematic errors. All static, residual, dynamic, and deformation maps were analyzed using MoproViewer software [19].
3. Results and Discussion
3.1. Molecular and Crystal Structure
The standard resolution, room temperature structures of 1 and 2 have been previously reported by Dega-Szafran et al. [6,7]. No phase transition with the temperature change was observed, so the general features of structures at 100 K are basically the same as those of room-temperature ones. Co-crystal of trigonelline with p-hydroxybenzoic acid 1 crystallizes in the monoclinic P21/c space group with additional water molecule in the asymmetric part of unit cell (Figure 1a). The asymmetric unit of 2, which crystallize in triclinic P-1 space group, comprises N-methylpiperidine and p-hydroxybenzoic acid molecules (Figure 1b). In neither crystal structure was the hydrogen transfer observed, so in principle there were only neutral species in the crystals.
3.2. Topological Analysis of Covalent Bonds
Analysis of covalent bond (and also other interactions) was performed using Atom-in-Molecules (AIM) theory [5], according to which different features of the can be analyzed in terms of topological features of total electron density field (gradient field, Laplacian, critical points, ellipticites etc.). The bond critical points (BCPs) for chemical covalent bonds (3,−1) were found and characterized (cf. Supplementary Tables S3 and S4.). In both of the structures, topological features of HBA molecules are typical. In both molecules, the most negative values of Laplacian, ∇2ρ, and the highest ρ values were found for C10-O4 double bonds, these CPs are significantly shifted towards the carbon atom. Critical points of carbon-carbon bonds in the aromatic ring lie, in a good approximation, in the middle of the bonds with total electron density ρ in the range 2.12–2.18 e/Å3 in 1 and 2.10–2.14 e/Å3 in 2; in both molecules, the Laplacian values are almost equal: 18.4 ± 1 e·Å−5. These features, along with the elasticities, are consistent with aromatic delocalized bonding, as expected. In the betaine molecules, the charge distribution is more asymmetrical. In 1, all of the carbon-nitrogen BCPs are moved towards the carbon atoms (Figure 2 and Figure 3); also, next-to-nitrogen C-C bonds are less symmetric, and the C4 C5 CP has the smallest ρ value at the CP of all the aromatic bonds in the molecule. The smaller values of ∇2ρ and ρ for Car-Car as compared with aromatic Car-N bonds suggest that less electron density is contracted in these areas. In carboxylate group, the distances C8-O1 and C8-O2, as well as the densities in appropriate BCPs, are almost identical, only the Laplacian values differ slightly (33.13 vs. 31.75 e·Å−5). In the case of MPB, BCPs for C-N bonds in the piperidine ring are also, as expected, shifted toward carbon atoms (Figure 4 and Figure 5). The electron densities at the BCPs of C-C bonds are larger than at C-N bonds. Electron density and Laplacian values at the BCP related to C2-C3 bond are 1.68 e·Å−3 and 9.31 e·Å−5, respectively, these values are about 0.11 e·Å−3 and 2.15 e·Å−5 higher than those found for N1-C2 bond in the same ring.
3.3. Experimental Deformation Electron Density and Atomic Charges
The static deformation density maps (Figure 6), show expected features, as consistent with the topological analysis: accumulation of electron density in the bonds of aromatic rings is in both of the structures larger than in piperidine one, strong polarization of electron density in C-O bonds (in COO− groups) towards the C atoms. One electron lone pair (LP) for O3 and O5 oxygen atoms, and two for O1, O2, and O4 atoms two LPs have been found in both complexes. It might be noted, that the deformation electron density within the lone pairs is not uniformly distributed—the result of the differences in intermolecular interactions (hydrogen bonding) in which these atoms are involved (these negatively charged atoms are excellent H-bonds acceptors). On the second end of the atomic charge spectra, in both of the structures the most positively atoms are carbon atoms of the carboxylate group (C8 (1), C9 (2), Figure 7).
In the case of betaine zwitterions, the atomic charge distributions are one of the most interesting issues; consequently, the partition of the charge between the quaternary ammonium and the carboxylate groups was also analyzed. To some extent, surprisingly, the charges reflect rather non-zwitterionic nature of TRG and MPB, since the positive charge is not concentrated at the nitrogen (q(N) = −0.81 e for 1 and q(N) = −0.74 e for 2), but is rather delocalized over the ring (similar effect has been observed in experimental charge density studies previously [24]).
Oxygen atoms in carboxylate groups have almost equal negative charges in both of the complexes, about −1.07 e (Figure 7, Tables S5 and S6), while the other oxygen atoms are even more negatively charged (from −1.09 e to −1.27 e). Of course, the zwitterionic nature of the molecule, even though not being observed in individual atom charges, can become clearly visible when groups of atoms are considered (Figure 8). So, partitioning the TRG and MPB molecules into parts that are related to N and COO− charges shows that fragment containing quaternary ammonium nitrogen atom is substantially more positive, and the carboxylate groups-negative (Figure 8). Interestingly, total atomic charges for the molecules constituting the molecular complex are close to 0 in 1 (TRG = 0.12 e, HBA = −0.12 e), while in two appropriate values (MPB = −0.48 e, HBA = 0.48 e) suggest some amount of charge transfer between the molecules. All of the atomic charges that are discussed here were obtained by integration over atomic basins; supplementary material also contains charges that are obtained as Nval–Pval differences between the numbers of valence electrons (formal) and refined valence populations.
3.4. Non-Covalent Interactions
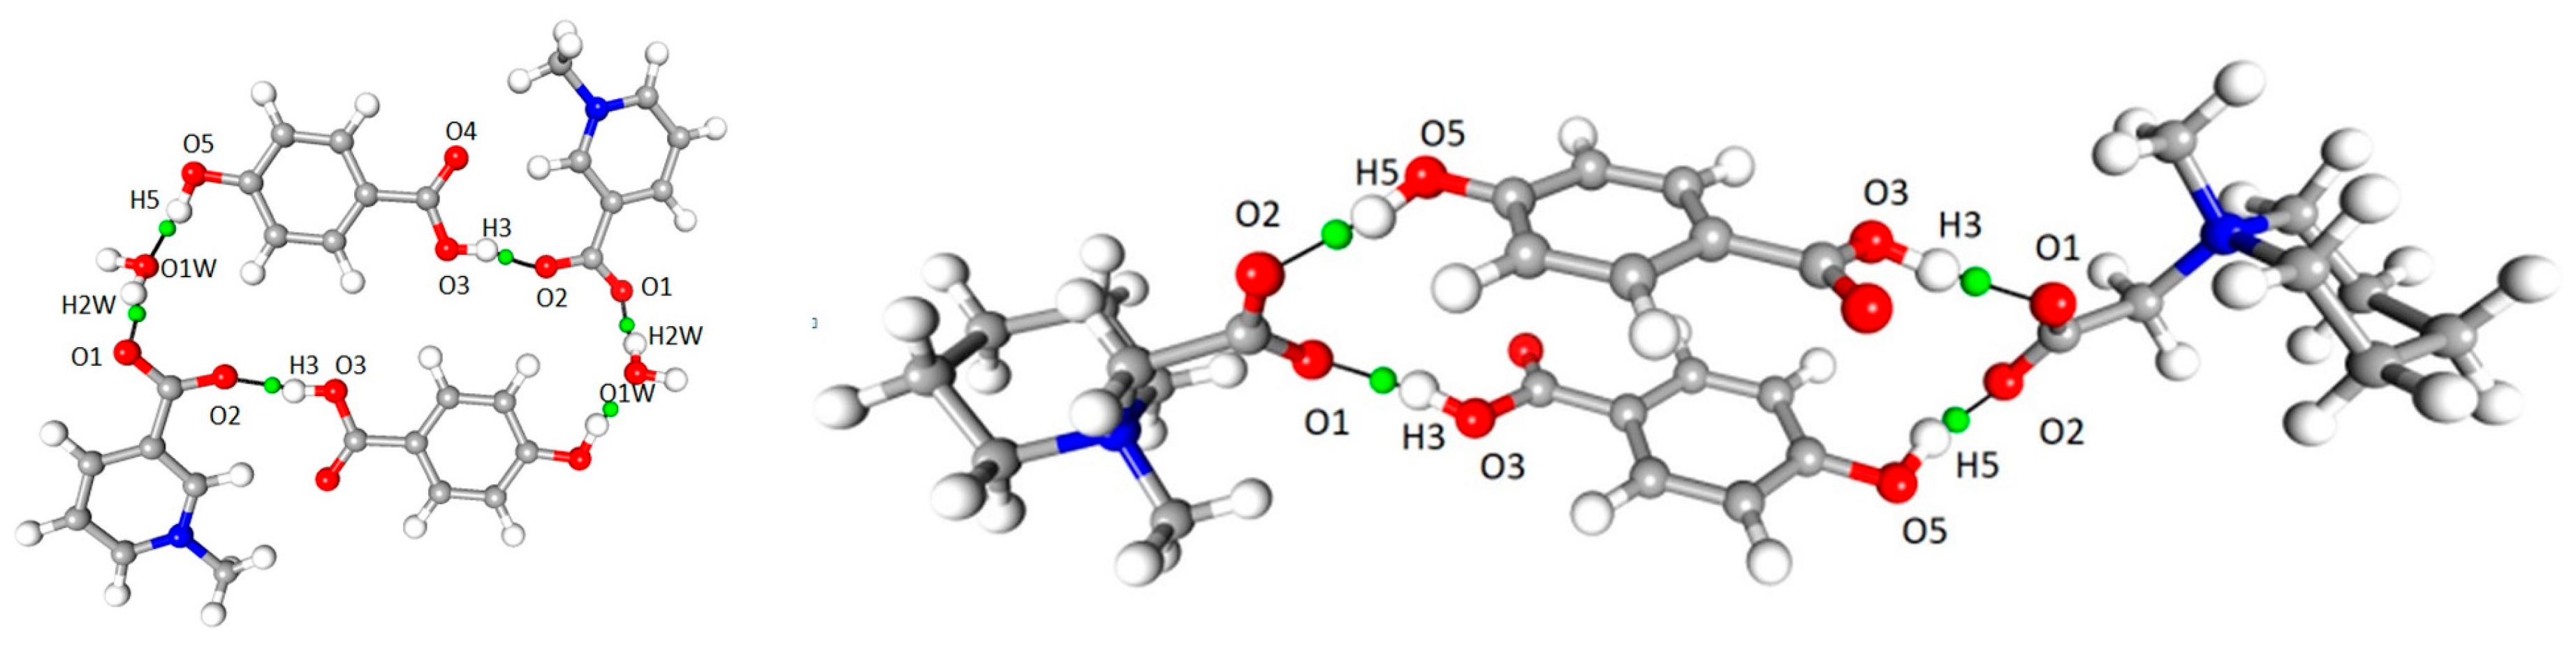
A number of important non-covalent interactions are present in the discussed crystal structures. The geometrical details of hydrogen bond network were described earlier [6,7]). The high-resolution data allow for more in-depth analysis of these interactions. Based on topological characteristics, a wide range of such non-covalent interactions, ranging from strong O–H···O hydrogen bonds, through moderate C–H···O h.b.s, to weak van der Waals type contacts, were identified and analyzed. In both 1 and 2, “classical” hydrogen bonds are by far the strongest and the most important intermolecular interactions, present in both crystal structures. In each case, a molecule of p-hydroxybenzoic acid acts as a donor for two hydrogen bonds (–OH and COOH groups), which are accepted by carboxylate groups in 1 and 2 (COO– group) and additionally by water molecule in 1, which acts also as the donor for another hydrogen bond. In both structures the centrosymmetric cyclic motifs are formed, build of six (1) or four (2) molecular entities (Figure 9). Using graph-set description these ring systems can be described as (28) in 1 and (24) in 2.
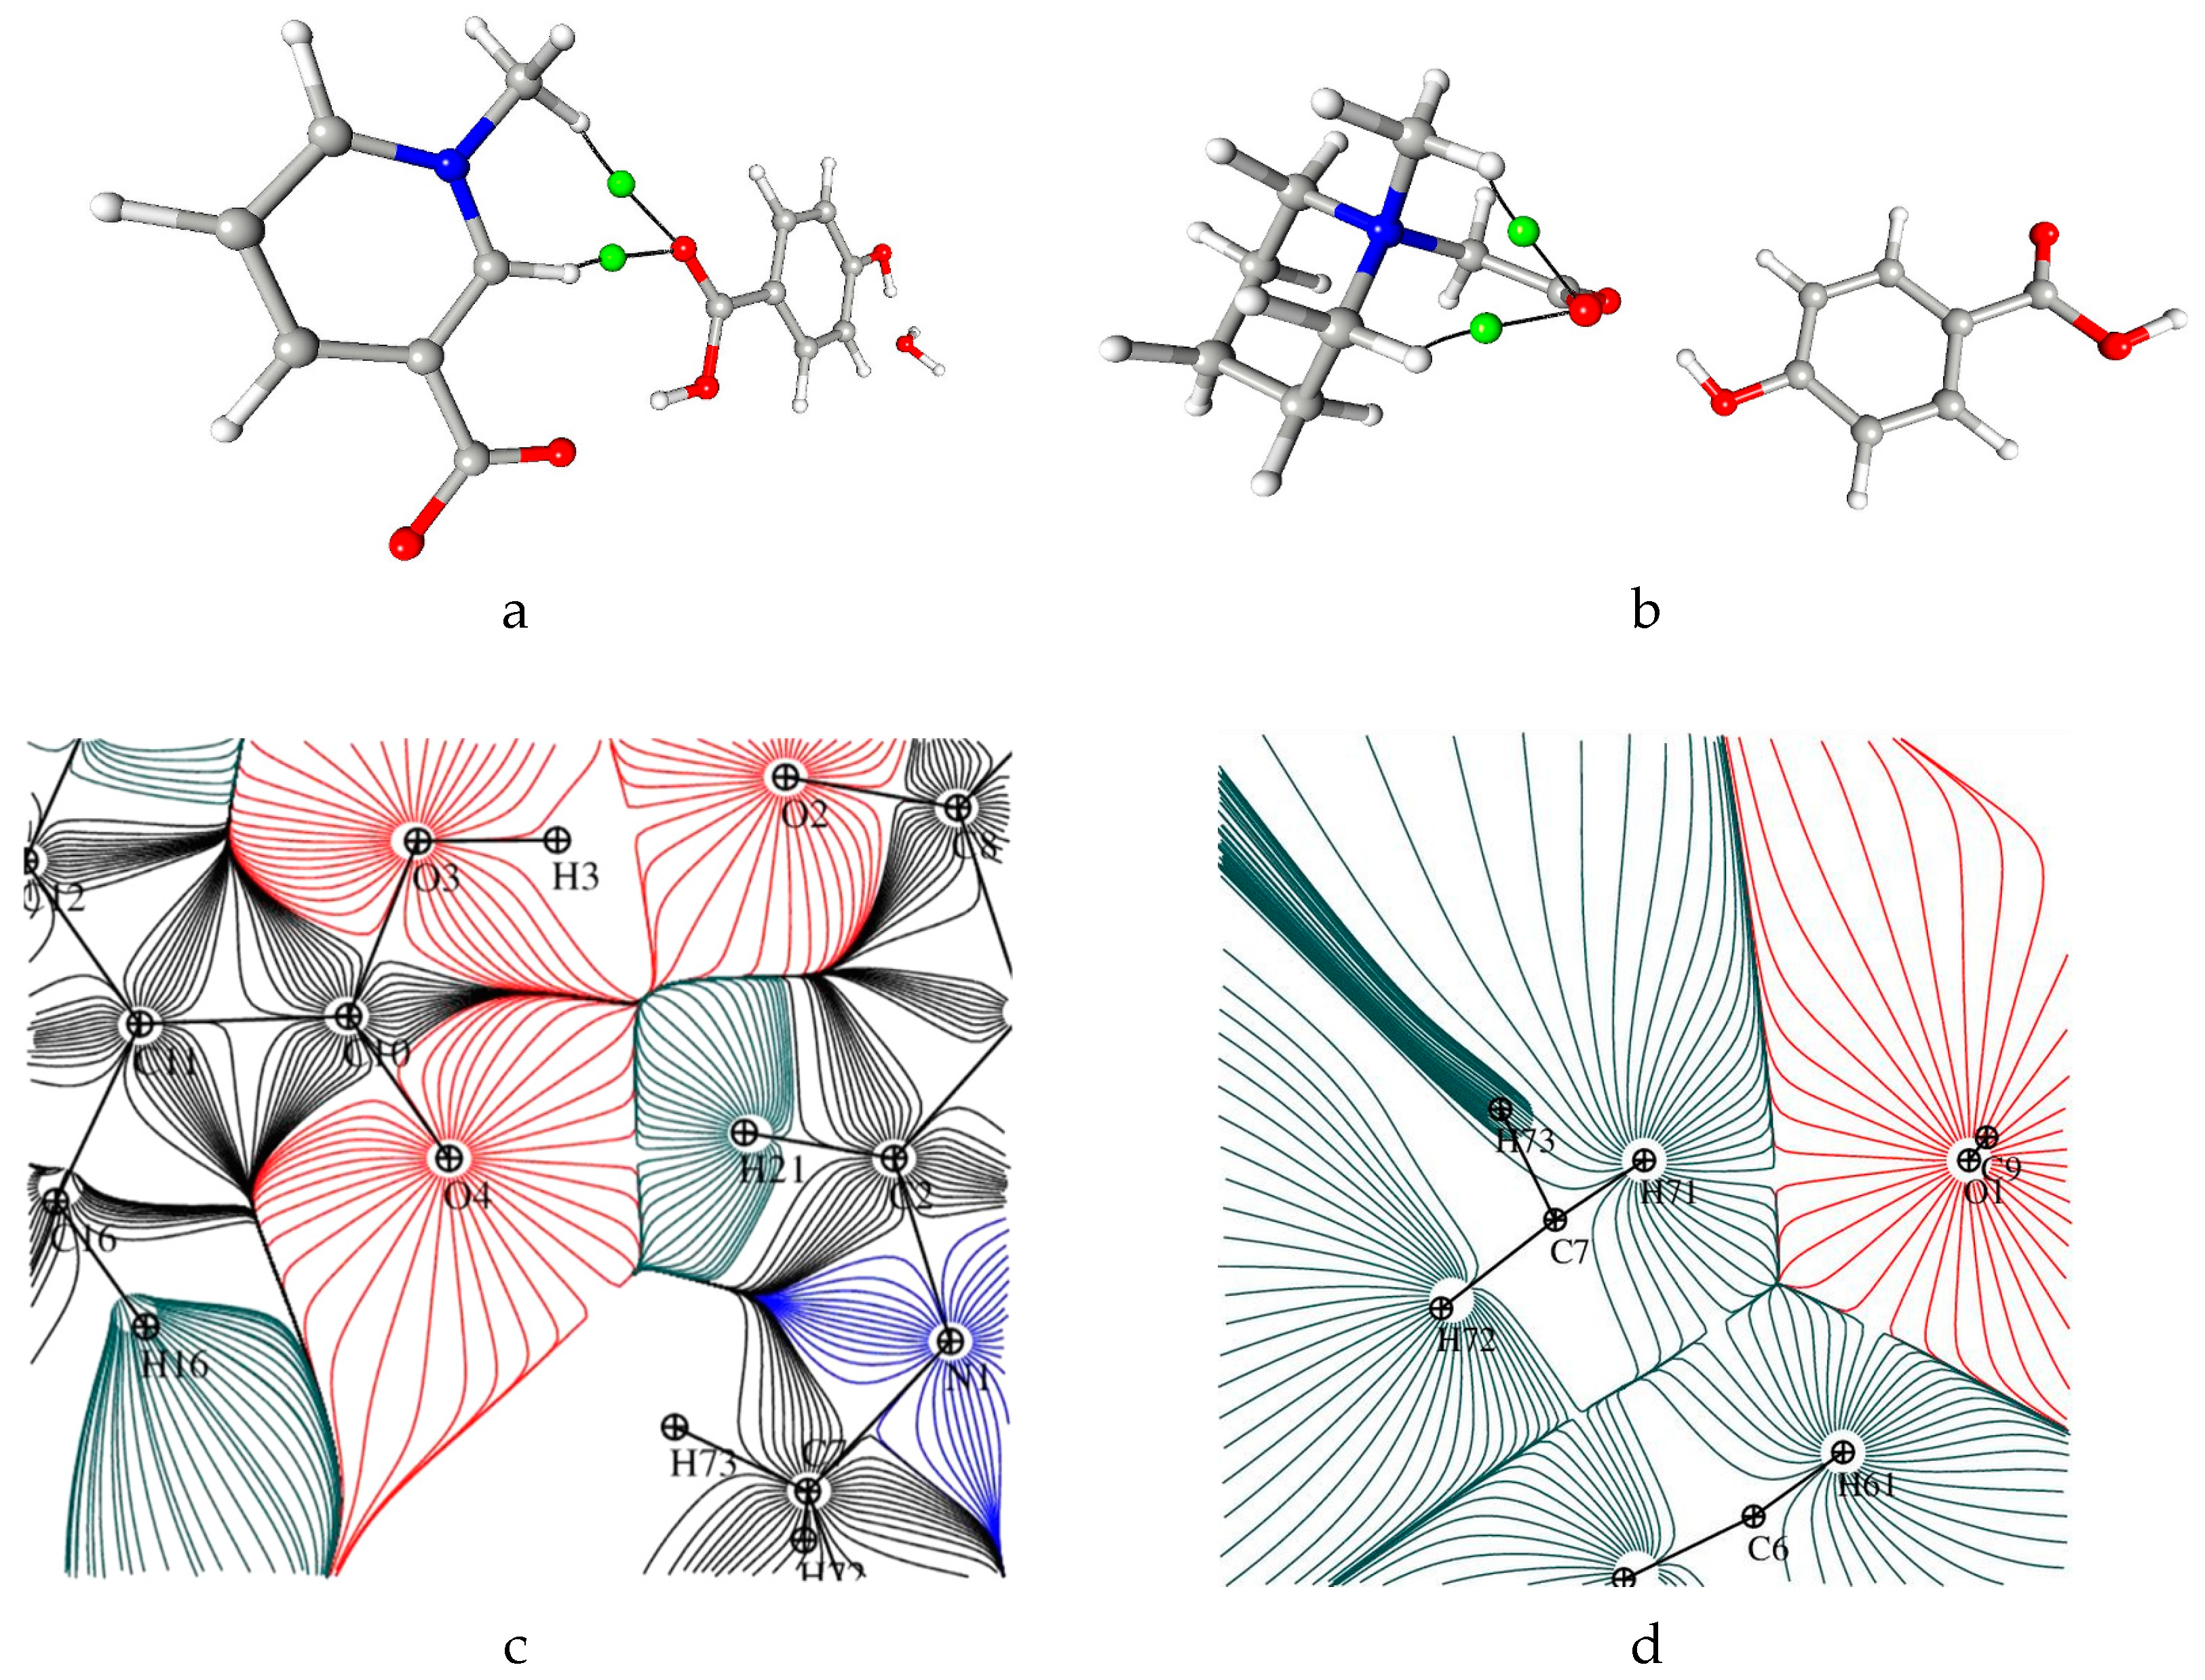
The analysis of the gradient of the electron density field in the structure 1 allowed for identifying (3,−1) CPs and corresponding bond paths for 27 interactions (the criterion of electron density value at CP larger than 0.02 Å was applied), while in the structure 2, as much as 36 such contacts were found (cf. Supplementary). The data for all of these CPs are deposited in the supplementary materials. According to Guru Row and Munshi conditions [25], all the OH···O contacts, for which CPs are identified, should be classified as strong hydrogen bonds, with high values of electron density (> 0.1 e·Å−3) and Laplasian (> 2.5 e·Å−5) at CP, as well as short (< 2.2 Å) D···H distance. Going further, almost all the CH···O contacts, in keeping with [22], can be classified as moderate or weak hydrogen bonds. The characteristics of critical points for selected O-H···O and C-H···O interactions are summarized in Table 2. One of the C-H···O bonds in 1, H21∙∙∙O4, is very short, 2.07 Å. This interaction is on the border of strong hydrogen bonds, in terms of ρtot (0.096 e·Å−3). Similar features show intramolecular H62∙∙∙O1 and H71∙∙∙O1 interaction in 2 (Table 2, Figure 10 and Figure 11).
Moreover, the aromatic rings in TRG and HBA molecules are involved in weak aromatic π-π stacking (parallel displaced) interactions, characterized in Table 2. In 2, (3,−1) CPs, and corresponding bond paths were found for sixteen additional contacts: C-H∙∙∙C, H···H, van der Waals. One of the strongest contacts is H∙∙∙H interaction with the highest values electron density at the CP (>0.05 e/Å, cf. Table 3, Figure 12). Electrostatic in nature C-O···C=C interaction between antiparallel HBA molecules can be identified in 2.
The chemical interactions can further be characterized in terms of the local energy density properties, which can be estimated from experimental results by using the approximate functional, as suggested by Abramov and Espinosa [26,27], who extended the ideas Cremer and Kraka [28]. The kinetic energy density, G(cp) is “proportional” to the ionic character, while the potential energy V(cp)-to the covalent one. Once both of the energy densities are known, it is possible to differentiate between shared and closed shell interactions. If sum of G(cp) and V (cp) (total energy density Hcp) is negative, the interactions can be classified as shared shell [27,28,29,30]. In 1, for all interactions, kinetic energy density is dominating, and therefore interactions are classified as closed shell (Table 2, Supplementary Tables S7 and S8). In 2, the strongest OH···O interaction can be considered to be partly covalent. Espinosa’s method for estimation of non-covalent bond interactions gives in 1 stabilization energy above 50 kJ/mol for OH···O hydrogen bond between hydroxyl group of p-hydroxybenzoic acid and water molecule and between carboxylic (HBA) and carboxylate (TRG) groups. The other two intermolecular OH···O bonds are moderate, of ca. 30 kJ/mol. Values of 67 kJ/mol and 61 kJ/mol are obtained for O5-H5···O2 and O3-H3···O1, respectively, in 2. Two intramolecular CH···O interactions are weaker but still relatively strong for this type of interactions (ca. 15 kJ/ mol, cf. S7 and S8). The relationships between G(cp) and Rij as well as between V(cp) and Rij follow the exponential dependence (cf. Supplementary Materials Figure S6).
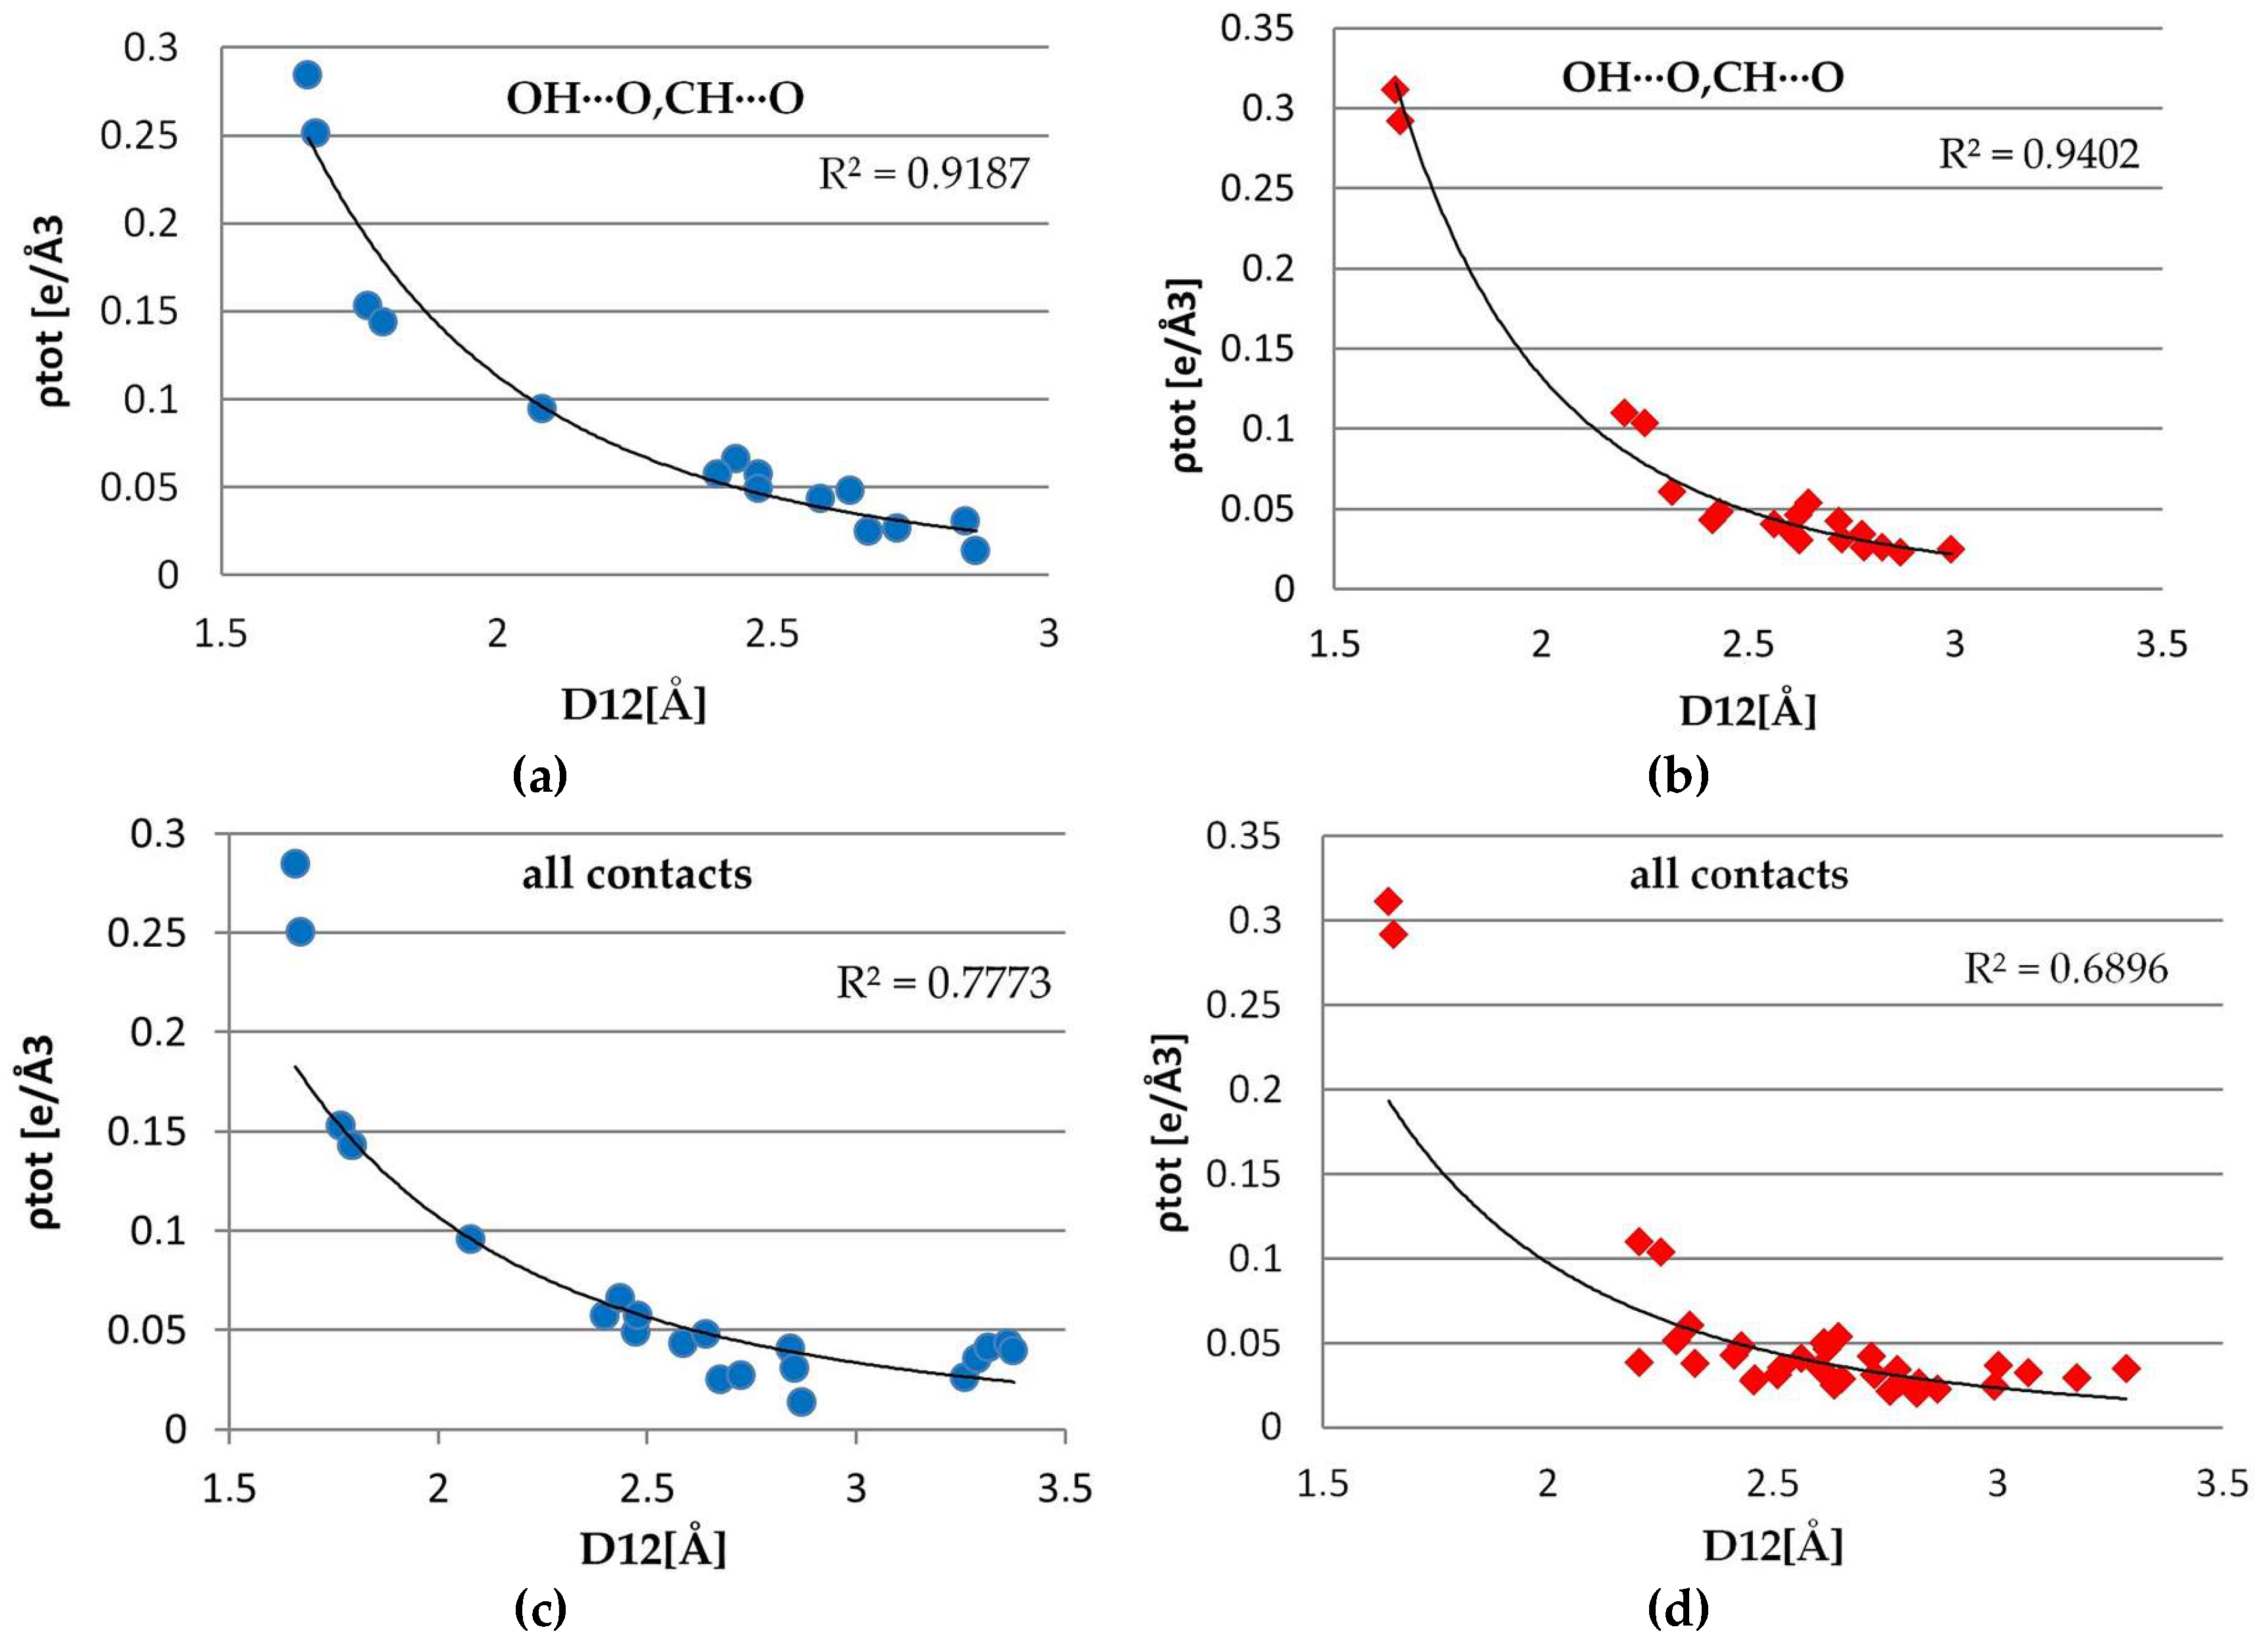
The exponential dependences of the total electron density, Laplacian, the main curvature (λ3) at the BCPs on the D12 distance, were examined for both complexes (Figure 13 and Supplementary Materials, Figures S6 and S7). The best exponential fitting for hydrogen bonds (both strong OH∙∙∙O, and weak CH∙∙∙O) was found for λ3, ∇2ρ (with the correlation of 98% (1) /97% (2), but also for ρ(rCP) correlation is quite remarkable (95% in 1 and 92% in 2). The analogous plots were drawn also for all of the contacts found using conditions mentioned above. In 1, a good fit for λ3, ∇2ρ (93%, 91%) has been found while the total electron density showed the worst convergence for these contacts (77%). In second complex, for all the contacts, no clear tendency is visible, points are rather spread around and the correlation is far below acceptable fitting level for all three parameters λ, ∇2ρ, λ3 (respectively, 69%, 69%, 73%). It can be explained by the different nature of interactions that are covered by this criterion-separated curves for CH···O contacts (91% λ3, 88%∇2, 81% ρ in 2), H···H contacts (89% λ3, 86% ∇2, 76% ρ) show much better agreement. For the remaining ones (π···π, CH···π, other weak interactions), there are too few points to give any reliable conclusions.
3.5. Electrostatic Potential
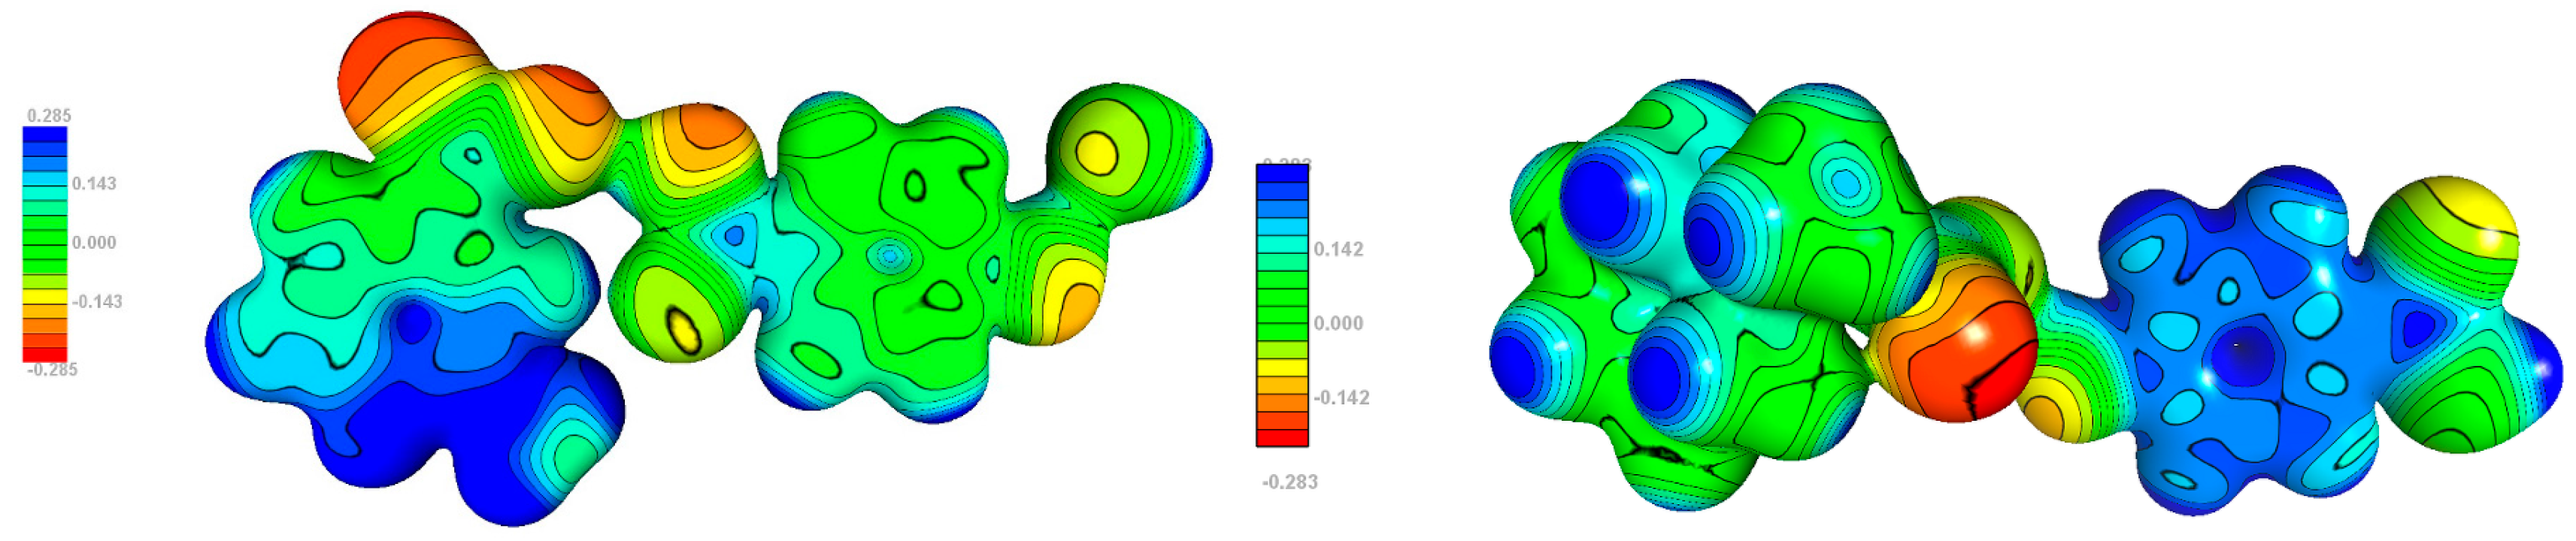
The electrostatic potential plots are shown in Figure 14. The most noteworthy difference is observed for p-hydroxybenzoic acid. In 1, the phenyl ring is close to neutral, whereas in 2, it has evident positive value (consistently with the mentioned above partial charge transfer from ‘base’ to ‘acid’). This dissimilarity is a consequence of the stacking interaction p-hydroxybenzoic acid is involved in. The most negative potential, in both structures, is located in carboxylic group, particular on oxygen atoms not involved in hydrogen bond. Its values for individual compounds do not differ remarkably.
4. Conclusions
High-resolution diffraction data were collected up to sinθ/λ = 1.13 Å−1 for two co-crystals: trigonelline with p-hydroxybenzoic acid (which turned out to contain a water molecule in the crystal), and N-methylpiperidine betaine with p-hydroxybenzoic acid. Hansen-Coppens multipolar model and Atoms-In-Molecules approach were used for modelling and analyzing the electron density distribution in the crystal. Critical points for both intra- and intermolecular interactions were found and analyzed in detail. The electron density distribution was used also for obtaining the atomic charges and electrostatic potential. Interestingly, it turned out zwitterionic species can be divided into two oppositely charged regions. In case of 1, all of the components of co-crystal are almost electrically negative, while in 2, a significant charge transfer between the components of co-crystal (0.5 e) was found.
Supplementary Materials
The following are available online at https://www.mdpi.com/2073-4352/8/3/132/s1, Figure S1: The RDA plots for (a) TRG∙HBA H2O (b)MPB∙HBA, Figure S2: The residual electron density maps for TRG∙HBA H2O (1) and MPB∙HBA (2), sinθ/λ > 0.9Å−1 contours are drawn at intervals 0.05 e Å−3 (2dmaps), and 0.1 e Å−3 for (1) and 0.15 e Å−3 for (2) (3dmaps), Figure S3: The static deformation electron density distribution in plane of pyridine ring (a), carboxylate group (b), C7-N1-C2 plane (c), carboxylate group (d), C2-C3-C5 plane (e), C2-N1-C6 plane (f), in plane of hba ring (g, h) and in plane of carboxylic group of hba (i),the positive (blue) and negative (dashed red) contours are drawn at intervals 0.05 e Å−3, Figure S4: Graphical representation of Laplacian (e Å−5)] electron density (e Å−3)] and λ3 eigenvalues of Hessian matrix in bond critical points, Figure S5: Atomic charges (e), Figure S6. Plots of CP characteristics as functions of interatomic distances for intermolecular interactions, Figure S7: Plots of kinetic and potential energies for critical points as a function of distance, Table S1: Rigid bond test for non-hydrogen atoms of TRG∙HBA∙H2O, Table S2: Rigid bond test for non-hydrogen atoms of MPB∙HBA, Table S3: Characteristics of bond critical points (3,−1) for TRG∙HBA∙H2O, Table S4: Characteristics of bond critical points(3,−1) for MPB∙HBA, Table S5: Atomic Charges (e) in Molecule (1) with different definition calculated as Nval-Pval and by integration over atomic basins (Inte), Table S6: Atomic Charges (e) in Molecule (2) with different definition as Nval-Pval and by integration over atomic basins (Inte), Table S7: Topological characteristic of the intermolecular critical points(3,1) in TRG∙HBA∙H2O, Table S8: Topological characteristic of the intermolecular critical points(3,1) in MPB∙HBA.
Author Contributions
Agata Owczarzak processed the experimental data, performed the analysis, wrote the manuscript and designed the figures. Maciej Kubicki performed the measurements, wrote the manuscript and supervised the findings of this work. All authors discussed the results and contributed to the final manuscript.
Conflicts of Interest
The authors declare no conflict of interest.
References
- Koritsanszky, T.; Coppens, P. Chemical applications of X-ray charge-density analysis. Chem. Rev. 2001, 101, 1583–1627. [Google Scholar] [CrossRef] [PubMed]
- Stalke, D. Electron Density and Chemical Bonding I: Experimental Charge Density Studies. Struct. Bond. 2012, 146. [Google Scholar] [CrossRef]
- Gatti, C.; Macchi, P. Modern Charge-Density Analysis; Springer: New York, NY, USA, 2012; ISBN 978-9048138357. [Google Scholar]
- Desiraju, G.R.; Steiner, T. The Weak Hydrogen Bond in Structural Chemistry and Biology; Oxford University Press: Oxford, UK; New York, NY, USA, 1999; ISBN 0-19-850252-4. [Google Scholar]
- Bader, R.F.W. Atoms in Molecules—A Quantum Theory; Oxford University Press: Oxford, UK; New York, NY, USA, 1990; ISBN 0198558651. [Google Scholar]
- Dega-Szafran, Z.; Dutkiewicz, G.; Kosturkiewicz, Z.; Szafran, M. Crystal structure and spectroscopic properties of the complex of trigonelline hydrate with p-hydroxybenzoic acid. J. Mol. Struct. 2011, 985, 219–226. [Google Scholar] [CrossRef]
- Dega-Szafran, Z.; Dutkiewicz, G.; Kosturkiewicz, Z.; Szafran, M. Structure of complex of N-methylpiperidine betaine with p-hydroxybenzoic acid studied by X-ray, FT-IR and DFT methods. J. Mol. Struct. 2008, 875, 346–353. [Google Scholar] [CrossRef]
- Allred, K.F.; Yackley, K.M.; Vanamala, J.; Allred, C.D. Trigonelline is a novel phytoestrogen in coffee beans. J. Nutr. 2009, 139, 1833–1838. [Google Scholar] [CrossRef] [PubMed]
- Zhou, J.; Chan, L.; Zhou, S. Trigonelline: A plant alkaloid with therapeutic potential for diabetes and central nervous system disease. Curr. Med. Chem. 2012, 19, 3523–3531. [Google Scholar] [CrossRef] [PubMed]
- Tohda, C.; Kuboyama, T.; Komatsu, K. Search for natural products related to regeneration of the neuronal network. NeuroSignals 2005, 14, 34–45. [Google Scholar] [CrossRef] [PubMed]
- Makowska, J.; Szczesny, D. Preliminary studies on trigonelline as potential anti-Alzheimer disease agent: Determination by hydrophilic interaction liquid chromatography and modeling of interactions with beta-amyloid. J. Chromatogr. B 2014, 968, 101–104. [Google Scholar] [CrossRef] [PubMed]
- Blessing, R.H. DREADD–data reduction and error analysis for single-crystal diffractometer data. J. Appl. Crystallogr. 1989, 22, 396–397. [Google Scholar] [CrossRef]
- Agilent. CrysAlis PRO; Agilent Technologies Ltd.: Yarnton, UK, 2014. [Google Scholar]
- Blessing, R.H. Data reduction and error analysis for accurate single crystal diffraction intensities. Crystallogr. Rev. 1987, 1, 3–58. [Google Scholar] [CrossRef]
- Sheldrick, G.M. SHELXT—integrated space-group and crystal-structure determination. Acta Cryst. 2015, 71, 3–8. [Google Scholar] [CrossRef] [PubMed]
- Farrugia, L.J. WinGX and ORTEP for Windows: An update. J. Appl. Crystallogr. 2012, 45, 849–854. [Google Scholar] [CrossRef]
- Hansen, N.K.; Coppens, P. Testing aspherical atom refinements on small-molecule data sets. Acta Cryst. 1987, 34, 909–992. [Google Scholar] [CrossRef]
- Guillot, B.; Viry, L.; Guillot, R.; Lecomte, C.; Jelsch, C. Refinement of proteins at subatomic resolution with MoPro. J. Appl. Crystallogr. 2001, 34, 214–223. [Google Scholar] [CrossRef]
- Jelsch, C.; Guillot, B.; Lagoutte, A.; Lecomte, C. Advances in proteins and small molecules charge density refinement methods using software MoPro. J. Appl. Crystallogr. 2005, 38, 38–54. [Google Scholar] [CrossRef]
- Clementi, E.; Roetti, C. Roothaan-Hartree-Fock atomic wavefunctions: Basis functions and their coefficients for ground and certain excited states of neutral and ionized atoms, Z ≤ 54. At. Data Nucl. Data Tables 1974, 14, 177–478. [Google Scholar] [CrossRef]
- Madsen, A.O. SHADE web server for estimation of hydrogen anisotropic displacement parameters. J. Appl. Crystallogr. 2006, 39, 757–758. [Google Scholar] [CrossRef]
- Hirshfeld, F.L. Can X-ray data distinguish bonding effects from vibrational smearing? Acta Cryst. 1976, 32, 239–244. [Google Scholar] [CrossRef]
- Meindl, K.; Henn, J. Foundations of residual-density analysis. Acta Cryst. 2008, 64, 404–418. [Google Scholar] [CrossRef] [PubMed]
- Du, J.J.; Váradi, L.; Williams, P.A.; Groundwater, P.W.; Overgaard, J.; Platts, J.A.; Hibbs, D.E. An analysis of the experimental and theoretical charge density distributions of the piroxicam–saccharin co-crystal and its constituents. RSC Adv. 2016, 6, 81578–81590. [Google Scholar] [CrossRef]
- Munshi, P.; Guru Row, T.N. Exploring the lower limit in hydrogen bonds: Analysis of weak C-H···O and C-H···pi interactions in substituted coumarins from charge density analysis. J. Phys. Chem. A 2005, 109, 659–672. [Google Scholar] [CrossRef] [PubMed]
- Espinosa, E.; Molins, E.; Lecomte, C. Hydrogen bond strengths revealed by topological analyses of experimentally observed electron densities. Chem. Phys. Lett. 1998, 285, 170–173. [Google Scholar] [CrossRef]
- Abramov, Y.A. On the Possibility of Kinetic Energy Density Evaluation from the Experimental Electron-Density Distribution. Acta Cryst. A 1997, 53, 264–272. [Google Scholar] [CrossRef]
- Cremer, D.; Kraka, E. Chemical bonds without bonding electron density—Does the difference electron-density analysis suffice for a description of the chemical bond? Angew. Chem. Int. Ed. 1984, 23, 627–628. [Google Scholar] [CrossRef]
- Baryshnikov, G.; Minaev, B.; Minaeva, V.A.; Nenajdenko, V. Single crystal architecture and absorption spectra of octathio[8]circulene and sym-tetraselenatetrathio[8]circulene: QTAIM and TD-DFT approach. J. Mol. Model. 2013, 19, 4511–4519. [Google Scholar] [CrossRef] [PubMed]
- Baryshnikov, G.V.; Minaev, B.F.; Minaeva, V.A.; Baryshnikova, A.T.; Pittelkow, M. DFT and QTAIM study of the tetra-tert-butyltetraoxa[8]circulene regioisomers structure. J. Mol. Struct. 2012, 1026, 127–132. [Google Scholar] [CrossRef]
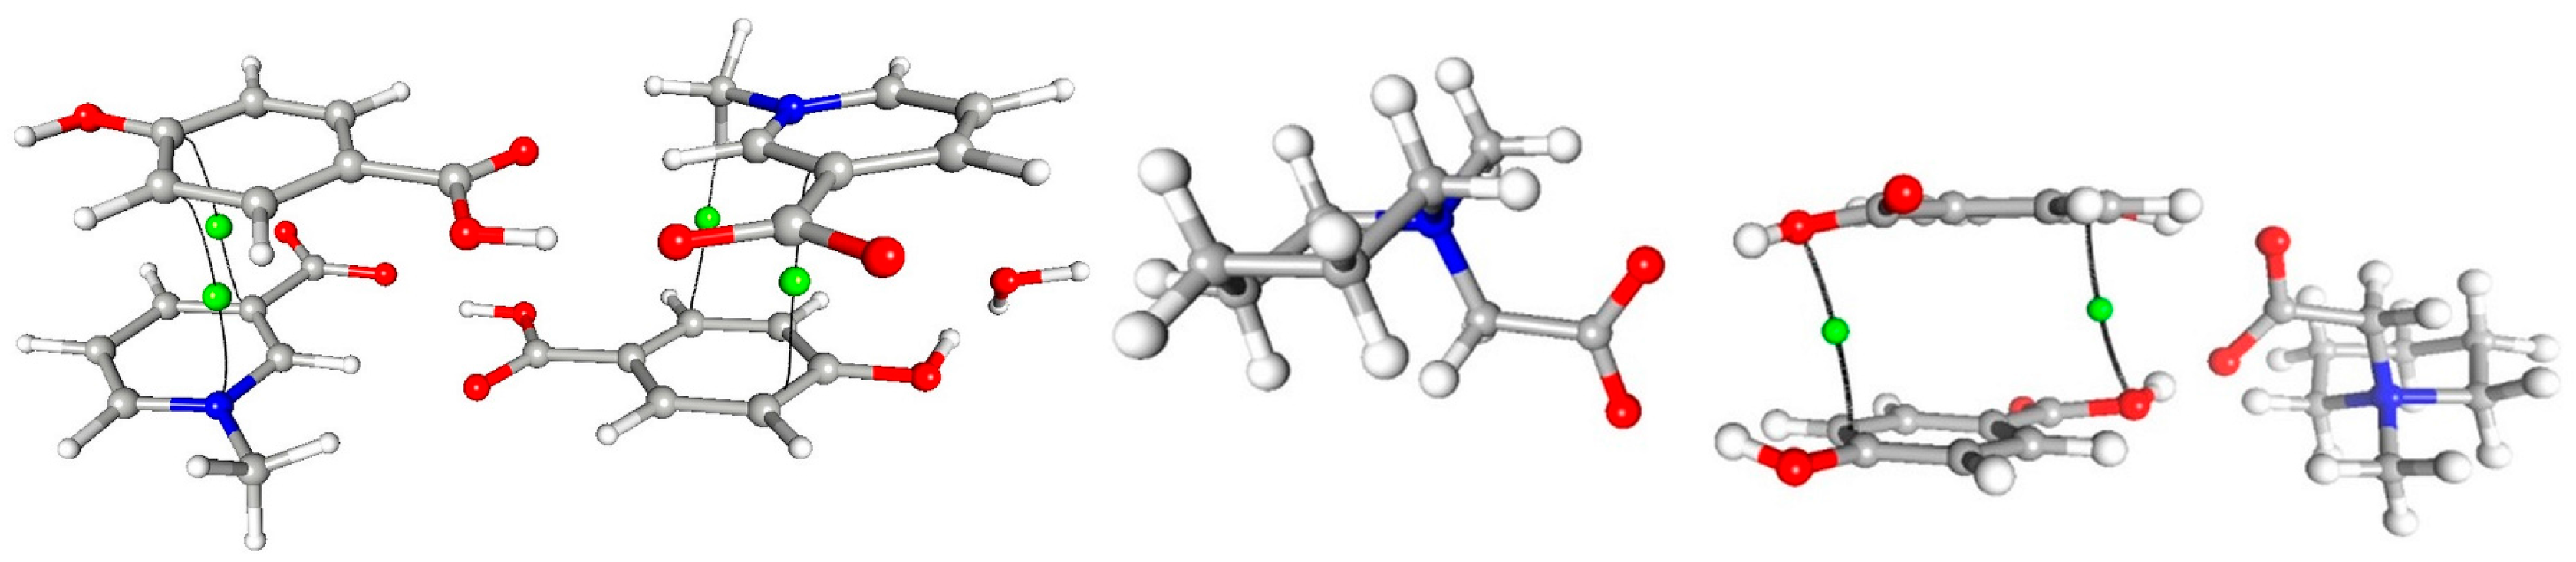
Figure 1.
Perspective views of the components of crystal structures 1 (a) and 2 (b), together with atom numbering schemes; the ellipsoids are drawn at the 50% probability level, anisotropic thermal parameters for hydrogen atoms were calculated with SHADE server (cf. Experimental part).
Figure 1.
Perspective views of the components of crystal structures 1 (a) and 2 (b), together with atom numbering schemes; the ellipsoids are drawn at the 50% probability level, anisotropic thermal parameters for hydrogen atoms were calculated with SHADE server (cf. Experimental part).
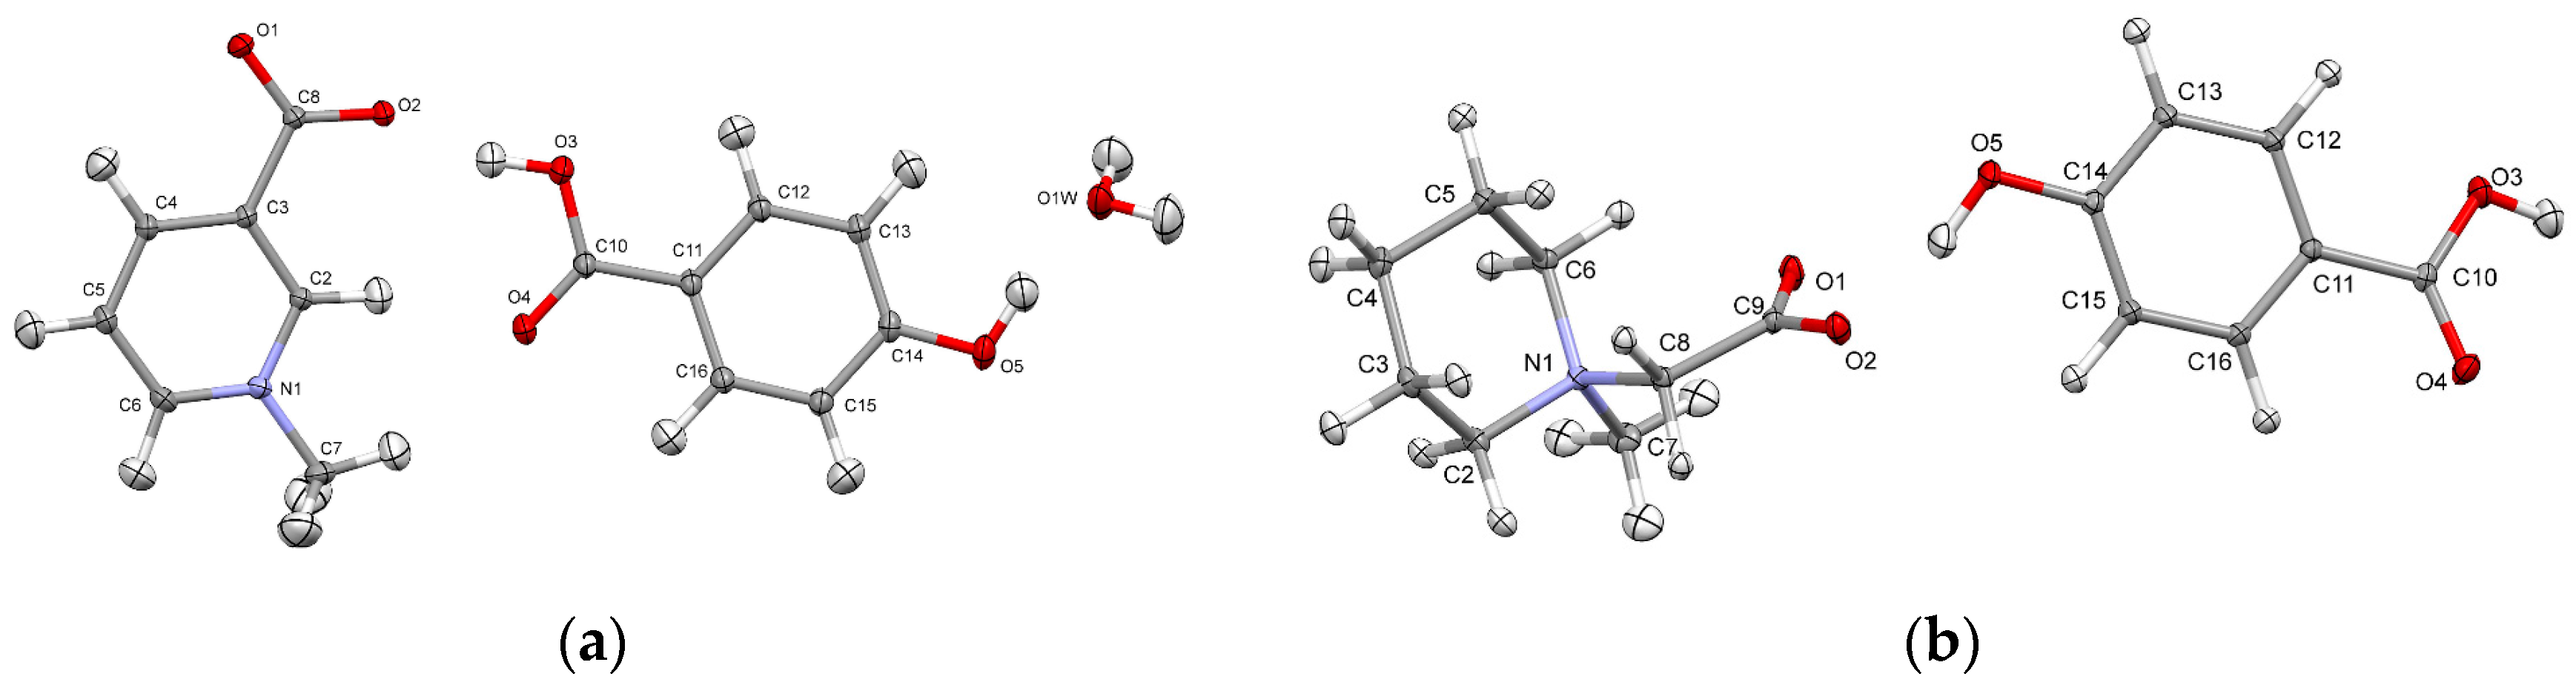
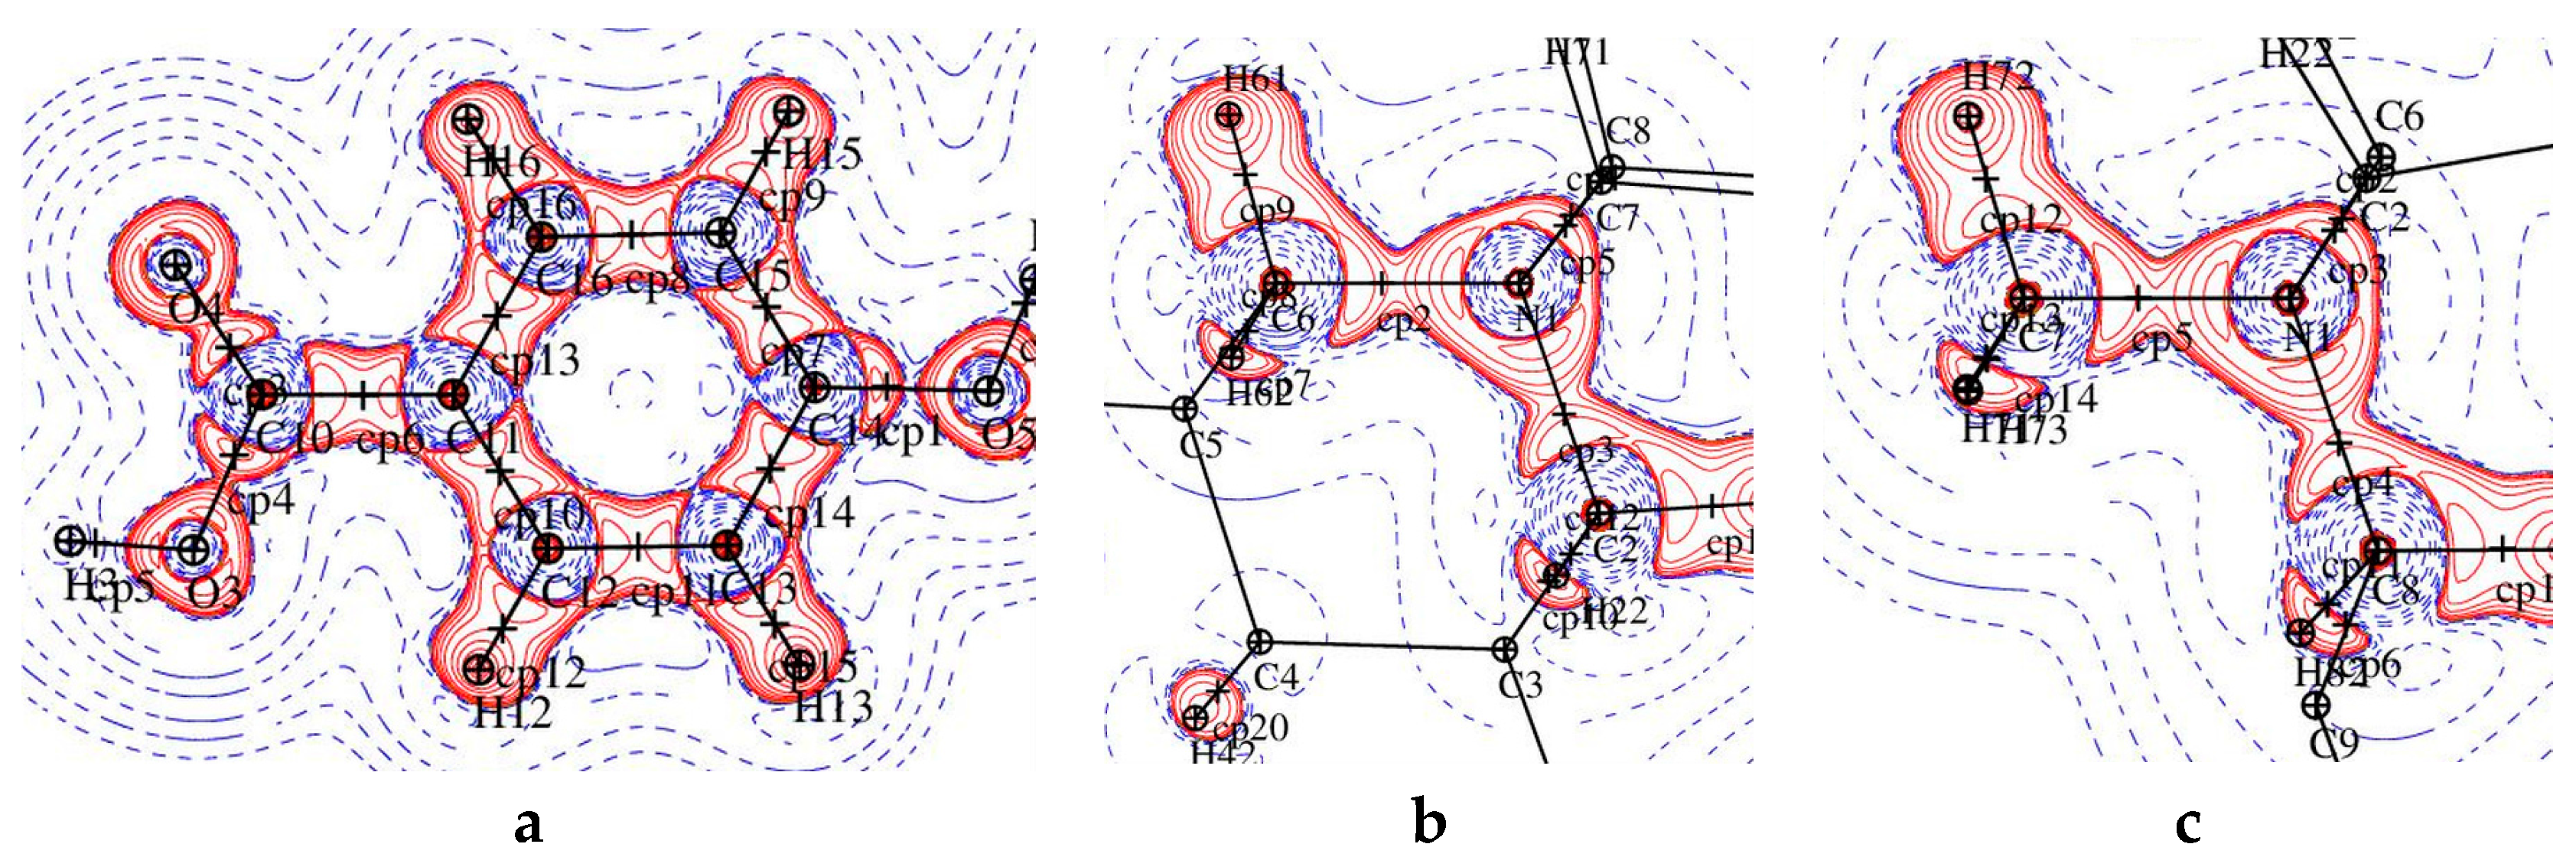
Figure 2.
Electron density values [ρbcp (e·Å−3)] at the covalent bond critical points in 1 (left) and graphical representation of bond critical points in molecule 2 (right).
Figure 2.
Electron density values [ρbcp (e·Å−3)] at the covalent bond critical points in 1 (left) and graphical representation of bond critical points in molecule 2 (right).
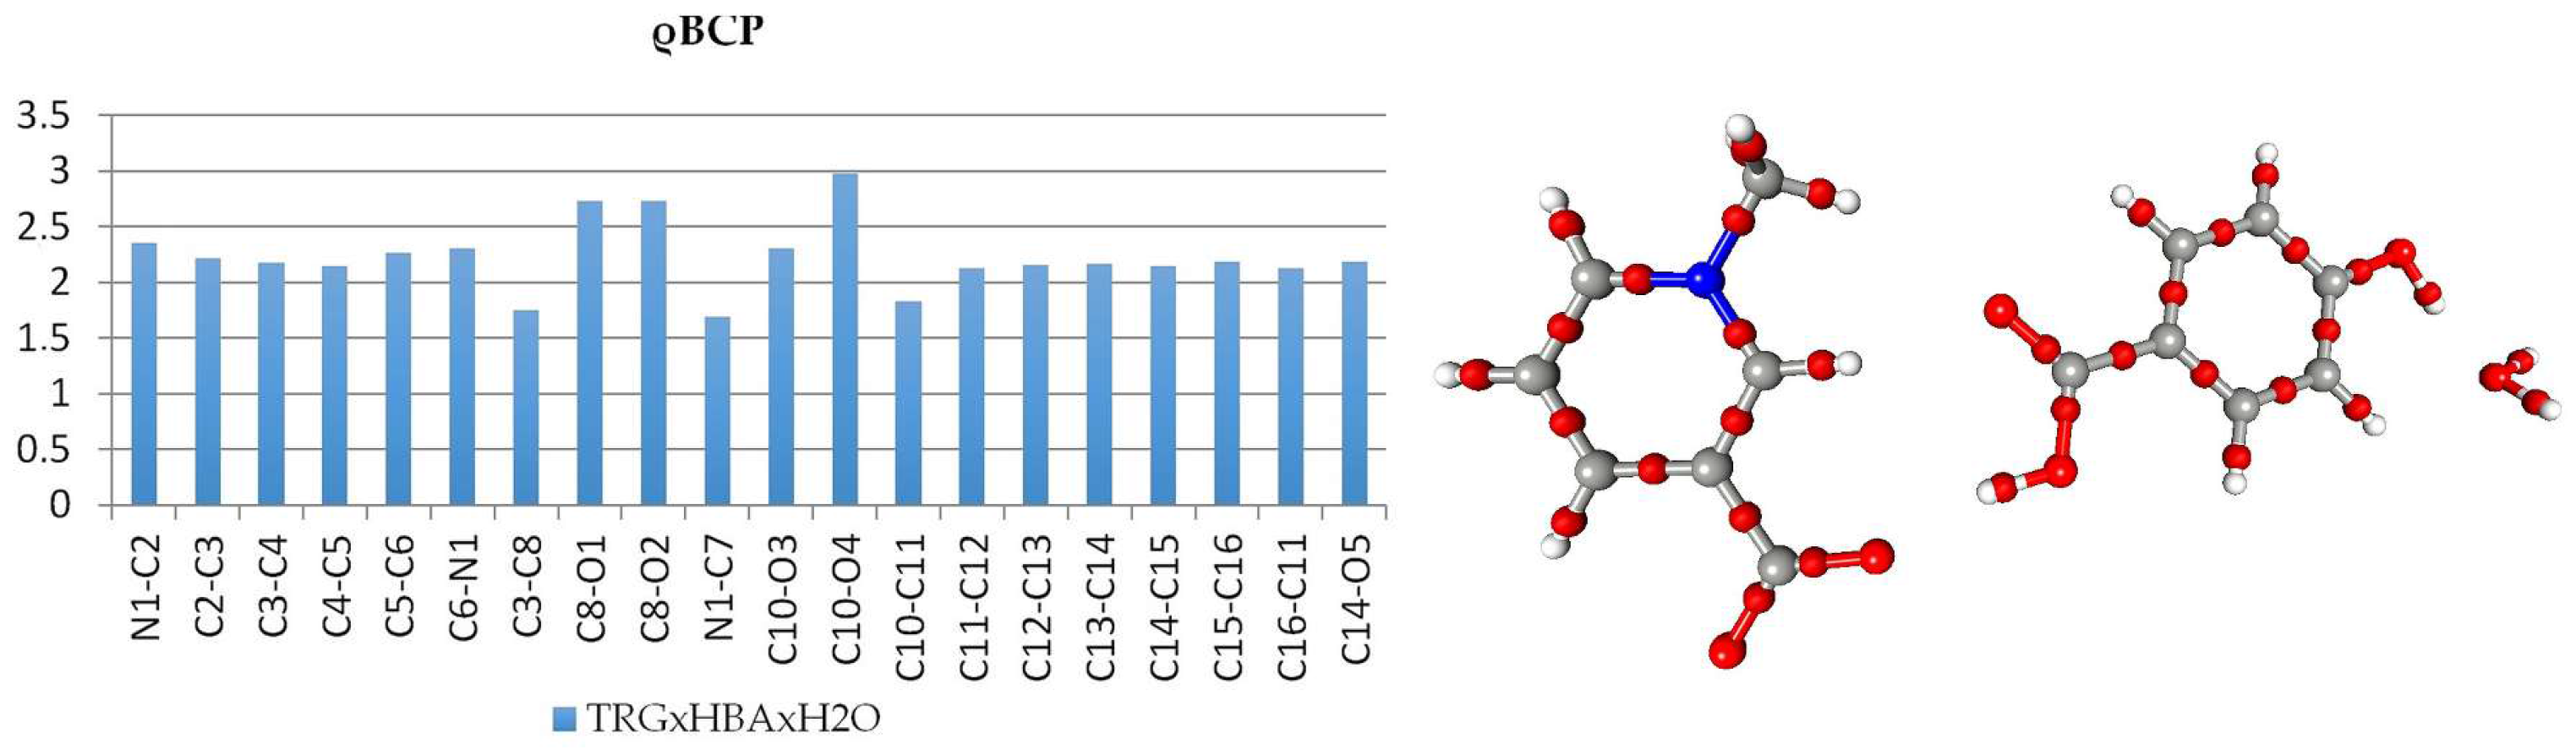
Figure 3.
A plot of the Laplacian of the electron density in two parts of 1: (left) p-hydroxybenzoic acid and (right) pyridine ring.
Figure 3.
A plot of the Laplacian of the electron density in two parts of 1: (left) p-hydroxybenzoic acid and (right) pyridine ring.
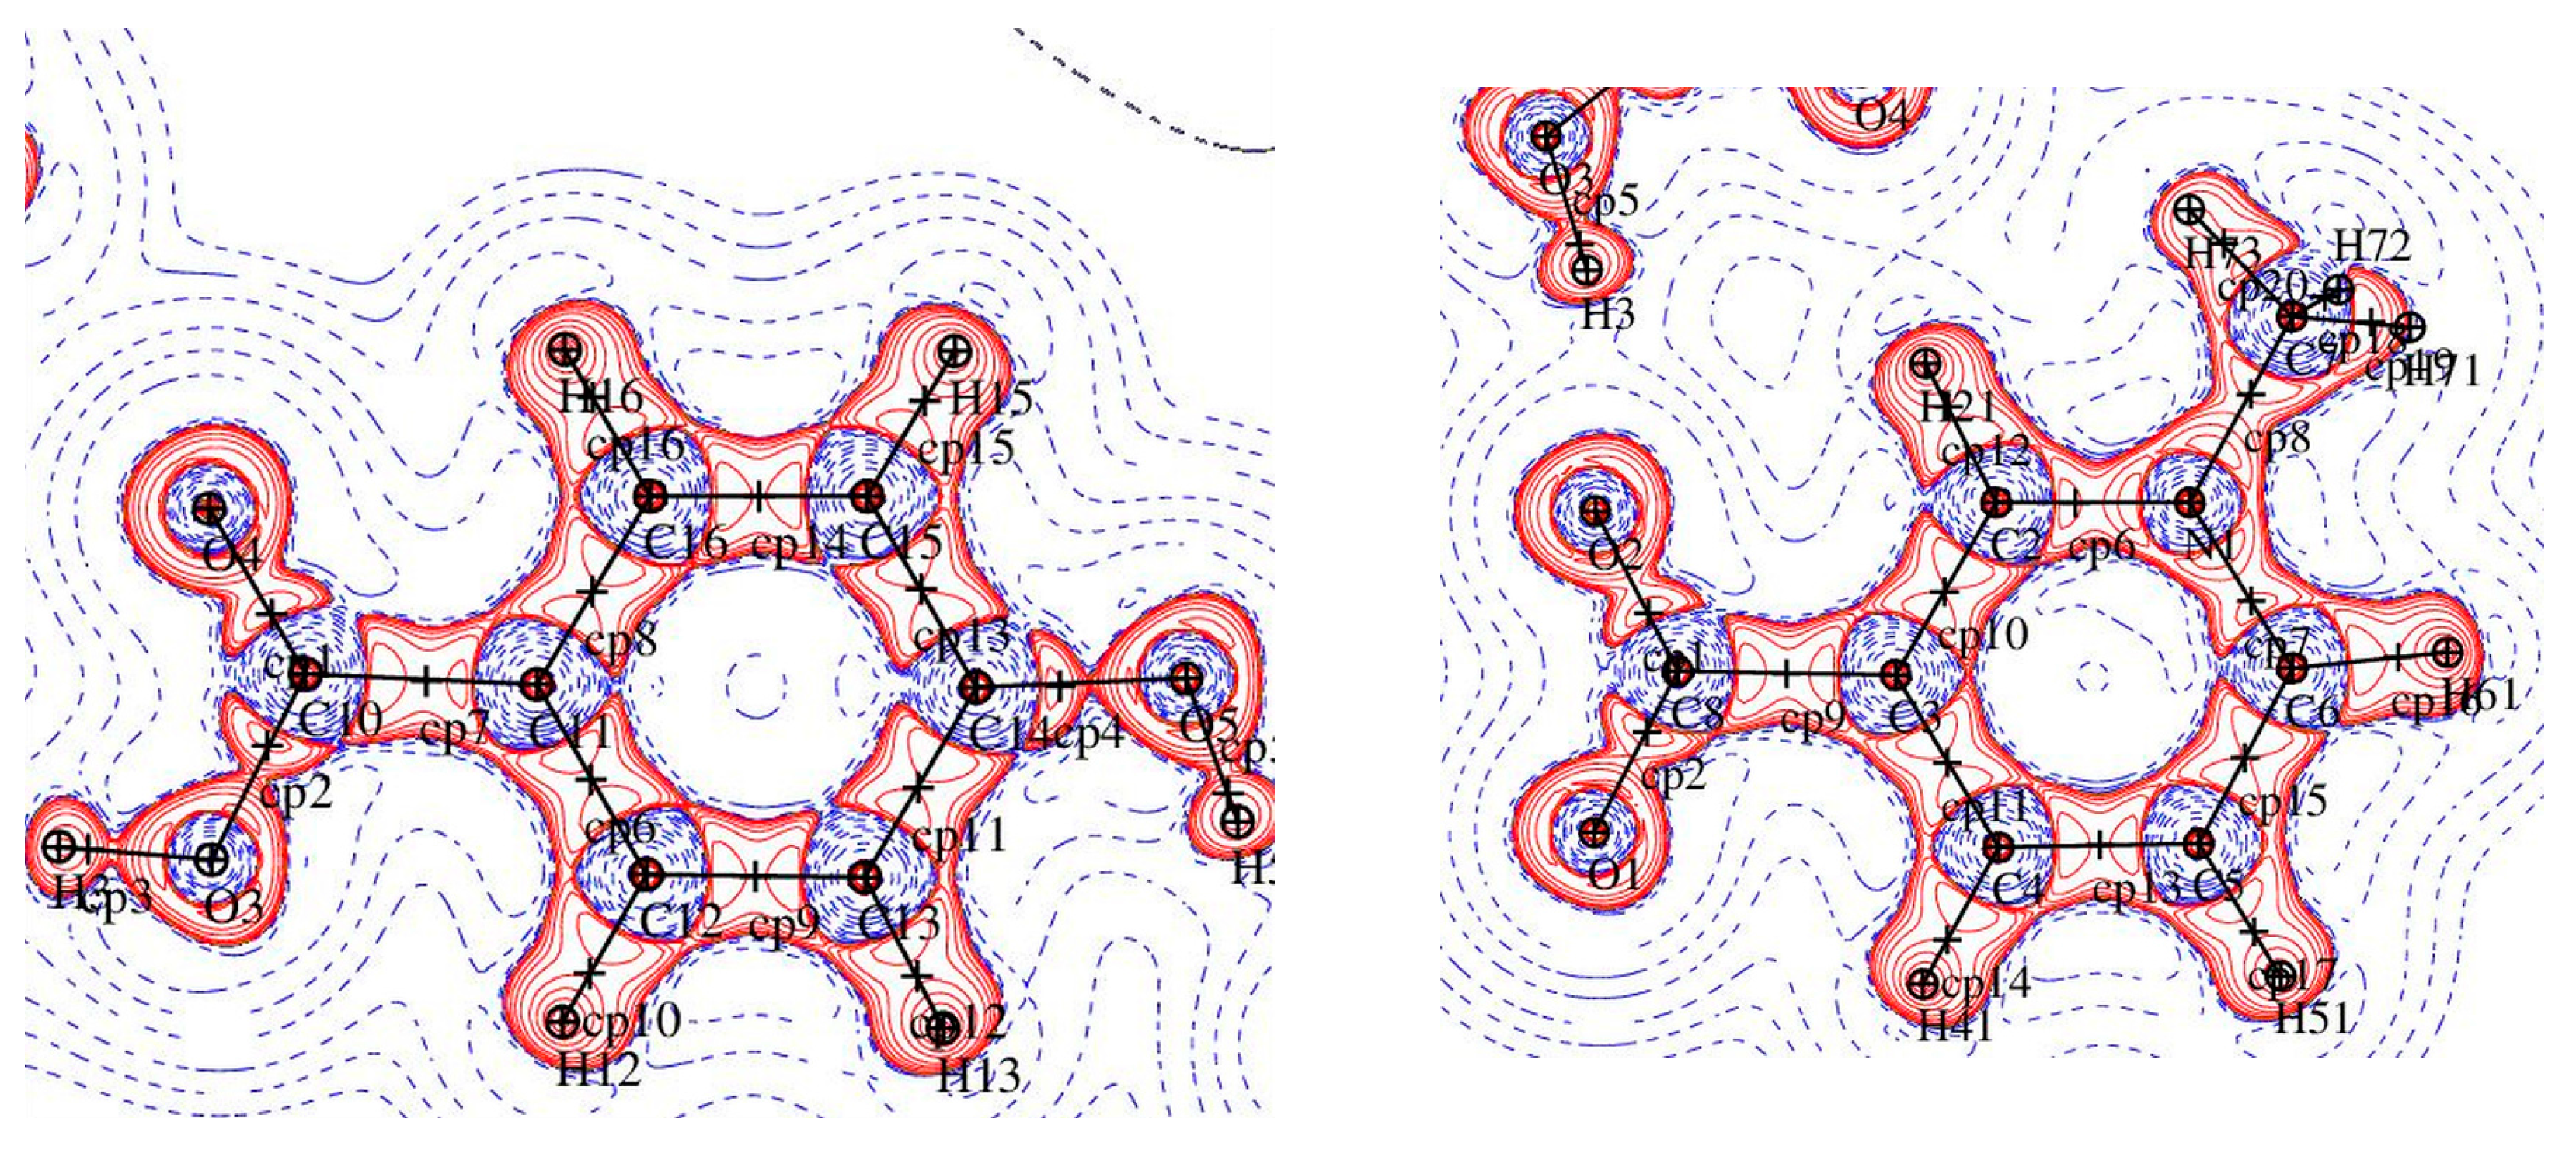
Figure 4.
Electron density values [ρbcp (e·Å−3)] at the covalent bond critical points in 2 (left) and graphical representation of bond critical points in molecule 2 (right).
Figure 4.
Electron density values [ρbcp (e·Å−3)] at the covalent bond critical points in 2 (left) and graphical representation of bond critical points in molecule 2 (right).
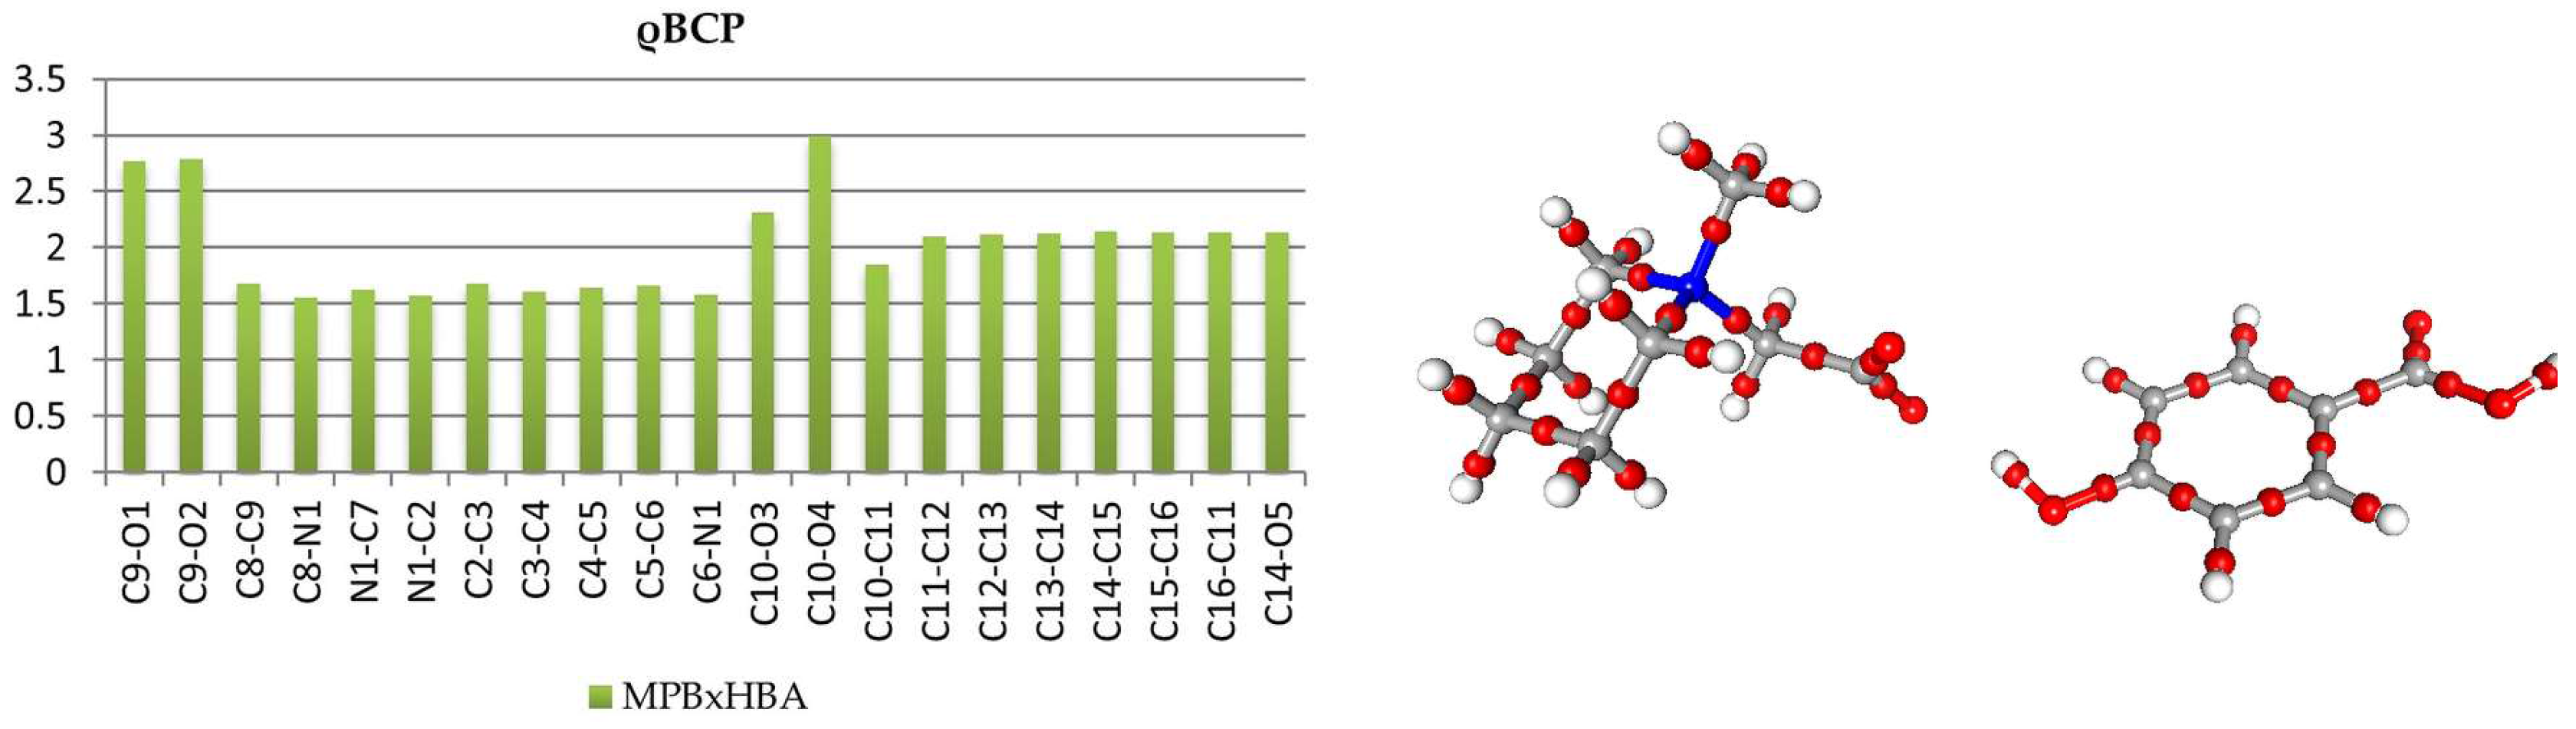
Figure 5.
Laplacian of the electron density in fragments of 2: (a) p-hydroxybenzoic acid, (b) C2-N1-C6 plane, and (c) C7-N1-C8 plane.
Figure 5.
Laplacian of the electron density in fragments of 2: (a) p-hydroxybenzoic acid, (b) C2-N1-C6 plane, and (c) C7-N1-C8 plane.

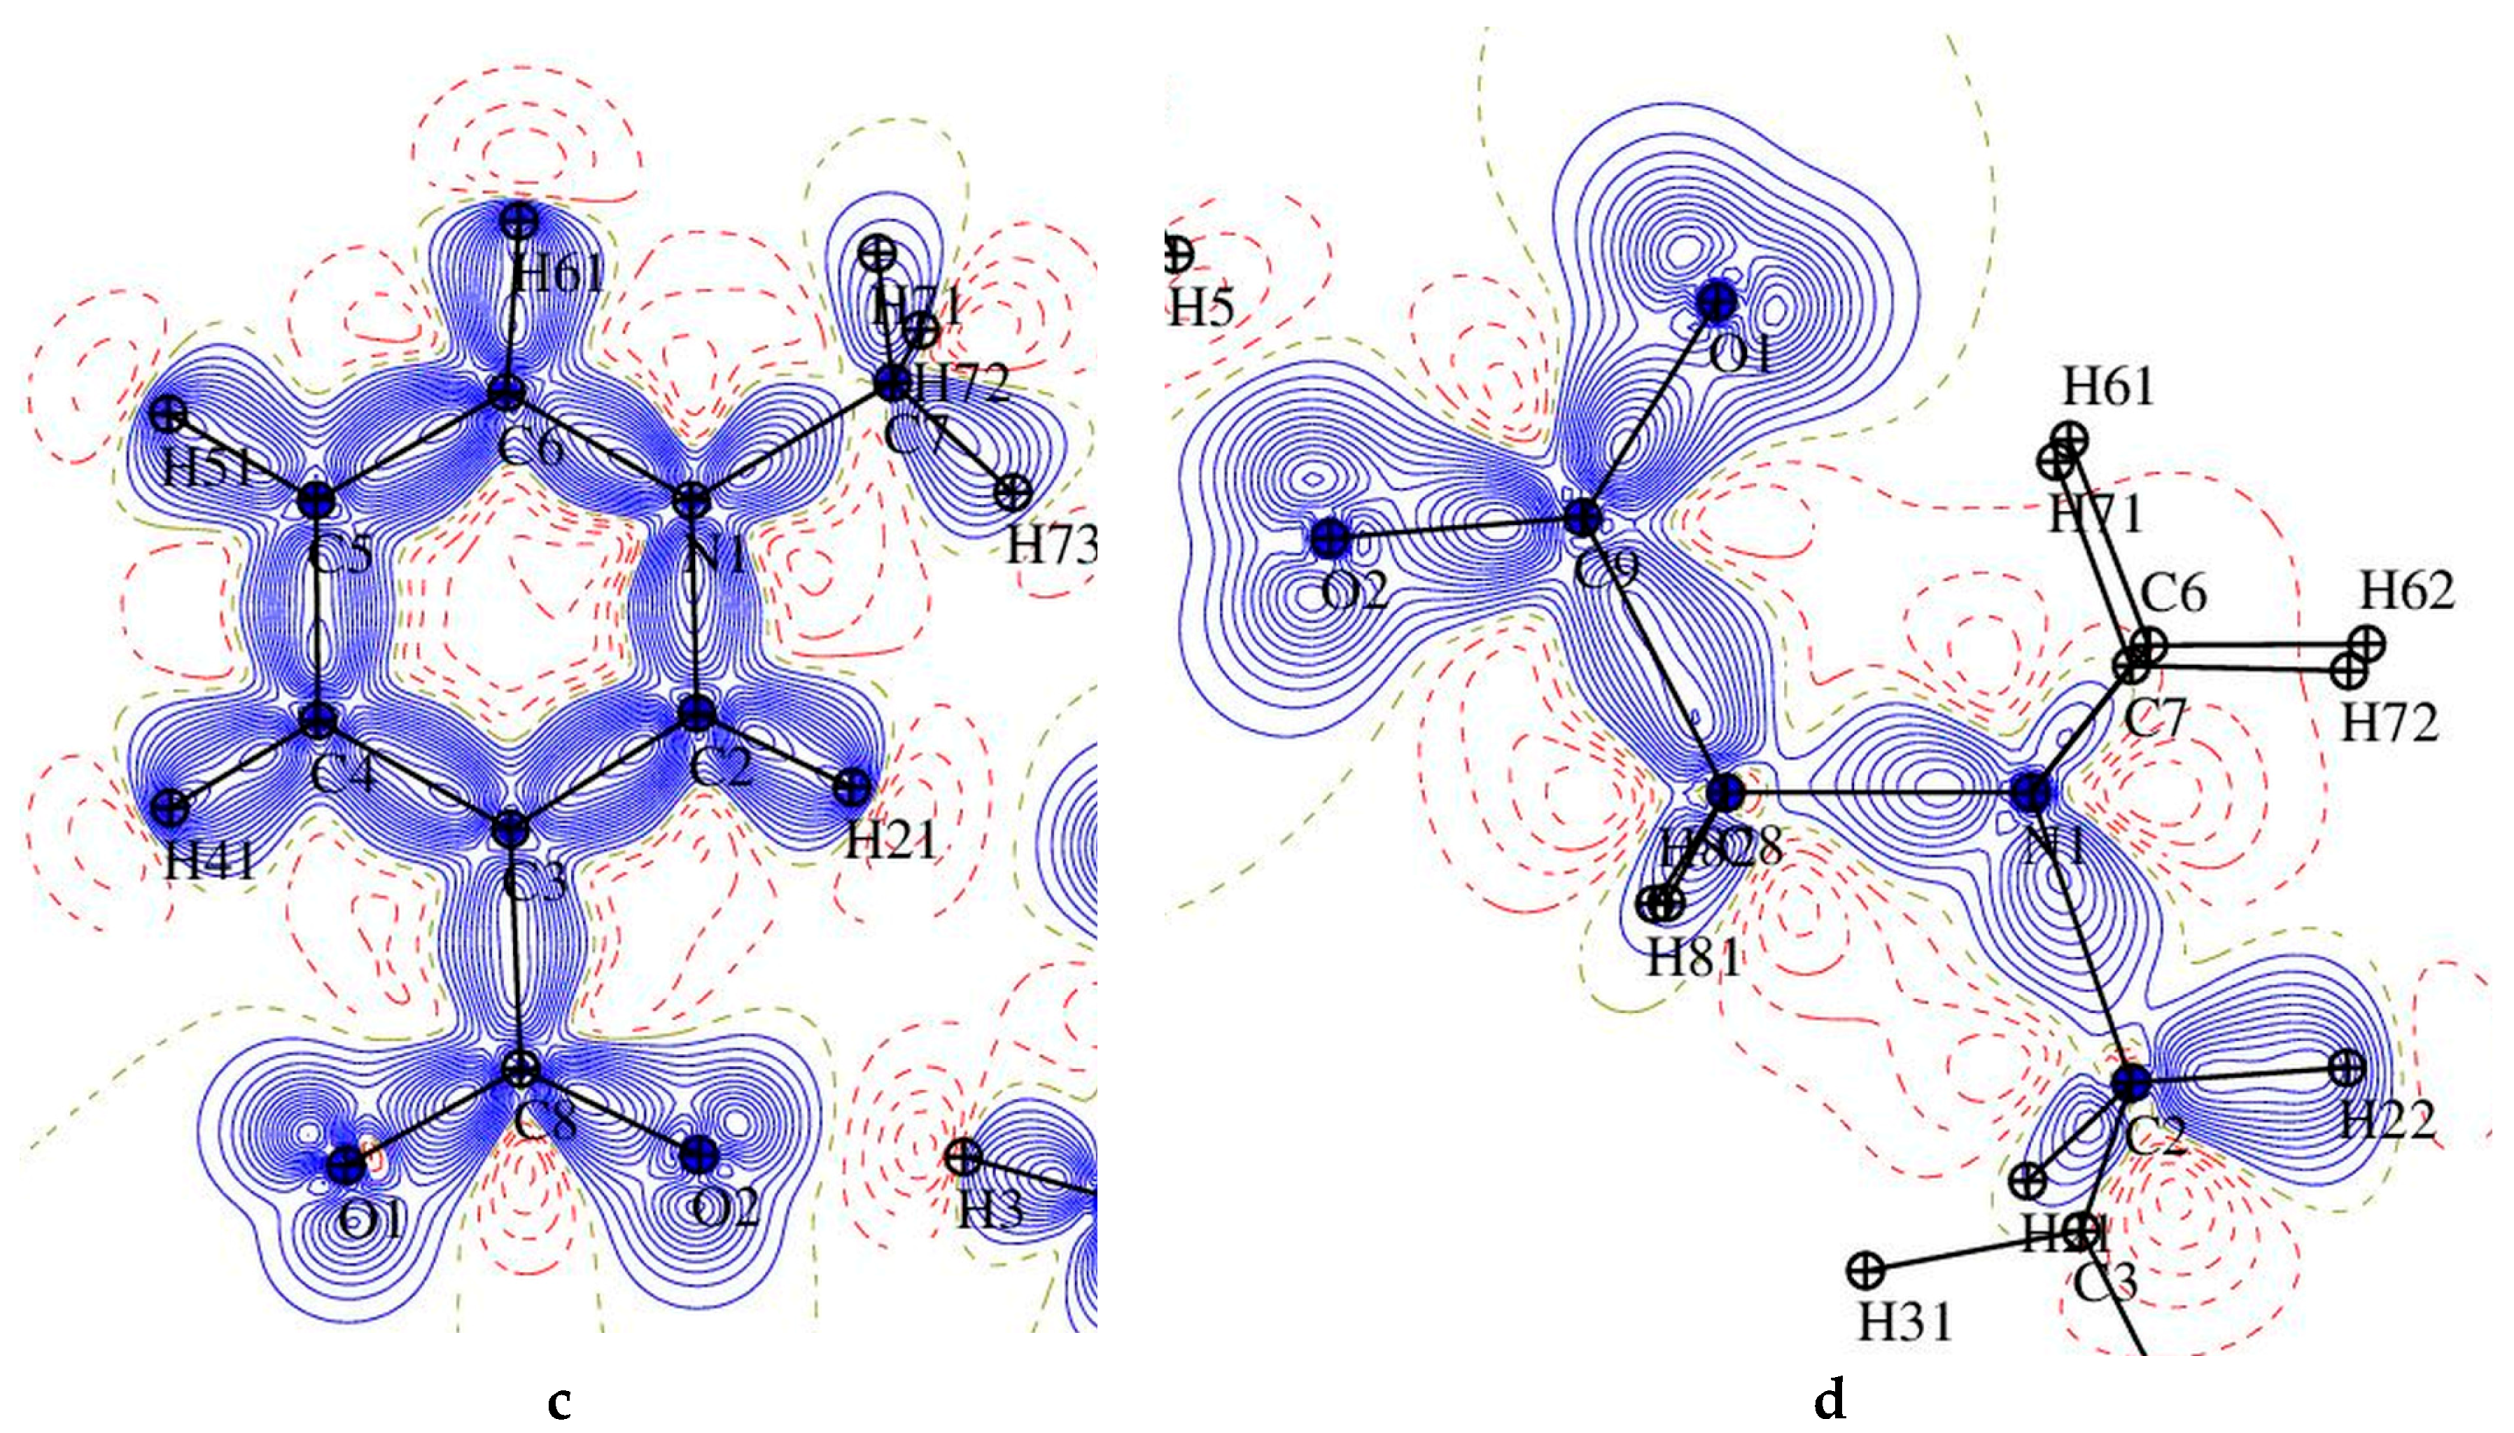
Figure 6.
The static deformation electron density distribution for 1 (left) and 2 (right): hydroxybenzoic acid (a,b), pyridine ring (c) and O1-C9-O2 plane (d), the positive (blue) and negative (dashed red) contours are drawn at intervals 0.05 e Å−3.
Figure 6.
The static deformation electron density distribution for 1 (left) and 2 (right): hydroxybenzoic acid (a,b), pyridine ring (c) and O1-C9-O2 plane (d), the positive (blue) and negative (dashed red) contours are drawn at intervals 0.05 e Å−3.
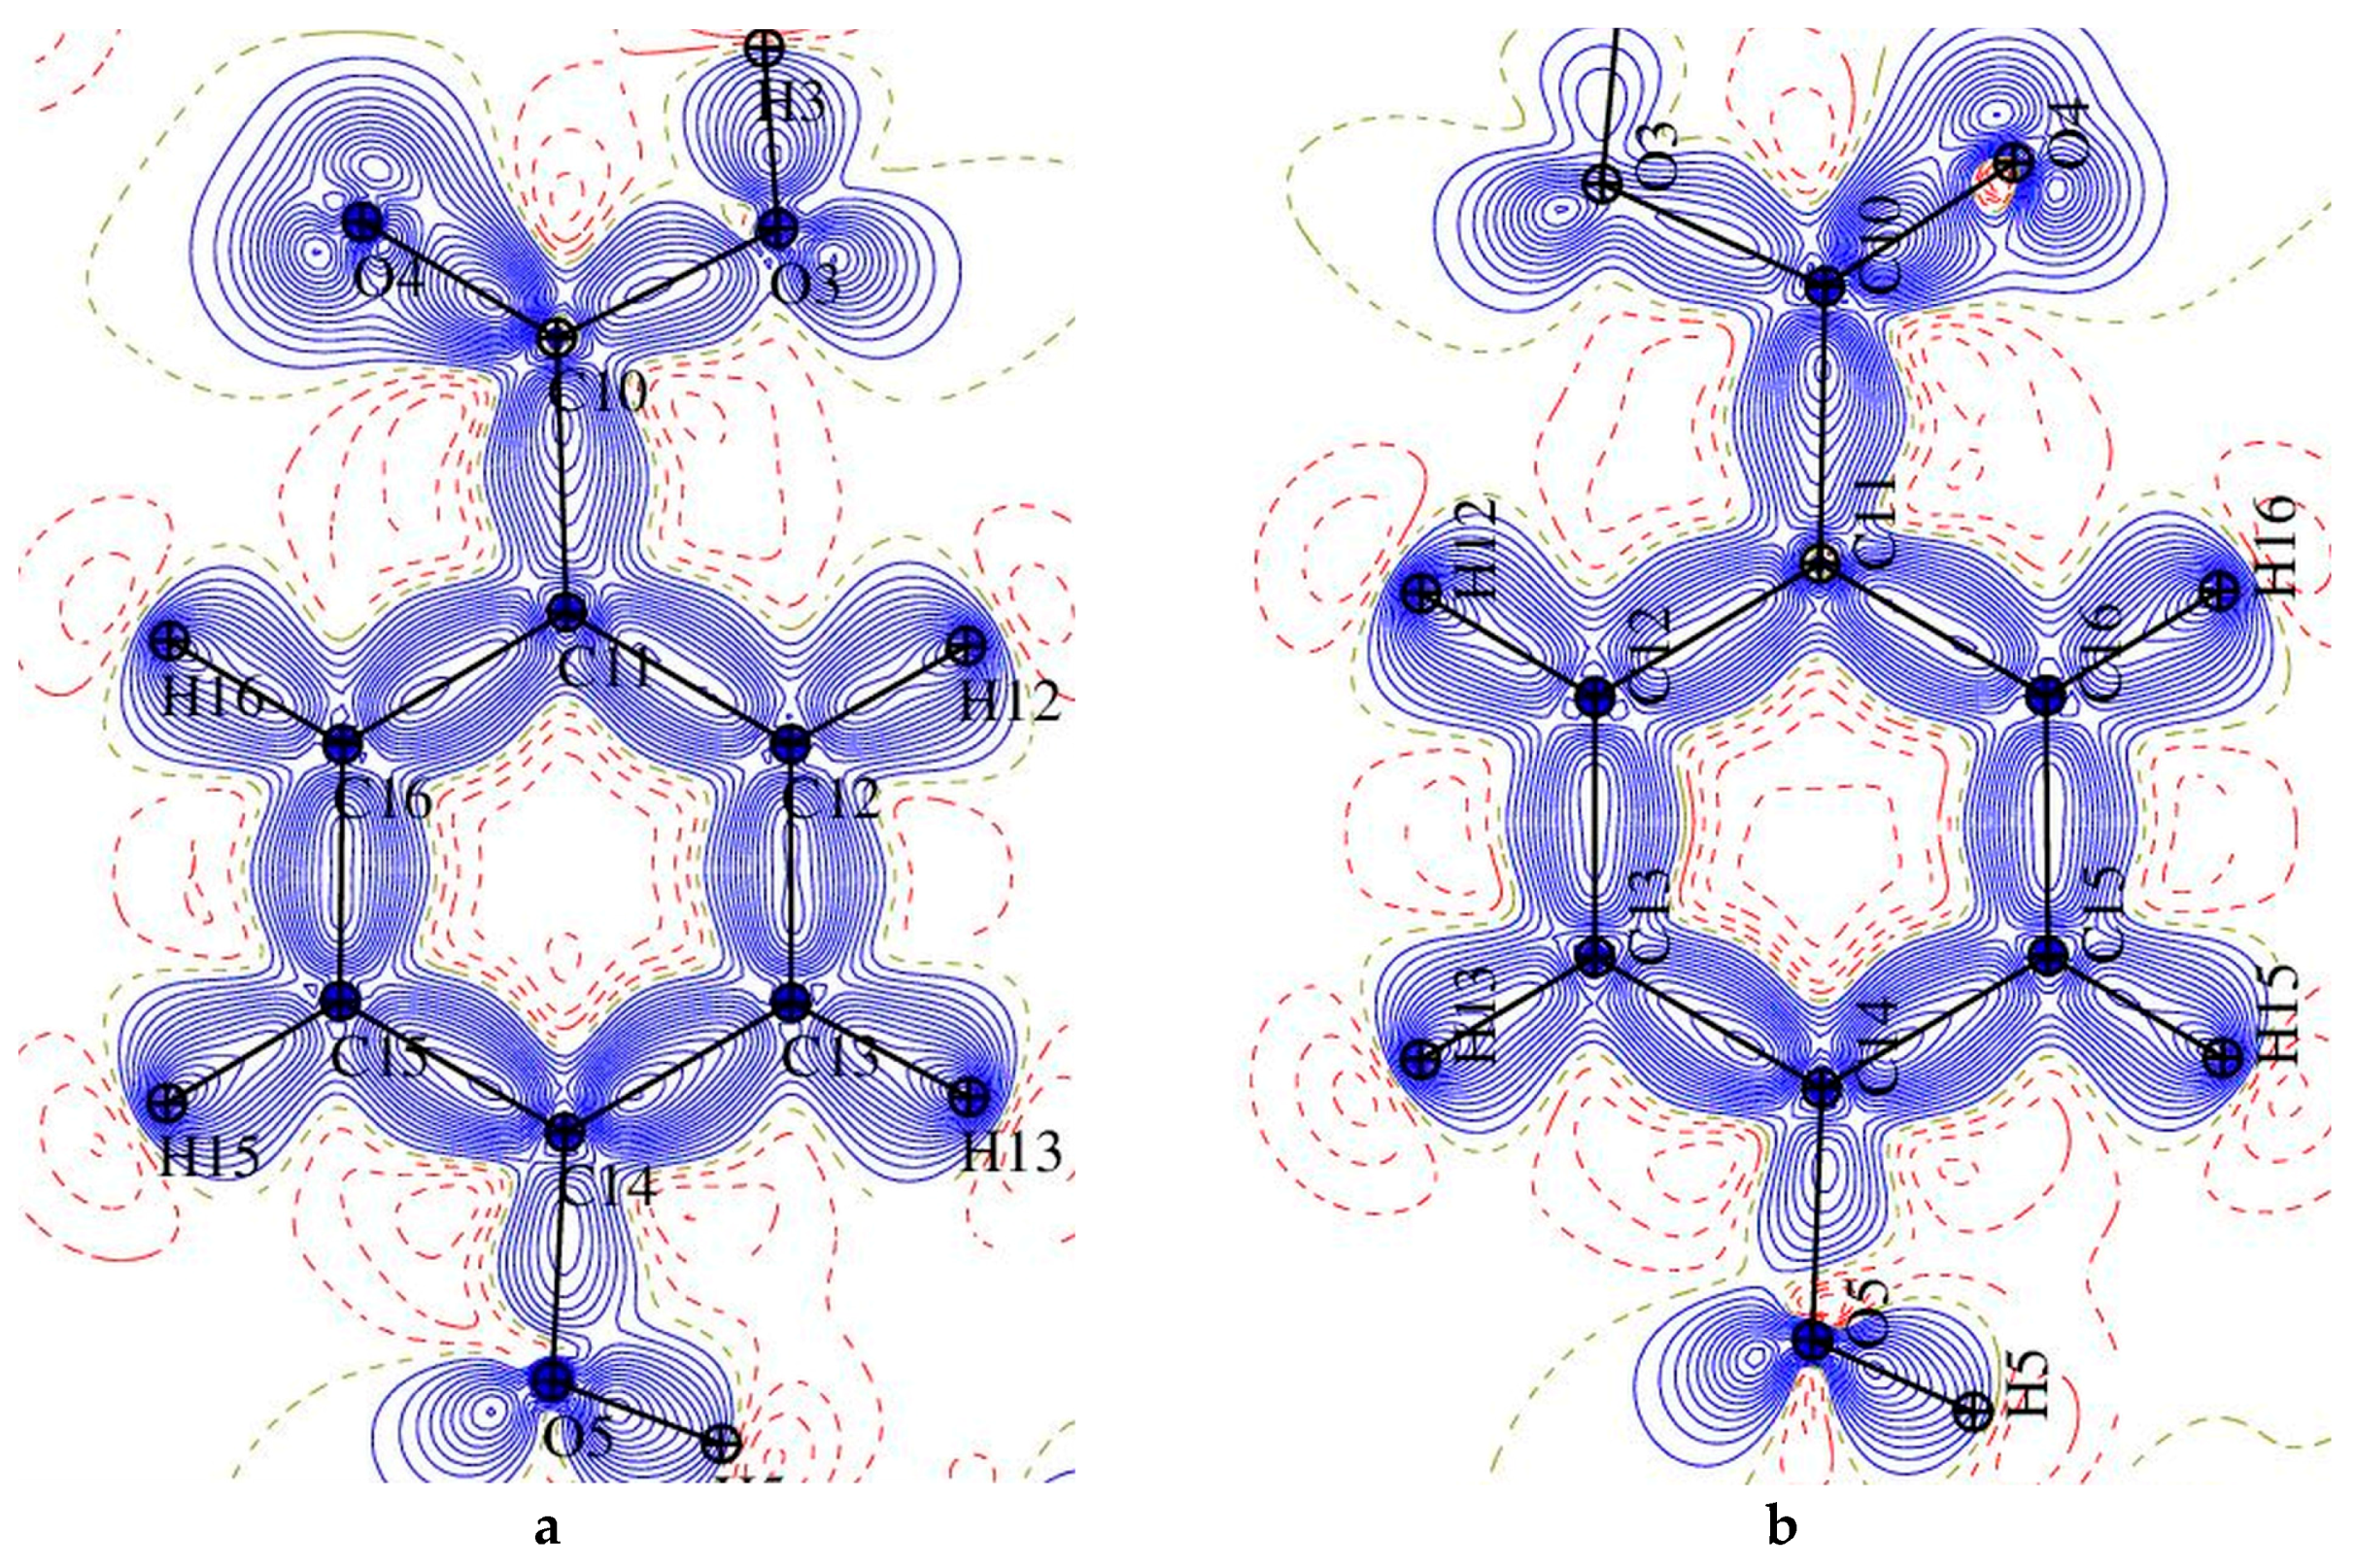

Figure 7.
Atomic charges (e) obtained by integration over atomic basins for trigonelline (1), N-methylpiperidine betaine (2), and p-hydroxybenzoic acid (HBA) for both complexes.
Figure 7.
Atomic charges (e) obtained by integration over atomic basins for trigonelline (1), N-methylpiperidine betaine (2), and p-hydroxybenzoic acid (HBA) for both complexes.
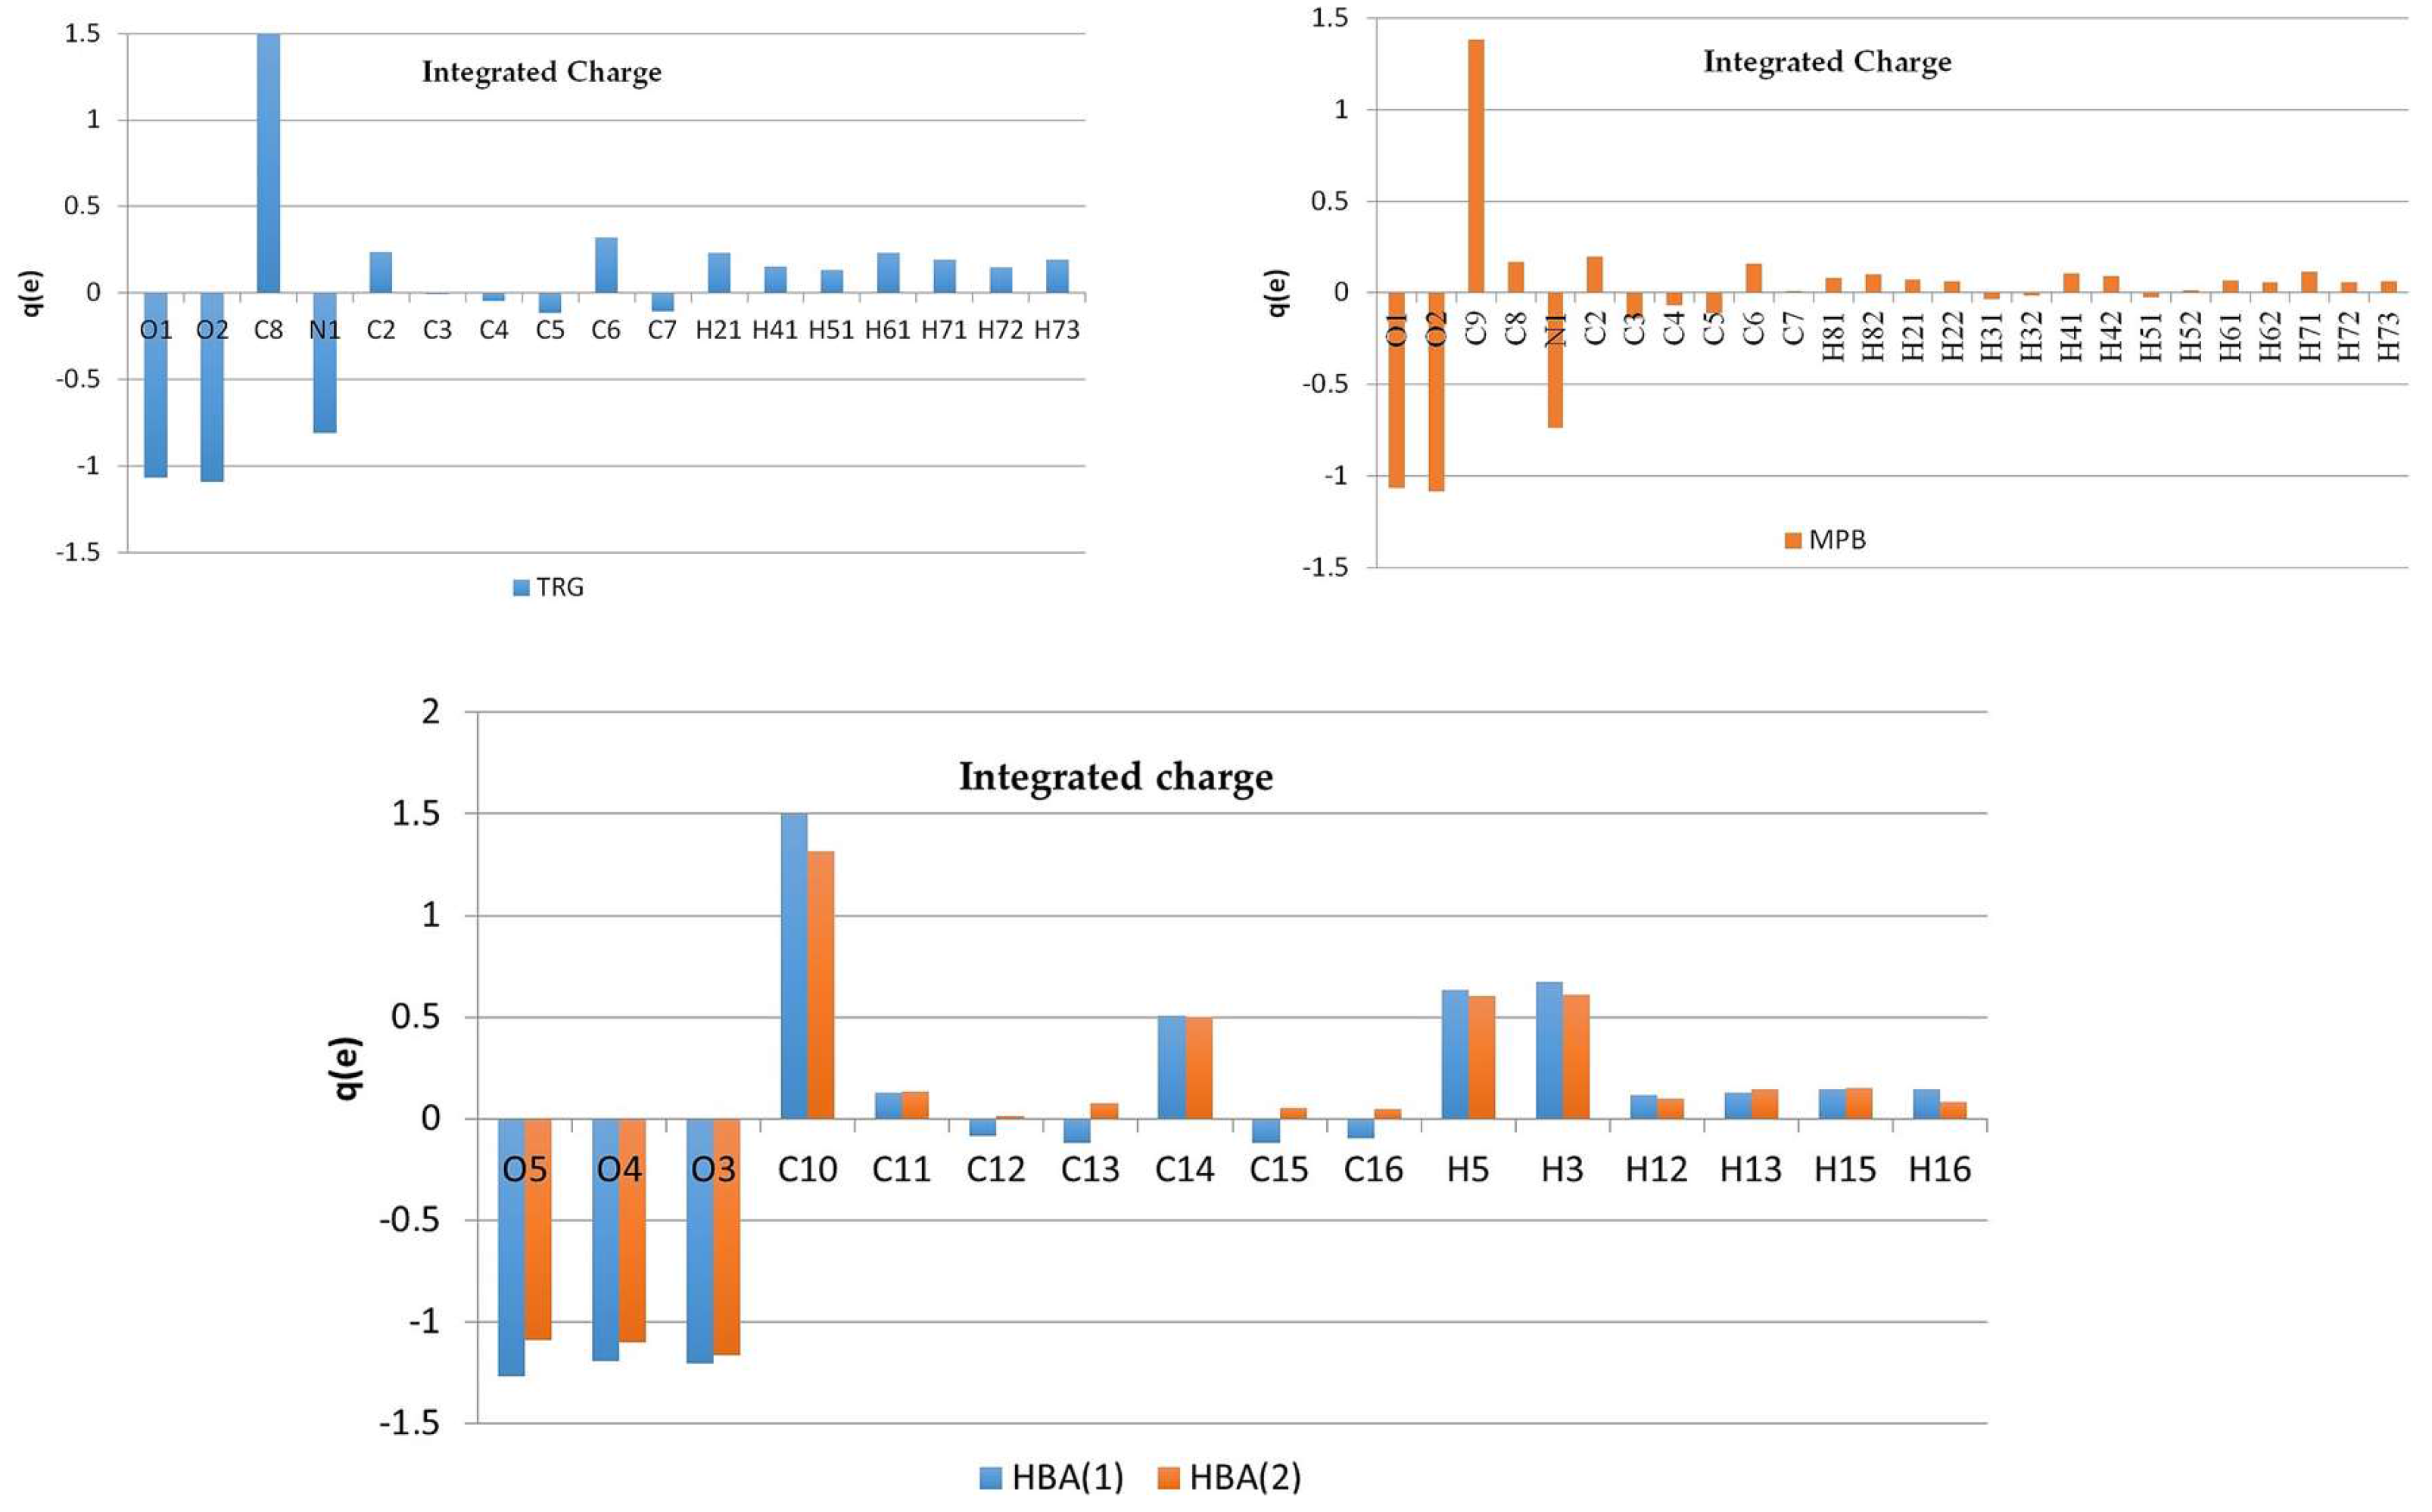
Figure 8.
Combined atomic charges for selected groups in 1 (left) and 2 (right).
Figure 9.
OH···O interaction, bond path and associated critical point in 1 (left) and 2 (right).

Figure 10.
Representation of O-H···O hydrogen bonds in Laplacian maps for 1 O5-H5···O1W plane (a), O1W-H2W···O1 plane (b) and for 2 O5-H5···O2 plane (c), O3-H3···O1 plane (d), logarithmic contours in e Å−5. Red and blue contours denote positive and negative values, respectively.
Figure 10.
Representation of O-H···O hydrogen bonds in Laplacian maps for 1 O5-H5···O1W plane (a), O1W-H2W···O1 plane (b) and for 2 O5-H5···O2 plane (c), O3-H3···O1 plane (d), logarithmic contours in e Å−5. Red and blue contours denote positive and negative values, respectively.
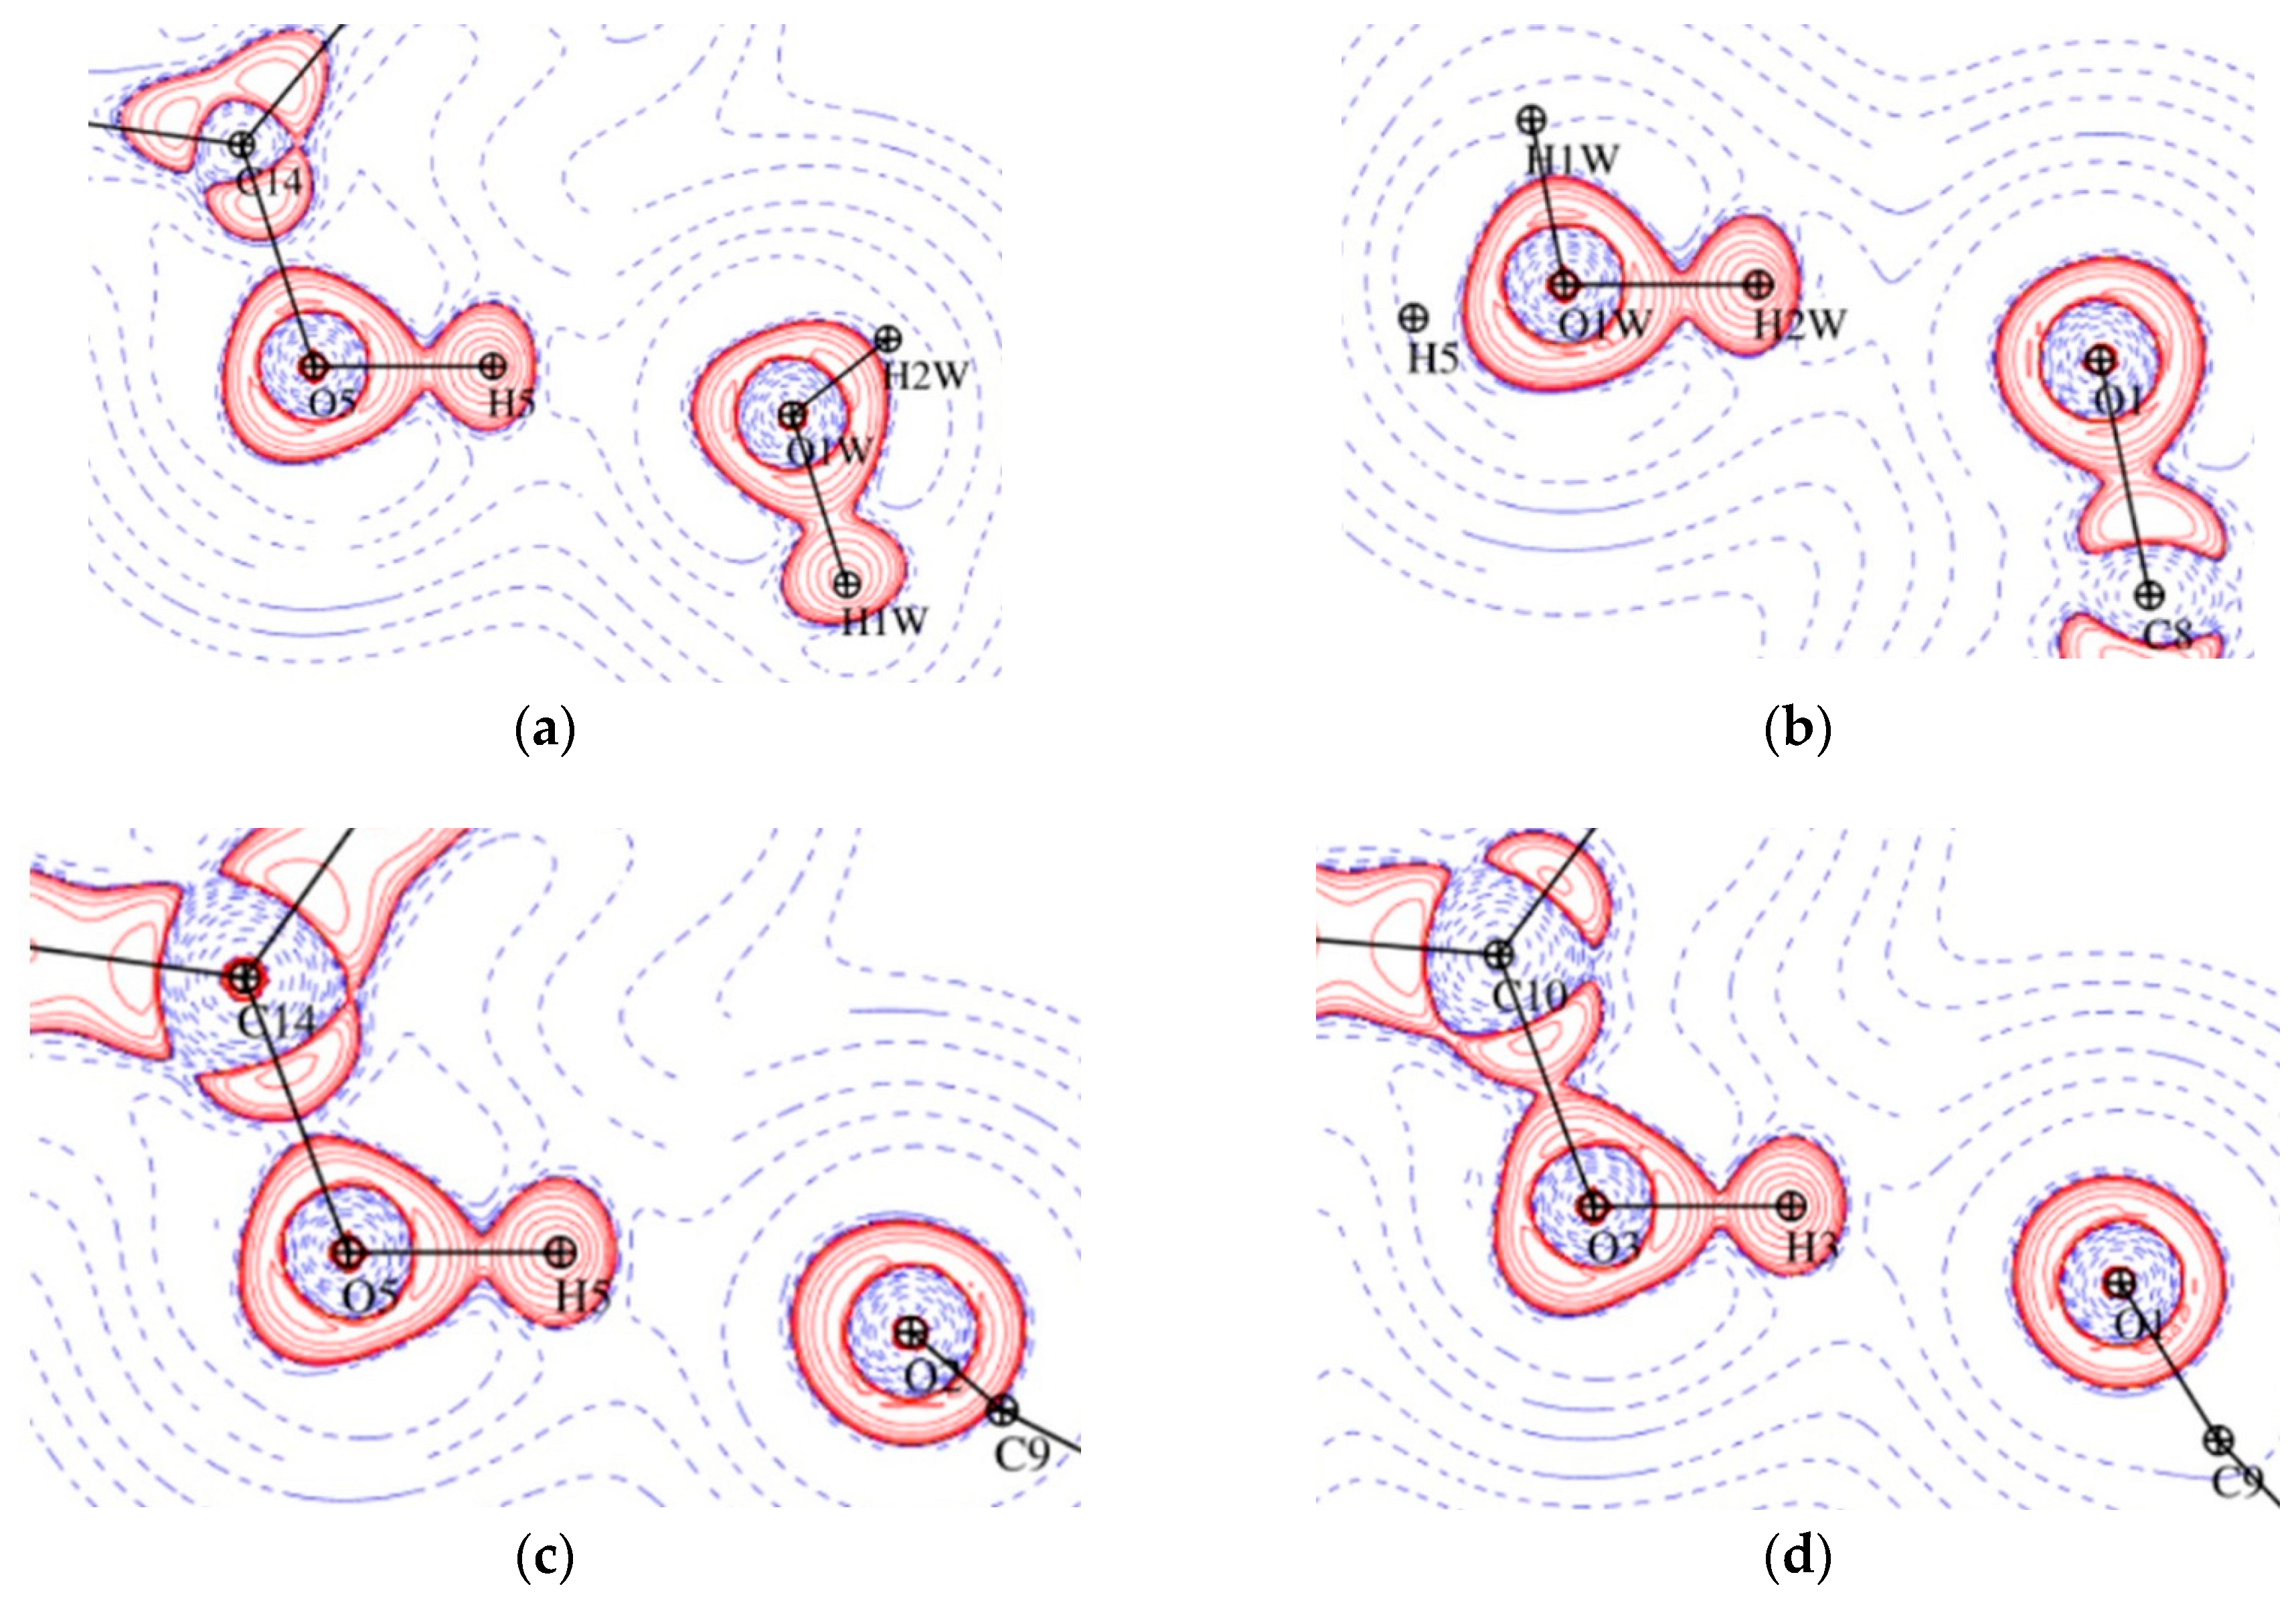
Figure 11.
Bond path and associated critical point for C-H···O intermolecular hydrogen bonds in 1 (a) and intramolecular hydrogen bonds in 2 (b). Representation of C7-H73···O4 (c) and C7-H71···O1 (d) hydrogen bonds in total static density gradient maps.
Figure 11.
Bond path and associated critical point for C-H···O intermolecular hydrogen bonds in 1 (a) and intramolecular hydrogen bonds in 2 (b). Representation of C7-H73···O4 (c) and C7-H71···O1 (d) hydrogen bonds in total static density gradient maps.

Figure 12.
Bond path and associated critical point between aromatic rings in 1 (left) and 2 (right).
Figure 12.
Bond path and associated critical point between aromatic rings in 1 (left) and 2 (right).

Figure 13.
Plots of ρ(CP) vs. Rij for intermolecular interaction OH∙·∙O, CH·∙·O in 1 (a), in 2 (b) and for all interactions in 1 (c) and in 2 (d).
Figure 13.
Plots of ρ(CP) vs. Rij for intermolecular interaction OH∙·∙O, CH·∙·O in 1 (a), in 2 (b) and for all interactions in 1 (c) and in 2 (d).

Figure 14.
Experimental electrostatic potential mapped onto 0.1 isodensity surfaces of molecule 1 (left) and 2 (right).
Figure 14.
Experimental electrostatic potential mapped onto 0.1 isodensity surfaces of molecule 1 (left) and 2 (right).


Table 1.
Crystallographic measurement and refinement data.
| 1 : TRG·HBA·H2O | 2 : MPB·HBA | |
|---|---|---|
| Formula | C7H7NO2·C7H6O3·H2O | C8H15NO2·C7H6O3 |
| Formula weight | 293.27 | 295.32 |
| Crystal system | monoclinic | triclinic |
| Space group | P21/c | P-1 |
| Temperature (K) | 100(1) | 100(1) |
| a (Å) | 14.2084(2) | 6.0511(1) |
| b (Å) | 6.63080(10) | 10.5600(2) |
| c (Å) | 14.5338(2) | 11.9819 |
| α (°) | 90 | 109.277 |
| β (°) | 102.3460(10) | 95.580 |
| γ(°) | 90 | 99.312 |
| V(A−3) | 1337.61(3) | 703.80(2) |
| Z | 4 | 2 |
| dx(g cm3) | 1.456 | 1.394 |
| μ(mm−1) | 0.115 | 0.104 |
| Resolution range (Å−1) | 0.083–1.13 | 0.044–1.135 |
| Reflections no. | 130790 | 88546 |
| Unique reflections (Rint) | 16,121/0.039 | 17,111/0.031 |
| IAM Refinement | ||
| No. of parameter | 250 | 274 |
| R1 [I > 2σ(I)] | 0.0358 | 0.0378 |
| wR2(F2) [I > 2σ(I)] | 0.01049 | 0.01034 |
| S | 1.057 | 1.105 |
| Δρmax, Δρmin (e Å−3) | −0.27/0.62 | −0.32/0.66 |
| Multipolar Refinement | ||
| No. of parameter | 657 | 652 |
| R1 [I > 2σ(I)] | 0.0211 | 0.0268 |
| wR2(F2) [I > 2σ(I)] | 0.0415 | 0.0561 |
| S | 1.018 | 1.26 |
| Δρmax/Δρmin (e Å−3) | −0.27/0.30 | −0.30/0.30 |
Table 2.
Distances and topological characteristic of the bond critical points (BCPs) in 1 and 2.
| Atom1 | Atom2 | Symmetry | G(rCP) | V(rCP) | D12 [Å] | D1cp [Å] | D2cp [Å] | ρtot [e/Å3] | ∇2ρ [e/Å5] | Type |
|---|---|---|---|---|---|---|---|---|---|---|
| TRG·HBA | ||||||||||
| O1W | H5 | x, y, z | 124.16 | −119.75 | 1.658 | 1.118 | 0.5415 | 0.2843 | 4.72 | OH···O |
| O2 | H3 | x, y, z | 110.91 | −102.23 | 1.6714 | 1.1206 | 0.5544 | 0.2507 | 4.39 | OH···O |
| O1 | H2W | 1−x, 1−y, 1−z | 91.07 | −66.07 | 1.7664 | 1.1893 | 0.5958 | 0.153 | 4.26 | OH···O |
| O1 | H1W | 1+x, −½+y, ½+z | 86.45 | −61.74 | 1.7917 | 1.1998 | 0.6009 | 0.1438 | 4.08 | OH···O |
| O4 | H21 | x, y, z | 41.83 | −30.24 | 2.0795 | 1.3177 | 0.7708 | 0.0953 | 1.96 | CH···O |
| O2 | H61 | x, 3/2−y, ½+z | 21.11 | −15.61 | 2.434 | 1.4289 | 1.0379 | 0.066 | 0.98 | CH···O |
| O3 | H71 | x, 3/2−y, ½+z | 18.54 | −13.26 | 2.3997 | 1.4565 | 0.9597 | 0.0573 | 0.87 | CH···O |
| O4 | H73 | 1−x, −½+y, ½+z | 15.48 | −10.82 | 2.4728 | 1.4745 | 1.0282 | 0.049 | 0.74 | CH···O |
| O1 | H61 | x, 3/2−y, ½+z | 15.2 | −10.6 | 2.639 | 1.5289 | 1.1303 | 0.0482 | 0.73 | CH···O |
| MPB·HBA | ||||||||||
| O2 | H5 | x, y, z | 133.68 | −133.94 | 1.6474 | 1.111 | 0.5371 | 0.3113 | 4.9 | OH···O |
| O1 | H3 | 1−x, 1−y, 2−z | 122.85 | −121.63 | 1.6591 | 1.1057 | 0.5541 | 0.2917 | 4.55 | OH···O |
| O1 | H61 | x, y, x | 38.36 | −30.99 | 2.2026 | 1.3184 | 0.9141 | 0.1097 | 1.68 | CH···O |
| O1 | H71 | x, y, z | 35.39 | −28.57 | 2.2513 | 1.3394 | 0.9383 | 0.1036 | 1.57 | CH···O |
| O5 | H82 | −1+x, y, z | 23.15 | −15.95 | 2.3161 | 1.429 | 0.9132 | 0.0605 | 1.11 | CH···O |
| O4 | H73 | 2−x, 1−y, 2−z | 17.19 | −12.16 | 2.6461 | 1.4505 | 1.2317 | 0.0535 | 0.82 | CH···O |
Table 3.
Distances and topological characteristic of the BCPs in 1 and 2.
| Atom1 | Atom2 | Symmetry | G(rCP) | V(rCP) | D12 [Å] | D1cp [Å] | D2cp [Å] | ρtot [e/Å3] | ∇2 [e/Å5] | Type |
|---|---|---|---|---|---|---|---|---|---|---|
| TRG·HBA | ||||||||||
| C3 | C15 | 1−x, 1/2+y, 3/2−z | 9.96 | −7.21 | 3.3639 | 1.7209 | 1.7724 | 0.0434 | 0.48 | π∙∙∙π |
| N1 | C13 | 1−x, 1/2+y, 3/2−z | 10.69 | −7.71 | 3.3188 | 1.6661 | 1.7204 | 0.0418 | 0.5 | π∙∙∙π |
| C12 | H72 | 1−x, 1/2+y, 3/2−z | 9.96 | −7.21 | 2.8404 | 1.6590 | 1.1877 | 0.0403 | 0.47 | CH∙∙∙π |
| C3 | C14 | 1−x, 1/2+y, 3/2−z | 9.52 | −6.91 | 3.3768 | 1.6953 | 1.6859 | 0.0395 | 0.45 | π∙∙∙π |
| MPB·HBA | ||||||||||
| H16 | H52 | x, y, z+1 | 13.66 | −10.16 | 2.2868 | 1.2019 | 1.0928 | 0.0513 | 0.63 | H∙∙∙H |
| C13 | H31 | 1−x, −y, 1−z | 14.06 | −10.19 | 2.6137 | 1.5459 | 1.0858 | 0.0498 | 0.66 | CH∙∙∙C |
| C15 | O3 | 1−x, 1−y, 2−z | 9.57 | −6.51 | 3.2854 | 1.6220 | 1.7682 | 0.0346 | 0.46 | C∙∙∙O |
© 2018 by the authors. Licensee MDPI, Basel, Switzerland. This article is an open access article distributed under the terms and conditions of the Creative Commons Attribution (CC BY) license (http://creativecommons.org/licenses/by/4.0/).
Share and Cite
MDPI and ACS Style
Owczarzak, A.; Kubicki, M. Experimental Electron Density Distribution in Two Cocrystals of Betaines with p-Hydroxybenzoic Acid. Crystals 2018, 8, 132. https://doi.org/10.3390/cryst8030132
AMA Style
Owczarzak A, Kubicki M. Experimental Electron Density Distribution in Two Cocrystals of Betaines with p-Hydroxybenzoic Acid. Crystals. 2018; 8(3):132. https://doi.org/10.3390/cryst8030132
Chicago/Turabian StyleOwczarzak, Agata, and Maciej Kubicki. 2018. "Experimental Electron Density Distribution in Two Cocrystals of Betaines with p-Hydroxybenzoic Acid" Crystals 8, no. 3: 132. https://doi.org/10.3390/cryst8030132
Note that from the first issue of 2016, this journal uses article numbers instead of page numbers. See further details here.