Zinc Oxide Nanostructures: From Chestnut Husk-Like Structures to Hollow Nanocages, Synthesis and Structure


NIS (Nanostructured Interfaces and Surfaces) Inter-Departmental Centre, University of Torino, Via P. Giuria 7, Consorzio INSTM (UdR of Torino), I-10125 Torino, Italy
*
Author to whom correspondence should be addressed.
Crystals 2018, 8(4), 153; https://doi.org/10.3390/cryst8040153
Submission received: 1 March 2018
/
Revised: 14 March 2018
/
Accepted: 28 March 2018
/
Published: 30 March 2018
Abstract
:Tailor-made nanostructured ZnO cages have been catalytically grown on Au and Pt films covering silicon substrates, by a controlled evaporation process, which means an accurate choice of temperatures, times, gas flows (He in the heating, He/air during the synthesis), and Au/Pt film thickness. The effect of the process parameters affecting the morphology and the structure of the obtained materials has been investigated by XRD analysis, scanning electron microscopy (SEM) and atomic force microscopy (AFM) microscopies, and FTIR spectroscopies. In particular, the role of the synthesis temperature in affecting the size and shape of the obtained ZnO cages has been highlighted. It will be shown that by adopting higher temperatures, the protruding nanowhiskers several microns in length, covering the cages and exhibiting both basal and prismatic faces, change into very thin and narrow structures, with extended prismatic faces, prevailing with respect to the basal ones. At an even higher process temperature, the building up of Au particles aggregates inside and/or anchored to the walls of the hollow cages, without any evidence of elongated ZnO nanostructures will be highlighted. From FTIR spectra information on lattice modes of the investigated ZnO, materials have been obtained.

1. Introduction
Nanocrystalline materials have attracted an increasing interest, because of their interesting properties and wide applications in many fields of science. In the last years, many studies have been focused on both the synthesis [1] and the morphological-structural characterization of new functional materials to use in post-synthesis treatments (deposition on substrates, blending with polymers, building up of two-dimensional (2D)/three-dimensional (3D) lattices with control of the properties at nanoscopic level) [2,3,4,5]. As a matter of fact, nanocrystals represent a class of materials, with enhanced properties and innovative functionalities (i.e., electrical, electronic, optical, mechanical, thermal, magnetic, catalytic, photocatalytic, etc.) [6,7,8].
The control of the sizes, shape, and orientation together with the porosity and the surface area of nano/microcrystallites, grown as three-dimensionally organized systems on different types of substrates, represent the main task to design the new generations of smart and functional materials, with specific properties [9,10,11,12]. It is well known that decreasing the particle size is one effective way to greatly increase the specific surface area of the materials; alternatively, to increase the porosity and the surface area, materials with micro-/mesopores may be designed. The common synthetic techniques are based on solution chemistry or the template methods. Hence, by starting from aqueous precursors in solution and by monitoring thermodynamics and kinetics of nucleation and growth, metal oxides with controlled size, morphology, and porosity have been obtained [13,14]. At the same time, the recent development of heterogeneous phase methods by means of suitable/proper catalysts represents a promising alternative for the synthesis of different structures from the nanometer to micrometer scale [15,16]. In certain nanostructures, formed by self-assembly of size and shape-controlled nanocrystals, such as one-dimensional arrays, nanowires, nanohelixes, nanorings, polyhedral nanocages, and shells have been demonstrated for a wide range of metallic, semiconductors, and oxide materials [17].
Among the many functional oxides with perovskite, rutile, spinel, and wurtzite structures, ZnO is a challenging material due to its peculiar character of the catalytically active system alone or as support for many catalytically active metals. Therefore, tailor-made ZnO-based materials having new morphology, and, in particular, highly porous and well-defined anisotropic frameworks are challenging for fundamental studies, as well as for industrial and high-tech applications in many fields [18].
Due to its wide band-gap (3.37 eV), high excitonic binding energy, and high breakdown strength, ZnO can be relevant also for electronic and photonic devices, as well as for high-frequency applications [19].
Up to now, ZnO nanostructures with various morphologies, including prismatic, needle-like, ellipsoidal, tetrapod-like, nanorod, nanofiber, nanobelts, and nanotubes, have been widely investigated and have been prepared through different physical and chemical approaches [4,20,21,22,23].
As it is well known, ZnO, having the thermodynamically stable crystal structure of wurtzite, ionic, and polar in nature, can be described as a hexagonal close packing of oxygen and zinc atoms, in tetrahedral sites, which gives rise to the typical crystal habit, exhibiting basal polar planes (0001), (000-1) and low-index unpolar faces parallel to the c-axes [4]. Some more the ‘low symmetry’ unpolar faces are the most stable ones, with the polar ones being metastable. On the basis of these features, it is possible to design ZnO nanostructures, which are highly heterogeneous in size and shape, where the observed surface metastability of the polar faces could explain the building up of hollow structures [24]. In such a case, the control of the single structures, which evolve from clusters/ultrasmall nanoparticles (~2 nm in size) [25] to bi-dimensional [26], and finally three-dimensional ones, can be achieved by tuning in a selective way the process parameters, like temperature, the growth time, the ratio between zinc vapour pressures, and oxygen partial pressure. The vapour-liquid-solid (VLS) method has been successfully used to make new nanostructures, having high porosity and dimensions in the 100 μm–1 mm range with a diameter of 50–500 nm, which can be suitable for applications in sensing, catalysis, and filtering [22]. Among these, mesoporous and structured polyhedral cages/shells that were formed by self-assembly of ZnO nanocrystals have been synthesized at high yield and purity, through a process following the solidification of the Zn liquid droplets, surface oxidation, and sublimation. The approach to the synthesis of self-assembled nanostructures allows for obtaining cage/shell shapes with walls that were composed of textured ZnO nanocrystals, having the predominant presence of prismatic faces. In particular, the relevance of such surfaces delimiting the obtained structures is based on the known ability of zinc and oxygen couples, located on (10-10) and (11-20) prismatic faces of ZnO, coming from the combustion of metal Zn, to dissociate hydrogen with the formation of reversibly adsorbed Zn-H and O-H surface species [27,28,29]. Nevertheless, the low surface area of ZnO, obtained from combustion of Zn, (BET surface area: 10 m2·g−1) does not allow for reaching a reasonable H/ZnO ratio, which is the only factor which could make ZnO/H2 system interesting not only for hydrogen storage, but also for catalytic purposes. In order to meet these requirements, many efforts have been made to produce high surface area ZnO-based materials. The systematic investigation in our laboratories of systems obtained from oxalates, citrates, carbonates, both pure and SiO2 supported, proved ineffective in hydrogen adsorption, probably because of their ill-defined morphology and the associated negligible proportion of prismatic faces. More in general, even starting from Zn(OH)2 as a precursor, the surface reactivity of the obtained oxides appears to be quite different when compared to the one of ZnO, coming from the combustion of metal Zn. This means that only the Zn-O couples that are present on extended and prismatic (10-10) and (11-20) faces are able to dissociate hydrogen, where a cooperative mechanism between surface zinc and oxygen species could be hypothesized to cause the hydrogen molecule polarization and then its consequent breaking. It must be underlined that the ability of prismatic faces to become covered by reversibly adsorbed H2 at room temperature, makes ZnO unique among the oxidic systems, (like MgO, Al2O3, SiO2, etc.) [28,29,30,31,32], which are known to dissociate hydrogen only at rare defective sites [33].
Along these themes, the design of ZnO-based nanostructures, grown on different substrates, could represent a relevant task to fulfil and enhance the multi-functionality requirements, i.e., high surface area and the ability toward hydrogen dissociation. To the best of our knowledge, no systematic studies are reported in the literature for the Pt-catalyzed growth of ZnO nanostructures, and this research wants to contribute to highlighting the role that is played by the catalyst.
2. Materials and Methods
2.1. Materials Synthesis
ZnO microcages have been synthesized by means of a solid-vapor process at moderate temperatures (700–900 °C) and at atmospheric pressure. Zn powders (1–10 μm in size) were used as source materials. About 0.9–1.0 g of Zn powders were loaded into a quartz filter and were placed in a quartz reactor operating at atmospheric pressure between 700 and 900 °C and then oxidized on (400) Si support. With respect to the inlet pipe carrier gas, metal Zn has been placed upstream of the support in a zone of the furnace at a lower temperature (50–100 °C) than that of the support. Prior to the synthesis, the silicon substrate has been coated with Au thin films (2–10 nm range in thickness) or with Au/Pt thick films (50 nm in thickness) by magnetron sputtering process, and then placed at the centre of the furnace downstream of the Zn feedstock with respect to the inlet pipe carrier gas.
In a two-step process, at first the temperature has been increased (heating rate = 5 °C/min) from 25 °C to 700, 800 or 900 °C, respectively, under He controlled atmosphere (100 mL/min flux), and then the carrier gas has been enriched with air (25 mL/min). The materials that were obtained on Au thin films after the different thermal treatments are labelled as samples A, B, C, and D, respectively, as shown in Table S1 (Supplementary Materials), where the optimised synthesis parameters are summarized.
The materials on Au and Pt thick films are obtained at 700 °C for 3 h of reaction.
2.2. Characterization Methods
Crystal structure and phase identification of the materials have been performed by XRD analyses by means of a Philips PW3020 X-ray diffractometer operating with Co. Kα radiation in a Bragg Brentano configuration. The observed patterns have been analysed using Philips X’Pert HighScore software and were compared with standard patterns of International Centre of Diffraction Data (ICDD) and Powder Diffraction File (PDF) databases. The profile fitting method has been adopted to determine the crystal sizes and semi-quantitative data (JADE 6.5, Materials Data, Livermore, CA, USA). Since the integrated intensities of the reflections (i.e., reference intensity ratios, RIR), values are given for ICSD reference patterns with the Cu radiation, the experimental XRD patterns obtained with Co radiation, were converted before applying the profile fitting method. JCPDS cards No. #99-0056 and No. #99-0111 were used for the Au and ZnO peak fittings. Full-profile-analysis shape parameter, pseudo-Voight function, FWHM option, and shape constant k = 0.89 were adopted for the crystallite size analysis.
FTIR spectroscopy has so far been used to study the lattice modes of ZnO nanostructured cages (A sample) grown on Au/Pt films that were covering silicon substrates, when compared to Kadox ZnO particles. For this, highly porous ZnO nanocages and Kadox ZnO samples were prepared and activated by outgassing at 773 K for 1 h under a dynamic vacuum (residual pressure 10−4 Torr) inside an IR cell, which also allowed for gas dosage and low-temperature IR measurements to be carried out. In order to compensate for the oxygen loss during the thermal activation of the pellets (which makes the samples non-stoichiometric and non-transparent in the IR region), at the end of the activation period, 20 Torr of oxygen was dosed to the sample (still kept at 773 K). Then, the sample was cooled to room temperature and oxygen was removed by outgassing at room temperature to a final pressure of 10−4 Torr. The FTIR spectra in the lattice modes region of ZnO nanocages and Kadox ZnO were recorded in situ at 2 cm−1 resolution, using an IFS 28 spectrometer (Bruker, Billerica, MA, USA), equipped with a cryogenic MCT detector.
The microcrystal morphology has been investigated by means of a Evo 50 SEM instrument (Zeiss, Oberkochen, Germany) operating at 30 kV and by means of atomic force microscopy (AFM), Auto Probe LS (Park Systems, Santa Clara, CA, USA).
Large-scale images are obtained in non-contact mode regime, using ultralevers silicon conical tips with a radius of curvature of 100 Å (cantilever thickness = 2 μm; cantilever width = 28 μm; cantilever length = 85 μm; force constant = 17 N/m; and, resonant frequency = 320 kHz). The AFM images were recorded in air at room temperature.
3. Results and Discussion
The role of the process parameters, such as (i) reaction times, (ii) temperatures, and (iii) type and thickness of Au and Pt covering Si substrate, affecting the morphological and structural properties of the obtained materials, has been investigated by XRD, FTIR, and SEM, AFM analyses.
3.1. Structure from XRD Patterns and FTIR Bulk Modes
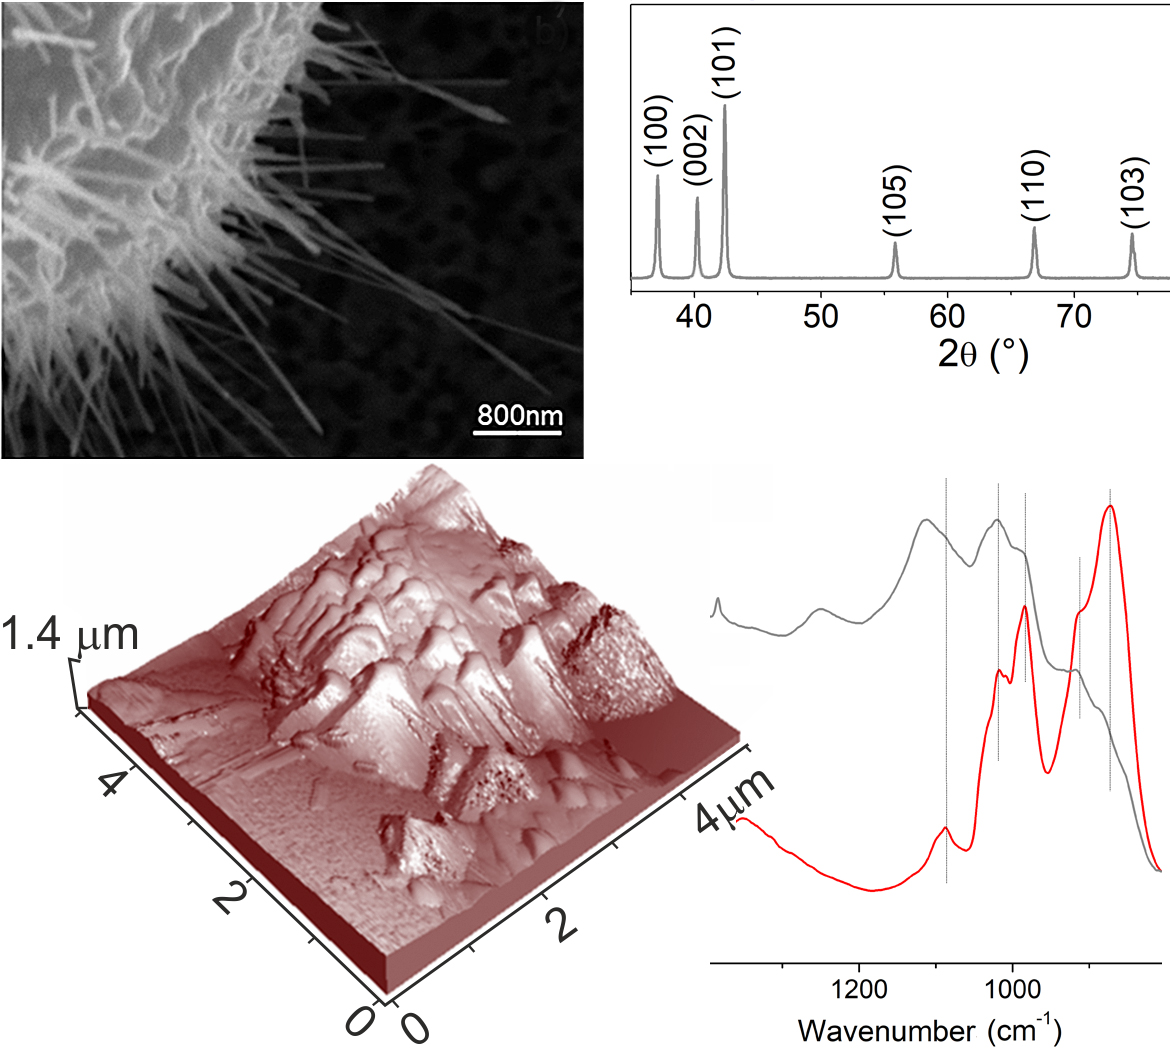
The XRD patterns of the ZnO samples grown on Au thin films, as compared to standard Zincite (wurtzite structure) (PDF No. #036-1451) and Kadox ZnO, as obtained by burning Zn powders in oxygen [34], are shown in Figure 1.
When compared to standard Zincite (PDF card No. #00-036-1451), Kadox ZnO sample (a pattern) shows a good fitting in terms of peak position and intensity ratio as well. As for XRD patterns of the samples that were synthesized at 700 °C (3 h, b pattern), (22 h, c pattern) and 800 °C (3 h, d pattern) (sample A, B, and C, respectively), it can be observed that on b and c patterns (A and B samples in Table S1), the intensity of the polar basal planes is slightly prevailing when compared to the one of the (10-10) and (10-11) prismatic faces, which means that (0002) basal planes have the main role in delimiting the ZnO cages (as will be shown in the following SEM and AFM images). Along with XRD patterns of the samples that were synthesized at 800 °C (3 h, d pattern), a remarkable decreasing of the feature due to the basal planes can be observed, thus highlighting the relevant contribution of (10-10) and (10-11) prismatic faces, and then a preferred orientation of ZnO nanocrystals (as shown in the following SEM and AFM images). Lastly, the XRD pattern of samples that were obtained at 900 °C (3 h, e pattern) (sample D in Table S1) shows the presence of Au nanocrystals with a cubic structure, with a minor contribution of ZnO crystallites.
As the peaks in the XRD pattern that are shown in Figure 1 are well-defined, without a substantial overlapping, the profile fitting method (JADE 6.5) has been adopted to determine the crystal sizes and phase composition (semi-quantitative data from RIR analysis). The results are reported in Table 1.
From the Table 1, it is clear that the mean crystallite sizes of ZnO and Au nanocrystals increase with the temperature and that the amounts of gold and ZnO (wt. %) are also determined by the temperature of oxidation. At 900 °C, Au particles in the cubic form, with sizes larger than 100 nm, become the predominant phase with a minor contribution of the ZnO phase. However, it is worth noticing that this temperature is near the boiling point of metal Zn (907 °C, 1 atm), and this fact could remarkably affect the amount of ZnO that is formed during the thermal oxidation process.
On the basis of these results, the relevant role of the oxidation temperature in affecting the composition and size of the obtained crystallites can be highlighted.
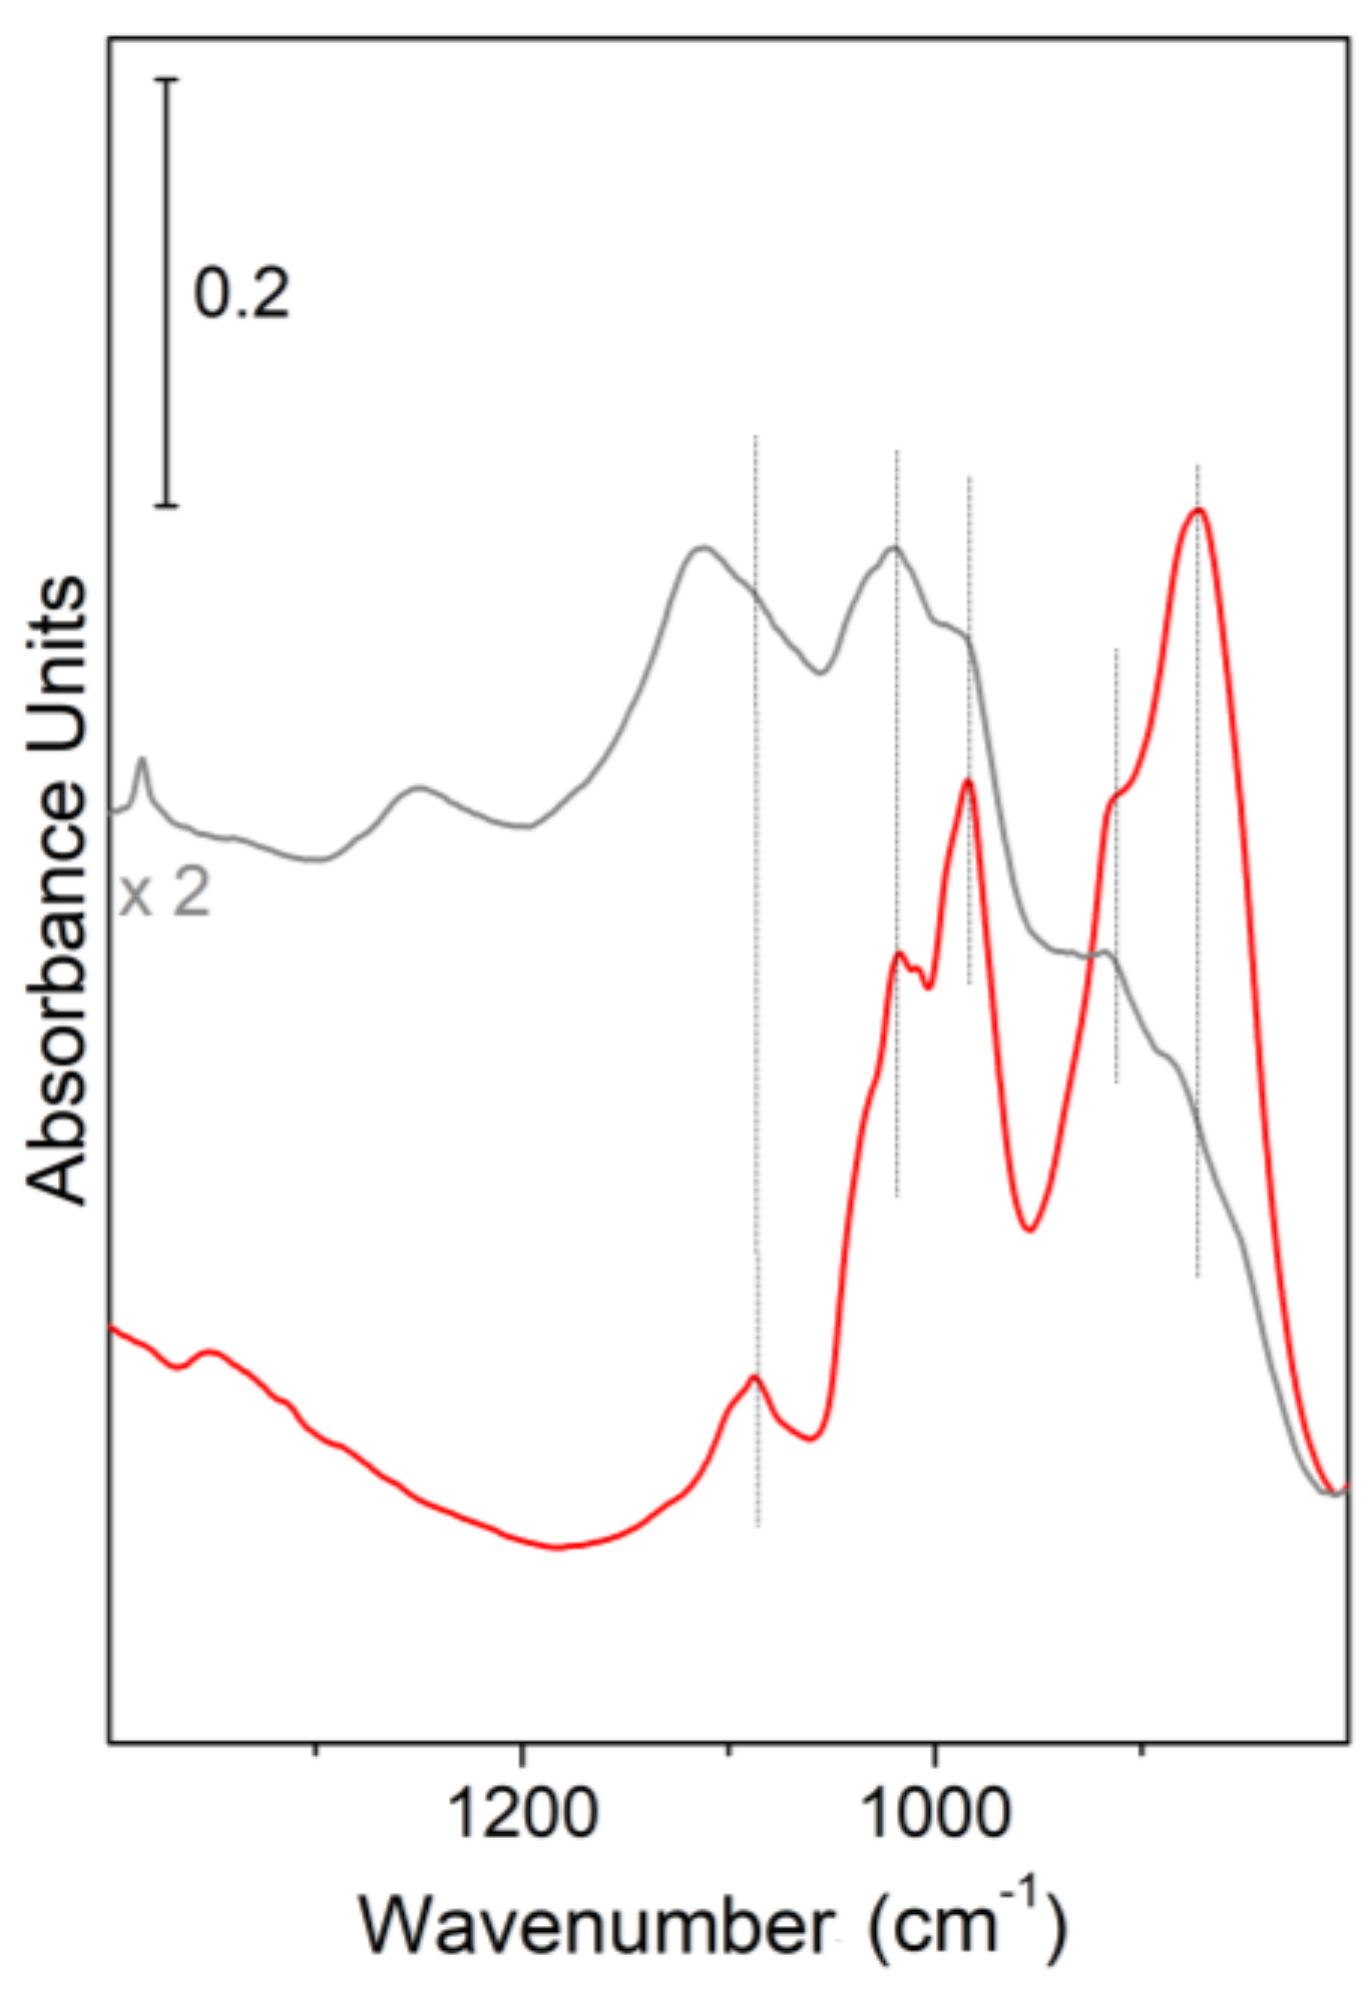
Further information can be obtained from FTIR spectra not only on the crystal habit (i.e., exposed facets) by using probe molecules [35], but also on the bulk structure by investigating the lattice modes region, thus providing support to XRD measurements [36]. Concerning the systems that are investigated in this work, from the analysis of the FTIR spectra in the 800–1200 cm−1 range, Figure 2, the sharp bands due to multiphonon modes of Kadox ZnO, used as a reference, are compared to those of ZnO nanocages [34].
In particular, the spectrum of Kadox ZnO (red line in Figure 2) shows two main envelopes in the 990–1095 cm−1 and 855–800 cm−1 intervals due to the combination of optical (longitudinal LO and transverse TO) and nonpolar phonons modes of the typical wurtzite ZnO structure [37,38,39].
Moving to the FTIR spectrum of ZnO nanostructures, obtained on Au thin film at 700 °C after 3 h process time (gray line in Figure 2), the same envelopes, before assigned to a combination of multiphonons modes of Kadox ZnO, can be observed. More in detail, a remarkable decreasing in the intensity of the overall lattice features can be highlighted, being, in particular, the 855–800 cm−1 envelope due to TO phonon modes more strongly eroded [40]. The observed modification of the lattice modes can be expected because of the formation of ZnO nanocrystals having different sizes together with a different proportion of basal and prismatic faces. Nevertheless, from the FTIR results, we state that the building up of well-defined ZnO nanocrystals, wurtzite in structure, surrounding the porous cages is occurring (see morphology of samples).
3.2. Morphology from SEM and AFM Images
On the basis of these results, we are going to discuss in the following SEM and AFM images of A and C samples (obtained at 700 °C and 800 °C, respectively, after 3 h), together with samples on Au and Pt thicker films (both obtained at 700 °C, after 3 h). The results of B (obtained at 700 °C after 22 h) and D (obtained at 900 °C, after 3 h) samples are not discussed for the sake of brevity (see Figures S1 and S2 in Supplementary Materials).
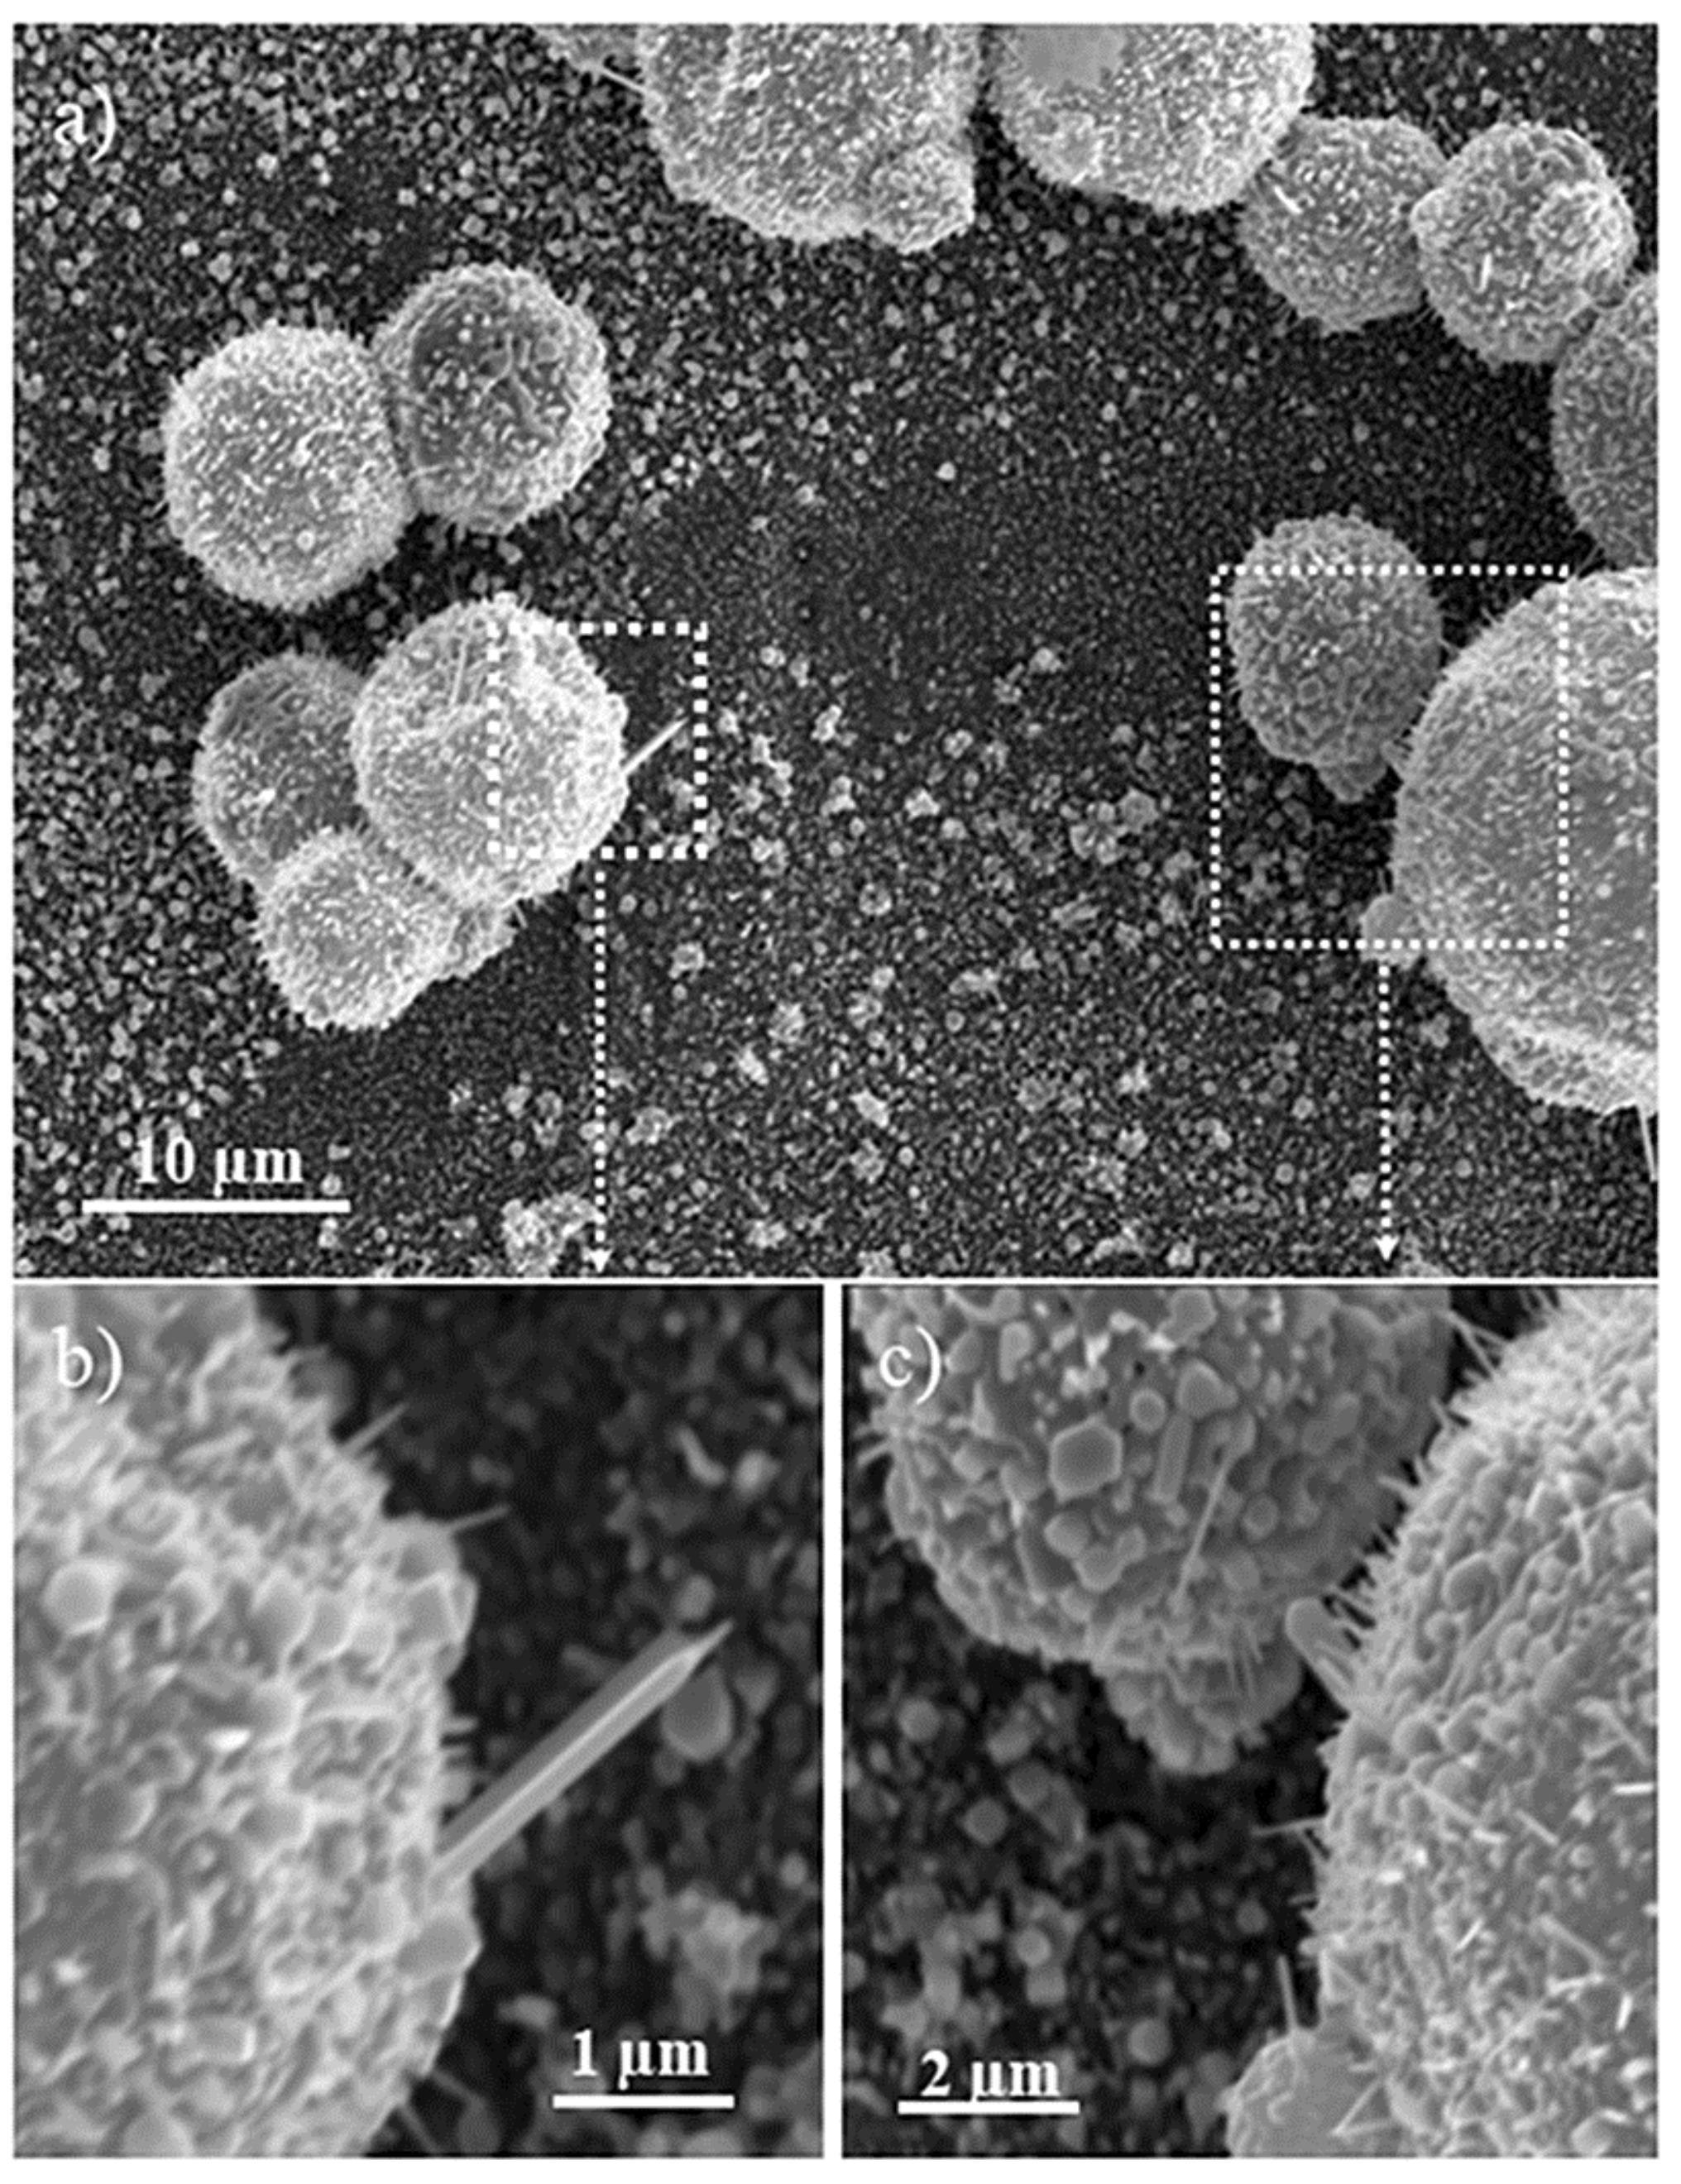
Figure 3a shows a SEM image of ZnO spherical microcages (0.5–15 μm in size) that were grown at 700 °C for 3 h (sample A in Table S1) on a silicon substrate that was coated with Au thin film. From higher magnification images, (Figure 3b,c) cages with nanostructured walls that were made by elongated nanowhiskers with typical length in the range of 0.5–2 μm and exposing both hexagonal and prismatic faces can be evidenced.
On the basis of the SEM images, it is not possible to infer about the index of the most exposed faces that are responsible for the shape of the microcrystals. Moreover, further details on microcrystals morphologies come from large area non-contact AFM images (Figure 4). From this figure, three-dimensional views of an external portion of a cage, 6 μm in size, (Figure 4a), and two enlarged views of selected regions (square areas in Figure 4a) are AFM imaged (Figure 4b,c).
In this figure (Figure 4a), the high roughness observed can be related to the presence of many protruding structures, which at higher magnifications appear in the shape of elongated crystals with prismatic and hexagonal planes terminating the microcrystals (Figure 4b,c). The hexagonal faces are highly regular and defect-free, at least at this level of magnification. It is noteworthy that the average size of the hexagonal faces can be evaluated in the 0.8–1 μm range (Figure 4b,c), being this value, a definitely small figure compared to the one observed for the prismatic faces. In conclusion, AFM images are consistent with cages that were covered with crystalline structures elongated along the prismatic direction and exhibiting both basal and prismatic faces.
By adopting higher synthesis temperatures (800 °C for 3 h, sample C in Table 1), it can be observed that the obtained ZnO cages show increased dimensions (20–50 μm in size), together with the significant development of the nanowhiskers at their surface (Figure 4b,c).
The nanowhiskers, achieving lengths of about 1–5 μm (Figure 4c), grow uniformly at the surface of the microcages giving rise to a highly dense packing, of chestnut husk-like microstructures (Figure 5a,b).
In other words, elongated crystals with more needle-like shapes and then prismatic faces are prevailing with respect to the basal ones. This means that, in these conditions (800 °C), the cages are completely surrounded by very thin and narrow structures, which can be reasonably associated with the presence of prismatic ZnO faces, as obtained from XRD patterns.
It is noteworthy that the amount of the chestnut husk-like structures is quite comparable to that obtained after the synthesis process at 700 °C for 3 h, although when more time is used to perform the synthesis (22 h), the concentration of these structures is sensibly higher (Figure S1).
In conclusion, it comes out that higher temperatures have been observed to affect in a remarkable way the shape and the dimensions of the crystals (Figure 4 and Figure 5), whereas during longer times, a larger amount of hollow micro-nanoshells, 10–20 μm in size, without any evidence of surface nanostructures, are simultaneously growing. In addition, during longer times Au nanocrystals are plausibly embedded within the core of the nanocages or anchored to the internal regions of the thick walls, being the presence of the metal particles negligible at the surface of the microcages (Figure S1).
Conversely, Au particles can be observed at the surface of cages, grown at 700 °C, 3 h, together with many small Au particles that were dispersed in the neighbour of small single ZnO nanocrystals (data not reported for the sake of brevity). The presence of uniformly dispersed Au particles is depending on the time of the process (low amount for 3 h and high amount for 22 h).
Furthermore, the building up of hollow cages, aforementioned for processes at low temperatures (700 °C) and longer times (22 h) (Figure S1, Supplementary Materials), becomes predominant at even higher temperatures (900 °C) (Figure S2). Some more it can be reasonably singled out that due to the high temperatures of the evaporation processes, great and more extended holes inside the cages having thin walls are occurring, until their destruction (Figure S2, Supplementary Materials).
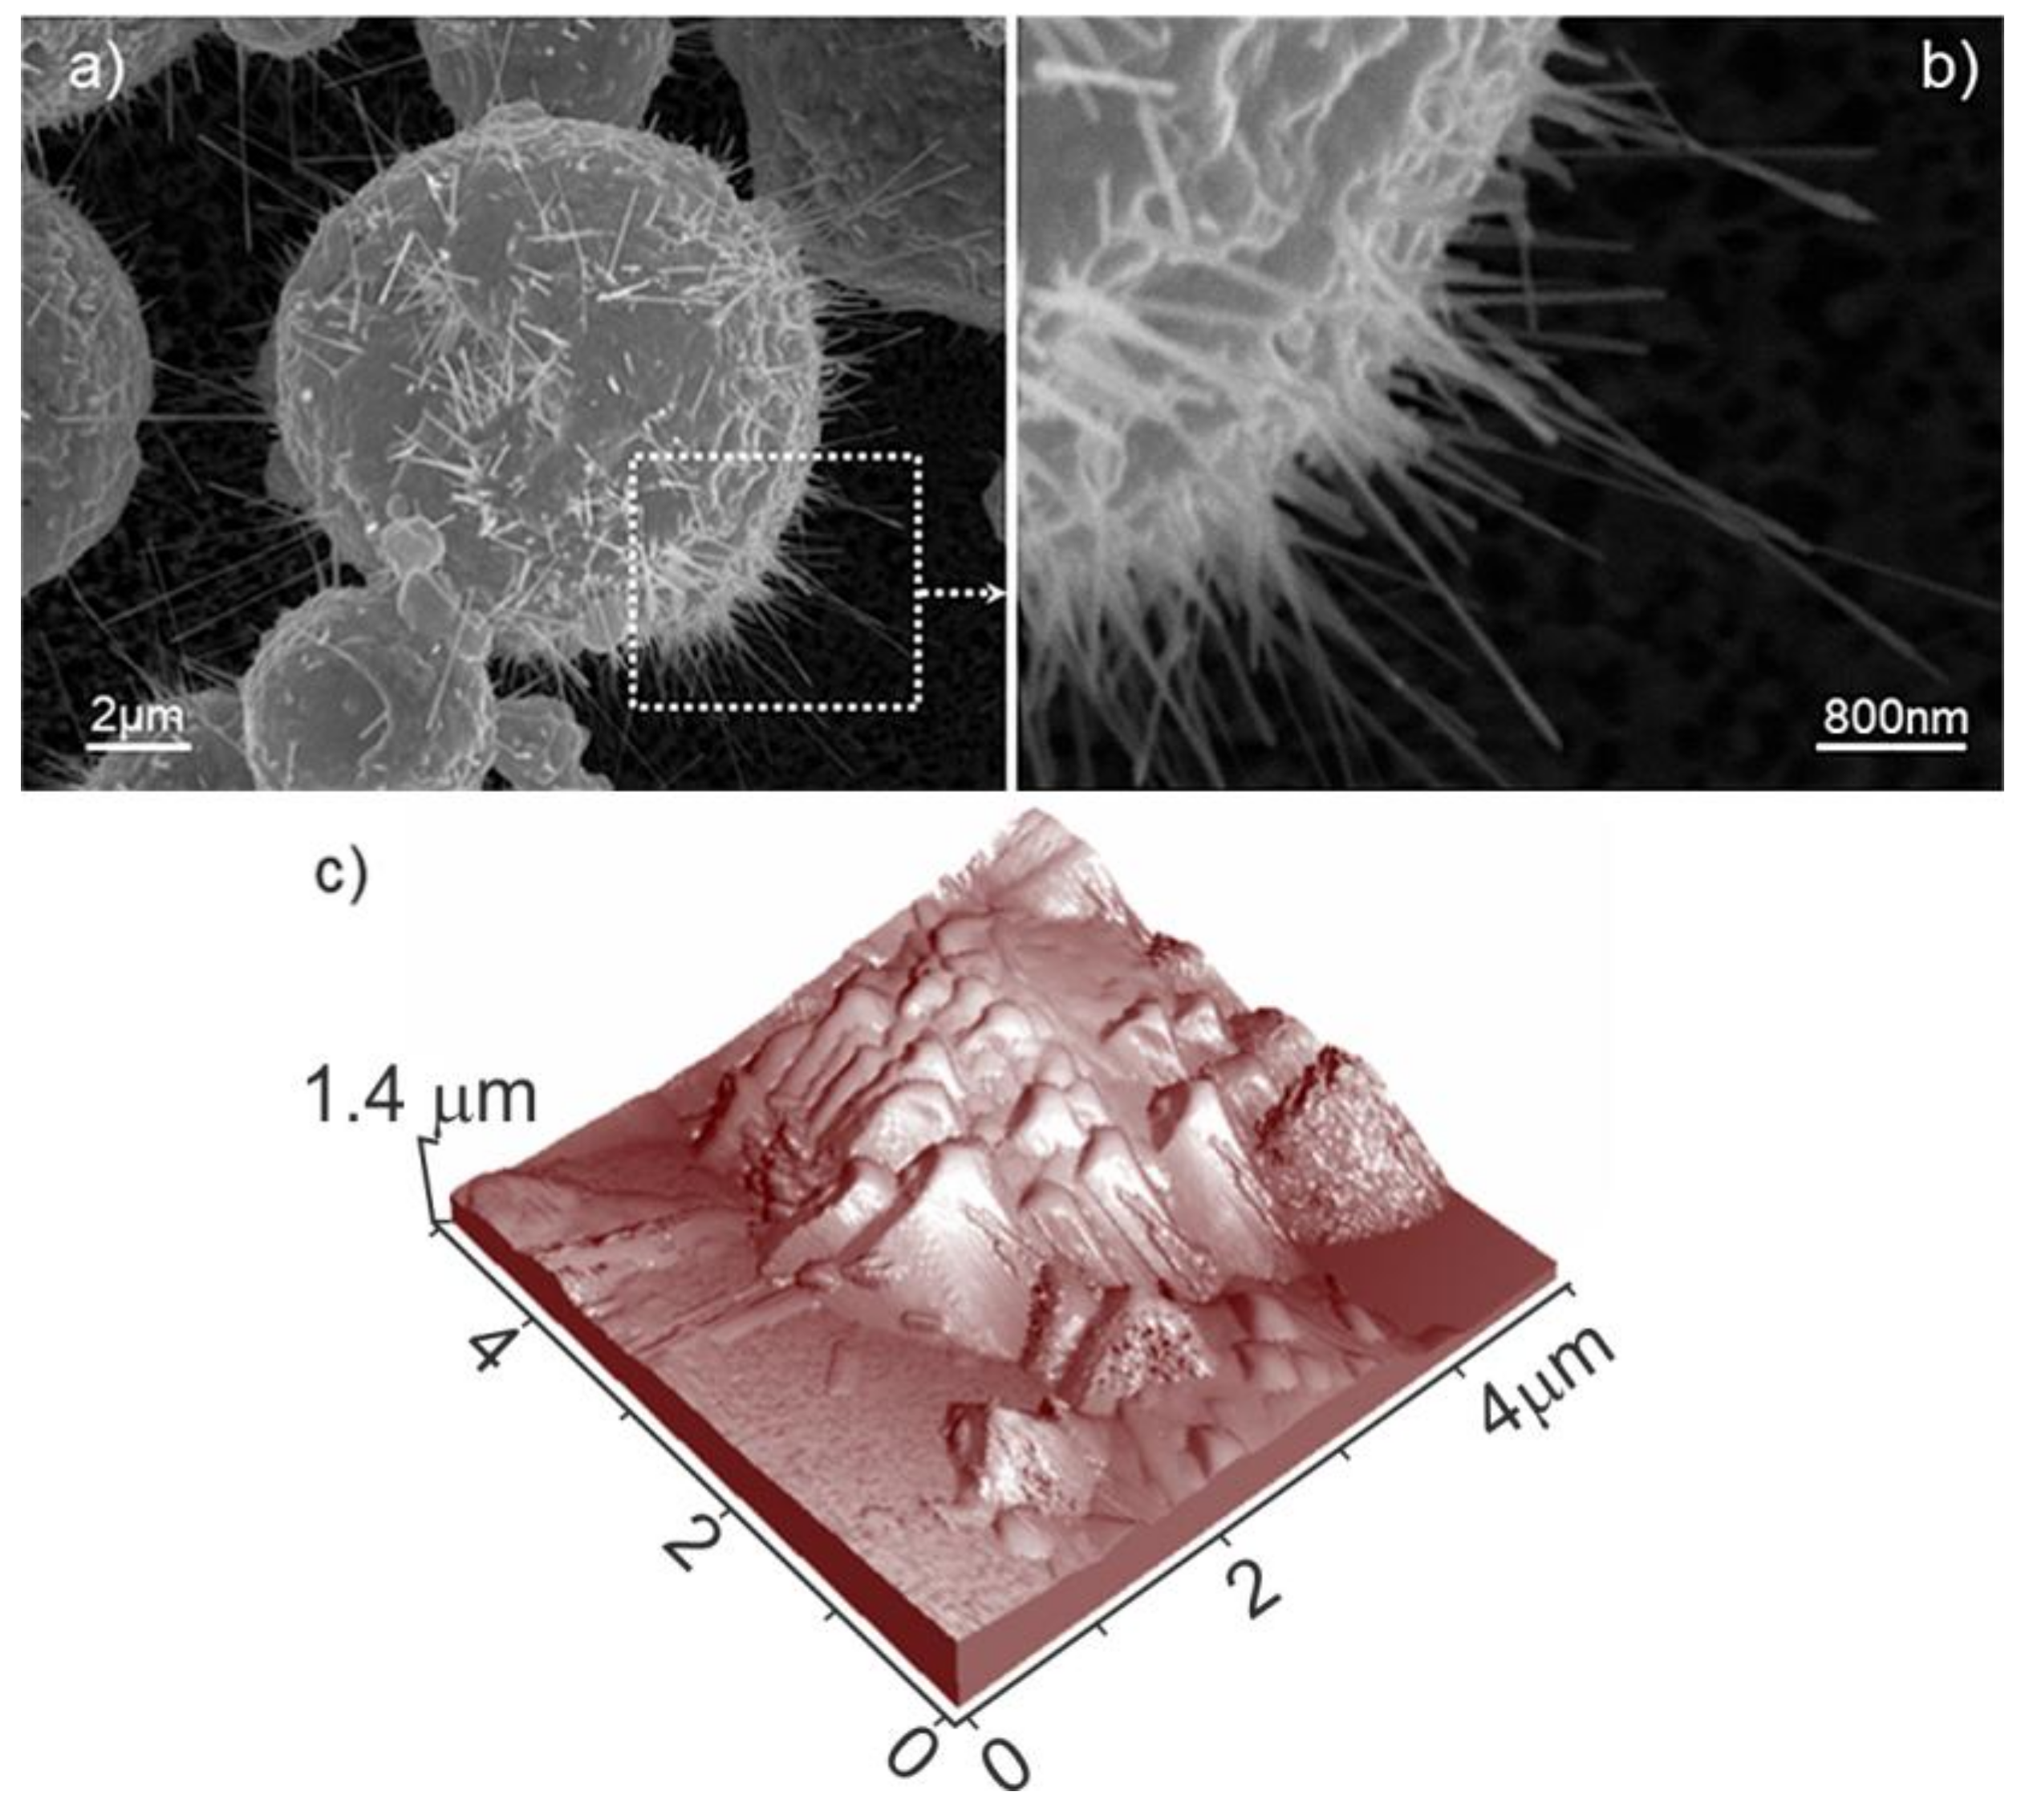
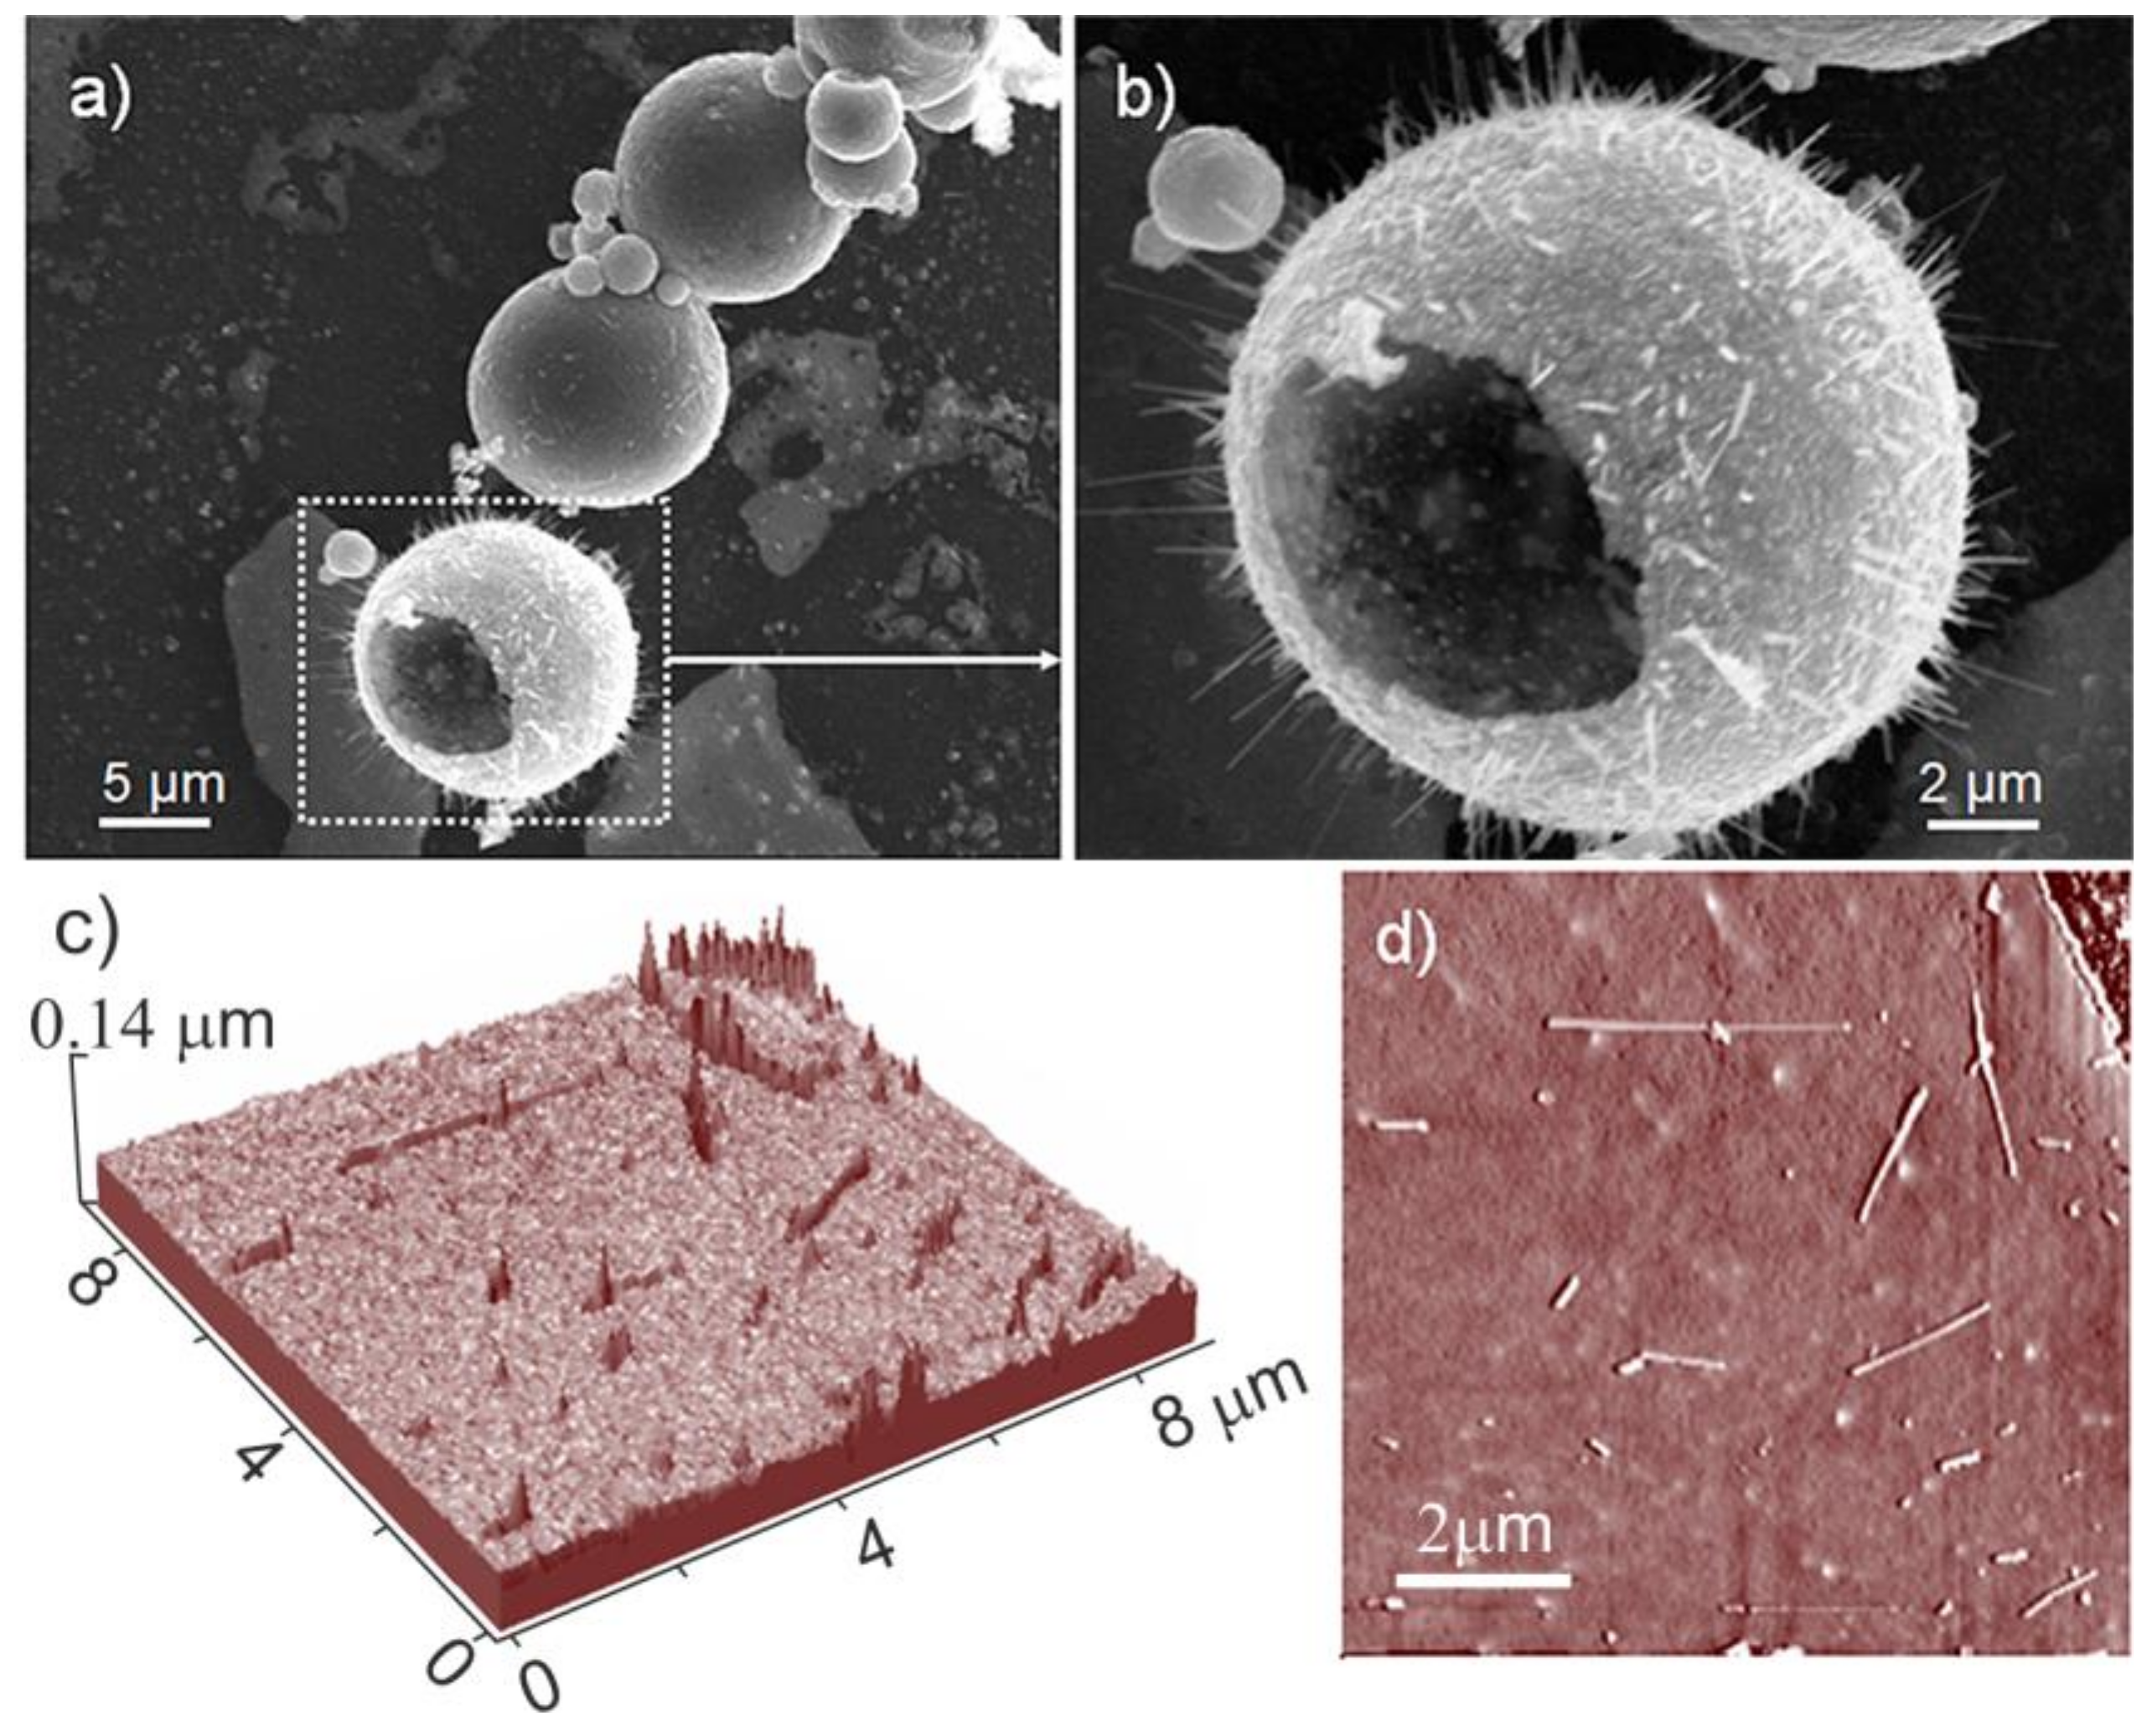
As far as the dimensions of the cavities are concerned, they have been estimated from incidentally broken or defective ZnO cages, as obtained after the different preparation temperatures. From this analysis, the structure of the ZnO particles can be better highlighted, thus evidencing walls with thicknesses ranging in the 100–700 nm interval beside inner cavities ranging in the 2–8 μm sizes. The smallest wall thickness has been found for the sample that was treated at the higher temperature of synthesis (900 °C) (Figure S2, Supplementary Materials). As far as ZnO samples grown on Au and Pt thicker films are concerned, SEM images at a different level of magnification and large-scale non-contact AFM topographies are shown in Figure 6a–d and Figure 7a–d, respectively.
Notice that more elongated and less dense packed needle-like structures, having length higher than 2 μm, are covering ZnO nanocages in both cases. In particular on ZnO nanocages that were grown on Pt films (Figure 7a,b), the needle-like structures seem to be even thinner and more elongated.
The importance of hierarchical ZnO nanostructures is of the relevance being the assembling of long ZnO nanowiskers been evidenced by some recent papers [41,42]. It has been also reported that the co-presence of hierarchical ZnO nanostructures and noble metal nanoparticles can be advantageous for many applications (i.e., catalytic/photocatalytic, electric charge capacity, and sensing property) [22,23], due to the strong surface plasmon resonance and to the charge separation efficiency given by the noble metal nanoparticles. Further study is needed for the knowledge of the process that is occurring in the vapor-solid process and of the role of Au/Pt nanoparticles in affecting the shape and size of ZnO particles, as well as their effectiveness in increasing quantities and homogeneity of the samples. Concerning the Pt-catalyzed growth of ZnO nanostructures, to the best of our knowledge, no systematic studies are reported and only two papers are shown on this subject [43,44].
4. Conclusions
Needle-like nanocrystals, exposing both hexagonal and prismatic faces and achieving a length of about 1–2 μm, have been grown uniformly at the surface of the ZnO cages, giving rise to a highly dense packing of chestnut husk-like structures. The formation of larger chestnut husk-like ZnO nanostructures that were surrounded by nanowhiskers, exposing the more stable elongated prismatic ZnO surfaces, has been observed after high temperatures processes. Moving to even higher temperatures, the formation of more extended holes inside the ZnO cages having thin walls with any evidence of surface nanostructures is occurring, until their destruction. It is noteworthy that in this conditions Au nanocrystals clusters can be embedded within the core of the nanocages, or anchored to the internal regions of the thick walls, being the presence of the metal particles negligible at the surface of the microcages. On both Au and Pt thicker films, the formation of less densely packed ZnO cages, which were surrounded by thin and narrow structures, has been observed, even if up to now no explanation can be proposed to explain the role of the support in affecting the shape and size of ZnO cages.
In this contribution, we have shown that by adopting suitable process conditions, hybrid hierarchical three-dimensional ZnO based structures that were grown at the surface of metal films can be obtained, which could represent a relevant task to fulfil and enhance the multi-functionality requirements. In particular, the role that is played by the catalyst is highlighted, being the formation of Pt-catalyzed nanostructures, very rarely documented in the literature (two papers), and for more traditional ZnO systems only. Some more, although the obtained systems are not uniform, our approach could offer a valuable perspective for researchers playing with innovative nanoarchitectures and advanced applications. As a matter of fact, the hollowed ZnO microspheres, as such, could be of great interest due to their porosity, together with a possible use as photonic crystals. Then, when considering the peculiar nanostructure of the walls, which were made by an organized assembly of nanowhiskers, whose density and size can be suitably controlled by our approach, our systems can act as antennas. Lastly, due to the dispersion of noble metal catalysts inside the cages, synergistic effects (i.e., plasmon resonance effects) coming from the peculiar properties of both the materials (Au/Pt metal and ZnO) could be observed.
Supplementary Materials
The following are available online at https://www.mdpi.com/2073-4352/8/4/153/s1, Figure S1: (a) SEM image of ZnO spherical micro-and nanocages grown on Au thin film at 700 °C for 22 h; (b) hollow microcages with smooth and thick walls of a selected area of (a); (c) secondary electron and (d) back-scattered electron images of ZnO spherical microcages, Figure S2: (a) SEM images of ZnO microcages grown on Au thin film at 900 °C for 3 h; (b) back scattered electron and (c) secondary electron images of a ZnO spherical microcage, Table S1: ZnO Synthesis parameters.
Acknowledgments
This work was supported by MIUR and INSTM Consorzio. All sources of funding of the study should be disclosed.
Author Contributions
D.S., F.C., S.B. and A.Z. conceived, designed and performed the experiments and characterizations, analyzing the data; D.S. wrote the paper, F.C. participated in the writing and final editing of the manuscript. All authors read and approved the paper.
Conflicts of Interest
The authors declare no conflict of interest.
References
- Li, L.; Zhou, N.; Chen, Q.; Shang, Q.; Zhang, Q.; Wang, X.; Zhou, H. Unraveling the growth of hierarchical Quasi-2D/3D perovskite and carrier dynamics. J. Phys. Chem. Lett. 2018, 9, 1124–1132. [Google Scholar] [CrossRef] [PubMed]
- Tan, C.; Cao, X.; Wu, X.-J.; He, Q.; Yang, J.; Zhang, X.; Chen, J.; Zhao, W.; Han, S.; Nam, G.-H.; et al. Recent advances in ultrathin two-dimensional nanomaterials. Chem. Rev. 2017, 117, 6225–6331. [Google Scholar] [CrossRef] [PubMed]
- Nasilowski, M.; Mahler, B.; Lhuillier, E.; Ithurria, S.; Dubertret, B. Two-dimensional colloidal nanocrystals. Chem. Rev. 2016, 16, 10934–10982. [Google Scholar] [CrossRef] [PubMed]
- Cravanzola, S.; Sarro, M.; Cesano, F.; Calza, P.; Scarano, D. Few-layer MoS2 nanodomains decorating TiO2 nanoparticles: A case study for the photodegradation of carbamazepine. Nanomaterials 2018, 8, 207. [Google Scholar] [CrossRef]
- Cravanzola, S.; Cesano, F.; Gaziano, F.; Scarano, D. Carbon domains on MoS2/TiO2 system via acetylene polymerization: Synthesis, structure and surface properties. Front. Chem. 2017, 5, 91. [Google Scholar] [CrossRef] [PubMed]
- Kalita, A.; Kalita, M.P.C. Effects of size reduction on microstructural, optical, vibrational, magnetic and photocatalytic properties of ZnO nanocrystals. Mater. Charact. 2018, 137, 109–118. [Google Scholar] [CrossRef]
- Ross, M.B.; Mirkin, C.A.; Schatz, G.C. Optical properties of one-, two-, and three-dimensional arrays of plasmonic nanostructures. J. Phys. Chem. C 2016, 120, 816–830. [Google Scholar] [CrossRef]
- Uddin, M.J.; Daramola, D.E.; Velasquez, E.; Dickens, T.J.; Yan, J.; Hammel, E.; Cesano, F.; Okoli, O.I. A high efficiency 3D photovoltaic microwire with carbon nanotubes (CNT)-quantum dot (QD) hybrid interface. Phys. Status Solidi Rapid Res. Lett. 2014, 8, 898–903. [Google Scholar] [CrossRef]
- Rackauskas, S.; Barbero, N.; Barolo, C.; Viscardi, G. ZnO nanowire application in chemoresistive sensing: A review. Nanomaterials 2017, 7, 381. [Google Scholar] [CrossRef] [PubMed]
- Rackauskas, S.; Jiang, H.; Wagner, J.B.; Shandakov, S.D.; Hansen, T.W.; Kauppinen, E.I.; Nasibulin, A.G. In situ study of noncatalytic metal oxide nanowire growth. Nano Lett. 2014, 14, 5810–5813. [Google Scholar] [CrossRef] [PubMed]
- Fu, Y.; Cao, F.; Wu, F.; Diao, Z.; Chen, J.; Shen, S.; Li, L. Phase-modulated band alignment in CdS nanorod/SnSx nanosheet hierarchical heterojunctions toward efficient water splitting. Adv. Funct. Mater. 2018, 28, 170671–170679. [Google Scholar] [CrossRef]
- Garakyaraghi, S.; Castellano, F.N. Nanocrystals for triplet sensitization: Molecular behavior from quantum-confined materials. Inorg. Chem. 2018, 57, 2351–2359. [Google Scholar] [CrossRef] [PubMed]
- Guo, T.; Yao, M.-S.; Lin, Y.-H.; Nan, C.-W. A comprehensive review on synthesis methods for transition-metal oxide nanostructures. CrystEngComm 2015, 17, 3551–3585. [Google Scholar] [CrossRef]
- Yang, H.G.; Zeng, H.C. Synthetic architectures of TiO2/H2Ti5O11·H2O, ZnO/H2Ti5O11·H2O, ZnO/TiO2/H2Ti5O11·H2O, and ZnO/TiO2 nanocomposites. JACS 2005, 127, 270–278. [Google Scholar] [CrossRef] [PubMed]
- Cesano, F.; Pellerej, D.; Scarano, D.; Ricchiardi, G.; Zecchina, A. Radially organized pillars of TiO2 nanoparticles: Synthesis, characterization and photocatalytic tests. J. Photochem. Photobiol. Chem. 2012, 242, 51–58. [Google Scholar] [CrossRef]
- Cesano, F.; Bertarione, S.; Damin, A.; Agostini, G.; Usseglio, S.; Vitillo, J.G.; Lamberti, C.; Spoto, G.; Scarano, D.; Zecchina, A. Oriented TiO2 nanostructured pillar arrays: Synthesis and characterization. Adv. Mater. 2008, 20, 3342–3348. [Google Scholar] [CrossRef]
- Zappa, D.; Bertuna, A.; Comini, E.; Kaur, N.; Poli, N.; Sberveglieri, V.; Sberveglieri, G. Metal oxide nanostructures: Preparation, characterization and functional applications as chemical sensors. Beilstein J. Nanotechnol. 2017, 8, 1205–1217. [Google Scholar] [CrossRef] [PubMed]
- Wang, L.; Liu, S.; Feng, X.; Xu, Q.; Bai, S.; Zhu, L.; Chen, L.; Qin, Y.; Lin, W.Z. Ultrasensitive vertical piezotronic transistor based on ZnO twin nanoplatelet. ACS Nano 2017, 11, 4859–4865. [Google Scholar] [CrossRef] [PubMed]
- Newton, M.C.; Warburton, P.A. ZnO tetrapod nanocrystals. Mater. Today 2007, 10, 50–54. [Google Scholar] [CrossRef]
- Zhang, Y. ZnO Nanostructures: Fabrication and Applications; RSC: Croydon, UK, 2017; Volume 43. [Google Scholar]
- Xu, S.; Wang, Z.L. One-dimensional ZnO nanostructures: Solution growth and functional properties. Nano Res. 2011, 4, 1013–1098. [Google Scholar] [CrossRef]
- Chaudhary, S.; Umar, A.; Bhasin, K.K.; Baskoutas, S. Chemical sensing applications of ZnO nanomaterials. Materials 2018, 11, 287. [Google Scholar] [CrossRef] [PubMed]
- Wang, X.; Ahmad, M.; Sun, H. Three-dimensional ZnO hierarchical nanostructures: Solution phase synthesis and applications. Materials 2017, 10, 1304. [Google Scholar] [CrossRef] [PubMed]
- Liu, Z.; Wang, X.; Cai, J.; Liu, G.; Zhou, P.; Wang, K.; Zhu, H. From the ZnO hollow cage clusters to ZnO nanoporous phases: A first-principles bottom-up prediction. J. Phys. Chem. C 2013, 17, 17633–17643. [Google Scholar] [CrossRef]
- Chen, M.; Straatsma, T.P.; Fang, Z.; Dixon, D.A. Structural and electronic property study of (ZnO)n, n ≤ 168: Transition from zinc oxide molecular clusters to ultrasmall nanoparticles. J. Phys. Chem. C 2016, 120, 20400–20418. [Google Scholar] [CrossRef]
- Ta, H.Q.; Zhao, L.; Pohl, D.; Pang, J.; Trzebicka, B.; Rellinghaus, B.; Pribat, D.; Gemming, T.; Liu, Z.; Bachmatiuk, A.; et al. Graphene-like ZnO: A mini review. Crystals 2016, 6, 100. [Google Scholar] [CrossRef]
- Ghiotti, G.; Chiorino, A.; Boccuzzi, F. Surface chemistry and electronic effects of H2 (D2) on two different microcrystalline ZnO powders. Surf. Sci. 1993, 287–288, 228–234. [Google Scholar] [CrossRef]
- Scarano, D.; Bertarione, S.; Spoto, G.; Zecchina, A.; Areán, C.O. FTIR spectroscopy of hydrogen, carbon monoxide, and methane adsorbed and co-adsorbed on zinc oxide. Thin Solid Films 2001, 400, 50–55. [Google Scholar] [CrossRef]
- Zecchina, A.; Scarano, D.; Bordiga, S.; Spoto, G.; Lamberti, C. Surface structures of oxides and halides and their relationships to catalytic properties. Adv. Catal. 2001, 46, 265–397. [Google Scholar]
- Scarano, D.; Bertarione, S.; Cesano, F.; Spoto, G.; Zecchina, A. Imaging polycrystalline and smoke MgO surfaces with atomic force microscopy: A case study of high resolution image on a polycrystalline oxide. Surf. Sci. 2004, 570, 155–166. [Google Scholar] [CrossRef]
- Scarano, D.; Bordiga, S.; Bertarione, S.; Ricchiardi, G.; Zecchina, A. The IR spectroscopy of methane and hydrogen adsorbed on α-chromia. Catal. Lett. 2000, 68, 185–190. [Google Scholar] [CrossRef]
- Scarano, D.; Ricchiardi, G.; Bordiga, S.; Galletto, P.; Lamberti, C.; Spoto, G.; Zecchina, A. Modelling of α-Cr2O3 and ZnO crystal morphology and its relation to the vibrational spectra of adsorbed CO. Faraday Discuss. 1996, 105, 119–138. [Google Scholar] [CrossRef]
- Züttel, A. Hydrogen storage methods. Naturwissenschaften 2004, 91, 157–172. [Google Scholar] [CrossRef] [PubMed]
- Smith, D.M.; Eischens, R.P. Infrared study of oxygen adsorption on impure zinc oxide. J. Phys. Chem. Solids 1967, 28, 2135–2142. [Google Scholar] [CrossRef]
- Groppo, E.; Lamberti, C.; Zecchina, A. On the fraction of Cr-II sites involved in the C2H4 polymerization on the Cr/SiO2 Phillips catalyst: A quantification by FTIR spectroscopy. Phys Chem. Chem. Phys. 2006, 8, 2453–2456. [Google Scholar] [CrossRef] [PubMed]
- Wang, Y.; Wo, C. IR spectroscopic investigations of chemical and photochemical reactions on metal oxides: Bridging the materials gap. Chem. Soc. Rev. 2017, 46, 1875–1932. [Google Scholar] [CrossRef] [PubMed]
- Emelie, P.Y.; Phillips, J.D.; Buller, B.; Venkateswaean, U.D. Free carrier absorption and lattice vibrational modes in bulk ZnO. J. Electron. Mater. 2006, 35, 525–529. [Google Scholar] [CrossRef]
- Scarano, D.; Bertarione, S.; Cesano, F.; Vitillo, J.G.; Zecchina, A. Plate-like zinc oxide microcrystals: Synthesis and characterization of a material active toward hydrogen adsorption. Catal. Today 2006, 116, 433–438. [Google Scholar] [CrossRef]
- Scarano, D.; Spoto, G.; Bordiga, S.; Zecchina, A.; Lamberti, C. Lateral interactions in CO adlayers on prismatic ZnO faces: A FTIR and HRTEM study. Surf. Sci. 1992, 276, 281–298. [Google Scholar] [CrossRef]
- Morishige, K.; Kittaka, S.; Moriyasu, T.; Morimoto, T. Thermal desorption study of surface hydroxyls on ZnO. J. Chem. Soc. Faraday Trans. 1980, 76, 738–745. [Google Scholar] [CrossRef]
- Gao, G.; Yu, L.; Vinu, A.; Shapter, J.G.; Batmunkh, M.; Shearer, C.J.; Yin, T.; Huanga, P.; Cui, D. Synthesis of ultra-long hierarchical ZnO whiskers in a hydrothermal system for dye-sensitised solar cells. RSC Adv. 2016, 6, 109406–109413. [Google Scholar] [CrossRef]
- Xia, Y.; Wang, J.; Chen, R.; Zhou, D.; Xiang, L. A review on the fabrication of hierarchical ZnO nanostructures for photocatalysis application. Crystals 2016, 6, 148. [Google Scholar] [CrossRef]
- Solís-Pomar, F.; Martínez-Guerra, E.; Meléndrez-Castro, M.; Pérez-Tijerina, E. Growth of ZnO nanowires using au/pd nanoparticles as catalyst. J. Nano Res. 2011, 14, 145–154. [Google Scholar] [CrossRef]
- Zhang, Z.; Wang, S.J.; Yu, T.; Wu, T. Controlling the growth mechanism of ZnO nanowires by selecting catalysts. J. Phys. Chem. C 2007, 111, 17500–17505. [Google Scholar] [CrossRef]
Figure 1.
XRD patterns of: Kadox ZnO (a) and ZnO spherical microcages grown at 700 °C for 3 h (b), at 700 °C for 22 h (c), at 800 °C for 3 h (d) and at 900 °C for 3 h (e) obtained on Au thin film. XRD diffraction planes of Zincite (PDF card No. #00-036-1451) are also reported.
Figure 1.
XRD patterns of: Kadox ZnO (a) and ZnO spherical microcages grown at 700 °C for 3 h (b), at 700 °C for 22 h (c), at 800 °C for 3 h (d) and at 900 °C for 3 h (e) obtained on Au thin film. XRD diffraction planes of Zincite (PDF card No. #00-036-1451) are also reported.
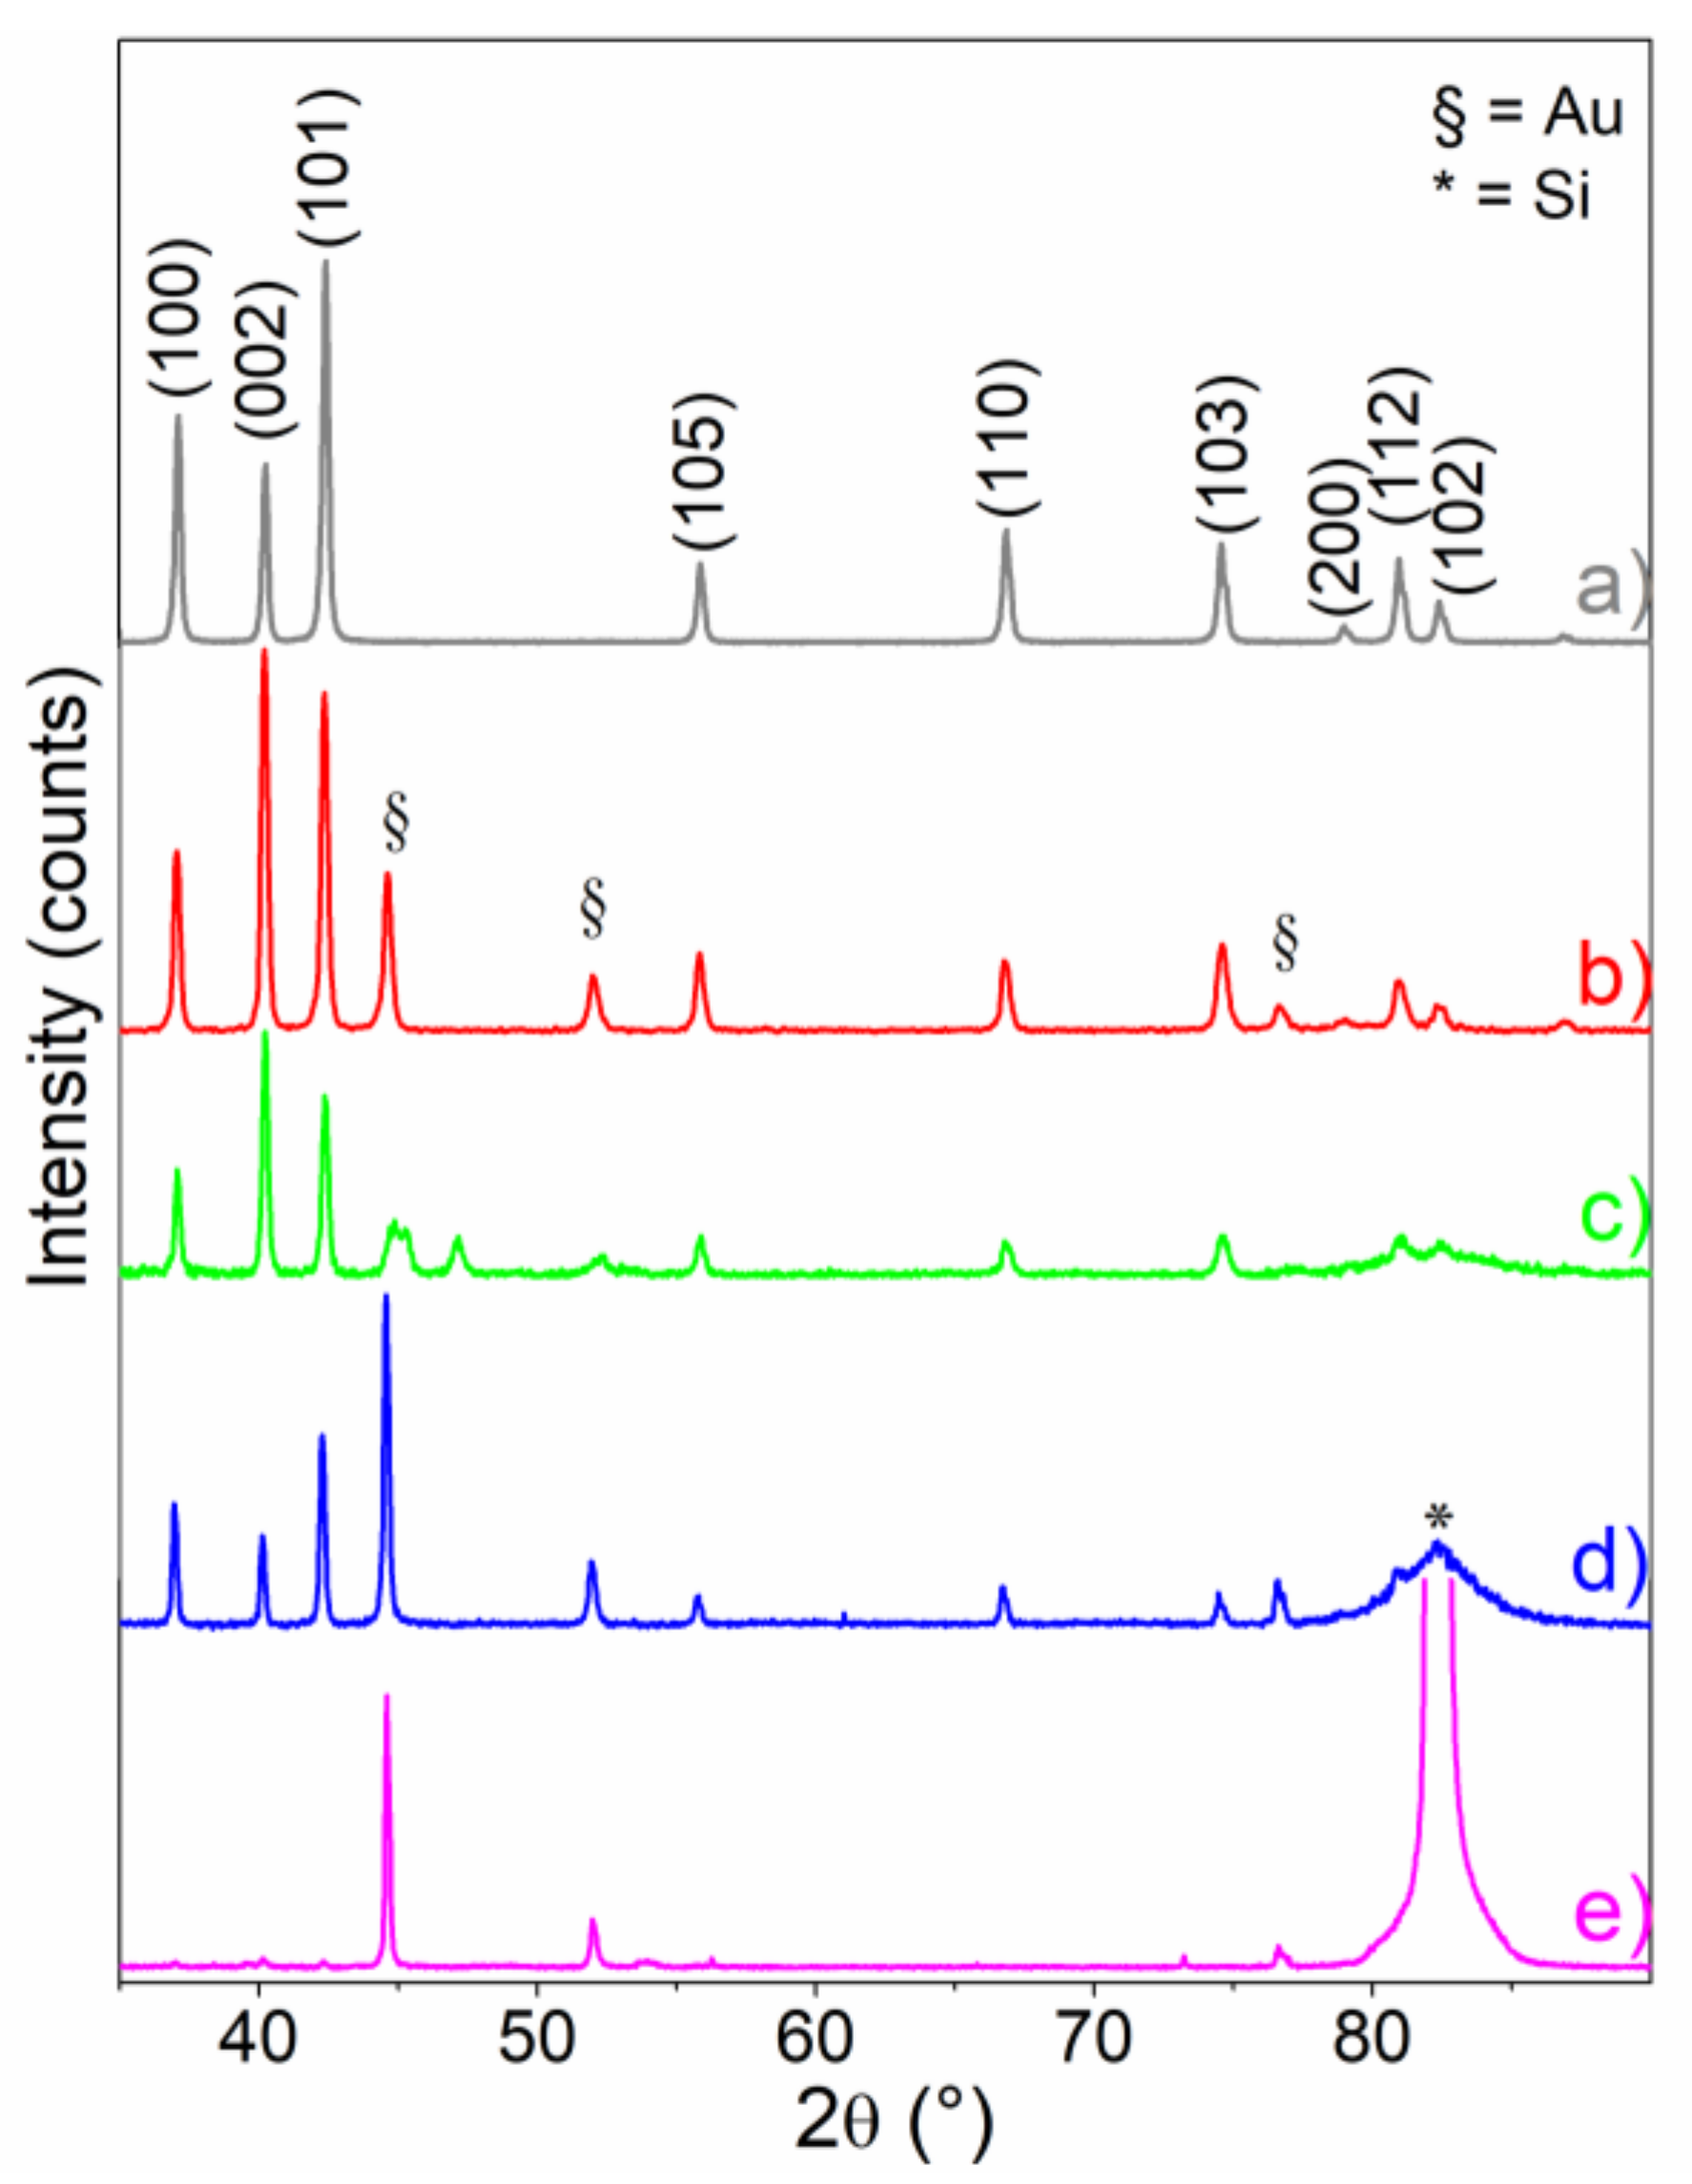
Figure 2.
Fourier-transform Infrared spectra of Kadox ZnO (red line) and ZnO nanostructured microcages (grey line) samples background in the lattice modes region.
Figure 2.
Fourier-transform Infrared spectra of Kadox ZnO (red line) and ZnO nanostructured microcages (grey line) samples background in the lattice modes region.

Figure 3.
SEM image of ZnO spherical cages (0.5–15 μm in size) grown on Au thin film at 700 °C for 3 h (a). In (b,c), enlarged views of two different areas of (a) are reported.
Figure 3.
SEM image of ZnO spherical cages (0.5–15 μm in size) grown on Au thin film at 700 °C for 3 h (a). In (b,c), enlarged views of two different areas of (a) are reported.

Figure 4.
Large-scale non-contact atomic force microscopy (AFM) topographies of ZnO spherical cages grown on Au thin film at 700 °C for 3 h: (a) 7 × 7 μm, (b) 1.6 × 1.6 μm, and (c) 2 × 2 μm images.
Figure 4.
Large-scale non-contact atomic force microscopy (AFM) topographies of ZnO spherical cages grown on Au thin film at 700 °C for 3 h: (a) 7 × 7 μm, (b) 1.6 × 1.6 μm, and (c) 2 × 2 μm images.
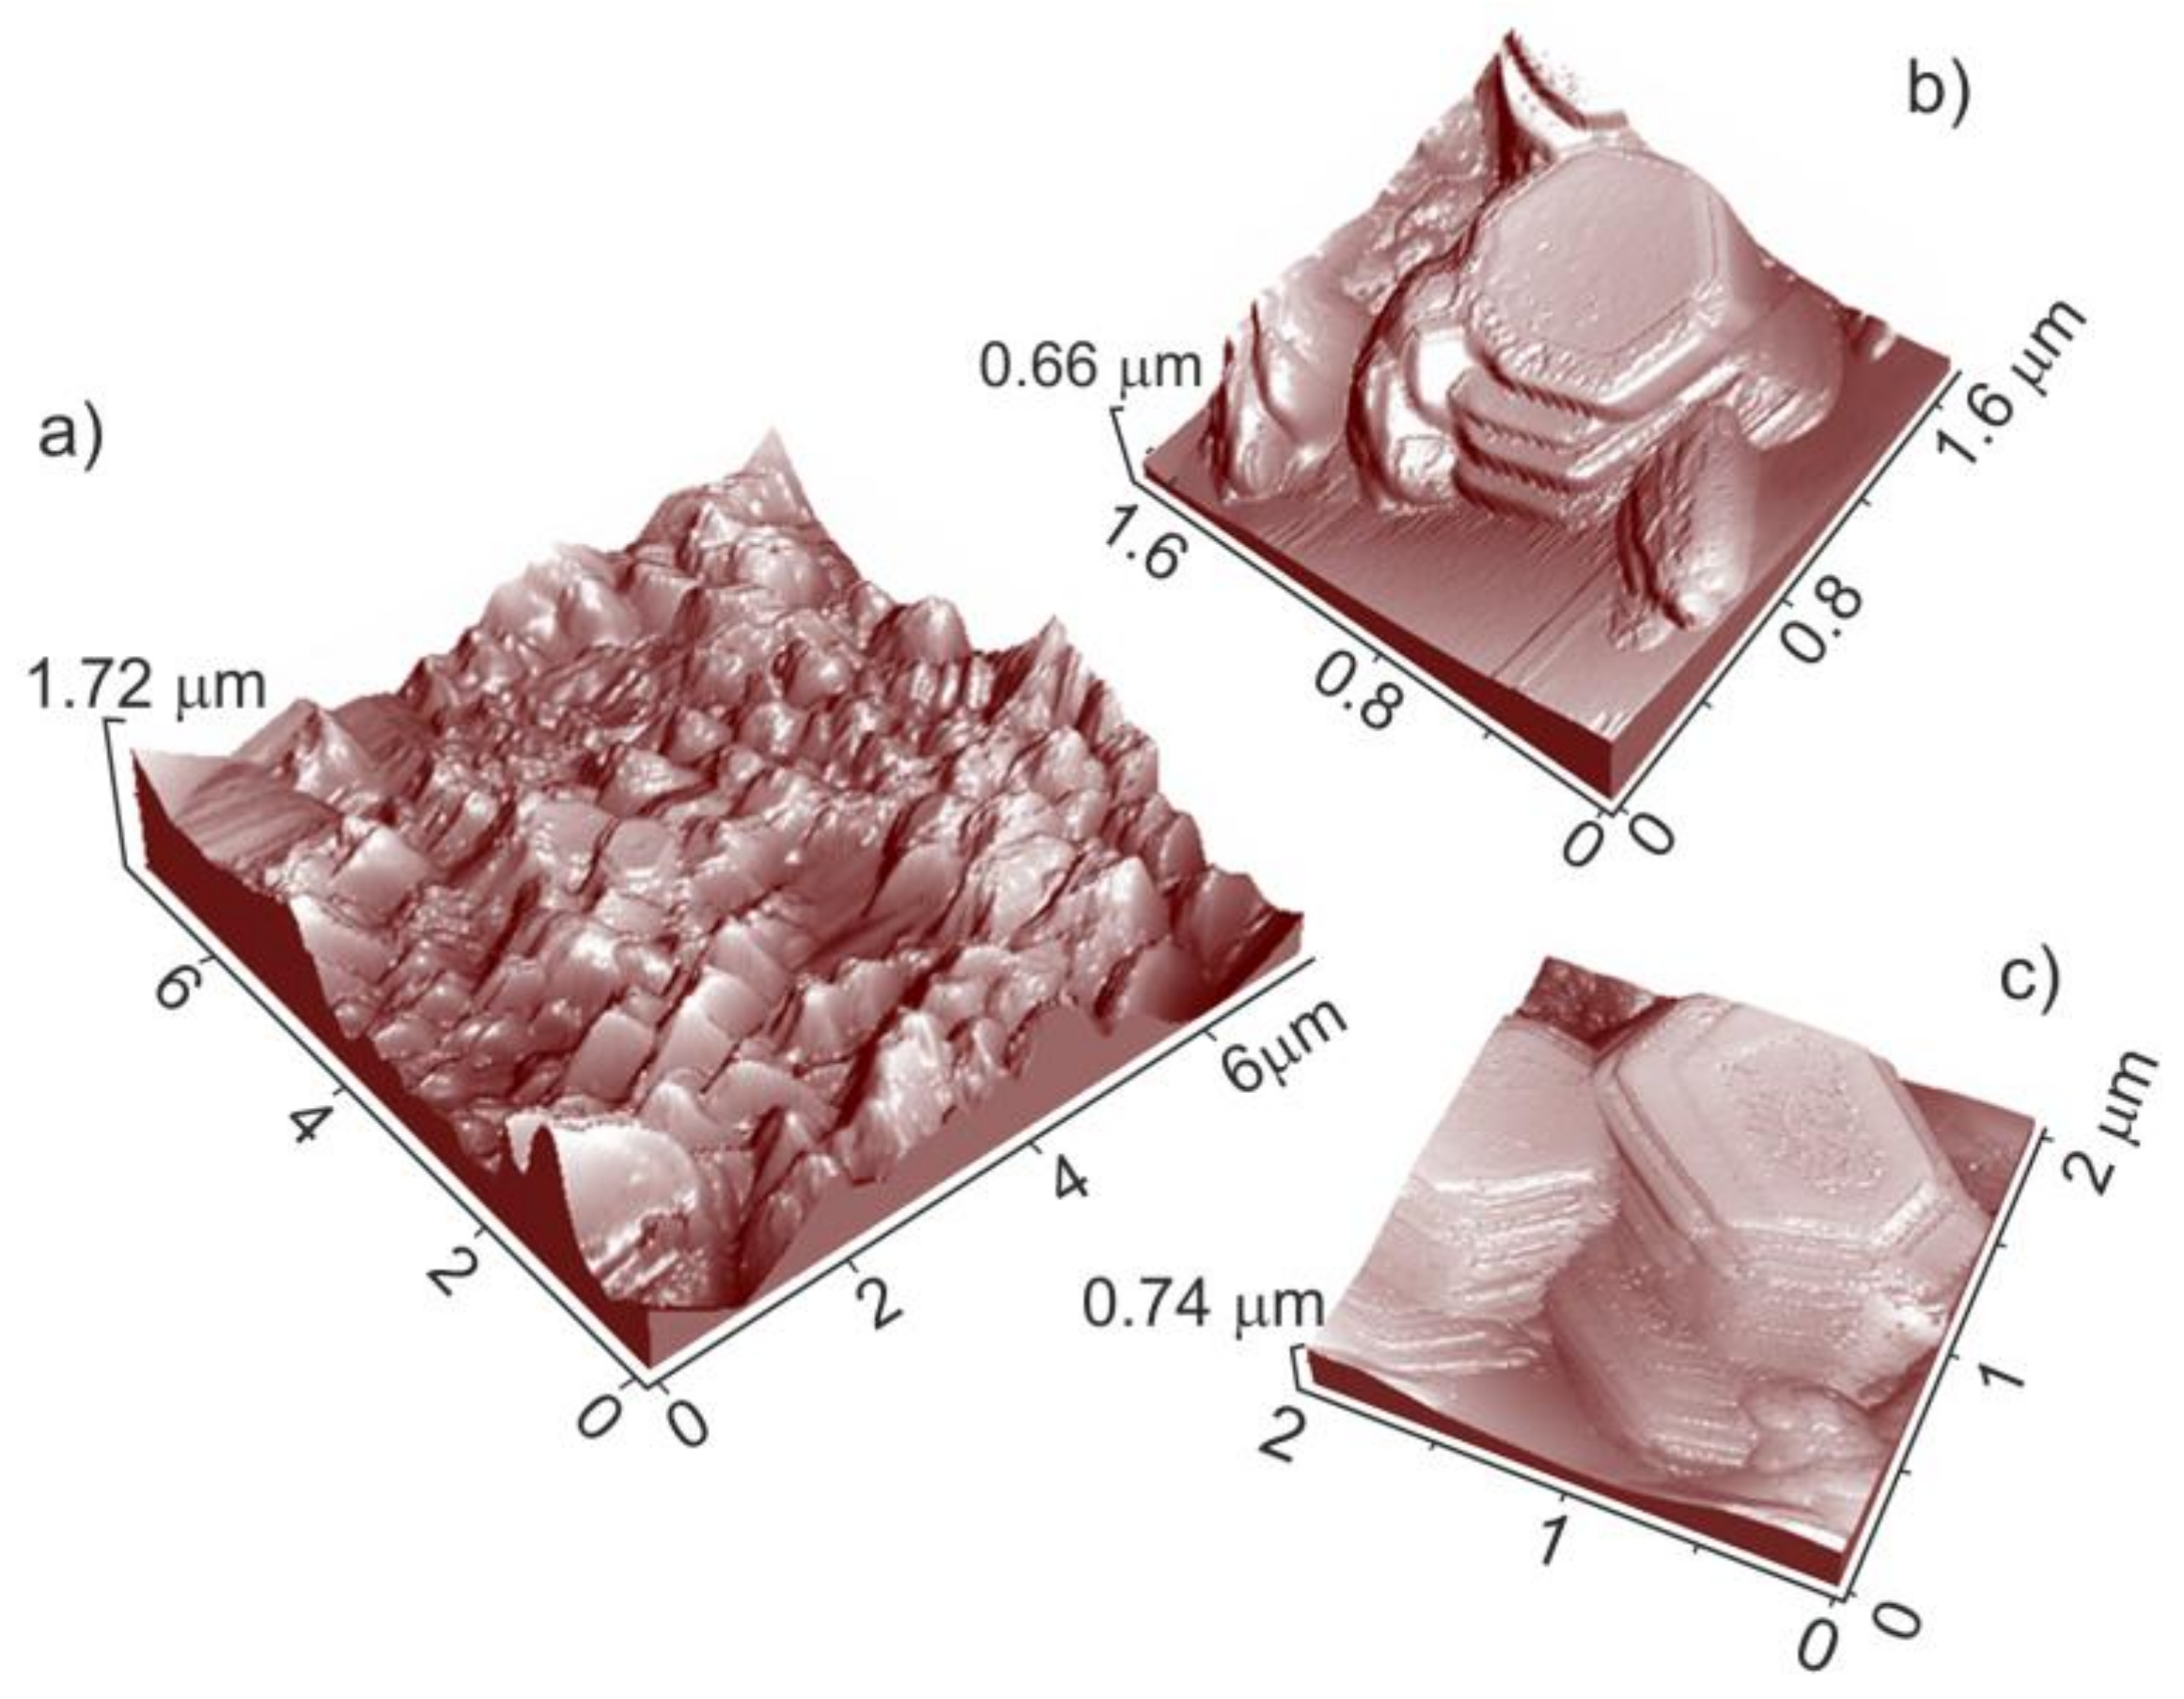
Figure 5.
(a,b) SEM images of ZnO cages grown on Au thin film at 800 °C for 3 h, (c) enlarged view of a selected area of (b).
Figure 5.
(a,b) SEM images of ZnO cages grown on Au thin film at 800 °C for 3 h, (c) enlarged view of a selected area of (b).
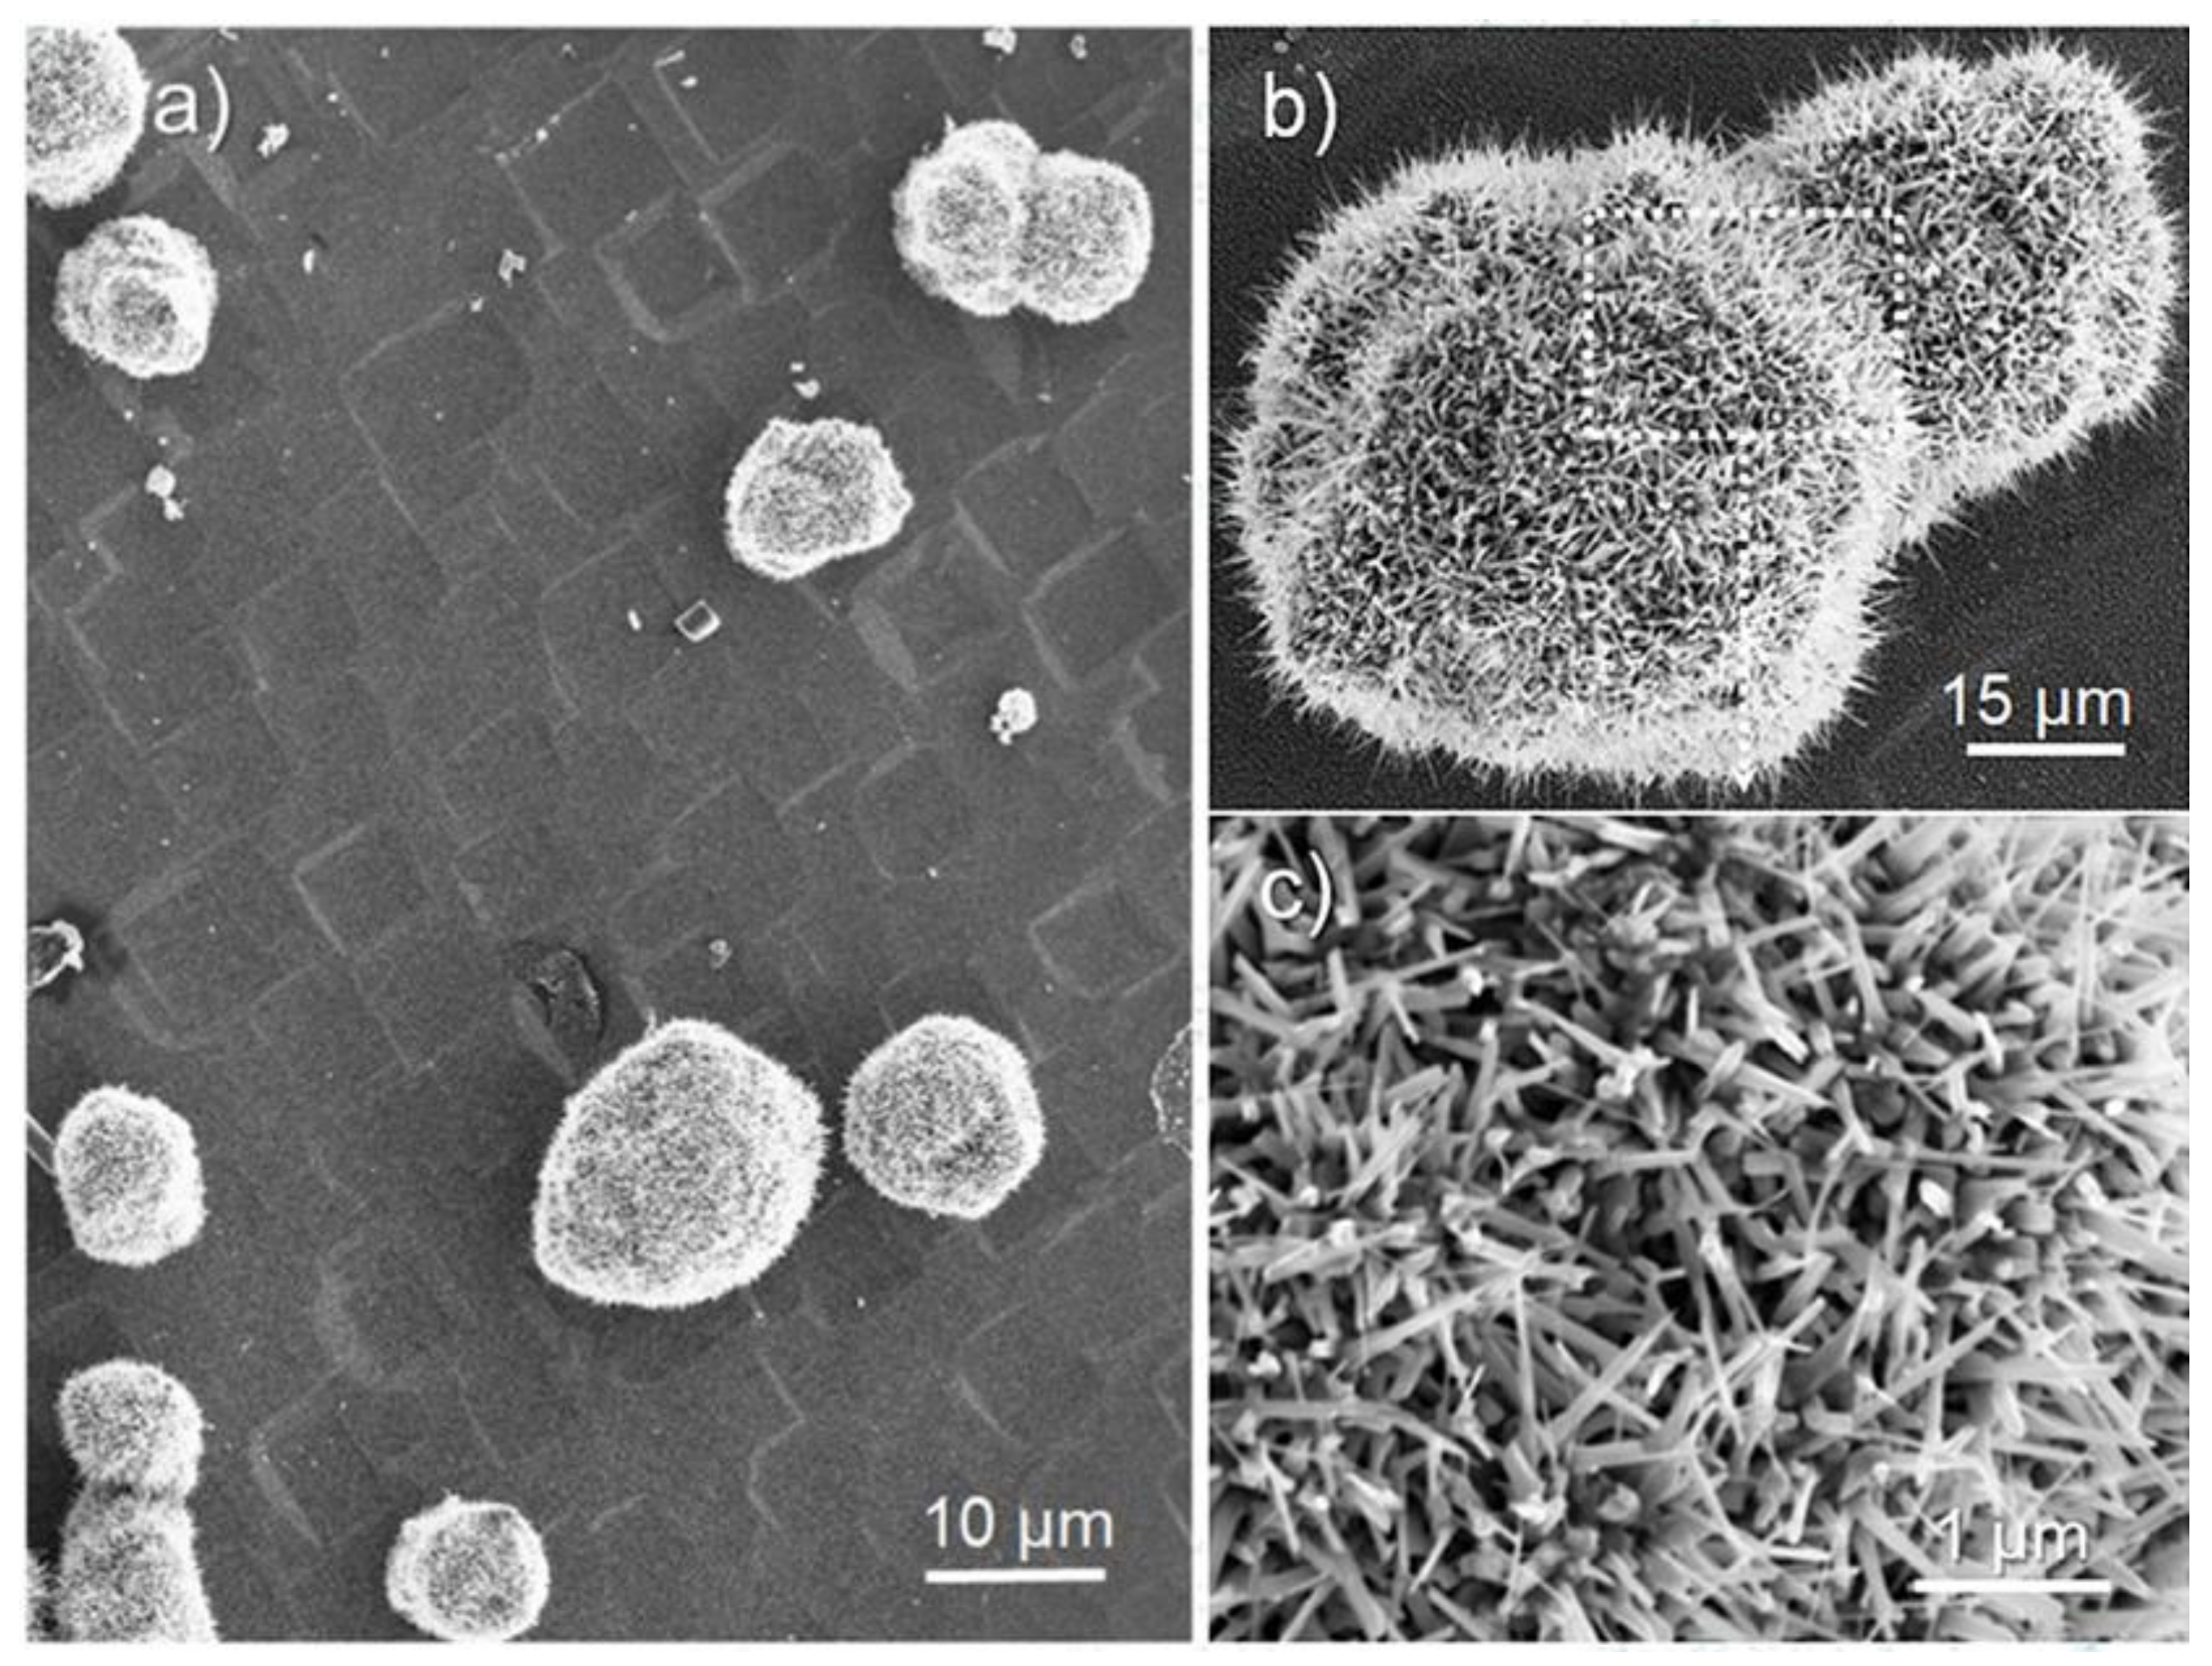
Figure 6.
(a) SEM image of ZnO spherical cages grown on Au thick film (50 nm thick) at 700 °C for 3 h; (b) enlarged view of (a); large-scale non-contact AFM (9 × 9 μm) topography of a region of a ZnO spherical cage; (c) three-dimensional; and, d) top view images.
Figure 6.
(a) SEM image of ZnO spherical cages grown on Au thick film (50 nm thick) at 700 °C for 3 h; (b) enlarged view of (a); large-scale non-contact AFM (9 × 9 μm) topography of a region of a ZnO spherical cage; (c) three-dimensional; and, d) top view images.

Figure 7.
SEM image of (a) ZnO spherical cages grown on Pt thick film (50 nm thick) at 700 °C for 3 h, (b) enlarged view of (a), (c) three-dimensional (3D) non-contact AFM (5 × 5 μm) image of a region of a ZnO spherical cage.
Figure 7.
SEM image of (a) ZnO spherical cages grown on Pt thick film (50 nm thick) at 700 °C for 3 h, (b) enlarged view of (a), (c) three-dimensional (3D) non-contact AFM (5 × 5 μm) image of a region of a ZnO spherical cage.

Table 1.
Crystal sizes and semi-quantitative phase analysis, as obtained from the XRD patterns.
| Temperature (°C) | |||
|---|---|---|---|
| 700 | 800 | 900 | |
| Crystal sizes (nm) | |||
| ZnO | 64 | >100 * | - |
| Au | 46 | 83 | >100 * |
| Composition (wt. %) | |||
| ZnO | 93 | 76 | - |
| Au | 7 | 24 | ~99 |
* The crystallite sizes are too big for a precise size evaluation.
© 2018 by the authors. Licensee MDPI, Basel, Switzerland. This article is an open access article distributed under the terms and conditions of the Creative Commons Attribution (CC BY) license (http://creativecommons.org/licenses/by/4.0/).
Share and Cite
MDPI and ACS Style
Scarano, D.; Cesano, F.; Bertarione, S.; Zecchina, A. Zinc Oxide Nanostructures: From Chestnut Husk-Like Structures to Hollow Nanocages, Synthesis and Structure. Crystals 2018, 8, 153. https://doi.org/10.3390/cryst8040153
AMA Style
Scarano D, Cesano F, Bertarione S, Zecchina A. Zinc Oxide Nanostructures: From Chestnut Husk-Like Structures to Hollow Nanocages, Synthesis and Structure. Crystals. 2018; 8(4):153. https://doi.org/10.3390/cryst8040153
Chicago/Turabian StyleScarano, Domenica, Federico Cesano, Serena Bertarione, and Adriano Zecchina. 2018. "Zinc Oxide Nanostructures: From Chestnut Husk-Like Structures to Hollow Nanocages, Synthesis and Structure" Crystals 8, no. 4: 153. https://doi.org/10.3390/cryst8040153
Note that from the first issue of 2016, this journal uses article numbers instead of page numbers. See further details here.