Size Control of Cobalt-Doped ZnO Nanoparticles Obtained in Microwave Solvothermal Synthesis
by
 ,
,
Jacek Wojnarowicz
1,* ,
,
Tadeusz Chudoba
1, 
Stanisław Gierlotka
1,
Kamil Sobczak
2 and
Witold Lojkowski
1 1
Institute of High Pressure Physics, Polish Academy of Sciences, Sokolowska 29/37, 01-142 Warsaw, Poland
2
Faculty of Chemistry, Biological and Chemical Research Centre, University of Warsaw, Żwirki i Wigury 101, 02-089 Warsaw, Poland
*
Author to whom correspondence should be addressed.
Crystals 2018, 8(4), 179; https://doi.org/10.3390/cryst8040179
Submission received: 13 February 2018
/
Revised: 9 April 2018
/
Accepted: 17 April 2018
/
Published: 19 April 2018
(This article belongs to the Special Issue Microwave-Assisted Synthesis of Nanocrystals and Nanostructures)
Abstract
:This article presents the method of size control of cobalt-doped zinc oxide nanoparticles (Zn1−xCoxO NPs) obtained by means of the microwave solvothermal synthesis. Zinc acetate dihydrate and cobalt(II) acetate tetrahydrate dissolved in ethylene glycol were used as the precursor. It has been proved by the example of Zn0.9Co0.1O NPs (x = 10 mol %) that by controlling the water quantity in the precursor it is possible to precisely control the size of the obtained Zn1−xCoxO NPs. The following properties of the obtained Zn0.9Co0.1O NPs were tested: skeleton density (helium pycnometry), specific surface area (BET), dopant content (ICP-OES), morphology (SEM), phase purity (XRD), lattice parameter (Rietveld method), average crystallite size (FW1/5/4/5M method and Scherrer’s formula), crystallite size distribution (FW1/5/4/5M method), and average particle size (from TEM and SSA). An increase in the water content in the precursor between 1.5% and 5% resulted in the increase in Zn0.9Co0.1O NPs size between 28 nm and 53 nm. The X-ray diffraction revealed the presence of only one hexagonal phase of ZnO in all samples. Scanning electron microscope images indicated an impact of the increase in water content in the precursor on the change of size and shape of the obtained Zn0.9Co0.1O NPs. The developed method of NPs size control in the microwave solvothermal synthesis was used for the first time for controlling the size of Zn1−xCoxO NPs.
1. Introduction
Zinc oxide (ZnO) has attracted the growing interest of numerous research groups due to its specific properties [1,2,3]. It is a II-VI semiconductor. The wide band gap of 3.37 eV and the high exciton binding energy (60 meV) make it a potential material for application in electronics, optoelectronics, and laser technologies [3,4]. The antibacterial and antifungal action as well as the UV radiation absorbability are the reasons why it is commonly used in the pharmaceutical industry as an ingredient of, e.g., tooth dressings, creams, sunscreens, ointments, and various skin powders [5,6,7]. In industry, it is used as a filler and stabiliser of plastics (e.g., vulcanised rubber, natural rubber), a pigment (zinc white), and an additive for lacquers and paints [8,9,10].
Nanotechnology enables taking advantage of the change of matter properties as a result of the matter size change in the nanoscale [11,12,13,14,15,16]. This permits making new scientific discoveries and increasing the application capabilities of the already commonly used materials, e.g., ZnO. Intensive research of ZnO nanomaterials (NMs) enabled finding new potential applications for them, e.g., in electronics, dentistry, pharmacy, biomedicine, agriculture, photovoltaics, or for the modification of liquid crystals [1,3,17,18,19,20,21,22]. It is common knowledge that the properties of NMs can be controlled by changing their size, shape, chemical composition and modifying their surface, e.g., by polymer coating or selective molecule addition. However, despite more than 10 years of development of ZnO NMs synthesis technologies, the simultaneous control over multiple properties of the synthesised ZnO NMs, e.g., size, shape, phase purity, homogeneity, and dopant content, has still been the main challenge in terms of technology.
The doping of ZnO NMs with ions of transition metals (e.g., Co, Cr, Ni, Fe, Mn, V) permits changing their forbidden band, conductivity, or magnetic properties [23,24,25,26,27,28,29]. The research on doped ZnO experienced a breakthrough in the publications by Dietl et al. [30] and Sato et al. [31], which demonstrated the existence of ferromagnetism in these materials at room temperature. Sato et al. [31] proved in their calculations that e.g., zinc oxide doped with Co2+ ions should display ferromagnetic properties. It is expected that the development of a technology of precise control of doped ZnO NMs properties is crucial for finding an application of these materials in electronics, optoelectronics, photovoltaics, and spintronics [32,33].
One of the most interesting doped NMs is Co2+-doped ZnO (Zn1−xCoxO) [34]. The search for the phrases: “doped ZnO” and “cobalt-doped ZnO” in the ScienceDirect search engine yielded 41,814 and 4955 hits, respectively (April 2018). The search results presented in Figure 1 prove the growing popularity of research on doped ZnO. Papers concerning cobalt-doped ZnO account for circa 12% of the number of the published scientific articles about doped ZnO (Figure 1).
The most often obtained forms of Zn1−xCoxO NMs are: nanoparticles (NPs), nanorods, nanowires, nanoflowers, core-shells, and thin films [34,35,36,37,38,39,40,41,42,43,44,45,46,47,48,49,50,51,52,53,54,55,56,57,58,59]. Zn1−xCoxO NMs can be obtained by such methods as, e.g., sol-gel [34,35,36,37,38], precipitation [34,39,40,41], calcination [34,42,43,44,45,46], vaporisation-condensation [47], pulsed-laser deposition [48], hydrothermal synthesis [42,43,44,49,50,51,52], solvothermal synthesis [28,34,53,54,55,56,57], combustion [58], and microemulsion [34,59]. Some of most interesting methods of Zn1−xCoxO NPs and ZnO NPs syntheses are microwave-assisted syntheses.
The dynamic development of the broadly understood microwave heating technology and the new design solutions of microwave reactors have contributed to the increased popularity of the microwave solvothermal synthesis (MSS) [60,61,62,63,64] and the microwave hydrothermal synthesis (MHS) methods [65,66,67]. The advantages of microwave heating and microwave syntheses of NMs and organic compounds are described in detail in the relevant literature [63,64,65,66,67,68,69,70,71,72,73,74]. In the case of the synthesis of doped ZnO NMs, it must be emphasised that microwave methods ensure 100% purity of reaction conditions thanks to the course of synthesis in a reaction chamber formed in a chemically inert material, e.g., Teflon®. Synthesis reaction purity is necessary for obtaining doped ZnO NMs with a repeatable chemical composition. Doped ZnO NMs obtained by microwave methods, e.g., MSS, are characterised by high purity (contactless heating method), homogeneity, narrow particle size distribution, repeatability, and a low degree of agglomeration and aggregation [28,29].
The literature review reveals [28,34,35,36,37,38,39,40,41,42,43,44,45,46,47,48,49,50,51,52,53,54,55,56,57,58,59] that the magnetic and optical properties of the obtained Zn1−xCoxO NMs result from the employed synthesis method and sample preparation process. Despite the numerous publications, the topic of the syntheses and properties of Zn1−xCoxO NMs still remains quite controversial. The majority of papers argue that the ferromagnetic properties of the obtained Zn1−xCoxO samples result exclusively from intrusions of foreign phases, not from the presence of the Co2+ dopant itself. Skillful selection of the synthesis method and sample preparation process of Zn1−xCoxO is extremely important since it permits avoiding the formation of foreign phases, e.g., cobalt oxides (CoO, Co2O3, CoO(OH), Co3O4 [75,76]), metallic cobalt [28,35], and spinel zinc cobaltite (ZnCo2O4) [42].
The leitmotif in the majority of publications is the examination of the impact of the Zn1−xCoxO synthesis method on the properties of the obtained samples, while the issue of precise control of Zn1−xCoxO NPs size is discussed sporadically. One of the easiest and most popular methods of changing the Zn1−xCoxO NPs size is sample soaking, e.g., in a chamber furnace, where the high temperature causes particle growth [28,34,35,36,37,38,39,40,41,42,43,44,45,46]. By using this method, we managed to increase the average size of Zn1−xCoxO NPs from ≈30 nm to ≈350 nm [28]. However, the application of this method contributes to the change of Zn1−xCoxO NPs properties, not only as a result of the change of their size but also through the precipitation of foreign phases. The soaking of Zn1−xCoxO samples in an oxidising atmosphere usually causes the oxidation of Co2+ to Co3+ and the formation of various cobalt oxides [28,36,75] and spinel zinc cobaltite. The soaking in a reducing atmosphere, in turn, causes the reduction of Co2+ ions to metallic Co. Zn1−xCoxO NPs prepared by this method are characterised by a compact heterogeneous structure in which agglomerates and aggregates prevail [28].
Another method that permits controlling the Zn1−xCoxO NPs size by changing the synthesis duration and temperature [50] is the hydrothermal method. The mechanism of Zn1−xCoxO particle growth is explained by the phenomenon of recrystallisation. However, the hydrothermal synthesis of Zn1−xCoxO NPs may lead to formation of foreign phases, e.g., Co3O4 [51,75] and ZnCo2O4 [42,44], while synthesis products are usually heterogeneous [34,42,44,51,52]. One of the most interesting and promising methods of obtaining Zn1−xCoxO NPs is the solvothermal method, where the size, morphology, and magnetic properties depend on the type of the organic solvent used [28,34,49,53,54,55,56,57]. Our earlier publication [28] proves the usefulness of the MSS in obtaining homogeneous Zn1−xCoxO NPs (where ), in which no precipitated foreign phases were detected. We used zinc acetate, cobalt acetate, and ethylene glycol (EG) as reagents. The organic solvent we selected, EG, had reducing properties, thanks to which it prevented the oxidisation of Co2+ to Co3+ during the synthesis. At the same time, it is a too weak reducing agent to reduce Co2+ to metallic Co. It must be emphasised that the MSS method also has great potential for obtaining ZnO NPs. The MSS of ZnO NPs developed by us permits controlling the NPs size within the range of 15 nm to 120 nm [60,61].
It is necessary to develop a fully reproducible method enabling precise control of Zn1−xCoxO NPs size in order to examine the impact of NPs size on their properties, but the methods applied for this purpose must not cause a change of the oxidation state of the Co2+ dopant or the precipitation of foreign phases (e.g., Co, CoO, CoO(OH), Co2O3, ZnCo2O4).
The aim of this paper was to prove that the method, discovered by us, of controlling the size of ZnO NPs obtained by MSS, consisting in changing the water content in the precursor [60,61], may also be used for controlling the size of Zn1−xCoxO NPs. What should be stressed is the uniqueness of the organic solvent selected by us, namely ethylene glycol, which fulfilled the function of substrate, dopant (Co2+)-stabilising agent, and eliminated uncontrolled particle growth in the MSS of Zn1−xCoxO NPs [60,61].
2. Materials and Methods
2.1. Substrates
The following reagents were used: zinc acetate dihydrate (Zn(CH3COO)2·2H2O, Zn(Ac)2·2H2O analytically pure, Chempur, Piekary Śląskie, Poland); cobalt(II) acetate tetrahydrate (Co(CH3COO)2·4H2O, Co(Ac)2·4H2O pure, Sigma-Aldrich, Saint Louis, MO, USA); ethylene glycol (EG, ethane-1,2-diol, C2H4(OH)2, pure, Chempur, Piekary Śląskie, Poland); deionised water (H2O) (specific conductance < 0.1 μS/cm, HLP 20UV, Hydrolab, Straszyn, Poland). The reagents were not subjected to any purification processes and were used as received.
2.2. Synthesis of Zn1−xCoxO NPs
Zn0.9Co0.1O NPs were obtained by means of MSS in accordance with the procedure described in our earlier publications [28,29,62]. The precursor was prepared by dissolving a calculated quantity of Zn(Ac)2·2H2O and Co(Ac)2·4H2O powders in 450 mL of EG to obtain a solution in which CmZn(Ac)2·2H₂O = 0.3254 mol/dm3 and CmCo(Ac)2·4H₂O = 0.0362 (mol/dm3). The composition of the precursor of Zn1−xCoxO NPs was calculated based on the following Equation (1):
where n is the quantity of moles of individual reagents, while x is the adopted nominal molar content of the Co2+ dopant in Zn1−xCoxO NPs.
The acetate mixture in EG was heated using a hot-plate magnetic stirrer (70 °C, 450 rpm, SLR, SI Analytics GmbH, Mainz, Germany). After the complete dissolution of the acetates, the obtained solution was distributed among five containers (100 mL, polypropylene), which were subsequently sealed. Once the containers had reached ambient temperature, the initial H2O content in the precursor was determined. Afterwards, calculated quantities of H2O were added to the obtained solutions so that the following final concentrations could be achieved: 1.5 wt %, 2 wt %, 3 wt %, 4 wt %, and 5 wt %. The results of the tests of the achieved H2O concentrations in precursor solutions are summarised in Table 1.
MSS was carried out in a microwave reactor (Model 02-02, 600 W, 2.45 GHz, ERTEC, Wrocław, Poland) [60]. The reactions of Zn0.9Co0.1O NPs synthesis are described by the following general Equation (2):
The synthesis parameters for each sample were identical: feedstock volume 75 mL, reaction duration 25 min; temperature 190 °C; microwave power 100%, reaction chamber cooling duration 20 min. After the synthesis, the suspensions were centrifuged (MPW-350, MPW Med Instruments, Warsaw, Poland) and subjected to decantation. All sediments were rinsed three times with deionised water. In order to obtain dry powders out of moist sediments, water suspensions with the concentration of ≈2.4% were obtained and subsequently rapidly cooled down with liquid nitrogen and dried in a freeze dryer (Lyovac GT-2, SRK Systemtechnik GmbH, Riedstadt, Germany).
2.3. Water Content Analysis
Water concentration in the samples was determined with the use of the automatic titrator (Cou-Lo AquaMAX KF, GR Scientific, Bedford, UK), which applied the coulometric titration technique based on the assumptions of the Karl Fisher method [60,61]. The following coulometric reagents dedicated by the titrator manufacturer were used: Aquagent® Coulometric OIL anolyte (cat. no. AQ00250100, Scharlau, Barcelona, Spain) and catholyte (Aquagent® Coulometric CG, cat. no. AQ00230050, Scharlau, Barcelona, Spain). The tests were carried out in accordance with the internal laboratory measurement procedure and the titrator user’s manual. The samples were collected/injected using glass syringes (1 mL), which were weighed using analytical scales (WAA 100/C/1, RADWAG, Radom, Poland).
2.4. X-ray Powder Diffraction
The phase composition of the samples was analysed by the X-ray diffraction (XRD) method using an X’Pert PRO diffractometer (Panalytical, Almelo, The Netherlands) equipped with a copper lamp (CuKα). The diffraction patterns were recorded within the range of 2 theta angle from 10° to 150° with a step of 0.02° at room temperature. Based on the diffraction patterns, the size of crystallites was determined in the direction of the crystallographic axes a and c using Scherrer’s formula [9,29,60].
The parameters of the unit cell, a and c, were determined by the Rietveld method. This method of diffraction pattern analysis is based on the non-linear method of least squares and was developed by Hugo Rietveld [77].
2.5. Crystallite Size Distribution
The results of average crystallite size, deviation of the average crystallite size, and crystallite size distribution were obtained by analysing the profile of XRD peaks by the FW15/45M method [78], which also permits analysing polydispersive powders. The employed FW15/45M method uses equations dedicated to spherical crystallites and was implemented in the Nanopowder XRD Processor Demo web application [79], where results of the samples were obtained by dropping diffraction pattern files directly to the browser window [79]. Data from the obtained crystallite size distributions for individual samples were exported from the “Method FW1/4/5M of full Grain Size Distribution Determination” server [80].
2.6. Measurement of Density and Specific Surface Area
Before the tests (density, specific surface area (SSA)), NPs samples were degassed in a VacPrep 061 (Micromeritics®) degassing station for 2 h (0.05 mbar, 150 °C). The sample weight was determined using analytical scales (WAA 100/C/1, RADWAG, Radom, Poland).
The skeleton density (pycnometric density) of NPs samples was tested in accordance with ISO 12154:2014 standard using a AccuPyc II 1340 helium pycnometer (FoamPyc V1.06, Micromeritics®, Norcross, GA, USA) at room temperature (24 ± 1 °C). The specific surface area (SSA) of NPs was tested in accordance with ISO 9277:2010 standard using a Gemini 2360 surface analyser (V 2.01, Micromeritics®, Norcross, GA, USA) by the nitrogen (99.999% N2) adsorption method based on the linear form of the Brunauer-Emmett-Teller (BET) isotherm equation in the P/P0 range of 0.05–0.25. The standard deviation of the specific surface area results was calculated using MicroActive software V4.03 (Interactive Data Analysis Software, Micromeritics®, Norcross, GA, USA).
The average NPs size was calculated based on the results of skeleton density and specific surface area with the assumption that the tested samples contained only spherical and identical NPs. The equation used for calculating the average particle size and the description and comparison of that method with other methods of average particle size determination, e.g., transmission electron microscopy image analysis and X-ray methods, can be found in our earlier publications [9,29,60,81].
2.7. Morphology Characteristics and Determination of Nanoparticle Size Distribution
The morphology of Zn0.9Co0.1O NPs samples was determined using a scanning electron microscope (SEM) ULTRA PLUS (ZEISS, Oberkochen, Germany). Before performing the SEM observations, the samples were coated with a thin carbon layer (SCD 005/CEA 035, BAL-TEC AG, Balzers, Liechtenstein).
The transmission electron microscopy (TEM) (Talos F200X, Thermo Scientific™, Waltham, MA, USA) tests were used to determine the nanoparticle size distribution. The samples for the TEM observations were prepared by dropping the ethanol particle dispersion, created by an ultrasonic technique, on a carbon film supported on a 300-mesh copper grid. The compilation of the results consisted in a graphic analysis of size of individual particles recorded in six microscopic images made by two methods: the bright field (analysis of three photographs) and the dark field (analysis of three photographs). The particle size determination consisted in finding the diameter of a circle circumscribed around each particle. The diameters were determined with the use of CorelDraw17 and Excel 2016 software. The diameters were determined for at least 200 particles in each sample, and subsequently a bar chart of the quantity of particles with diameters from a given range of values was created. The average particle size was provided as an average calculated with the use of OriginPro 8.0 software, using the matching of the logarithmic distribution curve.
2.8. Chemical Composition Analysis
The quantitative microanalysis of zinc and cobalt content was performed using energy dispersive spectrometry (EDS) with the use of Quantax 400 (Bruker, Billerica, MA, USA). The analysis covered pressed Zn0.9Co0.1O NPs samples (pastilles with the diameter of 5 mm). Each result of the quantitative analysis of zinc and cobalt provided herein is an average value obtained from five analyses of different areas of the sample.
The quantitative analysis of zinc and cobalt content was carried out by inductively coupled argon plasma optical emission spectrometry (ICP-OES) (Agilent Technologies, model 5100, Palo Alto, CA, USA). Zn0.9Co0.1O NPs samples for ICP-OES analyses were dissolved in concentrated nitric acid (HNO3) at room temperature.
3. Results and Discussion
3.1. Morphology
Figure 2, Figure 3 and Figure 4 present selected representative SEM images of Zn0.9Co0.1O NPs samples. An impact of the change of H2O content in the precursor on the morphology and size of Zn0.9Co0.1O NPs was observed. Powders obtained from the precursor with the water contents of 1.5% and 2% are composed of compact structures resembling a “cauliflower” structure, which is visible in Figure 3a,b. NPs obtained from the precursor with the H2O content of 3, 4, and 5% had a homogeneous and loose structure (Figure 2). Figure 4 reflects a change in the size of Zn0.9Co0.1O NPs from homogeneous spherical (1.5%, 2%, 3%) to elliptical (4%, 5%). The growth of particle size in line with the growth of H2O content in the precursors used for the reaction can be seen (Figure 3). The average particle size increases from circa 30–35 nm to 50–80 nm with the increase in H2O content from 1.5 to 5%. Figure 4e, for the powder obtained from the precursor with 5% H2O content, shows single NPs with a size greater than 100 nm, which may suggest that apart from the increase in the average size, the NPs size distribution becomes wider. A similar impact of the change of water content on the change of size and shape was also observed for undoped ZnO NPs [60].
Similar to our earlier article [29] concerning Mn2+-doped ZnO, SEM tests revealed that every precursor composition had to be considered individually. This means that in order to eliminate the processes of agglomeration and aggregation of Zn0.9 Co0.1O NPs, the synthesis parameters must be optimised for each precursor composition. Based on the results of our earlier papers [61], we argue that an optimisation of the synthesis parameters, i.e., a change of microwave power, duration, and synthesis temperature, will not contribute to a change of the size of the obtained Zn0.9Co0.1O NPs. A modification of the precursor composition, in turn, may contribute to a change of the size, shape, and quantity of the Co2+ dopant in the obtained Zn0.9 Co0.1O NPs.
3.2. Chemical Composition
The actual content of Co2+ dopant in Zn0.9Co0.1O NPs samples is summarised in Table 2. The chemical composition analysis was carried out by two methods: ICP-OES and EDS. The obtained results of the analyses are inconsistent, which is the consequence of the limitations and accuracy of these methods in the quantitative determination of zinc and cobalt, which applies in particular to the EDS method. The visible differences in the dopant content ranging from 9.06 to 9.90% are not statistically significant for the EDS method. In accordance with ISO 22309:2011 standard, in order to achieve a negligible measurement error resulting from the preparation process, the surface of the analysed sample must be flat and smooth and the analysed area must be homogeneous in the whole analysed sample region. The visible differences in the results of quantitative analyses of Zn2+ and Co2+ may result primarily from the difference in the porosity of Zn0.9Co0.1O NPs pastilles rather than the actual differences of Co2+ dopant quantities in the obtained samples. The ICP-OES analysis is considered as one of the most accurate and precise methods of chemical composition determination. The results of the Co2+ content obtained by the ICP-OES method for samples obtained from precursors with H2O contents of 2%, 3%, and 4% are ≈7.70%, while for samples with 1.5% H2O and 5% H2O the results are 7.97% and 8.09%, respectively. There is no trend in the changes in Co2+ content in the samples which were obtained for the increase in H2O content in the precursors. However, after taking into account the standard deviation of the results of Zn2+ and Co2+ analyses, it can be stated that there are no significant changes in the dopant contents in the obtained samples. In order to compare the repeatability of the MSS of Zn0.9Co0.1O NPs, Table 2 contains the result of the analysis of composition of the Zn0.9Co0.1O NPs reference sample obtained by the ICP-OES method [28]. The results of ICP-OES analyses of the Co2+ content in Zn0.9Co0.1O NPs samples are smaller by circa 1.3% than the reference sample result, which may be an effect of several factors, such as the lack of repeatability of syntheses, the impact of quality of the new batch of reagents on the doping degree, and the impact of the application of a different preparation process of samples in ICP-OES analyses, among others. The average efficiency of doping with Co2+ ions calculated based on ICP-OES results in the obtained Zn0.9Co0.1O NPs samples was circa 78%. The high doping efficiency can be explained by the negligible difference between the ionic radius values of Zn2+ and Co2+ ions [28].
3.3. Phase Composition and Lattice Parameters
The results of XRD tests for all obtained Zn0.9Co0.1O NPs samples indicated the presence of only one crystalline phase, which was attributed to the hexagonal phase of ZnO (Figure 5). The most stable crystalline structure of ZnO is the hexagonal wurtzite structure (JCPDS No. 36-1451, space group: P63mc) with two lattice parameters: a = 3.2498 Å and c = 5.2066 Å. The c/a ratio of ZnO lattice parameters is equal to 1.6021 and is similar to the c/a ratio value of 1.6330 for the close-packed hexagonal structure (hcp) [82]. Cobalt(II) oxide CoO crystallises in two stable phases: cubic rocksalt CoO (c-CoO, space group: Fm3m) and hexagonal wurtzite CoO (h-CoO, space group: P63mc). Given the fact that the ionic radius of Zn2+ is 0.74 Å while that of Co2+ is 0.745 Å and that CoO may also crystallise in the hexagonal structure, it may be presumed that doping, i.e., the substitution of Zn2+ for Co2+ in ZnO, and the change of NPs size should not greatly contribute to the change of the lattice parameters.
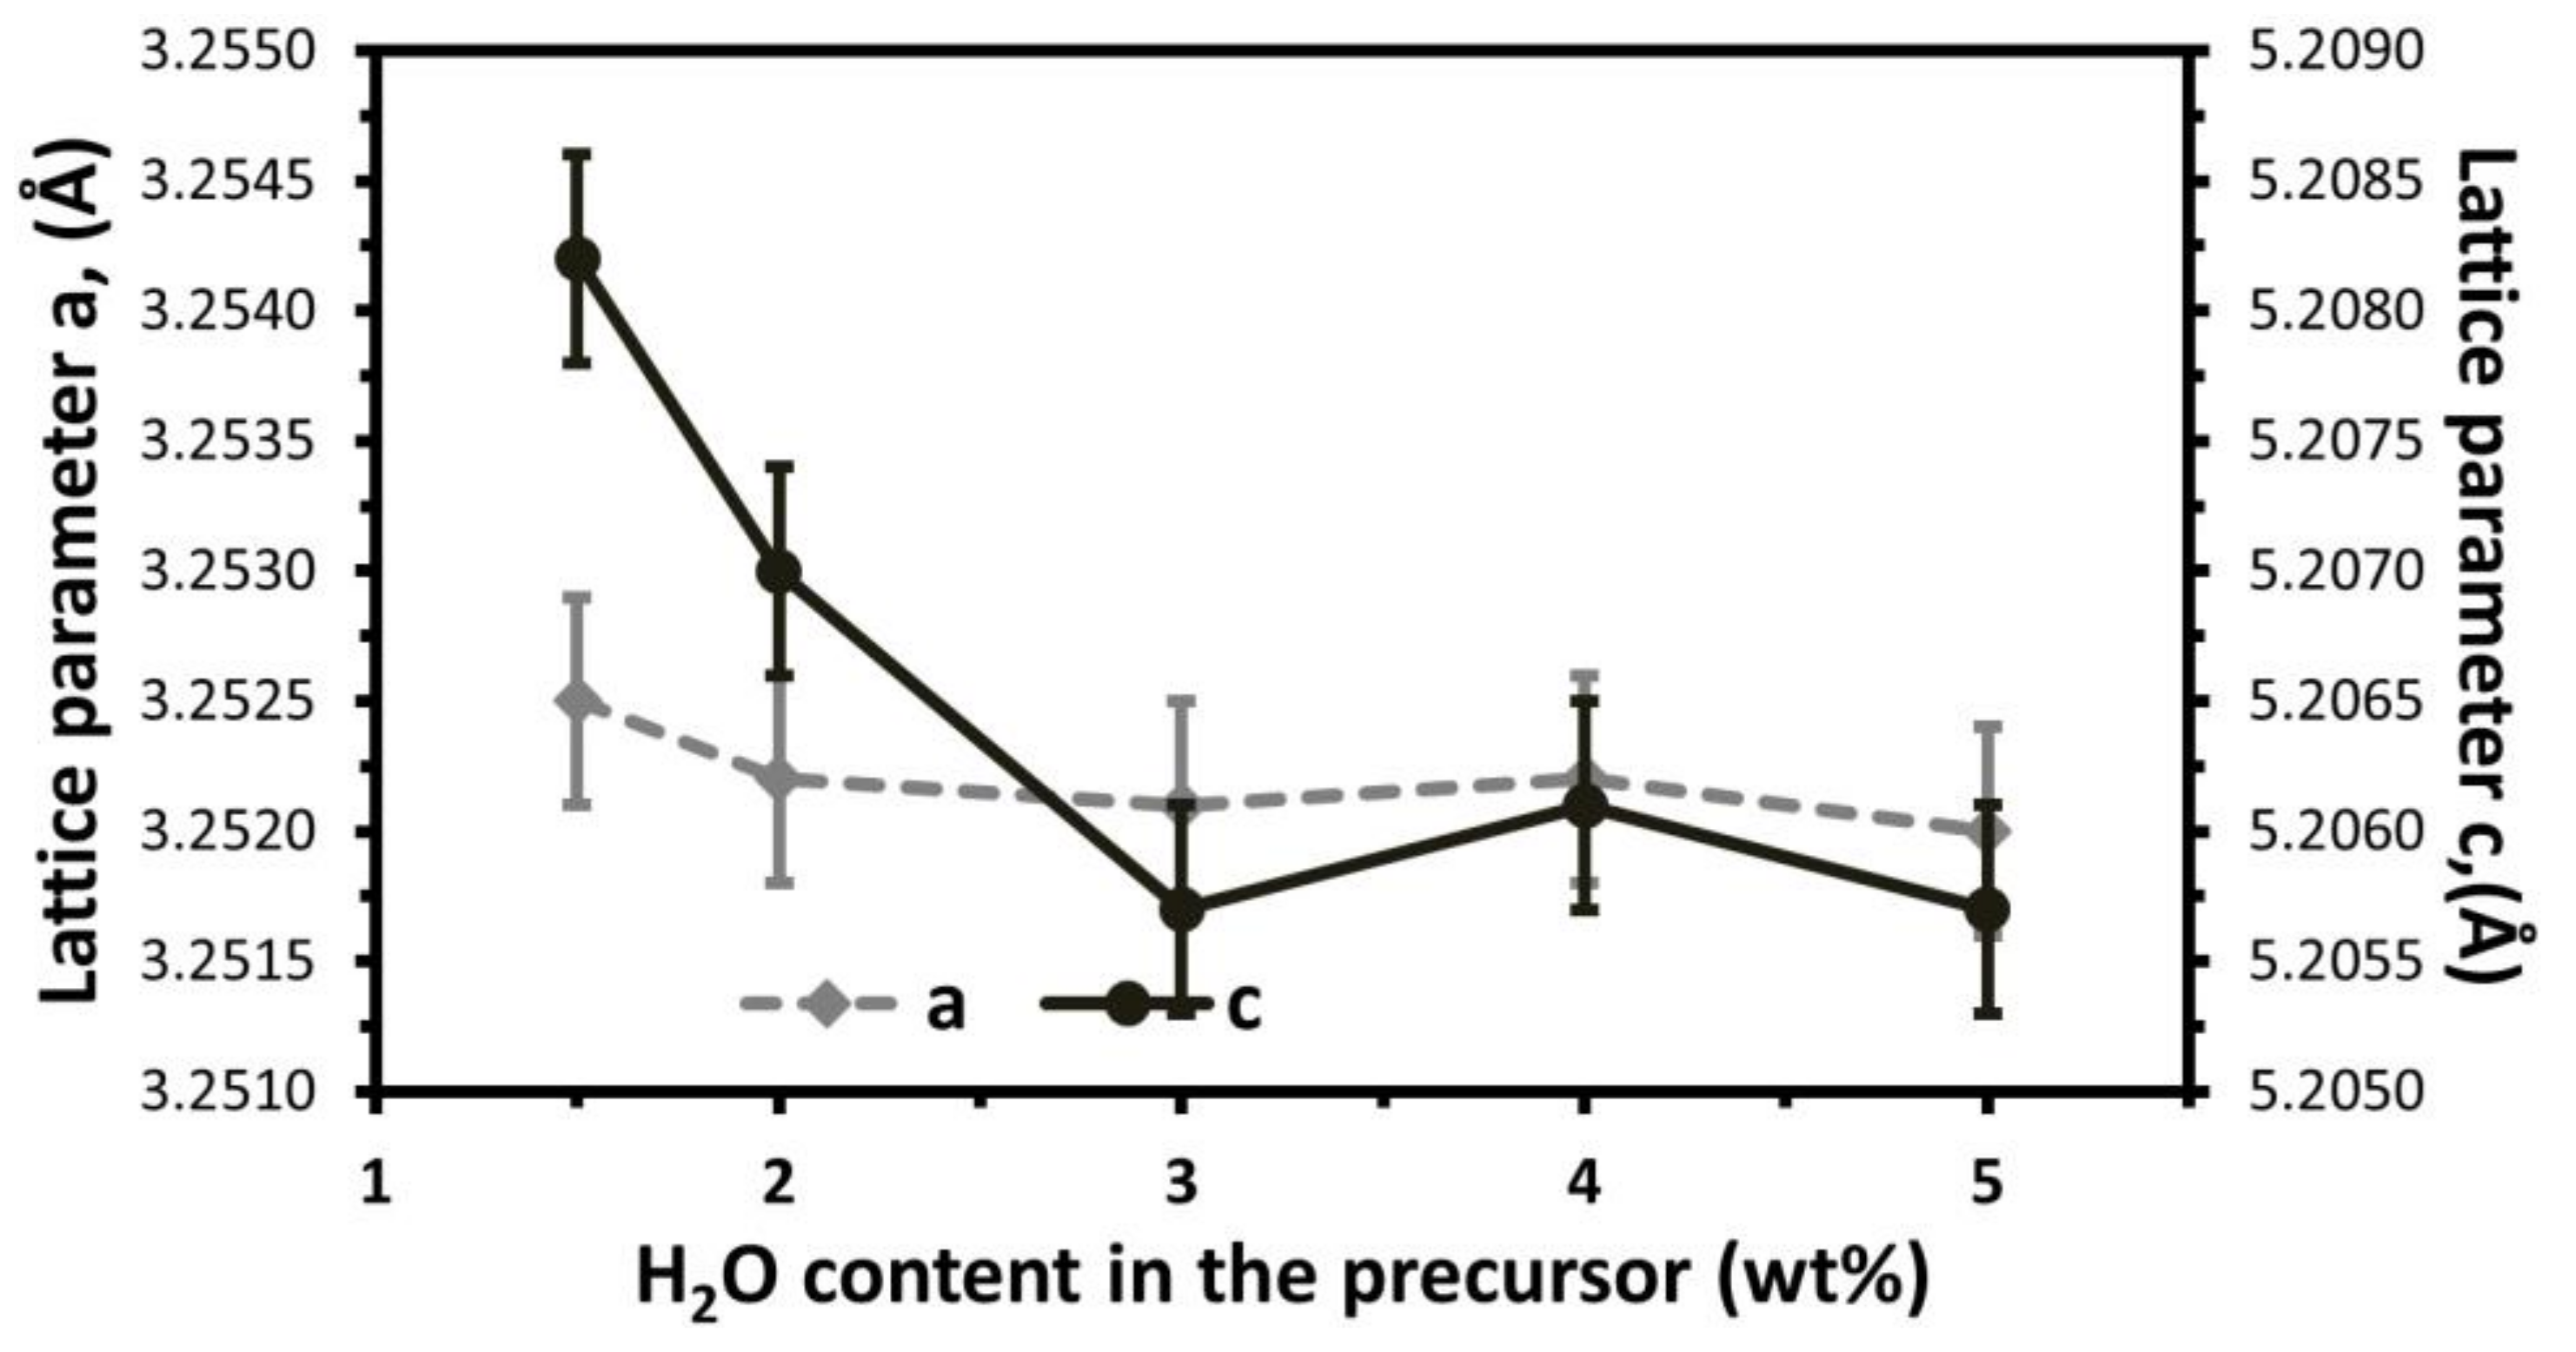
The calculated lattice parameters for Zn0.9Co0.1O NPs samples are summarised in Table 3 and Figure 6. Based on changes of lattice parameters of the Zn0.9Co0.1O NPs (1.5% H2O) sample in relation to the undoped ZnO NPs (1.5% H2O) sample and XRD results, we believe that Co2+ ions were integrated into the crystalline lattice of ZnO as a substitution for some Zn2+ ions. The value of the a lattice parameter of Zn0.9Co0.1O NPs samples did not change to a considerable degree with the increase in H2O content (Table 3, Figure 6). The c parameter indicated a decreasing trend within the water content range of 1.5 to 3%, and adopted a constant value within the range of 3 to 5%. The ICP-OES test did not reveal any significant impact of the change of H2O content in the precursor upon the change of the Co2+ dopant content, and therefore we believe that the change of lattice parameters of Zn0.9Co0.1O NPs is caused mainly by the change of the unit cell dimension caused by the change of NPs size. The change of the c lattice parameter can be explained by the results of the examination of the course of the microwave solvothermal synthesis of ZnO NPs [61], which distinguishes the stage of the formation of crystalline nuclei of ZnO sized 14–16 nm and the stage of their growth. We presume that in this case the developing nuclei (core) of Zn0.9Co0.1O have different crystalline lattice parameters than the part of the crystalline structure (shell) of Zn0.9Co0.1O NPs that forms on the nuclei as a result of their growth. Another cause of the change of lattice parameter values as a result of the impact of H2O content may be also the change of the quantity and distribution of clusters of Co2+ dopant in the crystalline lattice of Zn0.9Co0.1O NPs. Further research is required to confirm the causes of the changes of lattice parameters.
The value of the c/a lattice parameter ratio in the close-packed hexagonal structure ZnO is calculated based on the theoretical closest packing of identical spheres in the three-dimensional spatial lattice of the hexagonal structure [82]. The differences visible in Table 3 between the values of c/a lattice parameter ratios for actual samples and hcp ZnO result from several simultaneous factors:
- -
- differences in the ionic radii of O2−, Zn2+, and Co2+
- -
- attractive and repulsive electrostatic interactions between the ions in the crystalline lattice (these interactions affect the optimum distances between the ions in ZnO and doped ZnO)
- -
- existing defects in the actual crystalline lattice
- -
- changes in the quantity of defects in the crystalline lattice depending on the NPs size and the dopant quantity.
The results of the c/a lattice parameter ratio indicate that the change of Zn0.9Co0.1O NPs sizes leads to a less close packing in the crystalline structure (Table 3).
Phase purity is the inevitable topic when discussing the properties of doped ZnO NMs. While verifying the phase purity of doped NMs, the limitations of the methods employed for this purpose must be remembered at all times. For example, the foreign phase detectability limit in the XRD method may be even 5–6 at%. Moreover, the XRD method is unable to detect foreign amorphous phases. The purity of the obtained doped NMs should be confirmed by multiple characterisation methods [67]. In our earlier publication [28], we additionally proved the purity of Zn0.9Co0.1O NPs obtained using MSS by means of a test of the ability of the extended X-ray absorption fine structure (EXAFS) to determine structural information and by testing the magnetic properties using superconducting quantum interference device (SQUID) magnetometry. We argue that the results of EXAFS and SQUID analyses included in the publication [28] are representative for the present Zn0.9Co0.1O NPs samples because they were obtained in an identical manner (using the same method, procedure, and reagents). It must be emphasised that the change of H2O content in the precursor did not cause the precipitation of foreign phases in Zn0.9Co0.1O samples, which confirms that the used solvent, EG, stabilised the Co2+ dopant ions and prevented the formation of byproducts, e.g., CoO [28].
3.4. Density, Specific Surface Area, Average Size, and Size Distribution of Zn0.9Co0.1O NPs
The obtained results are summarised in Table 4. The theoretical density of ZnO with the hexagonal structure is 5.61 g/cm3. The increase in the water content in the precursor caused an increase in the skeleton density of the obtained Zn0.9Co0.1O NPs samples from 5.05 g/cm3 to 5.35 g/cm3, as well as the decrease of SSA from 42.6 m2/g to 21.2 m2/g. When comparing the results of density of Zn0.9Co0.1O NPs with undoped ZnO NPs with similar SSA values [60], the density value of Zn0.9Co0.1O NPs sample is always lower. This is caused by the lower atomic weight of Co2+ (≈58.69 u) in comparison with the substituted Zn2+ ions (≈65.38 u) and the presence of defects in the crystalline lattice as a result of the presence of dopant ions. The observed correlation between the density and size of NPs is well-known and described in the literature, e.g., for ZnO [60,61], HAp [65,83], and ZrO2 [84].
The average size of Zn0.9Co0.1 O NPs determined from TEM changed from 23 nm to 52 nm with the increase in the H2O content in the precursor from 1.5 to 5% (Table 4, Figure 7). The average size of Zn0.9Co0.1O NPs calculated based on the specific surface area and skeleton density results ranged from 28 nm to 53 nm (Table 4). Based on the existing convergence of the results of the average size of NPs, obtained by the aforementioned methods, it can be stated that the NPs where spherical or close to spherical and were characterised by a relative homogeneity of sizes. Figure 7 shows the increasing trend of the average size of Zn0.9Co0.1O NPs and the distribution of Zn0.9Co0.1O NPs size resulting from the increase in the H2O content in the precursor. Similar correlations between the results of NPs size and the change of H2O content in the precursor were obtained during the microwave solvothermal synthesis of undoped ZnO NPs with a controlled size [60,61].
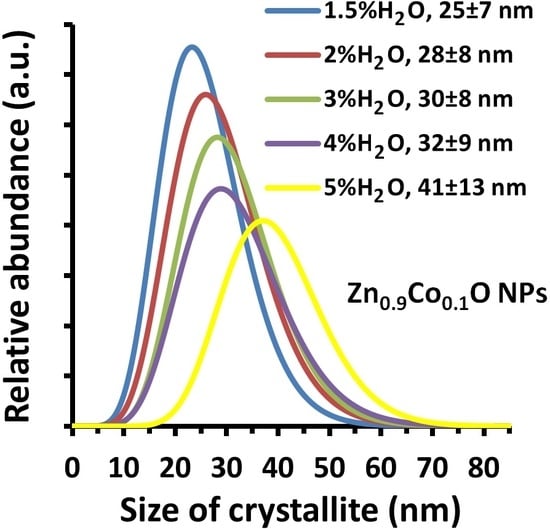
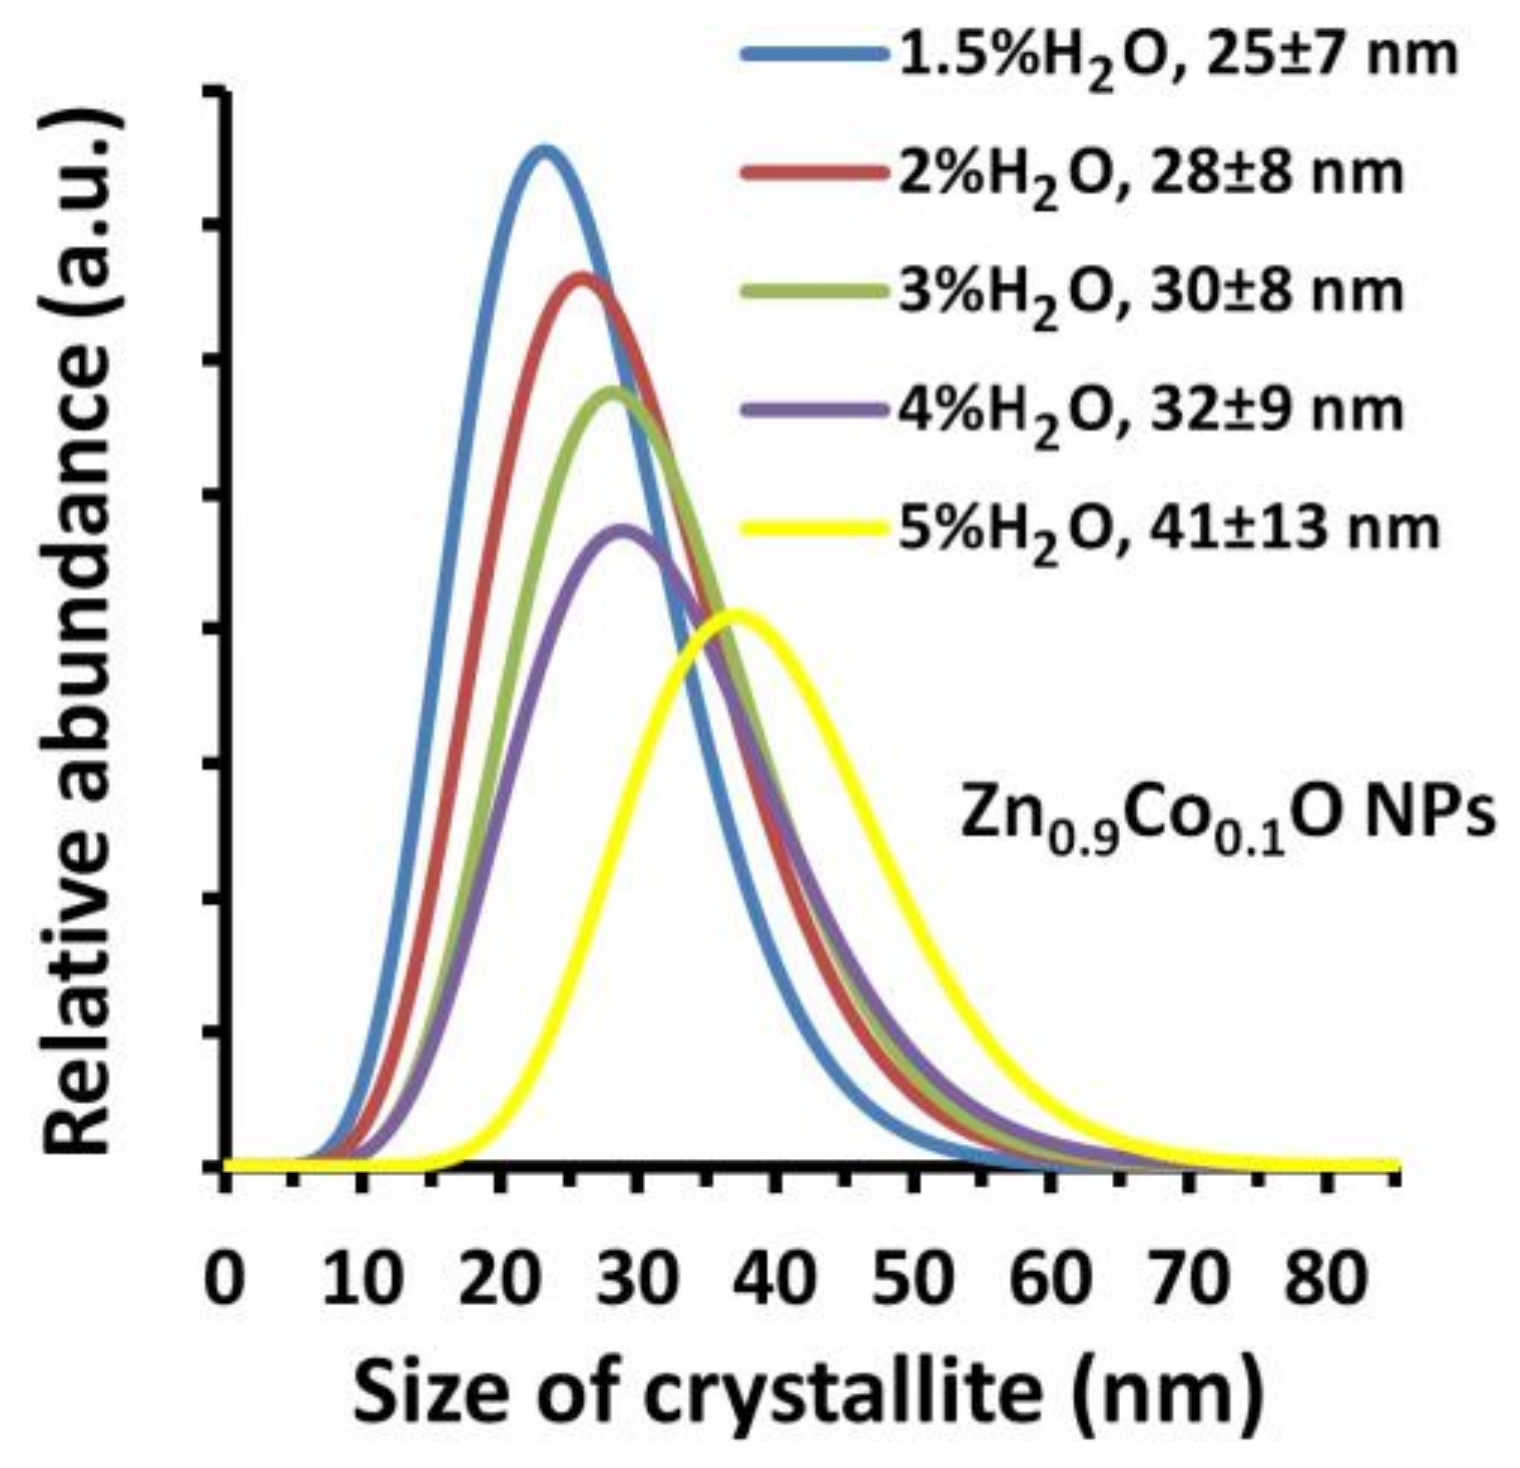
The XRD results served as a basis for determining the crystallite size and size distribution of Zn0.9Co0.1O (Table 4, Figure 8). The obtained results of crystallite size da and dc indicate that the increase in H2O content in the precursor led to the increase in size and the changes in proportions (asymmetry) of crystallites. In the case of increase in NPs size, a correlation of the increase in the da and dc crystallite dimension is visible, which may imply a change of the shape and an increase in the size distribution. The averaged crystallite size calculated in Nanopowder XRD Processor Demo [79] ranges from 25 ± 7 to 41 ± 13 nm. The obtained results confirm the increase in the standard deviation and in the crystallite size distribution depending on H2O content in the precursor (Table 4, Figure 7 and Figure 8).
The results of crystallite size obtained by two methods, Scherrer’s formula and Nanopowder XRD Processor Demo, yielded coinciding results falling within the standard deviation of these methods. When comparing the results of average particle size and average crystallite size, it can be stated that the NPs are built of single crystals. The small differences observed between particle sizes and crystallite sizes result from the general assumptions of these methods, which ultimately calculate the NPs size as the diameter of a sphere, without taking into account any changes of shapes of the obtained Zn0.9Co0.1O NPs.
3.5. Zn1−xCoxO NPs Size Control Mechanism
The method, discovered by us, of size control of undoped ZnO NPs obtained in the microwave solvothermal synthesis [60], which enables a precise control of the size of undoped ZnO NPs within the range of circa 15 nm to 120 nm by changing the H2O content in the precursor, was explained and verified by us [61]. The presented results of Zn0.9Co0.1O NPs samples confirmed that by changing the H2O content in the precursor it was also possible to control the size of Zn1−xCoxO NPs obtained by the microwave solvothermal synthesis. We believe that the mechanism of Zn1−xCoxO NPs size control is identical with the mechanism of ZnO NPs size control [61], but it must take into account an additional substrate: cobalt acetate. Generally, the mechanism of Zn1−xCoxO NPs size control can be described with the following equations:
The precursor of Zn0.9Co0.1O NPs synthesis is the strictly defined quantity of the mixture of zinc acetate and cobalt acetate dissolved in ethylene glycol (2). Zinc acetates and cobalt acetates in the glycol solution are subject to dissociation and hydrolysis (3), as a result of which acetic acid is formed (AcH).
We believe [61] that the intermediate in the MSS of Zn1−xCoxO NPs is Zn5(1−x)Co5x(OH)8(Ac)2·xH2O (cobalt-doped lamellar hydroxy zinc acetate–Co-doped LHZA) (5). The reaction of synthesis and growth of the intermediate is possible exclusively thanks to the co-existence of the esterification reaction (5), since only the water created in the esterification reaction participates in the formation/growth of the intermediate (6), which was already explained by us in detail [61]. Once the esterification equilibrium constant (5) has been reached, the intermediate decomposes rapidly under the influence of temperature into homogeneous Zn1−xCoxO NPs, which grow until the unreacted quantities of reagents (the remaining quantity of zinc acetate, cobalt acetate) are used up (7).
The control of Zn1−xCoxO NPs size is possible because the change of the water content in the precursor causes an inversely proportional change of the quantity of substrates, from which the intermediate is formed, as well as a directly proportional change of the quantity of substrates, from which Zn1−xCoxO NPs grow (8). In other words, an increase in the water quantity results in a shift of the esterification reaction equilibrium (6) towards the substrates, which means:
- -
- the quantity of reagents from which the intermediate is formed is decreased,
- -
- a smaller quantity of identical nuclei of Zn1−xCoxO crystallisation (7) forms as a result of the decomposition of the intermediate (Co-doped LHZA),
- -
- the quantity of reagents from which only the existing Zn1−xCoxO NPs grow is increased (8).
We argue that the method reported in this paper permits controlling Zn1−xCoxO NPs size within the range of circa 15 nm to 120 nm, i.e., the same as that for undoped ZnO NPs. In order to obtain Zn0.90Co0.10O NPs with a size below 28 nm, a precursor with an H2O content lower than 1.5% must be used; it can be prepared from dehydrated zinc acetate and dehydrated cobalt(II) acetate. Conversely, in order to obtain Zn0.90Co0.10O NPs with a size greater than 53 nm, a precursor with an H2O content greater than 5% must be used for the synthesis. The correlation between the Zn1−xCoxO NPs size and the H2O content in the precursor (NPs size = f(H2O)) may be different for various reagents [60], which results from differing contents of trace impurities, which may contribute to a shift of the esterification reaction equilibrium [61].
4. Conclusions
Zn0.9Co0.1O NPs were obtained by microwave solvothermal synthesis from a mixture of zinc acetate and cobalt acetate dissolved in ethylene glycol.
It was proved by the example of Zn0.9Co0.1O NPs (x = 10 mol %) that it was possible to precisely control the size of Zn1−xCoxO NPs in the microwave solvothermal synthesis process at least within the range of 28 nm to 53 nm by controlling the water quantity in the precursor.
The mechanism of Zn1−xCoxO NPs size control was explained and discussed based on our earlier results of tests concerning the microwave solvothermal synthesis of undoped ZnO NPs with a controlled size.
Our paper shows the high potential of the microwave solvothermal synthesis method to obtain homogeneous Zn1−xCoxO NPs as well as control their size.
We presume that the method of Zn1−xCoxO NPs size control presented here may be used also to optimise the properties of Mn2+ and Fe2+-doped ZnO NPs.
Acknowledgments
This paper was prepared as a result of the execution of the “PRELUDIUM 10” research project, Ref. no. UMO-2015/19/N/ST5/03668, financed by the National Science Centre, Poland. A part of the research was carried out with the use of equipment funded by the CePT project, reference: POIG.02.02.00-14-024/08, financed by the European Regional Development Fund within the Operational Programme “Innovative Economy” for 2007–2013. The TEM study was carried out at the Biological and Chemical Research Centre, University of Warsaw, established within the project co-financed by European Union from the European Regional Development Fund under the Operational Programme Innovative Economy, 2007–2013. The authors would like also to thank J. Mizeracki, A. Presz, and I. Koltsov from the Institute of High Pressure Physics of the Polish Academy of Sciences.
Author Contributions
Jacek Wojnarowicz conceived and designed the experiments; Jacek Wojnarowicz, Stanisław Gierlotka, and Kamil Sobczak performed the experiments; Jacek Wojnarowicz, Tadeusz Chudoba, Stanisław Gierlotka, Kamil Sobczak, and Witold Lojkowski analysed the data; Jacek Wojnarowicz wrote the paper.
Conflicts of Interest
The authors declare no conflict of interest.
References
- Klingshirn, C.F.; Waag, A.; Hoffmann, A.; Geurts, J. Zinc Oxide, 1st ed.; Springer: Berlin, Germany, 2010; ISBN 978-3-642-10576-0. [Google Scholar] [CrossRef]
- Escobedo-Morales, A.; Aranda-García, R.J.; Chigo-Anota, E.; Pérez-Centeno, A.; Méndez-Blas, A.; Arana-Toro, C.G. ZnO Micro- and Nanostructures Obtained by Thermal Oxidation: Microstructure, Morphogenesis, Optical, and Photoluminescence Properties. Crystals 2016, 6, 135. [Google Scholar] [CrossRef]
- Morkoç, H.; Özgür, Ü. Zinc Oxide: Fundamentals, Materials and Device Technology, 1st ed.; WILEY-VCH: Weinheim, Germany, 2009; ISBN 978-3-527-40813-9. [Google Scholar] [CrossRef]
- Ozgur, U.; Hofstetter, D.; Morkoc, H. 2010 ZnO devices and applications: A review of current status and future prospects. Proc. IEEE 2010, 98, 1255–1268. [Google Scholar] [CrossRef]
- Zhang, Y.; Nayak, T.R.; Hong, H.; Cai, W. Biomedical Applications of Zinc Oxide Nanomaterials. Curr. Mol. Med. 2013, 13, 1633–1645. [Google Scholar] [CrossRef] [PubMed]
- Cierech, M.; Kolenda, A.; Grudniak, A.M.; Wojnarowicz, J.; Woźniak, B.; Gołaś, M.; Swoboda-Kopeć, E.; Łojkowski, W.; Mierzwińska-Nastalska, E. Significance of polymethylmethacrylate (PMMA) modification by zinc oxide nanoparticles for fungal biofilm formation. Int. J. Pharm. 2016, 510, 323–335. [Google Scholar] [CrossRef] [PubMed]
- Osmond, M.J.; McCall, M.J. Zinc oxide nanoparticles in modern sunscreens: An analysis of potential exposure and hazard. Nanotoxicology 2010, 4, 15–41. [Google Scholar] [CrossRef] [PubMed]
- Coleman, V.A.; Jagadish, C. Basic Properties and Applications of ZnO. In Zinc Oxide Bulk, Thin Films and Nanostructures, 1st ed.; Jagadish, C., Pearton, S., Eds.; Elsevier: Oxford, UK, 2006; pp. 1–20. ISBN 978-0-08-044722-3. [Google Scholar] [CrossRef]
- Cierech, M.; Wojnarowicz, J.; Szmigiel, D.; Bączkowski, B.; Grudniak, A.; Wolska, K.; Łojkowski, W.; Mierzwińska-Nastalska, E. Preparation and characterization of ZnO-PMMA resin nanocomposites for denture bases. Acta Bioeng. Biomech. 2016, 18, 31–41. [Google Scholar] [CrossRef] [PubMed]
- Salzano de Luna, M.; Galizia, M.; Wojnarowicz, J.; Rosa, R.; Lojkowski, W.; Acierno, D.; Filippone, G.; Leonelli, C. Dispersing hydrophilic nanoparticles in hydrophobic polymers: HDPE/ZnO nanocomposites by a novel template-based approach. Express Polym. Lett. 2014, 8, 362–372. [Google Scholar] [CrossRef] [Green Version]
- ISO/TS 80004–1:2015 Nanotechnologies—Vocabulary—Part 1: Core Terms. Available online: https://www.iso.org/obp/ui/#iso:std:iso:ts:80004:-1:ed-2:v1:en (accessed on 10 January 2018).
- Guza, L.; Famá, L.; Candal, R.; Goyanes, S. Size effect of ZnO nanorods on physicochemical properties of plasticized starch composites. Carbohydr. Polym. 2017, 157, 1611–1619. [Google Scholar] [CrossRef] [PubMed]
- Yu, J.; Kim, H.J.; Go, M.R.; Bae, S.H.; Choi, S.J. ZnO Interactions with biomatrices: Effect of particle size on ZnO-protein corona. Nanomaterials 2017, 7, 377. [Google Scholar] [CrossRef] [PubMed]
- Goh, E.G.; Xu, X.; McCormick, P.G. Effect of particle size on the UV absorbance of zinc oxide nanoparticles. Scr. Mater. 2014, 78–79, 49–52. [Google Scholar] [CrossRef]
- Lopes, S.; Ribeiro, F.; Wojnarowicz, J.; Łojkowski, W.; Jurkschat, K.; Crossley, A.; Soares, A.M.V.M.; Loureiro, S. Zinc oxide nanoparticles toxicity to Daphnia magna: Size-dependent effects and dissolution. Environ. Toxicol. Chem. 2014, 33, 190–198. [Google Scholar] [CrossRef] [PubMed]
- Heggelund, L.R.; Diez-Ortiz, M.; Lofts, S.; Lahive, E.; Jurkschat, K.; Wojnarowicz, J.; Cedergreen, N.; Spurgeon, D.; Svendsen, C. Soil pH effects on the comparative toxicity of dissolved zinc, non-nano and nano ZnO to the earthworm Eisenia fetida. Nanotoxicology 2014, 8, 559–572. [Google Scholar] [CrossRef] [PubMed] [Green Version]
- The Global Market for Zinc Oxide Nanoparticles; ID: 3833830; Future Markets, Inc.: Edinburgh, UK, 2016.
- The Global Market for Nanotechnology and Nanomaterials in Cosmetics, Personal Care and Sunscreens; ID: 3784908; Future Markets, Inc.: Edinburgh, UK, 2016.
- Omelchenko, M.M.; Wojnarowicz, J.; Salamonczyk, M.; Lojkowski, W. Lyotropic liquid crystal based on zinc oxide nanoparticles obtained by microwave solvothermal synthesis. Mater. Chem. Phys. 2017, 192, 383–391. [Google Scholar] [CrossRef]
- Sabir, S.; Arshad, M.; Chaudhari, S.K. Zinc Oxide Nanoparticles for Revolutionizing Agriculture: Synthesis and Applications. Sci. World J. 2014, 2014, 925494. [Google Scholar] [CrossRef] [PubMed]
- Kamari, H.M.; Al-Hada, N.M.; Saion, E.; Shaari, A.H.; Talib, Z.A.; Flaifel, M.H.; Ahmed, A.A.A. Calcined Solution-Based PVP Influence on ZnO Semiconductor Nanoparticle Properties. Crystals 2017, 7, 2. [Google Scholar] [CrossRef]
- Ta, H.Q.; Zhao, L.; Pohl, D.; Pang, J.; Trzebicka, B.; Rellinghaus, B.; Pribat, D.; Gemming, T.; Liu, Z.; Bachmatiuk, A.; Rümmeli, M.H. Graphene-Like ZnO: A mini review. Crystals 2016, 6, 100. [Google Scholar] [CrossRef]
- Ohno, H. Making Nonmagnetic Semiconductors Ferromagnetic. Science 1998, 281, 951–956. [Google Scholar] [CrossRef] [PubMed]
- Norris, D.J.; Efros, A.L.; Erwin, S.C. Doped Nanocrystals. Science 2008, 319, 1776–1779. [Google Scholar] [CrossRef] [PubMed]
- Geetha, N.; Sivaranjani, S.; Ayeshamariam, A.; Suthan Kissinger, J.; Valan Arasu, M.; Jayachandran, M. ZnO doped oxide materials: Mini review. Fluid. Mech. Open Access 2016, 3, 141. [Google Scholar] [CrossRef]
- Pearton, S.J.; Norton, D.P.; Ivill, M.P.; Hebard, A.F.; Chen, W.M.; Buyanova, I.A.; Zavada, J.M. Transition metal doped ZnO for spintronics. J. Electron. Mater. 2007, 36, 462–471. [Google Scholar] [CrossRef]
- Glaspell, G.; Dutta, P.; Manivannan, A. A room-temperature and microwave synthesis of M-Doped ZnO (M=Co, Cr, Fe, Mn & Ni). J. Clust. Sci. 2005, 16, 523–536. [Google Scholar] [CrossRef]
- Wojnarowicz, J.; Kusnieruk, S.; Chudoba, T.; Gierlotka, S.; Lojkowski, W.; Knoff, W.; Lukasiewicz, M.I.; Witkowski, B.S.; Wolska, A.; Klepka, M.T.; et al. Paramagnetism of cobalt-doped ZnO nanoparticles obtained by microwave solvothermal synthesis. Beilstein J. Nanotechnol. 2015, 6, 1957–1969. [Google Scholar] [CrossRef] [PubMed]
- Wojnarowicz, J.; Mukhovskyi, R.; Pietrzykowska, E.; Kusnieruk, S.; Mizeracki, J.; Lojkowski, W. Microwave solvothermal synthesis and characterization of manganese-doped ZnO nanoparticles. Beilstein J. Nanotechnol. 2016, 7, 721–732. [Google Scholar] [CrossRef] [PubMed]
- Dietl, T.; Ohno, H.; Matsukura, M.; Cibert, J.; Ferrand, D. Zener Model Description of Ferromagnetism in Zinc-Blende Magnetic Semiconductors. Science 2000, 287, 1019–2000. [Google Scholar] [CrossRef] [PubMed]
- Sato, K.; Katayama-Yosida, H. First principles materials design for semiconductor spintronics. Semicond. Sci. Technol. 2002, 17, 367–376. [Google Scholar] [CrossRef]
- Reynolds, J.G.; Lewis Reynolds, C. Progress in ZnO acceptor doping: What is the best strategy? Adv. Condens. Matter Phys. 2014, 2014, 457058. [Google Scholar] [CrossRef]
- Shah, S.M.; Naz, H.; Ali, R.N.; Alam, F.; Ali, A.; Farooq, M.; Shah, A.; Badshah, A.; Siddiq, A.; Waseem, A. Optical and morphological studies of transition metal doped ZnO nanorods and their applications in hybrid bulk heterojunction solar cells. Arab. J. Chem. 2017, 10, 1118–1124. [Google Scholar] [CrossRef]
- Djerdj, J.; Jagličić, Z.; Arčon, D.; Niederberger, M. Co-Doped ZnO nanoparticles: Mini review. Nanoscale 2010, 2, 1096–1104. [Google Scholar] [CrossRef] [PubMed]
- Park, J.H.; Kim, M.G.; Jang, H.M.; Ryu, S.; Kim, Y.M. Co-metal clustering as the origin of ferromagnetism in Co-doped ZnO thin films. Appl. Phys. Lett. 2004, 84, 1338–1340. [Google Scholar] [CrossRef]
- Shi, T.; Zhu, S. Structures and magnetic properties of wurtzite Zn1−xCoxO dilute magnetic semiconductor nanocomposites. Appl. Phys. Lett. 2007, 90, 102108. [Google Scholar] [CrossRef]
- Shi, T.; Xiao, Z.; Yin, Z.; Li, X.; Wang, Y.; He, H.; Wang, J.; Yan, W.; Wei, S. The role of Zn interstitials in cobalt-doped ZnO diluted magnetic semiconductors. Appl. Phys. Lett. 2010, 96, 211905. [Google Scholar] [CrossRef]
- Kaushik, A.; Dalela, B.; Rathore, R.; Vats, V.S.; Choudhary, B.L.; Alvi, P.A.; Kumar, S.; Dalela, S. Influence of Co doping on the structural, optical and magnetic properties of ZnO nanocrystals. J. Alloys Compd. 2013, 578, 328–335. [Google Scholar] [CrossRef]
- Nair, M.G.; Nirmala, M.; Rekha, K.; Anukaliani, A. Structural, optical, photo catalytic and antibacterial activity of ZnO and Co doped ZnO nanoparticles. Mater. Lett. 2011, 65, 1797–1800. [Google Scholar] [CrossRef]
- Chithra, M.J.; Pushpanathan, K.; Loganathan, M. Structural and optical properties of Co-Doped ZnO nanoparticles synthesized by precipitation method. Mater. Manuf. Process. 2014, 29, 771–779. [Google Scholar] [CrossRef]
- Fabbiyola, S.; Kennedy, L.J.; Aruldoss, U.; Bououdina, M.; Dakhel, A.A.; JudithVijay, J. Synthesis of Co-doped ZnO nanoparticles via co-precipitation: Structural, optical and magnetic properties. Powder Technol. 2015, 286, 757–765. [Google Scholar] [CrossRef]
- Kuryliszyn-Kudelska, I.; Hadžić, B.; Sibera, D.; Romčević, M.; Romčević, N.; Narkiewicz, U.; Łojkowski, W.; Arciszewska, M.; Dobrowolski, W. Magnetic properties of ZnO(Co) nanocrystals. J. Alloys Compd. 2013, 561, 247–251. [Google Scholar] [CrossRef]
- Hadžić, B.; Romčević, N.; Romčević, M.; Kuryliszyn-Kudelska, I.; Dobrowolski, W.; Trajić, J.; Timotijević, D.; Narkiewicz, U.; Sibera, D. Surface optical phonons in ZnO(Co) nanoparticles: Raman study. J. Alloys Compd. 2012, 540, 49–56. [Google Scholar] [CrossRef]
- Typek, J.; Guskos, N.; Zolnierkiewicz, G.; Sibera, D.; Narkiewicz, U. Magnetic resonance study of Co-doped ZnO nanomaterials: A case of high doping. Rev. Adv. Mater. Sci. 2017, 50, 76–87. [Google Scholar]
- Mesaros, A.; Ghitulica, C.D.; Popa, M.; Mereu, R.; Popa, A.; Petrisor, T., Jr.; Gabor, M.; Ionut Cadis, A.; Vasile, B.S. Synthesis, structural and morphological characteristics, magnetic and optical properties of Co doped ZnO nanoparticles. Ceram. Int. 2014, 40, 2835–2846. [Google Scholar] [CrossRef]
- Sharma, N.; Thakur, S.; Sharma, R.; Kumar, J. Effect of cobalt doping on physical properties of ZnO nanoparticles. CPUH-Res. J. 2016, 1, 47–51. [Google Scholar]
- Martínez, B.; Sandiumenge, F.; Balcells, L.I.; Arbiol, J.; Sibieude, F.; Monty, C. Structure and magnetic properties of Co-doped ZnO nanoparticles. Phys. Rev. B 2005, 72, 165202. [Google Scholar] [CrossRef]
- Ivill, M.; Pearton, S.J.; Rawal, S.; Leu, L.; Sadik, P.; Das, R.; Hebard, A.F.; Chisholm, M.; Budai, J.D.; Norton, J.D. Structure and magnetism of cobalt-doped ZnO thin films. New J. Phys. 2008, 10, 065002. [Google Scholar] [CrossRef]
- Zhao, J.; Yan, X.; Lei, Y.; Zhao, Y.; Huang, Y.; Zhang, Y. Size control of Co-doped ZnO rods by changing the solvent. Adv. Mater. Res. 2012, 1, 75–81. [Google Scholar] [CrossRef]
- Annesh, P.M.; Cherian, C.T.; Jayaraj, M.K.; Endo, T. Co2+ doped ZnO nanoflowers grown by hydrothermal method. J. Ceram. Soc. Jpn. 2010, 118, 333–336. [Google Scholar] [CrossRef]
- Xu, X.; Cao, C. Hydrothermal synthesis of Co-doped ZnO flakes with room temperature ferromagnetism. J. Alloys Compd. 2010, 501, 265–268. [Google Scholar] [CrossRef]
- Zhu, L.P.; Bing, N.C; Yang, D.D.; Jin, H.Y. Hydrothermal synthesis and characterizations of cobalt-doped ZnO nanostructures. Mater. Sci. Forum 2011, 694, 274–277. [Google Scholar] [CrossRef]
- Lojkowski, W.; Gedanken, A.; Grzanka, E.; Opalinska, A.; Strachowski, T.; Pielaszek, R.; Tomaszewska-Grzeda, A.; Yatsunenko, S.; Godlewski, M.; et al. Solvothermal synthesis of nanocrystalline zinc oxide doped with Mn2+, Ni2+, Co2+ and Cr3+ ions. J. Nanopart. Res. 2009, 11, 1991–2002. [Google Scholar] [CrossRef]
- Jayakumar, O.D.; Sudarsan, V.; Tyagi, A.K. Bifunctional Li and Co doped ZnO nanostructures synthesized by solvothermal method: Stabilizer controlled shape and size tuning. J. Nanosci. Nanotechnol. 2015, 15, 2804–2809. [Google Scholar] [CrossRef] [PubMed]
- Naeem, M.; Hasanain, S.K; Kobayashi, M.; Ishida, Y.; Fujimori, A.; Buzby, S.; Shah, S.I. Effect of reducing atmosphere on the magnetism of Zn1-xCoxO (0≤x≤0.10) nanoparticles. Nanotechnology 2006, 17, 2675–2680. [Google Scholar] [CrossRef] [PubMed]
- Clavel, G.; Willinger, M.G.; Zitoun, D.; Pinna, N. Solvent Dependent Shape and Magnetic Properties of Doped ZnO Nanostructures. Adv. Funct. Mater. 2007, 17, 3159–3169. [Google Scholar] [CrossRef]
- Vagadia, M.; Ravalia, A.; Khachar, U.; Solanki, P.S.; Doshi, R.R.; Rayaprol, S.; Kuberkar, D.G. Size and grain morphology dependent magnetic behaviour of Co-doped ZnO. Mater. Res. Bull. 2011, 46, 1933–1937. [Google Scholar] [CrossRef]
- Basith, N.M.; Vijaya, J.J.; Kennedy, L.J.; Bououdina, M.; Jenefar, S.; Kaviyarasan, V. Co-doped ZnO nanoparticles: Structural, morphological, optical, magnetic and antibacterial studies. J. Mater. Sci. Technol. 2014, 30, 1108–1117. [Google Scholar] [CrossRef]
- Li, C.; Che, P.; Sun, C.; Li, W. Effect of cobalt concentration and oxygen vacancy on magnetism of Co doped ZnO nanorods. J. Nanosci. Nanotechnol. 2016, 16, 2719–2724. [Google Scholar] [CrossRef] [PubMed]
- Wojnarowicz, J.; Opalinska, A.; Chudoba, T.; Gierlotka, S.; Mukhovskyi, R.; Pietrzykowska, E.; Sobczak, K.; Lojkowski, W. Effect of water content in ethylene glycol solvent on the size of ZnO nanoparticles prepared using microwave solvothermal synthesis. J. Nanomater. 2016, 2016, 2789871. [Google Scholar] [CrossRef]
- Wojnarowicz, J.; Chudoba, T.; Koltsov, I.; Gierlotka, S.; Dworakowska, S.; Lojkowski, W. Size control mechanism of ZnO nanoparticles obtained in microwave solvothermal synthesis. Nanotechnology 2018, 29, 065601. [Google Scholar] [CrossRef] [PubMed]
- Wojnarowicz, J.; Kuśnieruk, S.; Chudoba, T.; Mizeracki, J.; Łojkowski, W. Microwave solvothermal synthesis of Co-doped ZnO nanoparticles. Glass Ceram. 2015, 3, 8–13. [Google Scholar]
- Horikoshi, S.; Serpone, N. Microwaves in Nanoparticle Synthesis: Fundamentals and Applications, 1st ed.; Wiley-VCH: Weinheim, Germany, 2013; ISBN 9783527331970. [Google Scholar] [CrossRef]
- Lojkowski, W.; Leonelli, C.; Chudoba, T.; Wojnarowicz, J.; Majcher, A.; Mazurkiewicz, A. High-Energy-low-temperature technologies for the synthesis of nanoparticles: Microwaves and high pressure. Inorganics 2014, 2, 606–619. [Google Scholar] [CrossRef]
- Kusnieruk, S.; Wojnarowicz, S.; Chodara, A.; Chudoba, T.; Gierlotka, S.; Lojkowski, W. Influence of hydrothermal synthesis parameters on the properties of hydroxyapatite nanoparticles. Beilstein J. Nanotechnol. 2016, 7, 1586–1601. [Google Scholar] [CrossRef] [PubMed]
- Koltsov, I.; Prześniak-Welenc, M.; Wojnarowicz, J.; Rogowska, A.; Mizeracki, J.; Malysa, M.; Kimmel, G. Thermal and physical properties of ZrO2-AlO(OH) nanopowders synthesised by microwave hydrothermal method. J. Therm. Anal. Calorim. 2017. [Google Scholar] [CrossRef]
- Wojnarowicz, J.; Chudoba, T.; Majcher, A.; Łojkowski, W. Microwaves Applied to Hydrothermal Synthesis of Nanoparticles. In Microwave Chemistry, 1st ed.; De Gruyter: Berlin, Germany; Boston, MA, USA, 2017; pp. 205–224. ISBN 9783110479935. [Google Scholar] [CrossRef]
- Schanche, J.S. Microwave synthesis solutions from personal chemistry. Mol. Divers. 2003, 7, 291–298. [Google Scholar] [CrossRef]
- Rizzuti, A.; Leonelli, C. Crystallization of aragonite particles from solution under microwave irradiation. Powder Technol. 2008, 186, 255–262. [Google Scholar] [CrossRef]
- Leonelli, C.; Lojkowski, W. Main development directions in the application of microwave irradiation to the synthesis of nanopowders. Chem. Today 2007, 25, 34–38. [Google Scholar]
- Horikoshi, S.; Schiffmann, R.F.; Fukushima, J.; Serpone, N. Microwave Chemical and Materials Processing, 1st ed.; Springer: Singapore, 2018; ISBN 978-981-10-6465-4. [Google Scholar] [CrossRef]
- Bogdal, D. Microwave-Assisted Organic Synthesis, 1st ed.; Elsevier: Amsterdam, The Netherlands, 2005; ISBN 9780080446219. [Google Scholar]
- Majcher, A.; Wiejak, J.; Przybylski, J.; Chudoba, T.; Wojnarowicz, J. A novel reactor for microwave hydrothermal scale-up nanopowder synthesis. Int. J. Chem. React. Eng. 2013, 11, 361–368. [Google Scholar] [CrossRef]
- Wojnarowicz, J.; Chudoba, T.; Smoleń, D.; Łojkowski, W.; Majcher, A.; Mazurkiewicz, A. Examples of the nanoparticles produced by microwave solvothermal synthesis (MSS) route. Glass Ceram. 2014, 6, 8–11. [Google Scholar]
- Mandal, S.K.; Das, A.K.; Natha, T.K. Microstructural and magnetic properties of ZnO:TM (TM=Co,Mn) diluted magnetic semiconducting nanoparticles. J. Appl. Phys. 2006, 100, 104315. [Google Scholar] [CrossRef]
- Tang, C.W.; Wang, C.B.; Chien, S.H. Characterization of cobalt oxides studied by FT-IR, Raman, TPR and TG-MS. Thermochim. Acta 2008, 473, 68–73. [Google Scholar] [CrossRef]
- Rietveld, M. A profile refinement method for nuclear and magnetic structures. J. Appl. Cryst. 1969, 2, 65–71. [Google Scholar] [CrossRef]
- Pielaszek, R. FW15/45M method for determination of the grain size distribution from powder diffraction line profile. J. Alloys Compd. 2004, 37, 128–132. [Google Scholar] [CrossRef]
- Nanopowder XRD Processor Demo, pre⋅α⋅ver.0.0.8, © Pielaszek Research. Available online: http://science24.com/xrd/ (accessed on 10 January 2018).
- FW1/5 4/5M Method of Evaluation of Grain Size Distribution by Powder Diffraction. Available online: http://science24.com/fw145m/ (accessed on 10 January 2018).
- Wejrzanowski, T.; Pielaszek, R.; Opalińska, A.; Matysiak, H.; Łojkowski, W.; Kurzydłowski, K.J. Quantitative methods for nanopowders characterization. Appl. Surf. Sci. 2006, 253, 204–208. [Google Scholar] [CrossRef]
- O’Keeffe, M.; Hyde, B.G. Crystal Structures: I. Patterns and Symmetry, 1st ed.; Mineralogical Society of America: Washington, DC, USA, 1996; ISBN 0939950405. [Google Scholar]
- Smoleń, D.; Chudoba, T.; Gierlotka, S.; Kedzierska, A.; Łojkowski, W.; Sobczak, K.; Święszkowski, W.; Kurzydłowski, K.J. Hydroxyapatite nanopowder synthesis with a programmed resorption rate. J. Nanomater. 2012, 2012, 841971. [Google Scholar] [CrossRef]
- Opalinska, A.; Malka, I.; Dzwolak, W.; Chudoba, T.; Presz, A.; Lojkowski, W. Size-dependent density of zirconia nanoparticles. Beilstein J. Nanotechnol. 2015, 6, 27–35. [Google Scholar] [CrossRef] [PubMed]
Figure 1.
The number of scientific publications referring to the search of “doped ZnO” and “cobalt-doped ZnO” phrases published in the period of 2009–2018. Source: ScienceDirect (accessed on 9 April 2018).
Figure 1.
The number of scientific publications referring to the search of “doped ZnO” and “cobalt-doped ZnO” phrases published in the period of 2009–2018. Source: ScienceDirect (accessed on 9 April 2018).

Figure 2.
SEM images of Zn0.9Co0.1O NPs obtained from precursors with varied H2O content: (a) 1.5%; (b) 2%; (c) 3%; (d) 4%; (e) 5%. Mag = 50 kx.
Figure 2.
SEM images of Zn0.9Co0.1O NPs obtained from precursors with varied H2O content: (a) 1.5%; (b) 2%; (c) 3%; (d) 4%; (e) 5%. Mag = 50 kx.
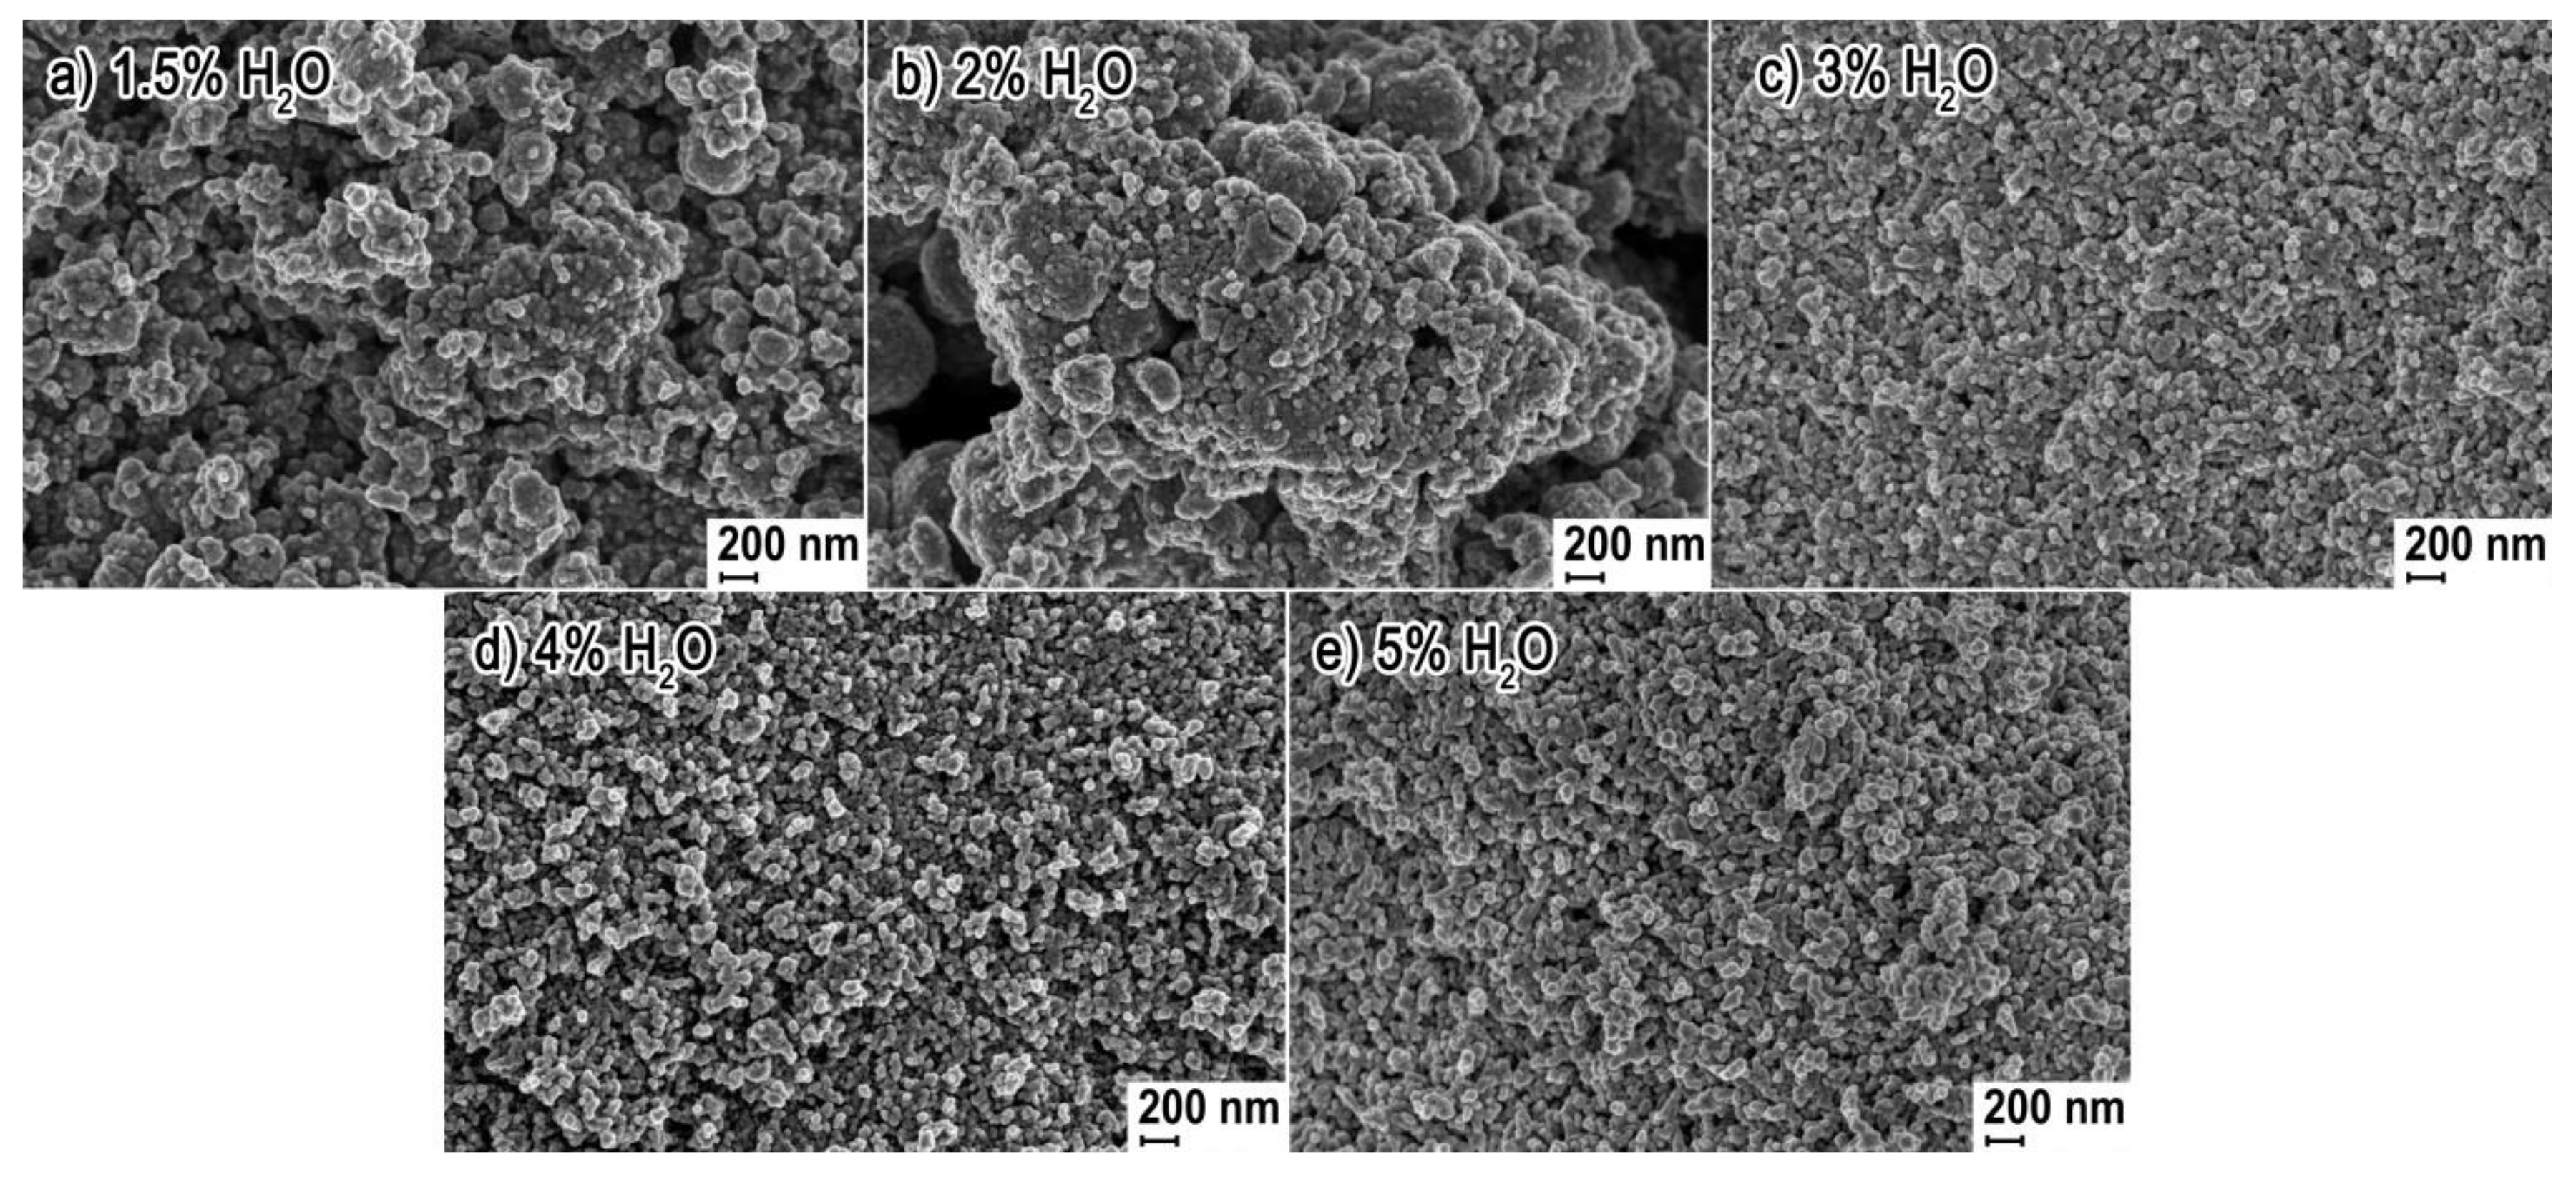
Figure 3.
SEM images of Zn0.9Co0.1O NPs obtained from precursors with varied H2O content: (a) 1.5%; (b) 2%; (c) 3%; (d) 4%; (e) 5%. Mag = 100 kx.
Figure 3.
SEM images of Zn0.9Co0.1O NPs obtained from precursors with varied H2O content: (a) 1.5%; (b) 2%; (c) 3%; (d) 4%; (e) 5%. Mag = 100 kx.
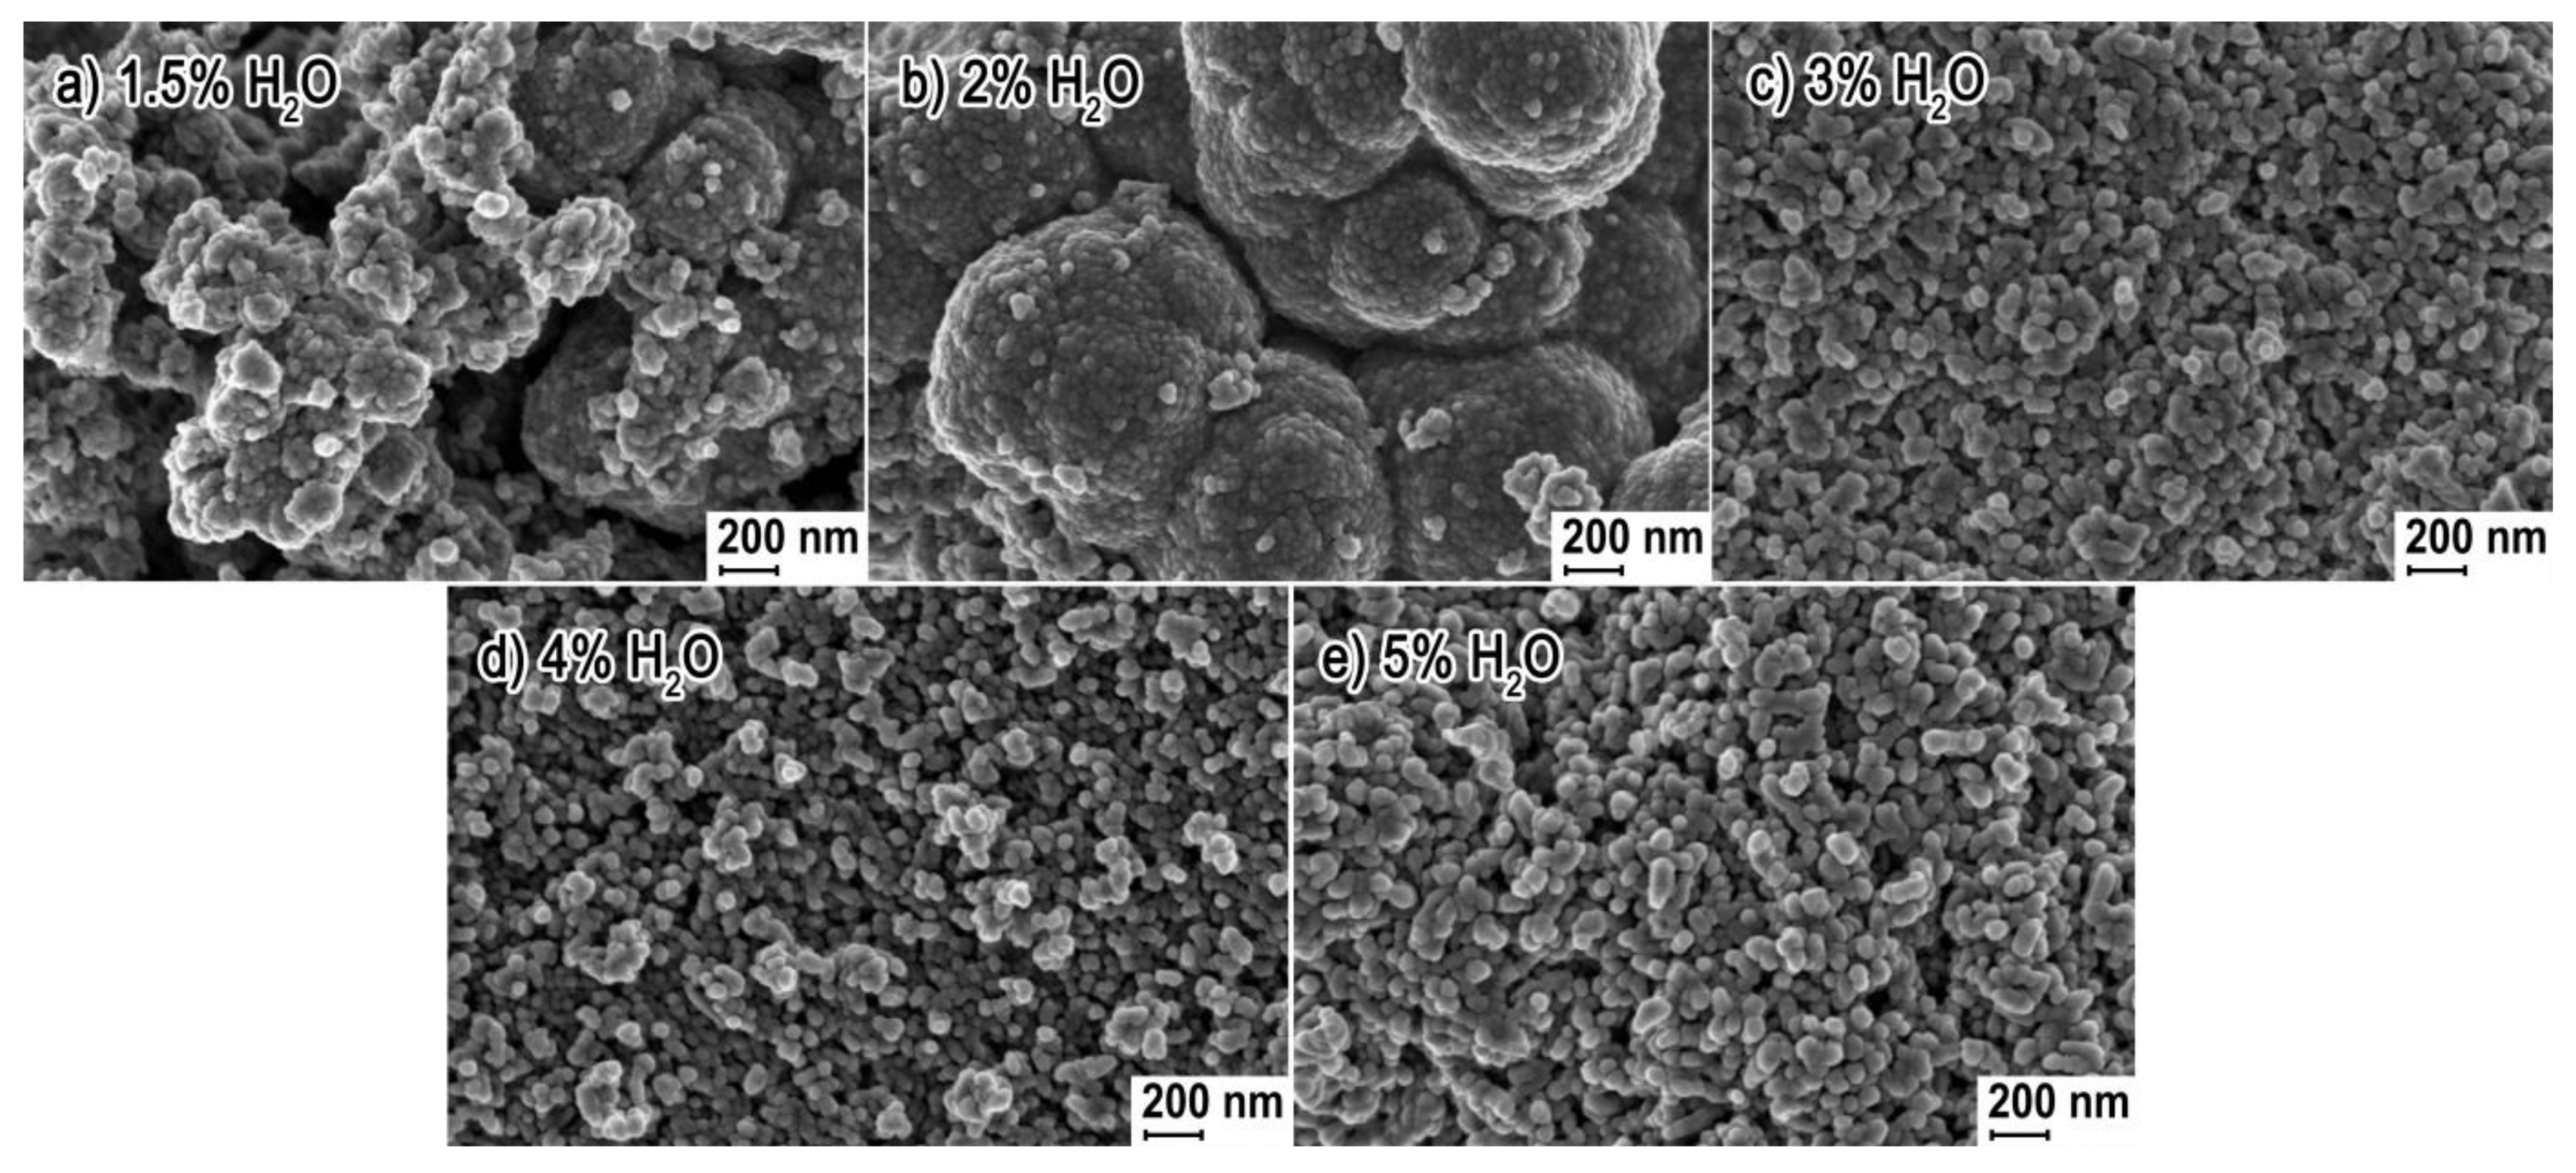
Figure 4.
SEM images of Zn0.9Co0.1O NPs obtained from precursors with varied H2O content: (a) 1.5%; (b) 2%; (c) 3%; (d) 4%; (e) 5%. Mag = 250 kx.
Figure 4.
SEM images of Zn0.9Co0.1O NPs obtained from precursors with varied H2O content: (a) 1.5%; (b) 2%; (c) 3%; (d) 4%; (e) 5%. Mag = 250 kx.
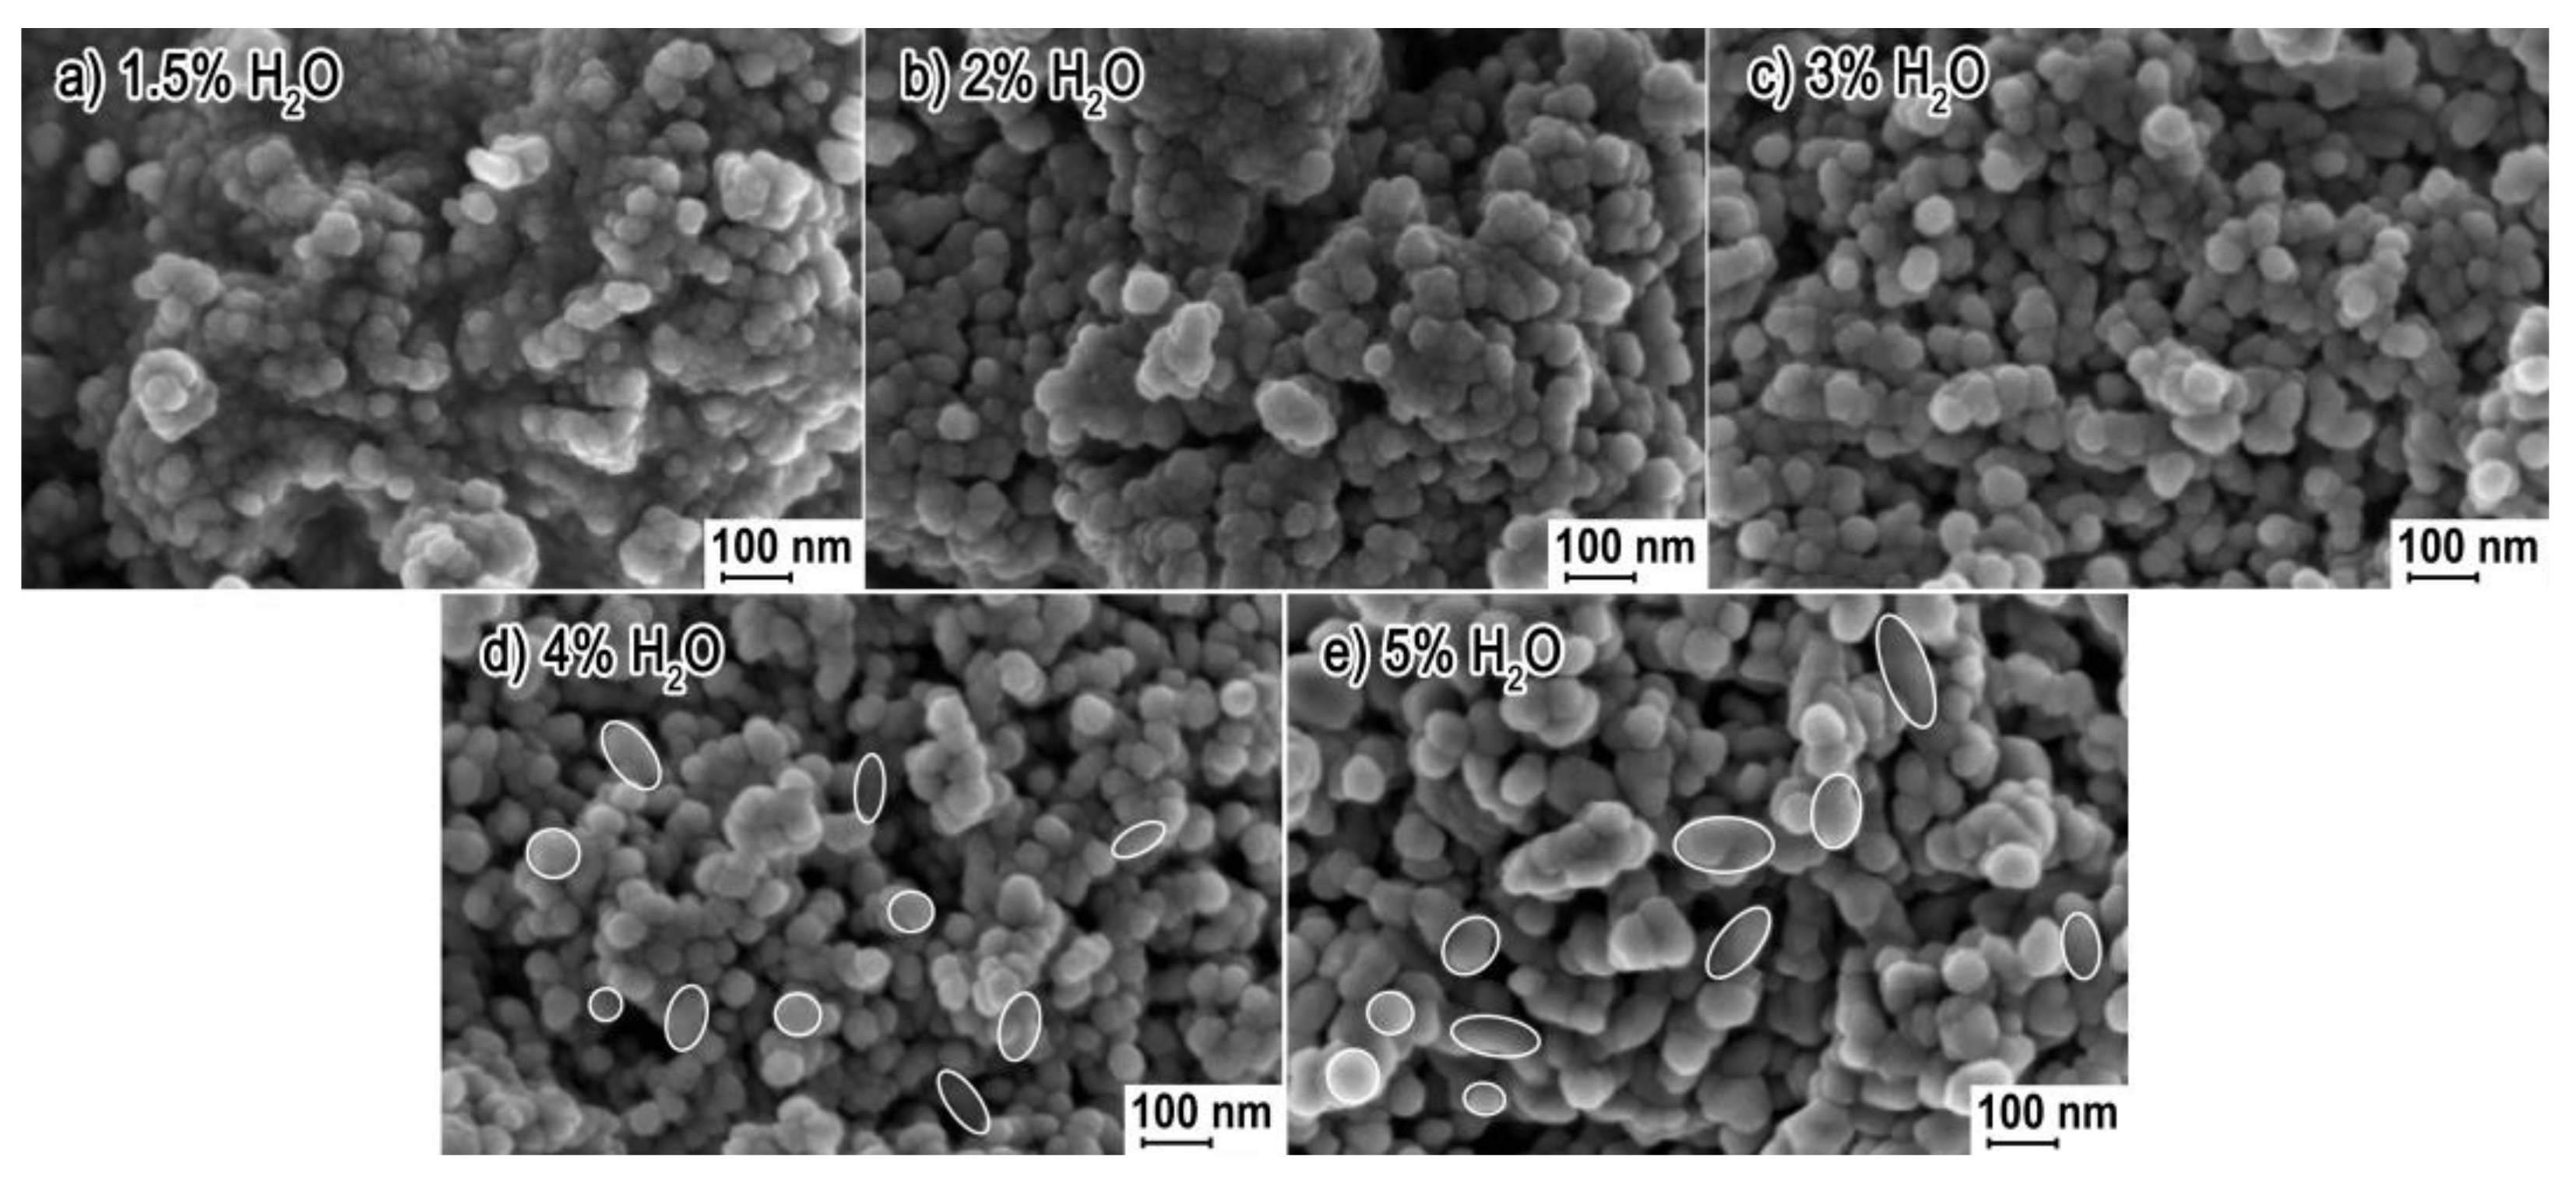
Figure 5.
X-ray diffraction patterns of Zn0.9Co0.1O NPs.
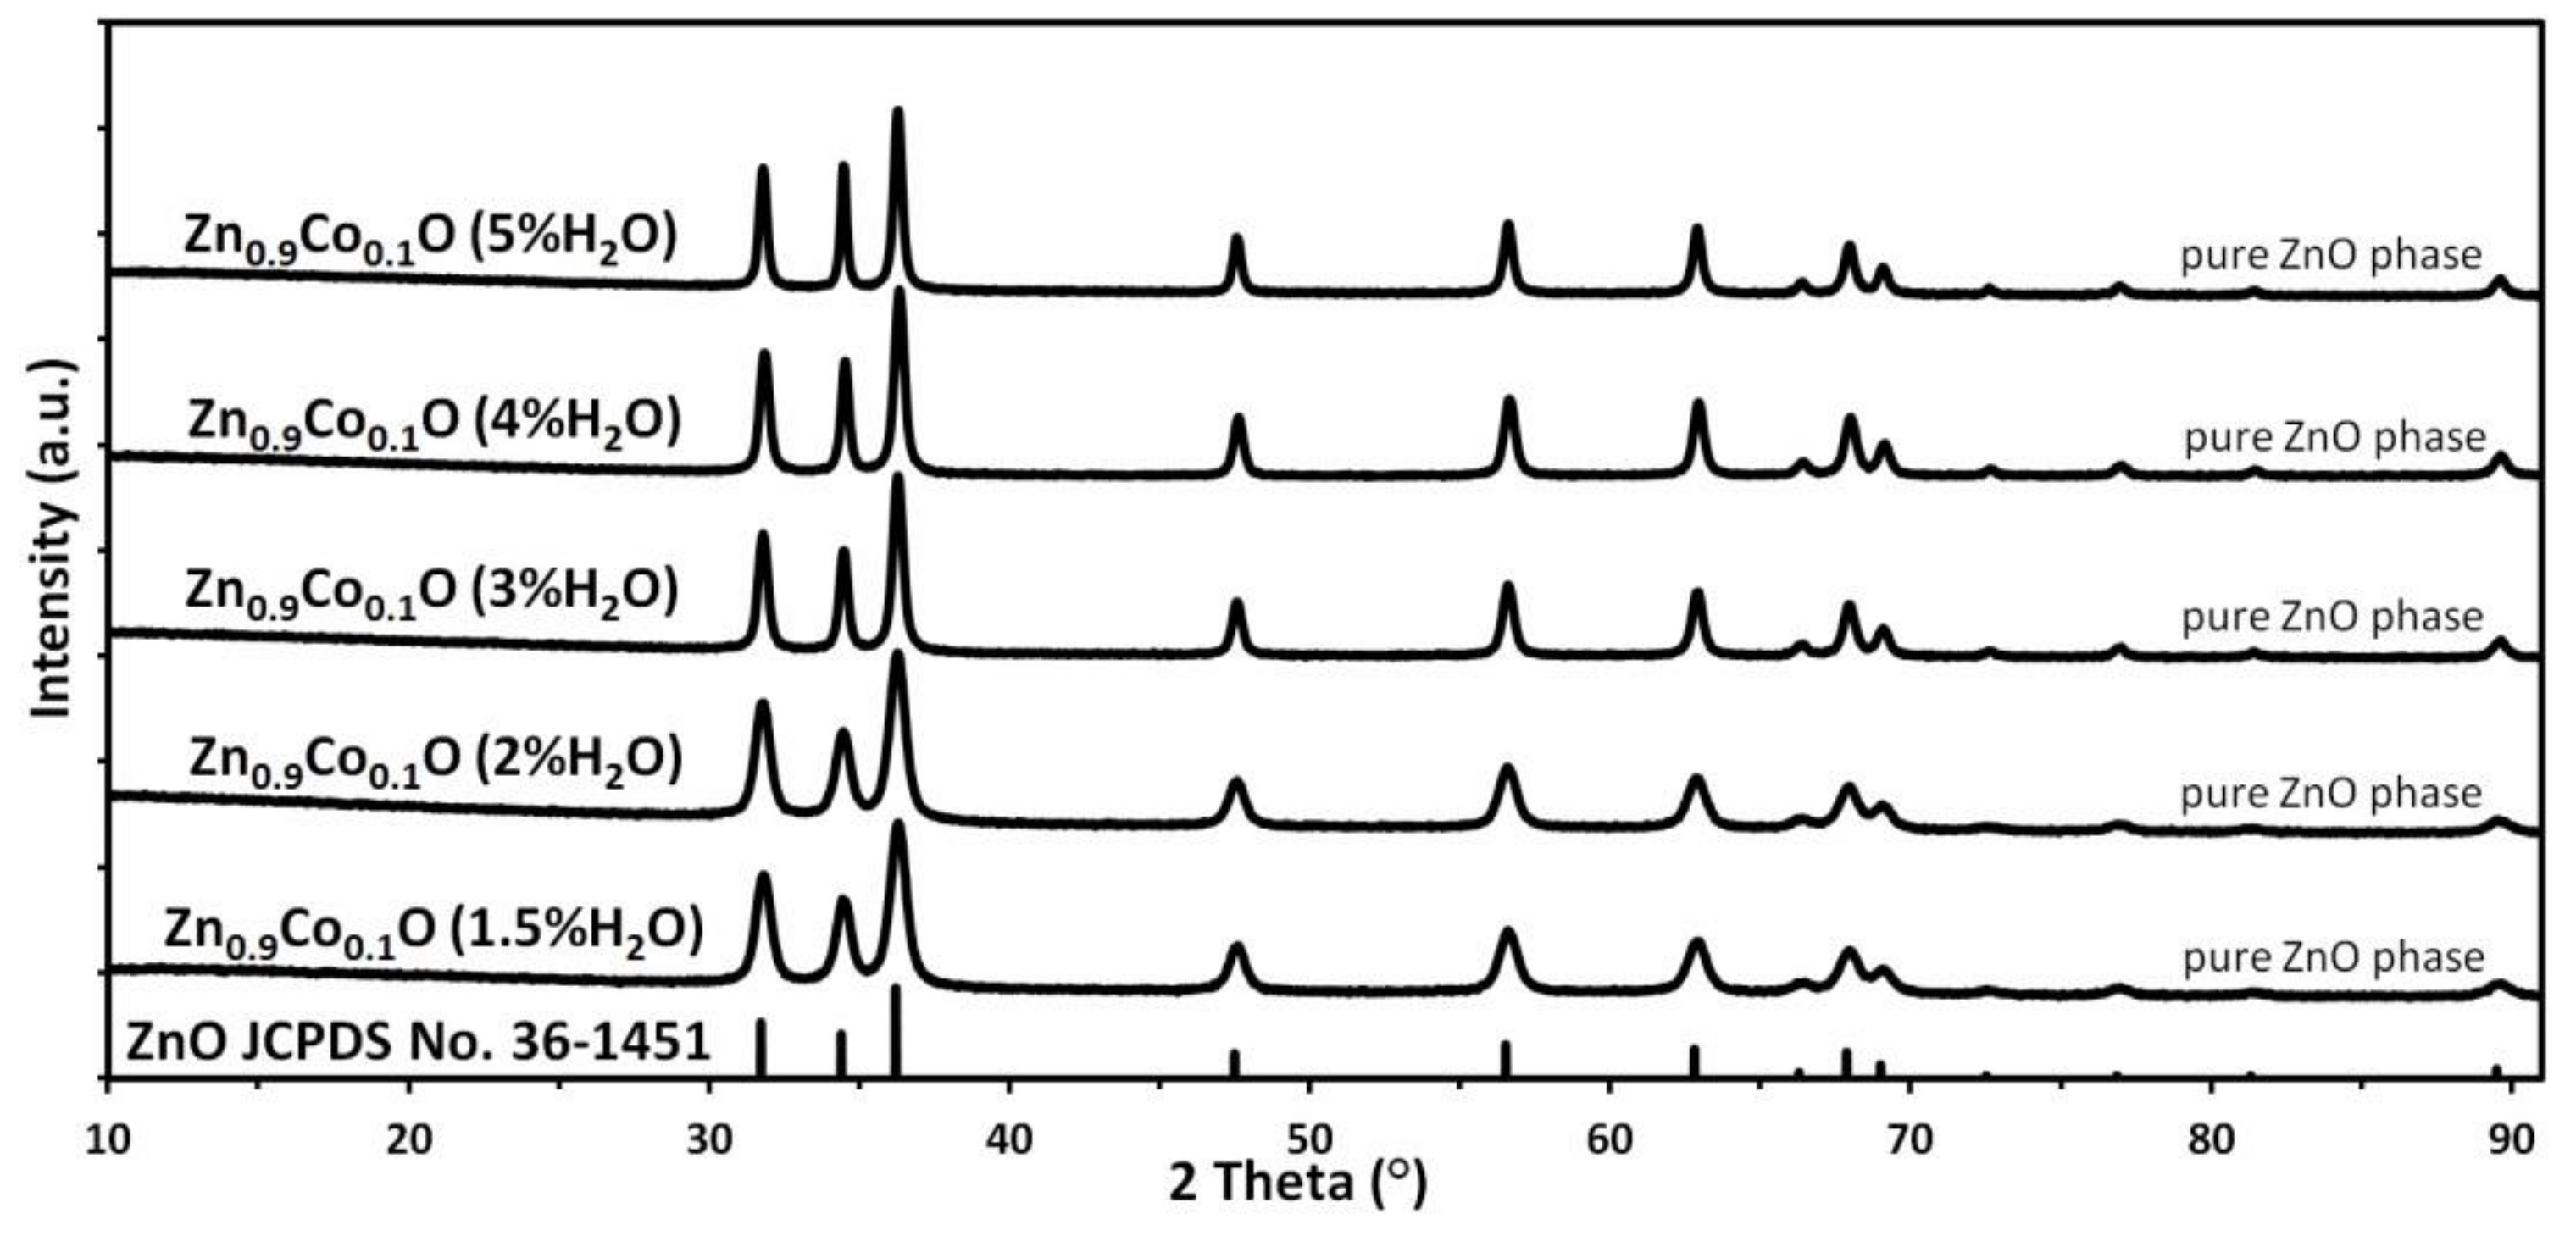
Figure 6.
Impact of H2O content in the precursor on the change of lattice parameters of Zn0.9Co0.1O NPs.
Figure 6.
Impact of H2O content in the precursor on the change of lattice parameters of Zn0.9Co0.1O NPs.

Figure 7.
The histogram of the particle size distribution of Zn0.9Co0.1O NPs (TEM method): (a) 1.5% H2O, (b) 2% H2O, (c) 3% H2O, (d) 4% H2O, (e) 5% H2O.
Figure 7.
The histogram of the particle size distribution of Zn0.9Co0.1O NPs (TEM method): (a) 1.5% H2O, (b) 2% H2O, (c) 3% H2O, (d) 4% H2O, (e) 5% H2O.
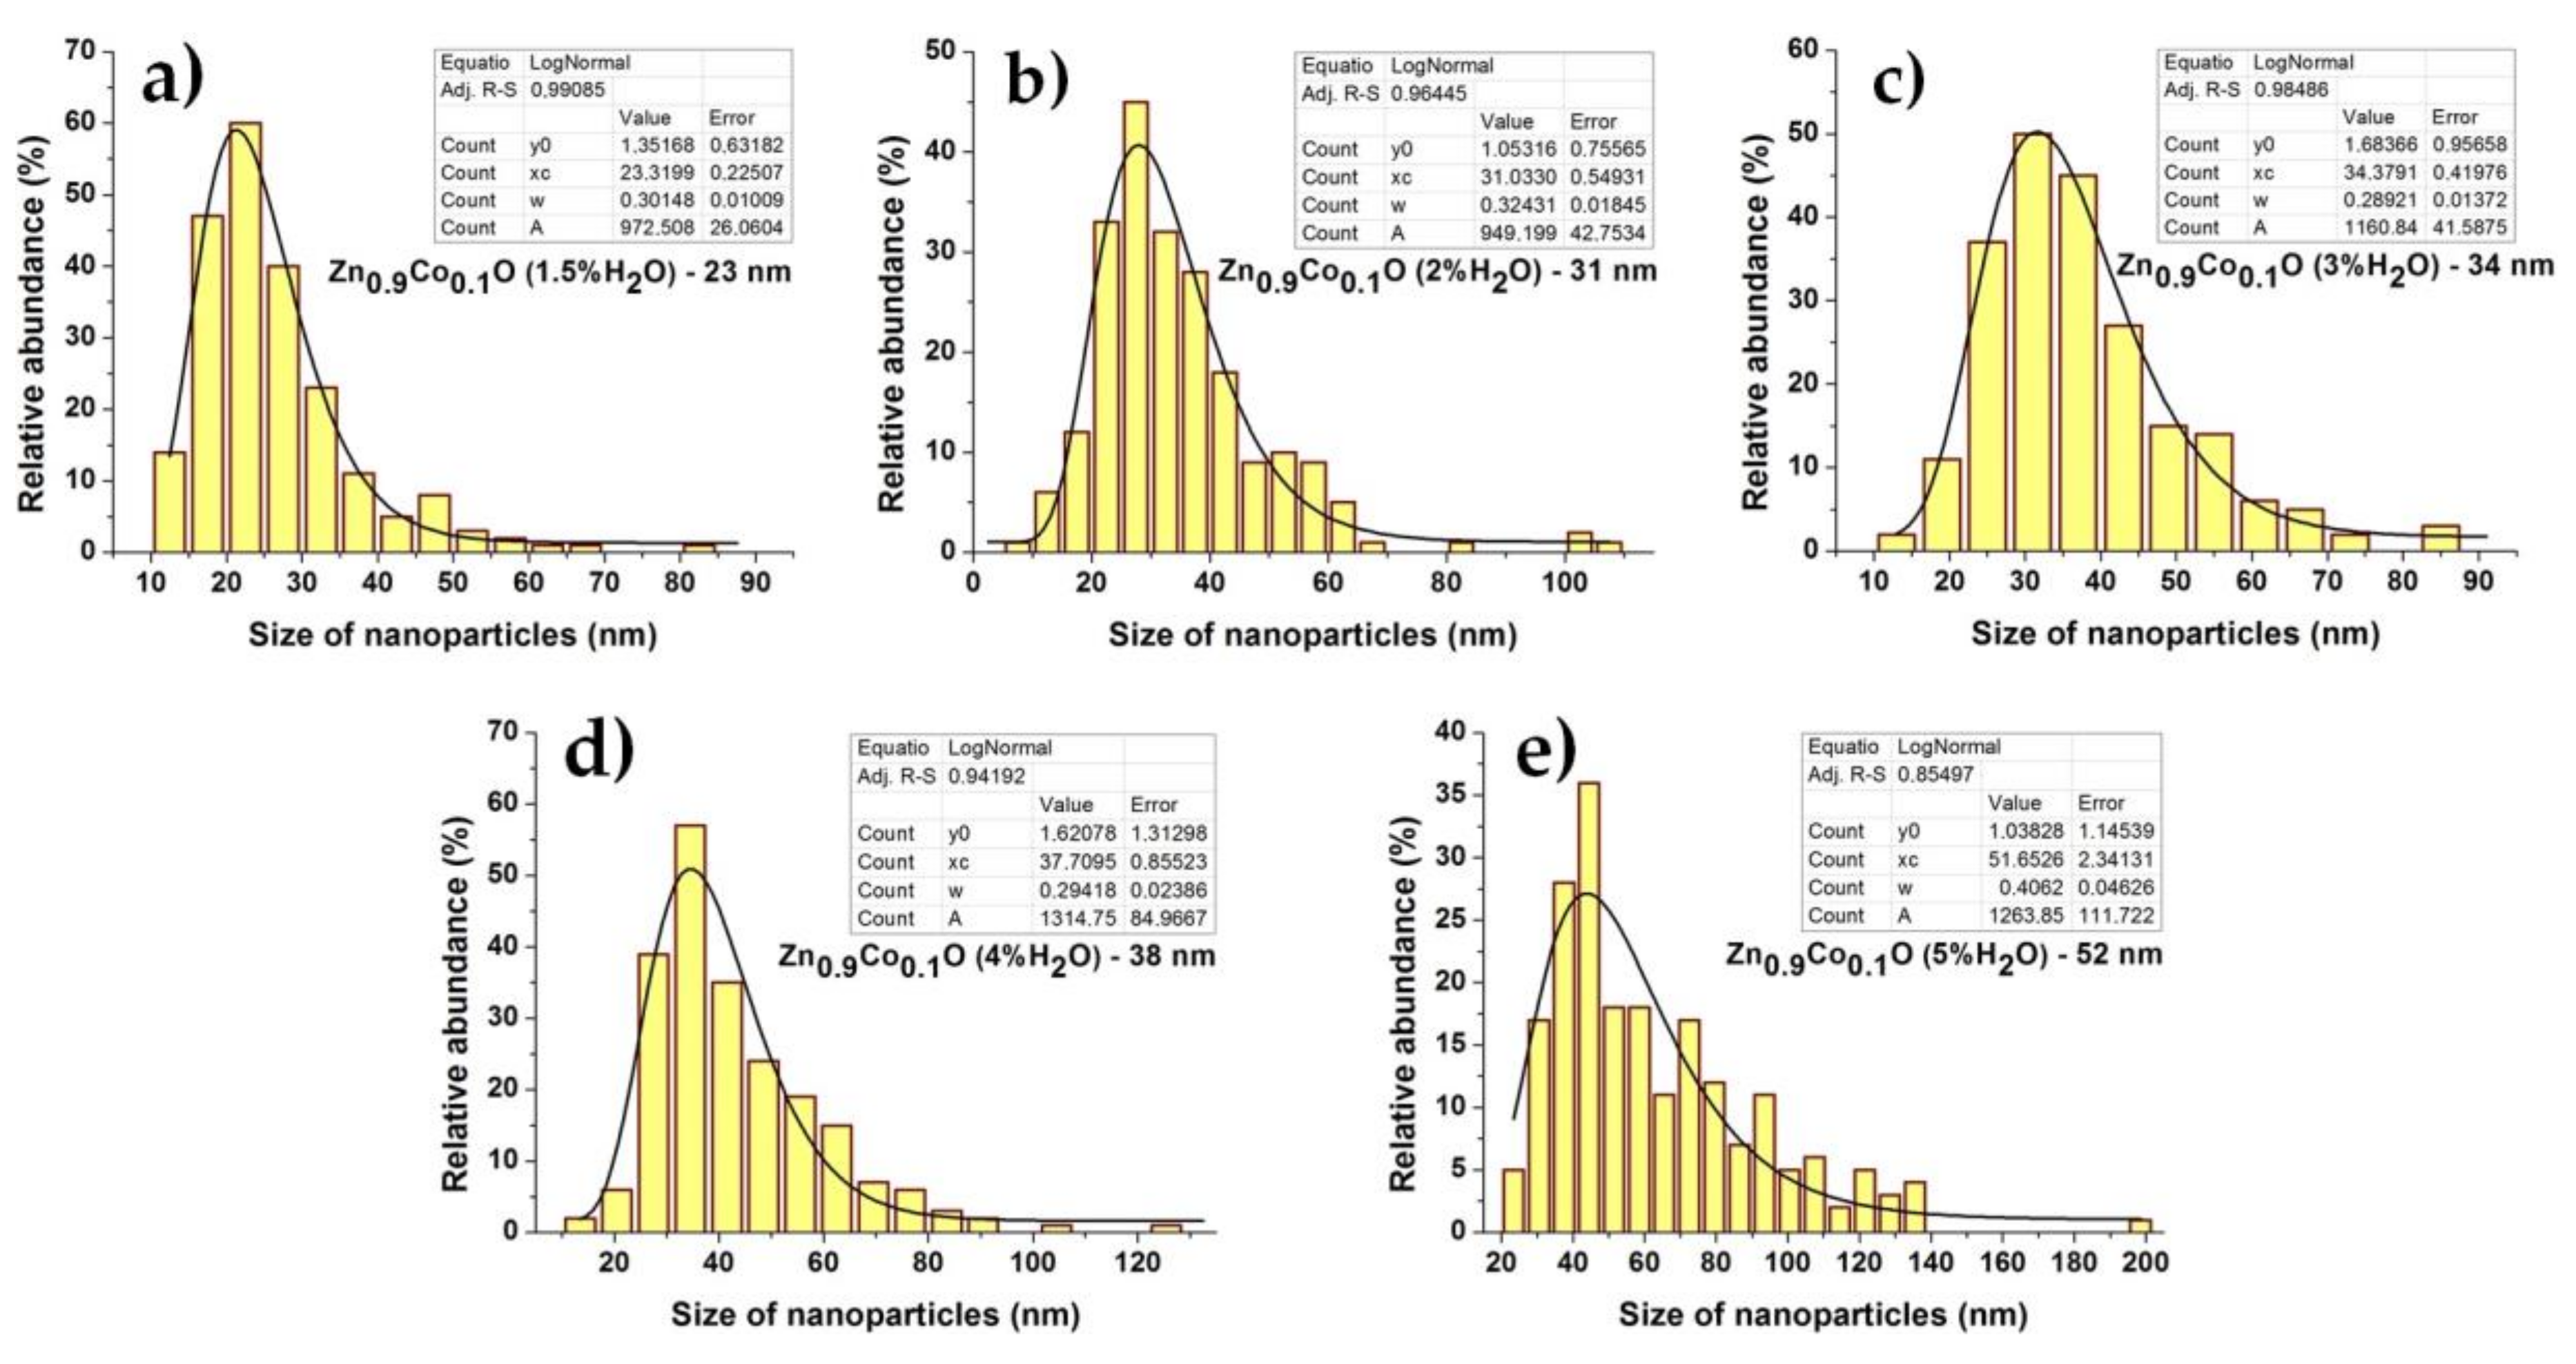
Figure 8.
Crystallite size distributions of Zn0.9Co0.1O NPs obtained using Nanopowder XRD Processor Demo, pre α ver.0.0.8, © Pielaszek Research [78].
Figure 8.
Crystallite size distributions of Zn0.9Co0.1O NPs obtained using Nanopowder XRD Processor Demo, pre α ver.0.0.8, © Pielaszek Research [78].

Table 1.
Results of analysis of H2O content in precursors of Zn0.9Co0.1O nanoparticles (NPs).
| Sample | Actual H2O Concentration, CpH2O (wt %) |
|---|---|
| Zn0.9Co0.1O (1.5% H2O) | 1.48 ± 0.03 |
| Zn0.9Co0.1O (2% H2O) | 2.00 ± 0.02 |
| Zn0.9Co0.1O (3% H2O) | 3.05 ± 0.04 |
| Zn0.9Co0.1O (4% H2O) | 3.95 ± 0.03 |
| Zn0.9Co0.1O (5% H2O) | 5.07 ± 0.04 |
Table 2.
Results of analysis of chemical composition of Zn0.9Co0.1O NPs.
| Sample | Actual Content of Dopant, mol % | |||
|---|---|---|---|---|
| EDS | ICP-OES | |||
| Zinc | Cobalt | Zinc | Cobalt | |
| Zn0.9Co0.1O (1.5%H2O) | 90.94 ± 0.52 | 9.06 ± 0.52 | 92.03 ± 0.91 | 7.97 ± 0.05 |
| Zn0.9Co0.1O (2%H2O) | 90.46 ± 0.39 | 9.54 ± 0.39 | 92.29 ± 0.27 | 7.71 ± 0.02 |
| Zn0.9Co0.1O (3%H2O) | 90.77 ± 0.45 | 9.23 ± 0.45 | 92.28 ± 0.12 | 7.72 ± 0.02 |
| Zn0.9Co0.1O (4%H2O) | 90.10 ± 0.57 | 9.90 ± 0.57 | 92.30 ± 0.38 | 7.70 ± 0.03 |
| Zn0.9Co0.1O (5%H2O) | 90.28 ± 0.64 | 9.72 ± 0.64 | 91.91 ± 0.25 | 8.09 ± 0.02 |
| Zn0.9Co0.1O, reference sample [28] | - | - | 90.86 | 9.14 |
Table 3.
Lattice parameters and ratio of lattice parameters of Zn0.9Co0.1O NPs.
| Sample. | Lattice Parameters | Lattice Parameter Ratio c/a | Lattice Parameter Ratio c/a in hcp ZnO | |
|---|---|---|---|---|
| a ± σ, (Å) | c ± σ, (Å) | |||
| ZnO (JCPDS No. 36-1451) | 3.2498 | 5.2066 | 1.6021 | 1.6330 |
| ZnO (1.5%H2O) reference sample, MSS, [60] | 3.2502 ± 0.0003 | 5.2061± 0.0003 | 1.6018 | |
| Zn0.9Co0.1O (1.5%H2O) | 3.2525 ± 0.0004 | 5.2082 ± 0.0004 | 1.6013 | |
| Zn0.9Co0.1O (2%H2O) | 3.2522 ± 0.0004 | 5.2070 ± 0.0004 | 1.6011 | |
| Zn0.9Co0.1O (3%H2O) | 3.2521 ± 0.0004 | 5.2057 ± 0.0004 | 1.6007 | |
| Zn0.9Co0.1O (4%H2O) | 3.2522 ± 0.0004 | 5.2061 ± 0.0004 | 1.6008 | |
| Zn0.9Co0.1O (5%H2O) | 3.2520 ± 0.0004 | 5.2057 ± 0.0004 | 1.6008 | |
Table 4.
Characteristics of Zn0.9Co0.1O NPs.
| Sample | SSA, as ± σ (m2/g) | Skeleton Density, ρs ± σ (g/cm3) | Average Particle Size from SSA, d (nm) | Average Crystallite Size, Scherrer’s Formula, da, dc (nm) | Average Crystallite Size, Nanopowder XRD Processor Demo, D ± σ (nm) | Average Particles Size from TEM, d ± SE * (nm) |
|---|---|---|---|---|---|---|
| Zn0.9Co0.1O (1.5%H2O) | 42.6 ± 0.1 | 5.05 ± 0.04 | 28 | 23a; 26c | 25 ± 7 | 23 ± 1 |
| Zn0.9Co0.1O (2%H2O) | 37.3 ± 0.1 | 5.13 ± 0.03 | 31 | 27a; 27c | 28 ± 8 | 31 ± 1 |
| Zn0.9Co0.1O (3%H2O) | 31.7 ± 0.1 | 5.26 ± 0.03 | 36 | 28a; 33c | 30 ± 8 | 34 ± 1 |
| Zn0.9Co0.1O (4%H2O) | 28.8 ± 0.1 | 5.30 ± 0.03 | 39 | 30a; 37c | 32 ± 9 | 38 ± 1 |
| Zn0.9Co0.1O (5%H2O) | 21.2 ± 0.1 | 5.35 ± 0.02 | 53 | 36a; 50c | 41 ± 13 | 52 ± 3 |
*—Standard Error.
© 2018 by the authors. Licensee MDPI, Basel, Switzerland. This article is an open access article distributed under the terms and conditions of the Creative Commons Attribution (CC BY) license (http://creativecommons.org/licenses/by/4.0/).
Share and Cite
MDPI and ACS Style
Wojnarowicz, J.; Chudoba, T.; Gierlotka, S.; Sobczak, K.; Lojkowski, W. Size Control of Cobalt-Doped ZnO Nanoparticles Obtained in Microwave Solvothermal Synthesis. Crystals 2018, 8, 179. https://doi.org/10.3390/cryst8040179
AMA Style
Wojnarowicz J, Chudoba T, Gierlotka S, Sobczak K, Lojkowski W. Size Control of Cobalt-Doped ZnO Nanoparticles Obtained in Microwave Solvothermal Synthesis. Crystals. 2018; 8(4):179. https://doi.org/10.3390/cryst8040179
Chicago/Turabian StyleWojnarowicz, Jacek, Tadeusz Chudoba, Stanisław Gierlotka, Kamil Sobczak, and Witold Lojkowski. 2018. "Size Control of Cobalt-Doped ZnO Nanoparticles Obtained in Microwave Solvothermal Synthesis" Crystals 8, no. 4: 179. https://doi.org/10.3390/cryst8040179
Note that from the first issue of 2016, this journal uses article numbers instead of page numbers. See further details here.