Rhombohedral Distortion of the Cubic MgCu2-Type Structure in Ca2Pt3Ga and Ca2Pd3Ga

1
Department of Chemistry, Iowa State University, Ames, IA 50011-3111, USA
2
Ames Laboratory, U.S. Department of Energy, Ames, IA 50011-3111, USA
*
Author to whom correspondence should be addressed.
Crystals 2018, 8(5), 186; https://doi.org/10.3390/cryst8050186
Submission received: 27 March 2018
/
Revised: 23 April 2018
/
Accepted: 24 April 2018
/
Published: 26 April 2018
(This article belongs to the Special Issue Compounds with Polar Metallic Bonding)
Abstract
:Two new fully ordered ternary Laves phase compounds, Ca2Pt3Ga and Ca2Pd3Ga, have been synthesized and characterized by powder and single-crystal X-ray diffraction along with electronic structure calculations. Ca2Pd3Ga was synthesized as a pure phase whereas Ca2Pt3Ga was found as a diphasic product with Ca2Pt2Ga. Electronic structure calculations were performed to try and understand why CaPt2 and CaPd2, which crystalize in the cubic MgCu2-type Laves phase structure, distort to the ordered rhombohedral variant, first observed in the magneto-restricted TbFe2 compound, with the substitution of twenty-five percent of the Pt/Pd with Ga. Electronic stability was investigated by changing the valence electron count from 22e−/f.u. in CaPd2 and CaPt2 (2x) to 37e−/f.u. in Ca2Pd3Ga and Ca2Pt3Ga, which causes the Fermi level to shift to a more energetically favorable location in the DOS. The coloring problem was studied by placing a single Ga atom in each of four tetrahedra of the cubic unit cell of the MgCu2-type structure, with nine symmetrically inequivalent models being investigated. Non-optimized and optimized total energy analyses of structural characteristics, along with electronic properties, will be discussed.
1. Introduction
Platinum exhibits the second largest relativistic contraction of the 6s orbitals, second only to Au [1], and has interesting catalytic properties, thus making it an interesting metal to study, especially in reduced environments. Exploration of the Ca-Pt-X (X = Ga, In) system revealed a new ternary compound, Ca2Pt3Ga, which turned out to be an ordered rhombohedral distortion of the MgCu2-type Laves phase CaPt2. After Ca2Pt3Ga was synthesized, the Pd analog was targeted and successfully prepared as an isostructural compound.
Laves phases are the largest class of intermetallic compounds with the general formula AB2. Binary Laves phases primarily crystalize in one of three crystal structures: MgCu2, MgZn2, or MgNi2 [2]. These structure types, which appear in a vast number of intermetallic systems, contain topologically closed-packed Frank–Kasper polyhedra and have been intensely studied for magnetic and magnetocaloric properties, hydrogen storage, and catalytic behavior [3,4,5,6,7,8,9]. The stability of Laves phases has been described by using geometrical and electronic structure factors. Geometrical factors include packing densities and atomic size ratios of A/B whereas electronic factors include valence electron count (vec) and difference in electronegativities between A and B [10,11].
To tune the properties and structures of Laves phases, an addition via substitution of a third element into the structure can be explored. The resulting ternary compounds can have mixing on the A and B sites but retain the parent Laves phase structure or the structures can change into a fully ordered ternary Laves phase that is a variant of the parent structure. The first ordered ternary Laves phase with the direct rhombohedral distortion of the MgCu2-type, first evidenced in the binary TbFe2 phase, which distorts via magnetostriction, was reported to be Mg2Ni3Si [11,12]. Recently, many examples of this rhombohedral distortion, with varying vec, have been reported: RE2Rh3Si (RE = Pr, Er), U2Ru3Si, Ce2Rh3+xSi1−x, RE2Rh3Ge, Ca2Pd3Ge, Sm2Rh3Ge, U2Ru3Ge, Mg2Ni3Ge [2], Mg2Ni3P, and the heretofore only known gallides RE2Rh3Ga (RE = Y, La-Nd, Sm, Gd-Er).
The maximal translationengleiche subgroup of the Fd-3m space group that allows for the ordered 3:1 ratio of M:Ga atoms is R-3m [2,3,11]. Reported herein is the first extensive computational study of the “coloring problem” [13] for this rhombohedral distortion of the cubic cell. Formation energies and electronic structure calculations were performed on the binary and ternary Laves phases CaM2 and Ca2M3Ga (M = Pt, Pd) along with total energy calculations of various “coloring models” with the same composition but different atomic arrangements or “colorings”.
2. Materials and Methods
2.1. Electronic Structure Calculations
Electronic structure calculations to obtain DOS and COHP curves for bonding analysis were performed on CaM2 and Ca2M3Ga (M = Pd, Pt) using the Stuttgart Tight-Binding, Linear-Muffin-Tin Orbital program with the Atomic Sphere Approximation (TB-LMTO-ASA) [14]. This approximation uses overlapping Wigner-Seitz (WS) spheres surrounding each atom so that spherical basis functions, i.e., atomic orbital (AO)-like wavefunctions, are used to fill space. The WS sphere radii used for the various atoms are: Ca 3.403–3.509 Å, Pt 2.800–2.844 Å, Pd 2.864–2.865 Å, and Ga 2.800–2.951 Å. The total overlap volume was 6.44% for the cubic Laves phase structures and 7.25% and 7.11%, respectively, for Ca2Pt3Ga and Ca2Pd3Ga. No empty spheres were required to attain 100% space filling of the unit cells. The exchange-correlation potential was treated with the von Barth-Hedin formulation within the local density approximation (LDA) [15]. All relativistic effects except spin-orbit coupling were taken into account using a scalar relativistic approximation [16]. The basis sets included 4s/(4p)/3d for Ca, 6s/6p/5d/(5f) for Pt, 5s/5p/4d/(4f) for Pd, and 4s/4p/(4d) for Ga (down-folded orbitals are shown in parentheses). Reciprocal space integrations were performed using k-point meshes of 1313 points for rhombohedral Ca2Pt3Ga and Ca2Pd3Ga and 145 points for cubic CaPt2 and CaPd2 in the corresponding irreducible wedges of the first Brillouin zones.
Structure optimization and total energy calculations were performed using the Vienna ab Initio Simulation Package (VASP) [17,18], which uses projector augmented-wave (PAW) [19] pseudopotentials that were treated with the Perdew–Burke–Ernzerhof generalized gradient approximation (PBE-GGA) [20]. Reciprocal space integrations were accomplished over a 13 × 13 × 13 Monkhorst–Pack k-point mesh [21] by the linear tetrahedron method [22] with the energy cutoff for the plane wave calculations set at 500.00 eV.
2.2. Synthesis
All ternary compounds were obtained by melting mixtures of Ca pieces (99.99%, Sigma-Aldrich, St. Louis, MO, USA), Pt spheres (99.98%, Ames Laboratory, Ames, IA, USA) or Pd pieces (99.999%, Ames Laboratory), Ga ingots (99.99%, Alfa Aesar, Haverhill, MA, USA), and, in some cases, including Ag powder (99.9% Alfa Aesar). Samples of total weight ca. 300 mg were weighed out in a N2-filled glovebox with <0.1 ppm moisture and sealed in tantalum tubes by arc-melting under an argon atmosphere. To prevent the tantalum tubes from oxidizing during the heating process, they were enclosed in evacuated silica jackets. The silica ampoules were placed in programmable furnaces and heated at a rate of 150 °C per hour to 1050 °C, held there for 3 h, then cooled at 50 °C per hour to 850 °C and annealed for 5 days. The samples were then cooled at 50 °C per hour to room temperature. Ca2Pt3Ga crystals were obtained from a loading of “Ca2Pt3Ga0.85Ag0.15”, whereas Ca2Pd3Ga crystals were obtained from stoichiometric mixtures of these elements.
2.3. Powder X-ray Diffraction
All samples were characterized by powder X-ray diffraction on a STOE WinXPOW powder diffractometer using Cu Kα radiation (λ = 1.540598 Å). Each sample was ground using an agate mortar and pestle and then sifted through a US standard sieve with hole sizes of 150 microns. All powder specimens were fixed on a transparent acetate film using a thin layer of vacuum grease, covered by a second acetate film, placed in a holder and mounted in the X-ray diffractometer. Scattered intensities were recorded using a scintillation detector with a step size of 0.03° in 2Θ using a step scan mode ranging from 0° to 130°. Phase analysis was performed using the program PowderCell [23] by overlaying theoretical powder patterns determined from single crystal X-ray diffraction over the powder patterns determined experimentally.
2.4. Single Crystal X-ray Diffraction
Single crystals were extracted from samples and mounted on the tips of thin glass fibers. Intensity data were collected at room temperature on a Bruker SMART APEX II diffractometer with a CCD area detector, distance set at 6.0 cm, using graphite monochromated Mo Kα radiation (λ= 0.71073 Å). The data collection strategies were obtained both by a pre-saved set of runs as well as from an algorithm in the program COSMO in the APEX II software package [24]. Indexing and integration of data were performed with the program SAINT in the APEX II package [24,25]. SADABS was used to apply empirical absorption corrections [24]. Crystal structures were solved by direct methods and refined by full-matrix least squares on F2 using SHELXL [26]. The final refinements were performed using anisotropic displacement parameters on all atoms. All crystal structure figures were produced using the program Diamond [27].
3. Results
3.1. Phase Analysis
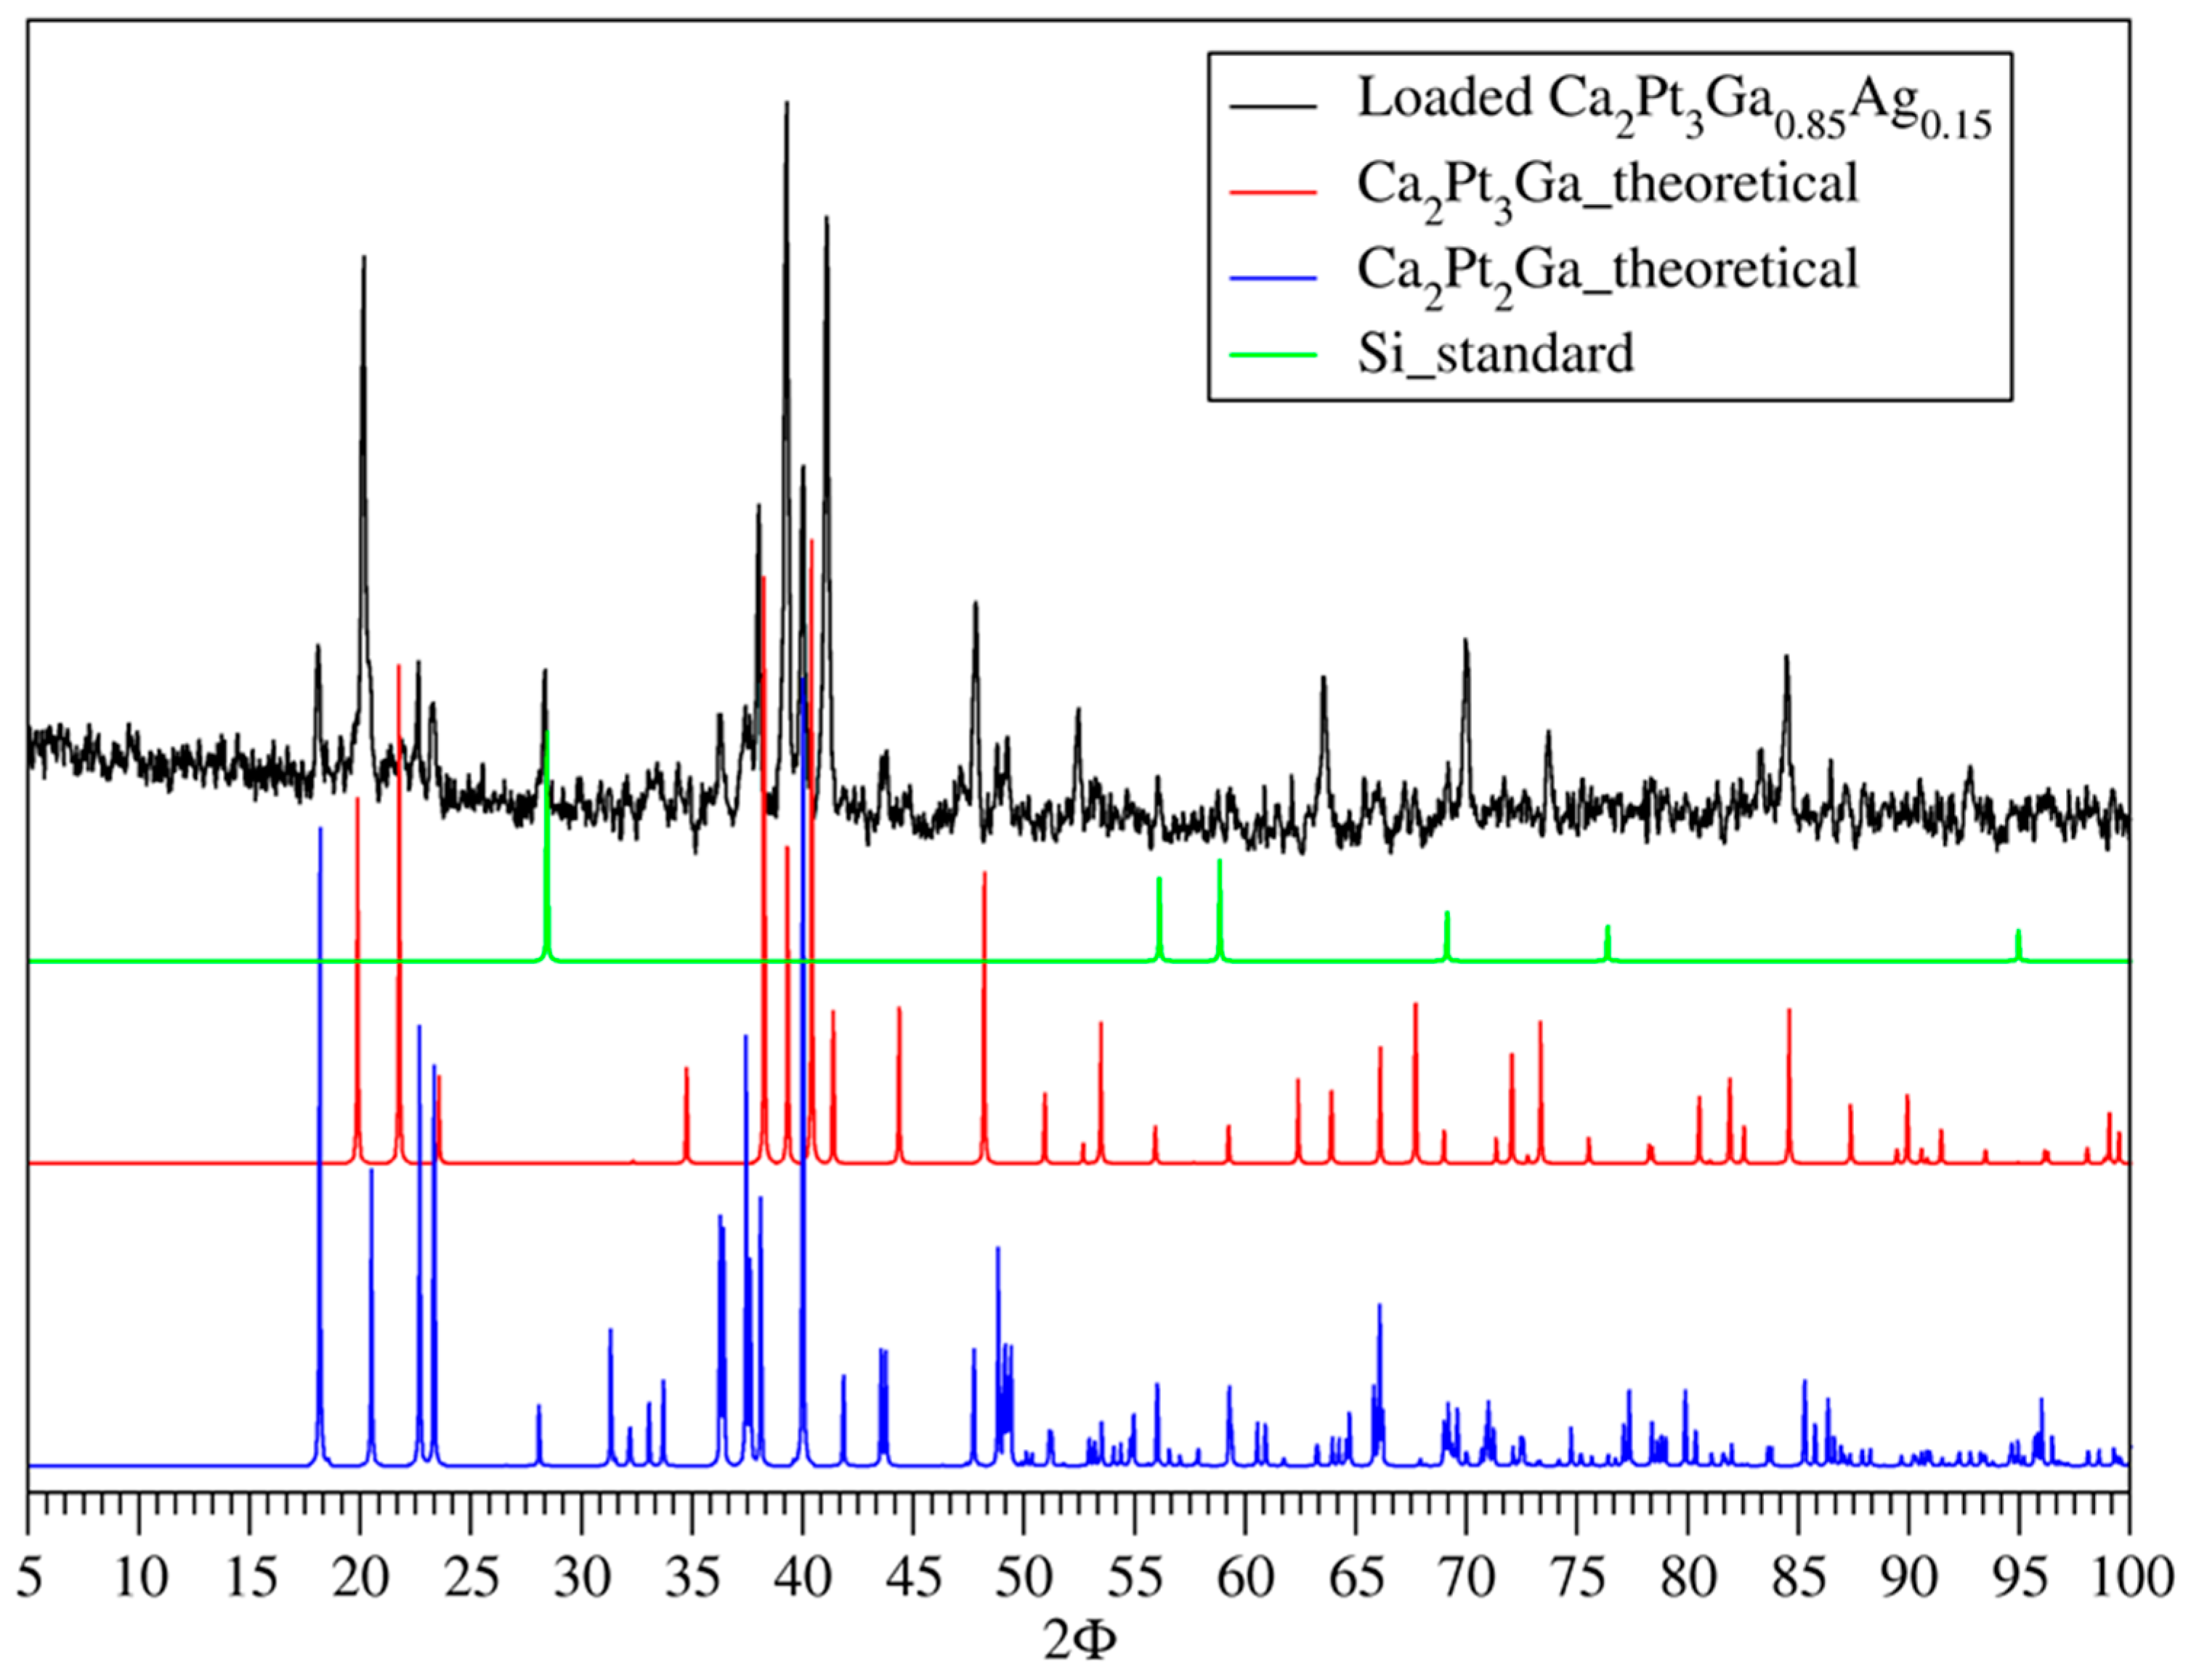
Ca2Pt3Ga has been synthesized, but not as a pure phase. Using high temperature reactions, this compound can only be synthesized with the addition of a small quantity of silver in the loaded reaction mixture. Without adding silver the binary cubic Laves phase CaPt2 forms as the major product as well as a small amount of some unidentified phase(s) according to X-ray powder diffraction. At reaction and annealing temperatures, Ga, Ca, and Ag are molten and their respective binary phase diagrams indicate miscibility. As Pt dissolves into the liquid, we hypothesize that the presence of Ag slows the reaction rate between Ca and Pt to form CaPt2 and allows Pt and Ga to achieve sufficient mixing in the liquid before crystallizing into Ca2Pt3Ga. However, even when synthesized with the addition of silver and at 1050 °C, Ca2Pt3Ga does coexists with Ca2Pt2Ga and the binary CaPt2. Figure 1 shows the powder pattern for the sample loaded as “Ca2Pt3Ga0.85Ag0.15” along with the theoretical patterns for the Ca2Pt3Ga and Ca2Pt2Ga. Peak fitting analysis performed with Jana [28] can be found in Figure S1 along with relative contributions of the three phases.
Three samples with varying silver content, viz., 2.50, 8.33, and 14.29 mole percent Ag, were examined. According to the XPD patterns (see Figure S3 in Supporting Information), as the silver content increased, the yield of Ca2Pt2Ga increased. The outcome was also successfully reproducible for the loading “Ca2Pt3Ga0.85Ag0.15” (see Figure S4).
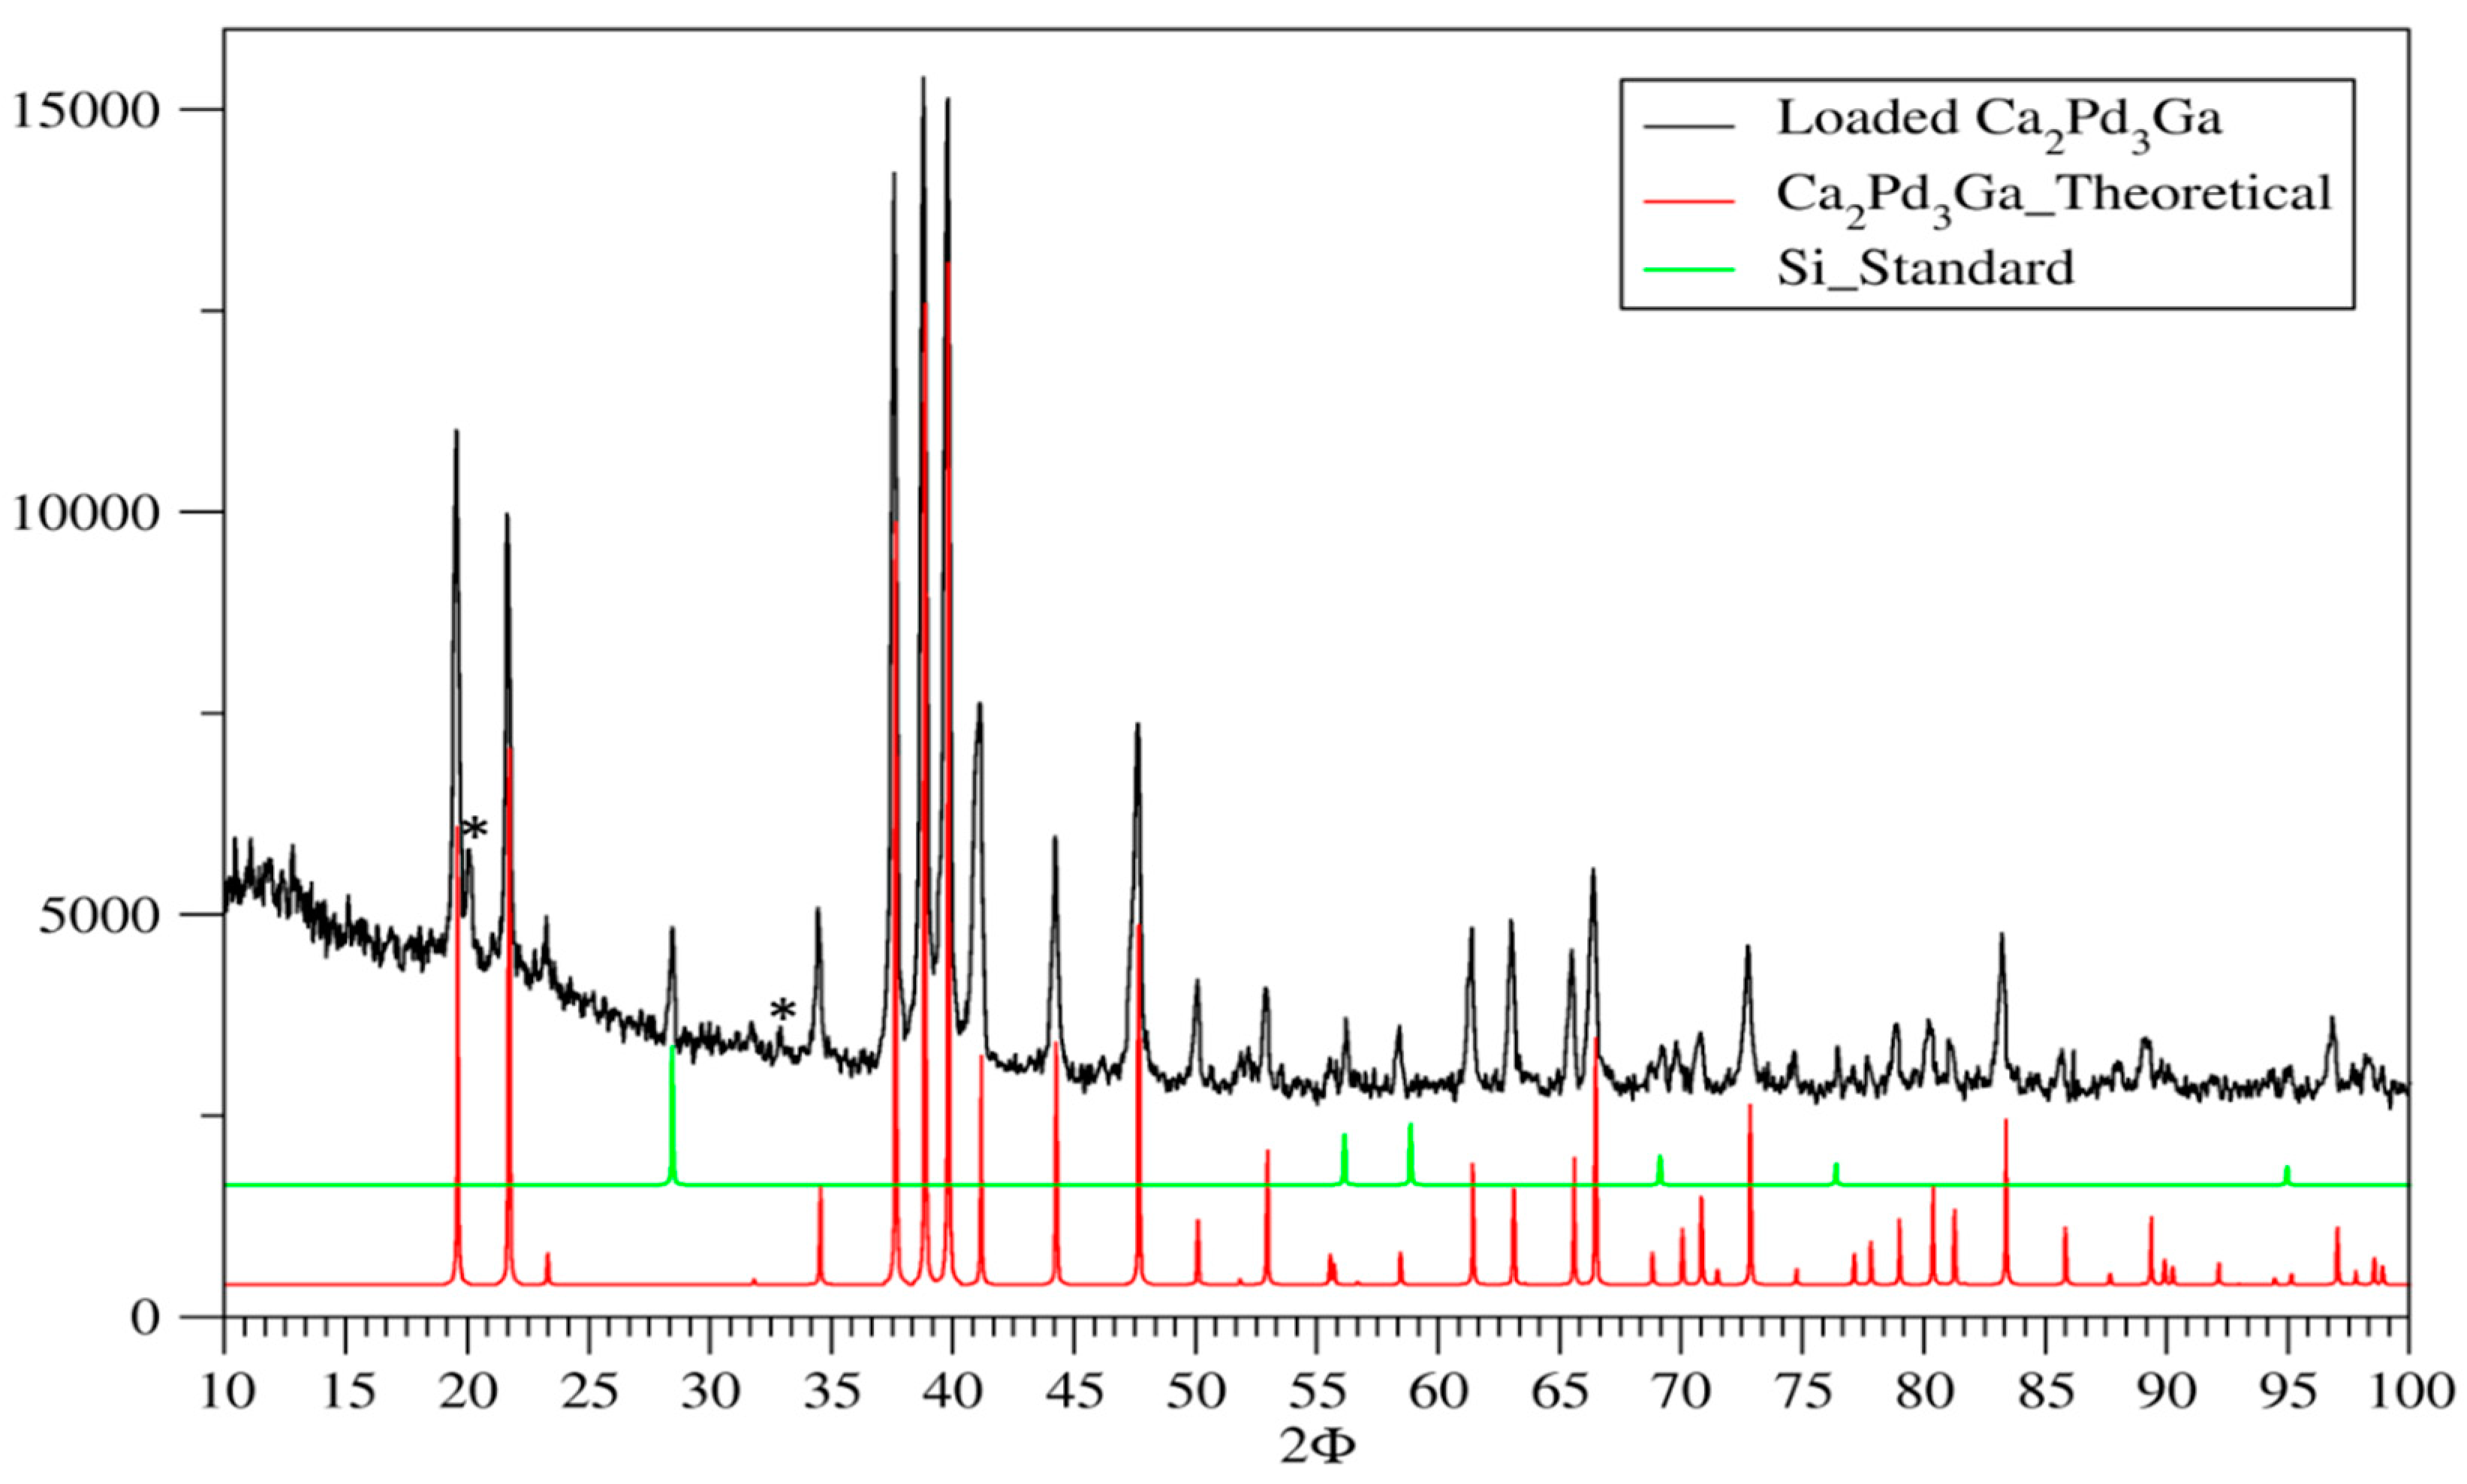
On the other hand, Ca2Pd3Ga can be prepared without the addition of silver. Since Ag and Pd have similar X-ray scattering factors, using Ag for the synthesis of Ca2Pd3Ga would present distinct challenges for subsequent characterization. Fortunately, a stoichiometric loading yielded Ca2Pd3Ga essentially as a pure phase product, with two non-indexed peaks at 2θ values of 20.0° and 32.8° most likely coming from a slight impurity of Ca3Pd2Ga2 (see Figure 2). Figure S2 shows the Rietveld refinement of Ca2Pt3Ga. Both compounds Ca2Pt3Ga and Ca2Pd3Ga degrade in air after approximately two weeks.
3.2. Structure Determination
Several single crystals were selected from the loaded samples and tested on a Bruker SMART APEX II single crystal diffractometer for quality. Among those, the best 3 samples for Ca2Pt3Ga and Ca2Pd3Ga were examined. The results of single crystal X-ray diffraction on these crystals are found in Table 1 and Table S3. Ca2M3Ga (M = Pt, Pd) crystallize in the Y2Rh3Ge structure type [29], which is a rhombohedral distortion of the cubic Laves phase MgCu2-type structure, as discussed by Doverbratt et al. [3] and Siggelkow et al. [2]. The M atoms occupy 9e Wyckoff positions which buildup 3.6.3.6 Kagomé nets orthogonal to the c-axis [2]. The Ga atoms cap alternate triangular faces of the Kagomé net and themselves form hexagonal nets. The Ga and M atoms are each coordinated by 6 Ga or M atoms. Nine M and three Ga atoms surround each Ca atom in a slightly distorted Frank-Kasper polyhedral environment. The rhombohedral structure of Ca2M3Ga has no Ga-Ga nearest neighbor interactions, with distances (6×/6×) of 5.2361(9)/5.576(1) Å and 5.2331(6)/5.6326(8) Å for the Pt and Pd cases, respectively [3]. For the binary compounds CaM2, each type of nearest neighbor interaction, i.e., Ca-Ca, Ca-M, and M-M, has a single length. When the structure distorts rhombohedrally to incorporate Ga atoms, the Ca-Ca and Ca-M contacts each split into two different distances: there are three shorter and one longer Ca-Ca interactions; whereas six Ca-M interactions that are longer and three shorter. Atomic positions and anisotropic displacement parameters for both compounds can be found in Tables S1 and S2.
3.3. Coloring Models and Electronic Structure Calculations
To elucidate the driving force that leads to the rhombohedral arrangement of Pt/Pd and Ga atoms in the majority atom positions of the cubic Laves phase, Burnside’s lemma [30] was used to construct nine distinct structural models for the unit cells formulated as Ca8[M3Ga]4 [31]. These models are illustrated in Figure S5 along with their respective space groups. The total energy of each model, listed in Table 2, was calculated using VASP without optimization. These results show that the rhombohedral model (α) is the lowest in energy. There are three models that have no nearest neighbor Ga-Ga interactions, these include the rhombohedral coloring, a cubic coloring (µ), and an orthorhombic coloring (γ). The rhombohedral and cubic models are the two lowest in energy before optimization, whereas the orthorhombic coloring is the second highest in energy.
All models were then optimized using VASP by allowing all structural parameters, including volume, cell shape, and atomic coordinates, to relax. The energies of the optimized structures can also be found in Table 2. Details of the optimized structures can be found in Tables S5–S13. After optimization, the rhombohedral model remains the lowest energy with the orthorhombic and cubic models coming in second and third lowest energy. The orthorhombic (γ) model optimized to a monoclinic unit cell, a ≠ b ≠ c and only β = 90°, while the other two models retained their symmetry through the optimization. As the energies increase for the various optimized structures, the number of nearest neighbor Ga-Ga interactions increases and the corresponding Ga-Ga distances decrease. Table 2 lists the energies after optimization as well as the resulting nearest Ga-Ga distance showing the correlation between total energy and Ga-Ga interactions.
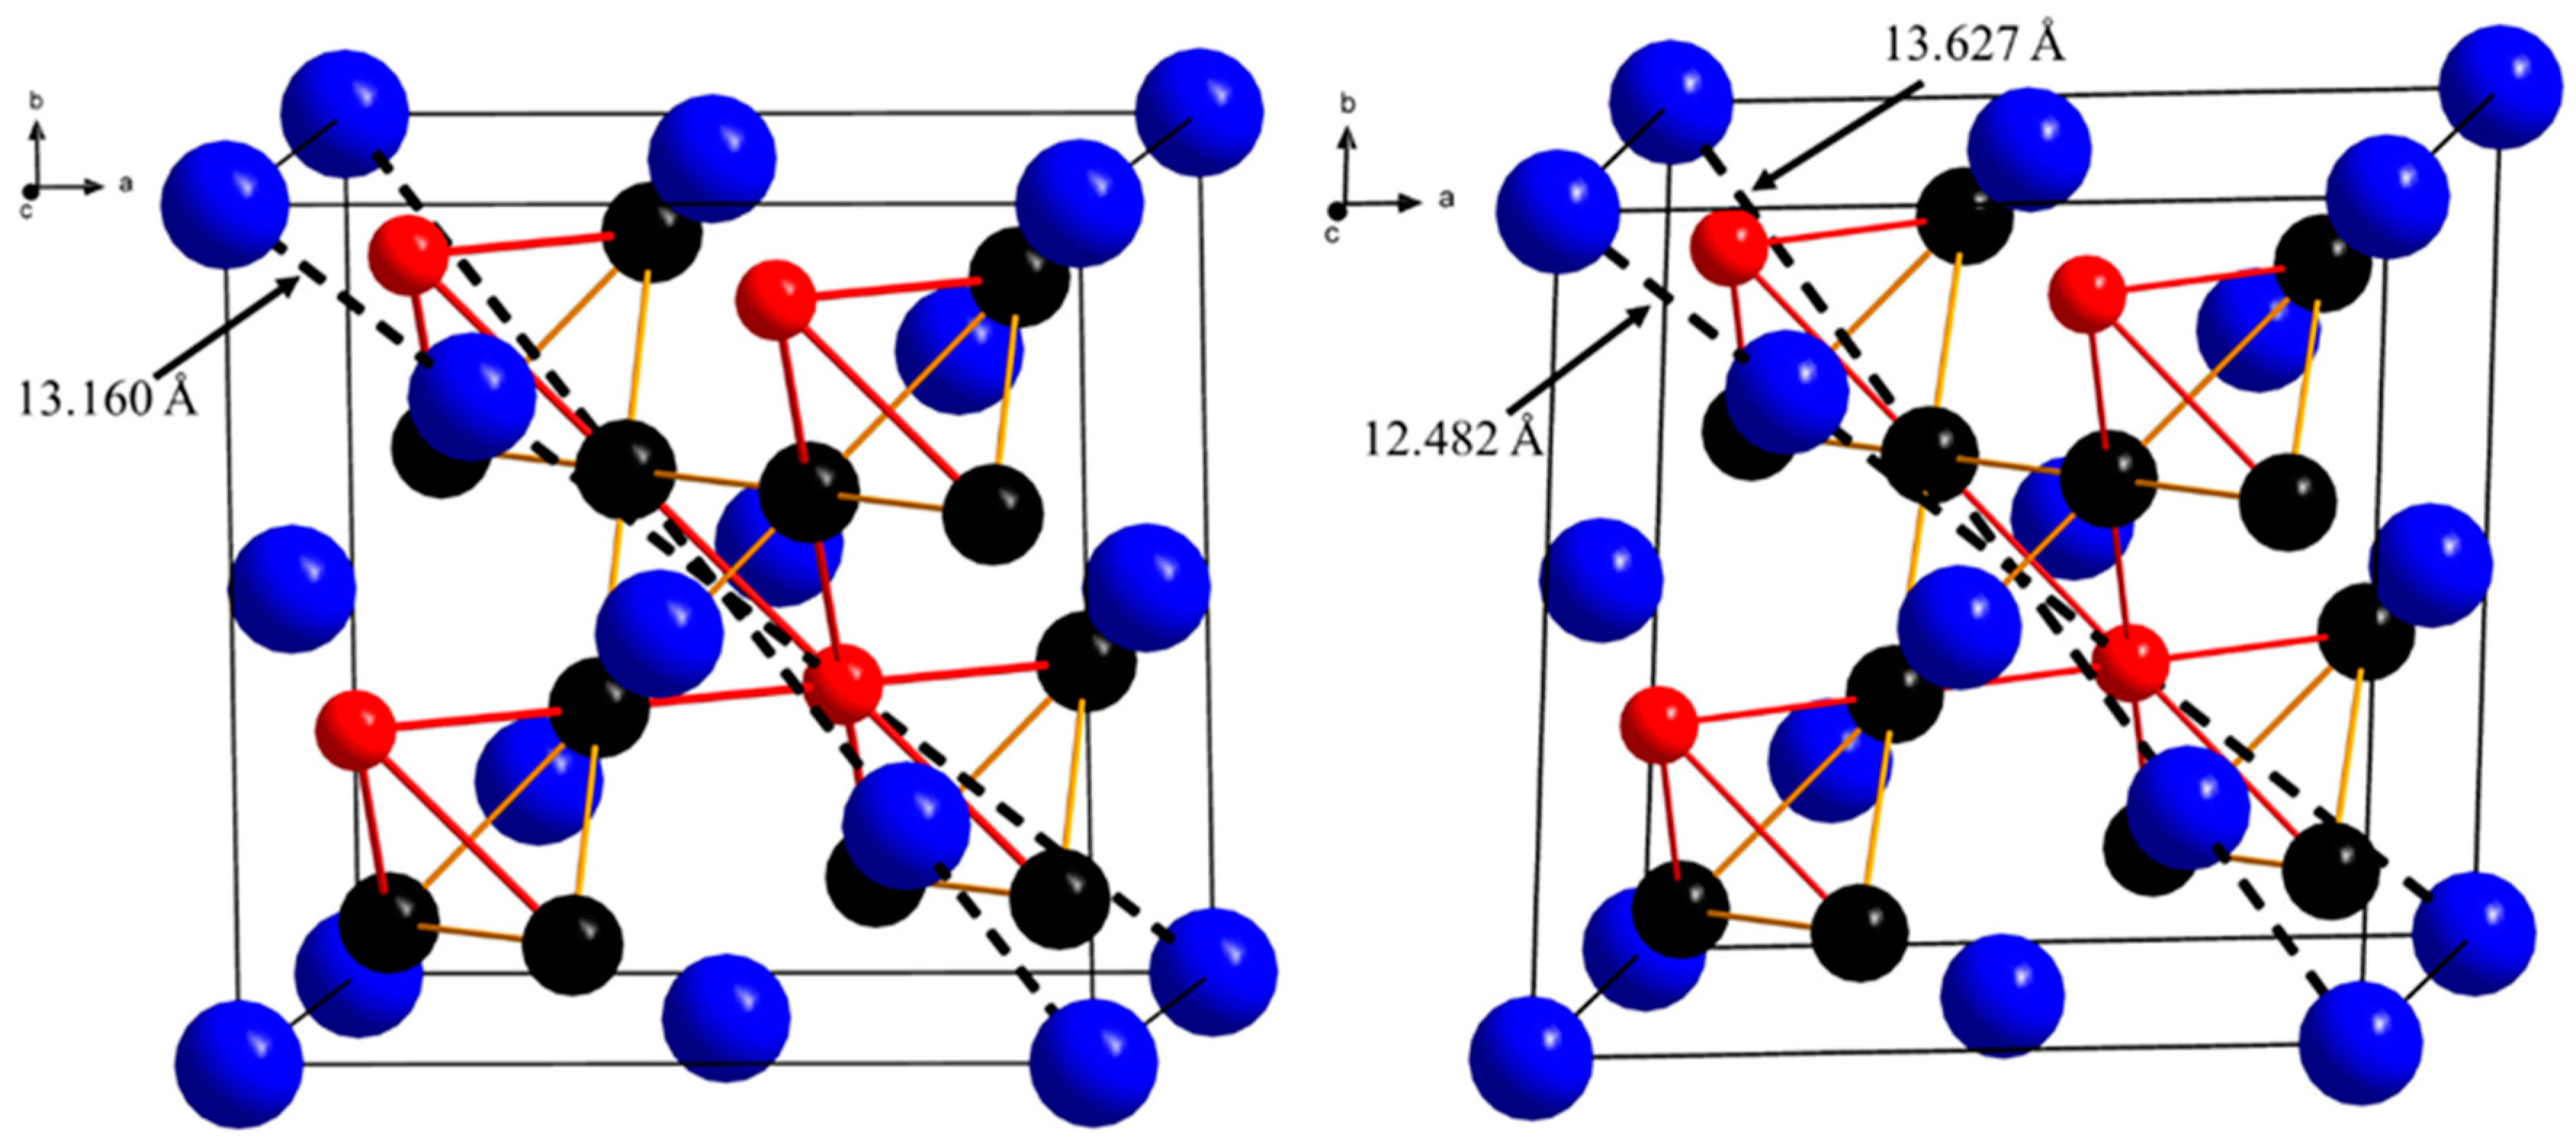
Calculations have shown that the rhombohedral model is the lowest energy both before and after optimization. This leads to the question of how does the rhombohedral structure arise from the “cubic” arranged starting point? The “cubic” starting point, for Ca2Pt3Ga, has a lattice parameter of 7.598 Å and a body diagonal distance of 13.160 Å. The primitive rhombohedral unit cell, within the face-centered cubic cell, has angles equal to 60° before optimization. After optimization these angles are 57.825° and 57.515° for Ca2Pt3Ga and Ca2Pd3Ga respectively. This collapsing of the angles, comprising the primitive unit cell, causes the expansion of the body diagonal. Optimization expands the lattice parameter by 1.43% to 7.708 Å. However, during optimization, the body diagonals do not expand congruently. Three body diagonals are congruent with a length of 13.627 Å while the fourth body diagonal shrinks to 12.482 Å. In the Pd case the three equivalent body diagonals are 13.754 Å while the fourth body diagonal shrinks to 12.412 Å. The shorter body diagonal is parallel to the direction that the Ga atoms are located in each of the four tetrahedra in the unit cell (see Figure 3). Calculated ICOHP values for the “cubic” starting point indicate that the Pt-Ga bonds (ICOHP = −1.857 eV) would become shorter as compared with the Pt-Pt bonds (ICOHP = −0.775 eV). These ICOHP values shed light on the driving force behind the corresponding distortion of the cubic unit cell to the rhombohedral structure by substituting Ga for Pd/Pt: shorter Pt-Ga contacts will contract one body-diagonal of the cubic cell.
All “coloring” calculations performed above were evaluated for the case of vec = 37e−/f.u. Models were also created for the Ca2Pd3Ge to determine if there were any differences by changing the vec to 38 e−/f.u. The energies of the non-optimized and optimized colorings can be found in Table S4, and the results show the same trends as those for Ca2M3Ga (M = Pd, Pt): the lowest energy model shows rhombohedral coloring and the largest Ge-Ge nearest neighbor distance.
To shed light on the nature of the distortion of the cubic Laves phase structure of CaM2 (M = Pd, Pt) upon the substitution of Ga for M and their stability, various total energies as well as the density of states (DOS) and crystal orbital Hamilton population (COHP) curves were determined for the binaries CaM2 and ternaries Ca2M3Ga (M = Pd,Pt). With respect to the elemental solids, the binaries CaM2 and ternaries Ca2M3Ga are favored. For the experimental structures, CaPt2 has an especially high formation energy compared to CaPd2; the experimental volume of CaPt2 is ca. 10 Å3/formula unit smaller than that of CaPd2, although Pt is slightly larger than Pd (the 12-coordinate metallic radii are 1.39 (Pt) and 1.37 (Pd) [32]. This outcome may be an indication of relativistic effects on the valence orbitals of Pt, effects which can enhance empty d-filled d Ca-Pt 3d-5d interactions as compared to Ca-Pd 3d-4d interactions.
Total energy calculations for the “reactions” 2CaPt2 + Ga → Ca2Pt3Ga + Pt and 2CaPd2 + Ga → Ca2Pd3Ga + Pd illuminate significant aspects of the relative stability and formation of the ternaries. Both “reactions” yield favorable ΔE values, respectively, of −0.297 and −0.599 eV, and they can be separated into the sum of three hypothetical but revealing steps: (1) elemental substitution of Ga for M with no metric changes (volume, unit cell shape) in the cubic Laves phase structure; (2) volume change for the ternary without change in unit cell shape; and (3) distortion of the unit cell shape of the ternary at constant cell volume. Table 3 summarizes these results. The difference in overall total energies essentially arises from the energetic difference for step (1) between Pt and Pd cases: replacing Pt with Ga is energetically unfavorable whereas Pd for Ga is favorable. Since Ga (metallic radius of 1.50 Å [32]) is larger than either Pt or Pd, these energy differences reflect, in part, volume effects, but also are influenced by the relative Mulliken electronegativities [33], which increase Ga (3.2 eV) to Pd (4.45 eV) to Pt (5.6 eV). In the second step, both structures favorably expand by over 3% (based on unit cell volume) with slight energetic lowering. In the third step, both lattice distortions provide similar energetic stabilizations.
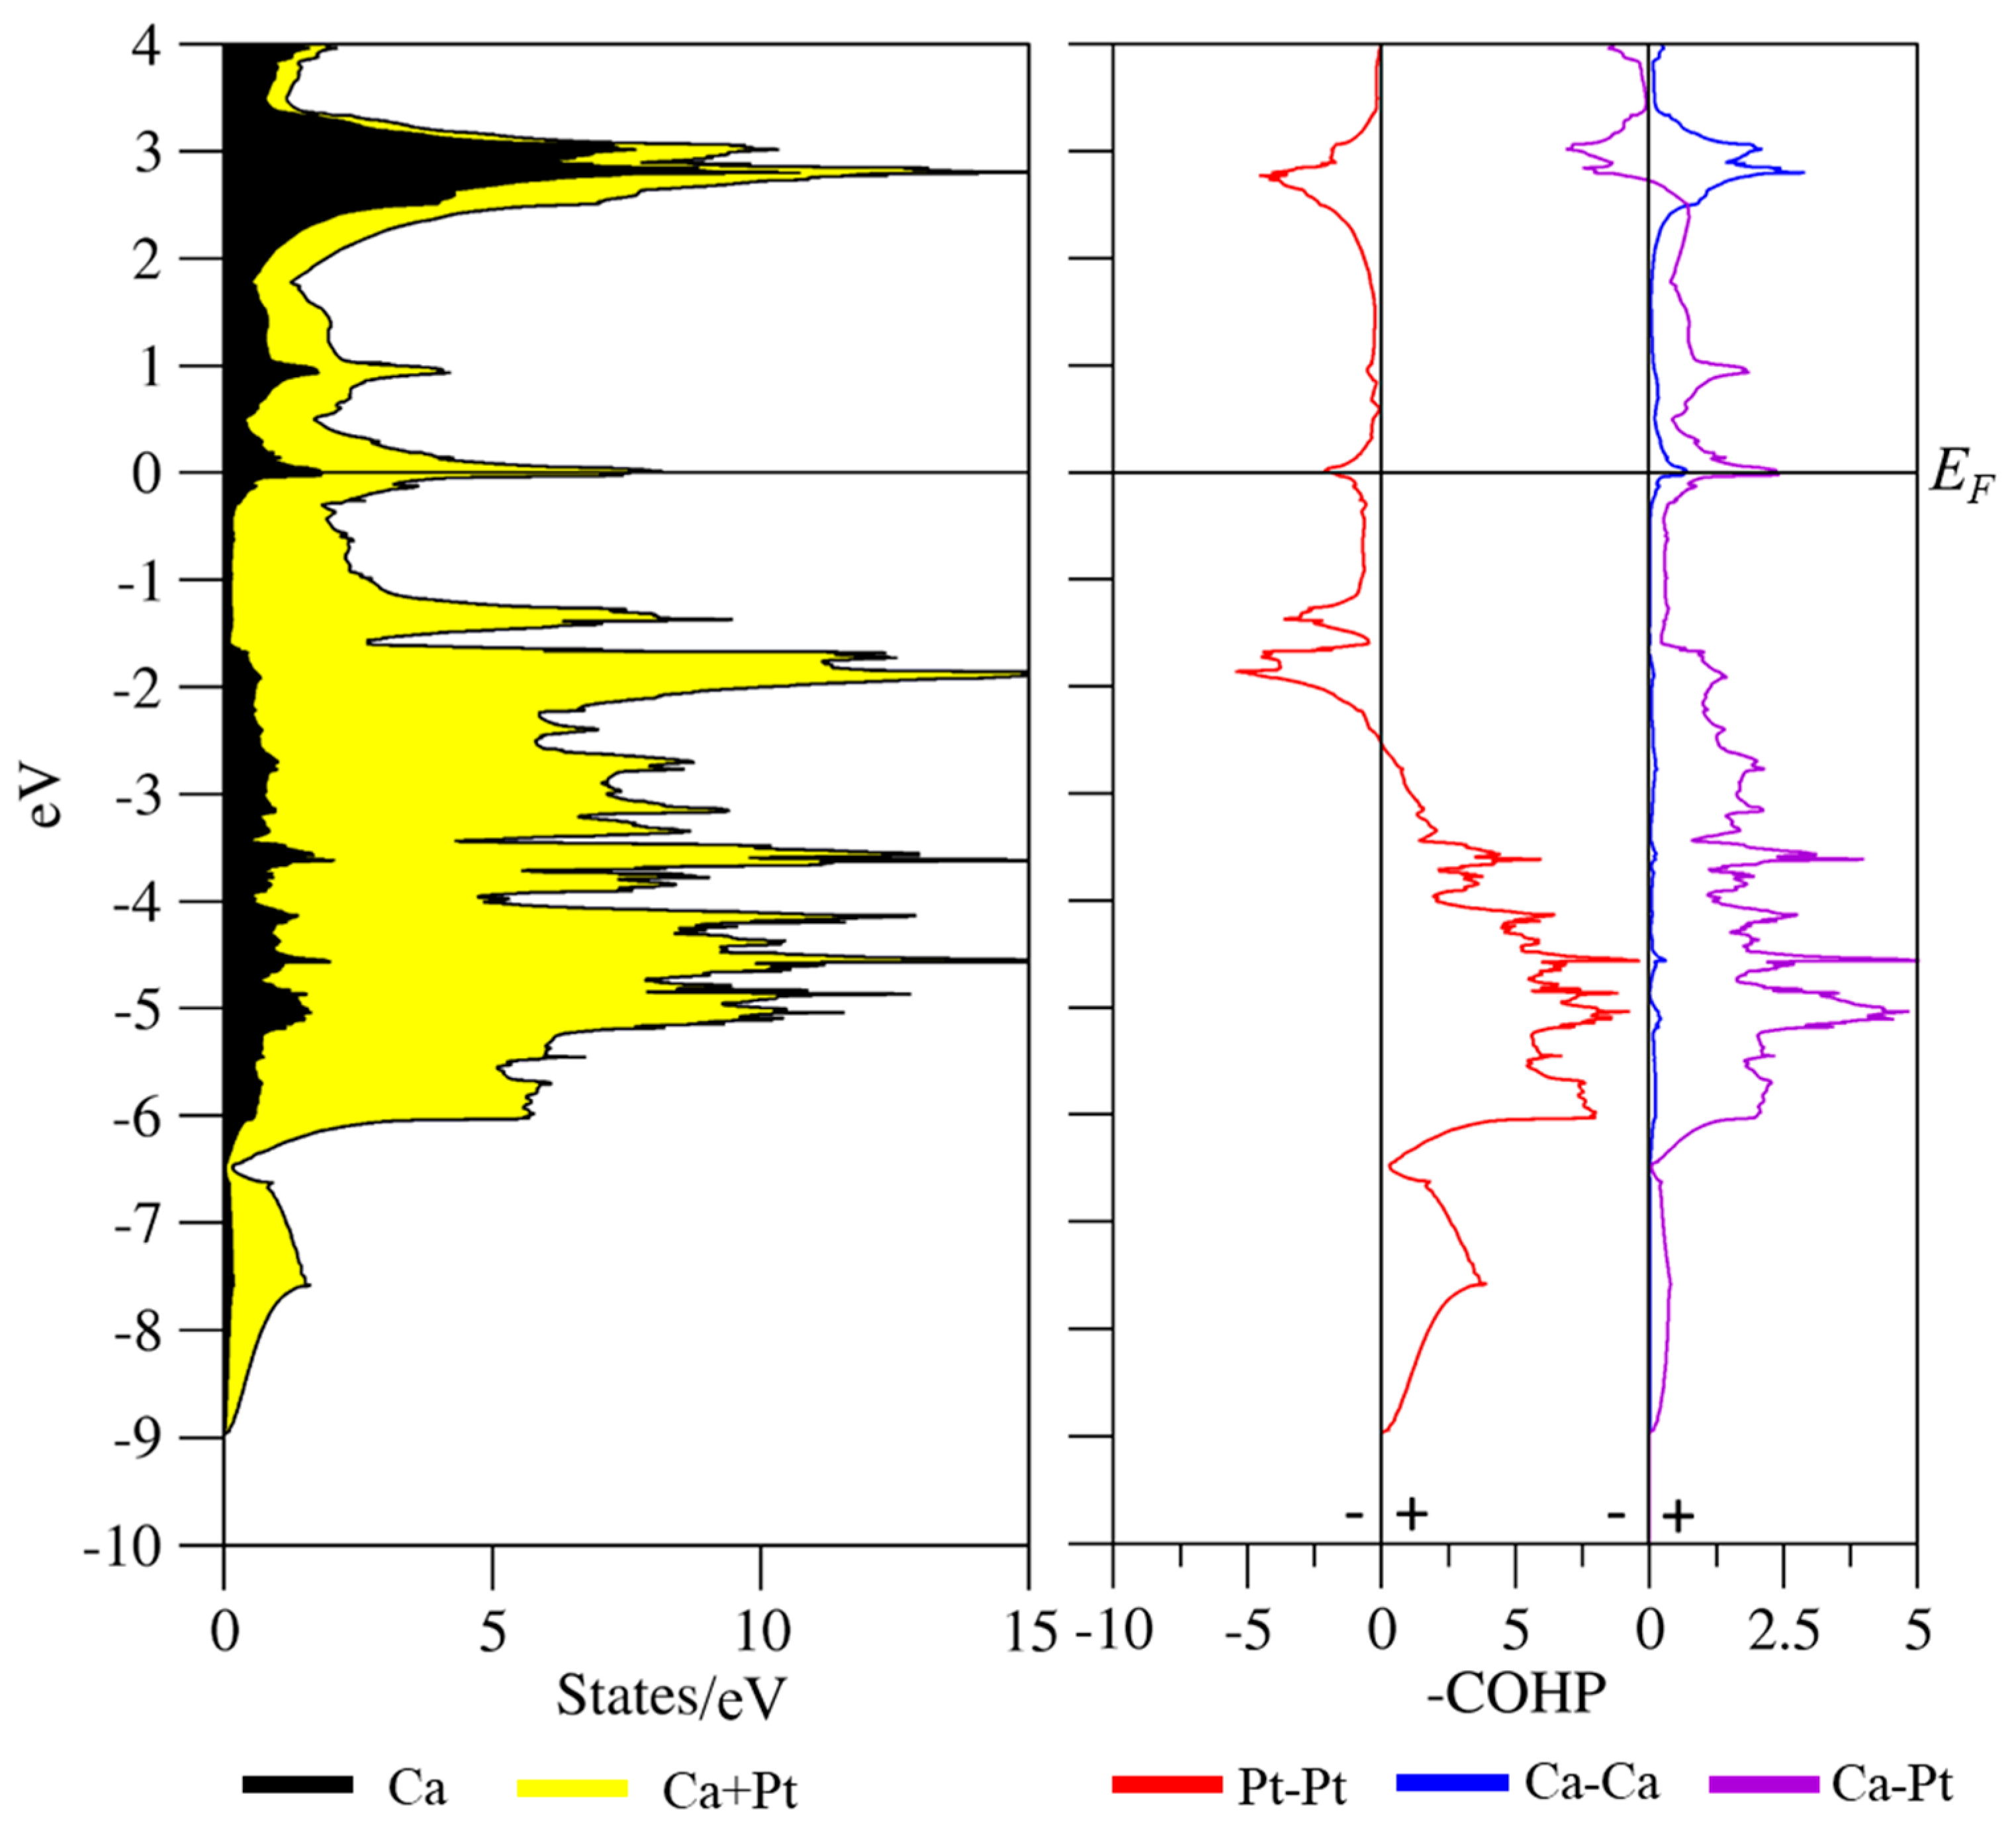
We now consider some specific aspects of the electronic structures of the binary CaM2 and ternary Ca2M3Ga. The DOS and COHP for CaPt2 are shown in Figure 4; the DOS shows a significant sharp peak at the Fermi level which suggests a potential electronic instability.
The precise reason for this peak and the possible instability has not been forthcoming to date and an electronic structure investigation was performed. Analysis of the band structure at the Fermi level, specifically at the W point, because there are bands with nearly zero slope near this point, shows that the Pt 5d atomic orbitals are major contributors to this peak. For each Pt atom the orbital contribution is split approximately as 80 percent 5d and 20 percent 6p, and the primary interatomic orbital interactions are 5d-5d π* interactions. Spin-orbit coupling was added to the Hamiltonian operator of CaPt2 to see if the peak at the Fermi level would be affected. Figure S6 shows the DOS curve and band structure for these calculations. The degeneracies in the band structure at the high symmetry k-points are removed by the spin-orbit coupling; however, the peak at EF is not affected. Furthermore, the application of spin-orbit coupling would only converge with a unit cell expanded by ~1.1 Å. A second hypothesis was to consider that vacancies might be playing a role to stabilize the structure. DOS calculations were subsequently performed using VASP on “Ca8Pt15” and “Ca8Pt12” models to see the effect of vacancies on the peak at EF; these results can be seen in Figure S7. The peak is no longer present in the “Ca8Pt12” model only when all 4 vacancies are adjacent to each other so that the resulting defect Laves phase structure is missing an entire tetrahedron per unit cell. Lastly, DOS curves calculated for AEM2 (AE = Ca, Sr, Ba; M = Ni, Pd, Pt), shown in Figure S8, indicate that as the size of the alkaline earth metal increases, the peak in the DOS moves away from EF. These calculations have not identified the reason behind the potential electronic instability in CaM2 and now the possibility of superconductivity is being investigated.
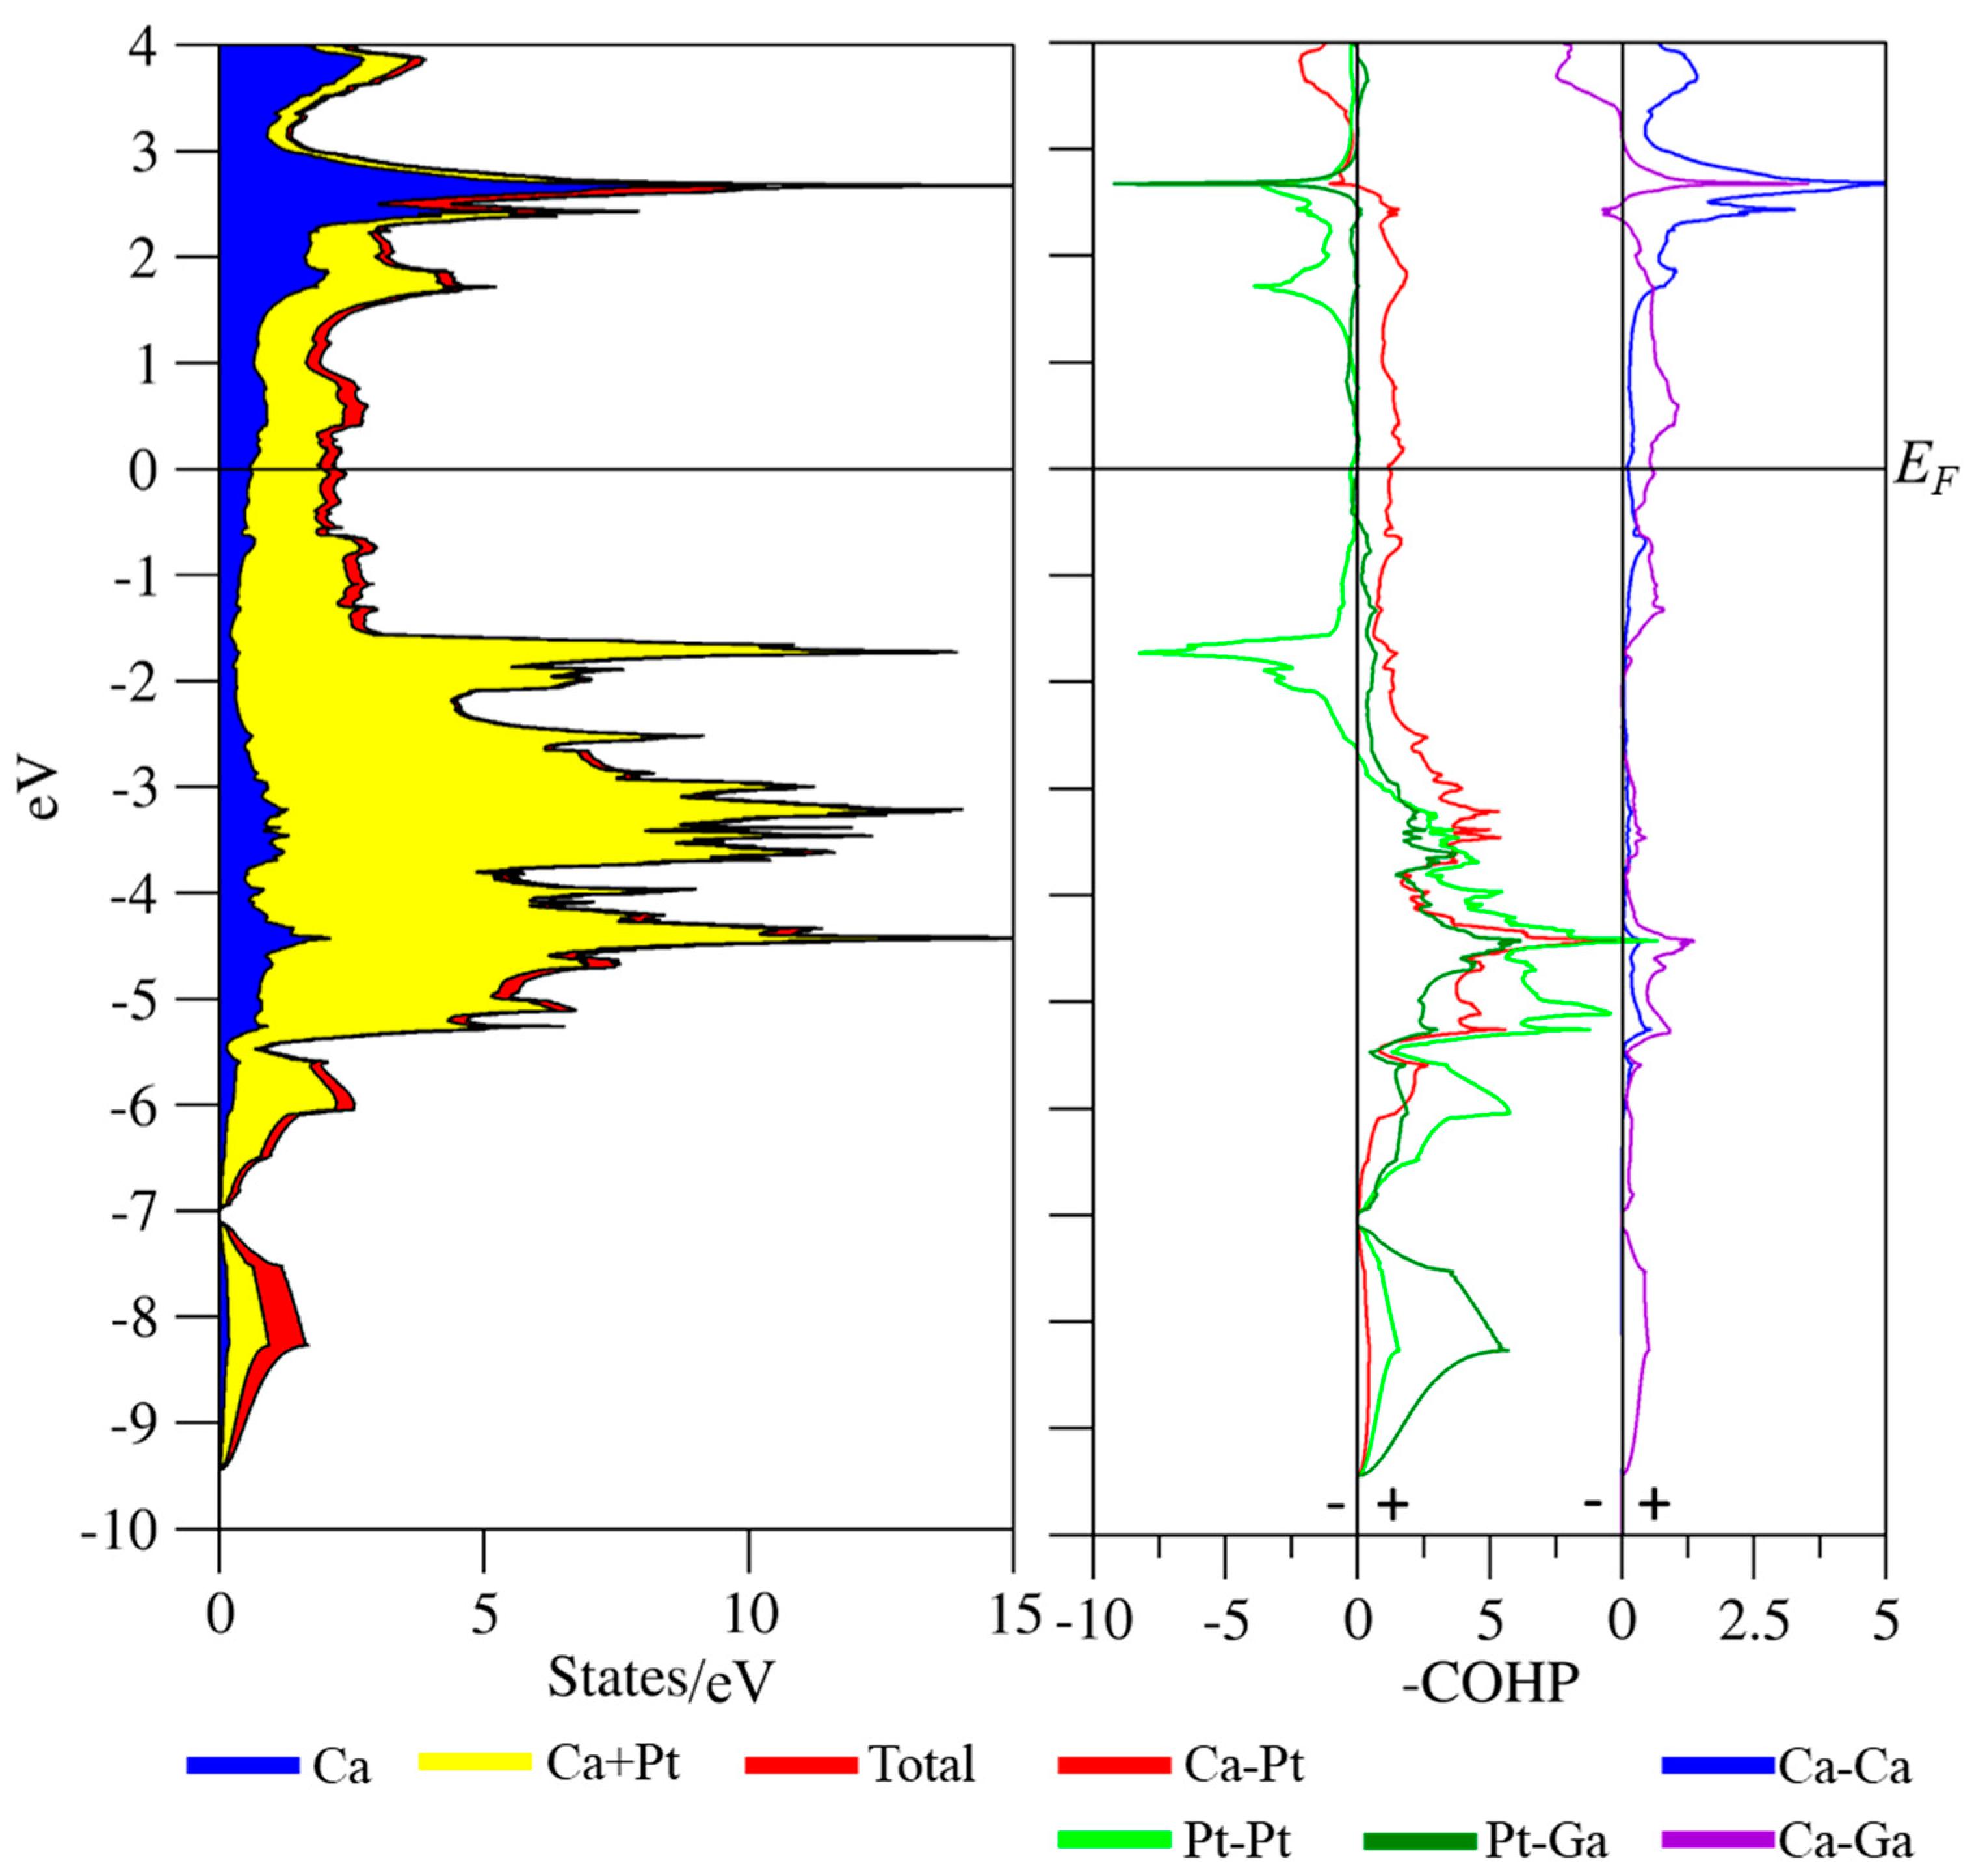
The Pt 5d band dominates the overall occupied DOS of CaPt2 and the majority contribution to the overall polar covalent bonding via ICOHP values arises from Pt-Pt interactions, which switch from bonding to antibonding at an energy value corresponding to 12.42 e−/formula unit. At the Fermi level, the Pt-Pt COHP curve shows a small antibonding peak, whereas the Ca-Pt and Ca-Ca COHPs show a small bonding peak. On transitioning to Ca2Pt3Ga, the peak at the Fermi level in the DOS of CaPt2 has all but disappeared in the DOS curve of Ca2Pt3Ga (see Figure 5). There is a large range from ca. −1.5 to +1 eV over which the DOS of Ca2Pt3Ga remains flat. The COHP curves have also changed in that the Pt-Pt interactions still transition to antibonding at −2.60 eV, although around the Fermi level they are mostly nonbonding rather than antibonding. Overall, at the Fermi level there are now no small peaks but mostly constant intensities of nonbonding or slightly bonding interactions with the Ca-Pt interactions still contributing the most to overall bonding.
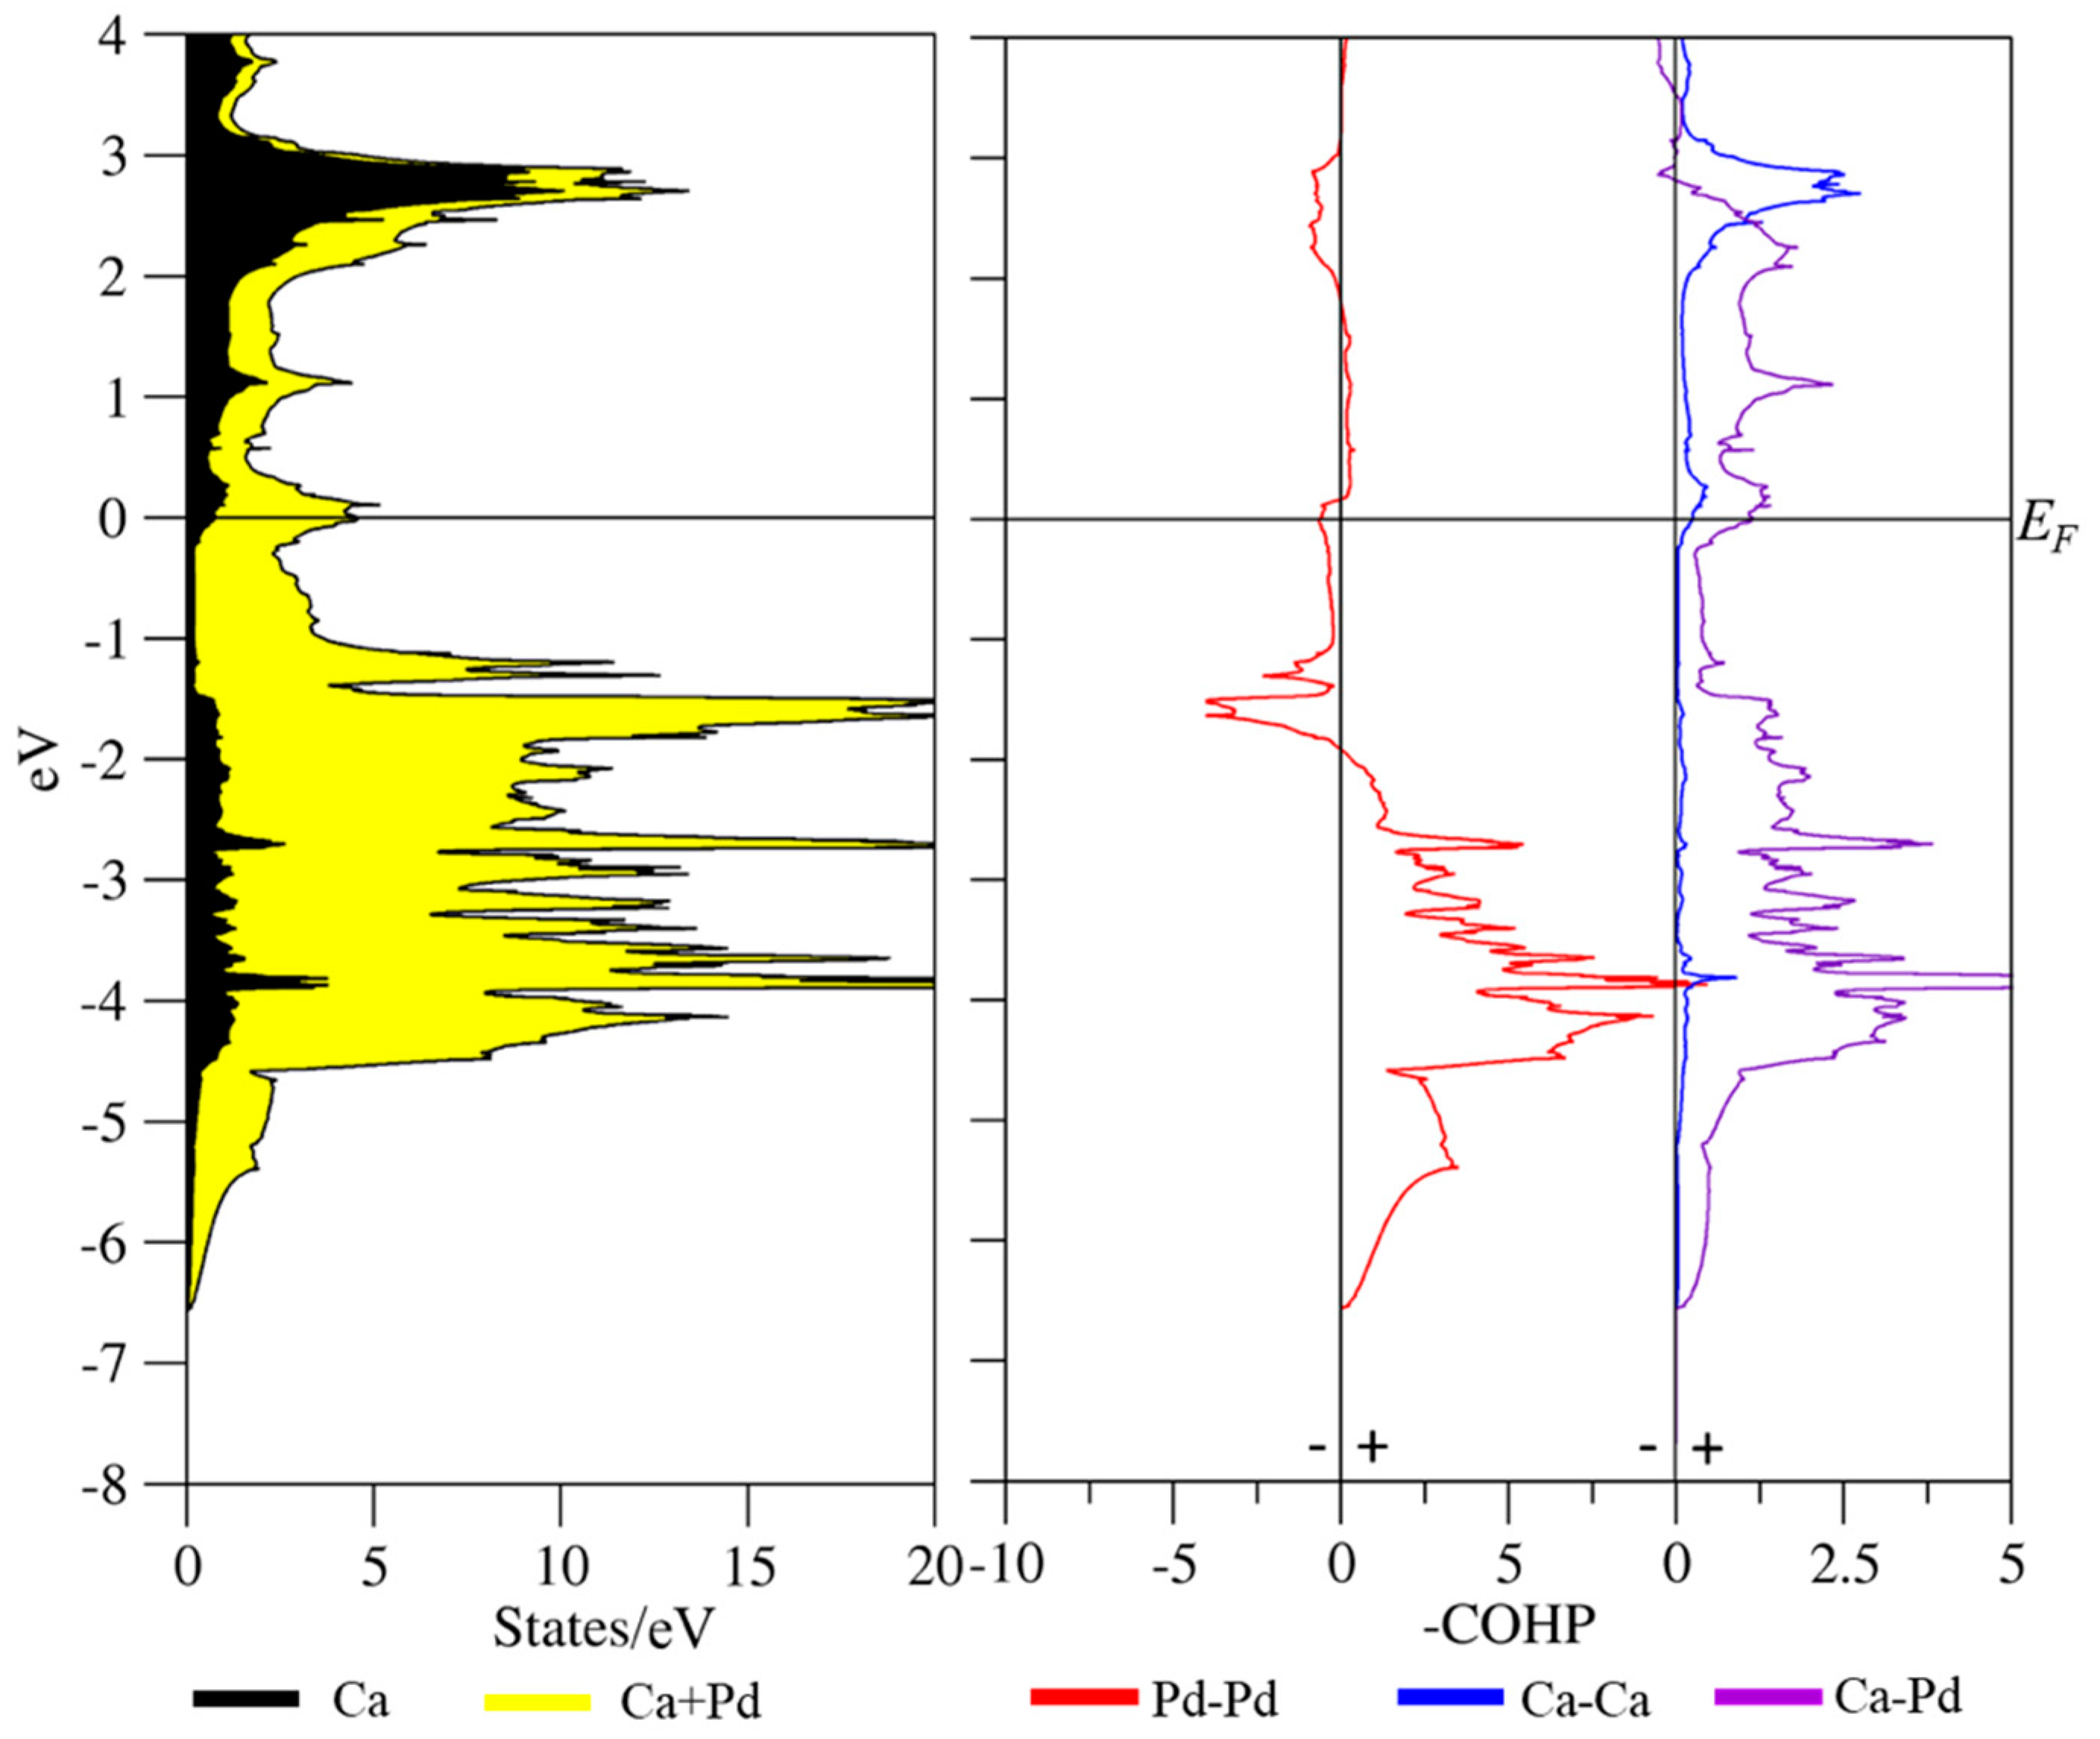
The DOS and COHP curves for CaPd2 (see Figure 6) and Ca2Pd3Ga (see Figure 7) look similar overall to those described above for the Pt counterparts, although there are a few distinct differences. The peak at the Fermi level in the DOS for CaPd2 as well as the antibonding Pd-Pd peak in the COHP are not as intense nor as sharp as those observed for CaPt2. The Pd-Pd interactions transition from bonding to antibonding at an energy which corresponds to 15.36 eV/formula unit. There is a similar minimum in the Pd 4d states at −1.40 eV which corresponds to 7.5 4d electrons/Pd. The DOS and COHP for Ca2Pd3Ga are similar to those for Ca2Pt3Ga. There is again a large energy range from ca. −1.8–1.8 eV over which the DOS remains flat.
Tables S14–S17 contain the percent contributions of each type of interaction to the overall integrated COHP (ICOHP) values. These can be used as an indication to determine the bond energy contribution to the stability of a structure. The cubic binary Laves phases are dominated by the M-M (M = Pd, Pt) interactions at 62.95 and 58.41% for CaPt2 and CaPd2, respectively, whereas the Ca-Ca interactions lend little to the overall ICOHP at only 1.47% and 2.12% for CaPt2 and CaPd2, respectively. The rest is made up by the Ca-M interactions. For the ternary compounds, there is a significant drop in the contributions from M-M interactions to the total polar-covalency because the majority of the total ICOHP comes from Ca-M and M-Ga interactions. In Ca2Pt3Ga, the Pt-Pt contribution is just 29.95%, and in Ca2Pd3Ga, the Pd-Pd contribution is 24.40%. The Ca-M and M-Ga interactions contribute ~30% each in both ternary compounds. Furthermore, in the ternary compounds, there are now Ca-Ga interactions that account for 5.81% and 7.89%, respectively, in Ca2Pt3Ga and Ca2Pd3Ga. The Ca-Ca bond populations continue to contribute less than 2.5% in all cases.
The analysis of the integrated Hamilton population curves to study the interatomic interactions is useful for mainly two-center interactions, and the use of crystal orbital overlap population (COOP) analysis has been applied to examine cubic vs. hexagonal Laves phases [34]. However, multi-center chemical bonding in Laves phases has also been described using an electron localizability indicator [35]. Laves phases AB2 with a small electronegativity difference between the two components exhibit enhanced multi-center bonding because the effective charge transfer between A and B is small. However, if the electronegativity difference between A and B is large, the correspondingly greater effective charge transfer can lead to polyanions [35]. CaPt2 and CaPd2 are cases with a large electronegativity difference between the A and B atoms (3.2 eV for CaPt2 and 2.25 eV for CaPd2 [33]), but there most likely exists some multi-center bonding in these compounds, especially between the faces of the transition metal tetrahedra and the Ca atoms, bonding which would be affected by the substitution of one of the Pt or Pd atoms by Ga. The electronegativity difference between Ga and Ca is not as large (1.0 eV [33]), which creates less charge transfer between Ca and Ga and thereby shifts the valence electron density as compared to the binary structures. Electron localizability indicators were not evaluated during this study, but they would provide useful information regarding specifics of multi-center interactions in the ternary derivatives.
4. Conclusions
Two new fully ordered ternary gallium-containing Laves phase compounds, Ca2Pt3Ga and Ca2Pd3Ga, were synthesized and characterized by X-ray diffraction and electronic structure calculations. The compounds crystallize in a rhombohedrally distorted cubic MgCu2-type structure. Ca2Pd3Ga was synthesized as a pure phase whereas Ca2Pt3Ga was only found co-existing with Ca2Pt2Ga and CaPt2 and required the addition of small amounts of Ag to form. Total energy calculations performed on nine symmetrically inequivalent “coloring models” indicated that the rhombohedral coloring gave the lowest energy by 78.8 meV and 68.1 meV in the Pt and Pd cases respectively. ICOHP values from the “cubic” starting arrangement indicate that the M-Ga bonds tend to become shorter vs. M-M contacts. These shorter bonds cause a shrinking of the body diagonal from the corner of 011 to 100 which gives rise to the rhombohedrally distorted unit cell.
This computational study supports the group–subgroup relationship that R-3m is the highest maximal subgroup of Fd-3m and allows a fully ordered structure with the 3:1 ratio of M:Ga atoms. The rhombohedral coloring is the lowest energy way to color the “B” network in the Laves phase so that the Ga atoms avoid all homoatomic interactions and have the furthest nearest neighbor distance.
Supplementary Materials
The following are available online at https://www.mdpi.com/2073-4352/8/5/186/s1, Figure S1: Peak fitting X-ray powder pattern for Ca2Pt3Ga, Figure S2: Rietveld refinement of Ca2Pd3Ga, Figure S3: Powder patterns with loadings Ca2Pt3Ga0.5Ag0.5 and Ca3Pt3GaAg, Figure S4: Powder Pattern of another loaded sample of Ca2Pt3Ga0.85Ag0.15, Table S1: atomic coordinates and ADPs for Ca2Pd3Ga, Table S2: atomic coordinates and ADPs for Ca2Pt3Ga Table S3: X-ray diffraction data on additional crystals for Ca2Pt3Ga and Ca2Pd3Ga, Figure S5: Coloring Models and respective symmetries, Table S4: Total energies and nearest Ge-Ge contact for the theoretical models of Ca2Pd3Ge, Figure S6: Sping-orbit coupling DOS and band structures for CaPt2, Figure S7: VASP calculated DOS for Ca8Pt15 and Ca8Pt12, Figure S8: DOS calculated for AEM2 (AE = Ca, Sr, Ba M = Pt, Pd), Tables S5–S13: Optimized structures of coloring models, Table S14: COHP interactions for CaPt2, Table S15: COHP interactions for CaPd2, Table S16: COHP interactions in Ca2Pt3Ga, Table S17: COHP interactions in Ca2Pd3Ga, Table S18: Total energies used to calculate ΔE values. COD contains the supplementary crystallographic data for this paper. These data can be obtained free of charge via http://www.crystallography.net/search.html. Ca2Pt3Ga: 3000193, Ca2Pd3Ga: 3000192.
Author Contributions
A.T. performed the synthesis, characterization, and computational studies of all compounds, and wrote the first draft of the manuscript as part of his doctoral dissertation. G.J.M. managed the overall project and edited the final manuscript.
Acknowledgments
A. Toombs acknowledges J. Pham and L. Lutz-Kappelman for answering many questions involving crystallography and computational guidance along with S. Thimmaiah for helping with the Rietveld refinements. This research was supported by the Office of the Basic Energy Sciences, Materials Sciences Division, U.S. Department of Energy (DOE). The Ames Laboratory is operated by Iowa State University under Contract No. DE-AC02-07C. Computations were performed on the CRUNCH cluster supported by Iowa State University Computation Advisory Committee under Project No. 202-17-10-08-0005.
Conflicts of Interest
The authors declare no conflict of interest.
References
- Jansen, M. Effects of relativistic motion of electrons on the chemistry of gold and platinum. Solid State Sci. 2005, 7, 1464–1474. [Google Scholar] [CrossRef]
- Siggelkow, L.; Hlukhyy, V.; Faessler, T.F. The Influence of the Valence Electron Concentration on the Structural Variation of the Laves Phases MgNi2−xGex. Z. Anorg. Allg. Chem. 2017, 643, 1424–1430. [Google Scholar] [CrossRef]
- Doverbratt, I.; Ponou, S.; Lidin, S. Ca2Pd3Ge, a new fully ordered ternary Laves phases structure. J. Solid State Chem. 2013, 197, 312–316. [Google Scholar] [CrossRef]
- Stein, F.; Palm, M.; Sauthoff, G. Structure and stability of Laves phases. Part I—Critcal assessment of factors controlling Laves phase stability. Intermetallics 2004, 12, 713–720. [Google Scholar] [CrossRef]
- Osters, O.; Nilges, T.; Schöneich, M.; Schmidt, P.; Rothballer, J.; Pielnhofer, F.; Weihrich, R. Cd4Cu7As, The First Representative of a Fully Ordered, Orthorhombically Distorted MgCu2 Laves Phases. Inorg. Chem. 2012, 51, 8119–8127. [Google Scholar] [CrossRef] [PubMed]
- Murtaza, A.; Yang, S.; Zhou, C.; Song, X. Influence of Tb on easy magnetization direction and magnetostriction of ferromagnetic Laves phase GdFe compounds. Chin. Phys. B 2016, 25, 096107. [Google Scholar] [CrossRef]
- Manickam, K.; Grant, D.M.; Walker, G.S. Optimization of AB2 type alloy composition with superior hydrogen storage properties for stationary applications. Int. J. Hydrogen Energy 2015, 40, 16288–16293. [Google Scholar] [CrossRef]
- Nash, C.P.; Boyden, F.M.; Whittig, L.D. Intermetallic compounds of alkali metals with platinum. A novel preparation of a colloidal platinum hydrogenation catalyst. J. Am. Chem. Soc. 1960, 82, 6203–6204. [Google Scholar] [CrossRef]
- Xiao, C.; Wang, L.; Maligal-Ganesh, R.V.; Smetana, V.; Walen, H.; Thiel, P.A.; Miller, G.J.; Johnson, D.D.; Huang, W. Intermetallic NaAu2 as a Heterogeneous Catalyst for Low-Temperature CO Oxidation. J. Am. Chem. Soc. 2013, 135, 9592–9595. [Google Scholar] [CrossRef] [PubMed]
- Thimmaiah, S.; Miller, G.J. Influence of Valence Electron Concentration on Laves Phases: Structures and Phase Stability of Pseudo-Binary MgZn2−xPdx. Z. Anorg. Allg. Chem. 2015, 641, 1486–1494. [Google Scholar] [CrossRef]
- Seidel, S.; Janka, O.; Benndorf, C.; Mausolf, B.; Haarmann, F.; Eckert, H.; Heletta, L.; Pöttgen, R. Ternary rhombohedral Laves phases RE2Rh3Ga (RE = Y, La-Nd, Sm, Gd-Er). Z. Naturforsch. 2017, 72, 289–303. [Google Scholar] [CrossRef]
- Dwight, A.E.; Kimball, C.W. A rhombohedral Laves phase. Terbium-ron (TbFe2). Acta Cryst. Sect. B 1974, 30, 2791–2793. [Google Scholar] [CrossRef]
- Burdett, J.K.; Canadell, E.; Hughbanks, T. Symmetry control of the coloring problem: The electronic structure of MB2C2 (M = calcium, lanthanum, …). J. Am. Chem. Soc. 1986, 108, 3971–3976. [Google Scholar] [CrossRef]
- Jepsen, O.; Andersen, O.K. TB-LMTO, version 47; Max-Planck-Institut für Festkörperforshcung: Stuttgart, Germany, 2000. [Google Scholar]
- Von Barth, U.; Hedin, L. Local exchange-correlation potential for the spin-polarized case. J. Phys. C 1972, 5, 1629. [Google Scholar] [CrossRef]
- Koelling, D.D.; Harmon, B.N. A technique for relative spin-polarized calculations. J. Phys. C 1977, 10, 3107–3114. [Google Scholar] [CrossRef]
- Kresse, G.; Hafner, J. Ab initio molecular dynamics for liquid metals. Phys. Rev. B 1993, 47, 558. [Google Scholar] [CrossRef]
- Kreese, G.; Furthmüller, J. Efficient iterative schemes for ab initio total-energy calculations using a plane-wave basis set. Phys. Rev. B 1996, 54, 11169–11186. [Google Scholar] [CrossRef]
- Blöchl, P.E. Projector augmented-wave method. Phys. Rev. B 1994, 50, 17953–17979. [Google Scholar] [CrossRef]
- Perdew, J.P.; Burke, K.; Wang, Y. Gerneralized gradient approximation for the exchange-correlation hole of a many-electron system. Phys. Rev. B 1996, 54, 16533–16539. [Google Scholar] [CrossRef]
- Monkhorst, H.J.; Pack, J.D. Special points for Brillouin-zone integrations. Phys. Rev. B 1976, 13, 5188. [Google Scholar] [CrossRef]
- Blöchl, P.E.; Jepsen, O.; Andersen, O.K. Improved tetrahedron method for Brillouin-zone integrations. Phys. Rev. B 1994, 49, 16223–16233. [Google Scholar] [CrossRef]
- PowderCell, version 2.3; Federal Institute for Materials Research and Testing: Berlin, Germany, 2000.
- APEX-II; Bruker AXS Inc.: Madison, WI, USA, 2013.
- SAINT-V8.27; Bruker AXS Inc.: Madison, WI, USA, 2013.
- SHELXTL-v2008/4; Bruker AXS Inc.: Madison, WI, USA, 2013.
- Brandenburg, K. Diamond, version 3.2; Crystal Impact GbR: Bonn, Germany, 2011. [Google Scholar]
- Petricek, V.; Dusek, M.; Palatinus, L. Structure Determination Software Programs; Institute of Physics: Praha, Czech Republic, 2006. [Google Scholar]
- Cenzual, K.; Chabot, B.; Parthe, E. Yttrium rhodium germanide (Y2Rh3Ge), a rhombohedral substitution variant of the MgCu2 type. J. Solid State Chem. 1987, 70, 229–234. [Google Scholar] [CrossRef]
- Burdett, J.K.; McLarnan, T.J. Geometrical and electronic links among the structures of MX2 solids: Structural enumeration and electronic stability of pyritelike systems. Inorg. Chem. 1982, 21, 1119–1128. [Google Scholar] [CrossRef]
- Xie, W.; Miller, G.J. β-Mn-Type Co8+xZn12−x as a Defect Cubic Laves Phase: Site Preferences, Magnetism, and Electronic Structure. Inorg. Chem. 2013, 52, 9399–9408. [Google Scholar] [CrossRef] [PubMed]
- Wells, A.F. Structural Inorganic Chemistry, 5th ed.; Clarendon Press: Oxford, UK, 1984. [Google Scholar]
- Pearson, R.G. Absolute Electronegativity and Hardness: Application to Inorganic Chemistry. Inorg. Chem. 1988, 27, 734–740. [Google Scholar] [CrossRef]
- Johnston, R.; Hoffmann, R. Structure-Bonding Relationships in the Laves Phases. Z. Anorg. Allg. Chem. 1992, 616, 105–120. [Google Scholar] [CrossRef]
- Ormeci, A.; Simon, A.; Grin, Y. Structural Topology and Chemical Bonding in Laves Phases. Angew. Chem. 2010, 49, 8997–9001. [Google Scholar] [CrossRef] [PubMed]
Figure 1.
Powder Patterns for Ca2Pt3Ga showing the existence of Ca2Pt2Ga in the system.
Figure 2.
Powder pattern of sample loaded as Ca2Pd3Ga. * = non-indexed peaks coming from slight Ca3Pd2Ga2 impurity.
Figure 2.
Powder pattern of sample loaded as Ca2Pd3Ga. * = non-indexed peaks coming from slight Ca3Pd2Ga2 impurity.
Figure 3.
“Cubic” arranged starting point with 4 congruent body diagonals (left) optimized rhombohedral unit cell (right) with 3 body diagonals of 13. 627 Å and 1 body diagonal of 12.482 Å. Red colored bonds shrink during optimization causing the reduction in body diagonal length from 011 to 100. Blue, black, and red atoms are Ca, Pt, and Ga respectively.
Figure 4.
DOS (left) and -COHP (right) for CaPt2 with +/− indicating bonding/antibonding values of COHP curves. Ca-Ca and Ca-Pt interactions are magnified for comparison.
Figure 4.
DOS (left) and -COHP (right) for CaPt2 with +/− indicating bonding/antibonding values of COHP curves. Ca-Ca and Ca-Pt interactions are magnified for comparison.
Figure 5.
DOS (left) and COHP (right) for Ca2Pt3Ga with +/− indicating bonding/antibonding values of COHP curves. Ca-Ca and Ca-Ga interactions magnified for comparison.
Figure 5.
DOS (left) and COHP (right) for Ca2Pt3Ga with +/− indicating bonding/antibonding values of COHP curves. Ca-Ca and Ca-Ga interactions magnified for comparison.
Figure 6.
DOS (left) and COHP (right) calculated for CaPd2 with +/− indicating bonding/antibonding values of COHP curves. Ca-Pd and Ca-Ca interactions magnified for comparison.
Figure 6.
DOS (left) and COHP (right) calculated for CaPd2 with +/− indicating bonding/antibonding values of COHP curves. Ca-Pd and Ca-Ca interactions magnified for comparison.
Figure 7.
DOS (left) and COHP (right) calculated for Ca2Pd3Ga with +/− indicating bonding/antibonding values of COHP curves. Ca-Ca and Ca-Ga interactions magnified for comparison.
Figure 7.
DOS (left) and COHP (right) calculated for Ca2Pd3Ga with +/− indicating bonding/antibonding values of COHP curves. Ca-Ca and Ca-Ga interactions magnified for comparison.


Table 1.
Crystallographic information for Ca2Pt3Ga and Ca2Pd3Ga.
| Sample | Ca2Pt3Ga | Ca2Pd3Ga |
|---|---|---|
| Space Group | R-3m | R-3m |
| Unit Cell Dim. | a = 5.576(1) Å c = 12.388(3) Å | a = 5.6326(8) Å c = 12.300(2) Å |
| Volume | 333.6(2) Å3 | 337.9(1) Å3 |
| Z | 3 | 3 |
| Theta range for data collection | 4.530 to 28.922° | 4.495 to 49.319° |
| Index ranges | −7 ≤ h ≤ 7, −7 ≤ k ≤ 7, −16 ≤ l ≤ 16 | −11 ≤ h ≤ 11, −11 ≤ k ≤ 11, −26 ≤ l ≤ 26 |
| Reflections Collected | 1321 | 4878 |
| Independent Reflections | 126 [R(int) = 0.0485 | 460 [R(int) = 0.0585] |
| Data/restraints/parameters | 126/0/11 | 460/0/11 |
| Goodness-of-fit | 1.078 | 1.091 |
| Final R indices [I > 2sigma(l)] | R1 = 0.0179, wR2 = 0.0403 | R1 = 0.0208, wR2 = 0.0403 |
| R indices (all data) | R1 = 0.0179, wR2 = 0.0403 | R1 = 0.0251, wR2 = 0.0414 |
| Extinction Coefficient | 0.0008(1) | 0.0036(3) |
| Largest diff. peak and hole | 3.366 and −2.052 e·Å−3 | 1.697 and −2.657 e·Å−3 |
Table 2.
Total energy of non-optimized and optimized coloring models showing optimized Ga-Ga distances.
Table 2.
Total energy of non-optimized and optimized coloring models showing optimized Ga-Ga distances.
| Ca2Pt3Ga | Ca2Pd3Ga | ||||||
|---|---|---|---|---|---|---|---|
| Model | Ga-Ga Distance (Å) | meV Non-Optimized | meV Optimized | # Ga-Ga Interactions | meV Optimized | meV Non-Optimized | Ga-Ga Distance (Å) |
| Alpha | 5.276 | 0 | 0 | 0 | 0 | 0 | 5.282 |
| Beta | 2.755 | +38.5 | +78.8 | 1 | +68.1 | +30.5 | 2.732 |
| Delta | 2.811 | +62.1 | +121.8 | 2 | +121.8 | +59.3 | 2.775 |
| Epsilon | 2.808 | +50.8 | +95.7 | 1 | +73.0 | +36.0 | 2.800 |
| Gamma | 4.738 | +140.7 | +56.0 | 0 | +26.0 | +92.0 | 4.791 |
| Iota | 2.931 | +70.5 | +113.4 | 2 | +104.7 | +61.2 | 2.922 |
| Mu | 4.709 | +37.6 | +71.0 | 0 | +66.5 | +13.3 | 4.653 |
| Theta | 2.950 | +203.0 | +289.4 | 6 | +256.6 | +155.5 | 2.909 |
| Zeta | 2.824 | +97.6 | +168.6 | 3 | +150.0 | +81.1 | 2.798 |
Table 3.
Relative total energies (eV) for conversion of binary cubic Laves phases CaM2 into ternary rhombohedral derivatives Ca2M3Ga (M = Pd, Pt). * = cubic unit cell metric with volume matching the corresponding binary compound; ** = cubic unit cell metric with volume matching the corresponding rhombohedral ternary compound. Specific total energies (eV/formula unit) for each component are listed in Supporting Information.
| 2 CaPd2 | + Ga | → | Ca2Pd3Ga | + Pd | ΔE = −0.599 eV | |
| (1) | 2 CaPd2 | + Ga | → | Ca2Pd3Ga * | + Pd | ΔE = −0.258 eV |
| (2) | Ca2Pd3Ga * | → | Ca2Pd3Ga ** | ΔE = −0.042 eV | ||
| (3) | Ca2Pd3Ga ** | → | Ca2Pd3Ga | ΔE = −0.299 eV | ||
| 2 CaPt2 | + Ga | → | Ca2Pt3Ga | + Pt | ΔE = −0.297 eV | |
| (1) | 2 CaPt2 | + Ga | → | Ca2Pt3Ga * | + Pt | ΔE = +0.115 eV |
| (2) | Ca2Pt3Ga * | → | Ca2Pt3Ga ** | ΔE = −0.088 eV | ||
| (3) | Ca2Pt3Ga ** | → | Ca2Pt3Ga | ΔE = −0.324 eV |
© 2018 by the authors. Licensee MDPI, Basel, Switzerland. This article is an open access article distributed under the terms and conditions of the Creative Commons Attribution (CC BY) license (http://creativecommons.org/licenses/by/4.0/).
Share and Cite
MDPI and ACS Style
Toombs, A.; Miller, G.J. Rhombohedral Distortion of the Cubic MgCu2-Type Structure in Ca2Pt3Ga and Ca2Pd3Ga. Crystals 2018, 8, 186. https://doi.org/10.3390/cryst8050186
AMA Style
Toombs A, Miller GJ. Rhombohedral Distortion of the Cubic MgCu2-Type Structure in Ca2Pt3Ga and Ca2Pd3Ga. Crystals. 2018; 8(5):186. https://doi.org/10.3390/cryst8050186
Chicago/Turabian StyleToombs, Asa, and Gordon J. Miller. 2018. "Rhombohedral Distortion of the Cubic MgCu2-Type Structure in Ca2Pt3Ga and Ca2Pd3Ga" Crystals 8, no. 5: 186. https://doi.org/10.3390/cryst8050186
Note that from the first issue of 2016, this journal uses article numbers instead of page numbers. See further details here.