Optical Absorption and Reflectivity of a Molecular Cluster of Lithium Niobate Adsorbed on a Graphene Layer


1
Escuela Superior de Ingeniería Mecánica y Eléctrica, Instituto Politécnico Nacional, Avenida Instituto Politécnico Nacional S/N, Gustavo A. Madero, San Pedro Zacatenco, 07738 CDMX México, Mexico
2
Tecnológico de Estudios Superiores Iztapaluca, Km. 7 carretera Ixtapaluca-Coatepec, San Juan Coatepec, Iztapaluca, 56580 Estado de México, Mexico
3
Instituto de Física, Universidad Nacional Autónoma de México, Apartado Postal 20-364, 01000 CDMX México, Mexico
*
Author to whom correspondence should be addressed.
Crystals 2018, 8(5), 208; https://doi.org/10.3390/cryst8050208
Submission received: 15 April 2018
/
Revised: 7 May 2018
/
Accepted: 8 May 2018
/
Published: 10 May 2018
(This article belongs to the Special Issue Lithium Niobate: Bulk Crystals, Composites, Thin Films and Nanocrystals)
Abstract
:We used density functional theory to study the adsorption of a molecular cluster of lithium niobate (LiNbO3) on a graphene layer. The cluster size is about 1.2 nm, and it has 11 molecules. We optimized the cluster, and then we calculated its interaction with the optimized graphene layer. We found that the cluster is adsorbed on the graphene layer with an adsorption energy of −2.2213 eV (−0.068 eV/atom). Afterwards, we calculated the reflectivity, and the optical absorption coefficients of the system cluster-graphene and of a graphene layer alone, to make a comparison. We found large differences in the values of these properties of the new system, with respect to the corresponding ones of graphene. We performed our calculations using the general gradient approximation (GGA), and the GGA modified for van der Waals interactions in order to take into account the long-range correlations.

1. Introduction
In crystalline form, LiNbO3 has many interesting properties. Among these, we can mention that it is an anisotropic, semiconductor, birefringent, photorefractive, colorless, photo elastic, ferroelectric, and piezoelectric material. Because of its properties, this compound is very appealing for many applications [1,2,3]. The photorefractive materials are used in many technological applications—such as holographic memories, phase conjugators, and dynamic holographic interferometry, among many more. Besides, in photorefractive crystals, an illumination configuration is converted into a refractive index pattern [1].
On the other hand, graphene is a two-dimensional form of carbon, which is a one atom thick, and arranged in a hexagonal distribution of atoms. It is formally a semiconductor, but it conducts electricity very well [4,5,6]. The optical properties of graphene are very different from those of LiNbO3, in particular, absorption and reflectivity as functions of frequency [7,8].
Here, we are interested in the decoration of a graphene layer with clusters of lithium niobate to combine, in two dimensions, the properties of these materials. Thus, we would have a new material in a two-dimensional geometry which includes a cluster of a photorefractive compound. As far as we know, this is the first attempt to predict the optical properties of this kind of a two-dimensional material.
Therefore, we have approached the problem of adsorbing a molecular cluster of lithium niobate on a graphene surface. Clearly, the properties of a molecular cluster of LiNbO3 will tend to those of crystalline LiNbO3 as the cluster increases its dimensions. Thus, the cluster size we choose should not be very small, and in this way, its properties can resemble some of those of the lithium niobate crystal. Furthermore, a nanometer-size cluster is experimentally much easier to obtain than smaller sizes. Besides, notice that as we increase the number of atoms within the cluster, the computing time for the numerical simulation is larger. Taking into account these considerations, we included 11 molecules of LiNbO3 in the cluster, with a size of about 1.2 nm.
We have calculated the resulting optical properties like absorption and reflectivity of the new system. We found that the cluster is, indeed, adsorbed on the pristine graphene surface and that for the new system, the absorption is quite large in the infrared and visible regions with respect to the corresponding value for graphene. In the ultraviolet region, there are important changes too, especially in the position of the peaks. Something very similar happens for the reflectivity.
2. Method
We started by optimizing the cluster of lithium niobate. We had 11 molecules in the cluster which had a size of around 1.2 nm. Then, we explored the possibility of adsorbing this cluster on a graphene layer. In this way, we started numerical simulations of the interaction of the cluster and the graphene surface. We utilized the DFT, with the GGA. We considered Vdw-DF2 to include long-range correlation effects as van der Waals interactions, with the Quantum Espresso code [9]. The norm conserving Troullier-Martins, and the Goedecker-Hartwigsen-Hutter-Teter pseudo potentials [10], were employed. We utilized the Perdew-Burke-Ernzerhof (PBE) approximation for GGA [11]
We considered as valence electronic states for carbon 2s2p2, for lithium: 2s1, for niobium: 4d45s2, and for oxygen: 2s22p4. We performed non-relativistic, and non-spin polarized calculations. We considered for the plane waves cut-off energy 1000 eV. We took 50 k points within the Monkhorst-Pack scheme [12]. We took 10−7 eV for the threshold energy convergence. In order to verify the pseudopotentials, we have selected, and calculated by energy minimization, the value of the C-C bond length 1.42 Å in the graphene layer (the experimental value is 1.42 Å). In this manner, we calculated the lattice parameters for the lithium niobate crystal with rhombohedral unit cell. We obtained the following, a = 5.4940 Å, c = 13.8625 Å, and α = 55.867° (the corresponding experimental values: a = 5.494 Å, c = 13.825 Å, and α = 55.867°, respectively [13]).
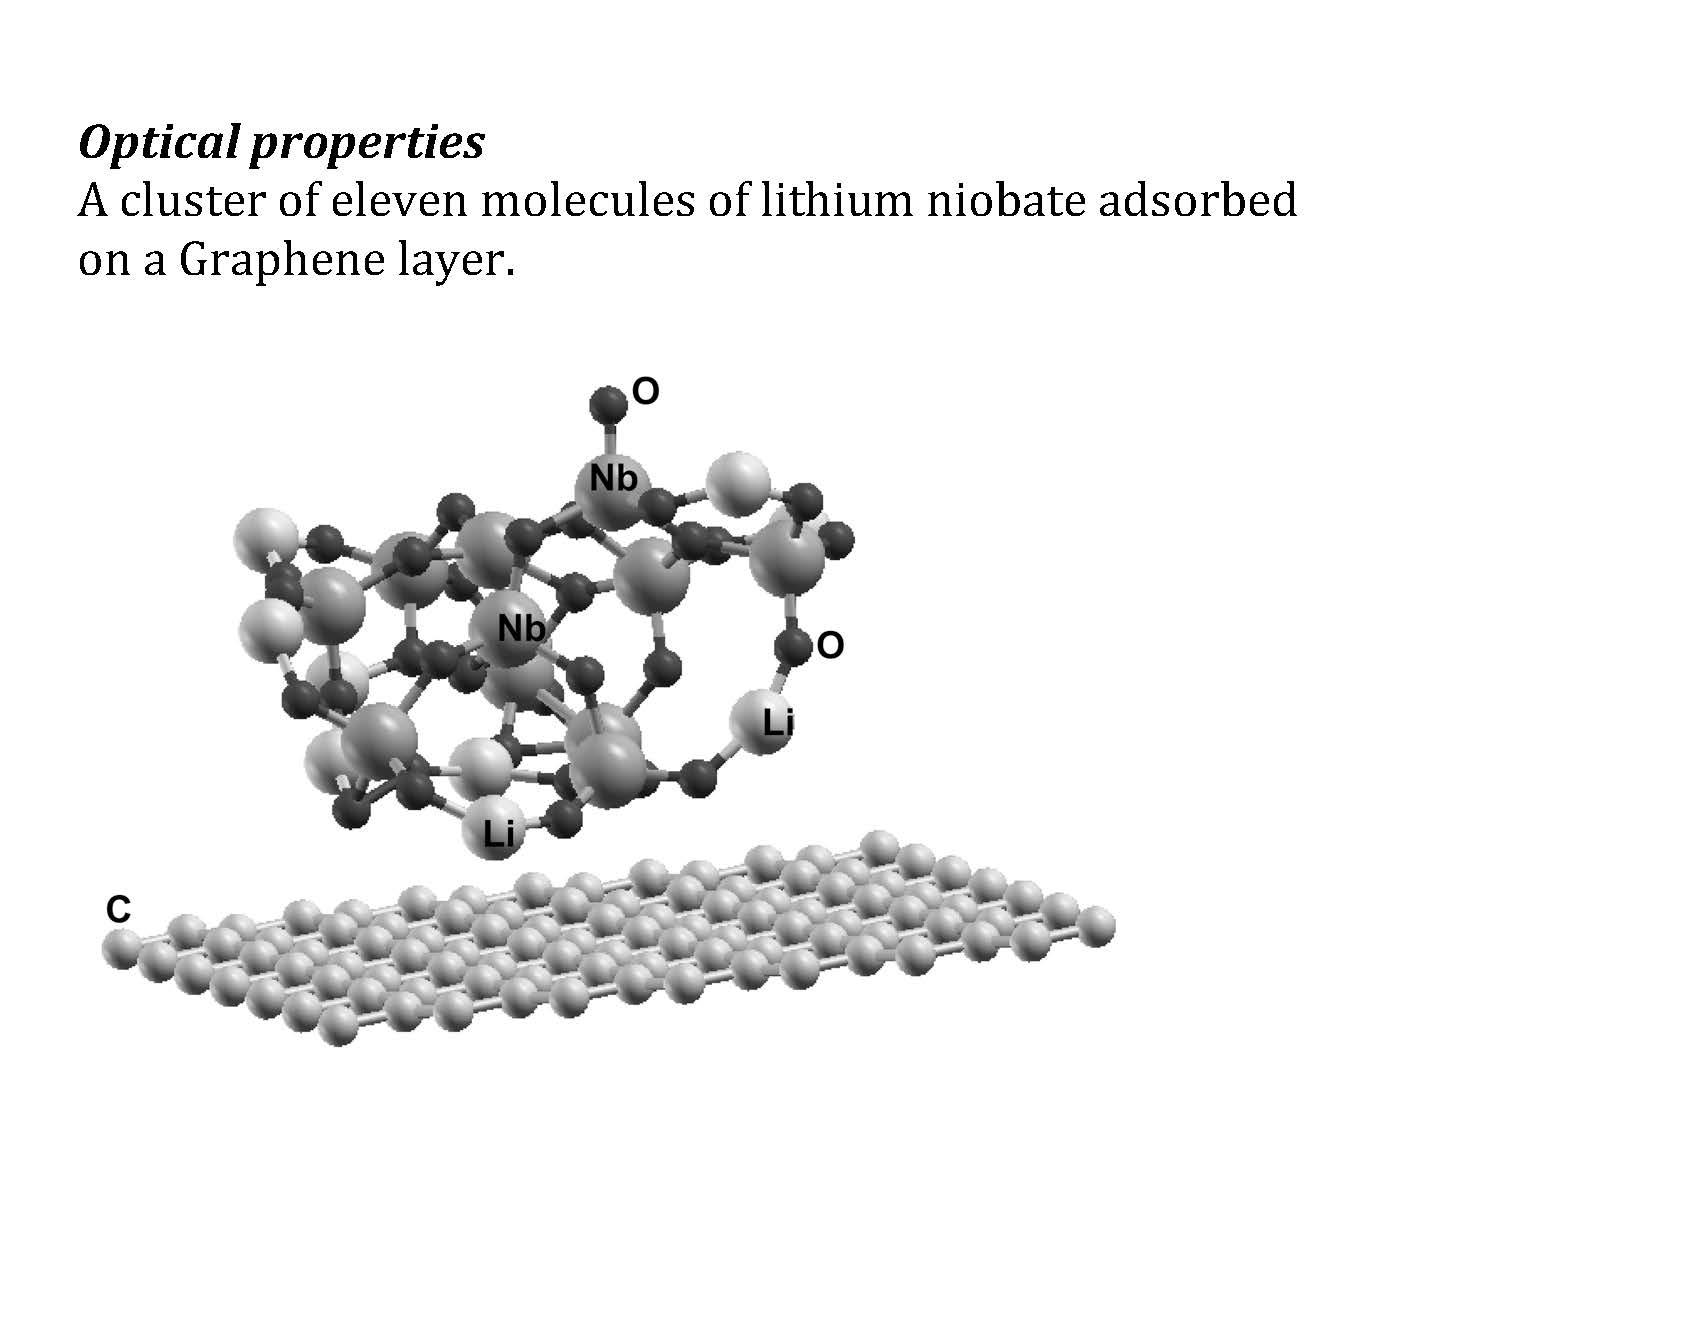
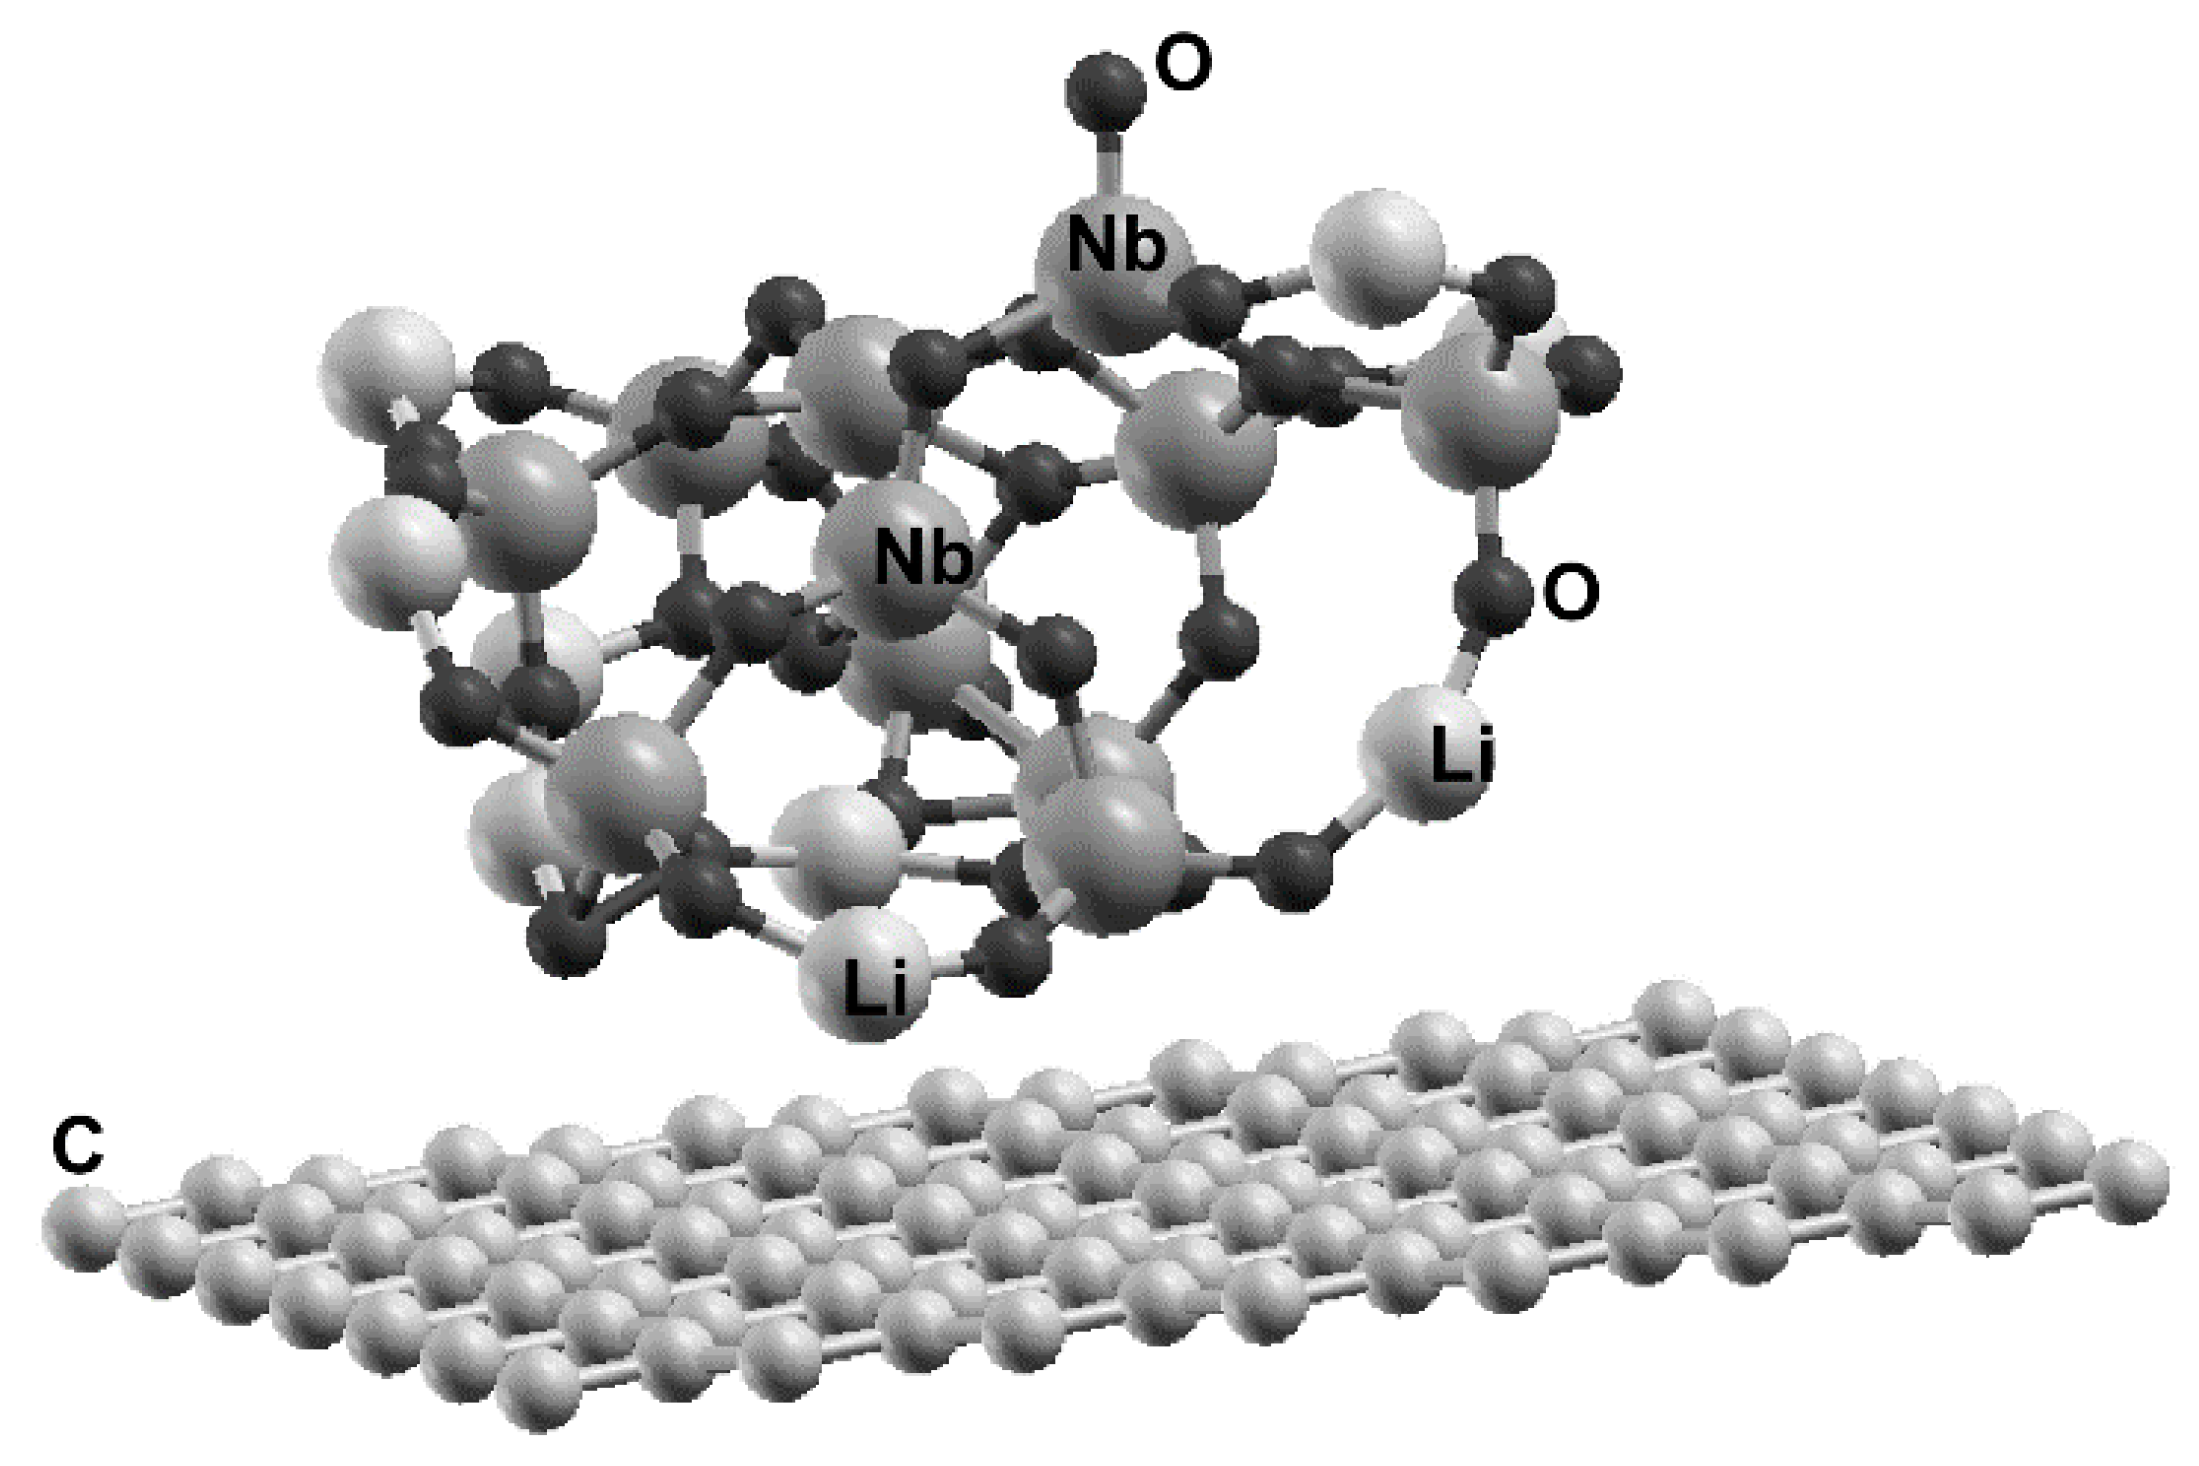
The graphene unit cell for the calculation has 98 carbon atoms (see Figure 1). The lithium niobate cluster has 11 molecules, i.e., 11 lithium atoms, 11 niobium atoms, and 33 oxygen atoms.
The system graphene-cluster of LiNbO3 was represented using a hexagonal cell with a = 17.344 Å and c = 26.04 Å with periodic conditions. Note that in the z direction, we took a large enough separation to ensure that there is no interaction between the adjacent cells.
To calculate the adsorption energy of the cluster on the graphene layer, we used the expression
∆E = E (graphene + cluster) − [E (graphene) + E (cluster)].
Here, the first term E (graphene + cluster) is the energy of the new system made by the cluster of lithium niobate, plus the graphene layer; the second, [E (graphene) + E (cluster)] is the energy of the graphene alone, plus the energy of the isolated cluster of lithium niobate.
We used the method of the modified Blöch tetrahedron for integration in the first Brillouin zone [14], to calculate the band energy structure. Afterwards, we calculated the dielectric tensor, the absorption and the reflectivity. These calculations were performed for graphene and for the new system made of the cluster of lithium niobate adsorbed on graphene.
3. Results and Discussion
From the numerical simulations of the interaction of the cluster and the pristine graphene surface, we obtained that the cluster of lithium niobate is adsorbed on the graphene layer, with an adsorption energy of −2.2213 eV (−0.068 eV/atom), as shown in Figure 1. It was not necessary to consider defects on the graphene layer to achieve the adsorption of the cluster. The adsorption energy is large enough to have stability on the resulting system. For an adsorption energy below 10 meV, we could have instability in the new system. Anyhow, we used molecular dynamics at 300 K and atmospheric pressure to test the stability, and the system did not change its configuration under these conditions. The size of the graphene unit cell (98 carbon atoms) is large enough to avoid interactions of adjacent lithium clusters.
We should mention that the reproducibility of the results is granted by the high degree of accuracy in our numerical simulations. Furthermore, we have the validation of our pseudo potentials. This was achieved by energy minimization. We could correctly reproduce the experimental values of the lattice parameters of graphene and of LiNbO3.
On the other hand, it is convenient to mention that DFT theory and molecular dynamics have been used successfully to understand the optical properties of crystalline lithium niobate. This was the case in understanding the variation of these properties with the deviation from the stoichiometric composition [15].
To obtain the optical absorption and reflectivity, we calculated the energy band structure of the new system and of graphene. The calculation of the complex dielectric tensor allows to obtain optical spectra. This allows us to know how the electromagnetic radiation propagates through the material.
Then, we proceed to calculate the imaginary component of the dielectric tensor in the limit of the linear optics, and within the random phase approximation (RPA) [16]
where ω is the photon frequency, n is the electron density, m is the effective mass, the indices α and β are the Cartesian components, p is the vector defining the polarization of the incident electric field, c and v represent the conduction band and valence band states, respectively.
On the other hand, from the Equation (2) and using the Kramers-Kronig rule [16,17], we can obtain the real component of the dielectric tensor
where P denotes the principal value. We performed the calculation over a range of 0 to 30 eV (or from 0 to rom 0 to 242,000 cm−1). We considered the light propagation perpendicular to the graphene layer, and calculated the reflectivity from the Fresnel formula
where n and k are the real and imaginary parts of the complex refractive index (n and k are the refractive index and extinction coefficient respectively)
We calculated the absorption coefficient
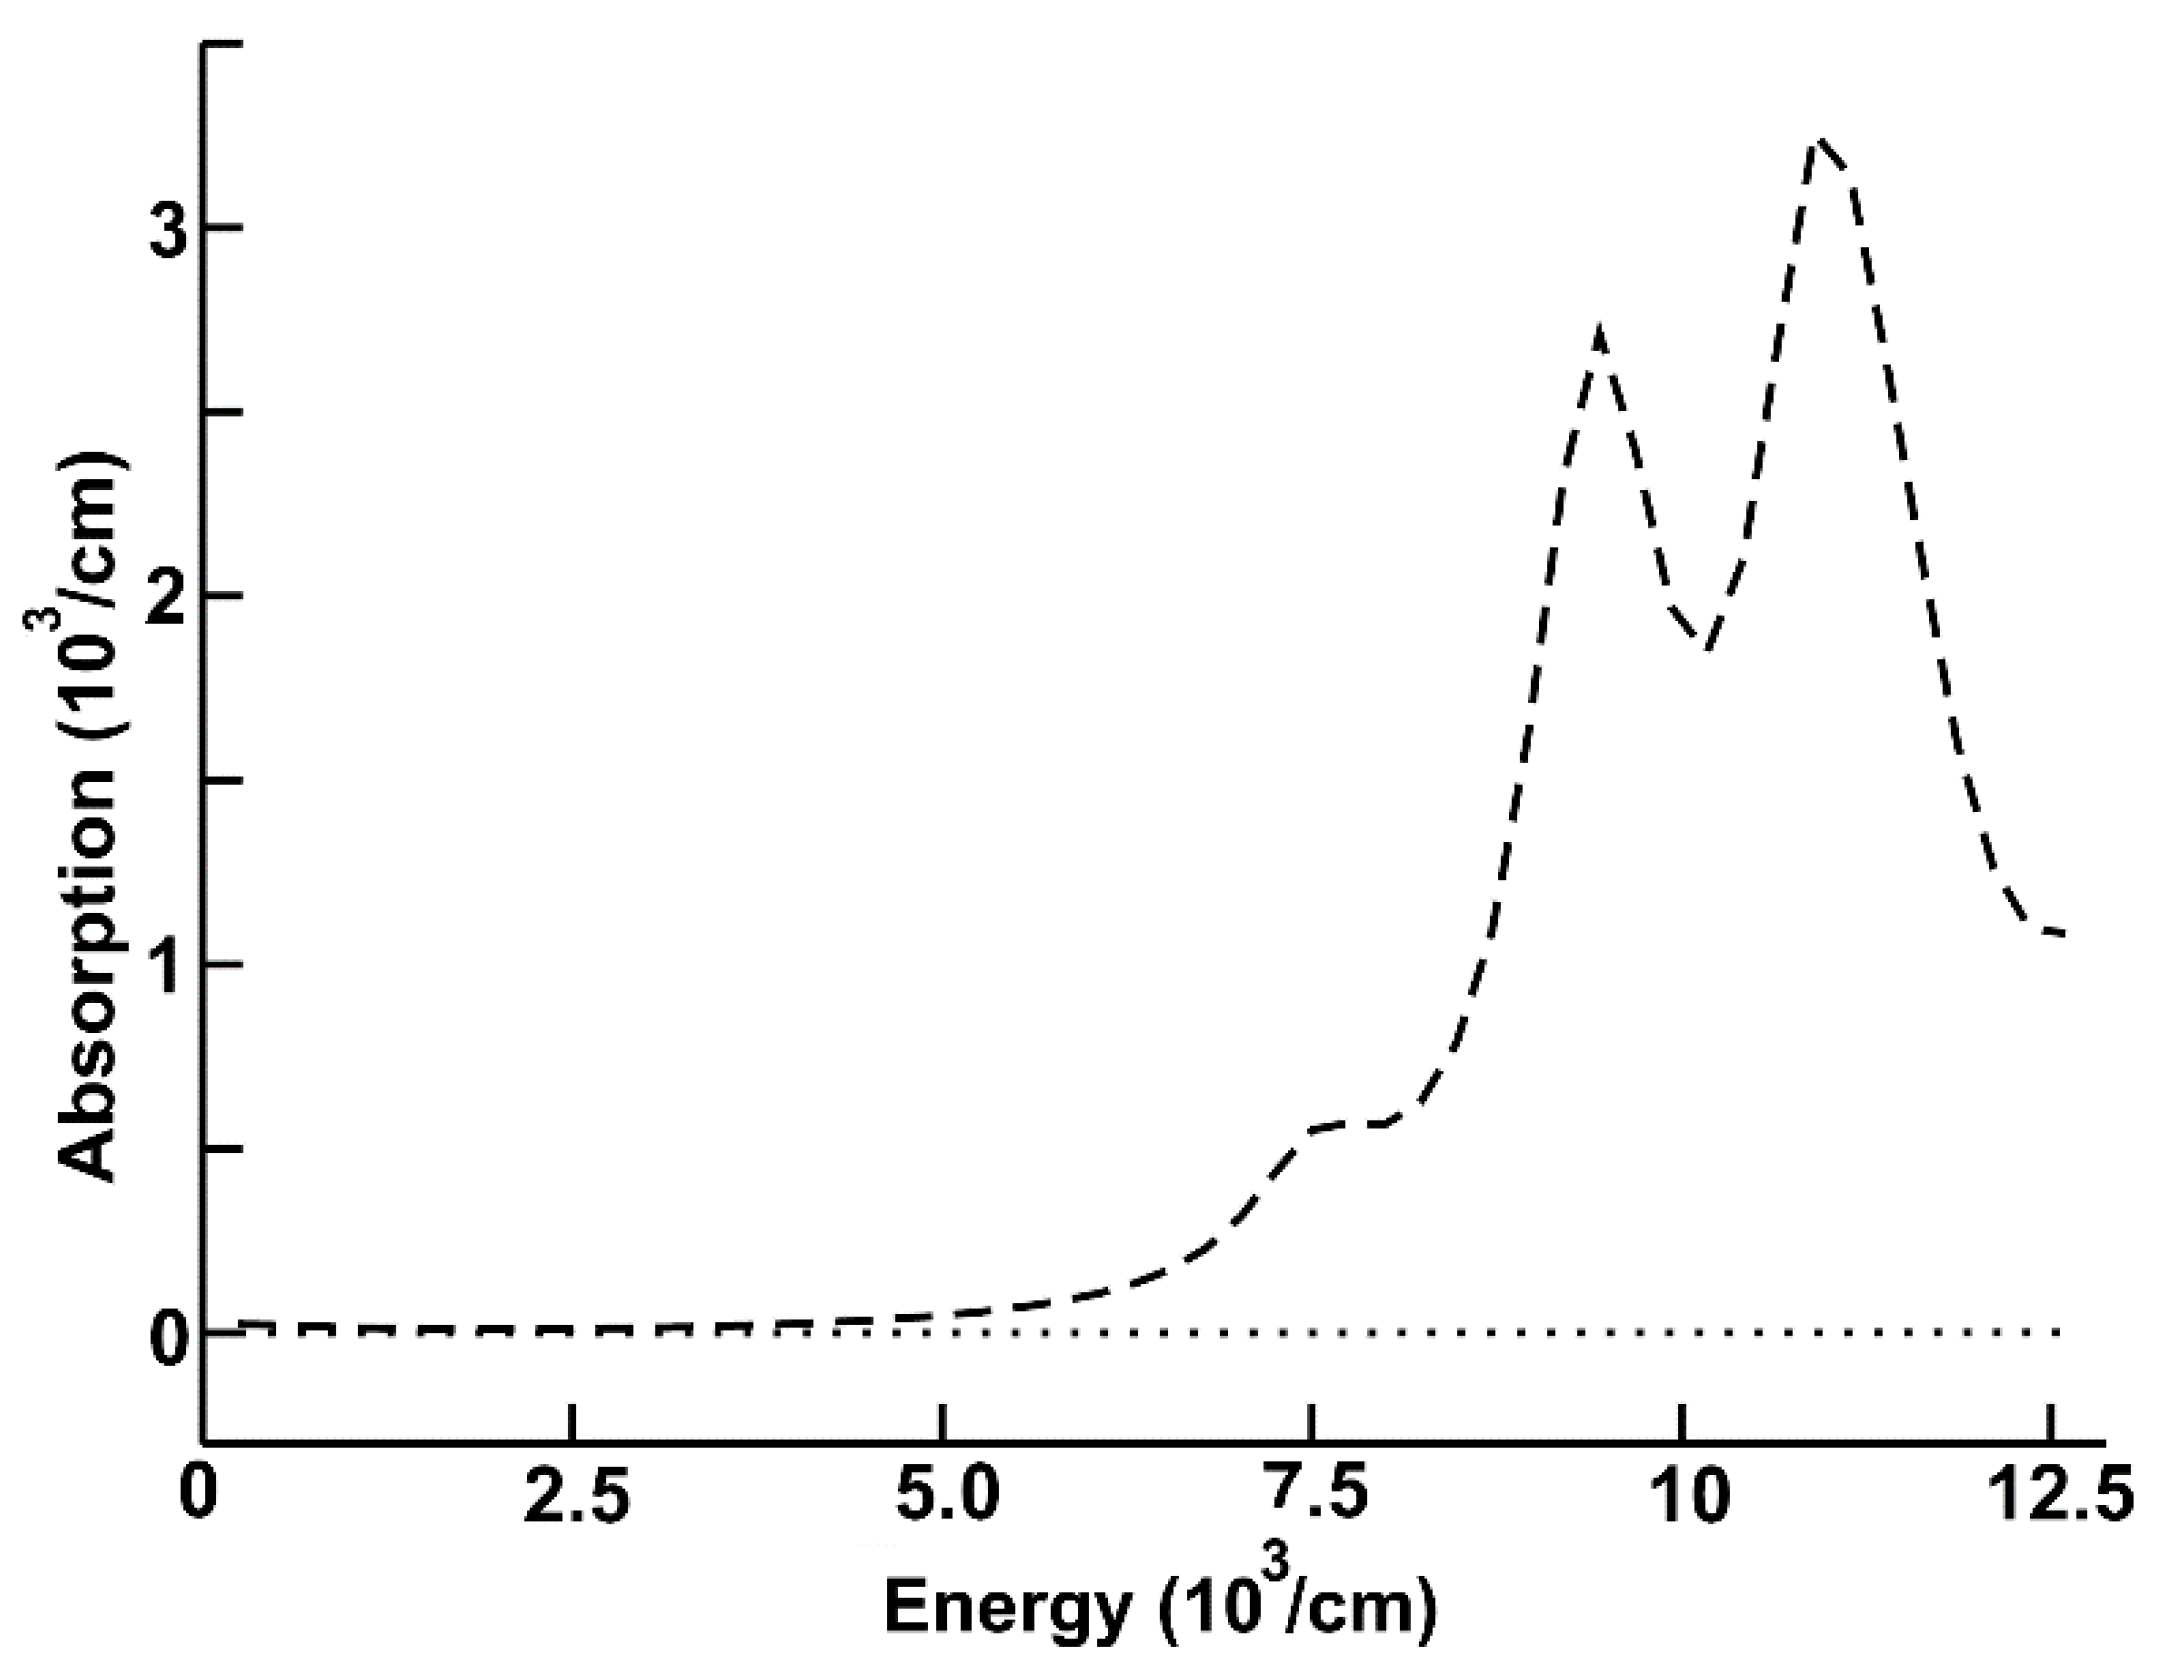
In Figure 2, we can see the calculated absorption for the system cluster of lithium niobate adsorbed on the graphene layer (dashed curve) for the infrared region. In this figure, we present the absorption of graphene too (dotted line). Notice that the new system shows a much larger absorption than the one corresponding to graphene. The absorption in this system has two large peaks, one around 9.4 × 103 cm−1, and the other around 11.25 × 103 cm−1. The absorption for graphene in this region is almost zero.
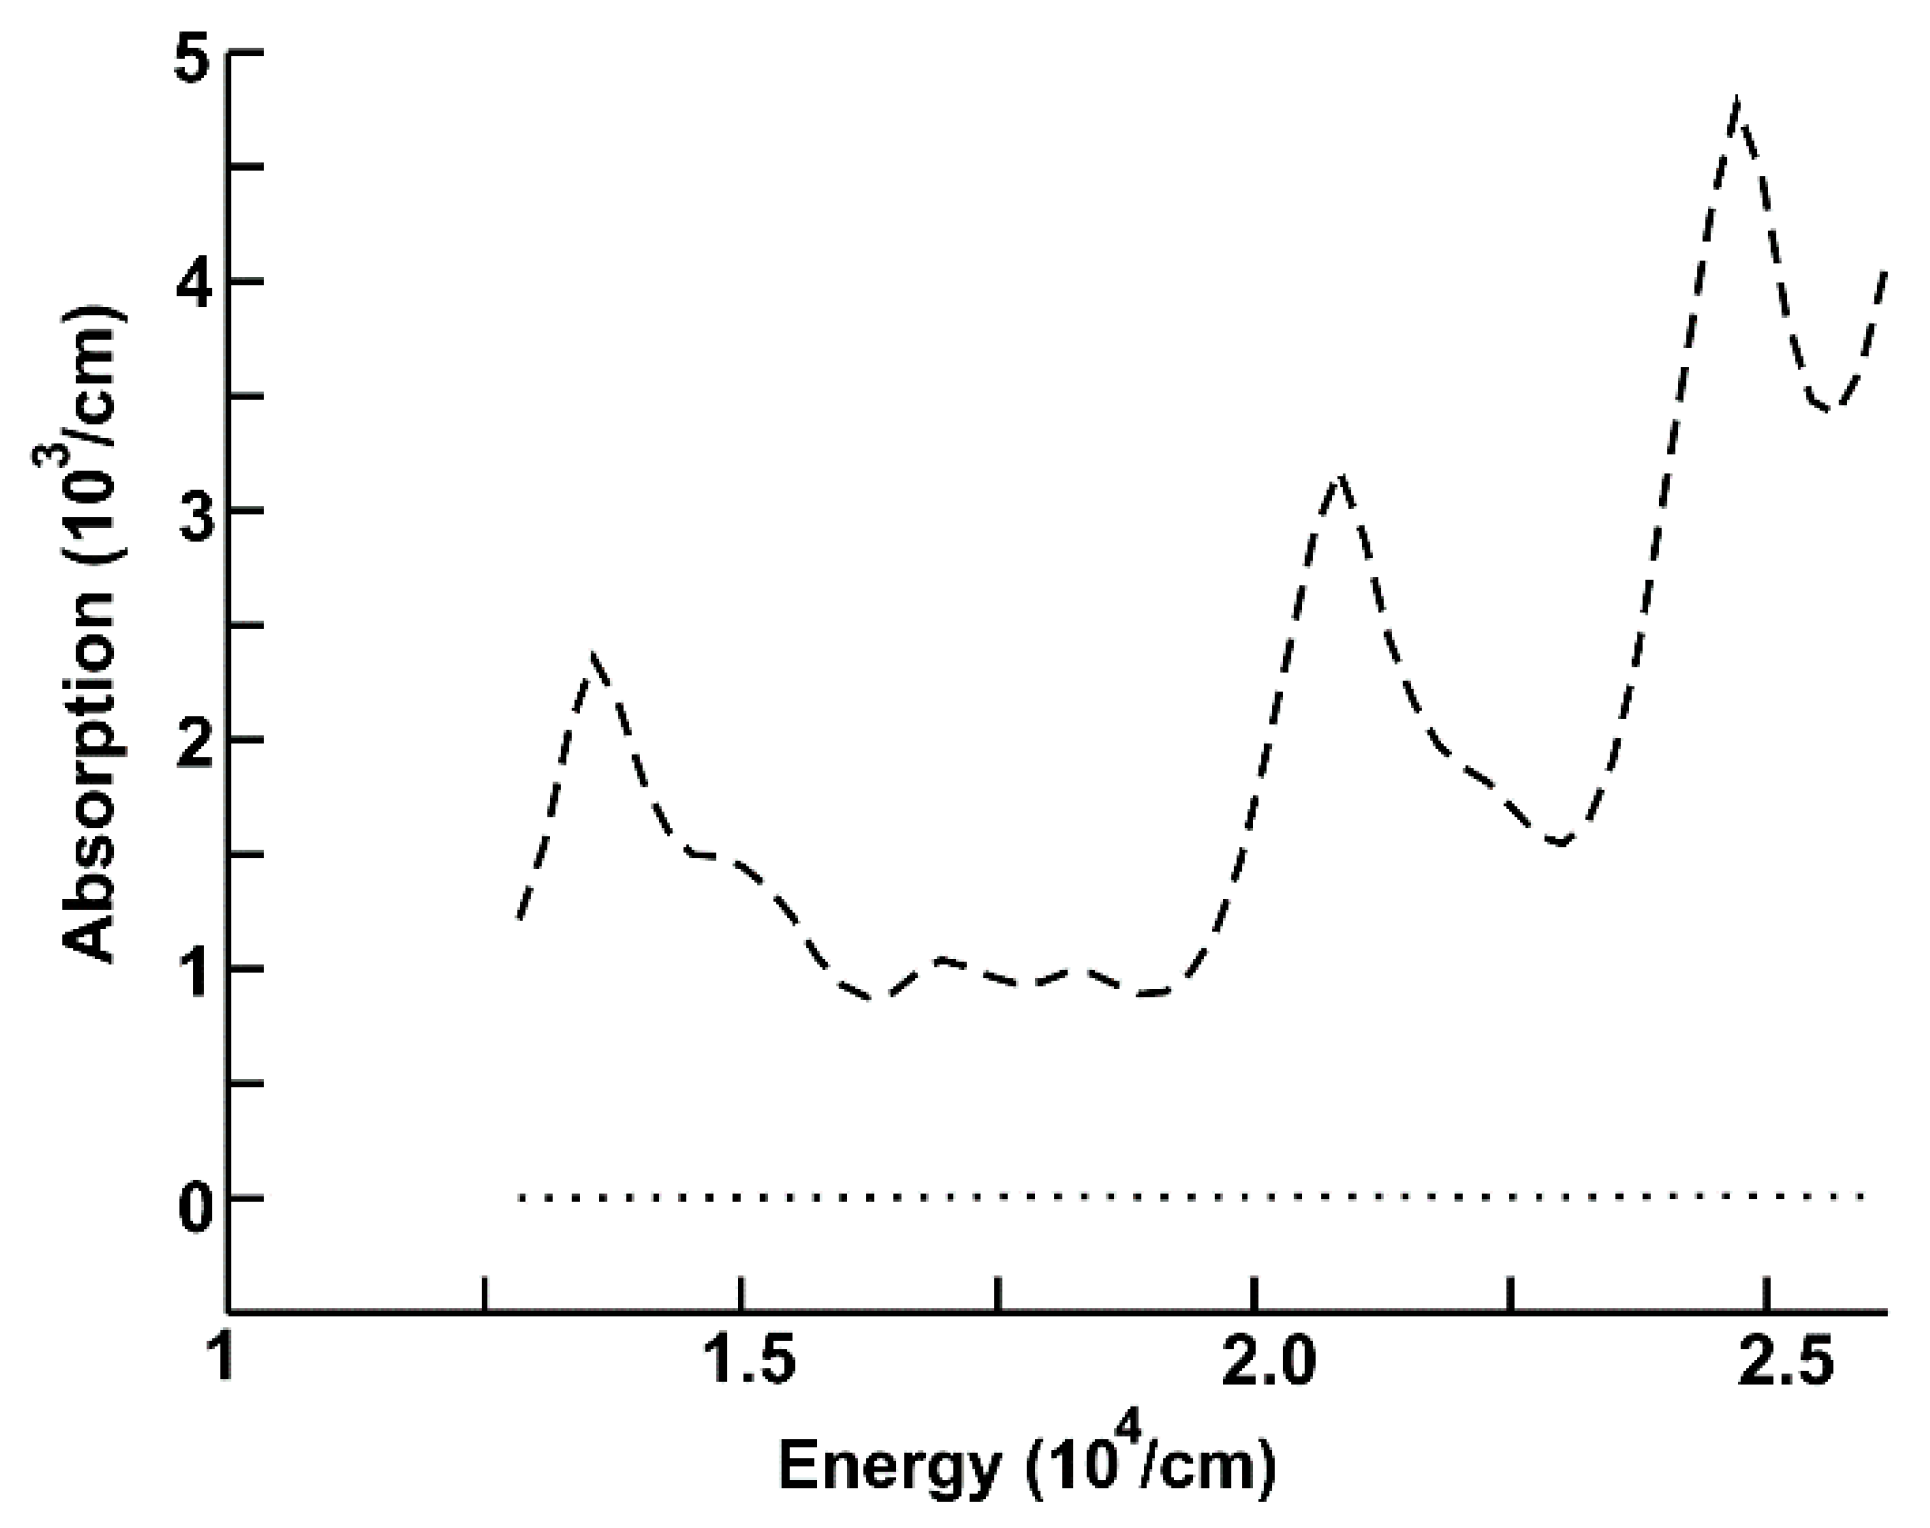
In Figure 3, we show the absorption for the new system (dashed curve) and for graphene (dotted line) in the region of visible light. The new system shows the largest absorption, which increases with increasing frequency. We notice three large peaks. The first one is around 1.2 × 104 cm−1, the second is located around 2.04 × 104 cm−1, and the third peak is at around 2.5 × 104 cm−1.
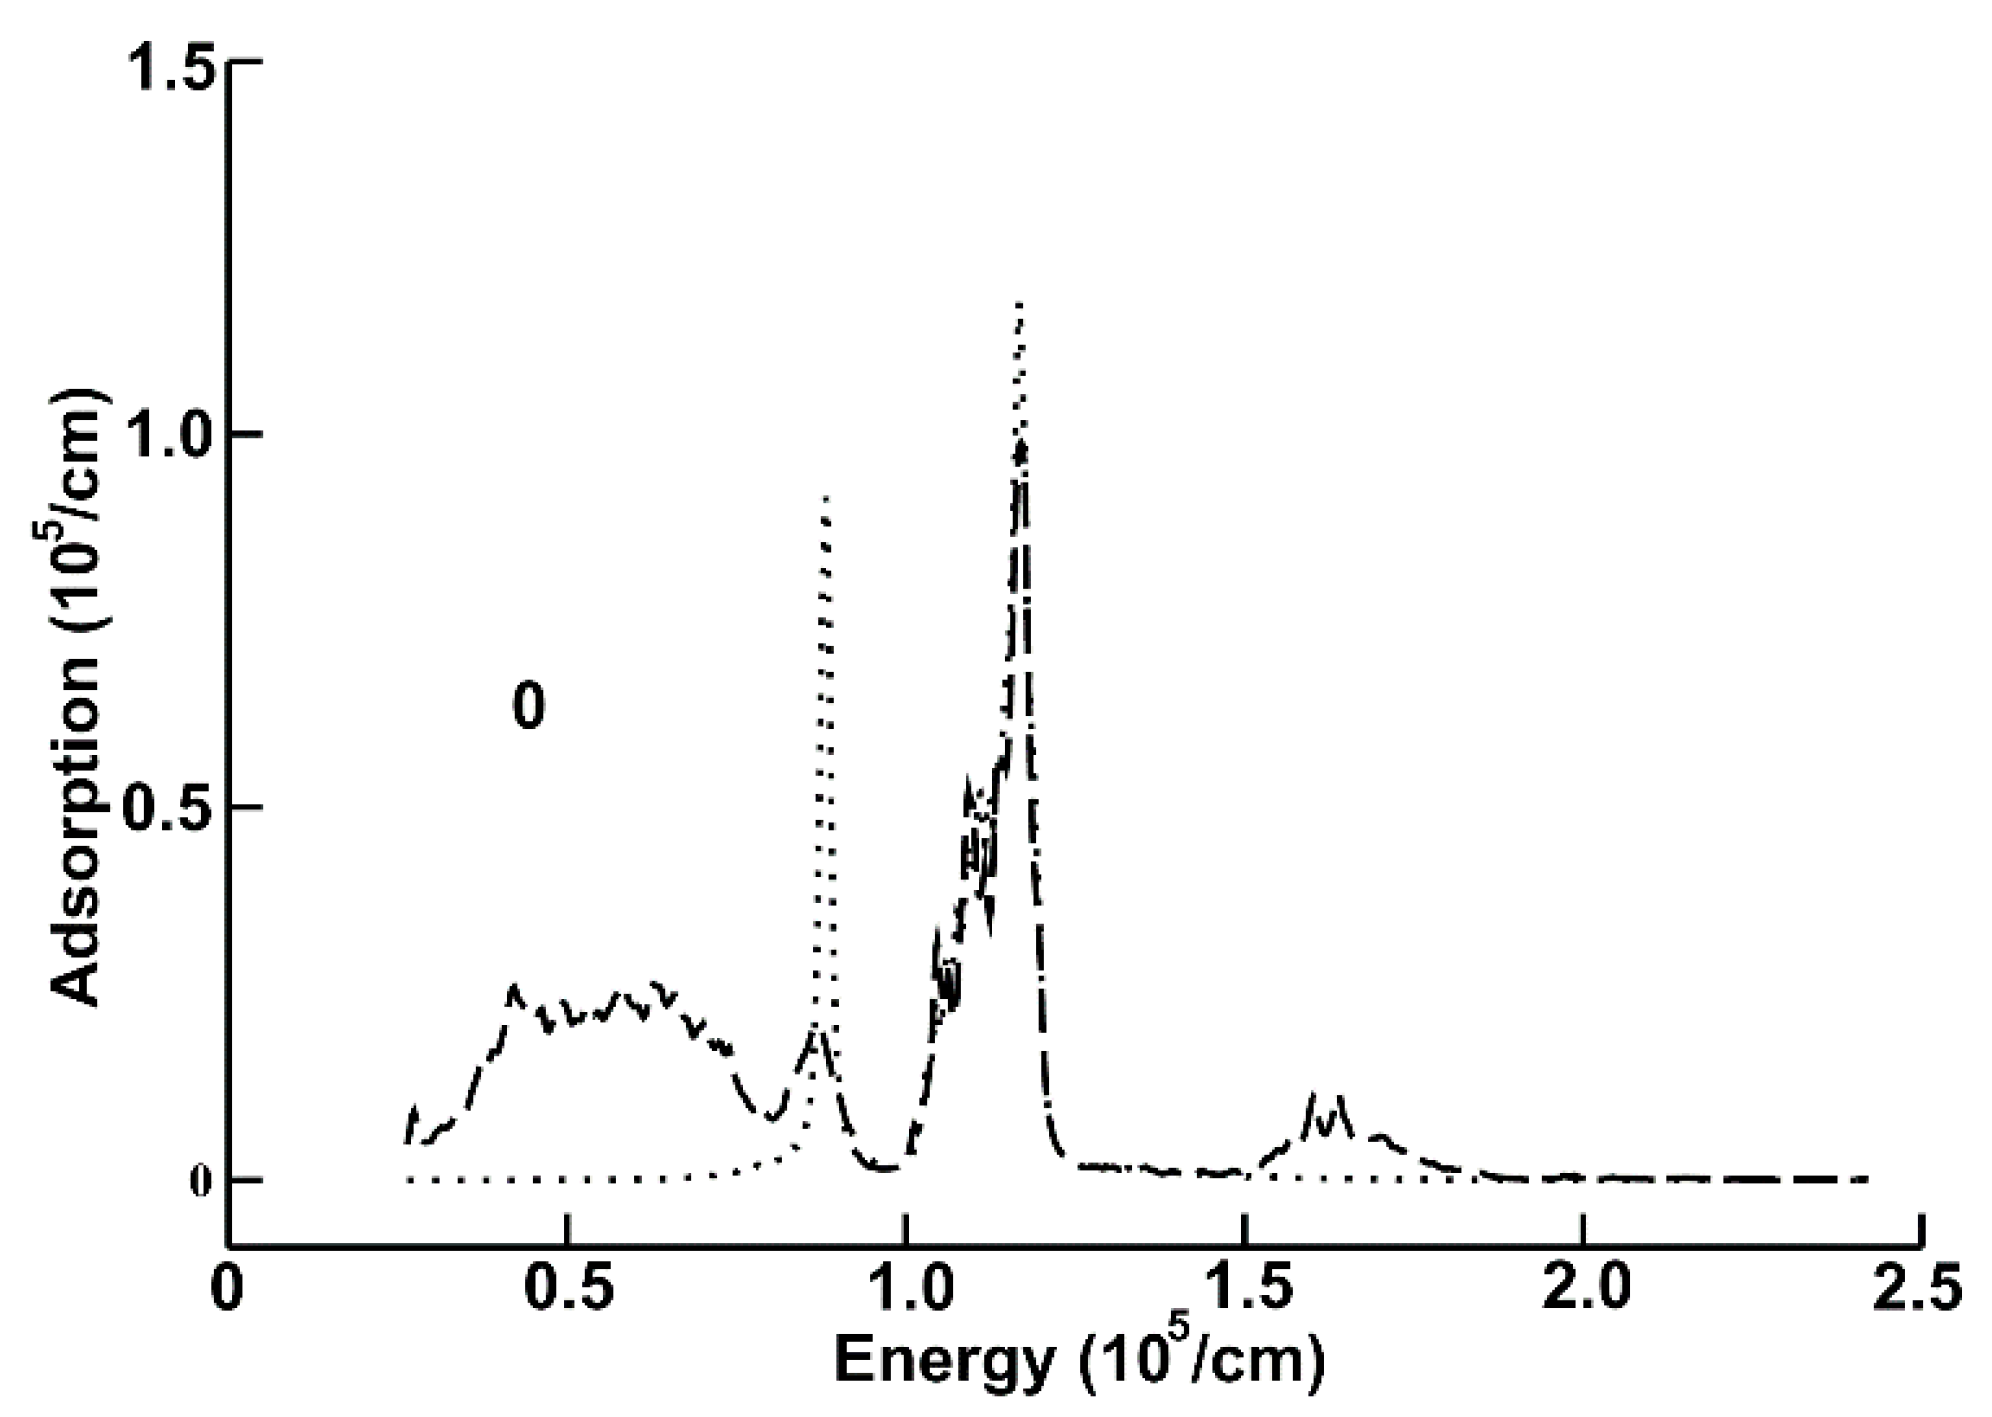
In Figure 4, we present again the absorption for the same systems (dashed curve for the new system), but for the ultraviolet region of the spectrum. We can notice that the graphene layer presents two peaks. The first one is located around 0.9 × 105 cm−1, and the second is at around 1.15 × 105 cm−1. The new system has the largest absorption between 0.25 × 105 cm−1 and 0.75 × 105 cm−1. The second peak of the new system is located at the same position than the second peak corresponding to the graphene layer. Besides, the absorption has a very similar value to the one corresponding with the graphene layer. Notice that there is a small third peak for the absorption of the new system located within a region where the corresponding absorption of the graphene layer is near zero. It is located around 1.6 × 105 cm−1.
Finally, in Figure 5, we show the reflectivity for the same systems for the infrared, visible, and ultraviolet regions of the spectrum. The new system (dashed curve) has the largest reflectivity from zero to around 0.8 × 105 cm−1. There is a second small peak for the absorption of the new system, located at almost the same position of the second peak of the graphene layer reflectivity (around 0.9 × 105 cm−1). The second peak of the reflectivity of the new system is located at the same position than the corresponding one to the graphene layer (around 1.2 × 105 cm−1). Its value is very similar to the one corresponding to the graphene layer.
We must mention that the energy band structure for the pristine graphene layer corresponds to an atypical semiconductor. The size of the energy gap for the graphene layer is zero. This characteristic, and its two-dimensional configuration, are the origin of the unusual electronic properties of this material [4]. Thus, graphene has an optical absorption near zero in the regions of the infrared and the visible radiation. It has two large peaks in the ultraviolet region, as we have presented in the Figure 2, Figure 3 and Figure 4.
4. Conclusions
We found that the cluster of lithium niobate can be adsorbed on a pristine graphene layer, with an adsorption energy of −2.2213 eV (−0.068 eV/atom). The cluster is made of 11 molecules containing a total of 11 lithium atoms, 11 niobium atoms, and 33 oxygen atoms.
The resulting system, with the lithium niobate cluster adsorbed on the graphene surface has different electronic properties. Thus, new possibilities for the adsorption of photons appear, and others disappear. In this way, the optical absorption of the new system eliminates a peak from the absorption of the graphene layer in the ultraviolet region. It is some kind of a filter in this region of the electromagnetic spectrum. Besides, the new system absorbs much more energy in the infrared and visible regions of the spectrum.
The reflectivity of the new system changes the corresponding one to the graphene layer. It eliminates one of the two peaks shown by the graphene layer in the ultraviolet region of the spectrum. Furthermore, the reflectivity in the infrared and visible regions are much increased for the new system.
Finally, we mention that we have combined the properties of pristine graphene and a molecular cluster of lithium niobate, which is a photorefractive compound. We have calculated the optical absorption and reflectivity of this possible, novel, two-dimensional material.
Author Contributions
All authors contributed equally.
Acknowledgments
We thank Dirección General de Asuntos del Personal Académico de la Universidad Nacional Autónoma de Mexico, partial financial support by grant IN-111817 and we also thank UNAM-Super-Computing Center the technical assistance.
Conflicts of Interest
The authors declare no conflict of interest.
References
- Kukhtarev, N. Sov, Influence of a heating electrical field on the interaction of light waves. Tech. Phys. Lett. 1975, 1, 155. [Google Scholar]
- Vinetsky, V.L.; Kukhtarev, N.V.; Semenyuk, A.K. Anisotropy of the Electrical Conductivity of Semiconductors Due to a Periodic Distribution of the Dopant. Sov. A Phys. Semicond. 1972, 6, 879–885. [Google Scholar]
- Volk, T.; Wohlecke, M. Lithium Niobate: Defects, Photorefraction and Ferroelectric Switching; Springer Series in Materials Science 115; Springer: Berlin, Germany, 2008. [Google Scholar]
- Novoselov, K.S.; Geim, A.K.; Morozov, S.V.; Jiang, D.; Zhang, Y.; Dubonos, S.V.; Grigorieva, I.V.; Firsov, A.A. Electric field effect in atomically thin carbon films. Science 2004, 306, 666–669. [Google Scholar] [CrossRef] [PubMed]
- Novoselov, K.S.; Jiang, D.; Schedin, F.; Booth, T.J.; Khotkevich, V.V.; Morozov, S.V.; Geim, A.K. Two-dimensional atomic crystals. Proc. Natl. Acad. Sci. USA 2005, 102, 10451–10453. [Google Scholar] [CrossRef] [PubMed]
- Novoselov, K.S.; Geim, A.K.; Morozov, S.V.; Jiang, D.; Katsnelson, M.I.; Grigorieva, I.V.; Dubonos, S.V.; Firsov, A.A. Two-dimensional gas of massless Dirac fermions in grapheme. Nature 2005, 438, 197. [Google Scholar] [CrossRef] [PubMed] [Green Version]
- Mamedov, A.M.; Osman, M.A.; Hajieva, L.C. VUV reflectivity of LiNbO3 and LiTaO3 single crystals. Appl. Phys. A 1984, 34, 189–192. [Google Scholar] [CrossRef]
- Rani, P.; Dubey, G.S.; Jindal, V.K. DFT study of optical properties of pure and doped grapheme. Physica E 2014, 62, 28–35. [Google Scholar] [CrossRef]
- Giannozi, P.; Baroni, S.; Bonini, N.; Calandra, M.; Car, R.; Cavazzoni, C.; Ceresoli, D.; Chiarotti, G.L.; Cococcioni, M.; Dabo, I.; et al. QUANTUM ESPRESSO: A modular and open-source software project for quntum simulation of materials. J. Phys. Condens. Matter 2009, 21, 395502. [Google Scholar] [CrossRef] [PubMed]
- Troullier, N.; Martins, J.L. Efficient pseudopotentials for plane wave calculations. Phys. Rev. B 1991, 43, 1993. [Google Scholar] [CrossRef]
- Perdew, J.P.; Burke, K.; Ernzerhof, M. Generalized gradient approximation made simple. Phys. Rev. Lett. 1996, 77, 3865. [Google Scholar] [CrossRef] [PubMed]
- Monkhorst, H.J.; Pack, J.D. Special points for Brillouin-zone integrations. Phys. Rev. B 1976, 13, 5188. [Google Scholar] [CrossRef]
- Weis, R.S.; Gaylord, T.K. Lithium Niobate: Summary of Physical Properties and Crystal Structure. Appl. Phys. A 1985, 37, 191. [Google Scholar] [CrossRef]
- Blöchl, P.E.; Jepsen, O.; Andersen, O.K. Improved tetrahedron method for brillouin-zone integrations. Phys. Rev. B 1994, 49, 16223. [Google Scholar] [CrossRef]
- Kityk, I.V.; Makowska-Janusik, M.; Fontana, M.D.; Aillerie, M.; Abdi, F. Nonstoichiometric Defects and Optical Properties in LiNbO3. J. Phys. Chem. B 2001, 105, 12242–12248. [Google Scholar] [CrossRef]
- Bohm, D.; Pines, D.A. Collective description of electron interactions: III. Coulomb interactions in a degenerate electron gas. Phys. Rev. 1953, 92, 609. [Google Scholar] [CrossRef]
- Kittel, C. Introduction to Solid State Physics, 3rd ed.; John and Wiley: New York, NY, USA, 1966; p. 648. [Google Scholar]
Figure 1.
We show the unit cell with the final configuration of the lithium cluster adsorbed on the graphene layer. The cluster has 11 molecules. This means 11 lithium atoms, 11 niobium atoms, and 33 oxygen atoms. The unit cell of graphene has 98 carbon atoms.
Figure 1.
We show the unit cell with the final configuration of the lithium cluster adsorbed on the graphene layer. The cluster has 11 molecules. This means 11 lithium atoms, 11 niobium atoms, and 33 oxygen atoms. The unit cell of graphene has 98 carbon atoms.

Figure 2.
Optical absorption for the system cluster of lithium niobate adsorbed on the graphene layer (dashed curve) for the infrared region. Optical absorption of graphene (dotted line).
Figure 2.
Optical absorption for the system cluster of lithium niobate adsorbed on the graphene layer (dashed curve) for the infrared region. Optical absorption of graphene (dotted line).

Figure 3.
Absorption for the new system (dashed curve), and for graphene (dotted line) in the region of visible light.
Figure 3.
Absorption for the new system (dashed curve), and for graphene (dotted line) in the region of visible light.

Figure 4.
Absorption for the new system (dashed curve), and for the graphene layer (dotted line), for the ultraviolet region of the spectrum.
Figure 4.
Absorption for the new system (dashed curve), and for the graphene layer (dotted line), for the ultraviolet region of the spectrum.

Figure 5.
Reflectivity for the three regions of the spectrum. For the new system (dashed line), and for the graphene layer (dotted line).
Figure 5.
Reflectivity for the three regions of the spectrum. For the new system (dashed line), and for the graphene layer (dotted line).

© 2018 by the authors. Licensee MDPI, Basel, Switzerland. This article is an open access article distributed under the terms and conditions of the Creative Commons Attribution (CC BY) license (http://creativecommons.org/licenses/by/4.0/).
Share and Cite
MDPI and ACS Style
Salas, O.; Garces, E.; Magana, L.F. Optical Absorption and Reflectivity of a Molecular Cluster of Lithium Niobate Adsorbed on a Graphene Layer. Crystals 2018, 8, 208. https://doi.org/10.3390/cryst8050208
AMA Style
Salas O, Garces E, Magana LF. Optical Absorption and Reflectivity of a Molecular Cluster of Lithium Niobate Adsorbed on a Graphene Layer. Crystals. 2018; 8(5):208. https://doi.org/10.3390/cryst8050208
Chicago/Turabian StyleSalas, Osiris, Eric Garces, and Luis Fernando Magana. 2018. "Optical Absorption and Reflectivity of a Molecular Cluster of Lithium Niobate Adsorbed on a Graphene Layer" Crystals 8, no. 5: 208. https://doi.org/10.3390/cryst8050208
Note that from the first issue of 2016, this journal uses article numbers instead of page numbers. See further details here.