1. Introduction
Dislocation is one of the most harmful defects in silicon crystals, causing current leakage in photovoltaic cells and large scale integrated circuits [
1]. M’Hamdi et al. reported that the dislocation density increased during the cooling process, rather than during crystal growth [
2]. The effect of interstitial oxygen on dislocation multiplication was not discussed. Imai et al. [
3] reported that oxygen concentration affected the dislocation velocity as a function of shear stress in silicon crystals. The crack was introduced into silicon crystals grown by the floating zone, Czochralski (CZ)-grown, and magnetic field-applied CZ methods. They also reported the measured dislocation velocity under applied stress at elevated temperature having different oxygen concentrations.
Sekander et al. [
4,
5,
6] reported the effect of unlocking stress that originated from the interstitial oxygen on the strength of silicon crystals. Furthermore, Cochard et al. [
7] discussed the effect of unlocking stress using the Alexander–Haasen–Sumino (HAS) model [
8,
9]. By using the HAS model, Gao et al. [
10,
11] carried out numerical calculations of the dislocation multiplication. Fukushima et al. [
12] also used the numerical model to discuss how the dislocation density decreased during annealing process when the interstitial oxygen concentration in a crystal increased. The reduction can be explained by considering the unlocking stress caused by interstitial oxygen atoms [
7] by taking into account a homogeneous distribution of oxygen diffusion in a crystal. It has been reported that dislocation velocity decreased as a function of oxygen concentration in silicon crystals by experiment [
3]. The grown crystal has an inhomogeneous distribution of oxygen in the crystal. Consequently, unlocking stress will be inhomogeneous, due to inhomogeneous distribution of oxygen. Furthermore, a number of dislocations, which act as a sink in the grown crystals, distribute inhomogeneously. There have been no reports which include inhomogeneous distributions of both oxygen and dislocations.
In this study, we focus on the relationship between oxygen concentration and dislocation multiplication in silicon crystals. We studied the effects of interstitial oxygen on the dislocation multiplication in silicon crystals having inhomogeneous distribution of oxygen concentrations during both crystal growth and cooling processes using numerical analysis. We also took into account oxygen diffusion. The model included the effect of the dislocation density which was equivalent to the distance between dislocations when the diffusion of interstitial oxygen atoms was considered.
2. Calculation Model
We applied the viscoelastic model [
8] for stress analysis using a two-dimensional axisymmetric model [
13,
14]. A three-dimensional analysis was carried out to calculate the dislocation density in silicon crystals using the numerical method reported elsewhere [
13,
14]. We took into account the activated mechanics of slip systems in different growth directions, immobilization of mobile dislocations, and the jog formation between different slip systems. The silicon crystals have 12 slip directions. The resolved shear stress in each slip direction can be calculated by the tensor transformation technique using stress components obtained from a three-dimensional analysis of the stress. Equation (1) represents the plastic deformation rate in a specific slip system
.
Nm and
b stand for the mobile dislocation density and the Burgers vector, respectively.
Equation (2) shows the mobile dislocation velocity in the slip direction
,
where
= 5000 ms
−1,
= 1 MPa,
m = 1, and
U = 2.2 eV. An increasing rate of mobile dislocation density can be written by Equation (3),
where
K,
,
, are the increase rate of mobile dislocation density, interaction distance between dislocations, and effective stress that is a function of interstitial oxygen concentration, respectively. Details of the calculation method were reported previously [
12].
The effective stress, which is necessary for dislocation multiplication, can be written by Equation (4) [
6,
7],
where
,
,
, and
are the resolved shear stress, short-range stress, long-range stress, and unlocking stress, respectively.
,
, and
are expressed by Equations (5)–(7), respectively.
where
and
are constants determined by the distance between different slip systems.
μ is Young’s modulus. Equation (7) contains the following function [
6,
7],
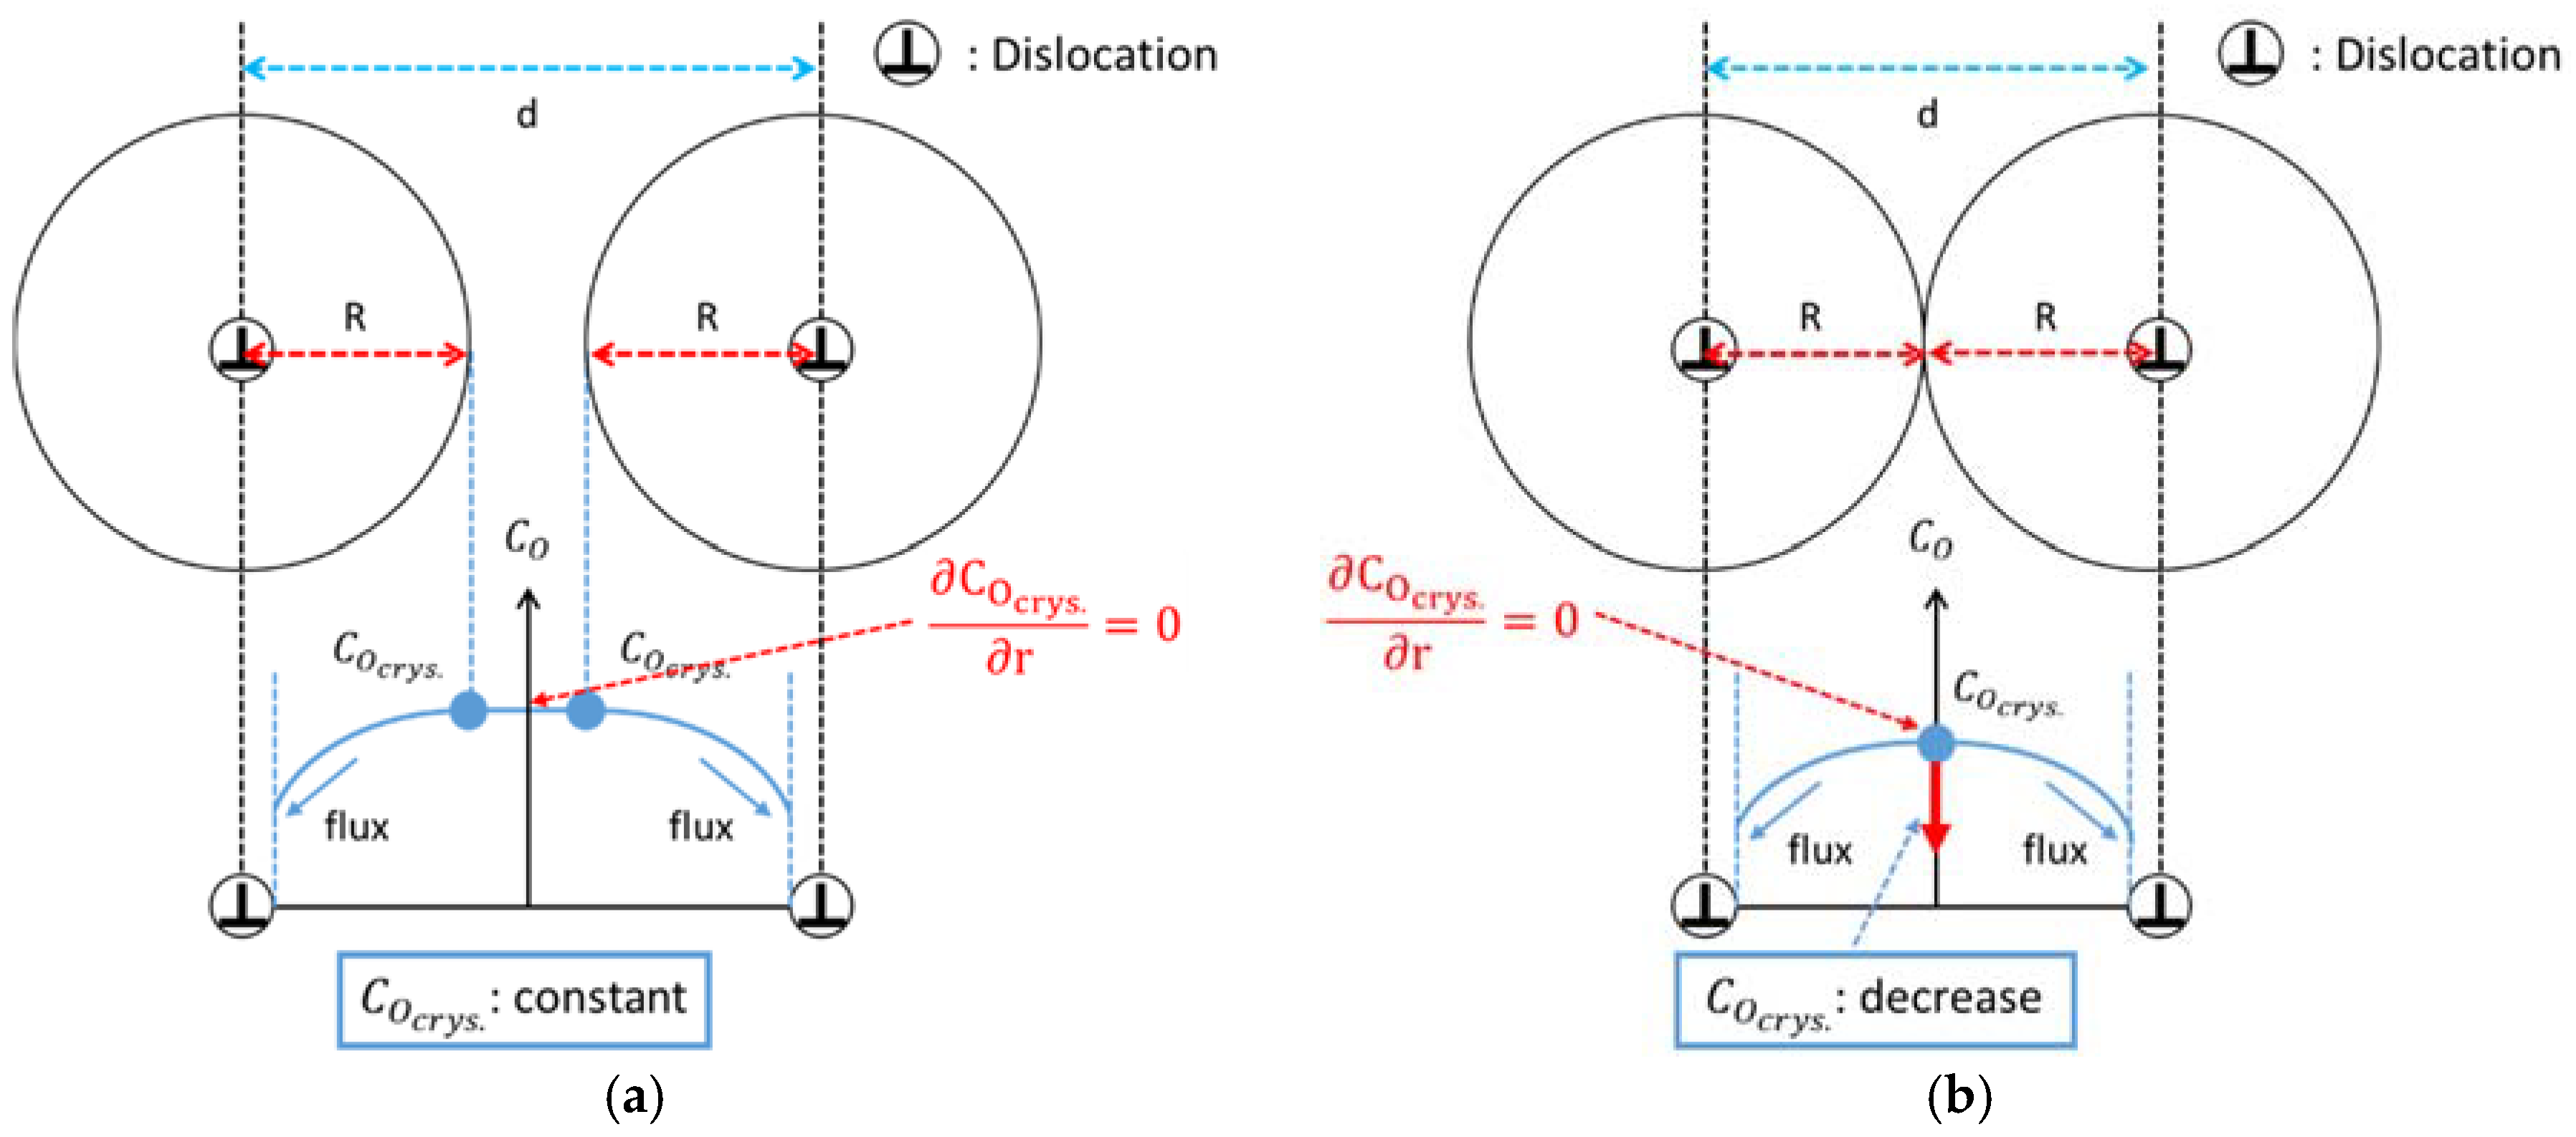
We also considered the effect of interstitial oxygen diffusion to dislocation cores on the dislocation motion using the diffusion model.
Figure 1a,b show the distributions of interstitial oxygen atoms between two dislocations having high (a) and low (b) concentrations, respectively.
R is the radius of the diffusion area of the interstitial oxygen and
rcore is the radii of the dislocation core.
R was set to the values shown in Equations (9) and (10) by considering the distance between dislocations,
d,
where
d is defined as
where
Nt denotes total dislocation density.
The Equation (12) was used to calculate the diffusion of the interstitial oxygen,
where
is the diffusion constant of the oxygen and
E is the interaction energy between oxygen and dislocation, respectively.
rcore was set in Equation (13), where
b is the Burgers vector,
We used the reported diffusion constant in the calculation [
7],
The boundary condition of the interstitial oxygen concentration at the interface between dislocation cores and bulk silicon was calculated using Equation (15), which is the reported equilibrium concentration of the interstitial oxygen in silicon crystals [
15,
16],
We calculated the interstitial oxygen concentration inside the dislocation cores by time integration of the incoming flux of the interstitial oxygen to the dislocation cores.
The crystal growth system based on directional solidification is the same as that reported elsewhere [
17,
18,
19].
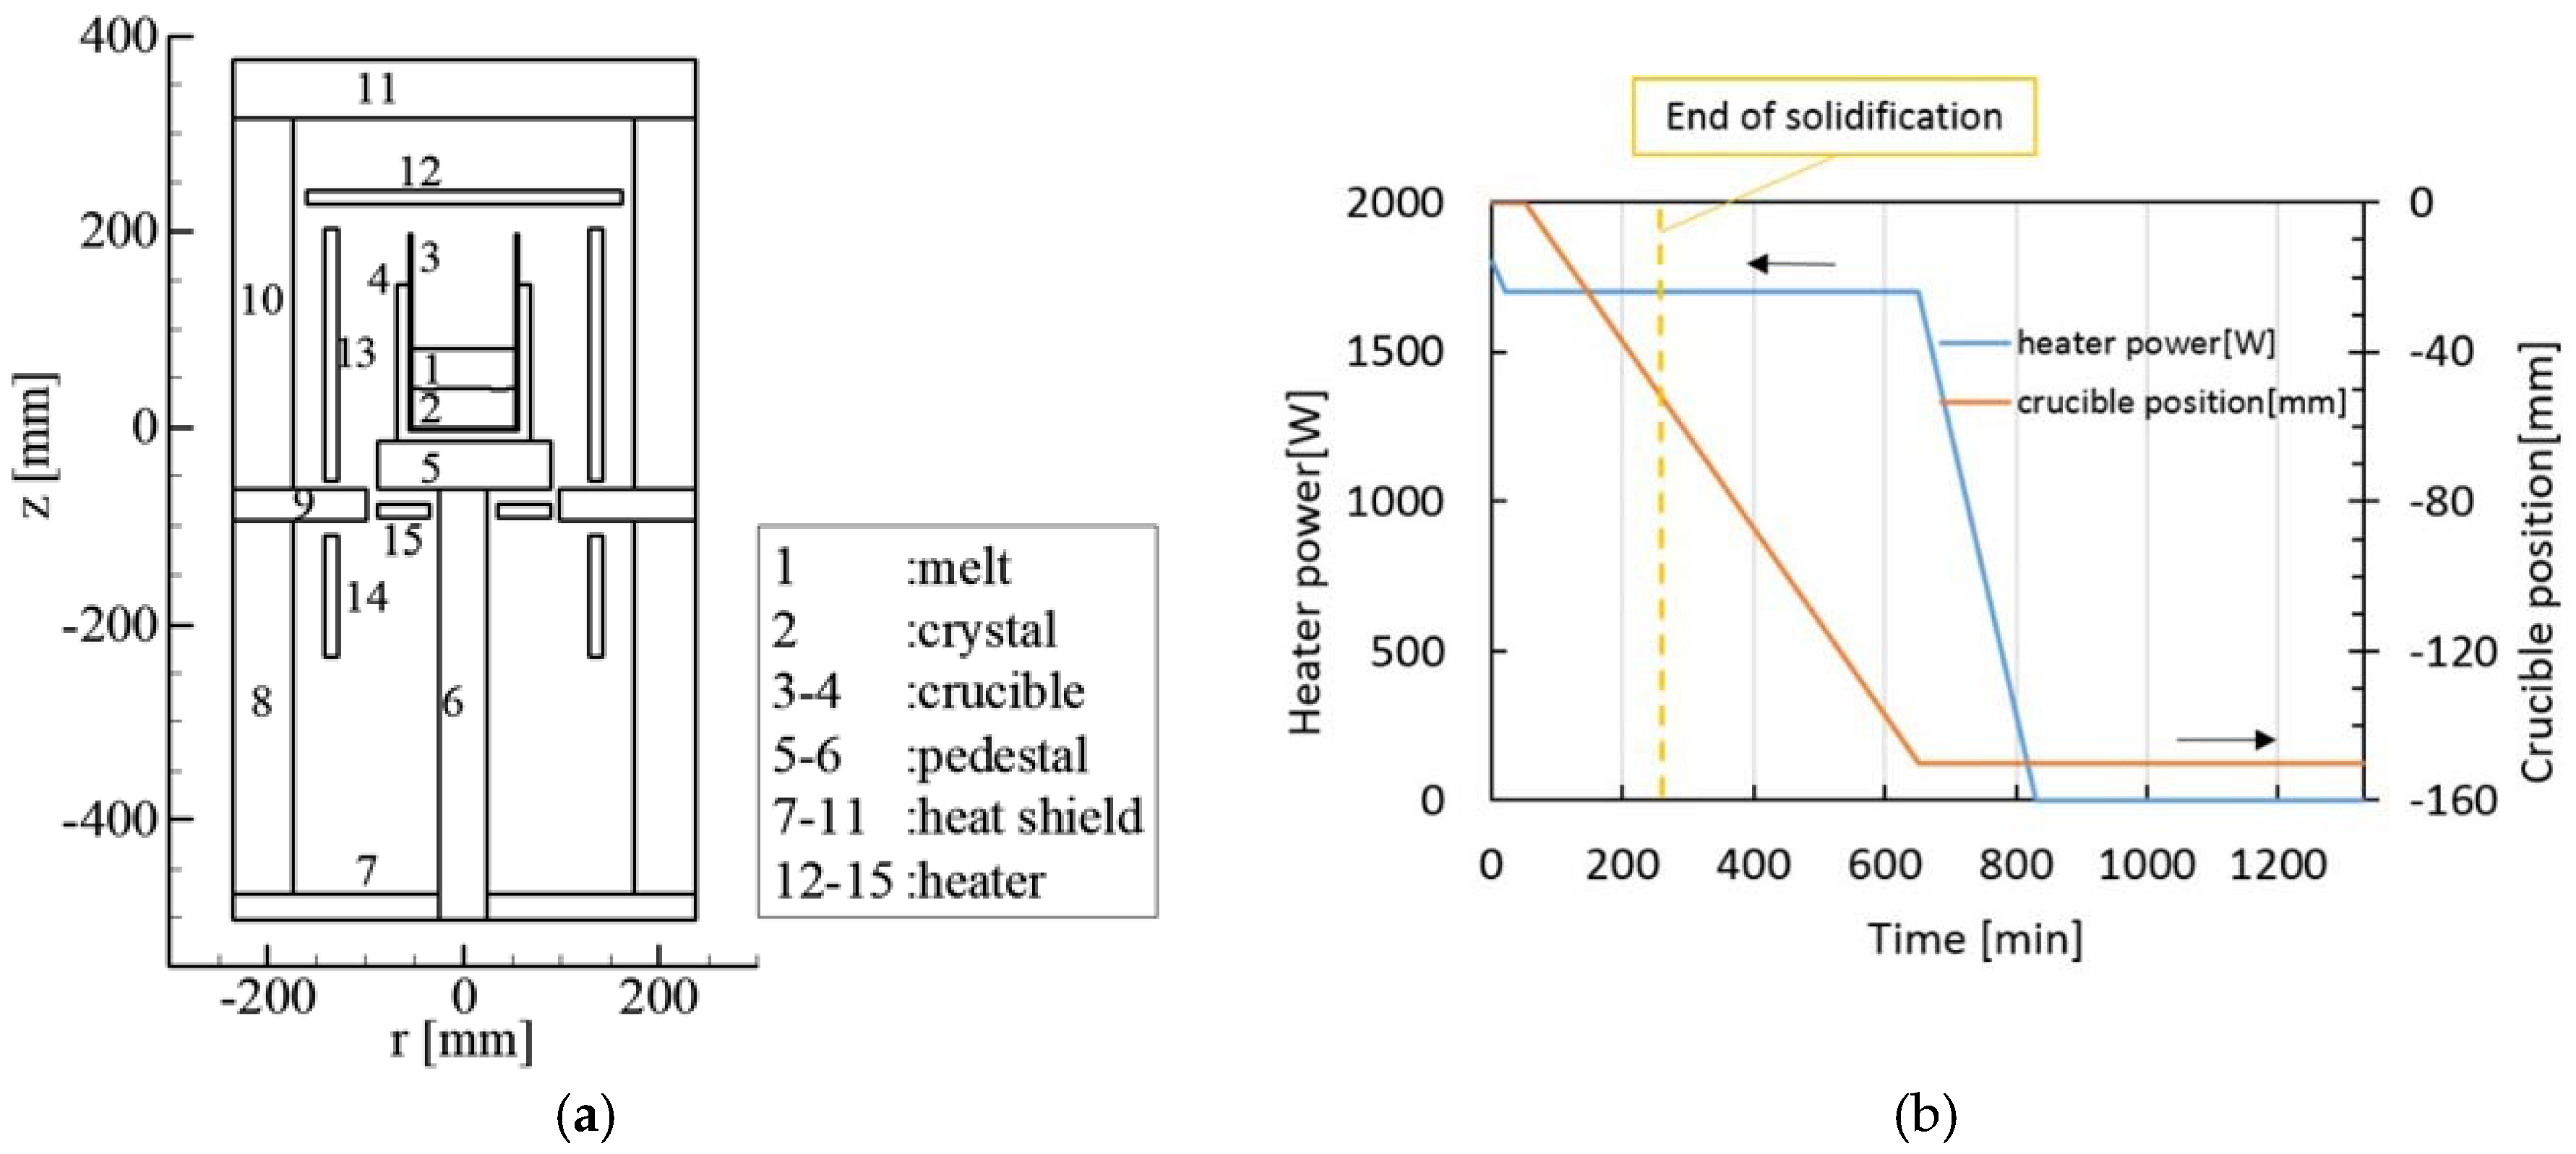
Figure 2a shows the furnace structure [
20]. The furnace contained the melt (1), the crystal (2), a quartz crucible (3, 4), pedestals (5, 6), heat shields (7–11), and four heaters (12–15). We carried out transient global modeling that includes conductive and radiative heat transfer in an entire furnace during the crystal growth and cooling processes of silicon crystals. Crucible was moved down to grow the Si crystal.
Figure 2b shows the history of crucible position and heater power during the solidification process and the cooling process. We used the top heater (12) and the side heater (13). The heater power ratio of the top heater and the side heater was 1:3. Details of our calculation are reported elsewhere [
17,
18,
19,
21].
3. Results
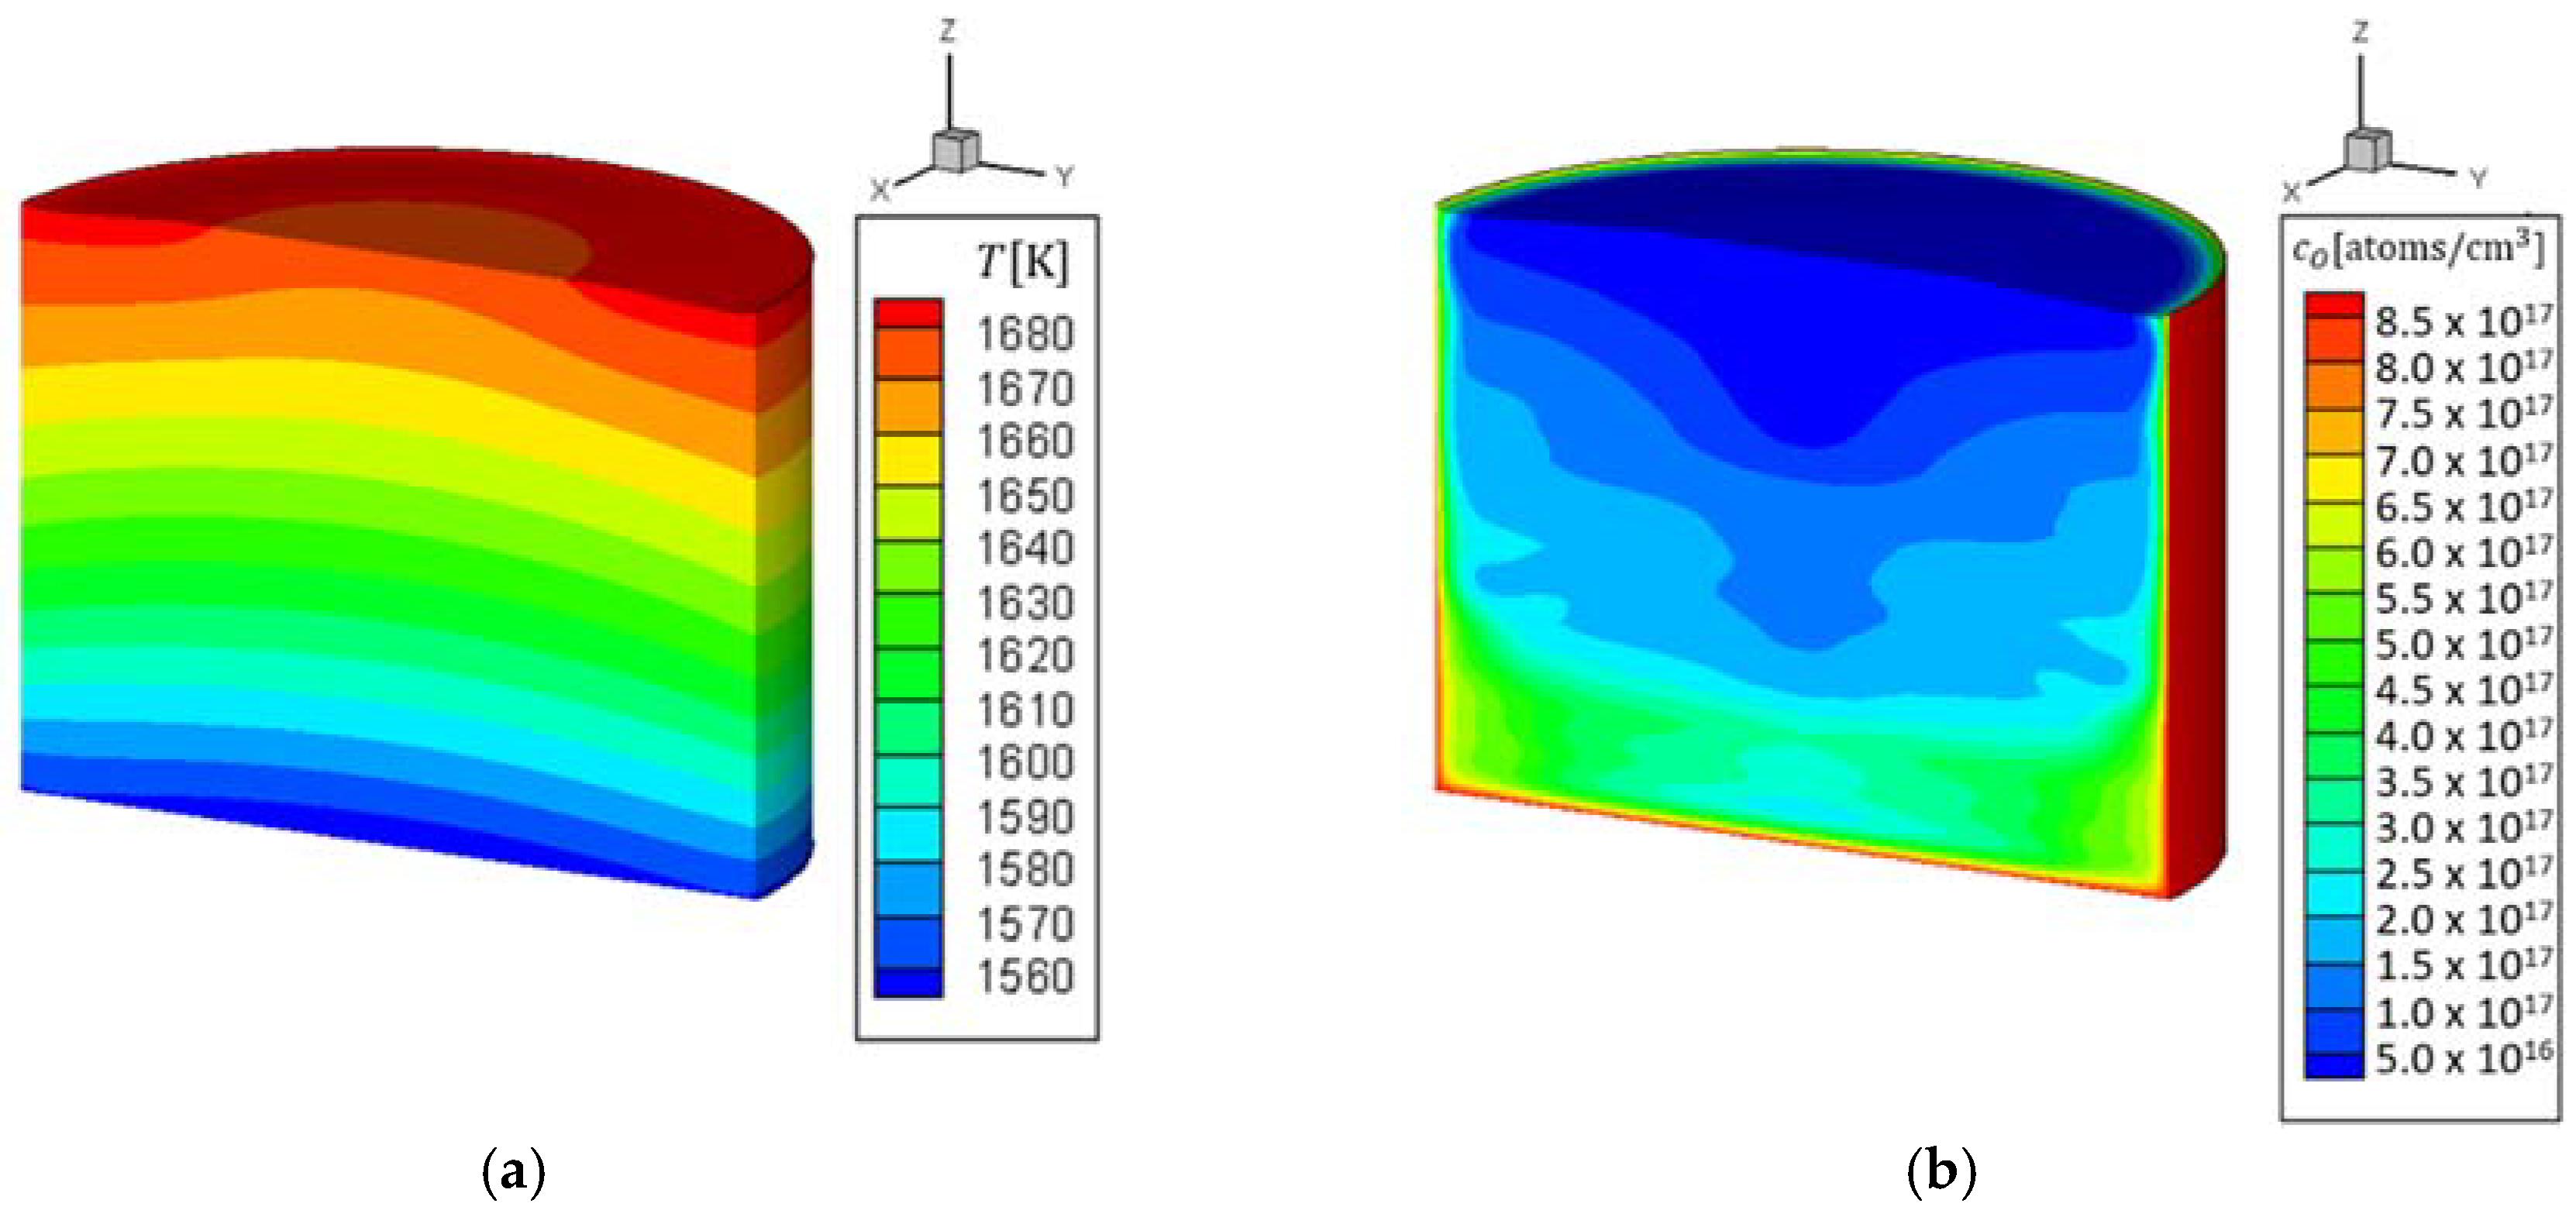
Figure 3 show the calculated temperature and oxygen concentration distributions at the end of the solidification. The periphery of the crystal has large oxygen concentration, except at the top, because of the oxygen evaporation to gas phase.
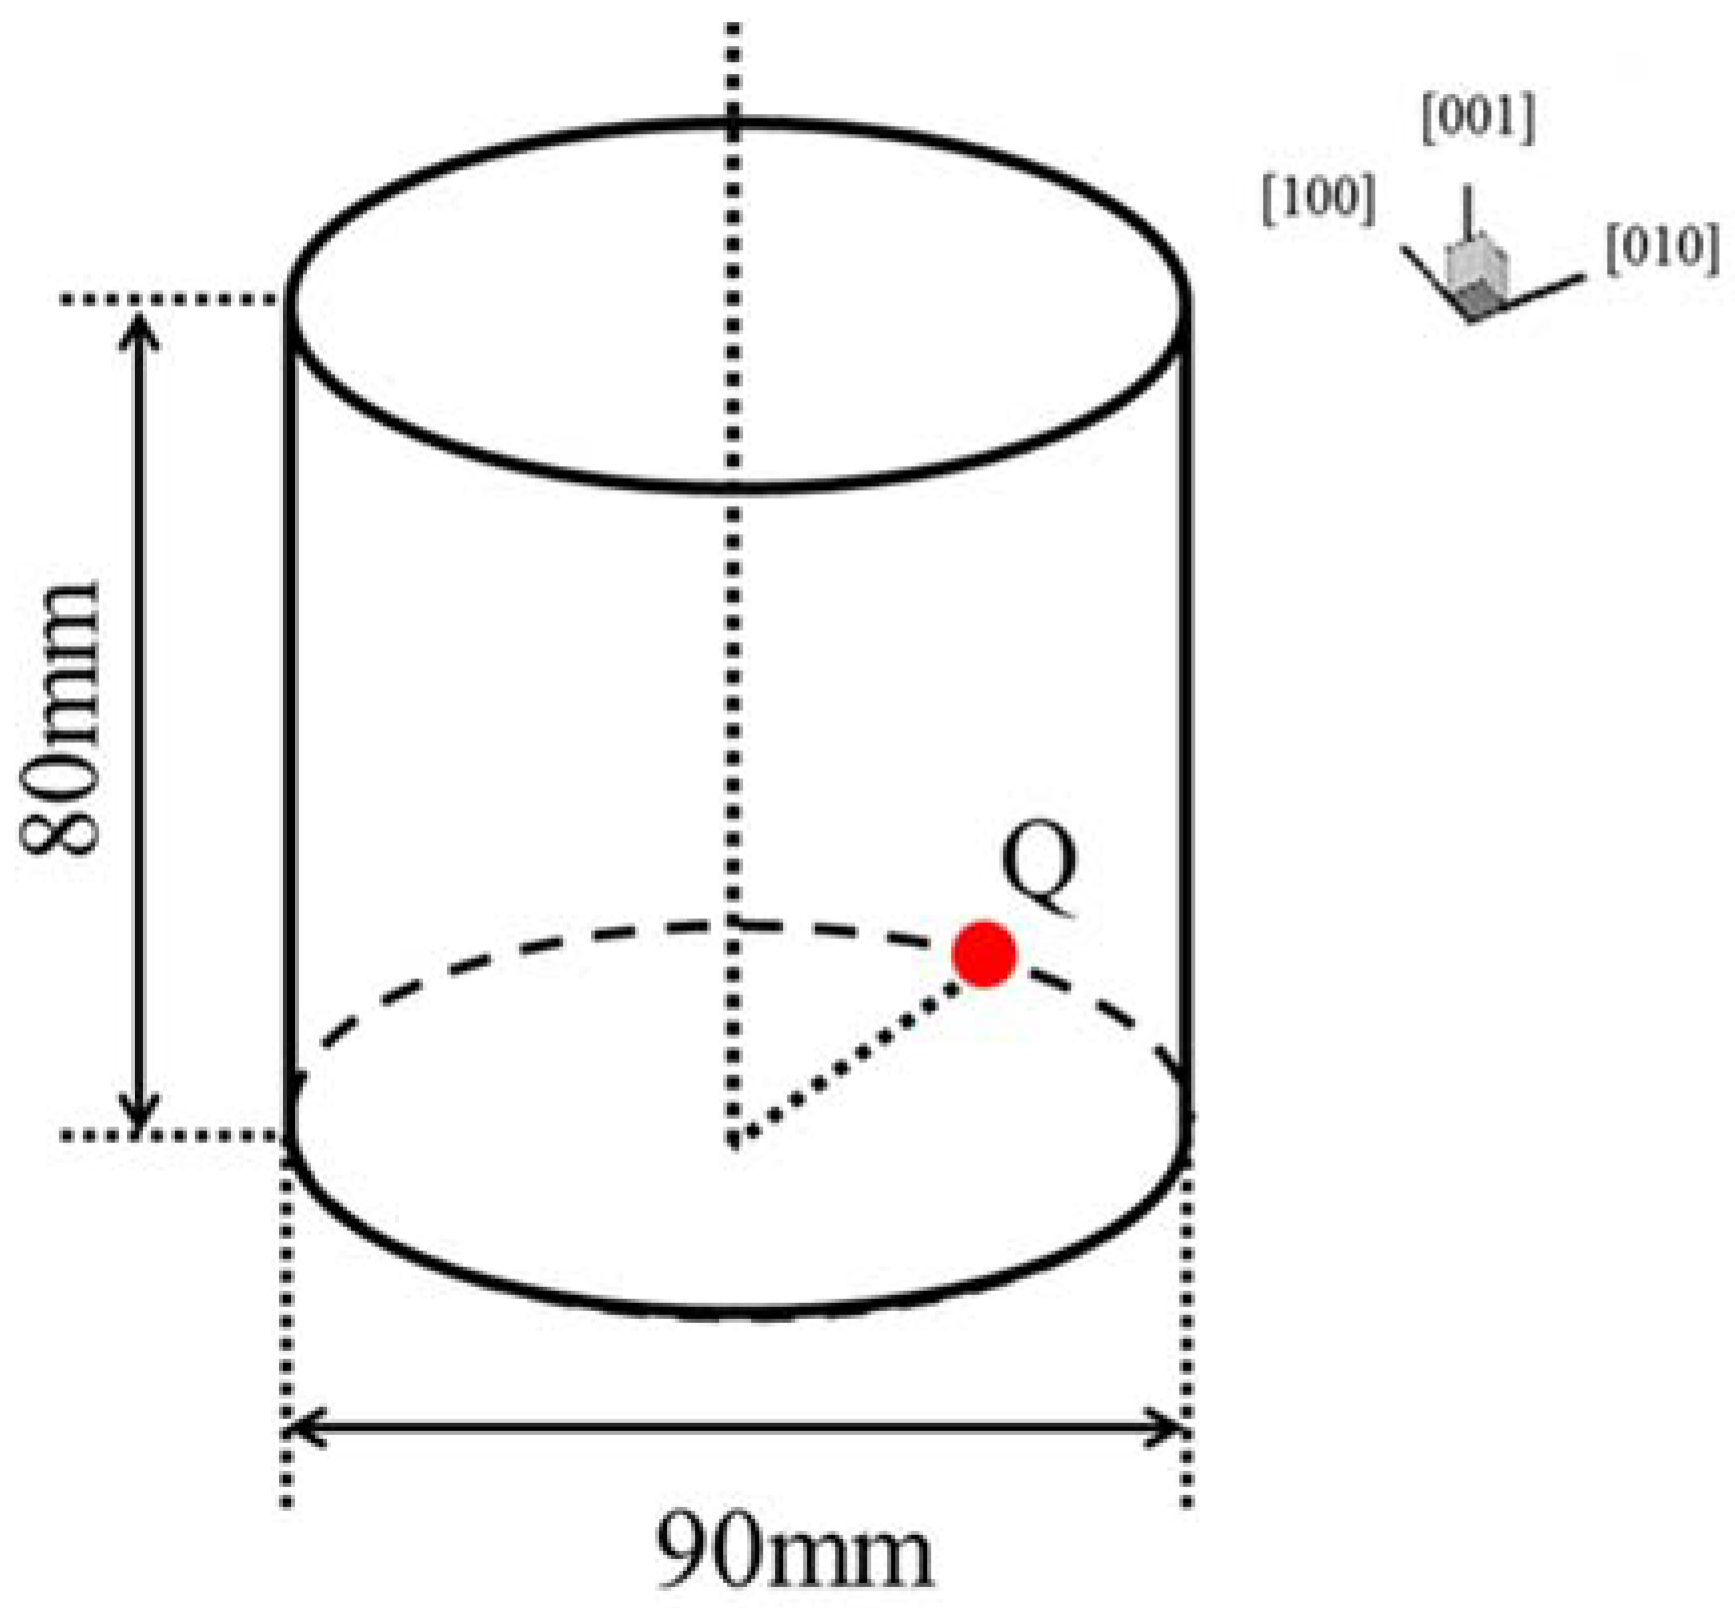
Figure 4 shows the schematic of a grown silicon crystal having a height of 80 mm and a diameter of 90 mm. The position Q in
Figure 4 is the point at which the temperature, oxygen concentration, and dislocation density of a crystal were monitored as a function of time. The maximum dislocation density was measured at this point.
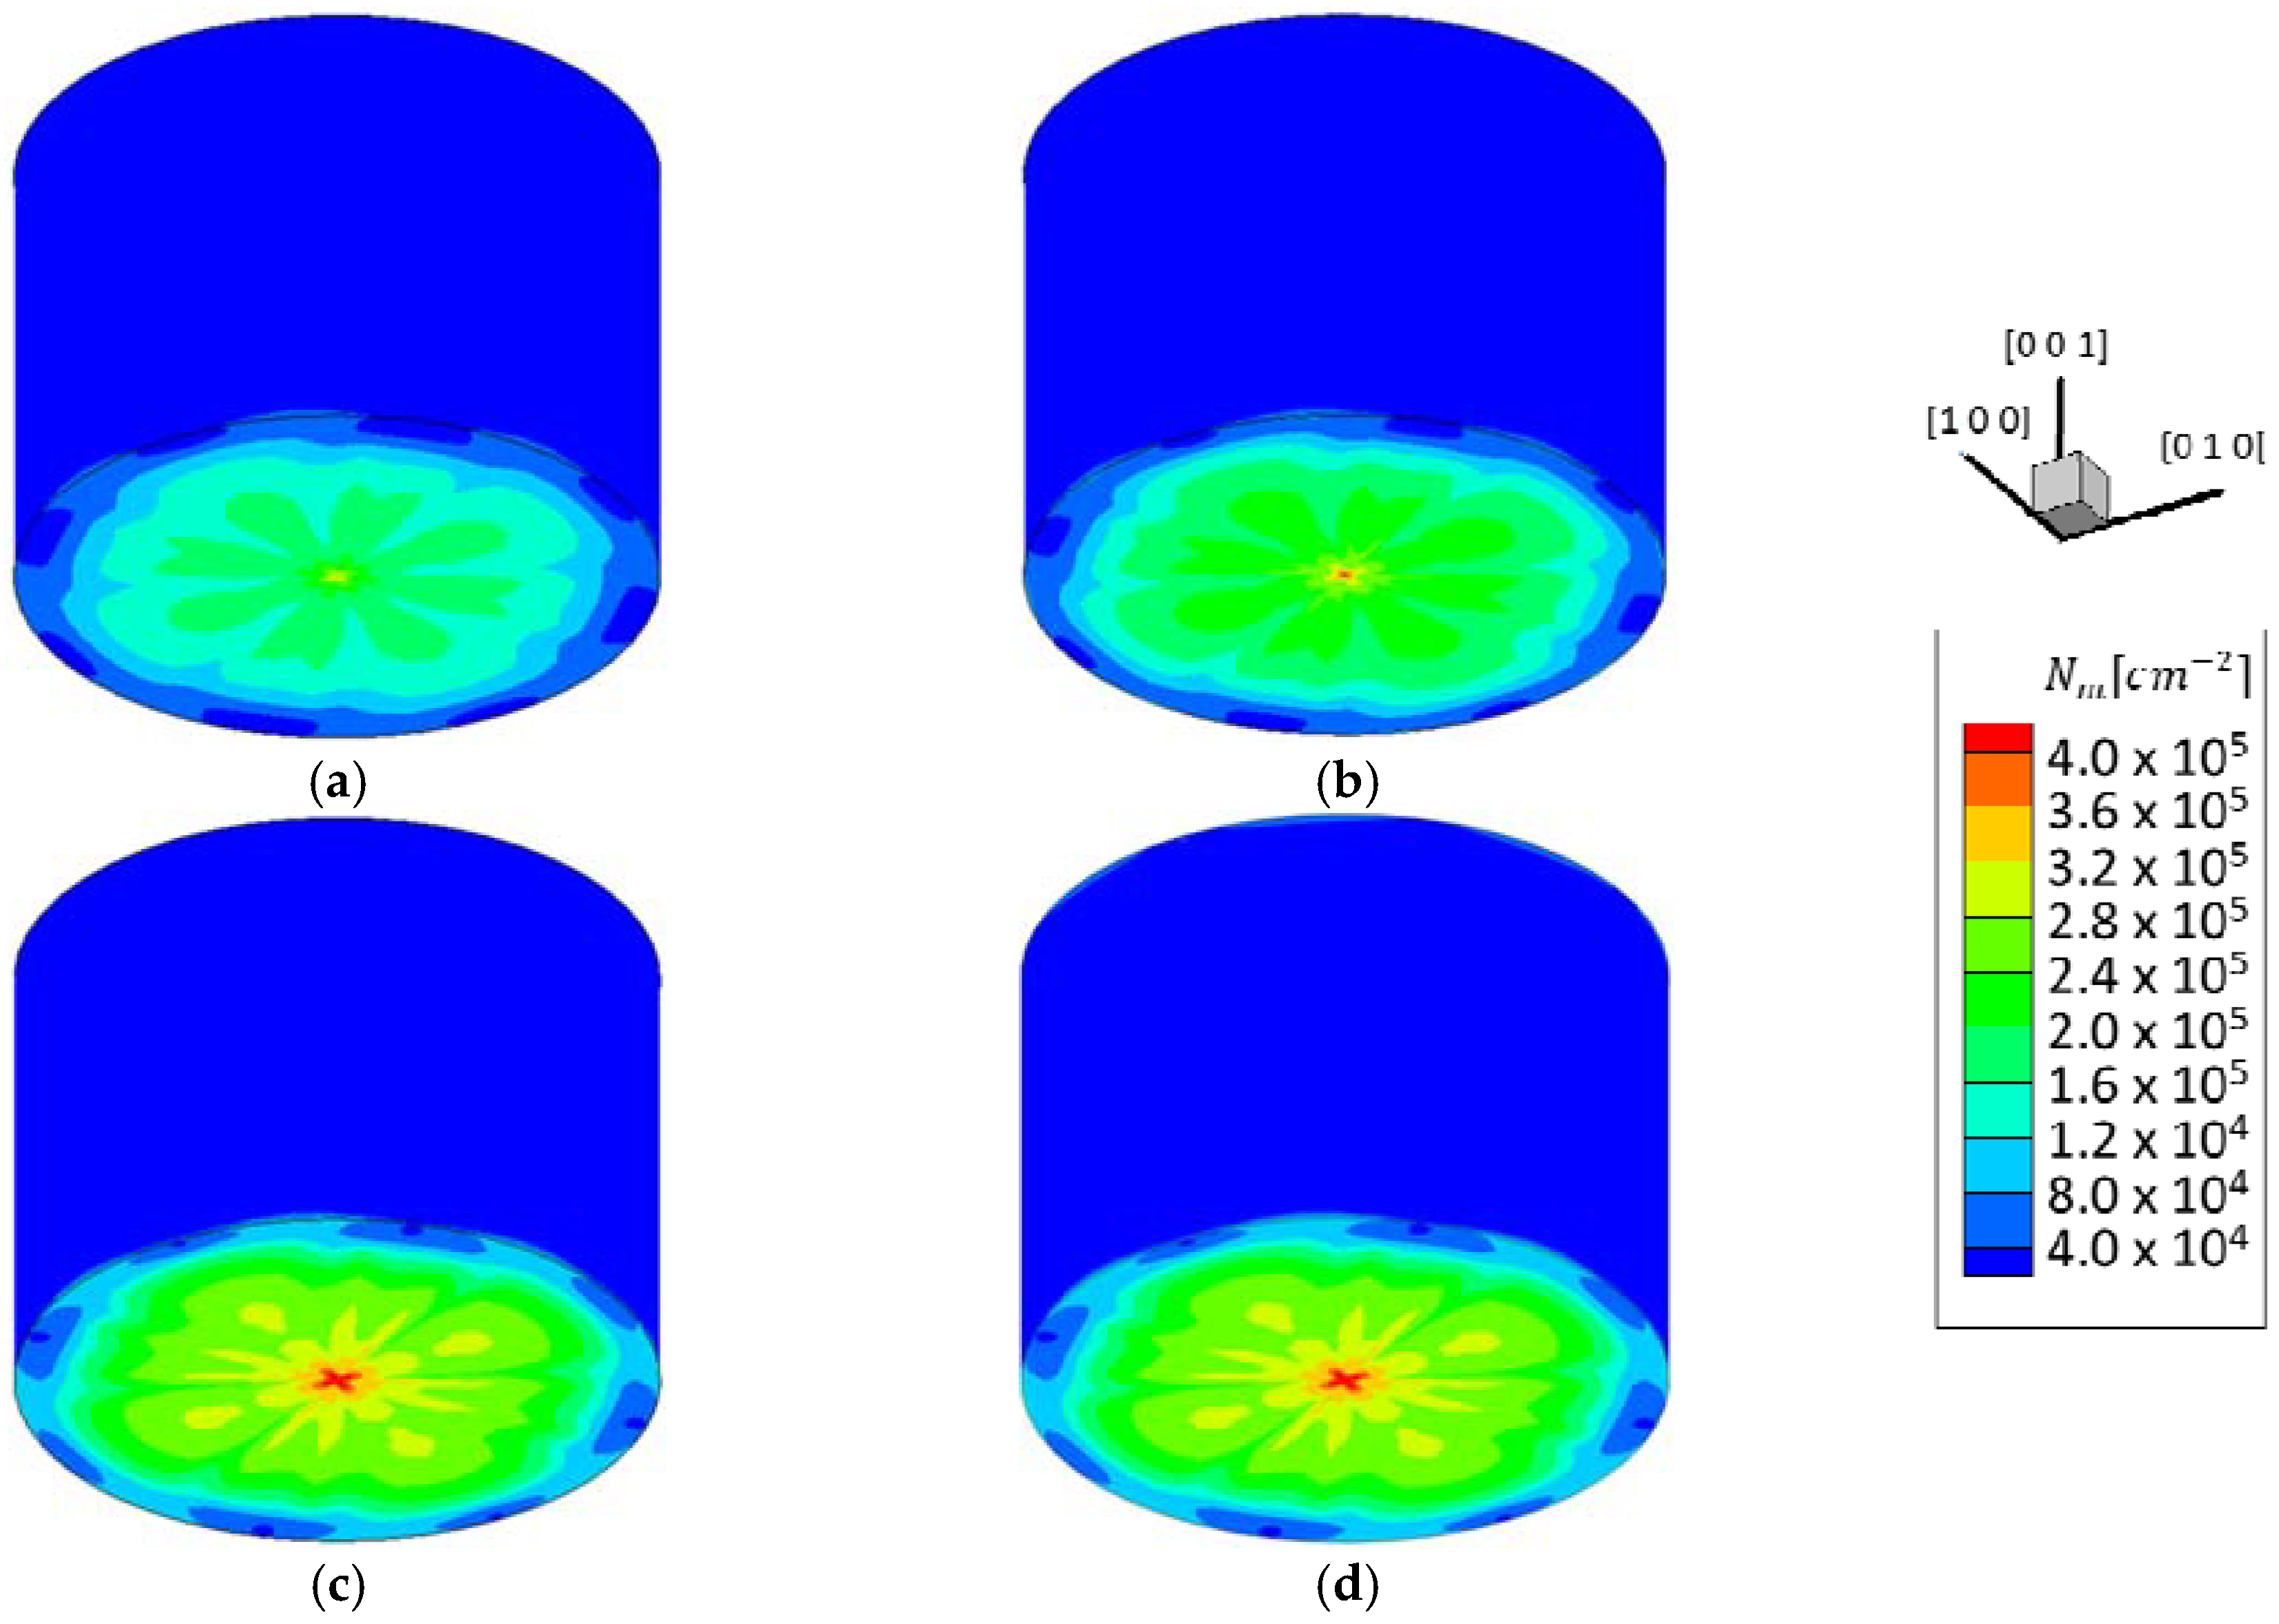
Figure 5a–d show the calculated distributions of dislocations in a crystal 282, 314, 466, and 720 min after the initiation of solidification, respectively. The average temperature throughout the crystal was 1627, 1600, 1500, and 1300 K, respectively. The effect of oxygen concentration on the dislocation density was considered in this case. Dislocation density increased as a function of time and became constant after 466 min, due to the small dislocation velocity at low temperature of the crystal during cooling process. Concerning stress distribution, the calculated data shows that the area with high dislocation has large residual stress [
19].
Figure 6a,b show the time-dependent temperature, dislocation density, and oxygen concentrations at point Q during the crystal growth and cooling processes. The result shows that the dislocation density increased during crystal growth and then remained constant at 1300 K in the case without considering the oxygen diffusion, shown by a dashed line, whereas the density became constant at 1500 K in the case with the oxygen diffusion. M’Hamdi reported that the density mainly increased during crystal cooling process [
2], whereas the density increase occurred during both crystal growth and cooling processes by considering oxygen diffusion to dislocation cores. The oxygen concentration in dislocation cores increased remarkably at 1500 K, due to the oxygen diffusion from the bulk to dislocation cores at elevated temperature.
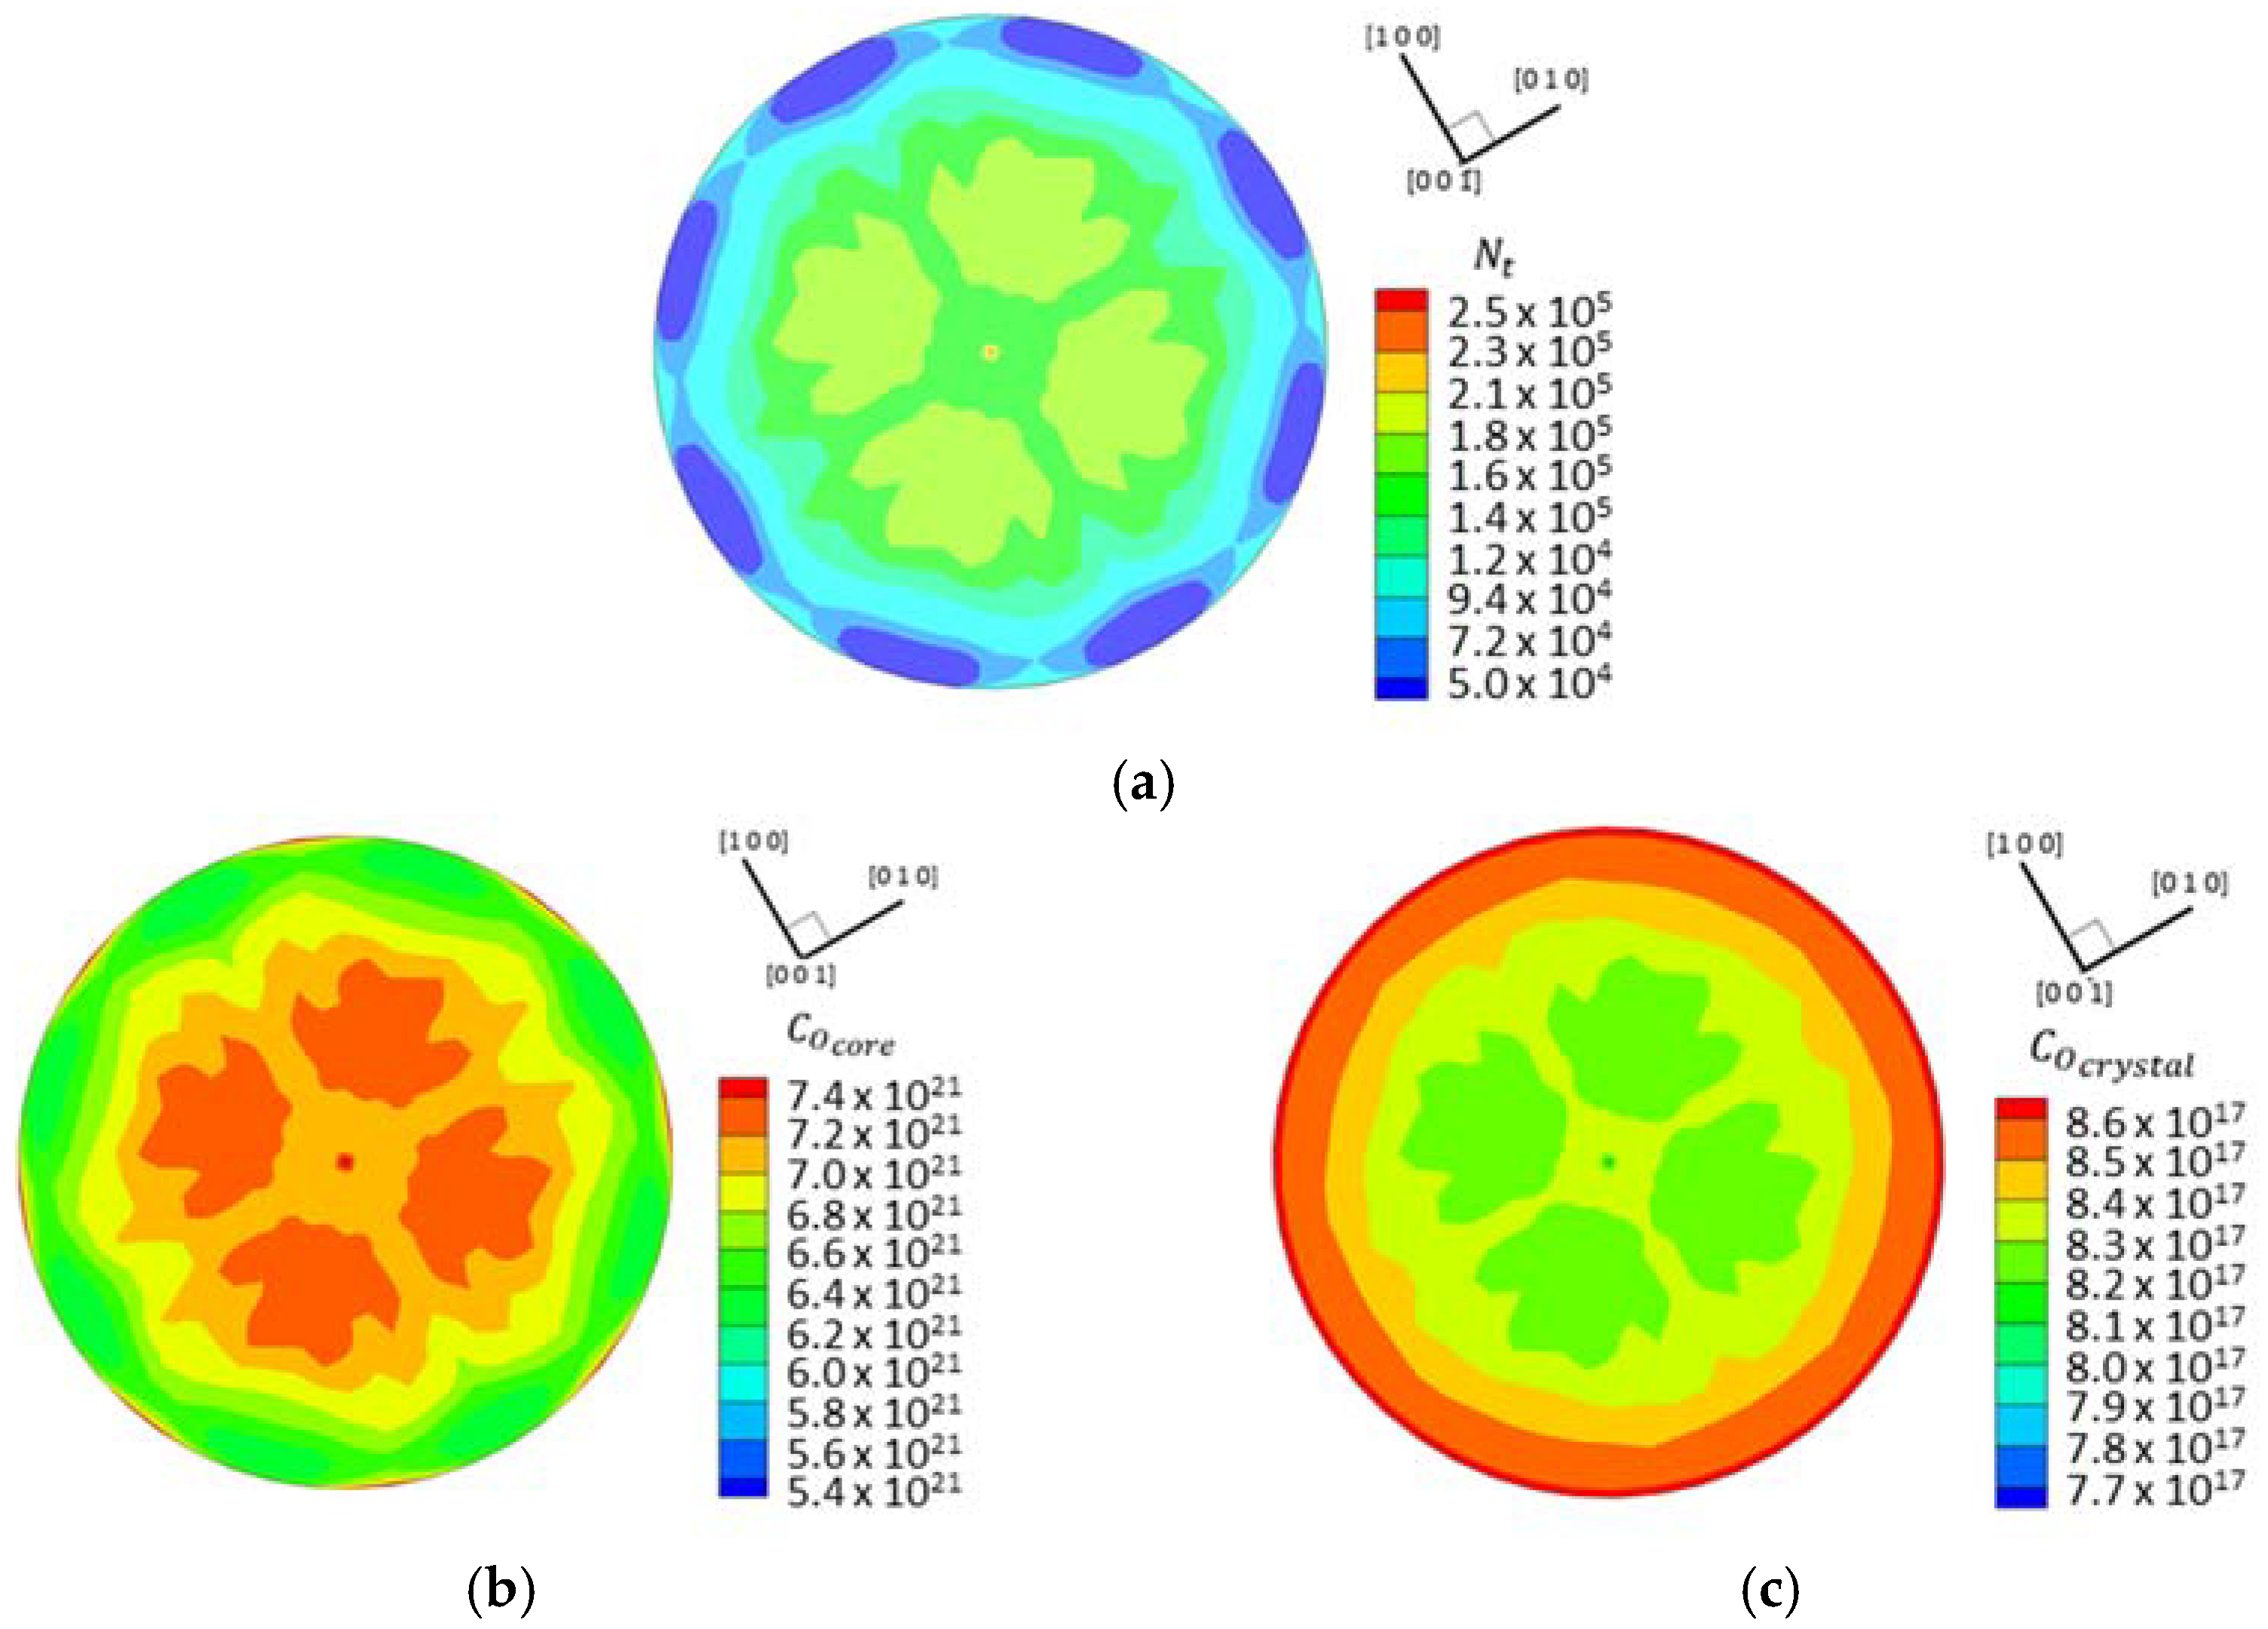
Figure 7a–c show the distributions of dislocation density, oxygen concentrations at the dislocation core, and interstitial oxygen concentration in the bulk at the bottom of the crystal at the end of cooling process, respectively. The area having a high dislocation density had a high concentration of oxygen at the dislocation core and low concentration in the bulk area.
4. Discussion
Figure 6a shows the relationship between temperature and dislocation density as a function of time at point Q. Increase in the dislocation densities during crystal growth was smaller than that during cooling process without the effect of oxygen on dislocation locking, as shown by a dashed line. On the contrary, the increase of the density ceased due to the locking process by oxygen that diffused from the bulk during crystal growth. Then, a half part of total dislocation density was introduced during the crystal growth process.
Figure 6b shows the relationship between oxygen concentration in dislocation cores and temperature as a function of time. The result shows that the concentration in the cores remarkably increased at 1500 K. Then, the increase of dislocation density stopped, as shown in
Figure 6a. This is related to the remarkable increase of
, consequently, the effective stress
shown in Equation (4) decreases. Then, the increase of the dislocation density stopped. The concentration of the oxygen in the cores becomes in the order of 1.0 × 10
21 atoms/cm
3, which is consistent with the results of formation of SiO
2 in the cores [
3]. The temperature at 1550 K is determined by equilibrium concentration of the interstitial oxygen at the surface of dislocation cores. Then, the temperature decreases when the concentration of the interstitial oxygen concentration decreases.
Figure 7a,b show the distributions of the dislocation density and oxygen concentration in the dislocation cores at the bottom of the grown crystal, respectively. The results show that the area having a high dislocation density has a high oxygen concentration in the core because of the small distance between dislocations. Then, the gradient of oxygen concentration toward dislocation core became large, when the dislocation density was large. Subsequently, the flux of the interstitial oxygen concentration increased. Finally, the concentration at the core became large.
Figure 7a,c show the distributions of the dislocation density and interstitial oxygen concentration in the bulk area, respectively. These results indicate that the area having a high dislocation density presented low oxygen concentration in the bulk. The decrease of oxygen concentration in the bulk was due to the boundary condition of the edge of diffusion area as shown in
Figure 1. When the distance
d decreased, the oxygen in the bulk diffused to the two adjacent dislocations. Then, the concentration in bulk decreased. All of the data are numerically predicted results, then, we should check them with experimental data to confirm our calculation.
From the above results, oxygen concentrations at dislocation cores were in the order of 1021 atoms/cm3, and those in the bulk were affected by dislocation density in the level larger than the order of 1.0 × 10⁴ atoms/cm3.


