Article

The Role of Hyperconjugation on the Structure and C–H Stretching Frequencies of 3,3′-Ethane-1,2-diyl- bis-1,3,5-triazabicyclo[3.2.1]octane (ETABOC): An X-Ray Structure and Vibrational Study

1
Facultad de Ciencias, Departamento de Química, Universidad Nacional de Colombia, Sede Bogotá, Carrera 30 No. 45-03, Bogotá 111321, Colombia
2
Institute für Anorganische Chemie, J. W. Goethe-Universität Frankfurt, Max-von Laue-Str., 7, 60438 Frankfurt/Main, Germany
*
Author to whom correspondence should be addressed.
Crystals 2018, 8(6), 251; https://doi.org/10.3390/cryst8060251
Submission received: 15 May 2018 / Accepted: 28 May 2018 / Published: 16 June 2018

Abstract

:
Structural and vibrational studies have been carried out for the most stable conformer of 3,3′-ethane-1,2-diyl-bis-1,3,5-triazabicyclo[3.2.1]octane (ETABOC) at the DFT/B3LYP/6-31G(dp) level using the Gaussian 03 software. In light of the computed vibrational parameters, the observed IR Bolhmann bands for the C2V, C2, and Ci symmetrical structures of ETABOC have been analyzed. Hyperconjugative interaction was done by Natural Bond Orbital Analysis. Interpretation of hyperconjugative interaction involving the lone pairs on the bridgehead nitrogen atoms with the neighboring C–N and C–C bonds defines the conformational preference of the title compound. The recorded X-ray diffraction bond parameters were compared with theoretical values calculated at B3LYP/6-31G(d,p) and HF/6-31G(d,p) level of theory showed that ETABOC adopts a chair conformation and possesses an inversion center.

Graphical Abstract

1. Introduction

The term “aminal” was coined by Böhme [1] to describe any molecule that contains the N–C–N sequence. Aminals, which are also known as N,N-acetals, are the aminated equivalents of acetals. Aminals can be either open-chained or cyclic such as aminal analogue 1. In the course of a systematic study on the synthesis of these interesting but rather poorly explored compounds, we discovered an unknown product from the condensation reaction between ethylendiamine and formaldehyde and we developed a mild method to obtain it in good yields [2]. On the basis of NMR spectroscopic studies, we assigned its structure as 3,3′-ethane-1,2-diyl-bis-1,3,5-triazabicyclo[3.2.1]octane (ETABOC, 1). The simplicity of the 13C-NMR spectrum with only four signals, the presence of pairs of doublets of aminalic protons, and the NOE effect observed between signals, which were assigned to C-2 and C-4 of bicyclooctane[3.2.1] and to the ethylenic bridge protons (bound to C-9), led us to propose a preferred C2V symmetric conformation of ETABOC in which rotation about the central C–C bond is restricted.
Because of its rigid bicyclic structure, 1 likely possesses a well-defined spatial arrangement that allows delocalization of the nonbonding electrons, especially the N-3 and N-3′ nitrogen atoms, with the σ* molecular orbitals antiperiplanar to the nitrogen lone pairs, resulting in the so-called hyperconjugation effect. It is well known that protons affected by this stereoelectronic interaction (i.e., nlp→σ*C–H) have different displacements relative to those in equatorial C–H positions because conjugation protects antiperiplanar C–H bonds and displaces it to higher fields (~1.0 ppm) [3,4,5].
However, based on the NOE effects observed between the hydrogen atoms, we assigned the signal in the 1H-NMR spectrum to the axial H-2 and H-4 protons (δH = 3.62), which are the closest to being antiperiplanar to the N-3 lone pair [3,4,5]. Thus, these hydrogen atoms should be more protected than the equatorial H-2 and H-4 hydrogen atoms (δH = 3.40). However, on the basis of these data and assignments, a new structural study of 1 is desirable to fully elucidate its structure and properties.
Additionally, it is well known that for diazabicycloalkanes and other polycyclic systems, the lone pair–lone pair interactions, either through space and/or sigma bonds, play an important role in stabilizing these polyamines, including their protonated or radical cation forms [6,7,8,9,10,11,12,13]. Moreover, such interactions depend on the spatial orientation of the lone pairs [12,13]. Thus, ETABOC serves as a prototypical molecule in this regard because of the presence of both structural fragments. It can thus be used to establish the importance of such stereoelectronic interactions in stabilizing a structure.
In this paper, a review of the structure of 1 is described and the role of the stereoelectronic effects on its structure and spectroscopic properties is discussed. Additionally, 1 was synthesized and crystallized to further confirm the identity of this intriguing structure because a crystalline structure has not yet been reported. These data are then used to analyze and compare the structural consequences of the stereoelectronic phenomena.
Crystals 08 00251 i001

2. Materials and Methods

3,3′-ethane-1,2-diyl-bis-1,3,5-triazabicyclo[3.2.1]octane (ETABOC, 1) was synthesized from formaldehyde and 1,2-diaminoethane as described in the literature [2]. The melting point was determined with an electrothermal apparatus, and is uncorrected. IR spectrum was recorded as KBr pellets at 292 K on a Thermo Nicolet IS10 spectrophotometer. 1H-NMR and 13C-NMR spectra were recorded in CDCl3 using a Bruker Avance AV-400 MHz spectrometer (Bruker, Leipzig, Germany) operated at 400.130 MHz for 1H and at 100.634 MHz for 13C. Crystals suitable for X-ray diffraction were obtained from MeOH upon slow evaporation of the solvent at room temperature.

2.1. X-Ray Analysis

The X-ray diffraction data were collected on a STOE IPDS II two-circle diffractometer equipped with MoKα radiation (λ = 0.71073 Å) at 173(2) K in the ω scan mode. Unit cell refinement was done using the X-Area software [14]. The structure was solved by direct methods using the SHELX-2014/6 [15]. For the structural refinement [15], the nonhydrogen atoms were treated anisotropically, and the hydrogen atoms bonded to O were refined isotropically whereas the remaining H atoms were treated as riding. The structure was refined as a three-component twin with fractional contributions of 0.104(6) and 0.105(9) for the minor components. Crystallographic data have been deposited at the Cambridge Crystallographic Data Centre. Copies of the data can be obtained free of charge on application to the CCDC, 12 Union Road, Cambridge CB2 IEZ, UK. Fax: +44-(0)1223-336-033 or e-mail: [email protected]. The CCDC deposition number is 1522802. Selected crystallograhic data and details concerning data collection and structure refinement are given in Table 1.

2.2. Theoretical Calculations

All the Density Functional Theory (DFT) calculations were performed using the Gaussian 03 package [16]. The geometries of C2V symmetry conformers of ETABOC were optimized using a DFT level of theory, with the B3LYP exchange correlation functional and the 6-31G(d,p) electronic basis set [17,18,19]. Vibrational studies have been carried out for the C2V, C2, and Ci symmetrical structures of ETABOC. The natural bonding orbitals (NBOs) calculations [20] are also performed on title compound with the same level of DFT theory with 6-311G(d,p) basis set using NBO 3.1 program as implemented in the Gaussian 03W package. The hyperconjugative interactive interaction energy can be deduced from the second-order perturbation approach. NBO calculation is also performed on title compound. The 1H and 13C NMR chemical shifts were calculated within the gauge-independent atomic orbital (GIAO) approach [21] and [22] applying the same level of DFT theory with 6-31++G (d,p) electronic basis set. The 1H and 13C NMR chemical shifts were converted into the TMS scale by subtracting the calculated absolute chemical shielding of TMS (δ = Σo − Σ, where δ is the chemical shift, Σo is the absolute shielding, and Σ is the absolute shielding of TMS), whose values are 31.685 and 192.834 ppm. The potential energy surface (PES) scans were performed by varying the torsion angle of N–CH2–CH2–N from −180° to 180° in steps of 20°.

3. Results and Discussion

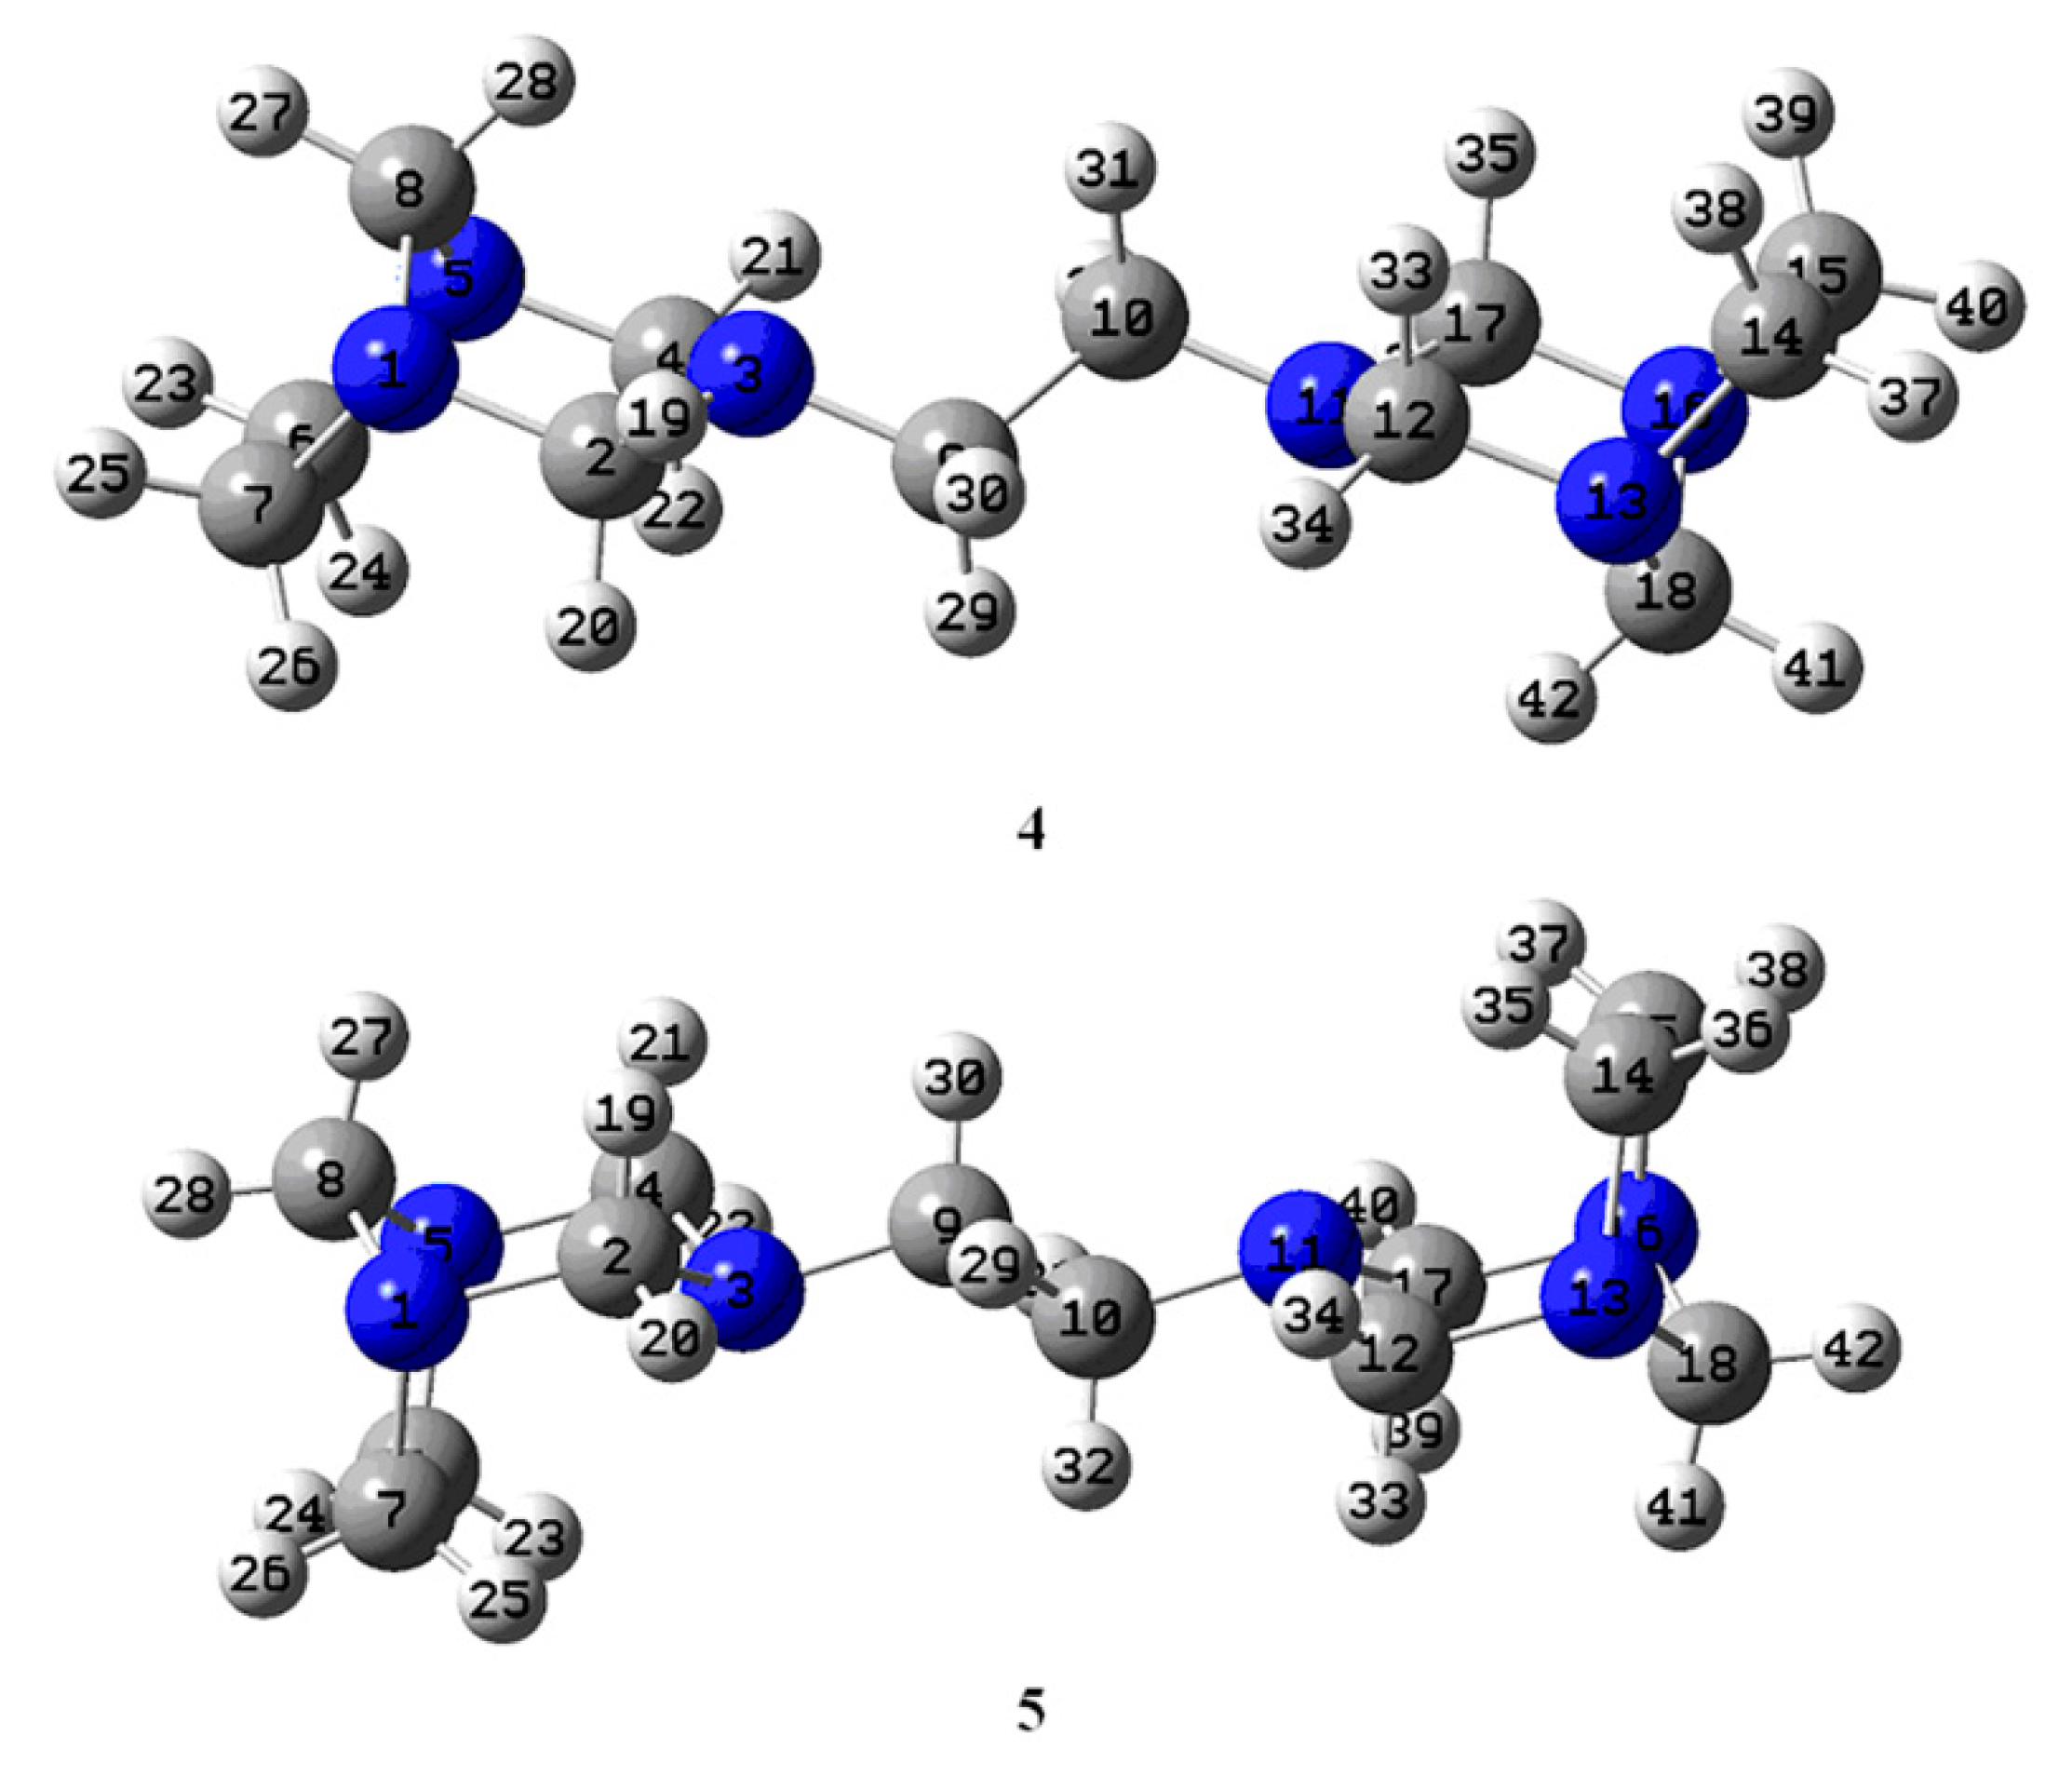
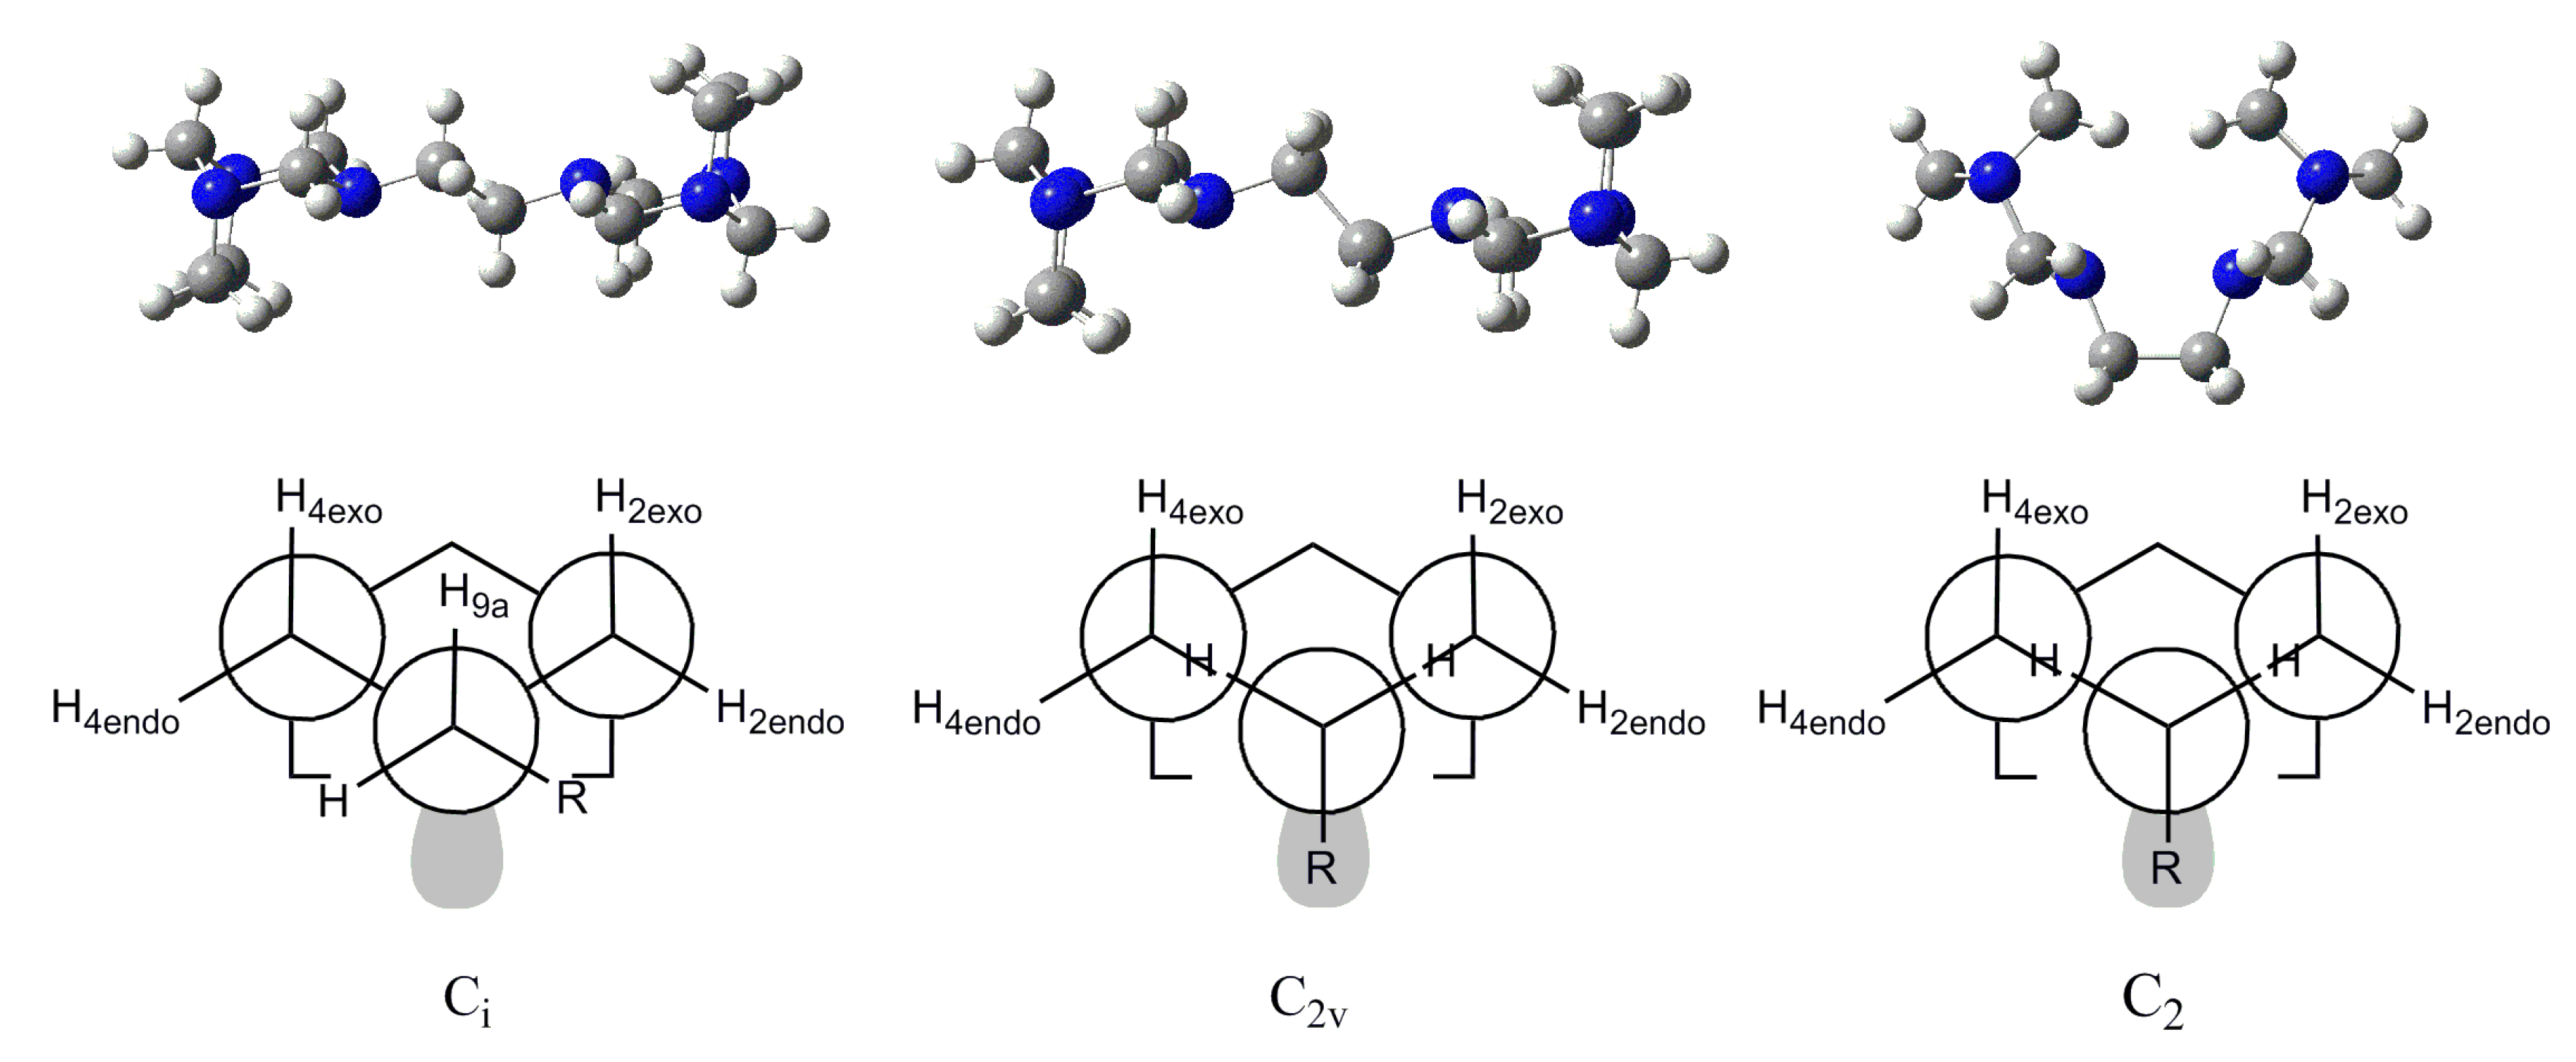
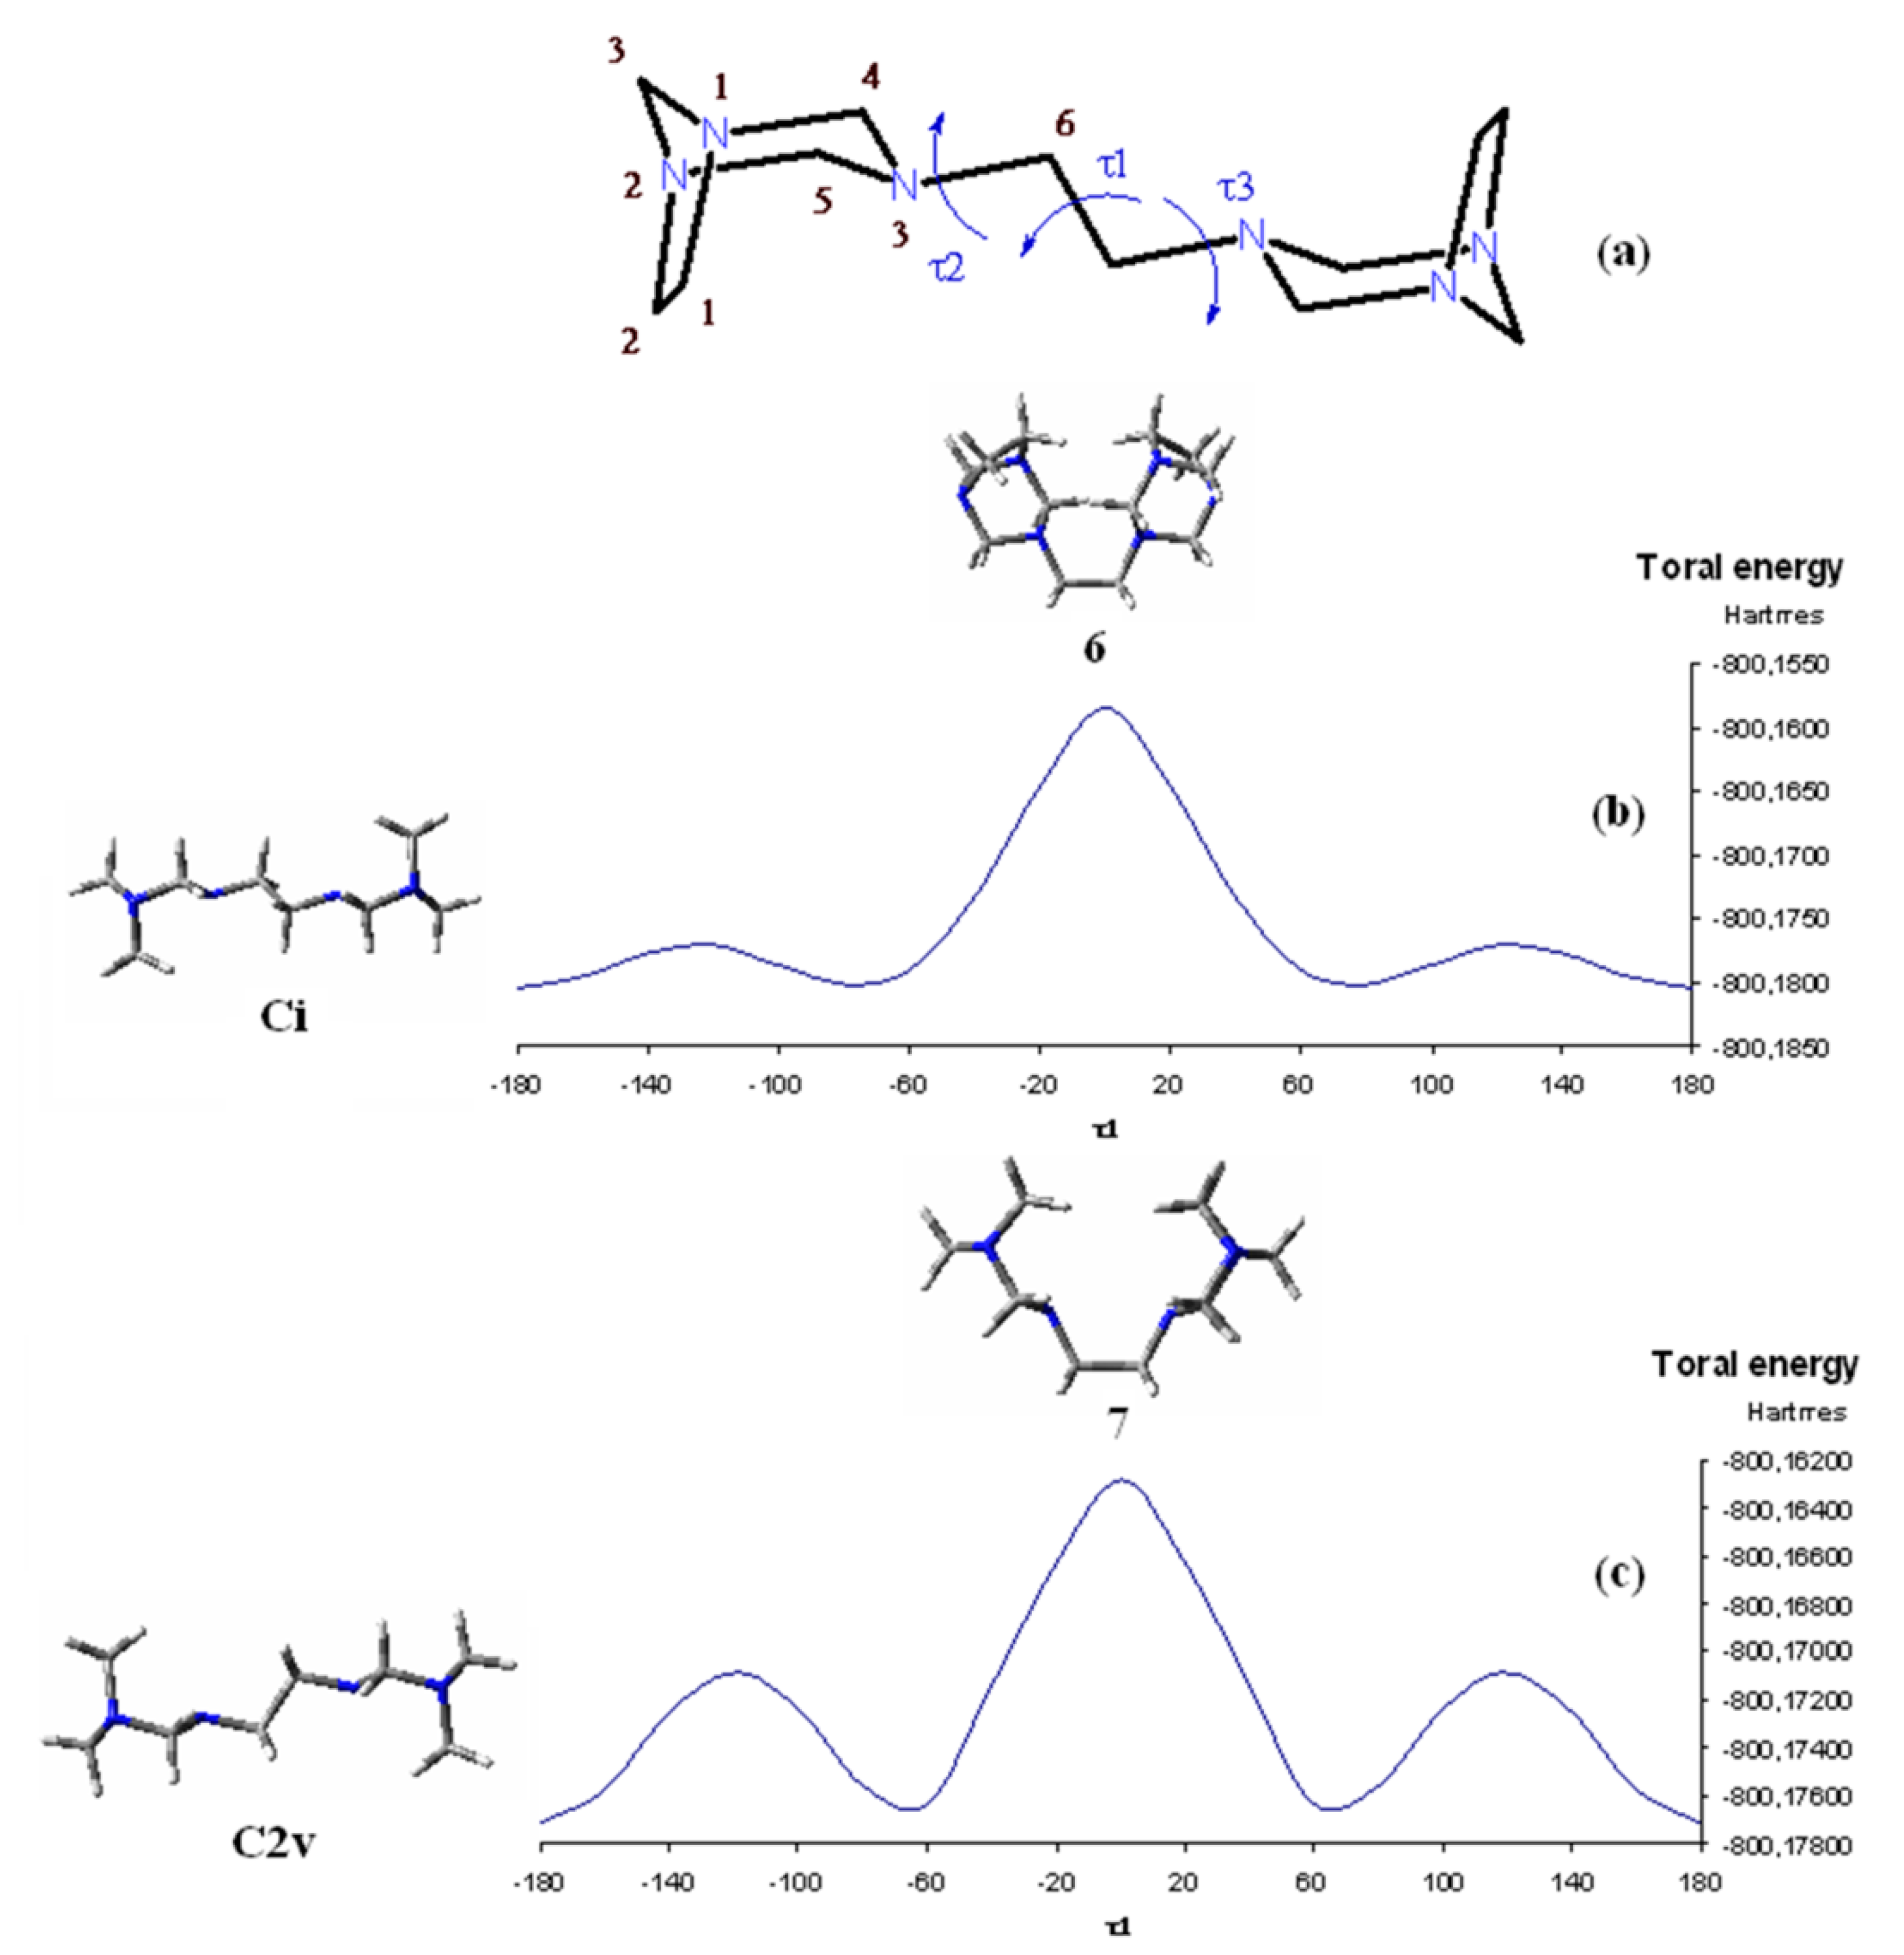
3.1. Conformational Analysis

In our previous paper we considered the conformer of 1 that possessed C2V symmetry, in which the 1,3,5-triazinane ring adopts a boat conformation, to account for the experimental observations [2]. Such a structure places the lone pairs of nonbridgehead nitrogen atoms N-3 and N-3′ in an exo arrangement (2). However, another conformation that can satisfy this symmetry constraint and explain the presence of a single set of signals for the ethylenic moiety is possible. Specifically, the heterocyclic ring can also adopt a chair conformation in this other C2V structure. This conformation places the lone pairs of N-3 and N-3′ in an endo arrangement (3), which should be lower in energy.
However, close inspection of both structures indicates that the hydrogen atoms on C-2 and C-4 are well positioned to interact with the lone pair on N-3, which also elicits an NOE effect with the hydrogen atoms of the central ethylene moiety. In this sense, neither structure supports the chemical shift difference observed in the experimental spectrum because the stereoelectronic effect should protect these hydrogen atoms because they are displaced antiperiplanar to the nitrogen lone pair, leading them to high field (δH 3.40). Consequently, the NOE effect should be more evident with the most protected hydrogen atoms and not with the most unprotected ones (δH 3.62).
Accordingly, our conclusion regarding the presence of a single conformation, which can explain the simplicity of the NMR spectrum and the observed NOE effects, is incomplete. For this reason, we return to investigate ETABOC further to establish the structural reasons for its unique spectroscopic properties and to establish an unambiguous assignment of the hydrogen atoms in the bicyclic ring.
To begin, we wish to establish the structural and energetic differences between 2 and 3. For this purpose, an optimization of the molecular geometries of 2 and 3 was performed using the B3LYP/6-31G(d,p) level of theory from density functional theory (DFT), which provides a good compromise between accuracy and computational cost. Our results were surprising because the molecules became distorted from C2V symmetry during the optimization procedure to give two conformations that don’t explain the simplicity of the spectrum. Although an exocyclic torsional angle involving N–CH2–CH2–N was set to 180° to have the bicyclics as far as possible from each other, we calculated a conformation that maintains Ci symmetry and includes an inversion center located in the middle of the central C9-C10 ethylene moiety (Figure 1). The relative energies and torsion angles involving CH2NCH2CH2 that characterize the symmetry of the two optimized conformations of the 1,3,5-triazinane ring in 4 and 5 are summarized in Table 2. The DFT calculations indicate that the energy gap between these two conformers is approximately 15.9 kcal/mol. Thus, the most stable ETABOC conformer is 5, wherein the 1,3,5-triazinane ring adopts a chair conformation and inversion of the N3 and N11 lone pairs is restricted.
However, this structure is not compatible with the presence of a simple set of signals in the NMR spectrum. If we consider the Ci conformer (5) instead of the C2V conformer (3), in which the N3 and N11 lone pairs adopt an endo arrangement, the possibility to observe chemical equivalence between the signals must include a free rotation of both bicyclic rings around the central ethylene moiety at room temperature. However, the observed NOE effect indicates that the molecule is stiff because this effect is largely based on through-space dipolar interactions between two spins [23,24,25].

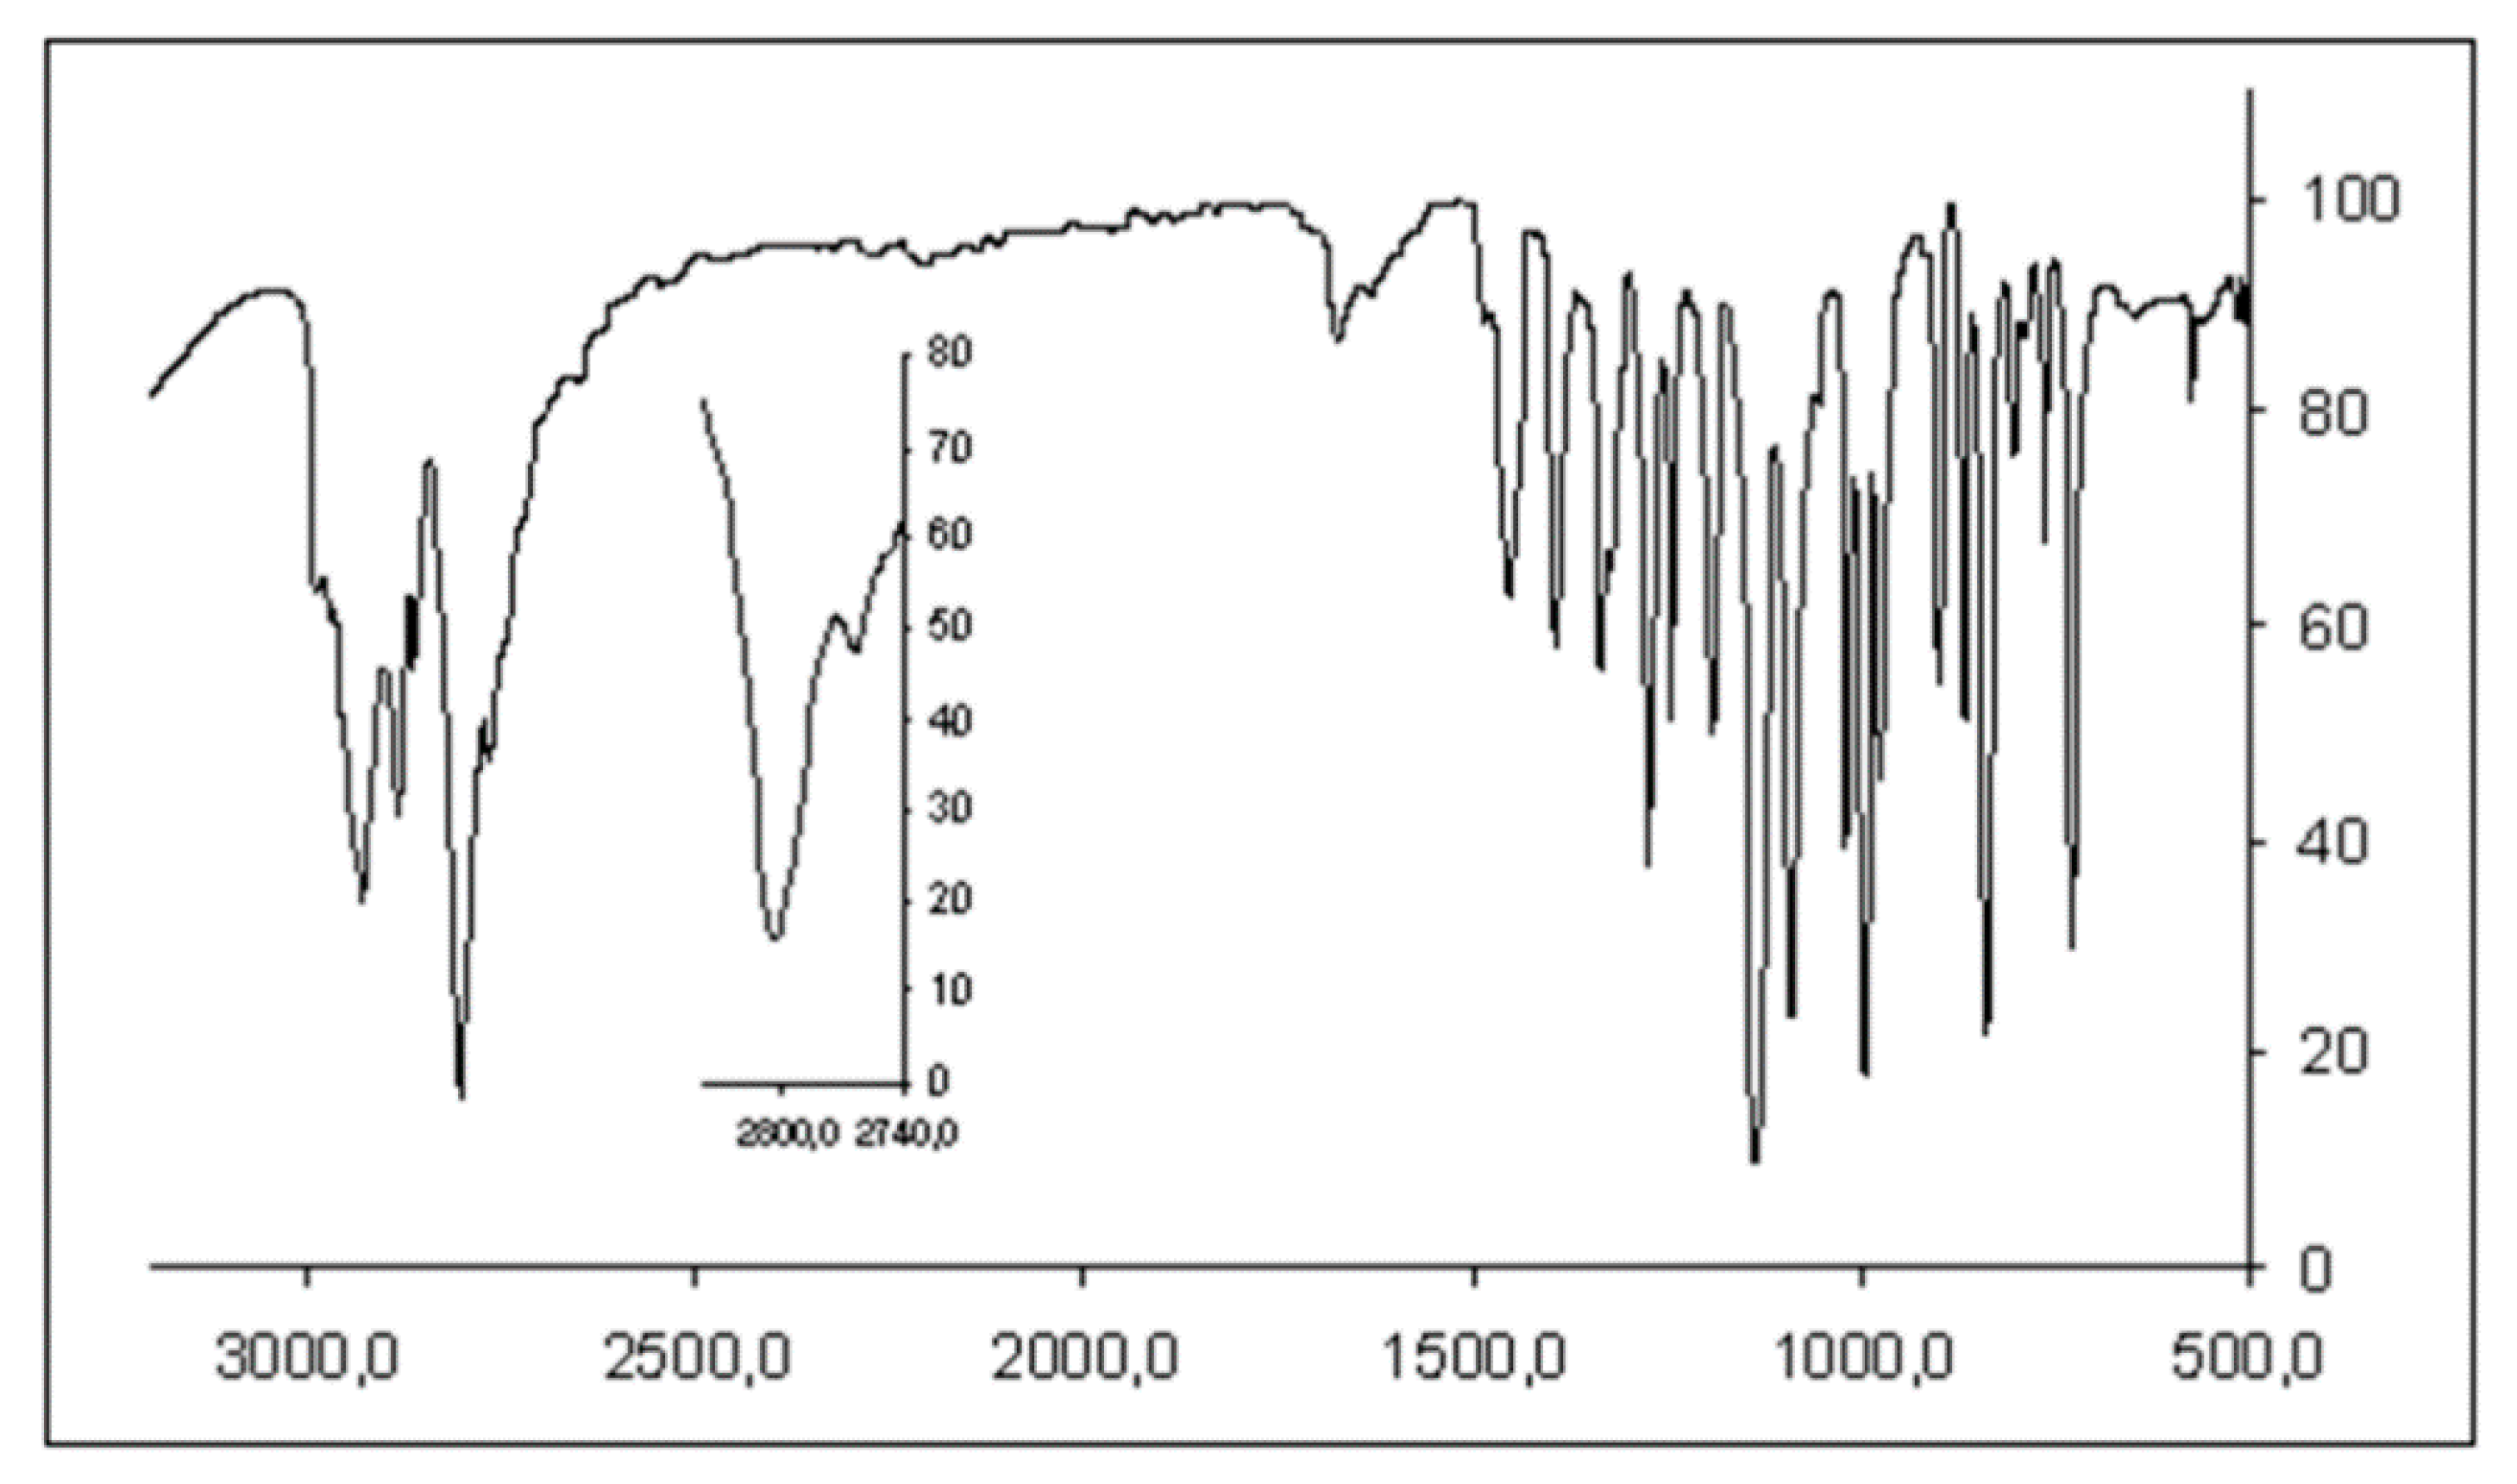
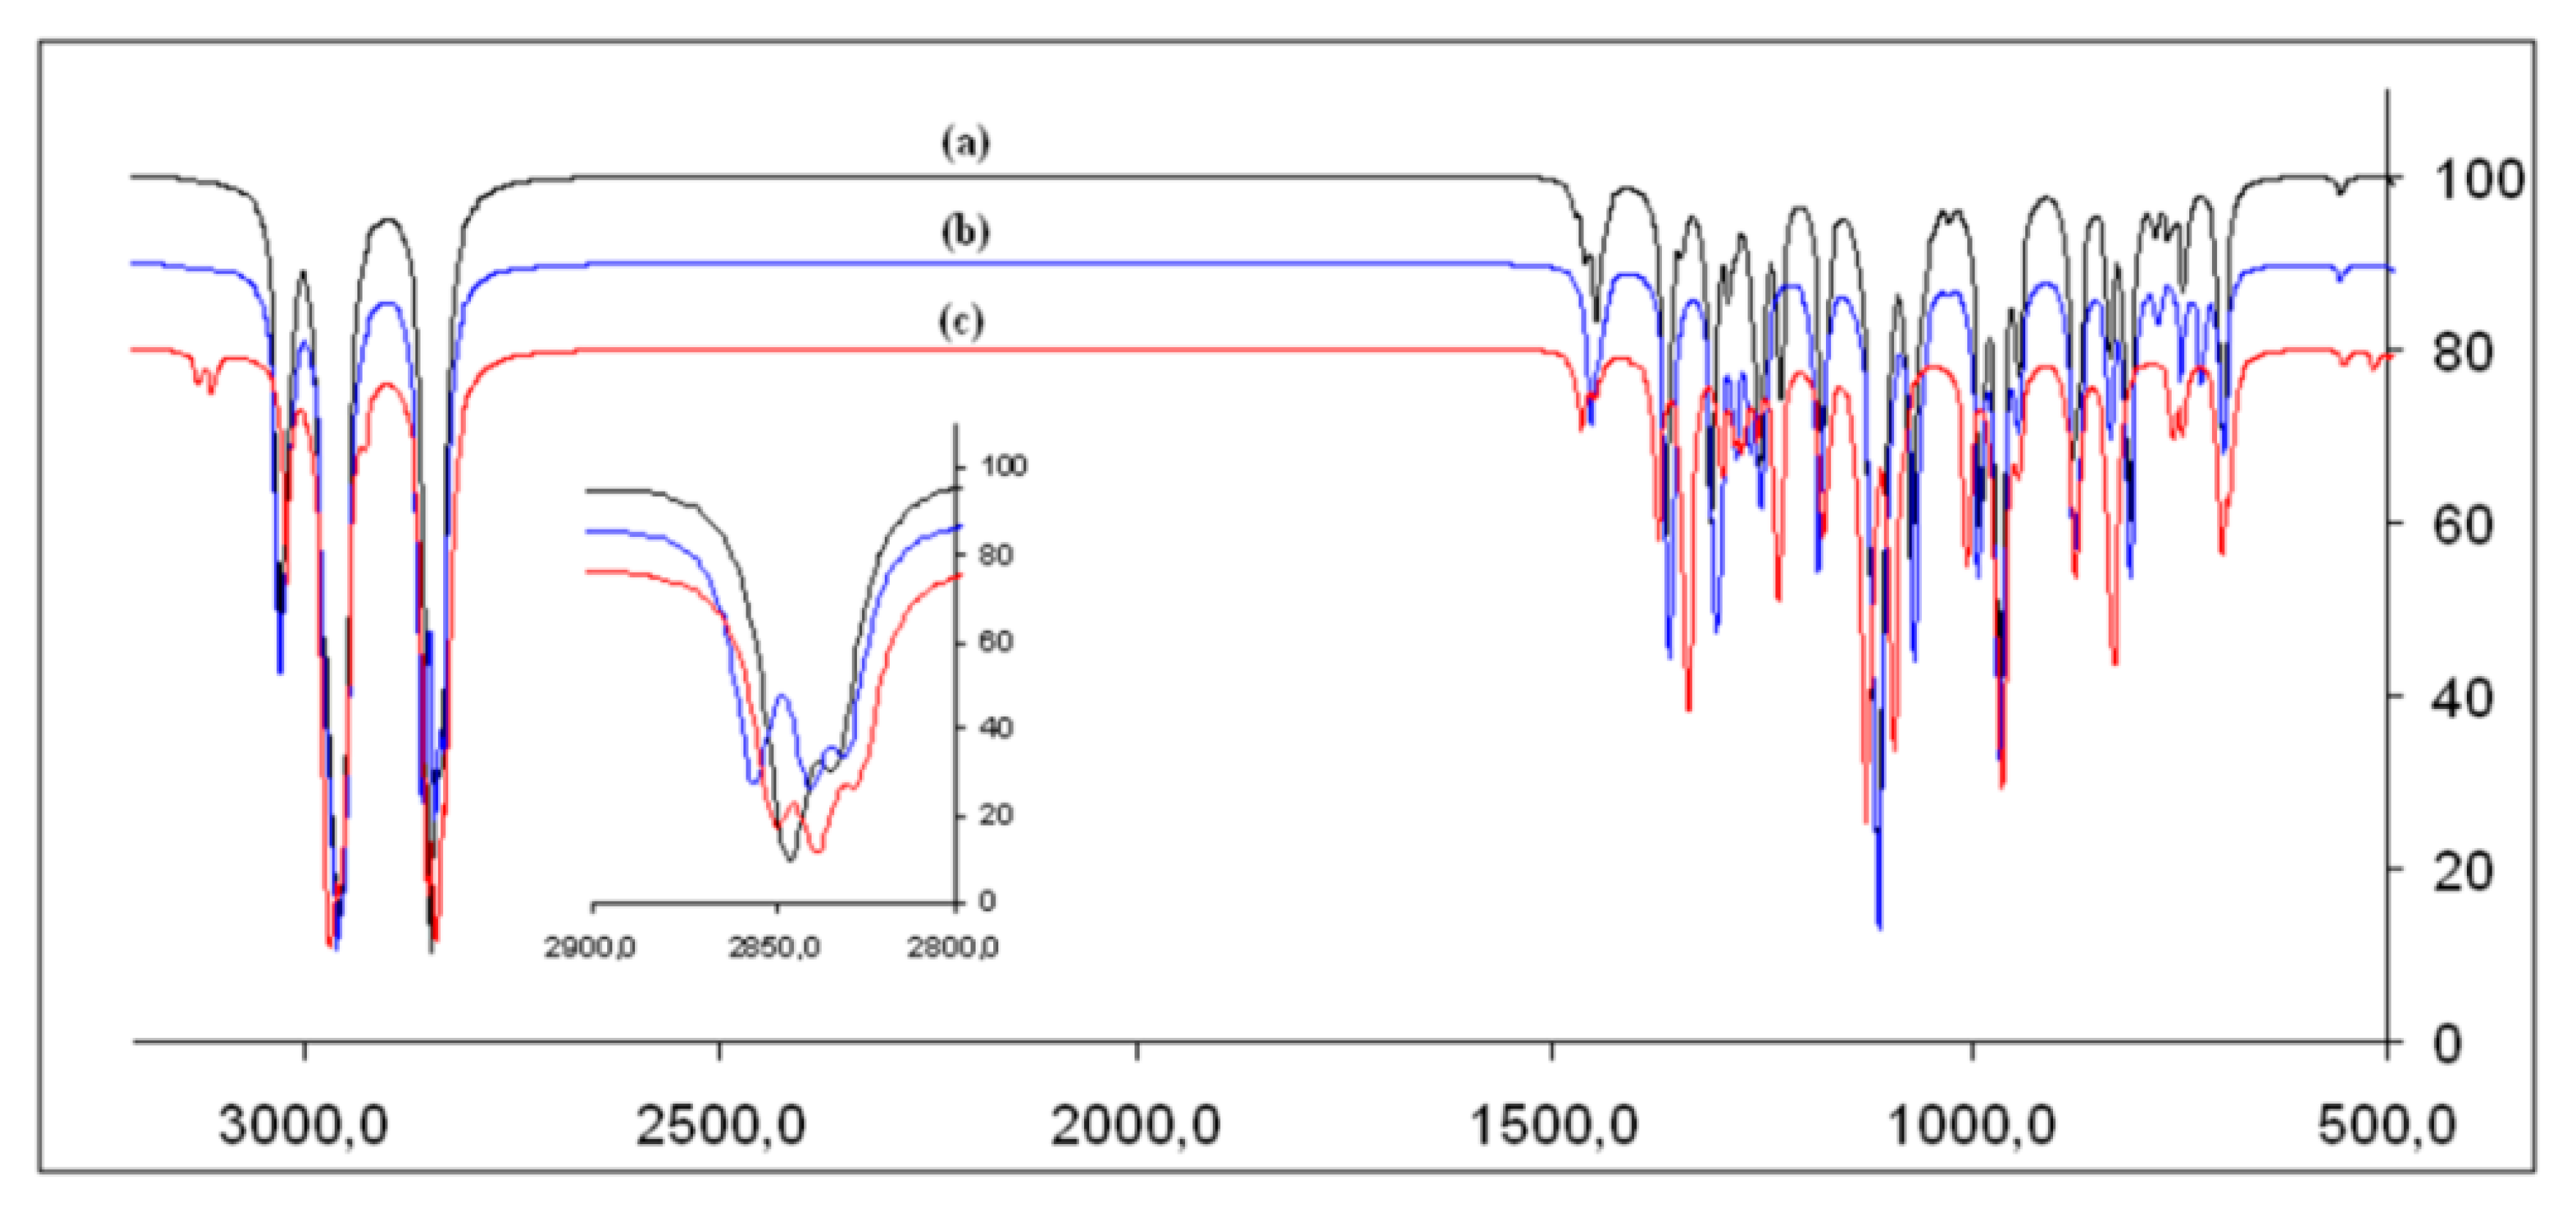
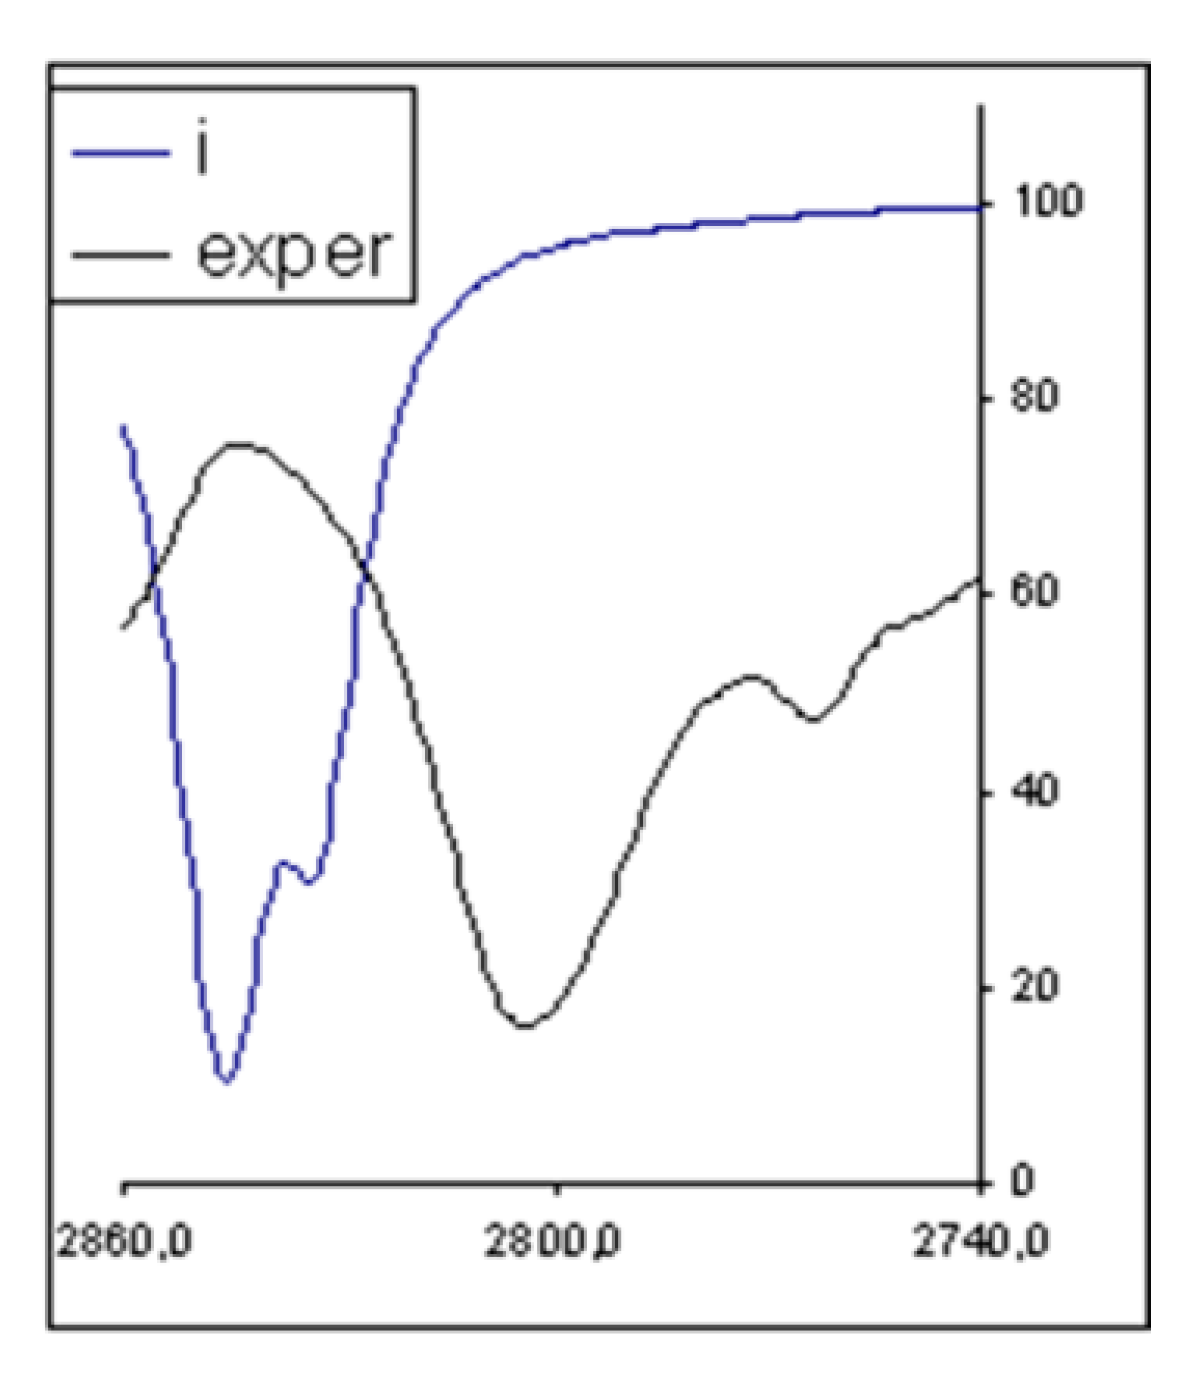
3.2. Infrared Spectrum

In amines with rigid systems, the presence of additional bands below 2800 cm−1 in the FT-IR spectrum indicates the presence of at least one C–H bond that is antiperiplanar to the nitrogen lone pair. Such signals are known as Bolhmann bands [26,27,28,29,30,31]. With this in mind, we report a vibrational analysis of ETABOC in the region between 2800 and 2900 cm−1. This analysis seeks to determine the presence or absence of a rigid structure that favors an antiperiplanar arrangement between the nitrogen lone pair with at least two C–H bonds (Bolhmann bands). The IR spectrum of ETABOC shows the C–H stretching frequencies in their characteristic region (i.e., between 2900 and 3000 cm−1). Additionally, other acute bands are present at 2764 and 2804 cm−1 (Figure 2). We attribute these signals to the symmetric and asymmetric C–H stretching of the hydrogen atoms involved in hyperconjugation with the lone pairs of electrons in the rigid amines (Bolhmann bands).
The presence of these signals allows us to conclude that, at least in the solid state, ETABOC adopts a well-defined rigid structure. Considering that Bolhmann bands have been widely used for conformational studies [26,27,28,29,30,31] and that the two conformers give separate and distinct signals in the C–H stretching region, we performed a second set of calculations using the B3LYP/6-31G(d,p) level of theory for a vibrational analysis of the Bolhmann bands for the C2V, C2 and Ci symmetrical structures of ETABOC. A detailed analysis of the Newmann projections (Figure 3) of these three structures suggests that stereoelectronic effects (nlp–σ*C–H) will be present, which are caused by the arrangement between the lone pairs of the central nitrogen atoms N3 and N3′ with the C-H2exo and C-H4exo bonds. In the case of Ci, an additional C–H bond located in the central ethylene moiety and antiperiplanar to the nitrogen lone pair is present. However, it is expected that the corresponding signals for this arrangement will be different in both frequency and number.
The vibrational properties of the infrared spectra of the three symmetric conformations of ETABOC were examined using the data obtained from the DFT calculations. For all three conformations, the calculated vibrational frequencies clearly show multiple sets of distinct C–H stretching frequencies. The weaker frequencies are assigned to the stretching of the hydrogen atoms that are located antiperiplanar to the nonbridgehead nitrogen lone pairs (Figure 4).
A comparison of the experimental Bolhmann bands (Figure 2) with the calculated spectra (Figure 4) indicates that the conformation giving equal Bolhmann bands in quantity and shape contains an inversion center in the middle of the ethylenic bridge that links the bicycles (i.e., Ci) (Figure 5). This description is consistent with the optimized ETABOC structure with the nitrogen lone pairs located towards an endo position (5).
This result led us to conclude that ETABOC is rigid in the solid state and restricts rotation around the central CH2–CH2 bond that connects the two bicyclic structures. Moreover, the preferred conformation is the one that maintains an inversion center in the center of this bond.

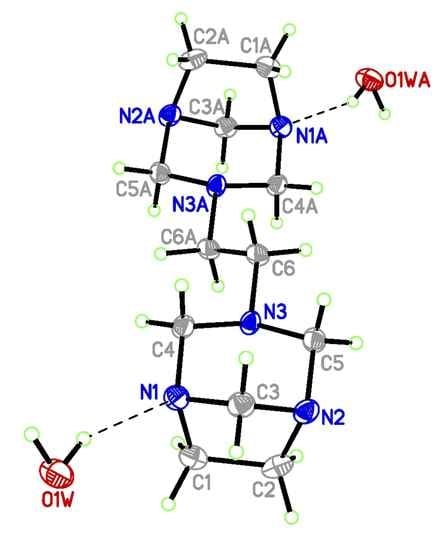
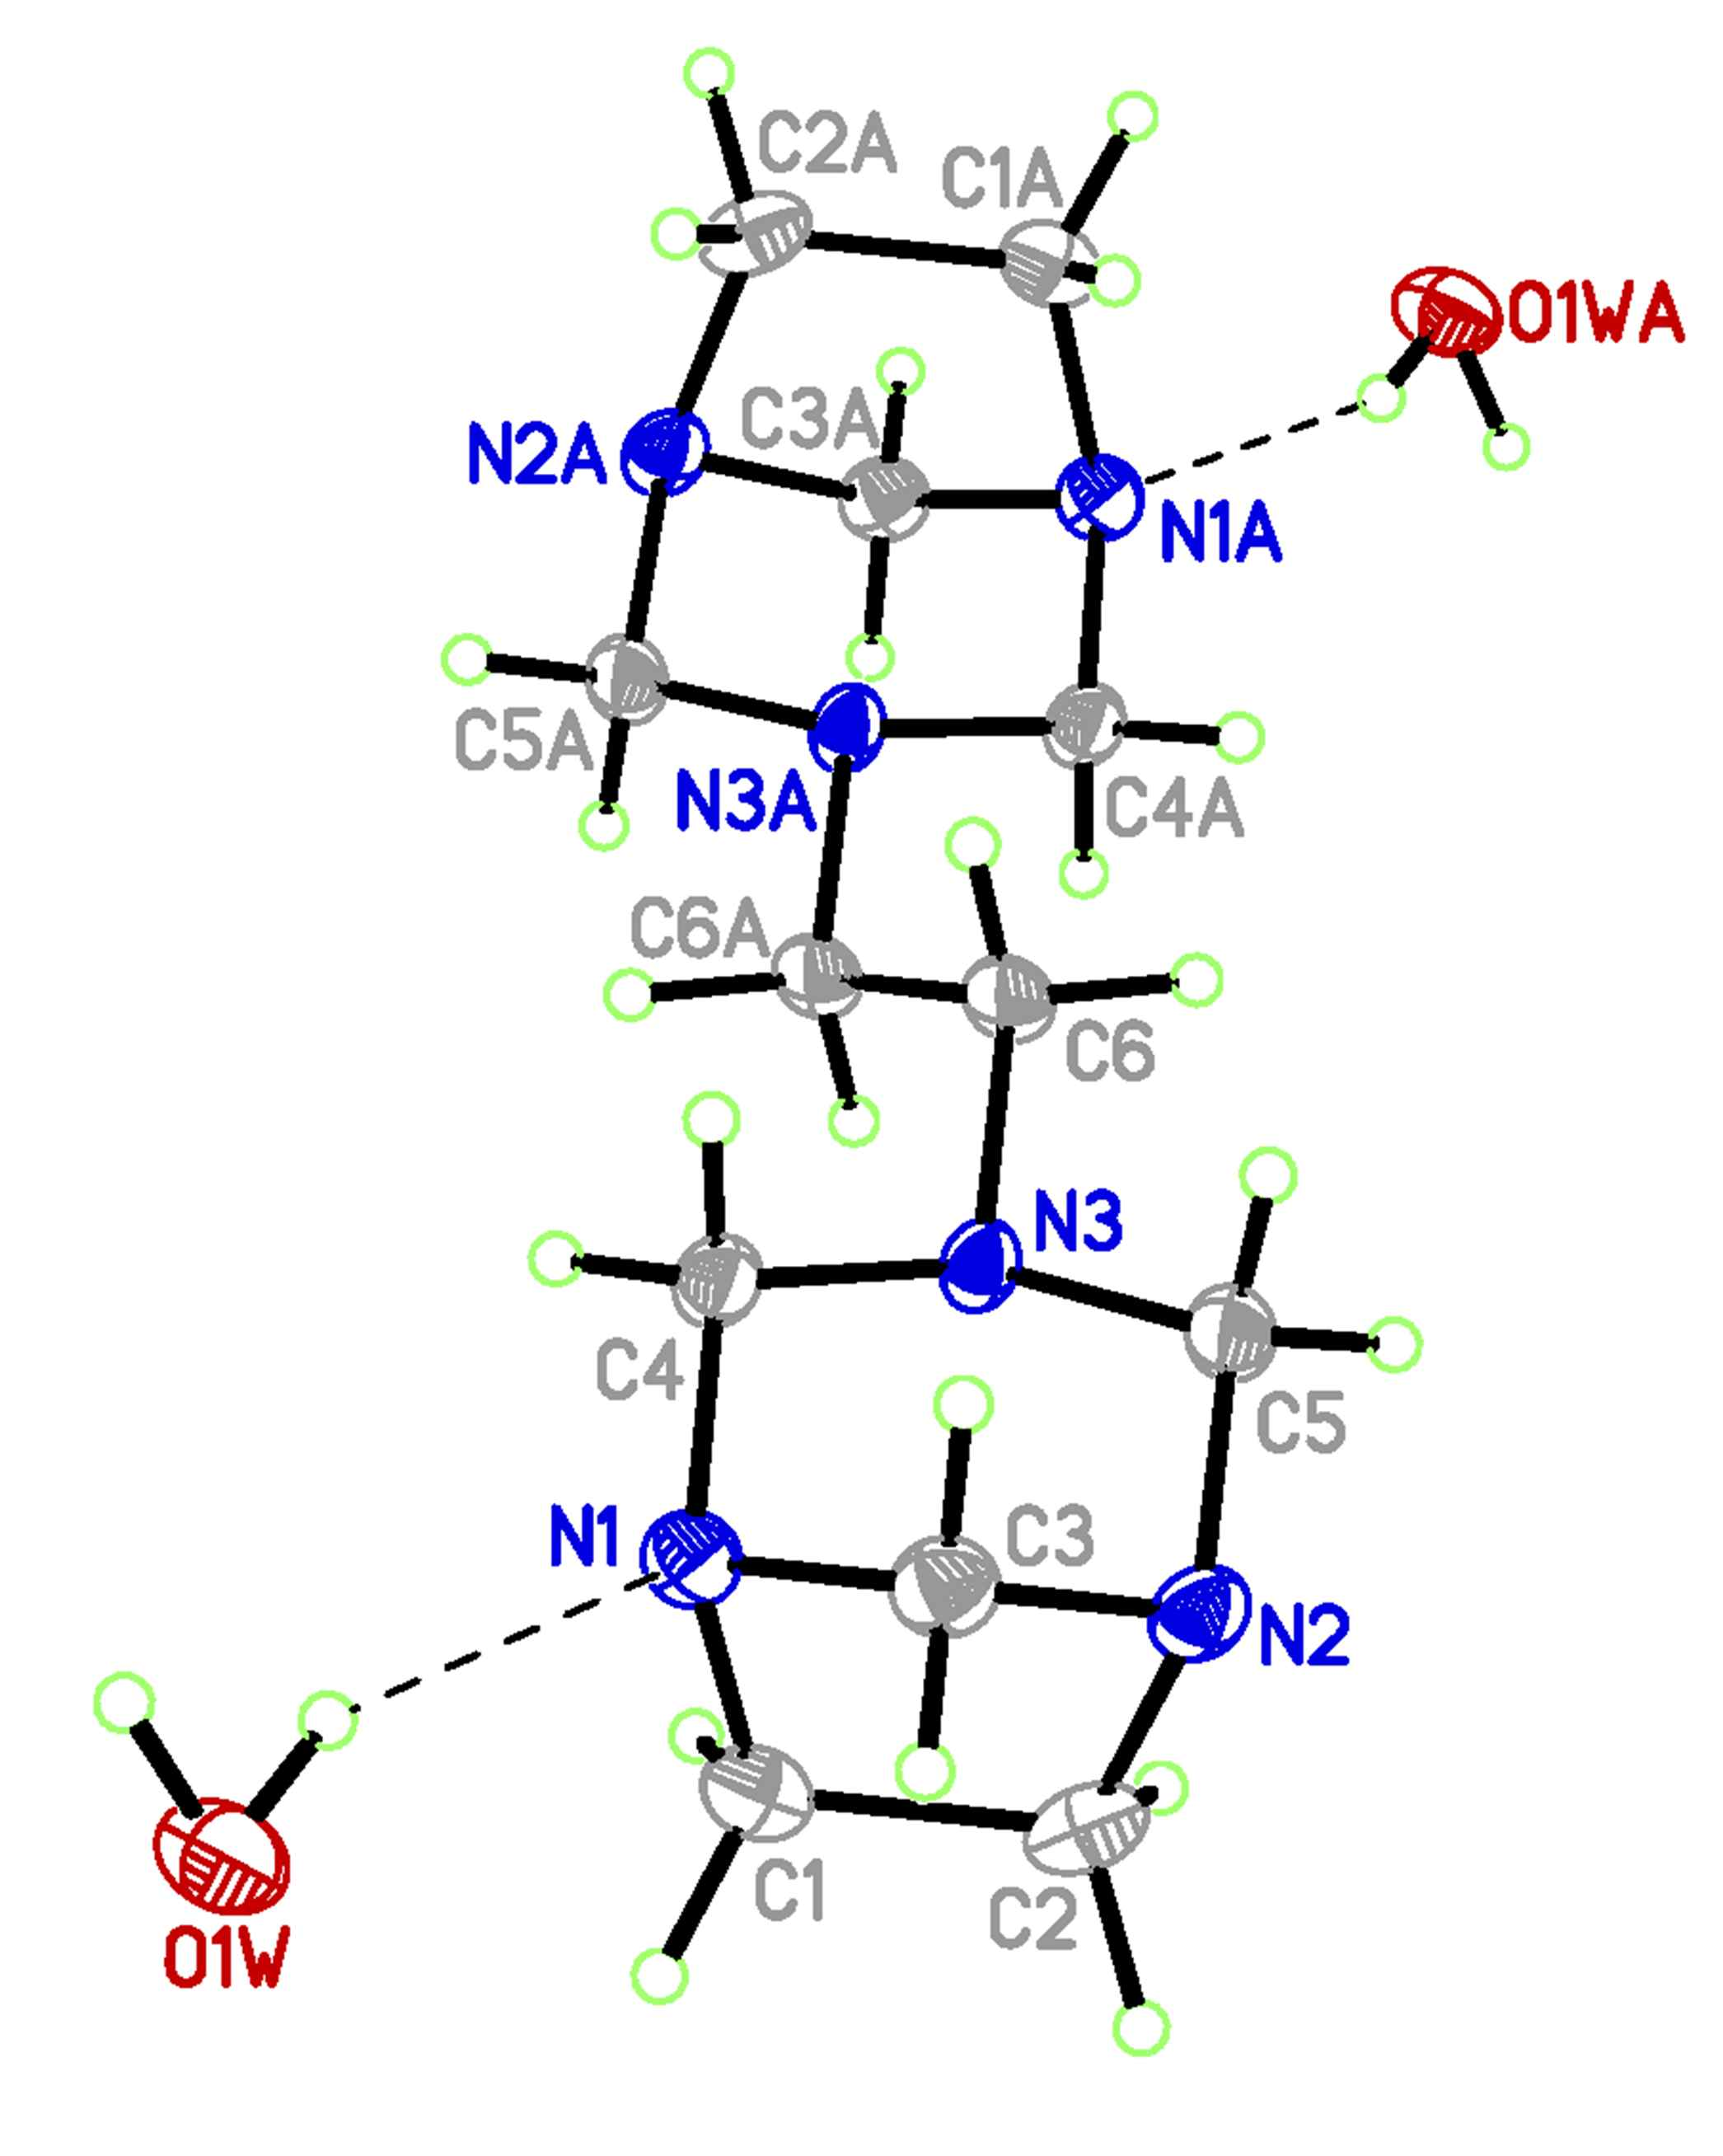
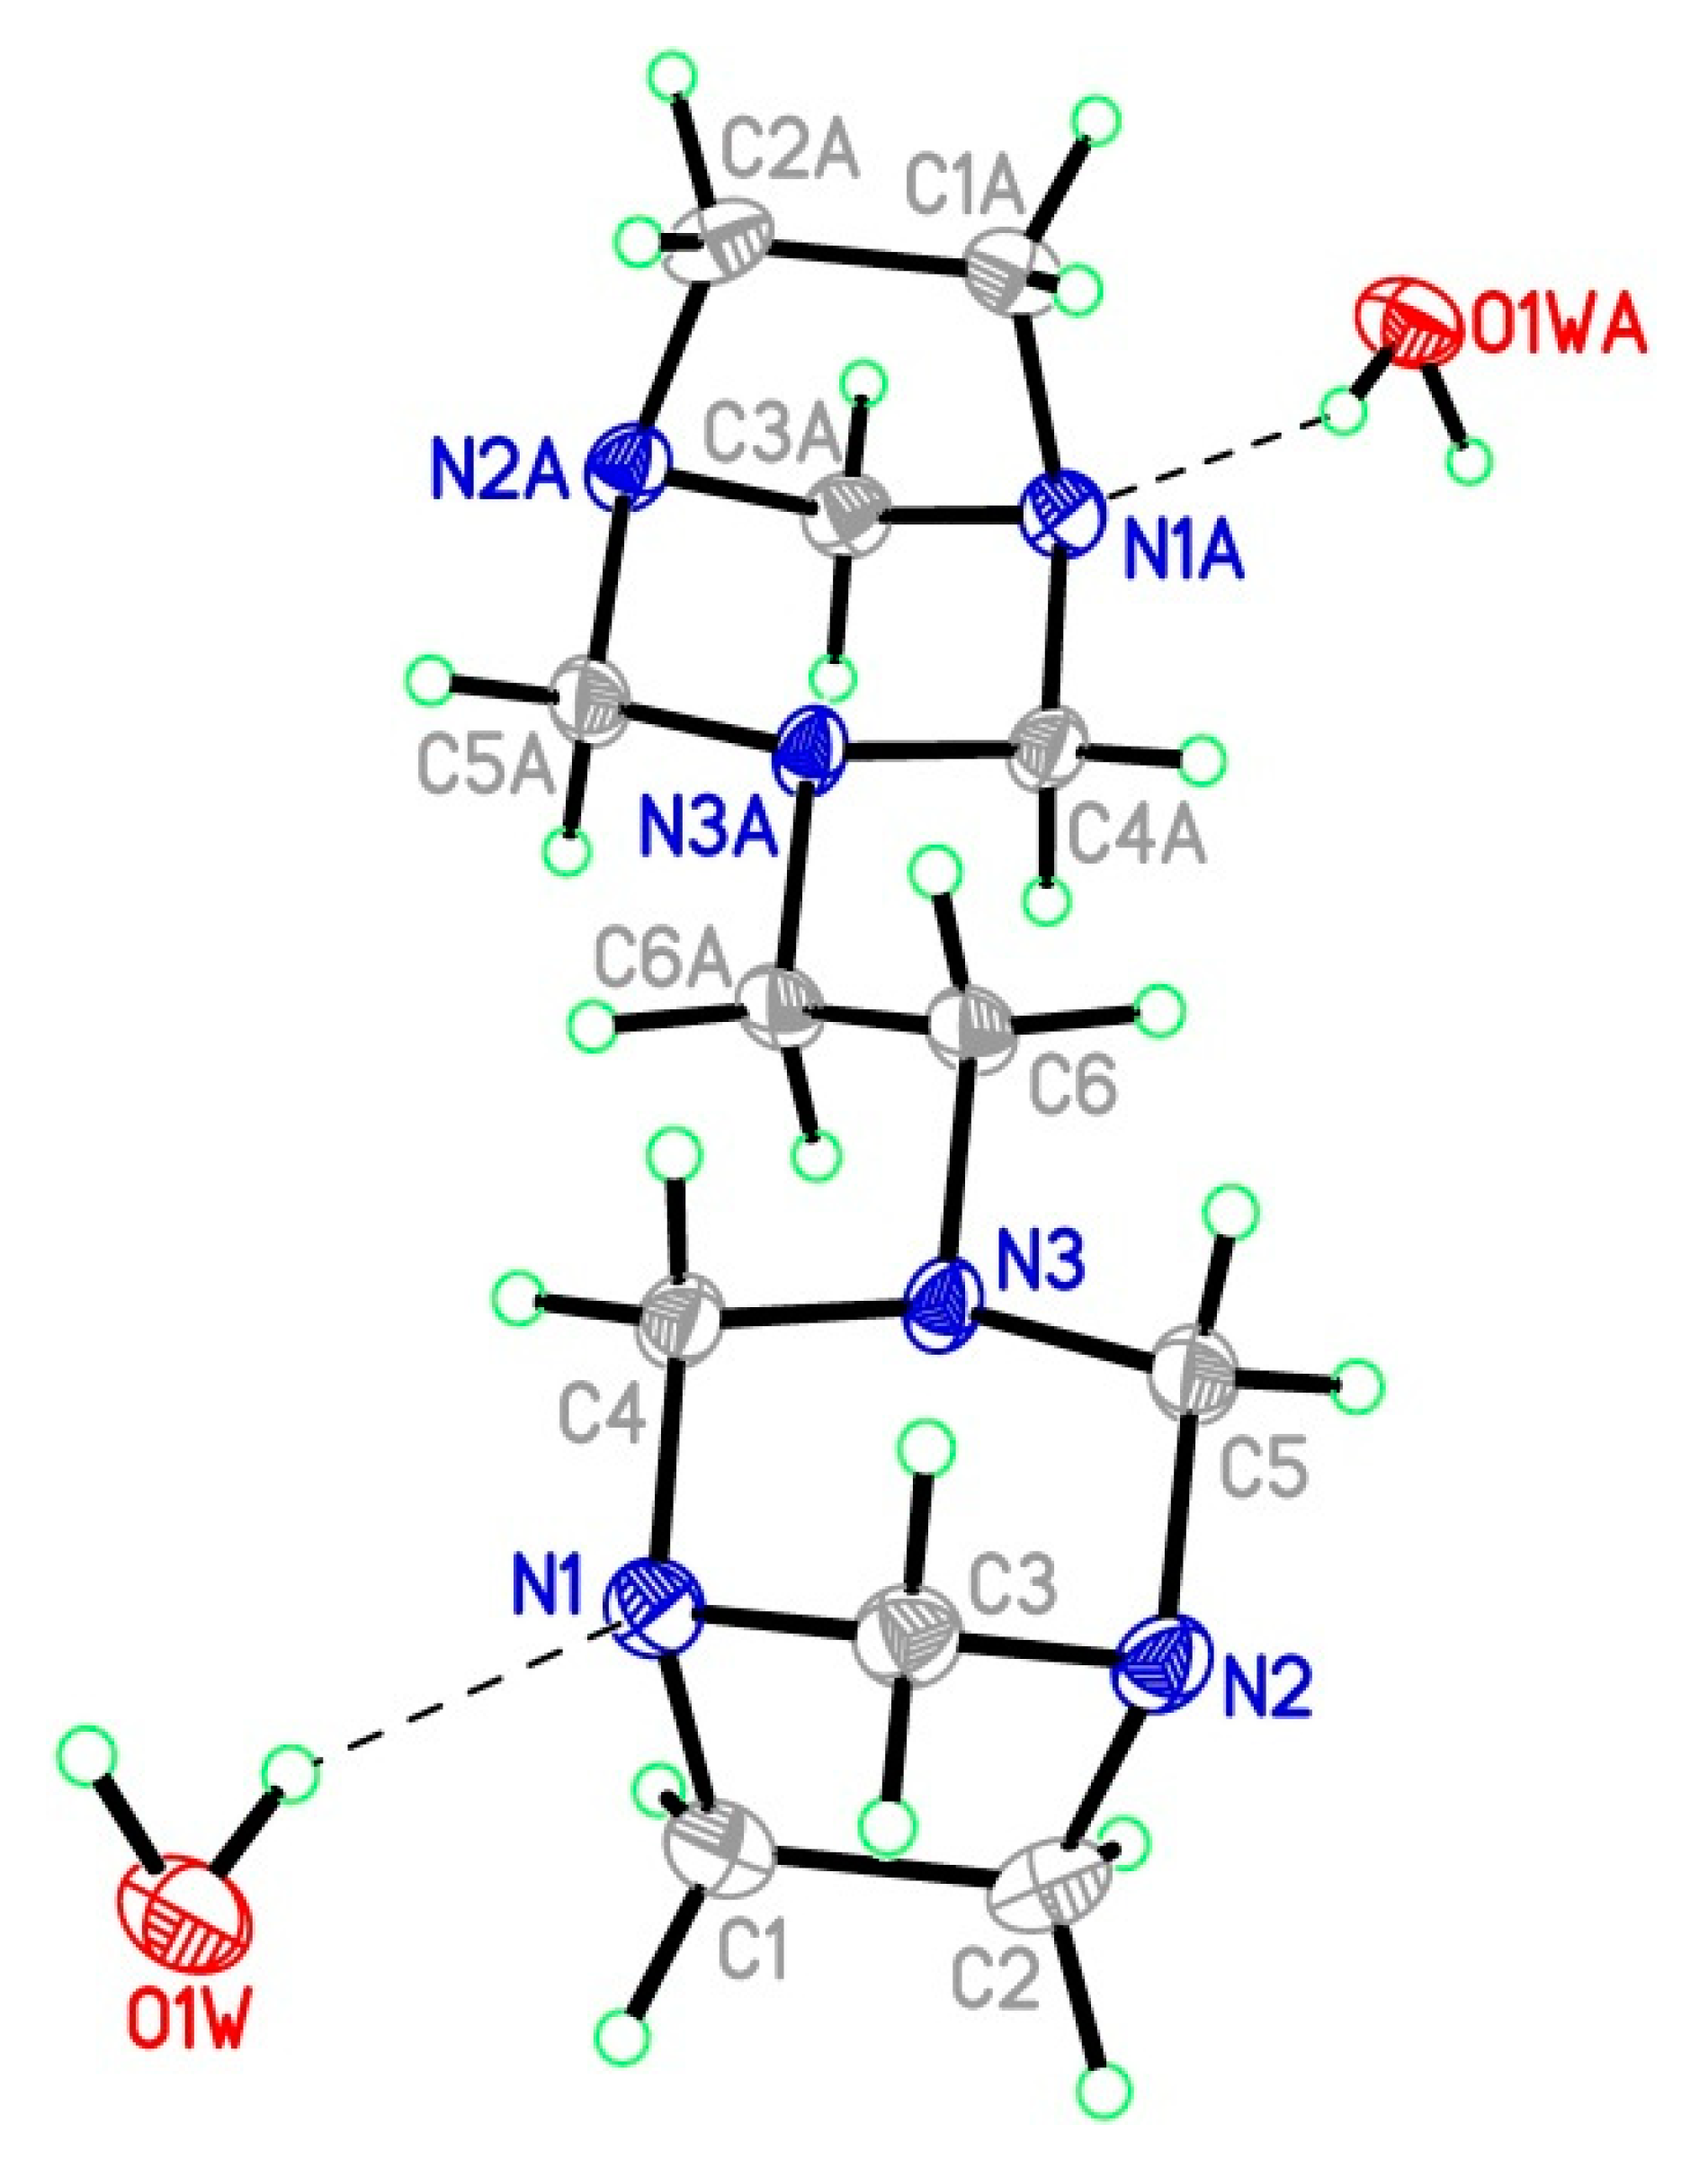
3.3. Single Crystal X-Ray Diffraction

To verify the notion of a rigid Ci symmetric ETABOC structure in the solid state, several attempts to obtain ETABOC crystals suitable for X-ray analysis were performed. XRD experiments were performed on a few crystals obtained by recrystallization from hexane. To this end, we obtained the crystal structure of 3,3′-ethane-1,2-diylbis(1,3,5-triazabicyclo[3.2.1]octane) dihydrate. The asymmetric unit, C12H24N6(H2O)2, is comprised of half a molecule of ETABOC located on a center of symmetry at the midpoint of the central C–C bond and a water molecule. It crystallized in the monoclinic space group P21/n. Figure 6 shows the molecular structure and atomic numbering system. Atoms: N(1), N(2), N(3), C(1), C(2), C(3), C(4), C(5), C(6), O(1W), H(1W), and H(2W) are symmetry-independent, and the remaining atoms can be generated by the symmetry code: −x + 1, −y, −z + 2 (Figure 6). Hereinafter in the text, the numeration of atoms is used according to Figure 6. This numeration of atoms does not correspond to IUPAC nomenclature. Relevant data of selected bond lengths (Å) and angles (°) are summarized in Table 3.
An analysis of the X-ray diffraction data showed that compound 1 adopts a chair conformation and possesses an inversion center, which is consistent with the DFT calculations (Figure 1). The bond angles and distances are within the normal ranges. However, a slight deviation of the angles for all nitrogen atoms is observed, ranging from 100.5 to 111.8°. We note that these values are distorted from the ideal tetrahedral geometry adopted by ammonia (HNH bond angle of 107.5°, ΣC–N–C = 322.5°) [32]. Especially noteworthy is the sum of the C–N–C bond angles involving N-3 (333.5°) compared with the major sp3-hybridized character of N1 and N2 (318.5° and 317.7°, respectively). These data indicate that N-3 has a higher degree of planarity, because of not being in the bridgehead position. Such bond angle variations in structural fragments of the type XCH2Y have been rationalized in terms of the Edgard–Lemieux effect (i.e., the anomeric effect) [33], which affects not only the bond angles but also the X–C and C–Y bond distances. In fact, despite being within normal ranges, the C1–N1 (1.491(5) Å) and C2–N2 (1.488(5) Å) bond distances are slightly longer than the average C–N (1.469 Å) bond distance [34].
The influence of the orientation of the nitrogen lone pair to affect the C–C bond distance of the ethylene group of the ring is also observed. While this influence appears to be negligible for the ethylene bridge C6–C6′ (1.526 Å), the C1–C2 bond is longer than a standard value [35] for CH2–CH2 bonds (1.556 Å versus 1.524 Å, respectively). This phenomenon is caused by the arrangement of the lone pair of electrons on the bridgehead nitrogen atoms.
Given that these bond angle and bond distance distortions can be understood in terms of hyperconjugation and that the degree of delocalization is sensitive to geometry, the calculated geometric parameters using DFT and HF methods were compared with data obtained from the ETABOC crystal structure. The optimized parameters of ETABOC calculated in the gas phase using HF and DFT are listed in Table 3.
The results indicate that the values obtained by DFT are closer to the experimental values compared with those obtained by the HF method. A comparison of the structural data indicates that the major difference observed between the data obtained theoretically and experimentally are the C–N bond lengths. Symmetry considerations make the calculated C4–N3 and C5–N3 bond lengths identical (1.473 Å with B3LYP and 1.459 Å with HF). However, the experimental bond length values are not identical (1.481(4) Å for C4–N3 and 1465(5) Å for C5–N3). Similarly, the C1–N1 and C2–N2 bond lengths are calculated to be 1.483 Å with B3LYP and 1.468 Å with HF, whereas a slight difference between these values is present for the experimentally determined bond lengths.
These data indicate that the C–N and C–C bonds in the ring are involved in the delocalization of the nitrogen lone pairs. These experimental findings must result from hyperconjugation, where the rigid bicyclic structure of ETABOC and the arrangement of nitrogen lone pairs modulate the ability of the antibonding molecular orbital to receive donation from the heteroatom lone pairs. Based on observations with ethylenediamine, in which a stronger interaction energy between nN→σ*C–C compared to the interaction energy nN→σ*C–H has been determined [36], it is expected that these secondary orbital interactions will modify the bond lengths neighboring the lone pairs on the three nitrogen atoms. Thus, a difference is expected in the interaction energies between the N-3 lone pair and the molecular antibonding orbitals of the heteroatom neighboring the C–N and C–H bonds compared with the interactions observed in N-1 and N-2.

3.4. NBO Analysis

Secondary interactions between molecular orbitals can be treated with second-order perturbation theory. Further, the “stabilization energy” of the electronic delocalization (denoted as ΔE) is related to the magnitude of the interaction. To this end, we performed NBO analysis of the ETABOC structure. The decreased energy of the molecular orbitals, which is a product of these interactions, can give rise to a meaningful interpretation of their corresponding geometries. This analysis was performed to include all possible interactions between nitrogen lone pair and acceptors, and second-order perturbation theory was used to estimate the energetic importance of the delocalization.
According to our results (Table 4), the highest interaction energies from the N-1 electron pairs are 9.02, 6.59 and 4.78 kcal/mol and 9.01, 6.55 and 4.75 kcal/mol from the N-2 electron pairs. These interaction energies correspond to conjugation with the antibonding molecular orbitals of the neighboring C–N and C–C bonds (nlp→σ*C–N and nlp→σC–C*). N-3 possesses the largest stabilization energies of 7.54, 7.38, and 7.33 kcal/mol with the bonds σ*C6–H6anti, σ*C5–H5exo, and σ*C4–H4exo, respectively, which shows a clear difference between the charge delocalization on N-3 compared with N-1 and N-2. While the best acceptors for N-1 and N-2 are the neighboring C–N and C–C bonds, the best acceptors for N-3 are the C–H bonds antiperiplanar to its lone pair of electrons. This suggests that hyperconjugation involving the lone pairs on the bridgehead nitrogen atoms with the neighboring C–N and C–C bonds stabilize the bicycle structure and that the conjugation of N-3 with σ*C–Hexo and σ*C6–H6anti define the conformational preference of structure 1, which maintains a center of inversion.

3.5. NMR

One of the most characteristic features of the 1H-NMR spectrum of 1 is the presence of four doublets, with an integral relation of 1:2:2:1. Two of the doublets are assigned to H-4 and H-5exo (3.62 ppm) and H-4 and H-5endo (3.40 ppm, Jgem = 10.7 Hz), and the other two doublets, in which one is low field (3.89 ppm, Jgem = 10.5 Hz) and the other is high field (3.30 ppm, Jgem = 10.5 Hz), are assigned to the diastereotopic hydrogen atoms on the shorter bridge (i.e., H-3syn and H-3anti, respectively) [2]. The difference between the chemical shifts of the endo and exo hydrogen atoms indicates that H4exo and H5exo are arranged anti to N-3. This is consistent with the interaction energy differences found in the NBO analysis presented above for the C–H bonds of the two hydrogen nuclei (Table 4). Despite being attached to the same carbon atom, H6a and H6b are magnetically shielded to varying degrees, and one would expect the shielding effect on H6a resulting from donation of electronic density from N-3 to be greater than that experienced by Hb because of its antiperiplanar arrangement to the lone pair (see Table 4, entry 3).
However, the signal of these exocyclic ethylenic hydrogen atoms in the 1H-NMR spectrum appears as a singlet at 2.17 ppm, which motivated us in our previous work to rule out a Ci symmetric structure. In solution, it is expected that a mixture of ETABOC conformers exists and that the spectrum is comprised of an average of signals from these conformations.
In this case, ETABOC is flexible because of rotations around the exocyclic bonds. The population of conformations is determined by varying the three dihedral angles around N3–C6, C6–C6′, and C6′–N3′, that is, τ1 (N3–C6–C6′–N3′), τ2 (C4–N3–C6–C6′), and τ3 (C6–C6′–N3′–C4′), respectively (Figure 7a). The rotations around these three angles transform the Ci symmetric structure into the other two symmetric conformations described above.
Rotations around the N3–C6 and C6–N3′ bonds allow conversion between the Ci and C2v conformations, and rotation around the C6–C6 bond will give the C2 structure. If ETABOC is flexible in solution, its different conformations can be described in terms of the relative orientations of the C–H bonds with respect to the nitrogen lone pairs, which cause a decrease or increase in nlp→σ*C–H and nlp→σ*C–N transfer. Thus, these various conformations result in a variety of geometric and electronic properties of the molecule in solution. To evaluate the solution phase preference of the Ci conformation, a 360° scan of dihedral angle τ1 was performed starting from the previously optimized geometry for structure 5 (Figure 7b). It was found that the highest energy conformation was the syn conformer (6, 13.8 kcal mol−1), which correlates with electronic repulsion between the lone pairs of electrons on the two nitrogen atoms. For the conversion between the C2V and C2 conformations, our calculations suggest that the relative energy of the syn conformation (7) is 9.0 kcal mol−1 higher in energy (Figure 7c).
Hence, although it is possible to determine a conformational equilibrium between solution phase structures that maintain an inversion center and a C2 axis, this equilibrium does not proceed through a complete rotation of the C6–C6′ bond. Consequently, a C2 conformation is unlikely to exist in solution. Given the spatial arrangement between the N-3 and N-3′ lone pairs and the contraction of the N···N contact (2.619 Å), this conformation should, in principle, be the highest energy conformer because, in addition to steric interactions, the repulsion between the lone pairs is high. This repulsive interaction must change the electronic structure, thus having an effect on the chemical shift tensors.
Based on the above results, we decided to make a comparison of the experimental NMR spectrum with the calculated values for the three symmetric conformations of ETABOC using the Gauge-Including Atomic Orbital method (GIAO), which is the most effective tool for calculating chemical shifts. Table 5 presents chemical shift data calculated relative to TMS for the C2, Ci, and C2V conformations compared with the experimental values.
As seen in Table 5, the values obtained for the chemical shifts of 13C in the three structures are very similar to the experimental values, with only slight deviations for the C2 conformer. In contrast, for the values obtained for the displacement of hydrogen, the correlations show a strong difference between the values obtained for the C2 conformer with those determined for the other two structures. It is evident that this level of theory for H-2 and H-1 endo on the C2 conformer gives the largest deviations. In this case, the arrangement of these hydrogen atoms, which are forced to be closer to other hydrogen atoms and towards the N-3 and N-3′ lone pairs, experience an anisotropic effect because of the nitrogen electron pairs and steric compression. Collectively, these phenomena move this signal to low field, giving a value of δcalc that is almost twice the experimental value. Based on these results, it is clear that free rotation could be observed in solution to give interconversion between the Ci and C2v structures. However, rotation about the central C6–C6′ bond is restricted and prevents such conformations because the steric hindrance and lone pair–lone pair interactions are stronger.
In conclusion, these results demonstrate that, in the solid state 3,3′-ethane-1,2-diyl-bis-1,3,5- triazabicyclo[3.2.1]octane (ETABOC) adopts a conformation with a chair conformation which possesses an inversion center (Ci). This conformation favors the operation of the hyperconjugation of the nitrogen lone pair with a major number of the C–H bonds adjacent.

Author Contributions

A.R. conceived and designed the experiments; J.M.U. performed the experiments; M.B. collected X-ray data and solved the X-ray structure; A.R. and J.R.-M. wrote the paper.

Acknowledgments

We acknowledge the Dirección de Investigaciones, Sede Bogotá (DIB) de la Universidad Nacional de Colombia, for financial support of this work (Grant No. 35816). Juan Manuel Uribe thanks COLCIENCIAS for a fellowship.

Conflicts of Interest

The authors declare no conflict of interest.

References

  1. Böhme, H. α-Halogenierte anzine und ihre umsetzungen. Angew. Chem. 1956, 68, 33–34. [Google Scholar] [CrossRef]
  2. Rivera, A.; Ríos-Motta, J. An unusual product obtained from condensation between ethylenediamine and formaldehyde in basic medium. Tetrahedron Lett. 2005, 46, 5001–5004. [Google Scholar] [CrossRef]
  3. Hamlow, H.P.; Okuda, S.; Nakagawa, N. NMR effects of cyclic tertiary amines. Tetrahedron Lett. 1964, 5, 2553–2559. [Google Scholar] [CrossRef]
  4. Gogoll, A.; Grennberg, H.; Axén, A. Chemical shift assignment of geminal protons in 3,7-diazabicyclo[3.3.1]nonanes: An unexpected deviation from the axial/equatorial chemical shift order. Magn. Reson. Chem. 1997, 35, 13–20. [Google Scholar] [CrossRef]
  5. Pandiarajan, K.; Manimekalai, A.; Rajarajan, G. 1H NMR spectral study of some 4-hydroxy-2,6-diphenylpiperidines and a systematic analysis of 1H chemical shifts in some piperidines and 3,7-diazabicyclo[3.3.1]nonane derivatives. Indian J. Chem. B 2000, 398, 517–524. [Google Scholar] [CrossRef]
  6. Albright, T.A.; Burdett, J.K.; Whangbo, M.H. Orbital Interactions through space and through bonds. In Orbital Interactions in Chemistry, 2nd ed.; John Wiley & Sons, Inc.: Hoboken, NJ, USA, 2013. [Google Scholar] [CrossRef]
  7. Zwier, J.M.; Brouwer, A.M.; Keszthelyi, T.; Balakrishnan, G.; Offersgaard, J.F.; Wilbrandt, R.; Barbosa, F.; Buser, U.; Amaudrut, J.; Gescheidt, G.; et al. Electron delocalization in the radical cation of 1,3,6,8-tetraazatricyclo[4.4.1.13,8]dodecane, a 4-nitrogen-7-electron system. J. Am. Chem. Soc. 2002, 124, 159–167. [Google Scholar] [CrossRef] [PubMed]
  8. Brodskaya, E.I.; Ratovskii, G.V.; Voronkov, M.G. Orbital interactions through space and through σ-bonds. Russ. Chem. Rev. 1993, 62, 919–933. [Google Scholar] [CrossRef]
  9. Hoffmann, R. Interaction of orbitals through space and through bonds. Acc. Chem. Res. 1971, 4, 1–9. [Google Scholar] [CrossRef]
  10. Jiang, L.; Orimoto, Y.; Aoki, Y. Stereoelectronic effects in Menshutkin-type SN2 reactions: Theoretical study based on through-space/bond orbital interaction analysis. J. Phys. Org. Chem. 2013, 26, 885–891. [Google Scholar] [CrossRef]
  11. Ohno, K.; Ishida, T.; Naitoh, Y.; Izumi, Y. Study of stereochemical properties of molecular orbitals by Penning ionization electron spectroscopy. Effects of through-space/through-bond interactions on electron distributions. J. Am. Chem. Soc. 1985, 107, 8082–8086. [Google Scholar] [CrossRef]
  12. Werstiuk, N.H.; Butler, D.N.; Datta, S. A study of lone-pair interactions of tetracyclic diamines by ultraviolet photoelectron spectroscopy. Can. J. Chem. 1986, 64, 760–763. [Google Scholar] [CrossRef] [Green Version]
  13. Heilbronner, E.; Muszkat, K.A. Applications of photoelectron spectroscopy. X. Relative importance of through-space vs. through-bond interaction between the lone pairs in 1,4-diazabicyclo[2.2.2]octane. J. Am. Chem. Soc. 1970, 92, 3818–3821. [Google Scholar] [CrossRef]
  14. Stoe & Cie. X-Area Diffractometer Control Software; Stoe & Cie: Darmstadt, Germany, 2001. [Google Scholar]
  15. Sheldrick, G.M. Crystal structure refinement with SHELXL. Acta Cryst. C 2015, 71, 3–8. [Google Scholar] [CrossRef] [PubMed]
  16. Spek, A.L. Structure validation in chemical crystallography. Acta Crystallogr. 2009, 65, 148–155. [Google Scholar] [CrossRef] [PubMed] [Green Version]
  17. Frisch, M.J.; Trucks, G.W.; Schlegel, H.B.; Scuseria, G.E.; Robb, M.A.; Cheeseman, J.R.; Montgomery, J.A.; Vreven, T., Jr.; Kudin, K.N.; Burant, J.C.; et al. Gaussian 03; Gaussian, Inc.: Pittsburgh, PA, USA, 2003. [Google Scholar]
  18. Becke, A.D. Density-functional exchange-energy approximation with correct asymptotic behavior. Phys. Rev. A 1988, 38, 3098–3100. [Google Scholar] [CrossRef]
  19. Becke, A.D. Density-functional thermochemistry. III. The role of exact exchange. J. Chem. Phys. 1993, 98, 5648–5652. [Google Scholar] [CrossRef]
  20. Lee, C.; Yang, W.; Parr, R.G. Development of the Colle-Salvetti correlation-energy formula into a functional of the electron density. Phys. Rev. B 1988, 37, 785–789. [Google Scholar] [CrossRef]
  21. Glendening, E.D.; Reed, A.E.; Carpenter, J.E.; Weinhold, F. NBO Version 3.1; Tcl University of Wisconsin: Madison, WI, USA, 1998. [Google Scholar]
  22. Ditchfield, R. Molecular orbital theory of magnetic shielding and magnetic susceptibility. J. Chem. Phys. 1972, 56, 5688–5691. [Google Scholar] [CrossRef]
  23. Wolinski, K.; Hinton, J.F.; Pulay, P. Efficient implementation of the gauge-independent atomic orbital method for NMR chemical shift calculations. J. Am. Chem. Soc. 1990, 112, 8251–8260. [Google Scholar] [CrossRef]
  24. Kolmer, A.; Edwards, L.J.; Kuprov, I.; Thiele, C.M. Conformational analysis of small organic molecules using NOE and RDC data: A discussion of strychnine and α-methylene-γ-butyrolactone. J. Magn. Reson. 2015, 261, 101–109. [Google Scholar] [CrossRef] [PubMed]
  25. Neuhaus, D.; Williamson, M.P. The Nuclear Overhauser Effect in Structural and Conformational Analysis, 2nd ed.; John Wiley & Sons, Inc.: New York, NY, USA, 2000. [Google Scholar]
  26. Kwan, E.E.; Huang, S.G. Structural elucidation with NMR spectroscopy: Practical strategies for organic chemists. Eur. J. Org. Chem. 2008, 2008, 2671–2688. [Google Scholar] [CrossRef]
  27. Gribble, W.G.; Nelson, R.B. Conformational requirements for the existence of Bohlmann bands in the infrared spectra of indolo[2,3-a]quinolizidines. I. Cis- and trans-2-tert-butyl derivatives. J. Org. Chem. 1973, 38, 2831–2864. [Google Scholar] [CrossRef]
  28. Nasipuri, D. Stereochemistry of Organic Compounds: Principles and Applications; John Wiley & Sons: New York, NY, USA, 1991. [Google Scholar]
  29. Jeyaraman, R.; Ravindran, T.; Sujatha, M.; Venkatraj, M. Lowering of Bohlmann band intensities in conformationally homogeneous 2,6-diarylpiperidines due to ring distortion. Indian J. Chem. B 1999, 38, 52–55. [Google Scholar] [CrossRef]
  30. Bertrand, B.; Nisole, C.; Drancourt, J.M.; Dubuffet, T.; Bouchet, J.P.; Volland, J.P. Determination of cis and trans configurations in pentahydrobenzopyranopyrroles by FT-IR spectroscopy. Spectrochim. Acta A 1996, 52, 1921–1923. [Google Scholar] [CrossRef]
  31. Garraffo, H.M.; Simon, L.D.; Daly, J.W.; Spande, T.F.; Jones, T.H. Cis- and trans-configurations of α,α′-disubstituted piperidines and pyrrolidines by GC-FTIR; application to decahydroquinoline stereochemistry. Tetrahedron 1994, 50, 11329–11338. [Google Scholar] [CrossRef]
  32. Wolfe, S.; Schlegel, H.B.; Whangbo, M.H.; Bernardi, F. On the origin of the Bohlmann bands. Can. J. Chem. 1974, 52, 3787–3792. [Google Scholar] [CrossRef]
  33. Demaison, J.; Margulès, L.; Boggs, J.E. The equilibrium N–H bond length. Chem. Phys. 2000, 260, 65–81. [Google Scholar] [CrossRef]
  34. Pinto, B.M.; Schlegel, H.B.; Wolfe, S. Bond angle variations in XCY fragments and their relationship to the anomeric effect. Can. J. Chem. 1987, 65, 1658–1662. [Google Scholar] [CrossRef] [Green Version]
  35. Allen, F.H.; Kennard, O.; Watson, D.G.; Brammer, L.; Orpen, A.G.; Taylor, R. Tables of bond lengths determined by X-ray and neutron diffraction. Part 1. Bond lengths in organic compounds. J. Chem. Soc. Perkin Trans. 2 1987, 12, S1–S19. [Google Scholar] [CrossRef]
  36. Alabugin, I.V.; Zeidan, T.A. Stereoelectronic effects and general trends in hyperconjugative acceptor ability of σ bonds. J. Am. Chem. Soc. 2002, 124, 3175–3185. [Google Scholar] [CrossRef] [PubMed]
Figure 1. The optimized structures of exo (4) and endo (5) arrangement for ETABOC at B3LYP/6-31G(d,p) level.
Crystals 08 00251 g001
Figure 2. FT-IR spectrum of ETABOC.
Crystals 08 00251 g002
Figure 3. Newman projections of Ci, C2V and C2 conformations of ETABOC.
Crystals 08 00251 g003
Figure 4. Calculated FT-IR spectra of: (a) Ci conformer, (b) C2v conformer, and (c) C2 conformer at the B3LYP/6-31G(d,p) level of theory.
Crystals 08 00251 g004
Figure 5. Experimental and calculated Bolhmann bands for ETABOC (Ci conformer).
Crystals 08 00251 g005
Figure 6. The molecular structure of ETABOC dihydrate. Displacement ellipsoids are drawn at the 50% probability level. Hydrogen bonds are drawn as dashed lines. Atoms labeled with the suffix A are generated using the symmetry operator −x + 1, −y, −z + 2.
Crystals 08 00251 g006
Figure 7. (a) Dihedral angles around N3–C6, C6–C6′ and C6′–N3′ (b) B3LYP/6-31G(d,p) potential energy surface scan of the N3–C6–C6′–N3′dihedral angle of Ci conformer, (c) B3LYP/6-31G(d,p) potential energy surface scan of the N3–C6–C6′–N3′dihedral angle of C2v conformer.
Crystals 08 00251 g007
Table 1. Crystal data and structure refinement for ETABOC dihydrate.
Compound
CCDC No.1522802
Empirical formulaC12H28N6O2
Formula weight288.40
Temperature173(2) K
Crystal systemmonoclinic
Space groupP21/n
Unit cell dimensionsa = 5.8765(9) Å, α = 90°
b = 6.9967(10) Å, β = 95.642(14)°
c = 18.240(3) Å, γ = 90°
Volume746.3(2) Å3
Z2
Calculated density1.283 g/cm3
Absorption coefficient0.091 mm−1
F(000)316
Crystal size mm30.17 × 0.14 × 0.06
θmin/θmax/°3.554/25.608
Limiting indices−7 ≤ h ≤ 7, −8 ≤ k ≤ 8, −22 ≤ l ≤ 22
Reflections collected5748
Independent reflections1396 [R(int) = 0.0725]
Refinement methodFull-matrix least-squares on F2
Data/restraints/parameters1396/0/101
Goodness of fit on F21.250
R1/wR2[I > 2σ(I)]0.0830/0.1700
R1/wR2(all data)0.1007/0.1750
Largest diff. peak and hole/e.Å−10.244/−0.300
Table 2. Calculated relative energies (∆E, kcal/mol) and torsion angles (degrees, torsional angles: ϕ1(N3–C9–C10–N11), ϕ2(C2–N1–C9–C10), ϕ3(C4–N1–C9–C10), ϕ4(C12–N11–C10–C9) and ϕ5(C17–N11–C10–C9)).
∆E, kcal/molϕ1ϕ2ϕ3ϕ4ϕ5
415.9180.0−153.7971.72−71.72153.79
50.0−180.0161.70−74.3574.35−161.68
Table 3. Selected bond length (Å) and angles (°) for ETABOC dihydrate.
Parameter aExp. bTheor. cTheor. d
N(1)-C(1)1.491(5)1.4831.468
N(1)-C(3)1.474(5)1.4741.456
N(1)-C(4)1.462(5)1.4651.451
N(2)-C(2)1.488(5)1.4831.468
N(2)-C(3)1.471(5)1.4741.456
N(2)-C(5)1.477(5)1.4641.450
N(3)-C(4)1.481(4)1.4731.459
N(3)-C(5)1.465(5)1.4731.459
N(3)-C(6)1.463(5)1.4591.450
C(1)-C(2)1.556(6)1.5741.561
C(6)-C(6)#11.526(7)1.5371.529
C(3)-N(1)-C(1)100.9(3)100.8101.2
C(4)-N(1)-C(1)110.2(3)110.8111.2
C(4)-N(1)-C(3)107.4(3)107.5108.0
C(3)-N(2)-C(2)100.5(3)100.8101.2
C(5)-N(2)-C(2)110.1(3)110.9111.2
C(3)-N(2)-C(5)107.1(3)107.3107.9
C(5)-N(3)-C(4)110.3(3)110.9111.9
C(6)-N(3)-C(4)111.8(3)114.2114.3
C(6)-N(3)-C(5)111.4(3)112.8113.2
a Symmetry transformations used to generate equivalent atoms: #1 −x + 1, −y, −z + 2; b X-ray data; c DFT/6-31G(d,p) data; d HF/6-31G(d,p) data.
Table 4. Selected second-order perturbation energy (E(2) kcal/mol) with values greater than 1 kcal/mol associated with electronic delocalization between nitrogen lone pairs (i) and acceptors (j) of ETABOC calculated at the B3LYP/6-311G(d,p) level of theory.
EntryDonor (i)TypeAcceptor (j)TypeE2(kcal/mol)
1N(1)lpC4–N3σ*9.02
C3–N26.59
C1–C24.78
C1–H1exo3.17
C3–H3anti1.79
C4–H4endo1.55
C4–H4exo0.97
2N(2)lpC5–N3σ*9.01
C3–N16.55
C1–C24.75
C2–H2exo3.19
C3–H3anti1.79
C5–H5endo1.58
3N(3)lpC6–H6aσ*7.54
C5–H5exo7.38
C4–H4exo7.33
C5–H5endo2.07
C4–H4endo2.05
C6–C6′2.05
C5–N21.15
C4–N11.13
Table 5. Calculated 13C and 1H NMR chemical shifts (ppm) values of the symmetrical conformations and experimental values of ETABOC.
CiC2vC2Exp.
C-477.578.879.576.5
C-580.380.080.776.5
C-254.554.959.351.9
C-154.854.859.051.9
C-378.578.178.376.6
C-652.354.049.348.5
C-4′77.778.979.676.5
C-5′80.379.880.576.5
C-2′54.654.859.251.9
C-1′55.054.959.151.9
C-3′78.578.178.376.6
C-6′53.453.849.448.5
H-4endo3.683.483.723.62
H-4exo3.293.503.703.40
H-5endo3.453.463.683.62
H-5exo3.463.493.693.40
H-2endo3.093.095.783.17
H-2exo2.732.642.932.79
H-1endo3.043.095.723.17
H-1exo2.712.632.922.79
H-3syn3.653.663.683.89
H-3anti3.263.253.273.30
H-6a1.961.691.742.17
H-6b1.991.951.962.17

