Article

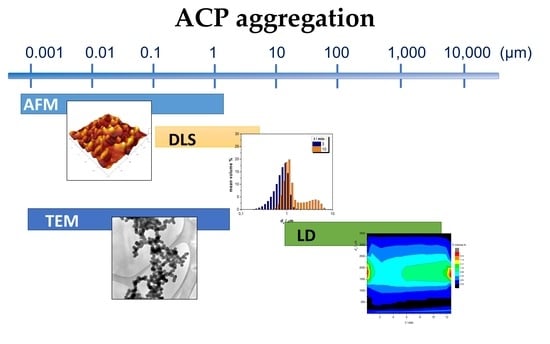
Amorphous Calcium Phosphate Formation and Aggregation Process Revealed by Light Scattering Techniques

1
Division of Physical Chemistry, Ruđer Bošković Institute, Bijenička cesta 54, 10000 Zagreb, Croatia
2
Center for Marine Research, Ruđer Bošković Institute, Giordano Pagliaga 5, 5210 Rovinj, Croatia
3
Division of Materials Chemistry, Ruđer Bošković Institute, Bijenička cesta 54, 10000 Zagreb, Croatia
*
Author to whom correspondence should be addressed.
Crystals 2018, 8(6), 254; https://doi.org/10.3390/cryst8060254
Submission received: 30 May 2018 / Revised: 8 June 2018 / Accepted: 15 June 2018 / Published: 17 June 2018
(This article belongs to the Special Issue Biomimetic Growth of Calcium Phosphate Crystals)

Abstract

:
Amorphous calcium phosphate (ACP) attracts attention as a precursor of crystalline calcium phosphates (CaPs) formation in vitro and in vivo as well as due to its excellent biological properties. Its formation can be considered to be an aggregation process. Although aggregation of ACP is of interest for both gaining a fundamental understanding of biominerals formation and in the synthesis of novel materials, it has still not been investigated in detail. In this work, the ACP aggregation was followed by two widely applied techniques suitable for following nanoparticles aggregation in general: dynamic light scattering (DLS) and laser diffraction (LD). In addition, the ACP formation was followed by potentiometric measurements and formed precipitates were characterized by Fourier transform infrared spectroscopy (FTIR), powder X-ray diffraction (PXRD), transmission electron microscopy (TEM), and atomic force microscopy (AFM). The results showed that aggregation of ACP particles is a process which from the earliest stages simultaneously takes place at wide length scales, from nanometers to micrometers, leading to a highly polydisperse precipitation system, with polydispersity and vol. % of larger aggregates increasing with concentration. Obtained results provide insight into developing a way of regulating ACP and consequently CaP formation by controlling aggregation on the scale of interest.

Graphical Abstract

1. Introduction

Biomineralization, the process of hard tissue formation in living organisms, continues to be a source of inspiration for materials scientists. The inspiration derives from the fact that biominerals have excellent properties, which to a great degree are still not matched by any man-made materials. In addition, they are formed in an economical way at low temperatures and pressures, thereby inspiring novel routes of green synthesis [1]. The picture that has emerged in recent years is that the superior properties of biological materials could be a consequence of them being amorphous or formed by amorphous mediated crystallization [2]. Indeed, it is estimated that one fifth of all known biominerals are amorphous (materials with no discernible X-ray diffraction) [3]. Among them, amorphous calcium phosphate (ACP) attracts special attention as it is a precursor in the formation of vertebrates’ hard tissue [3,4,5,6,7,8].
In 1965, Posner and his colleagues proposed that ACP is the first solid phase formed during calcium phosphates (CaP) precipitation at conditions close to physiological [9,10], which led to the generally accepted opinion that ACP may have a similar precursor role in hard tissue formation in organisms. The search for ACP in vivo was spurred by Olstza and Gower’s study [11], showing that in vitro, amorphous liquid-phase mineral precursors facilitate intrafibrillar mineralization of type-I collagen. Mahamid et al. [4] were first to identify ACP as the transient phase that acts as a precursor during the development of zebrafish fin rays. Later, ACP was also found in the caudal fin bone of larval zebra fish [5], enamel [6], trabecular bone [7], and during secondary ossification of mouse femur in the surroundings of hypertrophic chondrocyte [8].
Posner also proposed that the basic structural unit of ACP is a spherical cluster Ca9(PO4)6, later named Posner’s cluster [12]. The model of Posner’s clusters was readily accepted, but their existence under different experimental conditions was proven only recently [13,14,15,16,17,18,19,20]. However, it should be noted that the similarity in sizes between prenucleation clusters (PNCs) detected in different systems and Posner’s cluster does not mean that they are chemically and structurally identical [15]. Formation of ACP can be considered to be an aggregation process [19,21,22]. A large number of Posner’s clusters aggregate into spherical particles, typically with diameter of 30 nm and 100 nm, which subsequently aggregate in chain-like aggregates. In contact with mother liquor, depending on experimental conditions, ACP readily transforms to more stable crystalline phases: octacalcium phosphate [OCP, Ca8(HPO4)2(PO4)4·5H2O], calcium-deficient apatite [CDHA, Ca10−x(HPO4)x(PO4)6−x(OH)2−x, 0 < x < 1], and/or hydroxyapatite [HAP, Ca10(PO4)6(OH)2] [23,24,25,26,27].
The aggregation state of ACP is among the key factors determining its further transformation [2,28,29]. Compared to aggregation of nanoparticles, aggregation of ACP is a more complex process that proceeds simultaneously at significantly different length scales. A method widely used for following the aggregation of nanoparticles is dynamic light scattering (DLS), due to the fact that representative statistics can be obtained since the number of particles analyzed is much larger than that observed by microscopy techniques [30,31,32]. However, the drawback of DLS is that the intensity of light scattered from the particles is proportional to the sixth power of the particle radius. Therefore, the contribution of larger particles can be overestimated or the signal of smaller particles can be masked.
Several studies [22,32,33,34,35] investigated ACP formation by DLS. The influence of osteopontin [32] and polyaspartic acid (pAsp) [33] on ACP aggregation was also investigated by DLS. The results have shown a steady increase in ACP particles’ Z-average or rh values with time and large scattering of measured values. However, only in the studies by Wang et al. [35] and Habraken et al. [22] was it shown that populations of particles with different sizes existed.
The aim of this study was to gain more insight into ACP aggregation processes with the application of DLS and for the first time, to the best of our knowledge, of laser diffraction particle size measurement (LD), techniques that enable the aggregation of particles from nano- to micrometer scales to be followed. According to our previous studies, two systems of different initial reactant supersaturations were chosen, which were assumed to be optimal for both ACP precipitation and DLS and LD measurements [36,37]. In addition, two modes of stirring were employed, specifically no stirring for DLS measurements and mechanical stirring for LD measurements.

2. Materials and Methods

Analytical grade chemicals, calcium chloride dihydrate (CaCl2·2H2O) and sodium hydrogenphosphate (Na2HPO4) were obtained from Sigma Aldrich (Darmstadt, Germany), while hydrochloric acid (HCl) was obtained from Kemika (Zagreb, Croatia).
CaCl2·2H2O and Na2HPO4 stock solutions were prepared by weighing chemicals which were dried overnight in a desiccator over silica gel. The pH of sodium hydrogenphosphate stock solution was adjusted to 7.4 by using HCl.

2.1. Preparation of Precipitation Systems

Two precipitation systems with different initial reactant concentrations were investigated: system A with c(CaCl2·2H2O) = c(Na2HPO4) = 3.5 mmol dm−3 and system B with c(CaCl2·2H2O) = c(Na2HPO4) = 4 mmol dm−3. In both systems initial pH was 7.4. Precipitation systems were prepared by fast mixing of equal volumes of equimolar CaCl2 (cationic) and Na2HPO4 (anionic) solutions. Reactant solutions were diluted from the respective stock solutions, and the pH of anionic solutions was readjusted if necessary.
For DLS measurements, an aliquot of 1 mL was taken immediately after mixing and transferred to the measuring cuvette. In a second aliquot, precipitation was followed by continuously monitoring pH changes (Methrom 701 pH/ion meter). For LD measurements, the precipitation system was prepared directly in a wet dispersion unit and mechanically stirred. The reaction was also followed by simultaneously monitoring pH changes within the dispersion unit. All measurements were conducted at temperature (ϑ) 25.0 ± 0.1 °C. Based on obtained pH curves, induction times for ACP transformation were determined. Samples for further analysis were taken at 10 and 30 min for mechanically stirred and non-stirred precipitation systems, respectively.

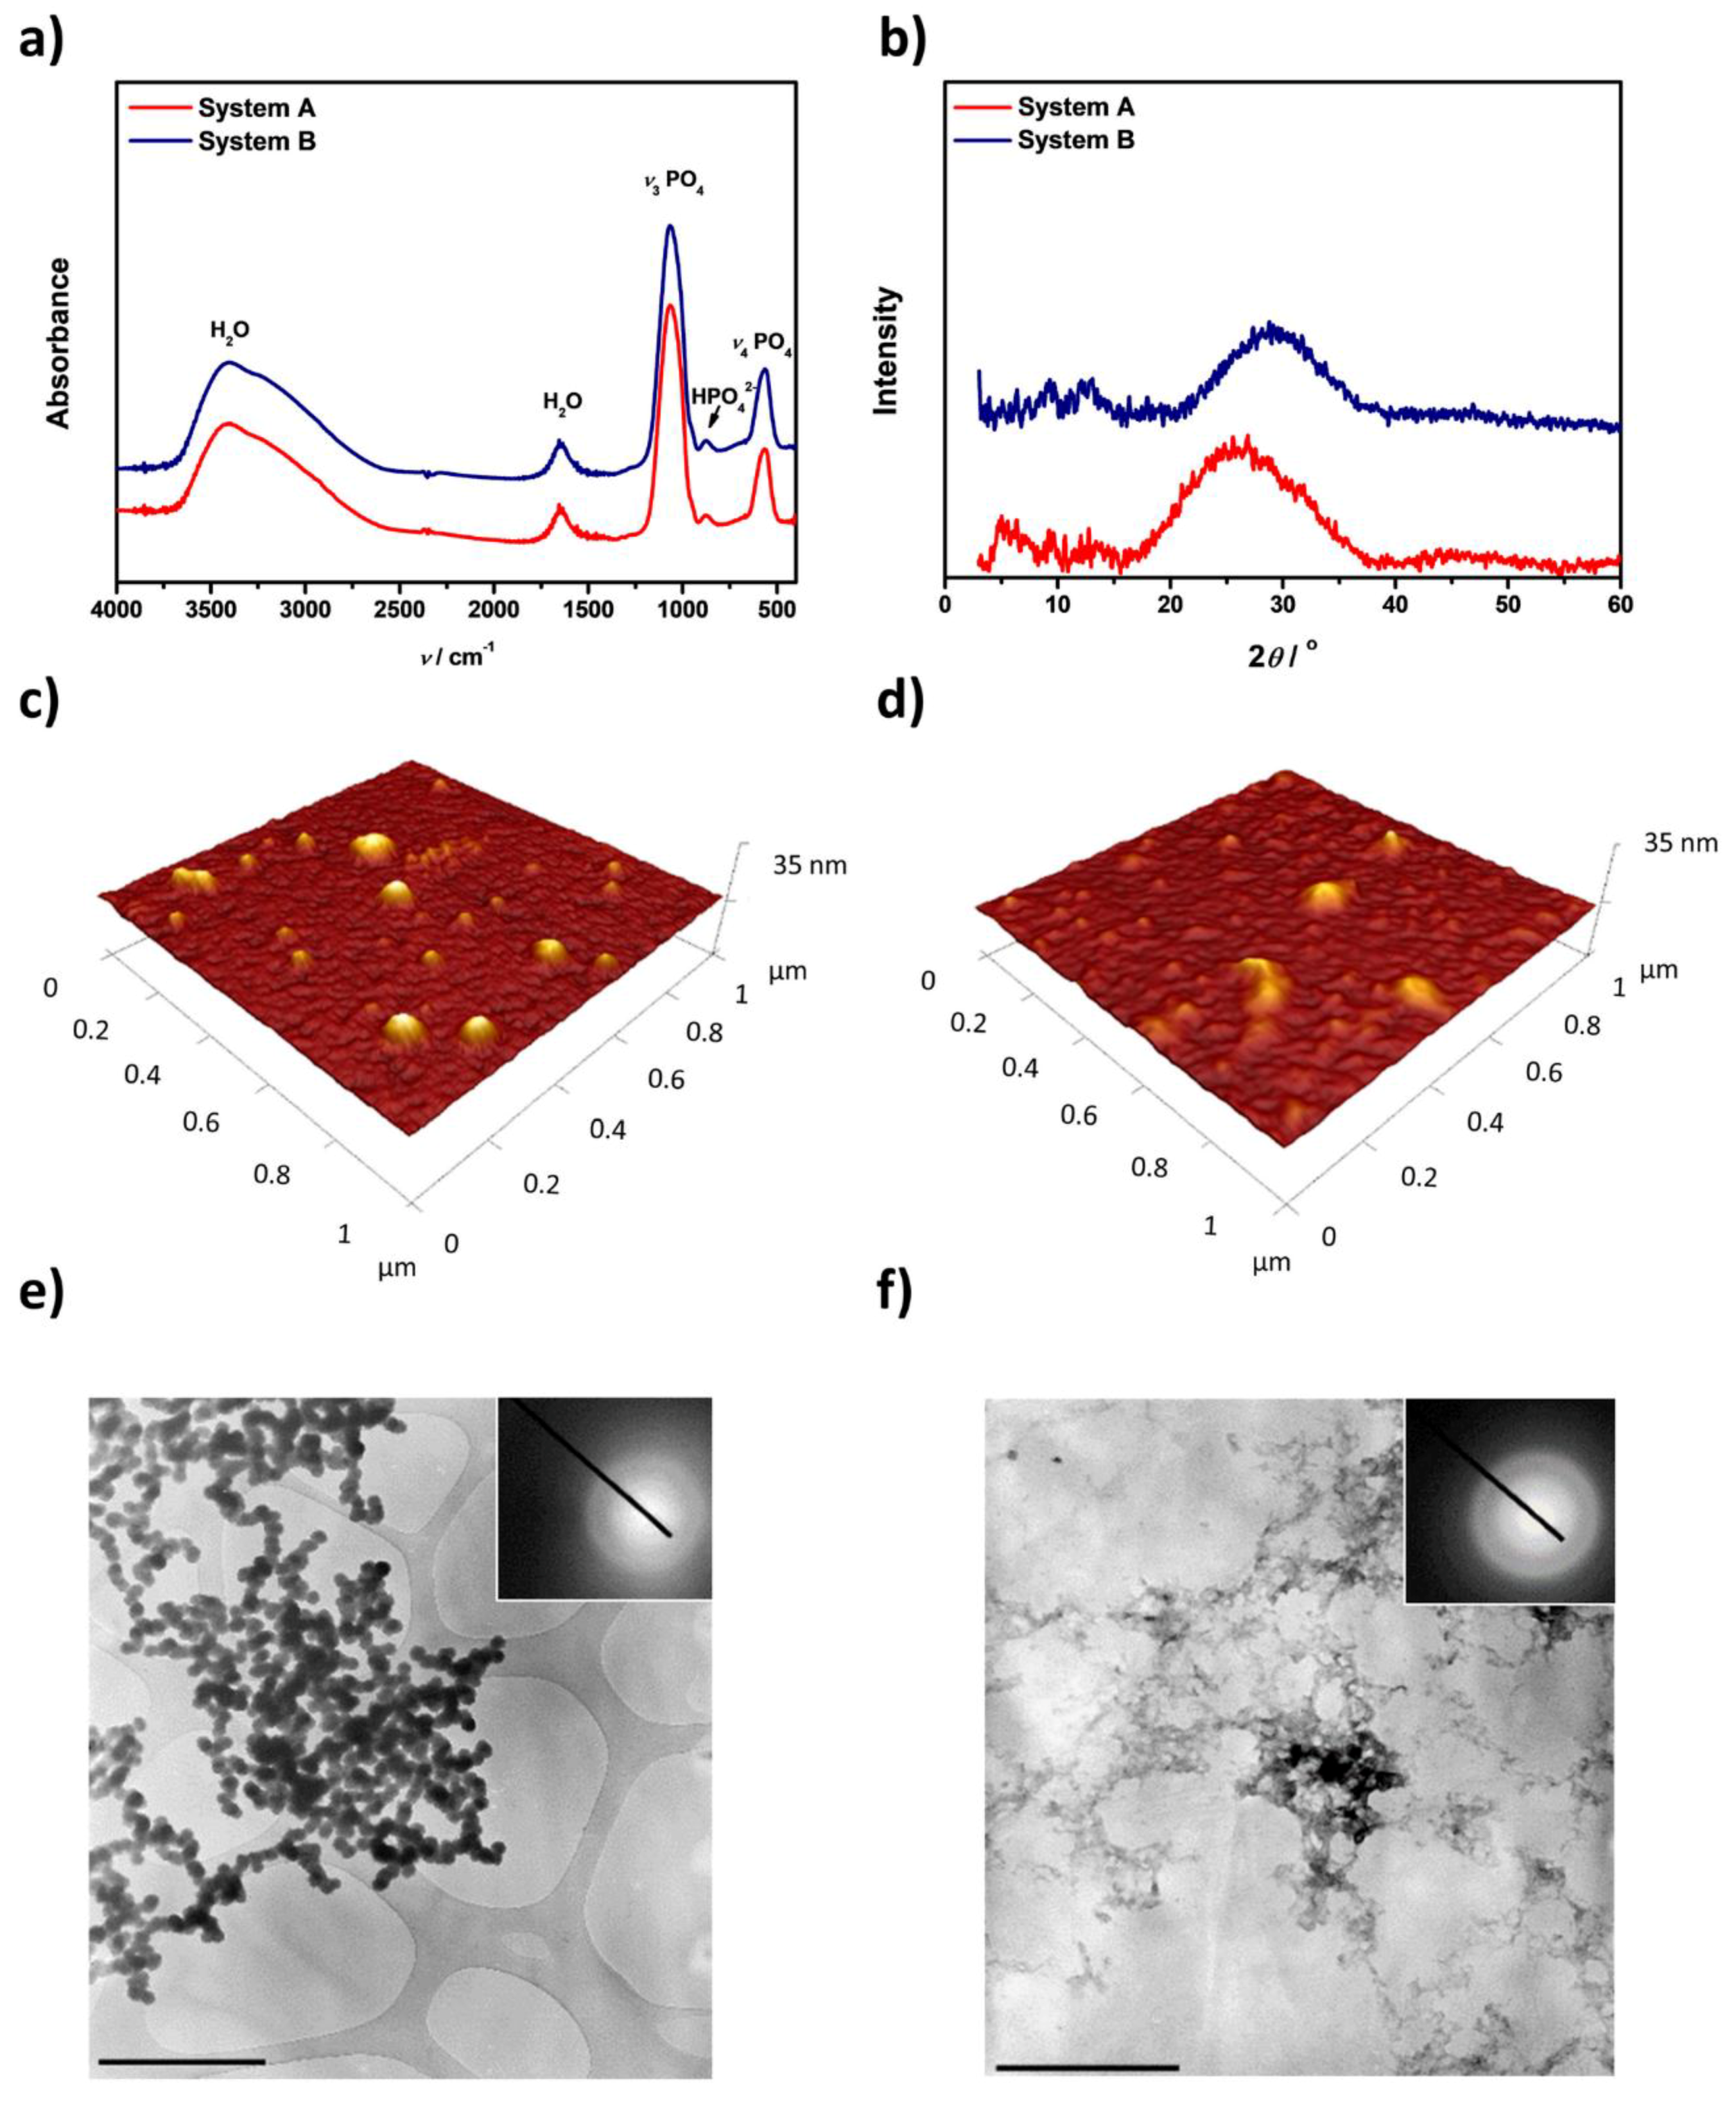
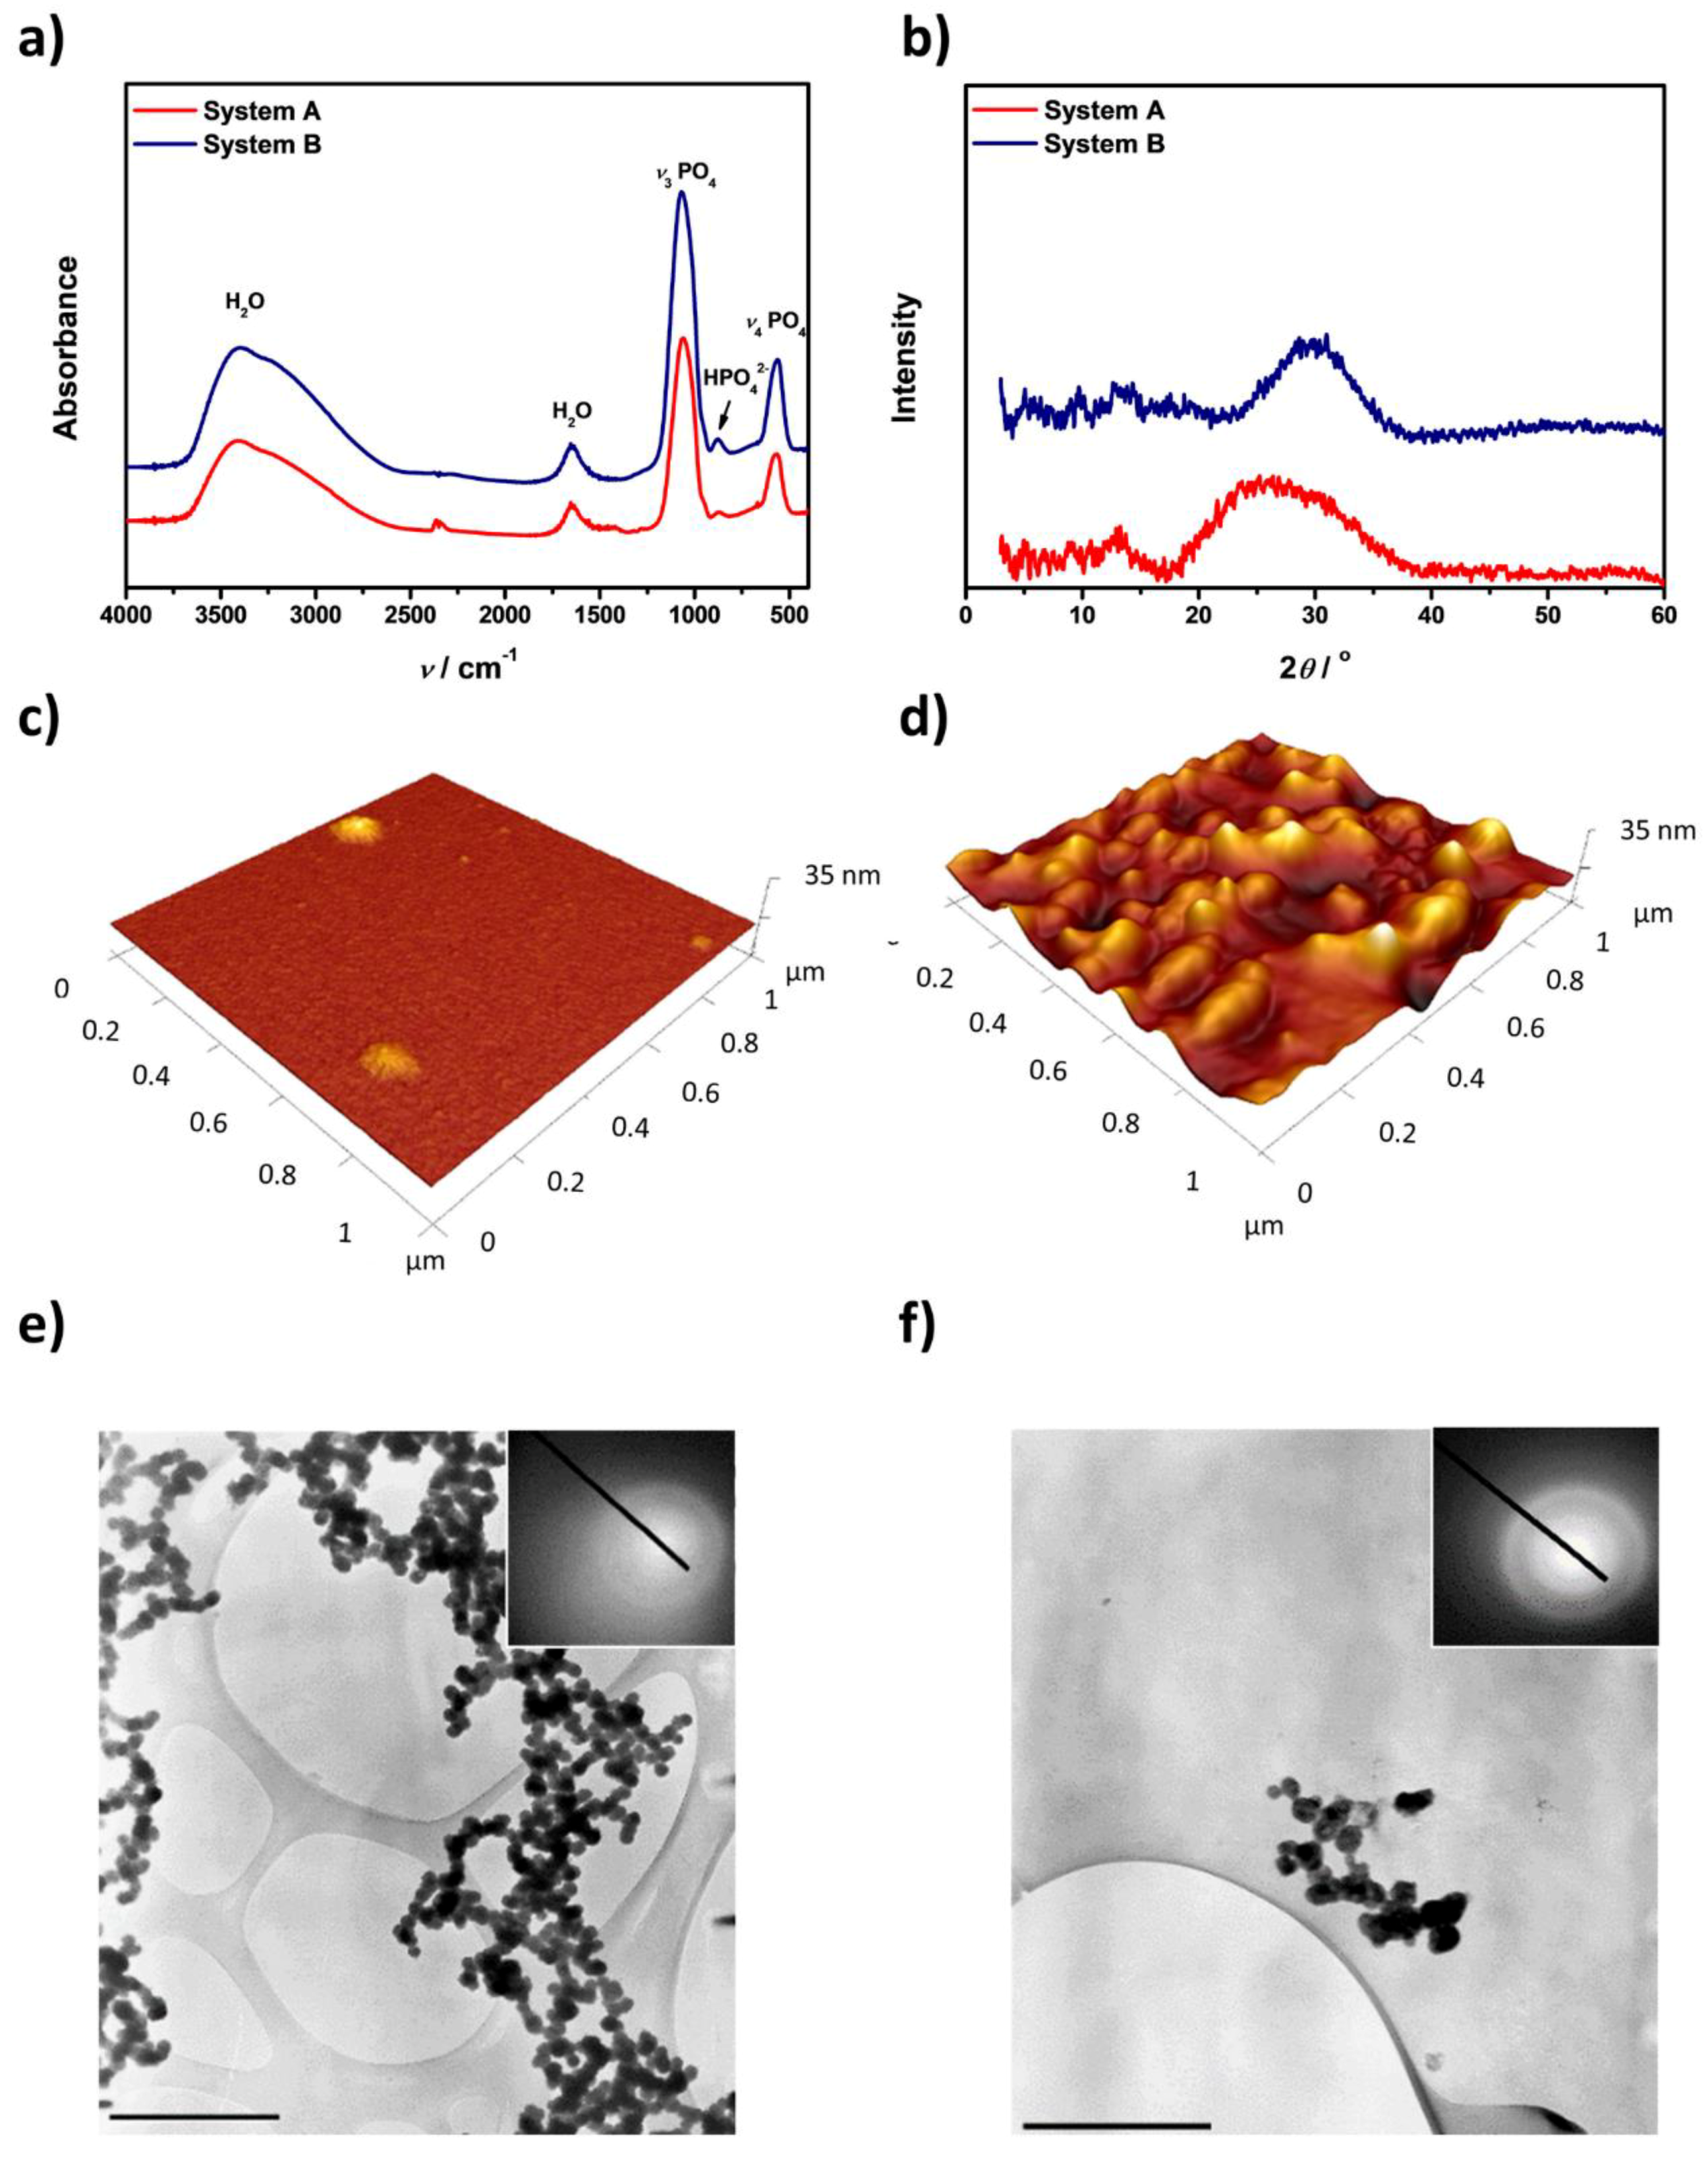
2.2. Fourier Transform Infrared Spectroscopy (FTIR)

To confirm the formation of ACP, precipitates were isolated by filtering through a 0.22 μm membrane filter after 10 and 30 min ageing time for stirred and non-stirred systems, respectively. Obtained precipitates were washed three times with Milli-Q water and ethanol, dried in a stream of nitrogen, and kept at 4 °C until further analysis. FTIR spectra were recorded on a FTIR spectrometer equipped with an attenuated total reflection module (Tensor II, Bruker, Ettlingen, Germany, 4000–400 cm−1), with a resolution of 2 cm−1. The recorded spectra are the average of 32 scans.

2.3. Powder X-ray Diffraction (PXRD)

For powder XRD characterization, samples were prepared as for FTIR analysis. Powder XRD patterns were obtained by means of Rigaku Ultima IV diffractometer in Bragg-Brentano geometry diffractometer using CuKα radiation and 5° Soller slits. XRD patterns were scanned in 0.02° steps (2θ) in the 2θ range from 3.25° to 60° with a scan speed of 1°(2θ) min−1. The baselines of powder XRD patterns were corrected and patterns smoothed using a 15-point Savitzky-Golay algorithm.

2.4. Atomic Force Microscopy (AFM)

The samples for AFM imaging were prepared by the drop deposition method, taken after predetermined time periods, on freshly cleaved mica. After a 1 min incubation period, the surfaces were washed two times with Milli-Q water and once with ethanol to remove the excess water and left to dry. The morphology was determined using a MultiMode probe microscope with a NanoScope IIIa controller and a “J” scanner with a vertical engagement (JV) of 125 μm (Bruker, Billerica, MA, USA). Tapping mode imaging was performed under ambient conditions in air using a silicon nitride tip (TESP, Bruker, nom. freq. 320 kHz, nom. spring constant 42 N m−1). The linear scanning rate was optimized between 1.0 and 1.5 Hz at a scan angle of 0°. Images were processed and analyzed by means of offline AFM NanoScope analysis software, version 1.7.

2.5. Transmission Electron Microscopy (TEM)

Transmission electron microscopy images were obtained using a Zeiss TEM EM10A (Carl Zeiss, Jena, Germany) operated at 80 kV. For TEM/SAED analysis, a drop of the suspension was placed on a copper grid covered with a Formvar membrane. Excess solution was removed by filter paper and the precipitate was washed three times with a drop of Milli-Q water. After removing excess water, the samples were dried in a stream of nitrogen and kept at 4 °C until further analysis. The sizes of ACP particles from TEM micrographs were determined by means of the image analysis program ImageJ 1.48v (freely available at http://imagejnih.gov/ij/). At least 20 particles were measured, except for the precipitate obtained in system B without stirring, where particles could not be individually quantified due to the morphology of the precipitate.

2.6. Dynamic Light Scattering

The size distribution of CaP particles was determined by means of dynamic light scattering using a photon correlation spectrophotometer equipped with a 532 nm “green” laser (Zetasizer Nano ZS, Malvern Instruments, Worcestershire, UK). The intensity of scattered light was detected at the angle of 173°. To avoid overestimation arising from the scattering of larger particles, the hydrodynamic diameter (dh) was obtained as a value at peak maximum of the size volume distribution function. Two modes of measurement were used: (a) time-averaged measurements, in which measurements were average of 12 runs each lasting around 10 s, and (b) time-resolved measurements in which the results were obtained from a single measurement lasting about 11 s. Each sample was measured five times, and representative data are shown. Data processing was carried out using Zetasizer Software 6.32 (Malvern Instrument Worcestershire, UK). All measurements were conducted at 25.0 ± 0.1 °C.

2.7. Laser Diffraction Particle Size Analyzer

The size distribution of CaP particles was determined by means of laser diffraction particle size analyzer Mastersizer 3000 equipped with a “red” He-Ne laser (632.8 nm) and a blue LED source (470 nm). The intensity of scattered light was detected in the angular range 0.015°–144°. Hydro EV wet dispersion unit (Malvern Instruments) was used for precipitation of ACP. The dispersion unit was equipped with a mechanical stirrer, and stirring was performed at 2000 rpm. Three measurements were performed per sample, and representative data are shown. The dispersion unit was drained and rinsed with diluted HCl and Milli-Q water after each measurement. Background detector intensities were checked to ensure cleanliness of the sample compartment. For data processing, Malvern Mastersizer software version 3.62 was used.

3. Results and Discussion
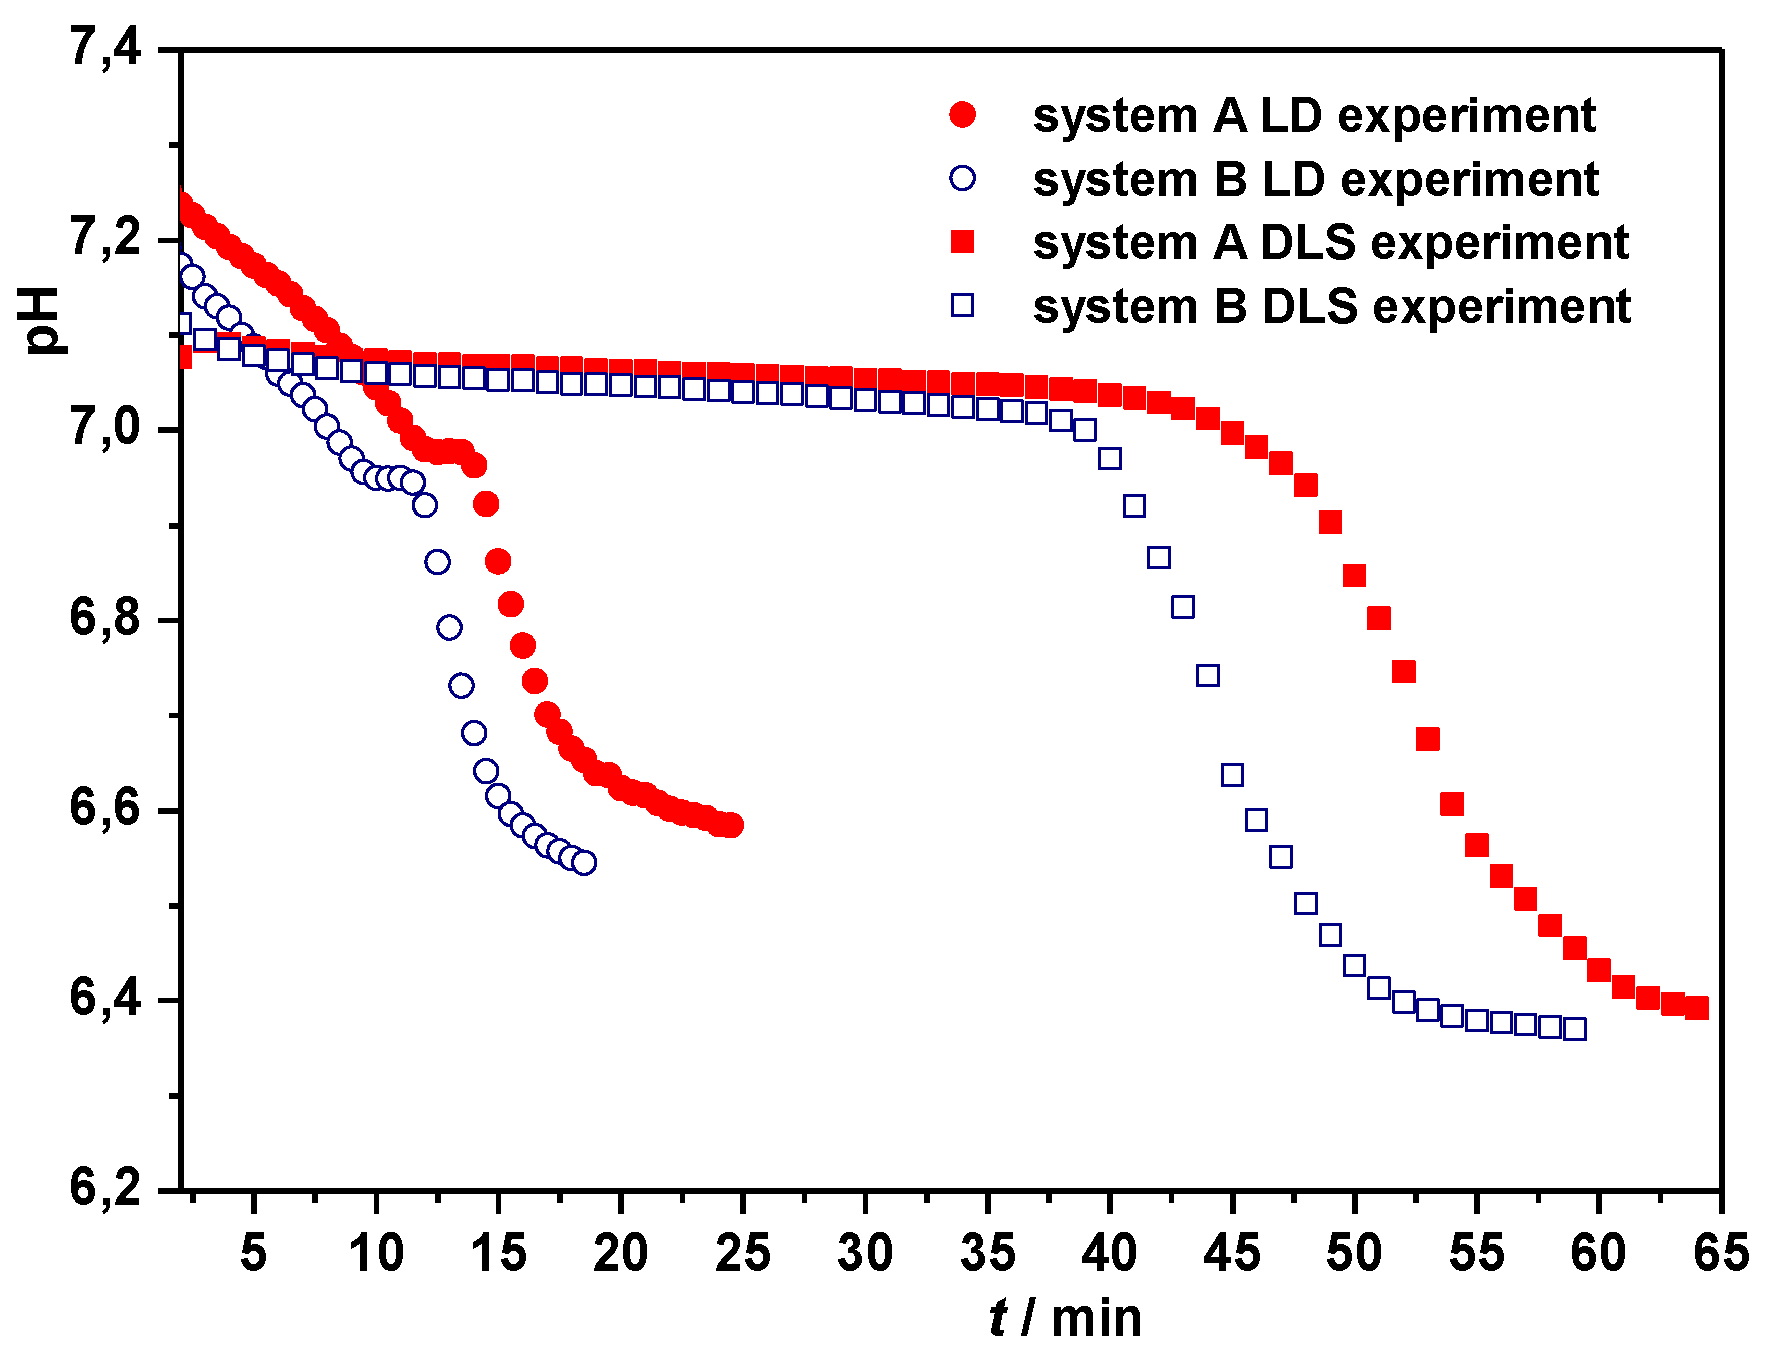
During the CaP precipitation, pH of suspension changes reflecting different stages of CaP formation and transformation [23,38,39]. Therefore, the progress of precipitation can be followed, at least semi-quantitatively, by monitoring the pH changes in precipitation systems. In Figure 1, pH curves obtained in system A and B at conditions corresponding to DLS and LD measurements, without and with mechanical stirring, respectively, are shown. Curves obtained in systems without stirring show typical sigmoidal shape reflecting three stages of the precipitation process [23,38,40]:
(1)
Initial slight pH decrease associated with the formation of ACP, during which the changes in pH and calcium concentrations are small or absent;
(2)
An abrupt decrease in pH associated with the secondary precipitation of crystalline phase upon ACP;
(3)
Final slight pH change associated with solution-mediated growth and phase transformation.
In the systems that were mechanically stirred, an additional initial stage was observed in which a significant decrease of pH was observed, pointing to a possible difference in the mechanisms of ACP formation in stirred systems. The different rates of pH changes in the stages of ACP (1) and crystalline formation (2) enables determination of the induction time (ti), from intersection of the tangents drawn on these two sections of pH curve. As expected, values of induction times for nucleation of the crystalline phase are shorter for a system with higher initial reactant concentration, as well as for mechanically stirred systems (Figure 1, Table 1).

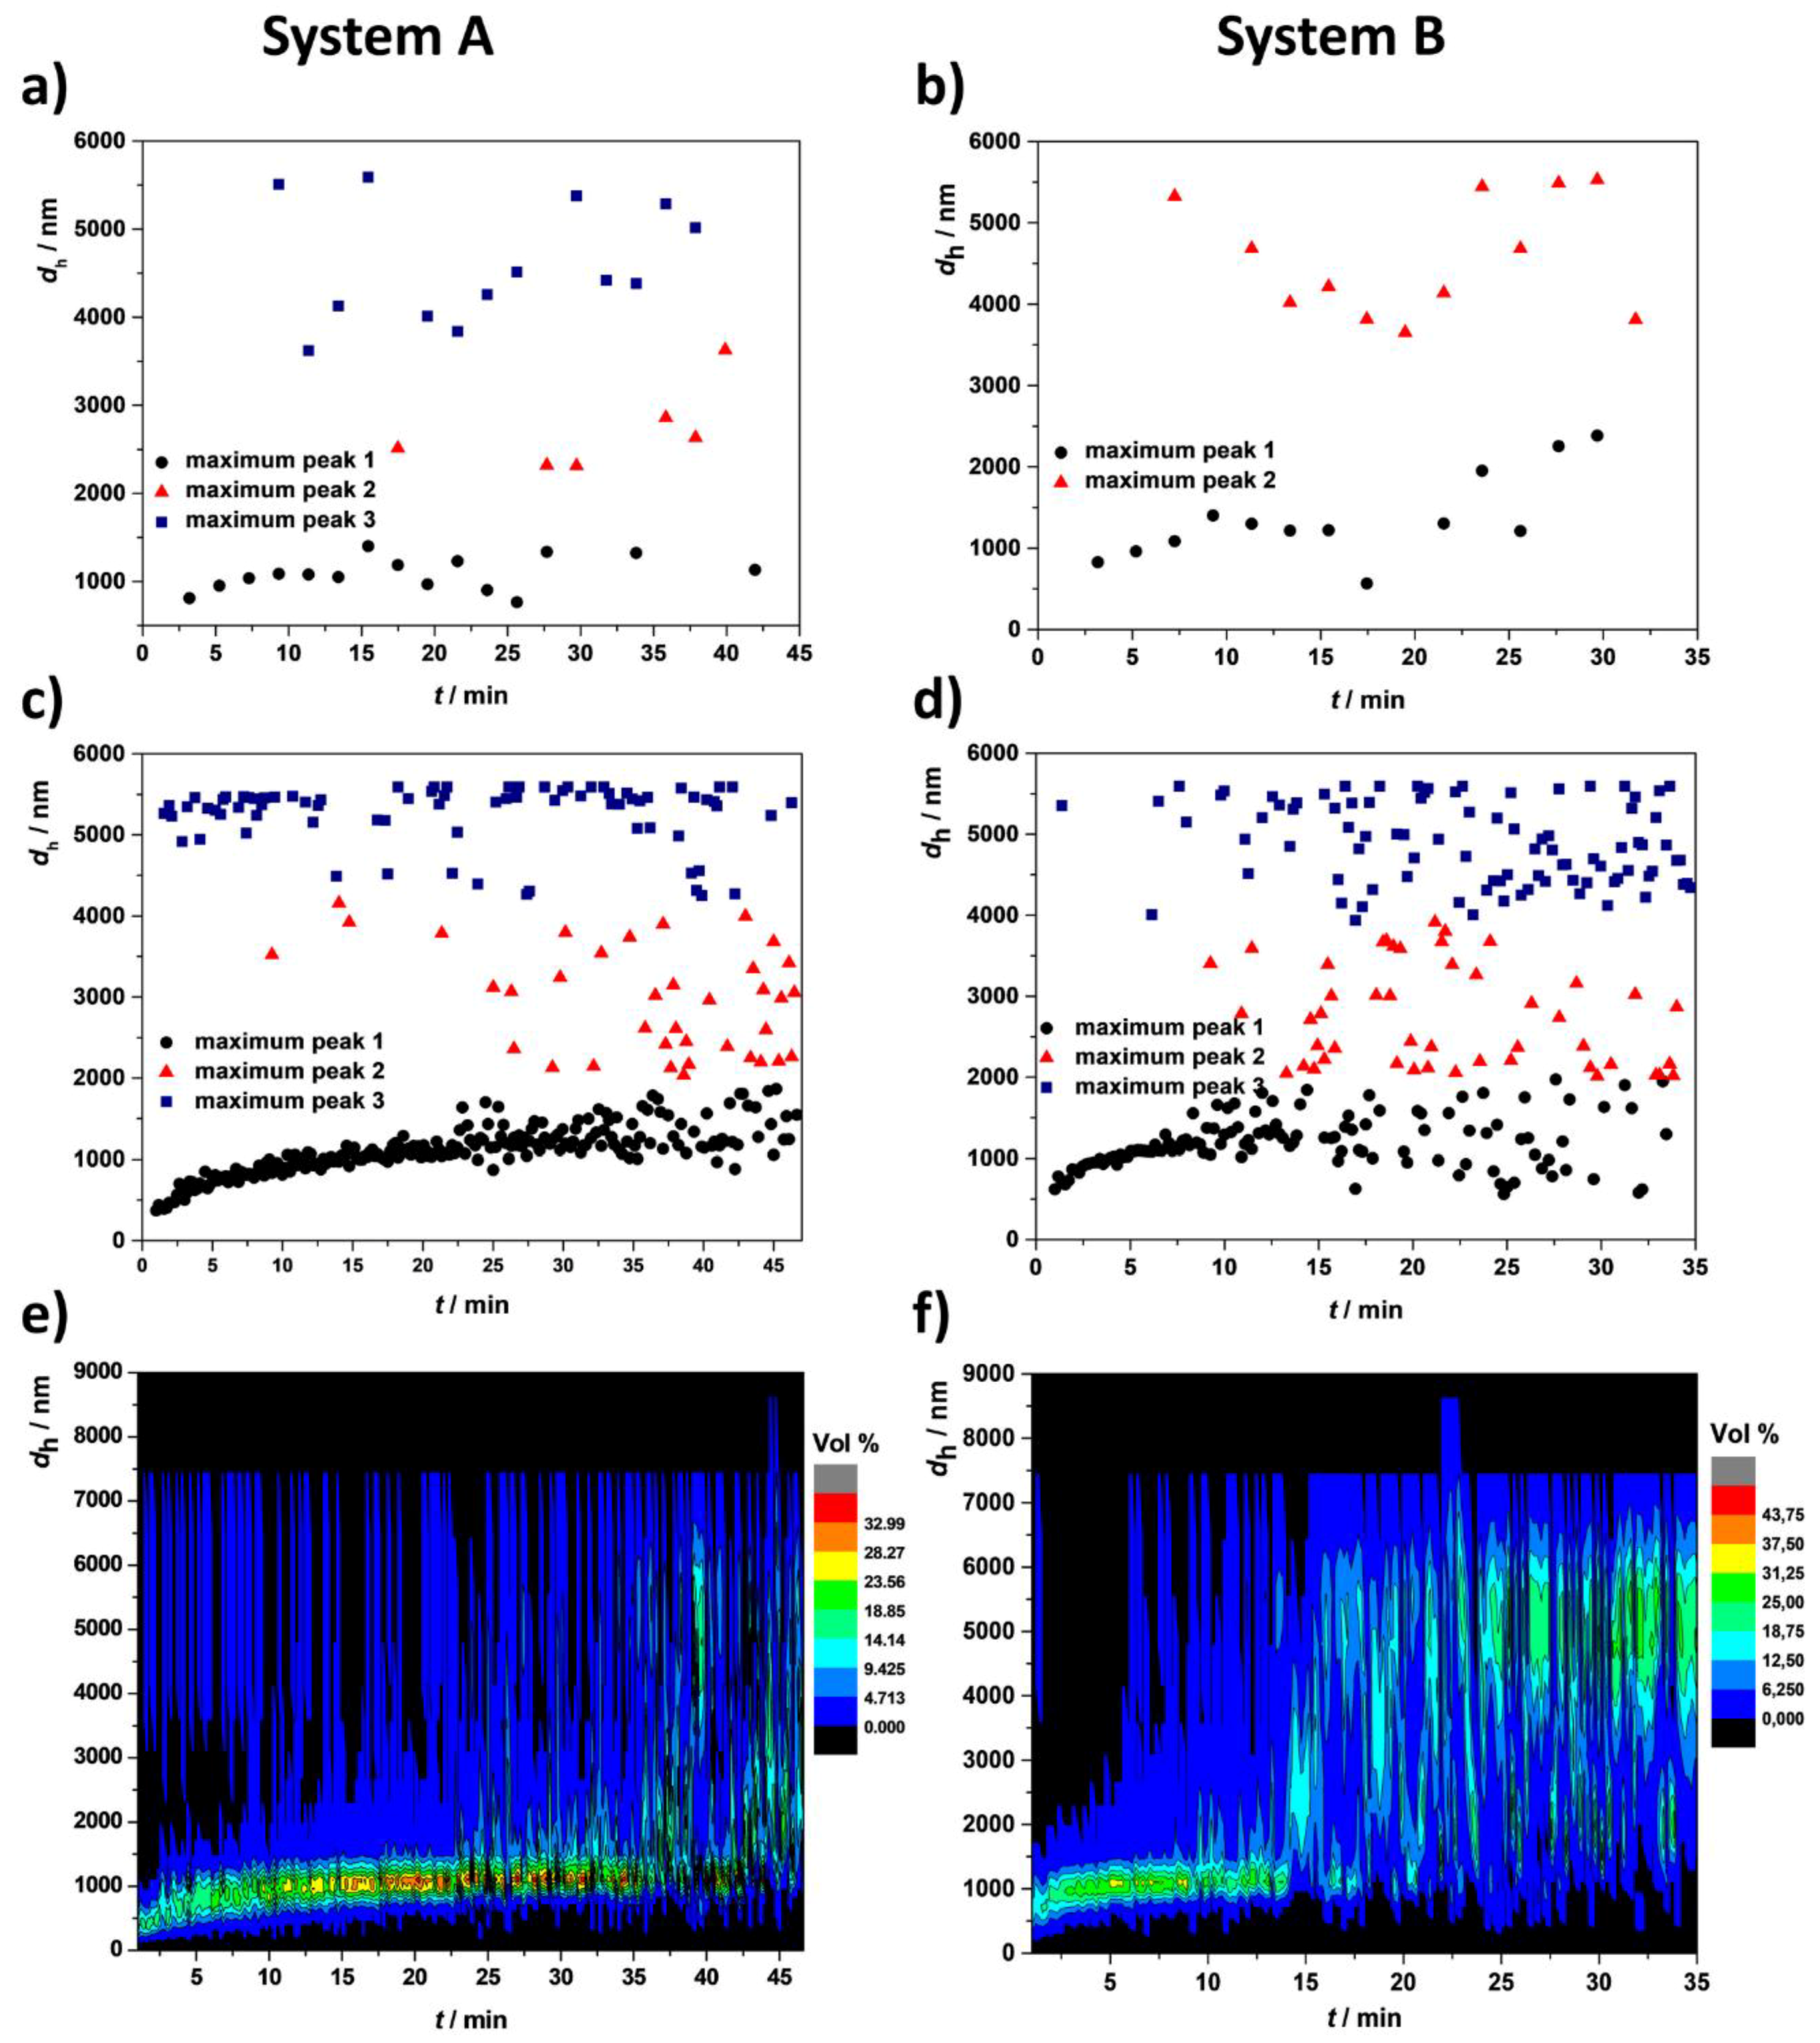
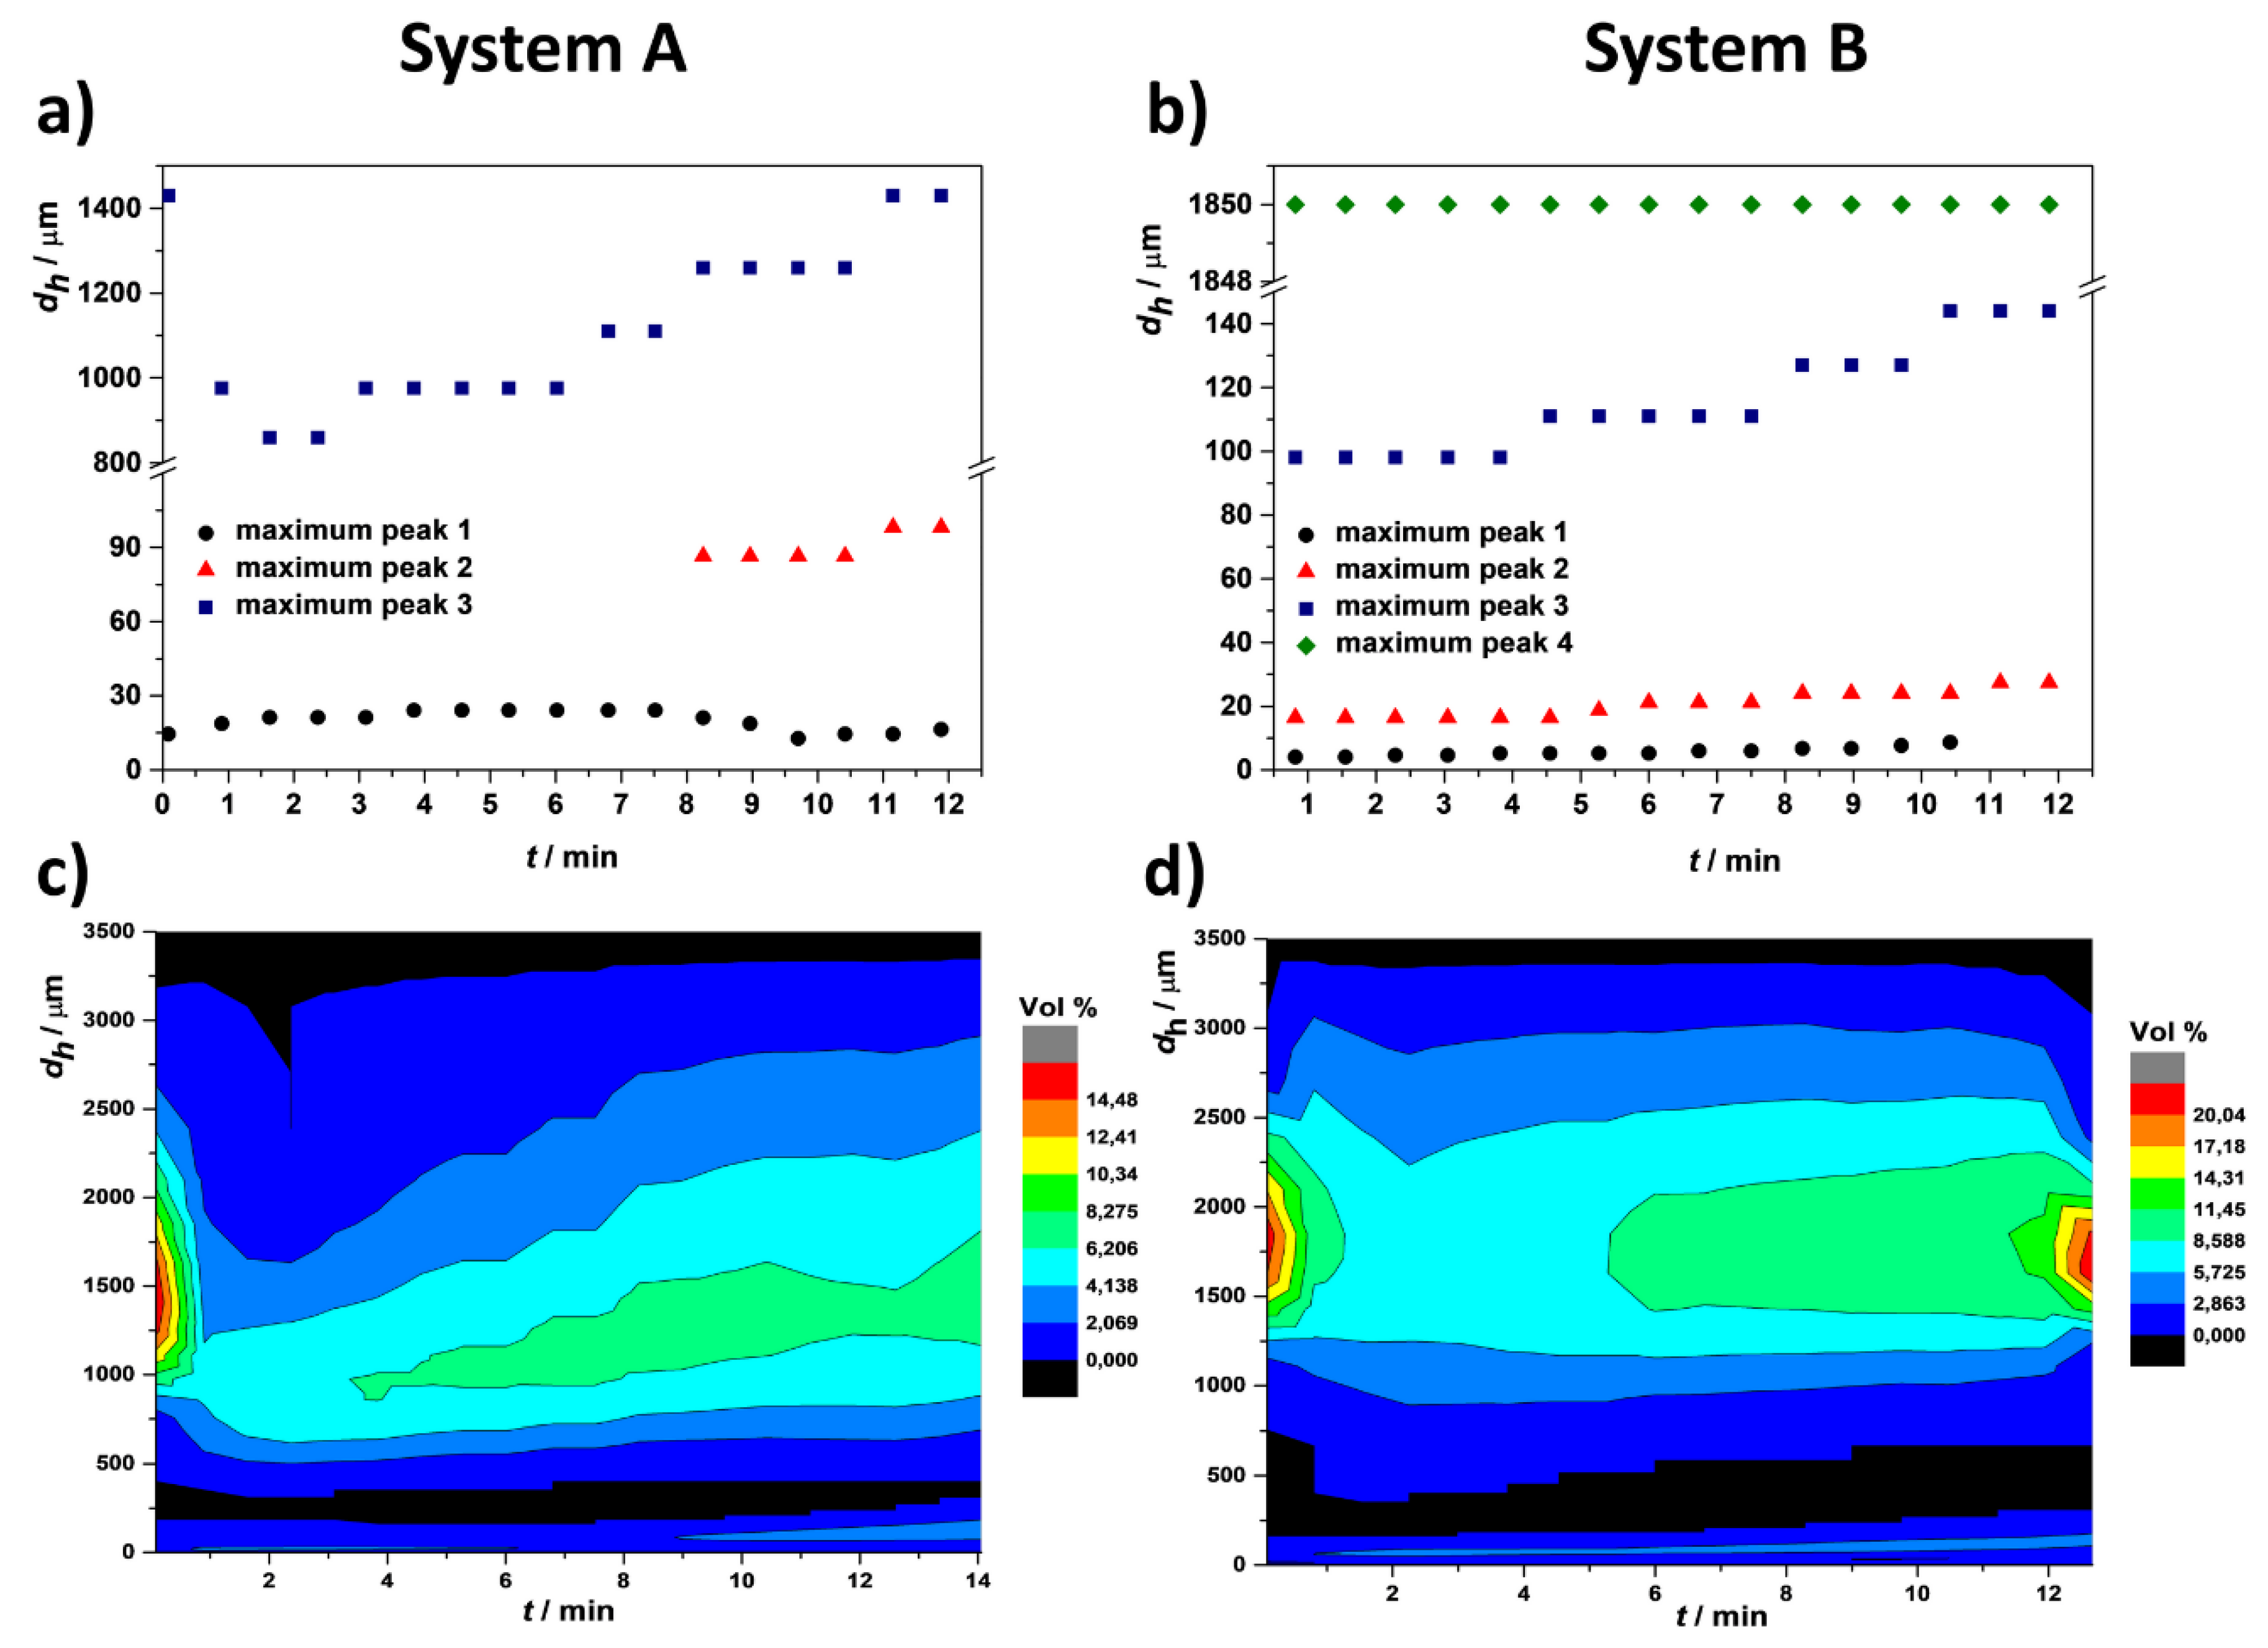
3.1. ACP Formation Followed by Dynamic Light Scattering

After 30 min of reaction time, ACP was formed in both precipitation systems, as confirmed by FTIR spectra and PXRD diffractograms (Figure 2a,b). FTIR spectra of both samples contained only phosphate and water bands characteristic for ACP [41]: asymmetric stretching mode of PO 4 3 at 1063 cm−1, HPO 4 2 band at 875 cm−1, and bending mode of PO 4 3 at 567 cm−1 were observed, as well as a broad band between 3700–2600 cm−1 and band at 1656 cm−1 characteristic for water. Formation of ACP was confirmed by the absence of splitting of the phosphate bands corresponding to asymmetric stretching and bending mode [41,42]. In PXRD only broad amorphous maximum in the 20°–37° 2θ region characteristic of ACP was observed [42]. AFM characterization showed that in both precipitation systems, spherical single particles were formed with distinct average heights of (2.8 ± 1.3) nm and (1.4 ± 0.8) nm and diameters (62 ± 27) nm and (56 ± 32) nm for system A and B, respectively (Figure 2c,d, Figure S1, Table S1). TEM micrographs revealed the difference between two precipitation systems. Thus, in system A, chain-like aggregates of spherical particles typical of ACP [21,23,37,38] were observed. The average diameter of spherical particles was 85 ± 12 nm (Figure 2e and Figure S4). In system B, a small number of small, spherical ACP particles and dense precipitate were observed (Figure 2f), indicating morphology evolution of ACP prior to its transformation [29,43]. In both systems, obtained selected area diffractions (SAED, inset Figure 2e,f) were characteristic for amorphous phase, confirming FTIR and PXRD results. AFM and TEM micrographs indicate that the precipitation systems are highly dispersed and that small (nano) particles can be present at later stages of the precipitation process, in accordance with previous studies of ACP formation [38,44].
Although AFM and TEM can give reasonably accurate average dimensions, the number of analyzed particles is relatively low [30]. DLS, on the other hand, enables representative statistics to be obtained since the number of analyzed particles is significantly higher. In addition, DLS enables in situ monitoring of the changes in particles’ size without the need for sample manipulation as in microscopy, making it the method of choice for studying nanoparticles aggregation as well as studying nucleation and growth of minerals at the nanoscale [32].
DLS measurements revealed pronounced difference between the two precipitation systems. In the time-averaged DLS measurement setup the trimodal and bimodal size distributions were observed in the systems A and B, respectively. From the earliest reaction time in system A, population of particles with dh in the range between 800 and 1300 nm was detected. After 10 min of the reaction time particles with dh between 2000 and 3000 nm and between 3500 and 5500 nm appeared, with their vol. % increasing with the time (Figure 3a). In system B (Figure 3b) in addition to the population of particles with dh in a range of 500–2400 nm, population of larger particles with dh in a range of 4000–5000 nm was observed, earlier than in system A. As in system A, the vol. % of larger particles increased with the time. With the aging, the sizes of smallest particles increased, which was more pronounced in system B. However, no trend in change of sizes of larger particles with time could be observed in either system, as the values were scattered. Comparing dh values obtained in DLS measurements with AFM and TEM results, it can be concluded that sizes of chain-like aggregates of spherical particles and dense precipitate obtained in precipitation system A and B, respectively, were measured. This is in accordance with previous work showing that sizes of individual spherical particles could be measured by DLS only when aggregation is suppressed, as for example in the presence of surfactants [38] or polyelectrolytes [33].
In previous studies, using a similar time averaged measurement setup, in different precipitation systems, only one population of particles was observed. Thus, Onuma et al. [34] have observed that in the absence of additional electrolyte the hydrodynamic radius of aggregates changes from 650 to 1000 nm. Due to fast reaction rates, the results were scattered. However, when the ionic strength increased by addition of 10 mM KCl, a sigmoidal growth of the hydrodynamic radius values was observed. De Bruyn et al. [32] used DLS to study the influence of osteopontin on hydroxyapatite formation. In the control experiment, they observed growth of particles’ rh from 150 to 900 nm, with the rate of growth decreasing from 0.4 nm/s at the beginning of precipitation to 0.17 nm/s at the end of experiment. Wang et al. [35] have also observed an increase in Z-average values during ACP induction time up to 2000 nm. The scattering of the data increased with time, which was described as indicative of particle aggregation. In time-resolved measurement, they observed what they named a steady size distribution, i.e., dominant distribution present in all measurements at around 300–1000 nm. In addition, particles with larger sizes corresponding to larger aggregates, or smaller sizes corresponding to the fragments, which were likely formed in the collisions of larger particles, have been sporadically observed. Interestingly, these different DLS measurements indicate that in different experimental conditions dominant population of particles is the one with sizes in the range of 150–2000 nm.
In order to obtain more detailed information about the ACP aggregation process, time-resolved experiments were performed. In both systems, three populations of particles were observed (Figure 3c,d). The sizes of the smallest particles continuously increased from 300 to 1800 nm in precipitation system A and from 550 to 1900 nm in precipitation system B. Larger aggregates existed in small vol. % already at early stages of ACP formation in both precipitation systems. The scattering of the values increased with time and was larger in system B. In system A, the smallest particles were dominant almost until the commencement of ACP transformation (Figure 3e and Figure S6a). In system B, on the other hand, the smallest particles were dominant (i.e., their vol. % was the largest) up to 15 min reaction time. After 15 min, for a short time, particles of sizes in the range of 1750–4000 nm were dominant, after which the largest particles with sizes over 4000 nm become dominant and remained dominant until the induction time (Figure 3f and Figure S6b). In both systems, the size distribution of all populations was wide. The wide size distribution could be attributed to the chains containing different number of spherical particles, as well as their different shapes. The larger sizes of aggregates could be a consequence of either increasing number of spherical particles in chain-like structure or growth of already aggregated particles. The latter was proposed by Brečević et al. [21], but a decrease in size of spherical particles with the time was also observed [38]. DLS results indicate that the highly polydisperse system exists from the earliest precipitation stages. In addition, with increasing concentration of precipitation system, scattering of the sizes and vol. % of larger aggregates increased, indicating more pronounced particle aggregation at higher reactant concentrations [35].

3.2. ACP Formation Followed by Laser Diffraction

Due to the experimental setup (no stirring) and a limit of maximum measurable sizes (6 μm), DLS offers no information about aggregates larger than 6 μm and of precipitated aggregates. Also, mechanical stirring offers better control of hydrodynamic conditions and consequently a more uniform process of ACP formation. To the best of our knowledge, although LD has been used for the characterization of CaP particles [45], no attempt has been made to follow their formation in situ.
Similarly, to the non-agitated systems, after 10 min of reaction time, ACP was formed, as confirmed by FTIR spectra and PXRD diffractograms typical of ACP (Figure 4a,b). AFM micrographs of the respective samples point to higher extent of aggregation than in systems without mechanical stirring. In system A, small individual particles (Figure 4c and Figure S3a, Table S2), similar to the ones obtained in non-stirred precipitation systems, coexisted with larger aggregates. An example of observed aggregate is shown in Figure S2, with a height of 26 ± 12 nm and diameter of 600 ± 280 nm. On its surface, aggregated clusters of about 1 nm in height and 30 nm width were noticeable. In the proximity of bigger aggregate (Figure 4c, Figure S2b and S2c), individual nanoparticles were visualized. In system B aggregation was most advanced (Figure 4d and Figure S3b, Table S2), as most particles were larger than 100 nm in diameter. TEM micrographs (Figure 4e,f) revealed that in both mechanically stirred systems chain-like aggregates of spherical particles were formed, as in non-stirred system A. Average diameters of spherical particles formed in precipitation systems A and B were 85 ± 11 nm and 135 ± 26 nm, respectively. SAED confirmed that the obtained precipitates were amorphous.
Although particles of nanometer sizes can be measured with LD, in both precipitation systems, only particles with sizes from several micrometers to 1900 μm were observed (Figure 5). In both systems, the dominant population corresponded to the largest particles. While in system A, the size of the largest particles gradually increased from 1000 μm to 1400 μm (Figure 5a), in system B (Figure 5b), the size remained almost constant at around 1850 μm. In both systems, these distributions were very broad and interestingly their vol. % initially decreased and then increased with time (Figure 5c,d), which could indicate the possibility of the aggregates breaking apart and their subsequent reconstruction [35]. In system A, two populations of smaller particles were noted (Figure 5a). Particles with sizes of around 15 μm, almost constant in size and in vol. %, were present from the beginning of the process. Conversely, particles with sizes of around 90 μm appeared at latter stages, and their size and vol. % increased slightly with time (Figure 5a,c). In the system B two populations of particles with sizes smaller than 20 μm were present from the beginning of the reaction, and their sizes slightly increased with time. The fourth population of particles, also present from the beginning of reaction in this system, exhibited growth from 98 to 143 μm (Figure 5b).
Although DLS and LD measurements cannot be directly compared due to the difference in experimental setup, LD measurements indicate that processes at the microscale are also dynamic and stochastic, resulting in a highly polydisperse system. Similar to DLS measurements, LD measurements revealed that, with increasing concentration precipitation, system becomes more polydisperse, and larger aggregates are formed, indicating more pronounced aggregation. However, despite the aggregation of ACP being a stochastic process, a large amount of evidence shows that kinetics of its formation and transformation, as well as properties of the formed crystalline phase, are reproducible [21,23,24,25,26,27,32,33,34,35,36,37,38,39,40,43].
Habraken et al. have shown that polymerization, i.e., aggregation, of building blocks (ion-association complexes and post-nucleation clusters) is the first step in CaP crystal formation [22]. A number of studies have confirmed that ACP formation continuous through aggregation of spherical particles to chain-like structures [21,35]. Our DLS and LD results indicate that ACP formation, at least in part, proceeds by aggregation of chain-like structures at the later stages of process.

4. Conclusions

In order to follow the formation of ACP in the nanometer to micrometer scale at two different supersaturations, DLS and LD techniques for particle size determination were applied. Both techniques enable monitoring the formation of chain-like aggregates of spherical particles of different sizes or dense phase. Indeed, DLS measurements are on the scale of several hundred nanometers to several micrometers, while LD encompasses the scale of several micrometers to millimeters. When coupled with AFM and TEM measurements, DLS and LD results demonstrate that during formation of ACP a highly polydisperse precipitate forms, containing particles with sizes ranging from several nanometers to several millimeters. The polydispersity of the systems and amount of larger aggregates increased with reactant concentration.
However, based on DLS measurements, it seems that a stable population of particles with the sizes of several hundred nm in the earliest stages of precipitation exist. Unlike populations with sizes above 2000 nm in which sizes are scattered in time and no apparent trend of changes exist, these particles show continuous growth up to sizes of 2000 nm, the exact value depending on concentration, i.e., the larger concentration bigger the size. Interestingly, such a population of particles was observed in previous studies in different experimental conditions [14,32,35]. This could indicate that these aggregates are the stable ones and that larger aggregates are formed through their collisions. Their stability decreases with concentration, reflected in larger scattering of dh values at latter stages of precipitation, possibly due to the higher frequency of collisions. Although in the LD experiments values of peak maxima are not as scattered as in DLS experiments, due to the large width of distributions it is hard to draw similar conclusion.
The existence of particles with significantly different size distributions enables a possible way of tailoring CaP properties, by controlling the aggregation at different scales. It also poses the question on whether amorphous phases could be easily molded into a complex shape as a consequence, at least in part, of such high polydispersity.

Supplementary Materials

The following are available online at https://www.mdpi.com/2073-4352/8/6/254/s1, Figure S1: Particle height analysis of atomic force microscopy (AFM) 2D height for the particles formed in precipitation systems without stirring; Figure S2: AFM 3D topographic view of aggregated nanoparticles obtained in precipitation System A with stirring; Figure S3: Particle height analysis of AFM 2D height for the particles formed in precipitation systems with mechanical stirring; Figure S4: Transmission Electron Microscopy (TEM) micrographs and the corresponding particles length distributions; Figure S5: Distribution of particles’ sizes obtained in time-averaged experiment and representative distributions obtained in time-resolved experiment at corresponding reaction times; Figure S6: Changes of vol. % of particles formed in systems A and B, without stirring measured by dynamic light scattering (DLS) time resolved experiment at the same time scale. Table S1: Particle height analysis of AFM 2D height for the particles formed in precipitation systems without stirring; Table S2: Particle height analysis of AFM 2D height for the particles formed in precipitation systems with mechanical stirring

Author Contributions

Conceptualization, M.D.S.; Funding acquisition, D.K.; Investigation, V.Č., I.E., A.S., D.D.J., S.Š., D.M.L. and D.K.; Methodology, M.D.S.; Writing—original draft, M.D.S.

Acknowledgments

The authors are indebted to Stanislav Martin, LKB Vertriebs Ges.m.b.H. for his help with Mastersizer measurements. This research was funded by the Croatian Science Foundation under project IP-2013-11-5055.

Conflicts of Interest

The authors declare no conflict of interest.

References

  1. Falini, G.; Fermani, S. The strategic role of adsorption phenomena in biomineralization. Cryst. Res. Technol. 2013, 48, 864–876. [Google Scholar] [CrossRef]
  2. Jin, W.; Jiang, S.; Pan, H.; Tang, R. Amorphous Phase Mediated Crystallization: Fundamentals of Biomineralization. Crystals 2018, 8, 48. [Google Scholar] [CrossRef]
  3. Lowenstam, H.A.; Weiner, S. On Biomineralization; Oxford University Press: New York, NY, USA, 1989; ISBN 0-19-536419-8. [Google Scholar]
  4. Mahamid, J.; Sharir, A.; Addadi, L.; Weiner, S. Amorphous calcium phosphate is a major component of the forming fin bones of zebrafish: Indications for an amorphous precursor phase. Proc. Natl. Acad. Sci. USA 2008, 105, 12748–12753. [Google Scholar] [CrossRef] [PubMed] [Green Version]
  5. Akiva, A.; Malkinson, G.; Masic, A.; Kerschnitzki, M.; Bennet, M.; Fratzl, P.; Addadi, L.; Weiner, S.; Yaniv, K. On the pathway of mineral deposition in larval zebrafish caudal fin bone. Bone 2015, 75, 192–200. [Google Scholar] [CrossRef] [PubMed]
  6. Beniash, E.; Metzler, R.A.; Lam, R.S.K.; Gilbert, P.U.P.A. Transient amorphous calcium phosphate in forming enamel. J. Struct. Biol. 2009, 166, 133–143. [Google Scholar] [CrossRef] [PubMed] [Green Version]
  7. Tertuliano, O.A.; Greer, J.R. The nanocomposite nature of bone drives its strength and damage resistance. Nat. Mater. 2016, 15, 1195–1202. [Google Scholar] [CrossRef] [PubMed] [Green Version]
  8. Hara, E.S.; Okada, M.; Nagaoka, N.; Hattori, T.; Kuboki, T.; Nakano, T.; Matsumoto, T. Bioinspired mineralization using chondrocyte membrane nanofragments. ACS Biomater. Sci. Eng. 2018, 4, 617–625. [Google Scholar] [CrossRef]
  9. Eanes, E.D.; Gillessen, I.H.; Posner, A.S. Intermediate states in the precipitation of hydroxyapatite. Nature 1965, 208, 365. [Google Scholar] [CrossRef] [PubMed]
  10. Wang, L.; Nancollas, G.H. Calcium Orthophosphates: Crystallization and dissolution. Chem. Rev. 2008, 108, 4628–4669. [Google Scholar] [CrossRef] [PubMed]
  11. Olszta, M.J.; Cheng, X.; Jee, S.S.; Kumar, R.; Kim, Y.-Y.; Kaufman, M.J.; Douglas, E.P.; Gower, L.B. Bone structure and formation: A new perspective. Mater. Sci. Eng. R Rep. 2007, 58, 77–116. [Google Scholar] [CrossRef]
  12. Posner, A.S.; Betts, F. Synthetic amorphous calcium phosphate and its relation to bone mineral structure. Acc. Chem. Res. 1975, 8, 273–281. [Google Scholar] [CrossRef]
  13. Onuma, K.; Ito, A. Cluster growth model for hydroxyapatite. Chem. Mater. 1998, 10, 3346–3351. [Google Scholar] [CrossRef]
  14. Oyane, A.; Onuma, K.; Kokubo, T.; Ito, A. Clustering of calcium phosphate in the system CaCl2–H3PO4–KCl–H2O. J. Phys. Chem. B 1999, 103, 8230–8235. [Google Scholar] [CrossRef]
  15. Dey, A.; Bomans, P.H.H.; Müller, F.A.; Will, J.; Frederik, P.M.; de With, G.; Sommerdijk, N.A.J.M. The role of prenucleation clusters in surface-induced calcium phosphate crystallization. Nat. Mater. 2010, 9, 1010–1014. [Google Scholar] [CrossRef] [PubMed]
  16. Wang, L.; Li, S.; Ruiz-Agudo, E.; Putnis, C.V.; Putnis, A. Posner’s cluster revisited: direct imaging of nucleation and growth of nanoscale calcium phosphate clusters at the calcite-water interface. CrystEngComm 2012, 14, 6252. [Google Scholar] [CrossRef]
  17. Onuma, K.; Oyane, A.; Kokubo, T.; Treboux, G.; Kanzaki, N.; Ito, A. Nucleation of calcium phosphate on 11-mercaptoundecanoic acid self-assembled monolayer in a pseudophysiological solution. J. Phys. Chem. B 2000, 104, 11950–11956. [Google Scholar] [CrossRef]
  18. Du, L.-W.; Bian, S.; Gou, B.-D.; Jiang, Y.; Huang, J.; Gao, Y.-X.; Zhao, Y.-D.; Wen, W.; Zhang, T.-L.; Wang, K. Structure of clusters and formation of amorphous calcium phosphate and hydroxyapatite: From the perspective of coordination chemistry. Cryst. Growth Des. 2013, 13, 3103–3109. [Google Scholar] [CrossRef]
  19. Kanzaki, N.; Treboux, G.; Onuma, K.; Tsutsumi, S.; Ito, A. Calcium phosphate clusters. Biomaterials 2001, 22, 2921–2929. [Google Scholar] [CrossRef]
  20. Treboux, G.; Layrolle, P.; Kanzaki, N.; Onuma, K.; Ito, A. Symmetry of posner’s cluster. J. Am. Chem. Soc. 2000, 122, 8323–8324. [Google Scholar] [CrossRef]
  21. Brečević, L.; Hlady, V.; Füredi-Milhofer, H. Influence of gelatin on the precipitation of amorphous calcium phosphate. Colloids Surf. 1987, 28, 301–313. [Google Scholar] [CrossRef]
  22. Habraken, W.J.E.M.; Tao, J.; Brylka, L.J.; Friedrich, H.; Bertinetti, L.; Schenk, A.S.; Verch, A.; Dmitrovic, V.; Bomans, P.H.H.; Frederik, P.M.; et al. Ion-association complexes unite classical and non-classical theories for the biomimetic nucleation of calcium phosphate. Nat. Commun. 2013, 4, 1507. [Google Scholar] [CrossRef] [PubMed] [Green Version]
  23. Bar-Yosef Ofir, P.; Govrin-Lippman, R.; Garti, N.; Füredi-Milhofer, H. The influence of polyelectrolytes on the formation and phase transformation of amorphous calcium phosphate. Cryst. Growth Des. 2004, 4, 177–183. [Google Scholar] [CrossRef]
  24. Brečević, L.; Füredi-Milhofer, H. Precipitation of calcium phosphates from electrolyte solutions. Calcif. Tissue Res. 1972, 10, 82–90. [Google Scholar] [CrossRef] [PubMed]
  25. Despotović, R.; Filipović-Vinceković, N.; Füredi-Milhofer, H. Precipitation of calcium phosphates from electrolyte solutions. Calcif. Tissue Int. 1975, 18, 13–26. [Google Scholar] [CrossRef]
  26. Christoffersen, J.; Christoffersen, M.R.; Kibalczyc, W.; Andersen, F.A. A contribution to the understanding of the formation of calcium phosphates. J. Cryst. Growth 1989, 94, 767–777. [Google Scholar] [CrossRef]
  27. Pan, H.; Liu, X.Y.; Tang, R.; Xu, H.Y. Mystery of the transformation from amorphous calcium phosphate to hydroxyapatite. Chem. Commun. 2010, 46, 7415. [Google Scholar] [CrossRef] [PubMed]
  28. Jiang, S.; Jin, W.; Wang, Y.-N.; Pan, H.; Sun, Z.; Tang, R. Effect of the aggregation state of amorphous calcium phosphate on hydroxyapatite nucleation kinetics. RSC Adv. 2017, 7, 25497–25503. [Google Scholar] [CrossRef] [Green Version]
  29. Sugiura, Y.; Onuma, K.; Kimura, Y.; Miura, H.; Tsukamoto, K. Morphological evolution of precipitates during transformation of amorphous calcium phosphate into octacalcium phosphate in relation to role of intermediate phase. J. Cryst. Growth 2011, 332, 58–67. [Google Scholar] [CrossRef]
  30. Domingos, R.F.; Baalousha, M.A.; Ju-Nam, Y.; Reid, M.M.; Tufenkji, N.; Lead, J.R.; Leppard, G.G.; Wilkinson, K.J. Characterizing manufactured nanoparticles in the environment: multimethod determination of particle sizes. Environ. Sci. Technol. 2009, 43, 7277–7284. [Google Scholar] [CrossRef] [PubMed]
  31. Kato, H. Size Determination of nanoparticles by dynamic light scattering. In Nanomaterials; Singh, S.C., Zeng, H., Guo, C., Cai, W., Eds.; Wiley-VCH Verlag GmbH & Co. KGaA: Weinheim, Germany, 2012; pp. 535–554. ISBN 978-3-527-64682-1. [Google Scholar]
  32. De Bruyn, J.R.; Goiko, M.; Mozaffari, M.; Bator, D.; Dauphinee, R.L.; Liao, Y.; Flemming, R.L.; Bramble, M.S.; Hunter, G.K.; Goldberg, H. A. Dynamic light scattering study of inhibition of nucleation and growth of hydroxyapatite crystals by osteopontin. PLOS ONE 2013, 8, e56764. [Google Scholar] [CrossRef] [PubMed]
  33. Krogstad, D.V.; Wang, D.; Lin-Gibson, S. Kinetics of aggregation and crystallization of polyaspartic acid stabilized calcium phosphate particles at high concentrations. Biomacromolecules 2015, 16, 1550–1555. [Google Scholar] [CrossRef] [PubMed]
  34. Onuma, K.; Oyane, A.; Tsutsui, K.; Tanaka, K.; Treboux, G.; Kanzaki, N.; Ito, A. Precipitation kinetics of hydroxyapatite revealed by the continuous-angle laser light-scattering technique. J. Phys. Chem. B 2000, 104, 10563–10568. [Google Scholar] [CrossRef]
  35. Wang, C.-G.; Liao, J.-W.; Gou, B.-D.; Huang, J.; Tang, R.-K.; Tao, J.-H.; Zhang, T.-L.; Wang, K. Crystallization at multiple sites inside particles of amorphous calcium phosphate. Cryst. Growth Des. 2009, 9, 2620–2626. [Google Scholar] [CrossRef]
  36. Buljan Meić, I.; Kontrec, J.; Domazet Jurašin, D.; Njegić Džakula, B.; Štajner, L.; Lyons, D.M.; Dutour Sikirić, M.; Kralj, D. Comparative study of calcium carbonates and calcium phosphates precipitation in model systems mimicking the inorganic environment for biomineralization. Cryst. Growth Des. 2017, 17, 1103–1117. [Google Scholar] [CrossRef]
  37. Buljan Meić, I.; Kontrec, J.; Domazet Jurašin, D.; Selmani, A.; Njegić Džakula, B.; Maltar-Strmečki, N.; Lyons, D.M.; Plodinec, M.; Čeh, M.; Gajović, A.; et al. How similar are amorphous calcium carbonate and calcium phosphate? A comparative study of amorphous phase formation conditions. CrystEngComm 2018, 20, 35–50. [Google Scholar] [CrossRef]
  38. Selmani, A.; Coha, I.; Magdić, K.; Čolović, B.; Jokanović, V.; Šegota, S.; Gajović, S.; Gajović, A.; Jurašin, D.; Sikirić, M.D. Multiscale study of the influence of cationic surfactants on amorphous calcium phosphate precipitation. CrystEngComm 2015, 17, 8529–8548. [Google Scholar] [CrossRef] [Green Version]
  39. Wang, L.; Nancollas, G.H. Pathways to biomineralization and biodemineralization of calcium phosphates: the thermodynamic and kinetic controls. Dalton Trans. 2009, 2665–2672. [Google Scholar] [CrossRef] [PubMed]
  40. Li, S.; Wang, L. Phosphorylated osteopontin peptides inhibit crystallization by resisting the aggregation of calcium phosphate nanoparticles. CrystEngComm 2012, 14, 8037–8043. [Google Scholar] [CrossRef]
  41. Combes, C.; Rey, C. Amorphous calcium phosphates: synthesis, properties and uses in biomaterials. Acta Biomater. 2010, 6, 3362–3378. [Google Scholar] [CrossRef] [PubMed] [Green Version]
  42. Dorozhkin, S.V. Amorphous calcium (ortho)phosphates. Acta Biomater. 2010, 6, 4457–4475. [Google Scholar] [CrossRef] [PubMed]
  43. Xie, B.; Halter, T.J.; Borah, B.M.; Nancollas, G.H. Tracking amorphous precursor formation and transformation during induction stages of nucleation. Cryst. Growth Des. 2014, 14, 1659–1665. [Google Scholar] [CrossRef] [PubMed]
  44. Pouget, E.M.; Bomans, P.H.H.; Goos, J.A.C.M.; Frederik, P.M.; Sommerdijk, N.A.J.M. The initial stages of template-controlled CaCO3 formation revealed by Cryo-TEM. Science 2009, 323, 1455–1458. [Google Scholar] [CrossRef] [PubMed] [Green Version]
  45. Garcia, I.M.; Leitune, V.C.B.; Samuel, S.M.W.; Collares, F.M. Influence of different calcium phosphates on an experimental adhesive resin. J. Adhes. Dent. 2017, 19, 379–384. [Google Scholar] [CrossRef] [PubMed]
Figure 1. Representative pH vs. time curves of amorphous calcium phosphate (ACP) formation and transformation in the precipitation systems A (c(CaCl2·2H2O) = c(Na2HPO4) = 3.5 mmol dm−3) and B (c(CaCl2·2H2O) = c(Na2HPO4) = 4 mmol dm−3), at conditions corresponding to DLS and LD measurements, without and with mechanical stirring, respectively. pHinit = 7.4, ϑ = 25.0 ± 0.1 °C.
Crystals 08 00254 g001
Figure 2. (a) Fourier Transform Infrared Spectroscopy (FTIR) spectra, (b) X-ray Diffraction (XRD) patterns, (c,d) Atomic Force Microscopy (AFM) 3D height views and (e,f) Transmission Electron Microscopy (TEM) micrographs and the corresponding selected area diffraction (SAED) of the precipitate formed after 30 min reaction time in precipitation systems A (c(CaCl2·2H2O) = c(Na2HPO4) = 3.5 mmol dm−3, (c,e) and B (c(CaCl2·2H2O) = c(Na2HPO4)= 4.0 mmol dm−3, (d,f) at conditions corresponding to DLS measurements, i.e., without the stirring. pHinit = 7.4, ϑ= 25.0 ± 0.1 °C. (TEM bar = 1 µm).
Crystals 08 00254 g002
Figure 3. Changes of hydrodynamic diameter (dh) (ad) and vol. % (ef) of particles formed in system A (c(CaCl2·2H2O) = c(Na2HPO4) = 3.5 mmol dm−3) and B (c(CaCl2·2H2O) = c(Na2HPO4) = 4.0 mmol dm−3) without stirring measured by DLS. (a,b) time averaged experiment and (cf) time resolved experiment. pHinit = 7.4, ϑ= 25.0 ± 0.1 °C.
Crystals 08 00254 g003
Figure 4. (a) FTIR spectra, (b) XRD patterns, (c,d) AFM 3D height views and (e,f) TEM micrographs and the corresponding selected area diffraction (SAED) of the precipitate formed after 30 min reaction time in precipitation systems A (c(CaCl2·2H2O) = c(Na2HPO4) = 3.5 mmol dm−3, (c,e) and B (c(CaCl2·2H2O) = c(Na2HPO4) = 4.0 mmol dm−3, (d,f) at conditions corresponding to DLS measurements, i.e., with the mechanical stirring. pHinit = 7.4, ϑ= 25.0 ± 0.1 °C. (TEM bar = 1 µm).
Crystals 08 00254 g004
Figure 5. Changes of hydrodynamic diameter (dh) (ab) and vol. % (cd) of particles formed in system A (c(CaCl2·2H2O) = c(Na2HPO4) = 3.5 mmol dm−3) and B (c(CaCl2·2H2O) = c(Na2HPO4) = 4.0 mmol dm−3) with mechanical stirring measured by LD. pHinit = 7.4, ϑ = 25.0 ± 0.1 °C.
Crystals 08 00254 g005
Table 1. Average induction times (ti) obtained from pH vs. time (t) curves in the precipitation systems A (c(CaCl2·2H2O) = c(Na2HPO4) = 3.5 mmol dm−3) and B (c(CaCl2·2H2O) = c(Na2HPO4) = 4 mmol dm−3), at conditions corresponding to DLS and LD measurements, without and with mechanical stirring. pHinit = 7.4, ϑ = 25.0 ± 0.1 °C.
Systemti/min
DLS ExperimentLD Experiment
A49.3 ± 1.913.7 ± 0.5
B37.7 ± 1.712.0 ± 0.4

