Over-Expression, Secondary Structure Characterization, and Preliminary X-ray Crystallographic Analysis of Xenopus tropicalis Ependymin

School of Systems Biomedical Science, Soongsil University, Seoul 06978, Korea
*
Author to whom correspondence should be addressed.
Crystals 2018, 8(7), 284; https://doi.org/10.3390/cryst8070284
Submission received: 19 June 2018
/
Revised: 6 July 2018
/
Accepted: 9 July 2018
/
Published: 11 July 2018
(This article belongs to the Special Issue Biological Crystallization)
Abstract
:The gene encoding frog (Xenopus tropicalis) ependymin without the signaling sequence was gene-synthesized, and the protein successfully over-expressed in ~mg quantities adequate for crystallization using insect cell expression. Circular dichroism (CD) analysis of the protein purified with >95% homogeneity indicated that ependymin contains both α-helix and β-strand among the secondary structure elements. The protein was further crystallized using polyethylene glycol 8000 as the precipitating reagent, and X-ray diffraction data were collected to 2.7 Å resolution under cryo-condition at a synchrotron facility. The crystal belongs to a hexagonal space group P6122 (or P6522) having unit cell parameters of a = b = 61.05 Å, c = 234.33 Å. Matthews coefficient analysis indicated a crystal volume per protein mass (VM) of 2.76 Å3 Da−1 and 55.4% solvent content in the crystal when the calculated molecular mass of the protein only was used. However, the apparent SDS-PAGE molecular mass of ~33 kDa (likely resulting from N-glycosylation) suggested VM of 1.90 Å3 Da−1 and 35.4% solvent content instead. In both cases, the asymmetric unit of the crystal likely contains only one subunit of the protein.
1. Introduction
Ependymin (EPN) was first discovered in the ependymal zone of goldfish brain upon emergence of a learning behavior [1,2,3]. Additionally, EPN being one of the abundant glycoproteins in the brain extracellular fluid and cerebrospinal fluid in the teleost fish, has been suggested to have various roles in memory consolidation, neuronal regeneration, brain calcium homeostasis [4,5] as well as in cold adaptation, and even in determining aggressiveness [6,7]. Interestingly, orthologues of fish EPN, also exist in other animals such as sea urchin, frog, and even in mammals, and have been also named as EPDR (ependymin-related) protein or MERP (mammalian ependymin-related protein). Humans, in particular, have one isoform of EPN and its expression has been reported in various human normal tissues [8,9]. More interestingly, the transcription level of human EPN was elevated in colorectal tumor cells, and hence is also called UCC1 (upregulated in colorectal cancer gene 1) [10]. Hereafter, all EPN and EPN-like proteins will be mentioned as EPN for simplicity.
EPNs in general contain endoplasmic reticulum-targeting signal sequences at the N-terminus, which are likely cleaved by signal peptidases and further processed for secretion [9,11]. The sequences also hold four cysteine residues that may form either intramolecular disulfide crosslinking for stabilizing protein conformation or intermolecular crosslinking for mediating dimeric interaction (Figure 1). Furthermore, studies on fish EPN suggest N-glycosylations at two asparagine residues [1,12], and other EPNs also have predicted N-glycosylation sites (Figure 1). An isolated digestive fragment of fish EPN has been shown to activate c-Jun N-terminal kinase, and components of AP-1 (c-Jun and c-Fos) via the PKC and MAPK pathways [13,14]. Because oxidative stresses induce the expression of AP-1 by the MAP kinase pathway, upregulation of superoxide dismutase (SOD), catalase, and glutathione peroxide have been implied as the downstream targets of at least fish EPN to prevent damages resulting from reactive oxygen species [15].
Despite the fact that EPN is similar from sea urchins to humans [16], studies leading to its multi-functional role are limited to EPN of the fish. Furthermore, the detailed mechanism of EPN’s action remains yet to be unveiled. Since no known structure of any EPN exists so far, we believe that the future structure of EPN would give directions in predicting the function of EPNs in general. In this attempt, frog (Xenopus tropicalis) EPN without the signal sequence was recombinantly expressed in insect cells and purified. The protein was further crystallized, and the diffraction data obtained in a synchrotron facility.
2. Materials and Methods
2.1. Macromolecule Production
DNA encoding frog (X. tropicalis) EPN (residues 38~224), which excludes the N-terminal signal sequence was gene-synthesized with an addition of N-terminal His8-tag sequence and BamHI/NotI restriction enzyme sites (Bioneer, Daejeon, Korea) for cloning into pAcGP67A vector (BD Biosciences, Franklin Lakes, NJ, USA) (Table 1). The final plasmid generated was sequence verified before using it for transfection into insect cells. The media used for the insect cell culture was Corning® Insectagro® (Thermo Fisher Scientific, Waltham, MA, USA) supplemented with ×1 of Gibco® (Thermo Fisher Scientific, Waltham, MA, USA) Antibiotic-Antimycotic [penicillin 100 units/mL, streptomycin 100 µg/mL, Fungizone® (Amphotericin B) 250 ng/mL]. The media was pre-warmed in 27 °C water bath for 1 h, and the insect cell culture was performed in 27 °C benchtop or shaking incubators. Transfection of frog EPN containing plasmid and baculovirus DNA into SF9 (Spodoptera frugiperda) cells, and the subsequent virus amplification through multistep infections were performed according to the manufacturer’s method. Briefly, a mixture of 0.1 μg plasmid and 5 µL baculovirus DNA (ProEasy™, AB vector, San Diego, CA, USA) was pre-mixed and diluted with water to 50 µL. Into the pre-mix, 50 µL of 10% Profectin™ (AB vector, San Diego, CA, USA) solution was added dropwise, and incubated at room temperature for 20 min. For transfection into SF9 cells, the resulting 100 µL mixture was added dropwise to the 50% confluent cells in a 6-well plate. The cells were harvested after four days of infection to obtain the initial P0 EPN virus stock. All subsequent infections for virus amplification were made by using the virus stock as ×20 stock. Hence, the P1 EPN virus stock was obtained by infecting the P0 stock into 50% confluent SF9 cells in T75 flask and harvesting after 4 days. Further infection and harvest after 4 days in 50% confluent SF9 cells in T150 flask generated the P2 EPN virus stock. Subsequently, another infection was made into a suspension culture in 50 mL SF9 cells (2 × 10⁶ cells/mL) for the P3 EPN virus stock which was harvested in 4 days. The final P4 EPN virus stock was obtained by infecting the P3 EPN virus stock into 200 mL SF9 cells (2 × 10⁶ cells/mL). For large-scale protein expression, 50 mL of P4 EPN virus stock was infected into 1 L of 2 × 10⁶ cells/mL SF9 cells with 140 RPM shaking at 27 °C. The cells were harvested after 2 days to obtain only the supernatant in which the secreted EPN was found.
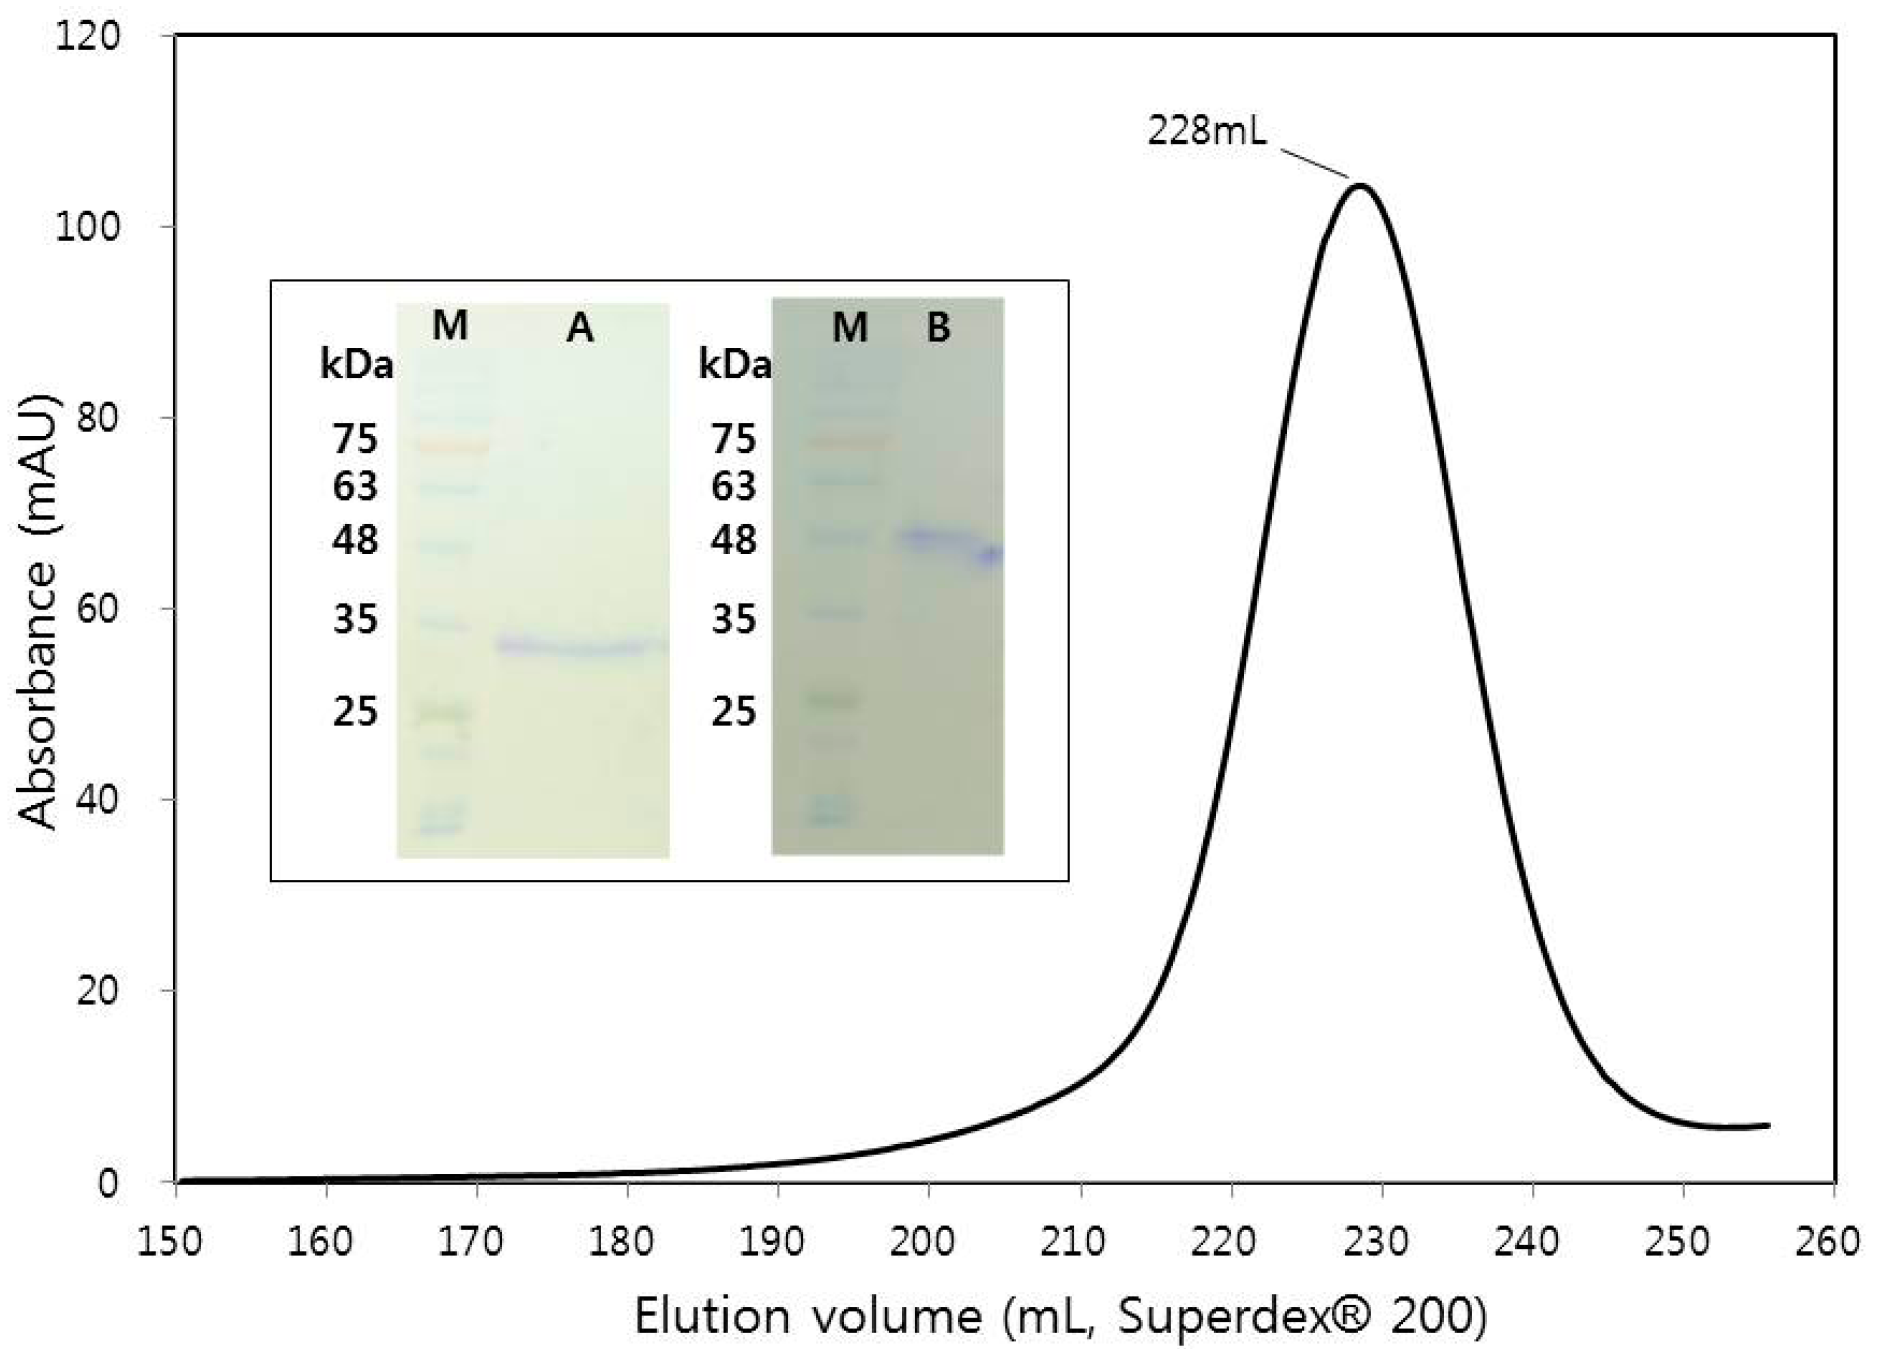
Stock solutions of Tris pH 7.5 and NaCl were added into the harvested supernatant to a final concentration of 50 mM Tris pH 7.5 and 200 mM NaCl, and further adjusted to pH 7 optimal for Ni-NTA binding. For ~1 L of supernatant, 20 mL Ni-NTA resin (Qiagen, Hilden, Germany) was added and rocked at 100 RPM (20 °C, 1 h) for bead binding. The mixture was incubated in 4 °C for 1 h to allow the separation of resin from the supernatant. The supernatant was carefully removed until ~100 mL and the re-suspended mixture was packed in a glass column. The resin was further washed with ~100 mL wash buffer (20 mM imidazole, 25 mM Tris pH 7.5, and 500 mM NaCl), and the frog EPN eluted with ~100 mL elution buffer (200 mM imidazole, 25 mM Tris pH 7.5, and 500 mM NaCl) by collecting in fractions of ~10 mL. The frog EPN in the collection fraction was checked on SDS-PAGE, and concentrated to ~10 mL using Amicon® Ultra-15 centrifugal filter (Merck, Kenilworth, NJ, USA). The concentrated crude protein was further purified using size-exclusion chromatography (SEC) on a ÄKTA FPLC (GE Healthcare, Little Chalfont, UK) connected to Superdex® 200 HR26/60 (GE Healthcare, Little Chalfont, UK) pre-equilibrated with gel filtration buffer (50 mM Tris pH 7.5 and 150 mM NaCl). FPLC eluate peak of EPN showed one major peak, and was concentrated to yield ~13 mg/mL (~200 µL) of frog EPN protein. Absorptivity coefficient of ε = 1.8 (mg/mL)−1 cm−1 at λ = 280 nm was calculated by using the numbers of tyrosine and tryptophan in the protein [17]. The homogeneity of the final frog EPN was checked using SDS-PAGE under both reducing (with 5 mM DTT) and non-reducing (without DTT) conditions (Figure 2) and the aliquoted protein flash-frozen in liquid nitrogen for storage in −80 °C.
2.2. Circular Dichroism (CD)
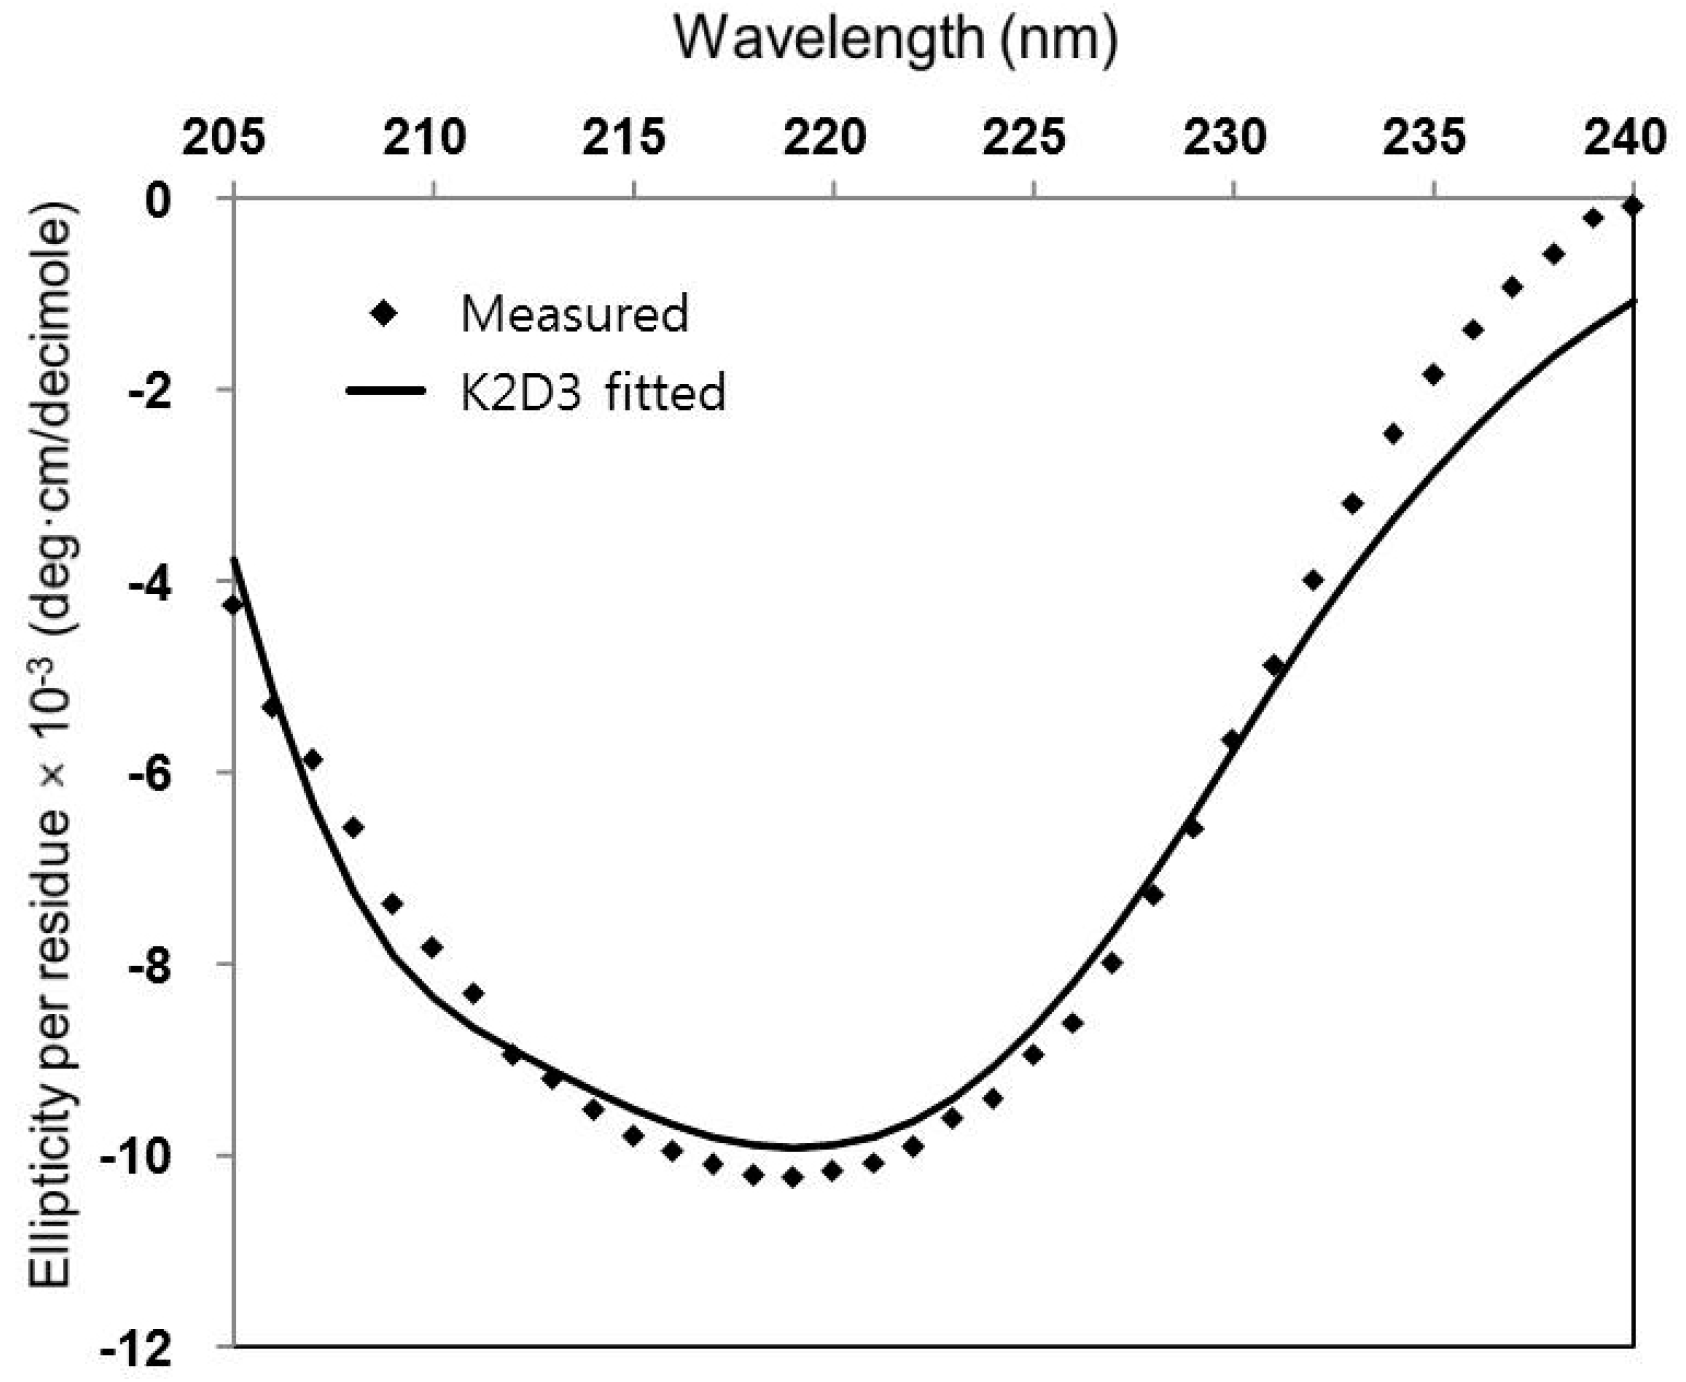
Proper folding and further secondary structure element content of the purified frog EPN protein were analyzed using circular dichroism (CD). Ellipticity was scanned over 205~240 nm wavelength on a JASCO spectropolarimeter (Model J-810, Tokyo, Japan) where a concentration of 0.2 mg/mL frog EPN in 0.1 cm path-length cuvette was used. The ellipticity data was fitted using a secondary structure estimation program K2D3 [18] to approximate the secondary structure content (Figure 3).
2.3. Crystallization
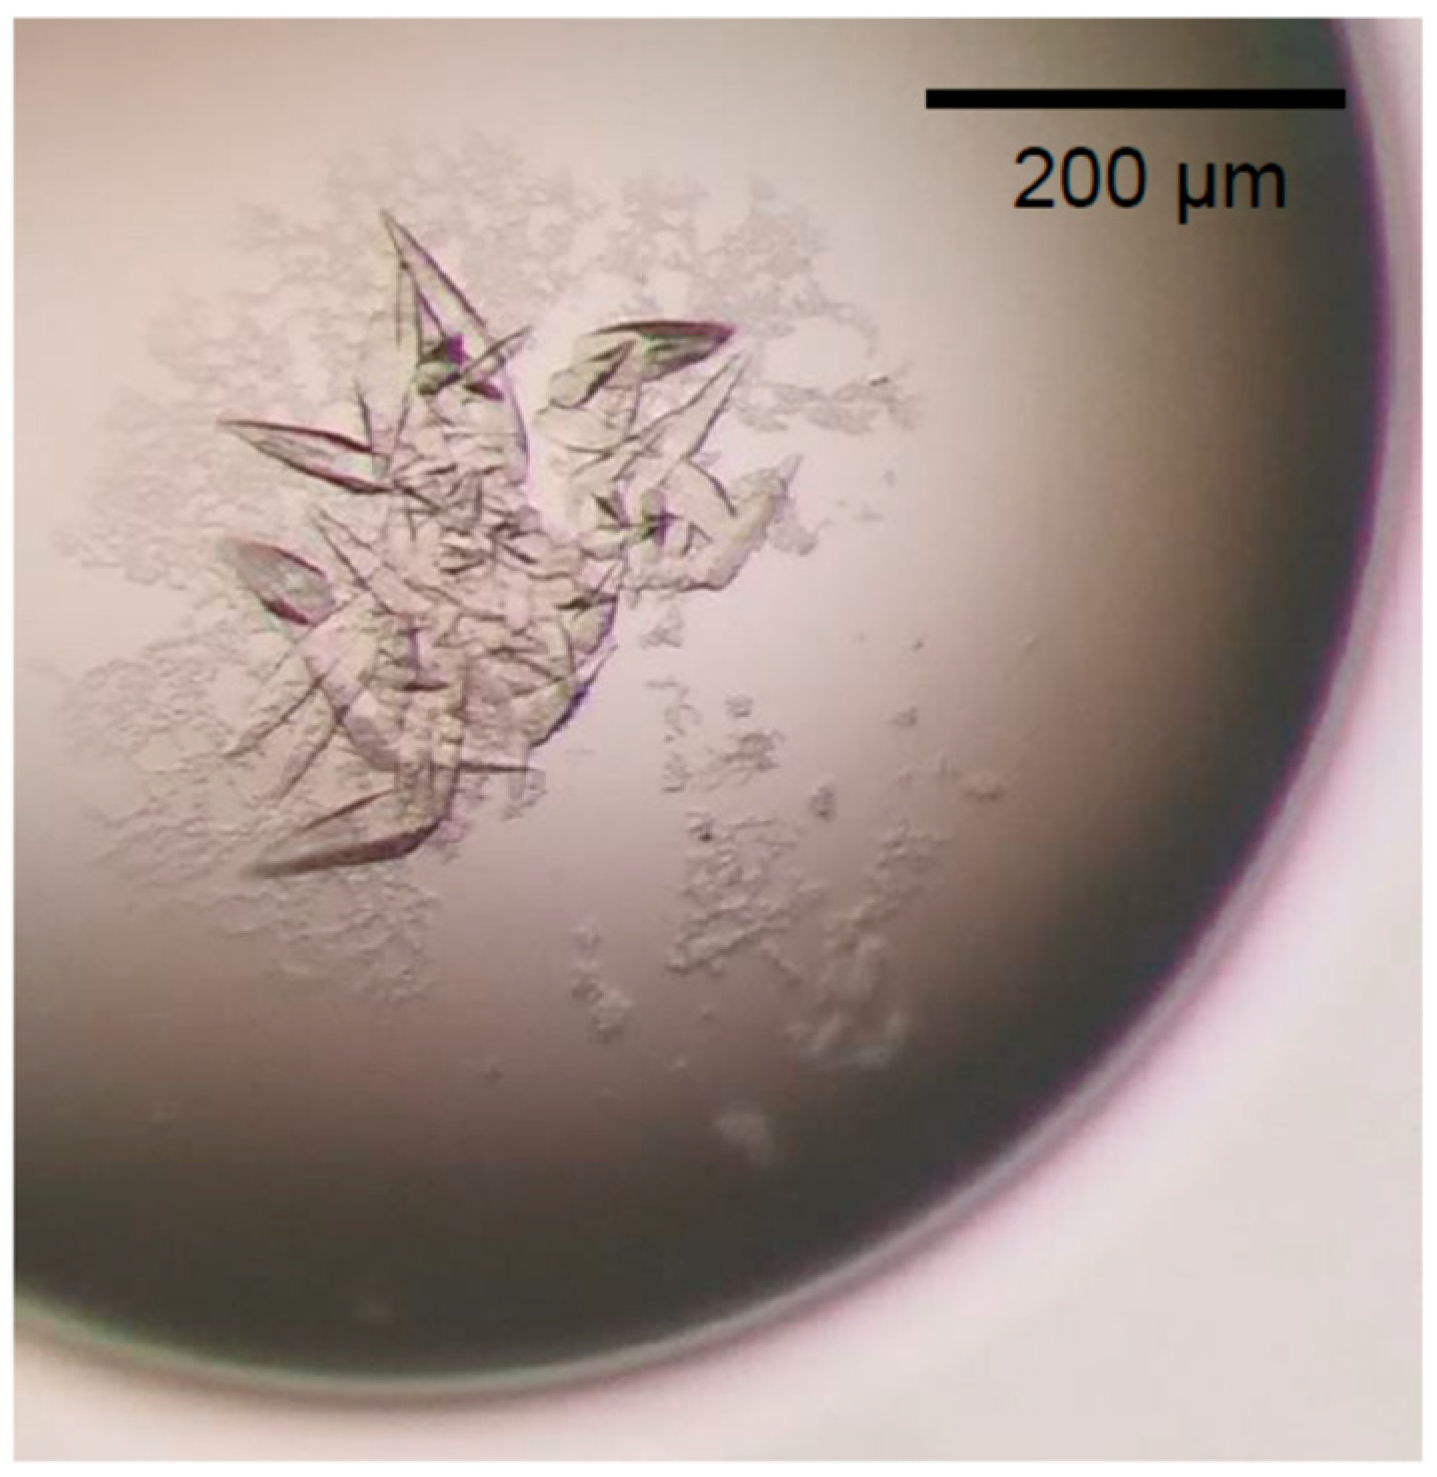
Commercial screening solutions (Hampton Research, Aliso Viejo, CA, USA) were used to screen for frog EPN crystals. Single crystals appeared in a well reservoir of 0.2 M Calcium acetate hydrate, 0.1 M Sodium cacodylate trihydrate pH 6.5, and 18% (w/v) Polyethylene glycol 8000 in ~2 days over a hanging drop at 22 °C (Figure 3). A single crystal was transferred to a cryo-protectant solution which was made by adding glycerol to the reservoir solution to final 20% concentration, and flash-cooled in liquid nitrogen for storage. The frozen crystal was transported to a synchrotron facility where diffraction experiment was performed (Figure 4).
2.4. Data Collection and Processing
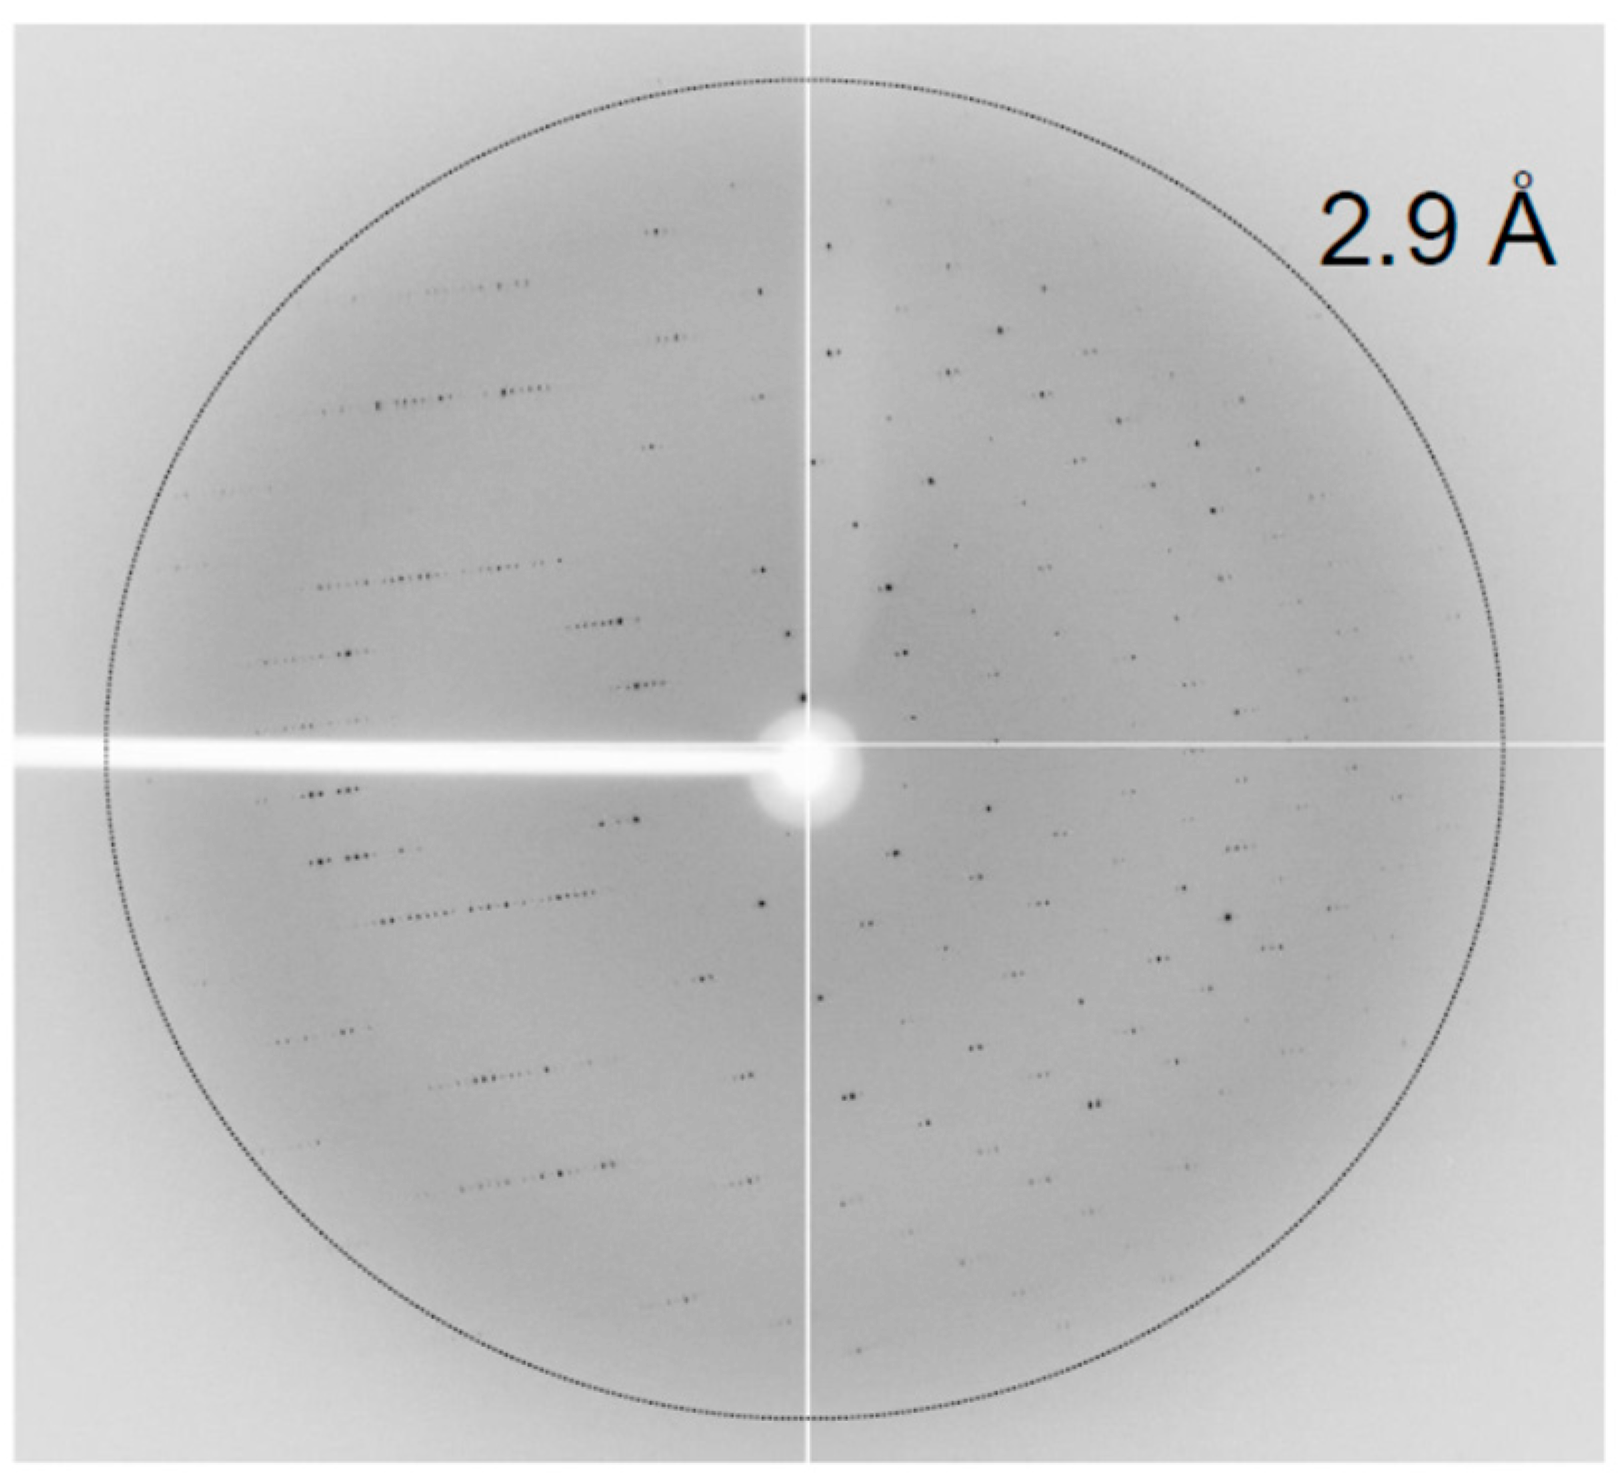
X-ray diffraction data were collected under a liquid nitrogen stream (100 K) on a CCD detector (ADSC Quantum Q270) at beamline 7A of PLS (Pohang, Korea). The crystal was rotated with 1.0° oscillation per frame to a total of 180° for complete data collection. Data were processed using HKL2000 [19] to a space group of P6122 (or P6522) (Table 2).
3. Results and Discussion
Although EPN is a protein that is similar among various species (Figure 1), neither the functional role (other than in fish) nor the detailed mechanism of action are known. In this study, the DNA encoding the frog (X. tropicalis) EPN without the signal sequence was generated by gene-synthesis and cloned into a pAcGP67A vector for secreted recombinant expression in SF9 insect cells. Of note, all attempts in using Escherichia coli bacterial expression of the same protein in various vectors and competent cells failed, which led us to depend on the eukaryotic expression system of using insect cells. The EPN protein was successfully over-expressed in a soluble form and was secreted into the media. The SEC elution profile of initial Ni-NTA purified frog EPN on HiLoad® 26/60 Superdex® 200 showed a single peak (Figure 2). The final SDS-PAGE analysis of the concentrated EPN protein under the peak indicated successful over-expression and purification of the EPN protein (Figure 2 inset). When looking at the size of the expressed frog EPN protein under reducing (5 mM DTT) condition, the molecular mass estimated based on standard protein markers seems to be ~33 kDa (Figure 2 inset) while the expected size calculated from the protein sequence is 22.8 kDa. This increased size in SDS-PAGE may be due to the N-glycosylations that are possible during expression within the insect cells. Also, unlike SDS-PAGE ran under reducing condition, non-reducing SDS-PAGE of the protein showed a single band corresponding to the size of a dimer. Hence, the frog EPN is likely associated into a dimer by at least one intermolecular disulfide bridge. The overall yield of the purified frog EPN was ~3 mg per 1 L of culture.
Due to the lack of functional studies that can be performed on the frog EPN, circular dichroism (CD) was used to determine that the recombinant protein had proper folding. Furthermore, secondary structure contents of frog EPN were estimated using the CD data (Figure 3). When the experimental ellipticity values of 205~240 nm range were fitted for secondary structure estimation, the result indicated that ~19% of the protein are α-helical and ~33% of the protein are of β-strands (Figure 3).
Despite the fact that the purified frog EPN may contain N-glycosylation which often result in difficulties in crystallizing proteins [20], crystals of frog EPN were obtained by screening against commercial solutions (Figure 4). Single crystals were grown and optimized in a reservoir solution of 0.2 M Calcium acetate hydrate, 0.1 M Sodium cacodylate trihydrate pH 6.5, and 18% (w/v) Polyethylene glycol 8000 at 22 °C. In ~2 days, the EPN crystal grew to approximately 10 μm × 10 μm × 100 μm (Figure 4) in size, which was sufficiently sized for X-ray diffraction experiments. The crystal diffracted well in a synchrotron X-ray radiation maintaining isotropic diffraction throughout all 180° rotation (Figure 5). A total of 7871 unique reflections were measured throughout 180° rotation and merged in the space group P6122 (or P6522) with unit cell parameters of a = b = 61.05 Å, and c = 234.33 Å. The merged dataset was overall 99.6% complete with Rmerge of 11.8% and Rp.i.m. of 2.9% to 2.70 Å resolution. Further diffraction statistics for the data collected are shown in Table 2. Matthews coefficient analysis [21] using the unit cell parameters, space group and the calculated molecular mass of protein only (22.8 kDa) indicated that the crystal volume per protein mass (VM) of the EPN crystal was 2.76 Å3 Da−1 with 55.4% solvent content. Instead of the calculated molecular mass, using the apparent molecular mass of ~33 kDa from SDS-PAGE analysis, which likely results from N-glycosylation, led to VM of 1.90 Å3 Da−1 and 35.4% solvent content. In both cases, these values suggested that the asymmetric unit of EPN crystal likely contains only one subunit of the monomeric frog EPN. Because no model for EPN exists in the Protein Databank (PDB), attempts for phasing via molecular replacement couldn’t be made.
In the future, we plan to improve the current 2.7 Å resolution crystal for better diffraction, and determine the high resolution structure of frog EPN by direct phasing. During the process, we plan to exploit conventional metal soaking [22] and other well-known techniques to work such as the use of (Ta6Br12)2+ [23] or 5-amino-2,4,6-triiodoisophthalic acid [24], and even sulfur-SAD [25,26] or ultraviolet radiation damage-induced phasing (UV-RIP) [27] methods. Since no structural information on any EPN exists in databases, the structure would give us insight into understanding its function.
Author Contributions
SY.P. and J.K.P. conceived and designed the experiments; J.K.P. and Y.W.S. performed the experiments; J.K.P. analyzed the data; SY.P. wrote the paper.
Funding
This research was supported by the Basic Science Program through the National Research Foundation of Korea (NRF) funded by the Ministry of Science, ICT & Future Planning (2016R1D1A1A09918187).
Acknowledgments
The authors would like to thank the staff at PAL 7A beamline for their support and beam time.
Conflicts of Interest
The authors declare no conflict of interest.
References
- Shashoua, V.E. Brain metabolism and the acquisition of new behaviors. I. Evidence for specific changes in the pattern of protein synthesis. Brain Res. 1976, 111, 347–364. [Google Scholar] [CrossRef]
- Benowitz, L.I.; Shashoua, V.E. Localization of a brain protein metabolically linked with behavioral plasticity in the goldfish. Brain Res. 1977, 136, 227–242. [Google Scholar] [CrossRef]
- Shashoua, V.E. Brain protein metabolism and the acquisition of new patterns of behavior. Proc. Natl. Acad. Sci. USA 1977, 74, 1743–1747. [Google Scholar] [CrossRef] [PubMed]
- Shashoua, V.E. Ependymin, a brain extracellular glycoprotein, and CNS plasticity. Ann. N. Y. Acad. Sci. 1991, 627, 94–114. [Google Scholar] [CrossRef] [PubMed]
- Schmidt, R. Cell-adhesion molecules in memory formation. Behav. Brain Res. 1995, 66, 65–72. [Google Scholar] [CrossRef]
- Tang, S.J.; Sun, K.H.; Sun, G.H.; Lin, G.; Lin, W.W.; Chuang, M.J. Cold-induced ependymin expression in zebrafish and carp brain: Implications for cold acclimation. FEBS Lett. 1999, 459, 95–99. [Google Scholar] [CrossRef]
- Sneddon, L.U.; Schmidt, R.; Fang, Y.; Cossins, A.R. Molecular correlates of social dominance: A novel role for ependymin in aggression. PLoS ONE 2011, 6, e18181. [Google Scholar] [CrossRef] [PubMed]
- Apostolopoulos, J.; Sparrow, R.L.; McLeod, J.L.; Collier, F.M.; Darcy, P.K.; Slater, H.R.; Ngu, C.; Gregorio-King, C.C.; Kirkland, M.A. Identification and characterization of a novel family of mammalian ependymin-related proteins (MERPs) in hematopoietic, nonhematopoietic, and malignant tissues. DNA Cell Biol. 2001, 20, 625–635. [Google Scholar] [CrossRef] [PubMed]
- Gregorio-King, C.C.; McLeod, J.L.; Collier, F.M.; Collier, G.R.; Bolton, K.A.; Van Der Meer, G.J.; Apostolopoulos, J.; Kirkland, M.A. MERP1: A mammalian ependymin-related protein gene differentially expressed in hematopoietic cells. Gene 2002, 286, 249–257. [Google Scholar] [CrossRef]
- Nimmrich, I.; Erdmann, S.; Melchers, U.; Chtarbova, S.; Finke, U.; Hentsch, S.; Hoffmann, I.; Oertel, M.; Hoffmann, W.; Müller, O. The novel ependymin related gene UCC1 is highly expressed in colorectal tumor cells. Cancer Lett. 2001, 165, 71–79. [Google Scholar] [CrossRef]
- Müller-Schmid, A.; Rinder, H.; Lottspeich, F.; Gertzen, E.M.; Hoffmann, W. Ependymins from the cerebrospinal fluid of salmonid fish: Gene structure and molecular characterization. Gene 1992, 118, 189–196. [Google Scholar] [CrossRef]
- Königstorfer, A.; Sterrer, S.; Hoffmann, W. Biosynthesis of ependymins from goldfish brain. J. Biol. Chem. 1989, 264, 13689–13692. [Google Scholar] [PubMed]
- Shashoua, V.E.; Adams, D.; Boyer-Boiteau, A. CMX-8933, a peptide fragment of the glycoprotein ependymin, promotes activation of AP-1 transcription factor in mouse neuroblastoma and rat cortical cell cultures. Neurosci. Lett. 2001, 312, 103–107. [Google Scholar] [CrossRef]
- Adams, D.S.; Hasson, B.; Boyer-Boiteau, A.; El-Khishin, A.; Shashoua, V.E. A peptide fragment of ependymin neurotrophic factor uses protein kinase C and the mitogen-activated protein kinase pathway to activate c-Jun N-terminal kinase and a functional AP-1 containing c-Jun and c-Fos proteins in mouse NB2a cells. J. Neurosci. Res. 2003, 72, 405–416. [Google Scholar] [CrossRef] [PubMed]
- Kaska, J. Ependymin Mechanism of Action: Full Length EPN vs Peptide CMX-8933. Master’s Thesis, Worcester Polytechnic Institute, Worcester, MA, USA, 28 May 2003. [Google Scholar]
- Suárez-Castillo, E.C.; García-Arrarás, J.E. Molecular evolution of the ependymin protein family: A necessary update. BMC Evol. Biol. 2007, 7, 23. [Google Scholar] [CrossRef] [PubMed]
- Gill, S.C.; von Hippel, P.H. Calculation of protein extinction coefficients from amino acid sequence data. Anal. Biochem. 1989, 182, 319–326. [Google Scholar] [CrossRef]
- Louis-Jeune, C.; Andrade-Navarro, M.A.; Perez-Iratxeta, C. Prediction of protein secondary structure from circular dichroism using theoretically derived spectra. Proteins 2012, 80, 374–381. [Google Scholar] [CrossRef] [PubMed]
- Otwinowski, Z.; Minor, W. Processing of X-ray Diffraction Data Collected in Oscillation Mode. Methods Enzymol. 1997, 276, 307–326. [Google Scholar] [CrossRef] [PubMed]
- Chang, V.T.; Crispin, M.; Aricescu, A.R.; Harvey, D.J.; Nettleship, J.E.; Fennelly, J.A.; Yu, C.; Boles, K.S.; Evans, E.J.; Stuart, D.I.; et al. Glycoprotein Structural Genomics: Solving the Glycosylation Problem. Structure 2007, 15, 267–273. [Google Scholar] [CrossRef] [PubMed] [Green Version]
- Matthews, B.W. Solvent content of protein crystals. J. Mol. Biol. 1968, 33, 491–497. [Google Scholar] [CrossRef]
- Pike, A.C.; Garman, E.F.; Krojer, T.; von Delft, F.; Carpenter, E.P. An overview of heavy-atom derivatization of protein crystals. Acta Crystallogr. D Struct. Biol. 2016, 72, 303–318. [Google Scholar] [CrossRef] [PubMed] [Green Version]
- Pasternak, O.; Bujacz, A.; Biesiadka, J.; Bujacz, G.; Sikorski, M.; Jaskolski, M. MAD phasing using the (Ta6Br12)2+ cluster: A retrospective study. Acta Crystallogr. D Struct. Biol. 2008, 64, 595–606. [Google Scholar] [CrossRef] [PubMed]
- Sippel, K.H.; Robbins, A.H.; Reutzel, R.; Domsic, J.; Boehlein, S.K.; Govindasamy, L.; Agbandje-McKenna, M.; Rosser, C.J.; McKenna, R. Structure determination of the cancer-associated Mycoplasma hyorhinis protein Mh-p37. Acta Crystallogr. D Struct. Biol. 2008, 64, 1172–1178. [Google Scholar] [CrossRef] [PubMed]
- El Omari, K.; Iourin, O.; Kadlec, J.; Fearn, R.; Hall, D.R.; Harlos, K.; Grimes, J.M.; Stuart, D.I. Pushing the limits of sulfur SAD phasing: De novo structure solution of the N-terminal domain of the ectodomain of HCV E1. Acta Crystallogr. D Struct. Biol. 2014, 70, 2197–2203. [Google Scholar] [CrossRef] [PubMed]
- Gorgel, M.; Bøggild, A.; Ulstrup, J.J.; Weiss, M.S.; Müller, U.; Nissen, P.; Boesen, T. Against the odds? De novo structure determination of a pilin with two cysteine residues by sulfur SAD. Acta Crystallogr. D Struct. Biol. 2015, 71, 1095–1101. [Google Scholar] [CrossRef] [PubMed]
- Foos, N.; Seuring, C.; Schubert, R.; Burkhardt, A.; Svensson, O.; Meents, A.; Chapman, H.N.; Nanao, M.H. X-ray and UV radiation-damage-induced phasing using synchrotron serial crystallography. Acta Crystallogr. D Struct. Biol. 2018, 74, 366–378. [Google Scholar] [CrossRef] [PubMed] [Green Version]
Figure 1.
Protein sequence alignment of EPNs (without their N-terminal signal sequence) from various organisms. Homologous residues in all species are in green background. Predicted N-glycosylation sites are in red background. The four conserved cysteines are indicated with triangles on top. The mouse sequence is from Mus musculus EPDR2, the fish sequence is from Oncorhynchus mykiss (Rainbow trout), the frog sequence is from Xenopus tropicalis, and the sea urchin sequence is from Strongylocentrotus purpuratus (purple sea urchin). In comparison to the frog EPN sequence expressed in this study, the EPNs of fish (29%), sea urchin (43%), human (66%), and mouse (65%) all show sequence conservations (identity percent in parenthesis).

Figure 2.
Size-exclusion chromatogram of frog EPN near 228 mL elution volume with the SDS-PAGE results on the concentrated fractions under the peak (inset). Labels for inset are as follows: Protein standard marker (M); SDS-PAGE under reducing condition (A); SDS-PAGE under non-reducing condition (B).

Figure 3.
Circular dichroism study on the frog EPN.

Figure 4.
Crystals of frog EPN.

Figure 5.
Isotropic X-ray diffraction image of frog EPN crystal.


Table 1.
Macromolecule production information for frog EPN.
| Source Organism | Xenopus tropicalis |
|---|---|
| DNA source | Synthesized DNA |
| Cloning sites | BamHI and NotI |
| Cloning vector | pAcGP67A |
| Expression vector | pAcGP67A |
| Expression host | SF9 (S. frugiperda) |
| Complete amino acid sequence of the construct produced 1 | ADPHHHHHHHHPVTPCEAPLQWEGRIVLYDHNTGKNTRATVTYDAILQRIRILEEKKSFVPCKRFFEYIFLYQEAVMFQIEQVTKICSKNTLTEPWDPYDIPENSTYEDQYYIGGPGDQIPVQEWSDRKPARKYETWVGVYTVKDCYPVQETYTKNDSMTTSTRFFDIKLGISDPSVFNPPSTCEAAQPLLMSGDC |
1 Non-native His6-tag is underlined.
Table 2.
Data collection and processing.
| Diffraction Source | Pohang Light Source (PLS 7A) (Pohang, Korea) |
|---|---|
| Wavelength (Å) | 0.97934 |
| Temperature (K) | 100 |
| Detector | ADSC Quantum Q270 |
| Crystal-detector distance (mm) | 350 |
| Rotation range per image (°) | 1 |
| Total rotation range (°) | 180 |
| Exposure time per image (s) | 1 |
| Space group | P6122 (or P6522) |
| a, b, c (Å) | 61.05, 61.05, 234.33 |
| α, β, γ (°) | 90.0, 90.0, 120.0 |
| Mosaicity (°) | 0.496 |
| Resolution range (Å) | 50.0–2.70 (2.75–2.70) 1 |
| Total No. of reflections | 129,713 |
| No. of unique reflections | 7871 |
| Completeness (%) | 99.6 (100.0) |
| Redundancy | 16.6 (17.0) |
| 〈I/σ(I)〉 | 43.8 (3.7) |
| Rmerge | 0.118 (1.136) |
| Rp.i.m. | 0.029 (0.271) |
| CC1/2 | (0.886) |
| Overall B factor from Wilson plot (Å2) | 58.9 |
1 Values for the outer shell are given in parentheses.
© 2018 by the authors. Licensee MDPI, Basel, Switzerland. This article is an open access article distributed under the terms and conditions of the Creative Commons Attribution (CC BY) license (http://creativecommons.org/licenses/by/4.0/).
Share and Cite
MDPI and ACS Style
Park, J.K.; Sim, Y.W.; Park, S. Over-Expression, Secondary Structure Characterization, and Preliminary X-ray Crystallographic Analysis of Xenopus tropicalis Ependymin. Crystals 2018, 8, 284. https://doi.org/10.3390/cryst8070284
AMA Style
Park JK, Sim YW, Park S. Over-Expression, Secondary Structure Characterization, and Preliminary X-ray Crystallographic Analysis of Xenopus tropicalis Ependymin. Crystals. 2018; 8(7):284. https://doi.org/10.3390/cryst8070284
Chicago/Turabian StylePark, Jeong Kuk, Yeo Won Sim, and SangYoun Park. 2018. "Over-Expression, Secondary Structure Characterization, and Preliminary X-ray Crystallographic Analysis of Xenopus tropicalis Ependymin" Crystals 8, no. 7: 284. https://doi.org/10.3390/cryst8070284
Note that from the first issue of 2016, this journal uses article numbers instead of page numbers. See further details here.