The Effect of Skelp Thickness on Precipitate Size and Morphology for X70 Microalloyed Steel Using Rietveld Refinement (Quantitative X-ray Diffraction)

Abstract
:1. Introduction
2. Materials and Methods
2.1. Steels Analyzed
2.2. Matrix Dissolution and Precipitate Collection
2.3. ICP Analysis of the Supernatant Solution
2.4. XRD of the Solid Residue
2.5. Rietveld Refinement and Analysis
2.6. SEM-EDX Analysis of Collected Precipitates
3. Results
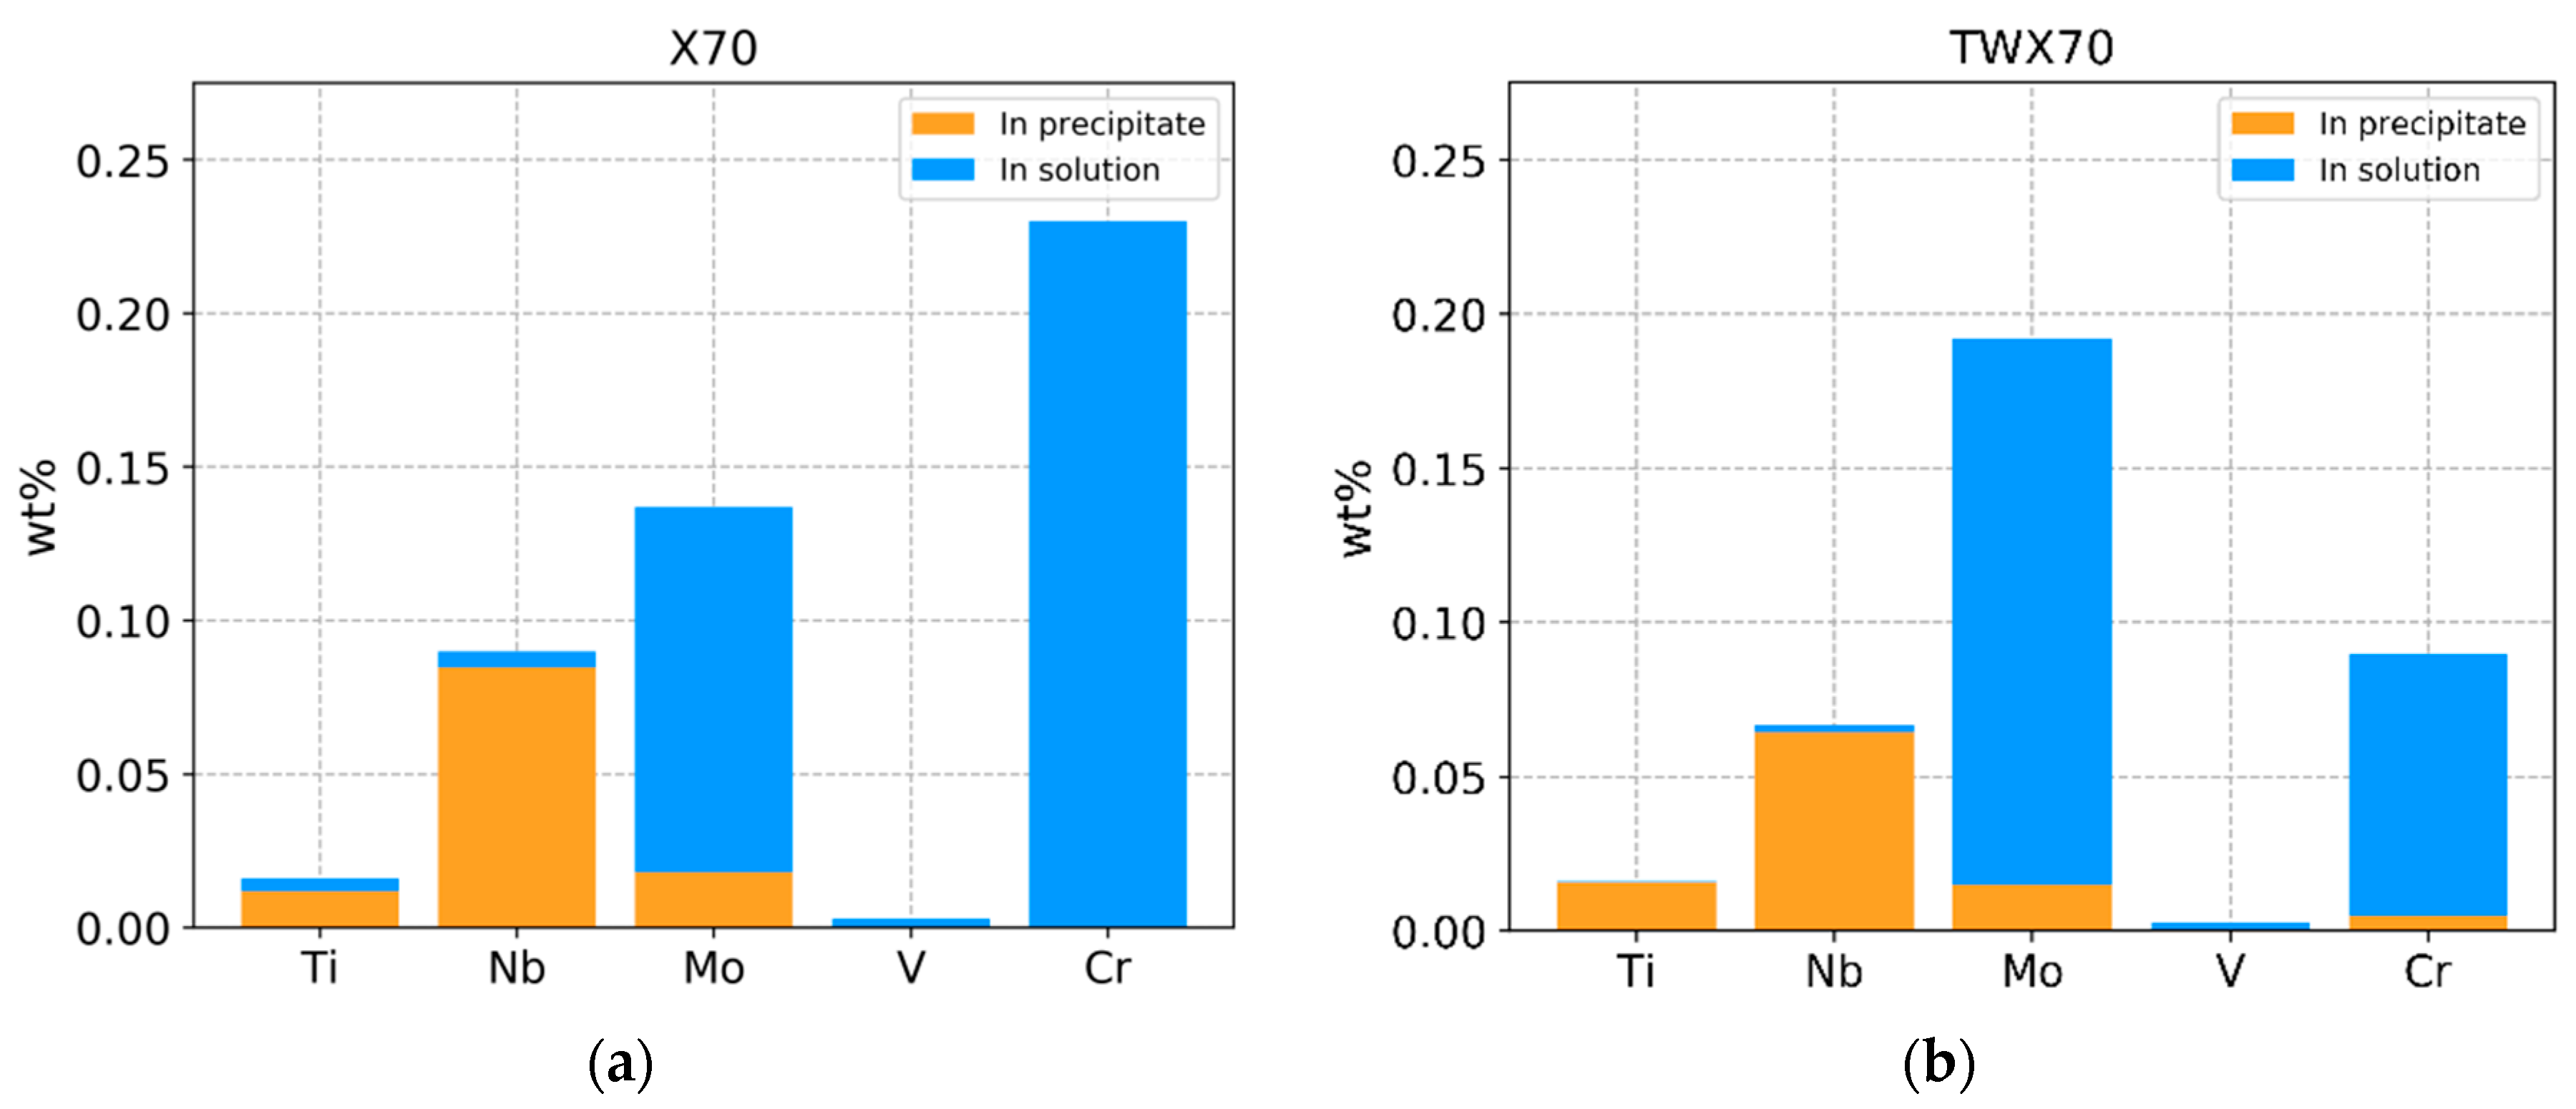
3.1. ICP Results
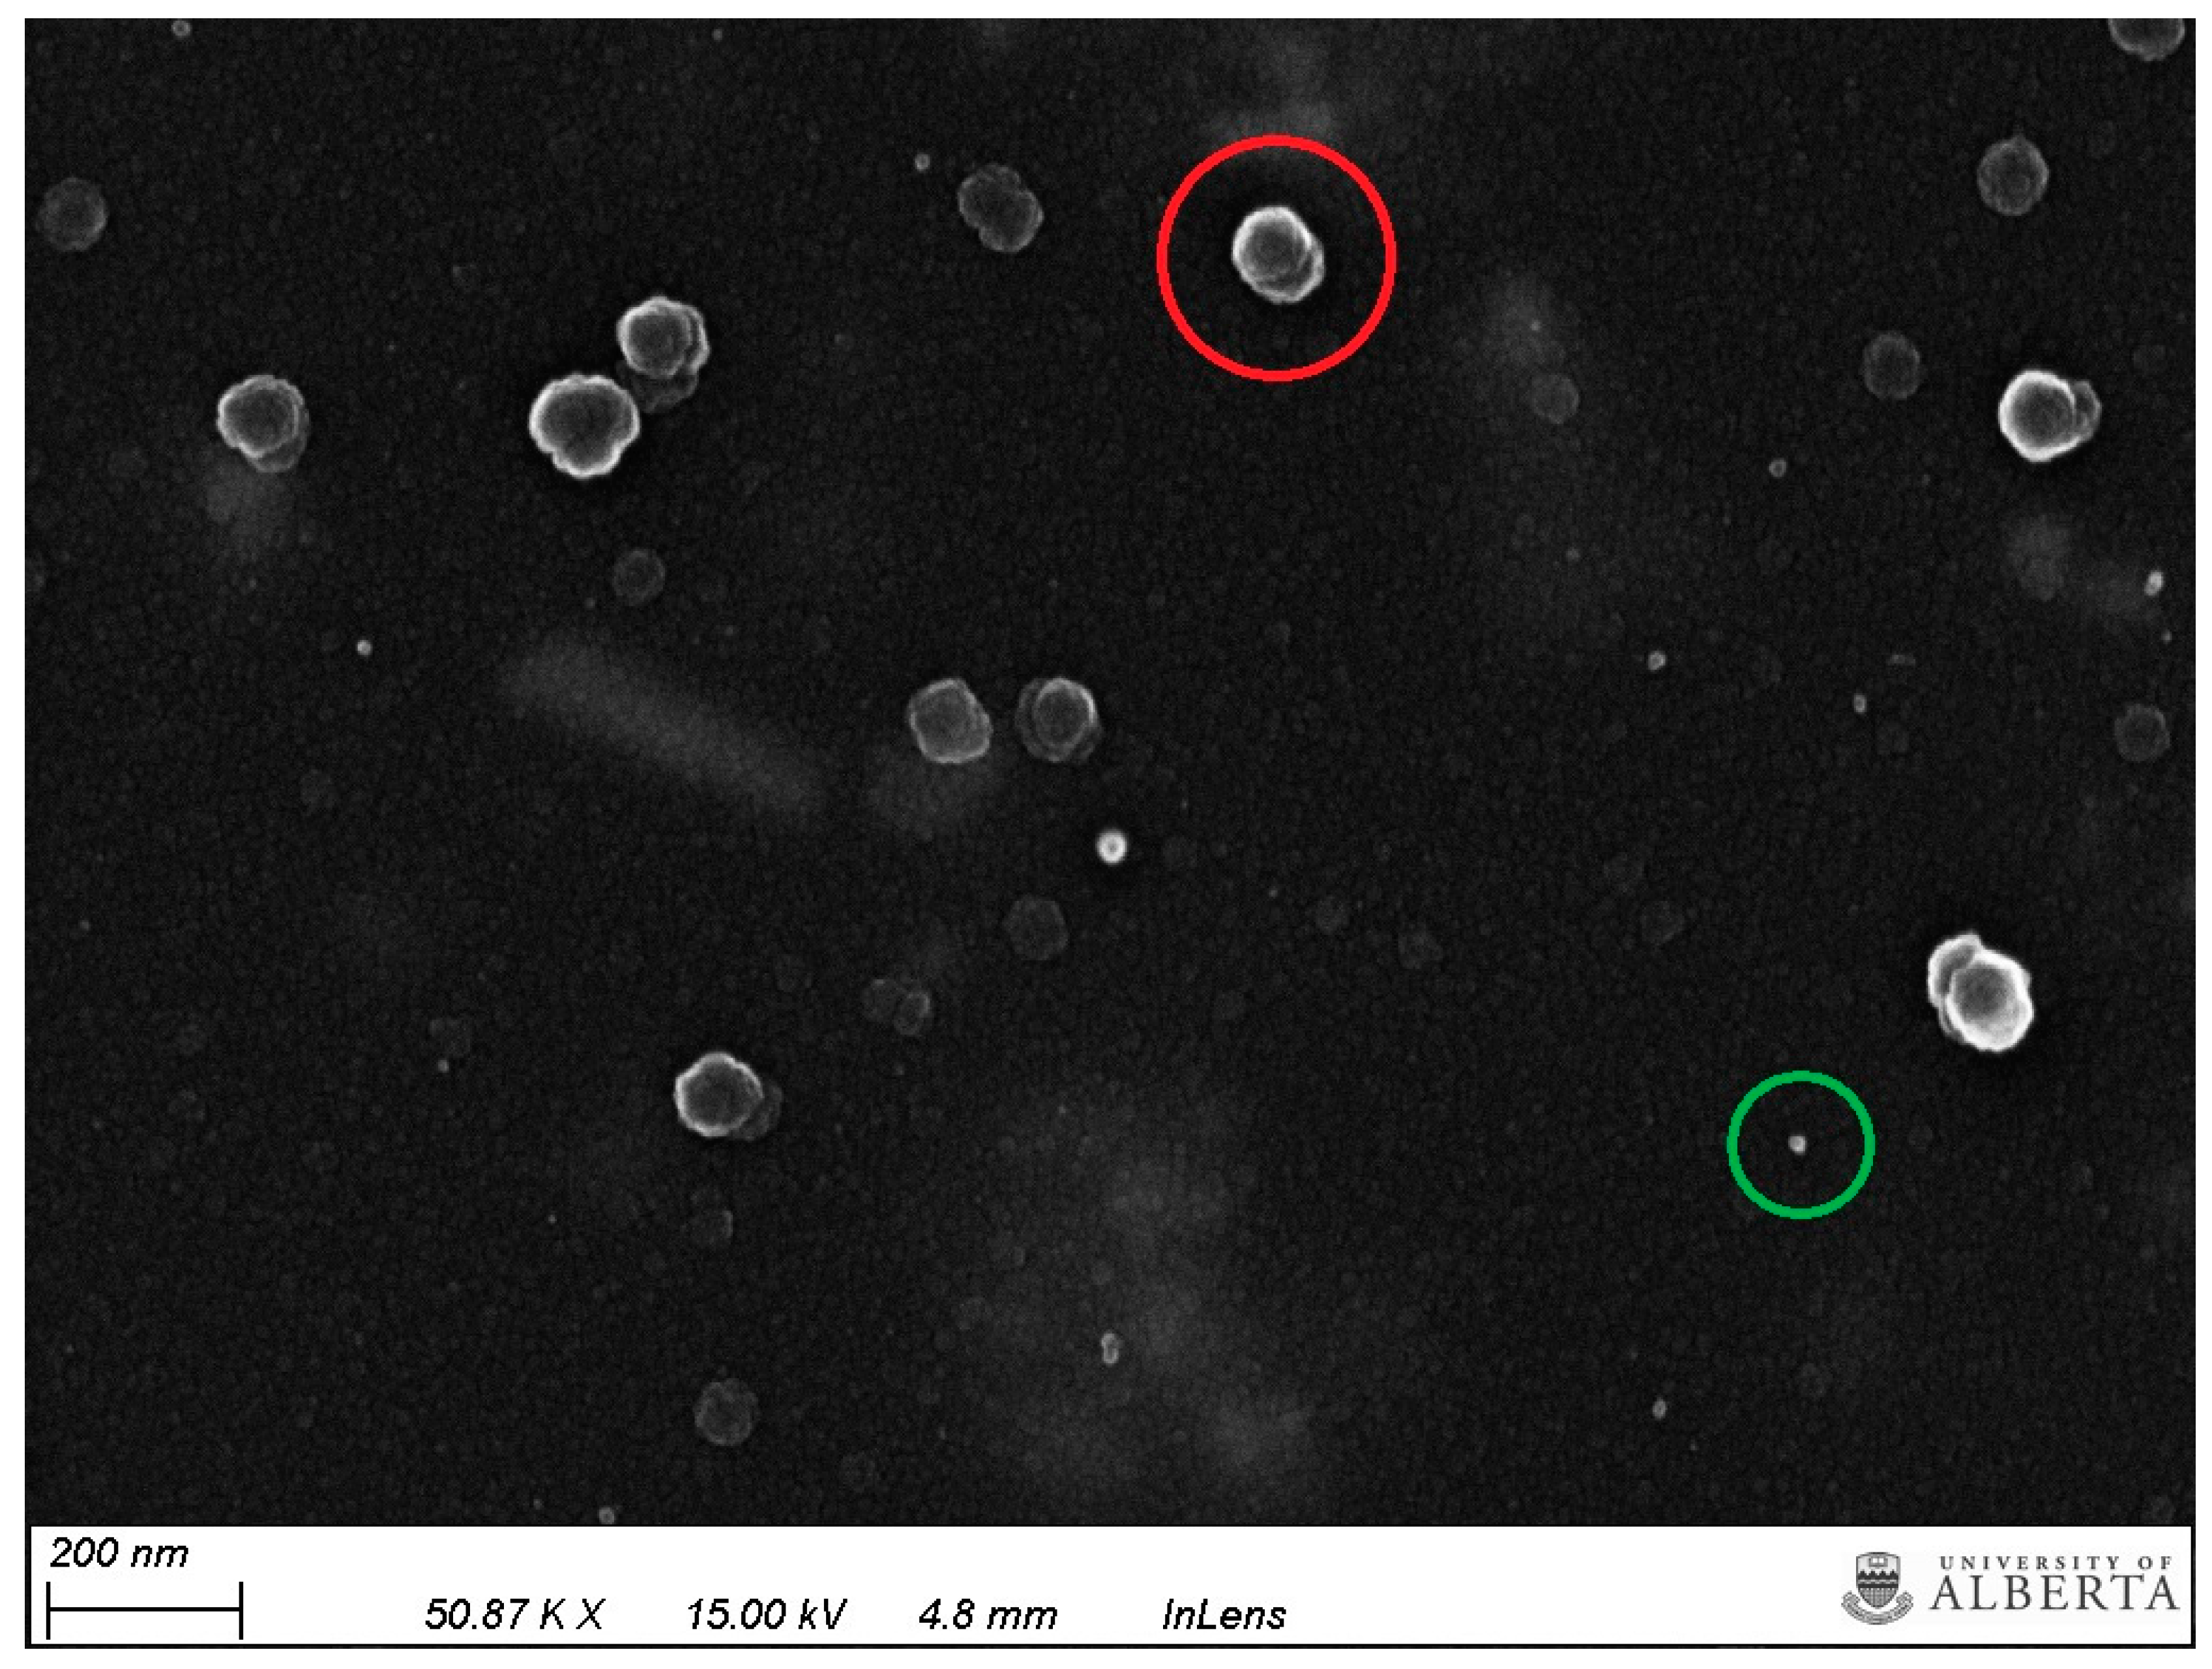
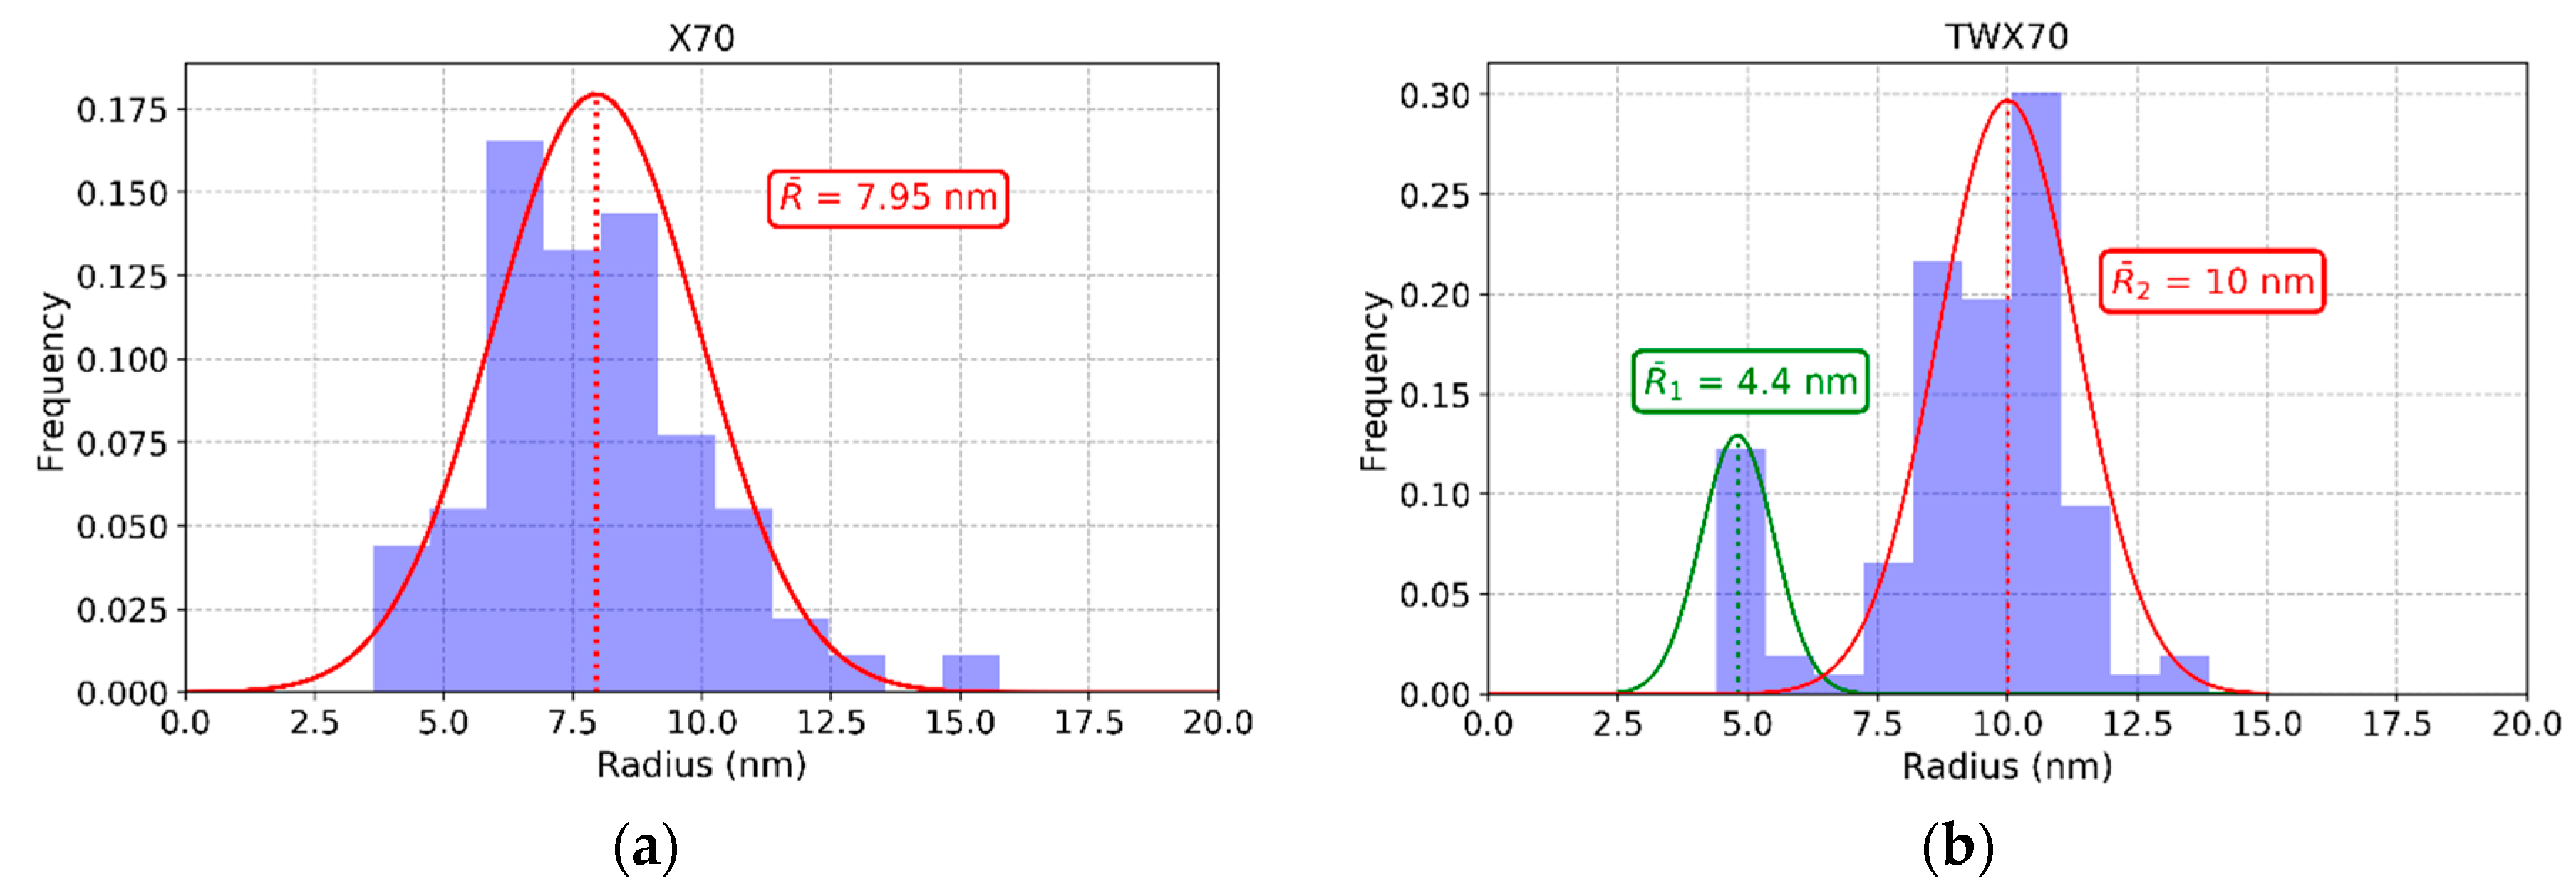
3.2. SEM Size Analysis
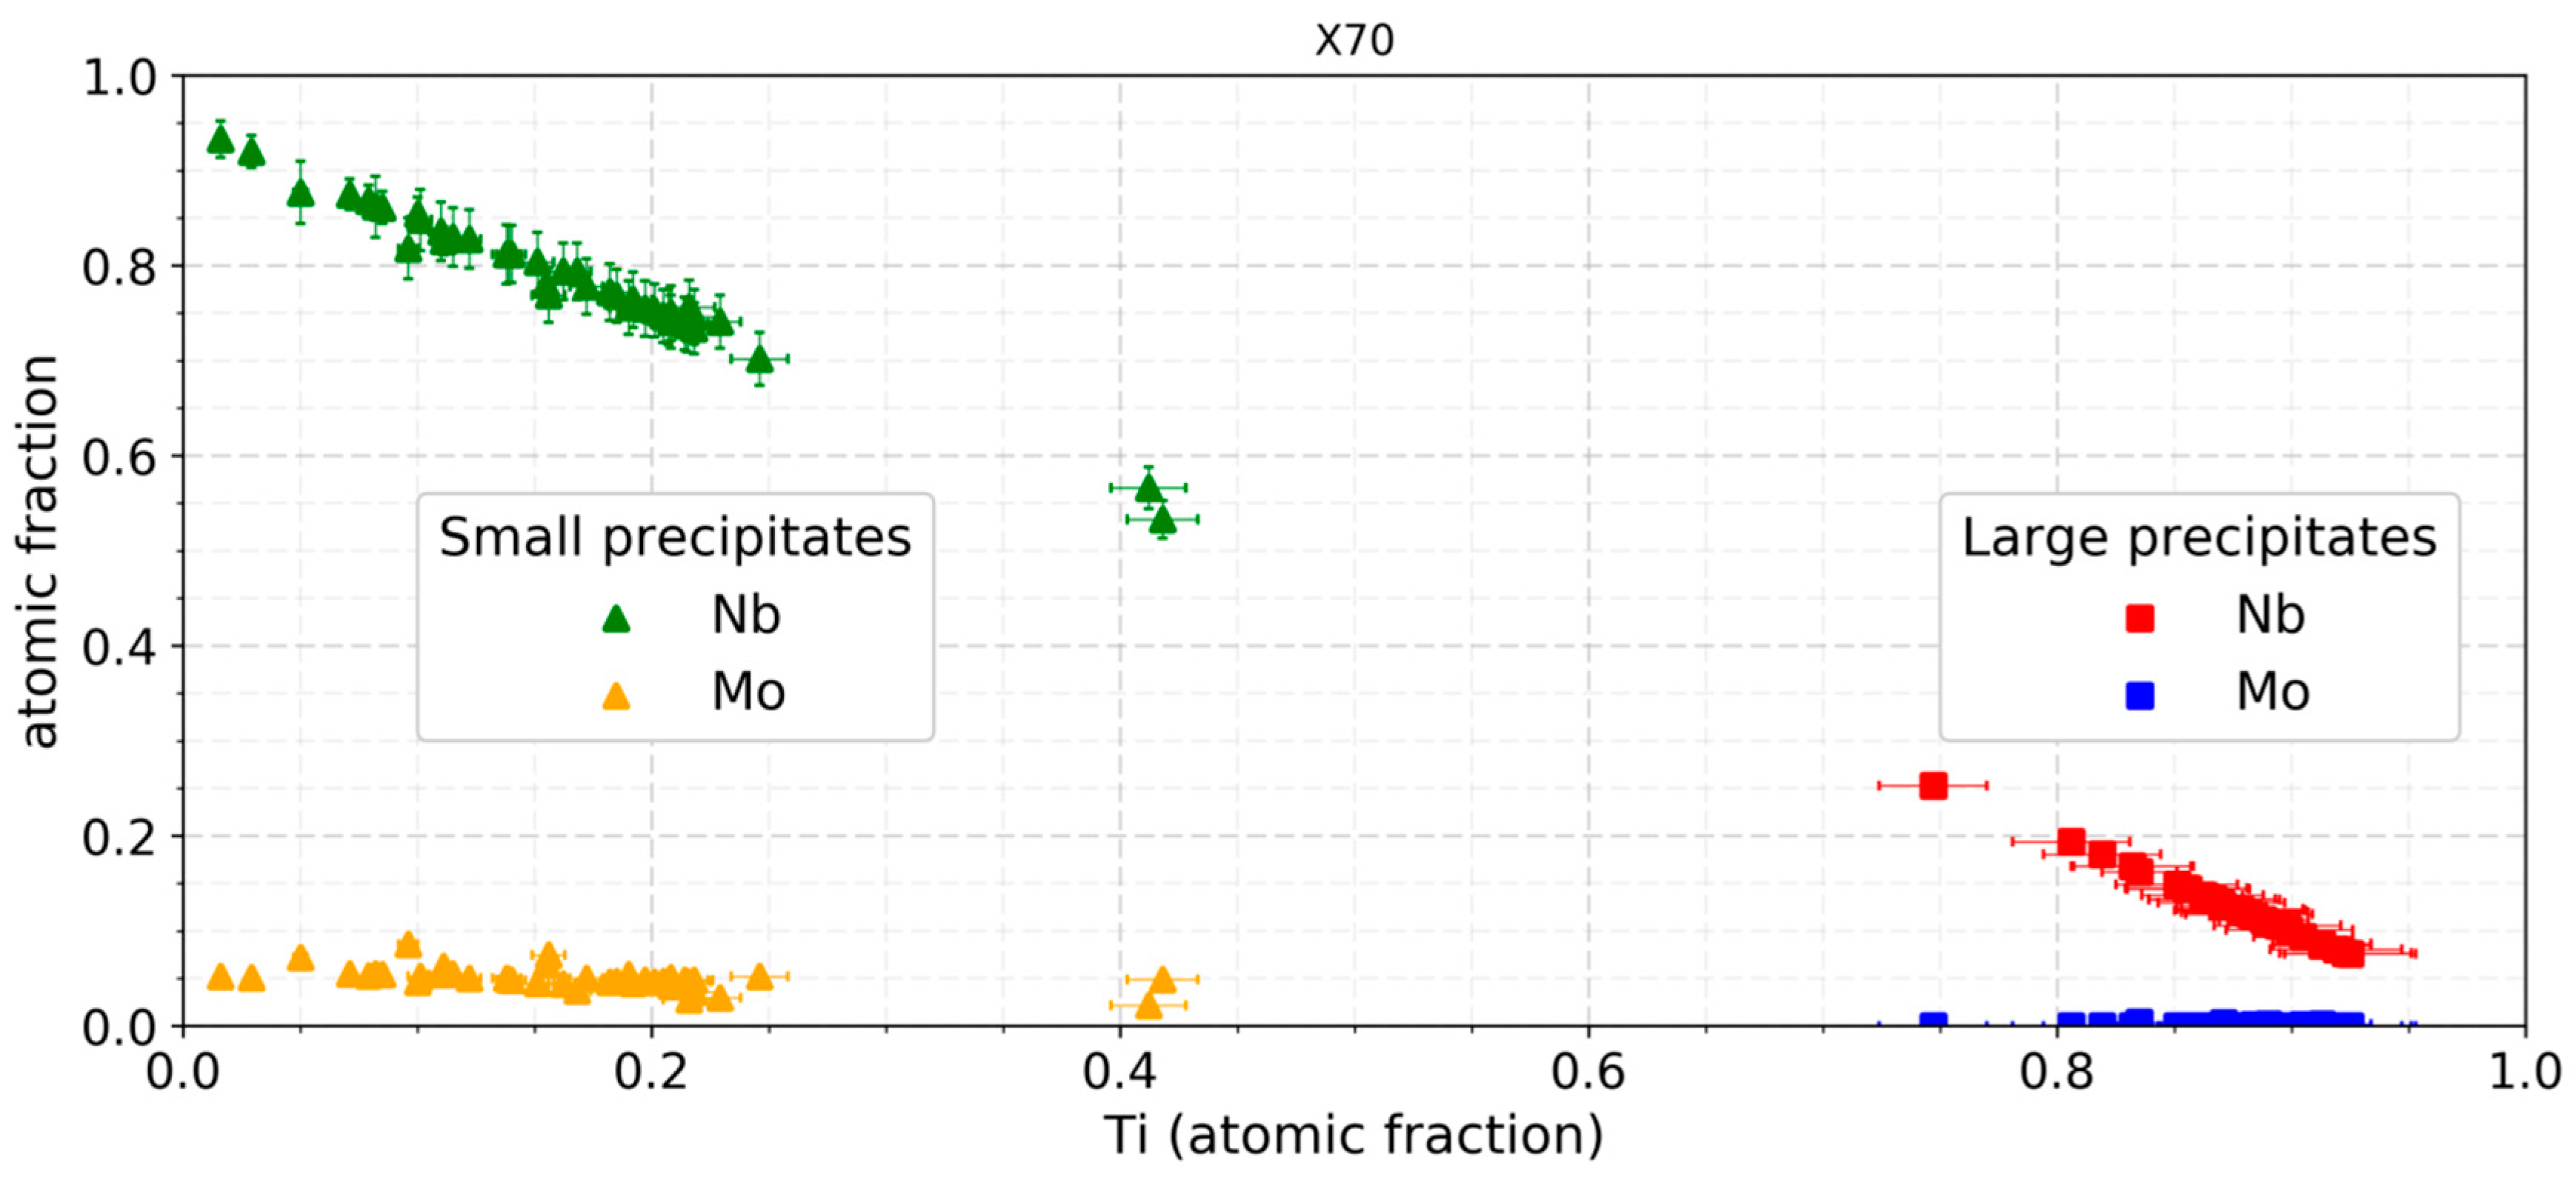
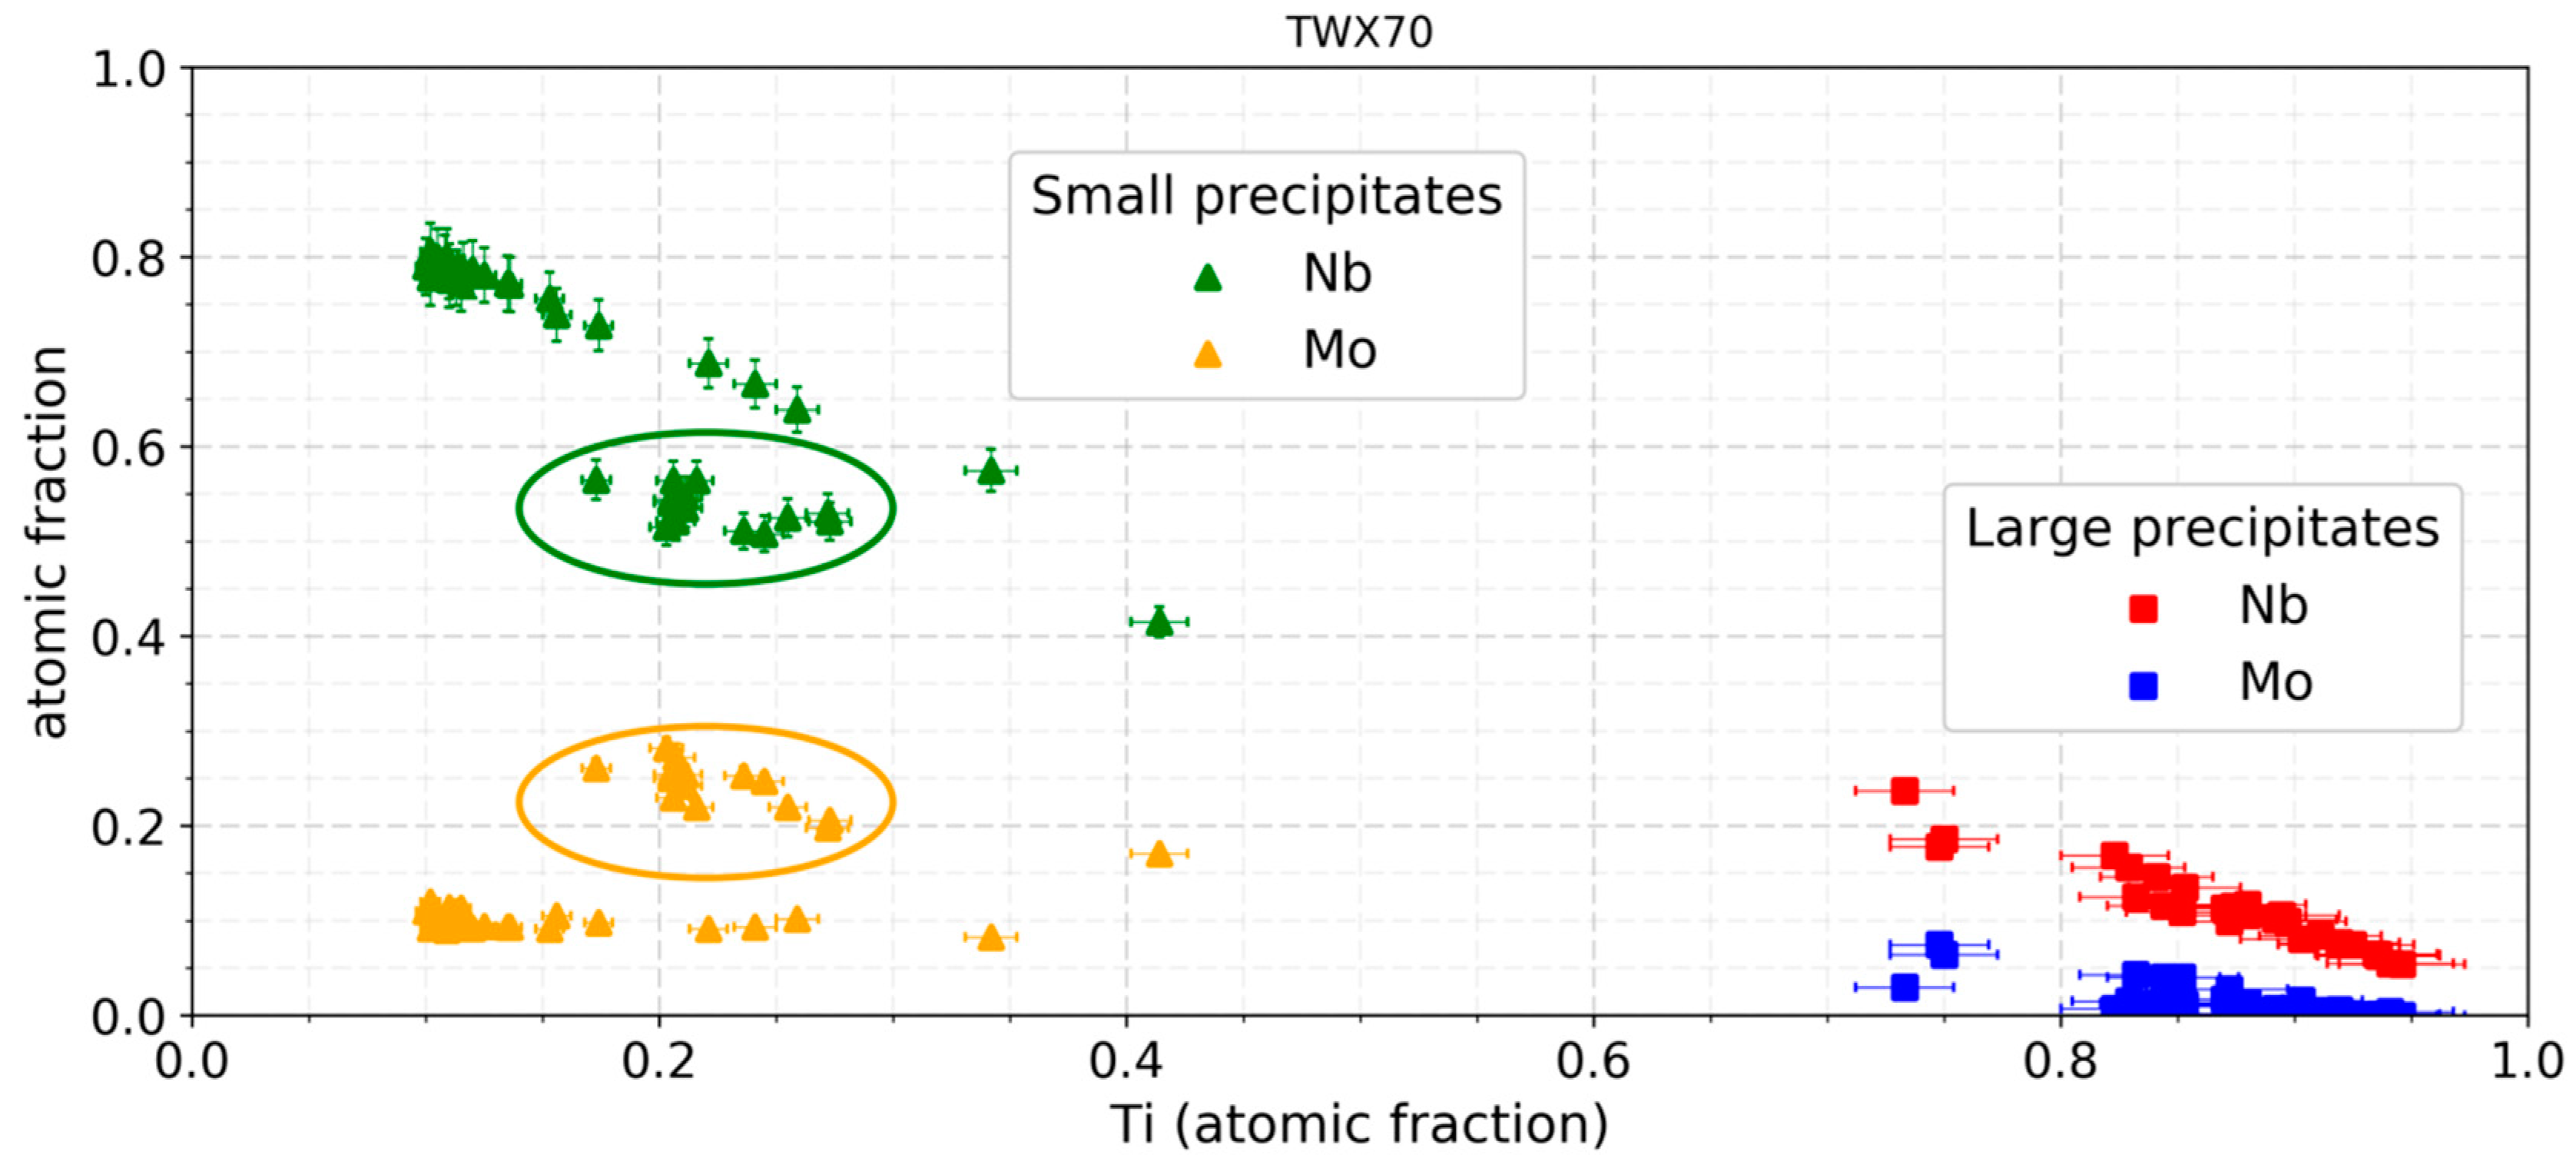
3.3. Composition Analysis
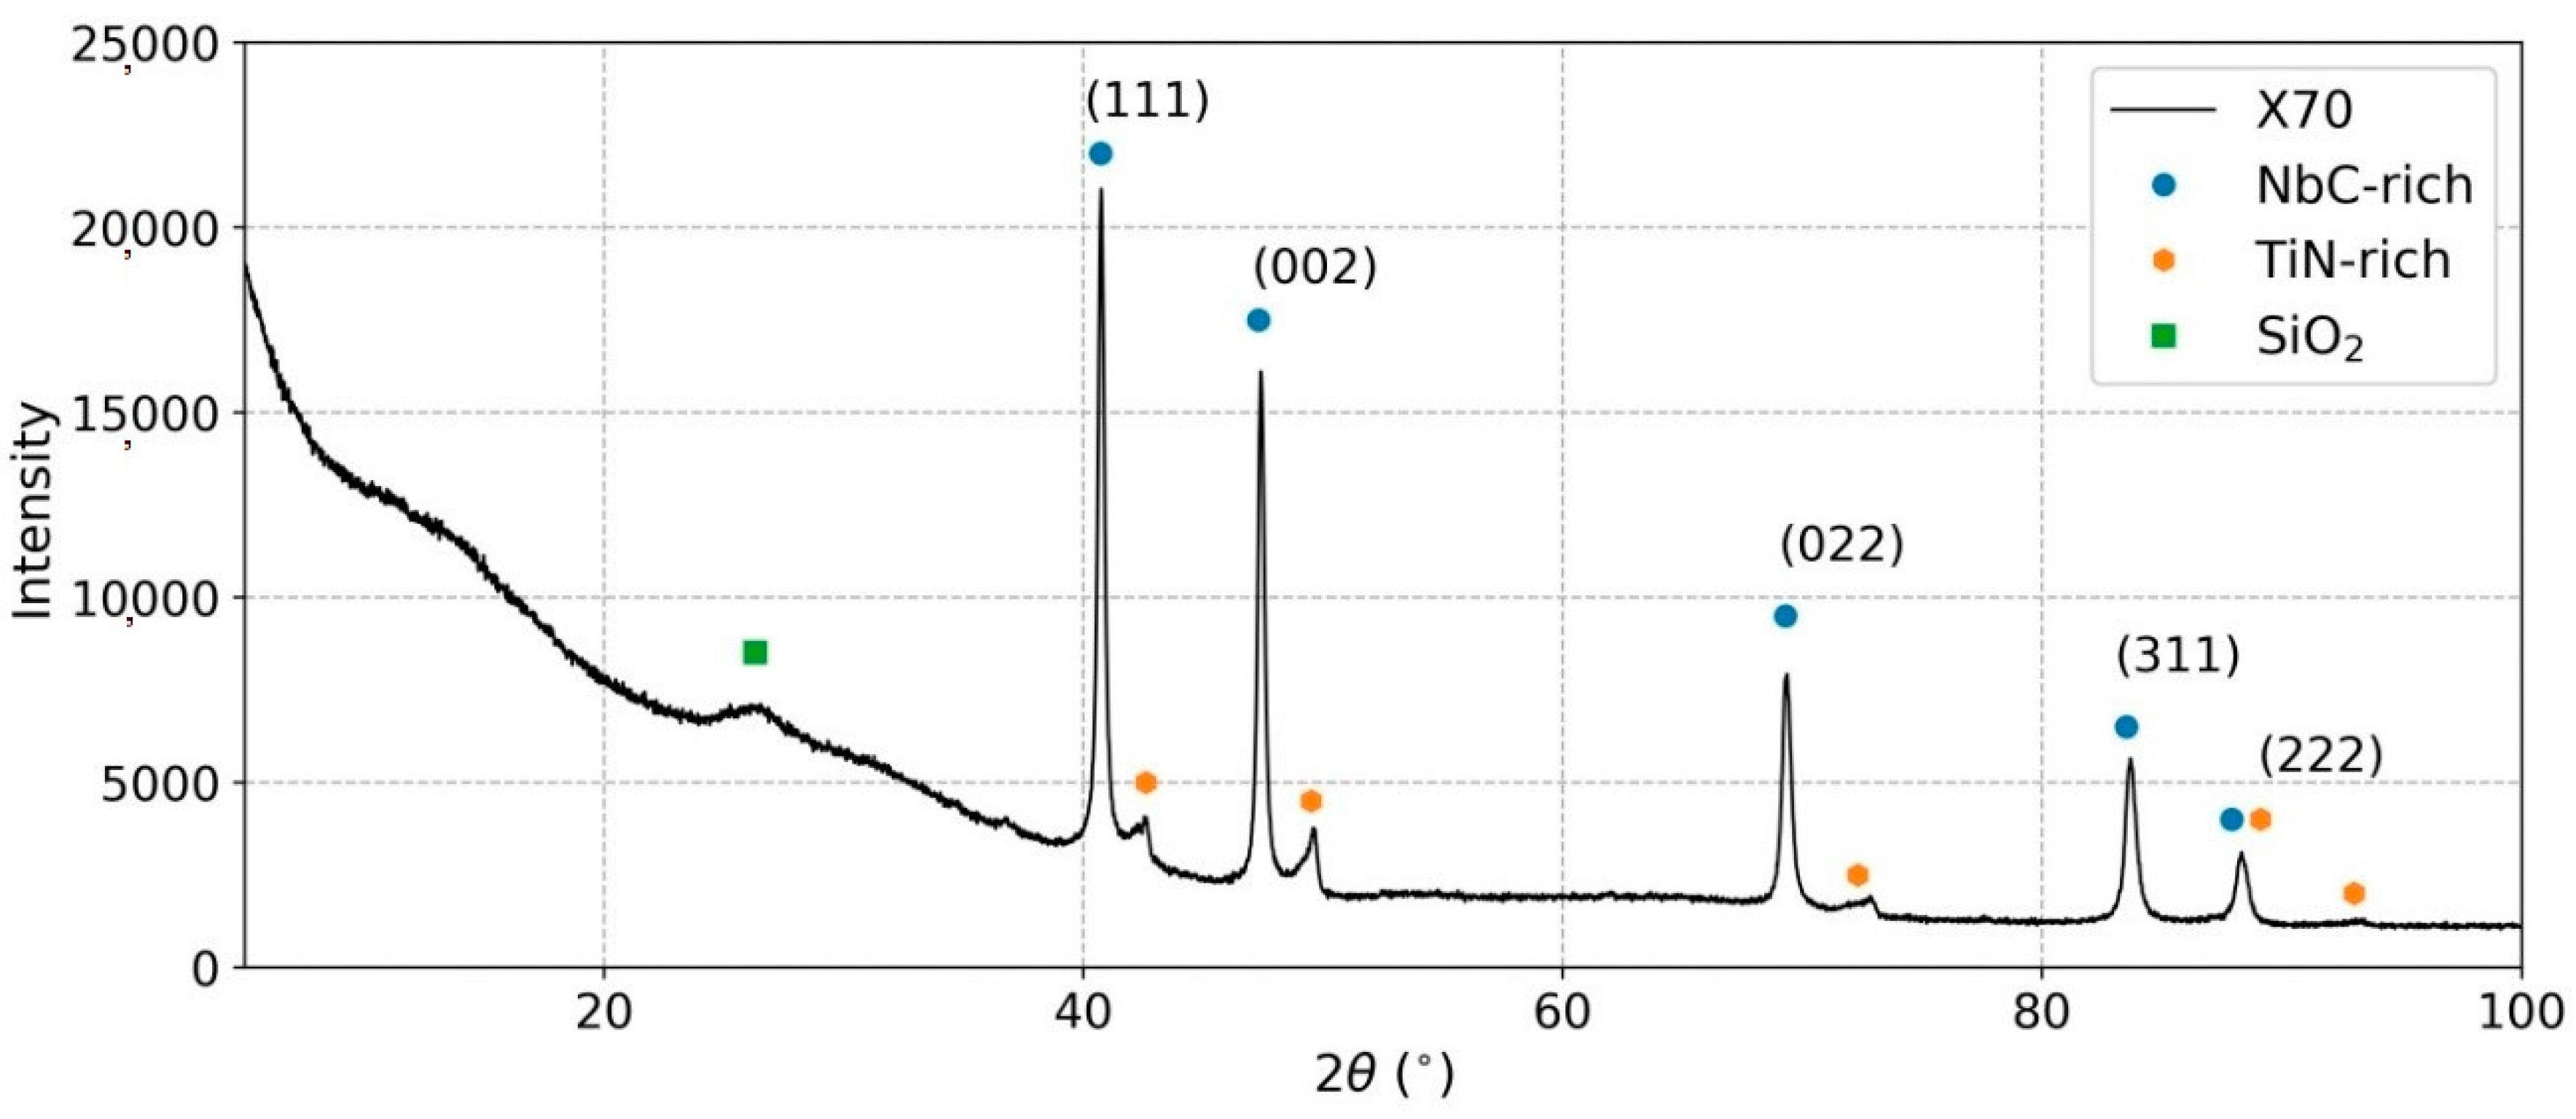
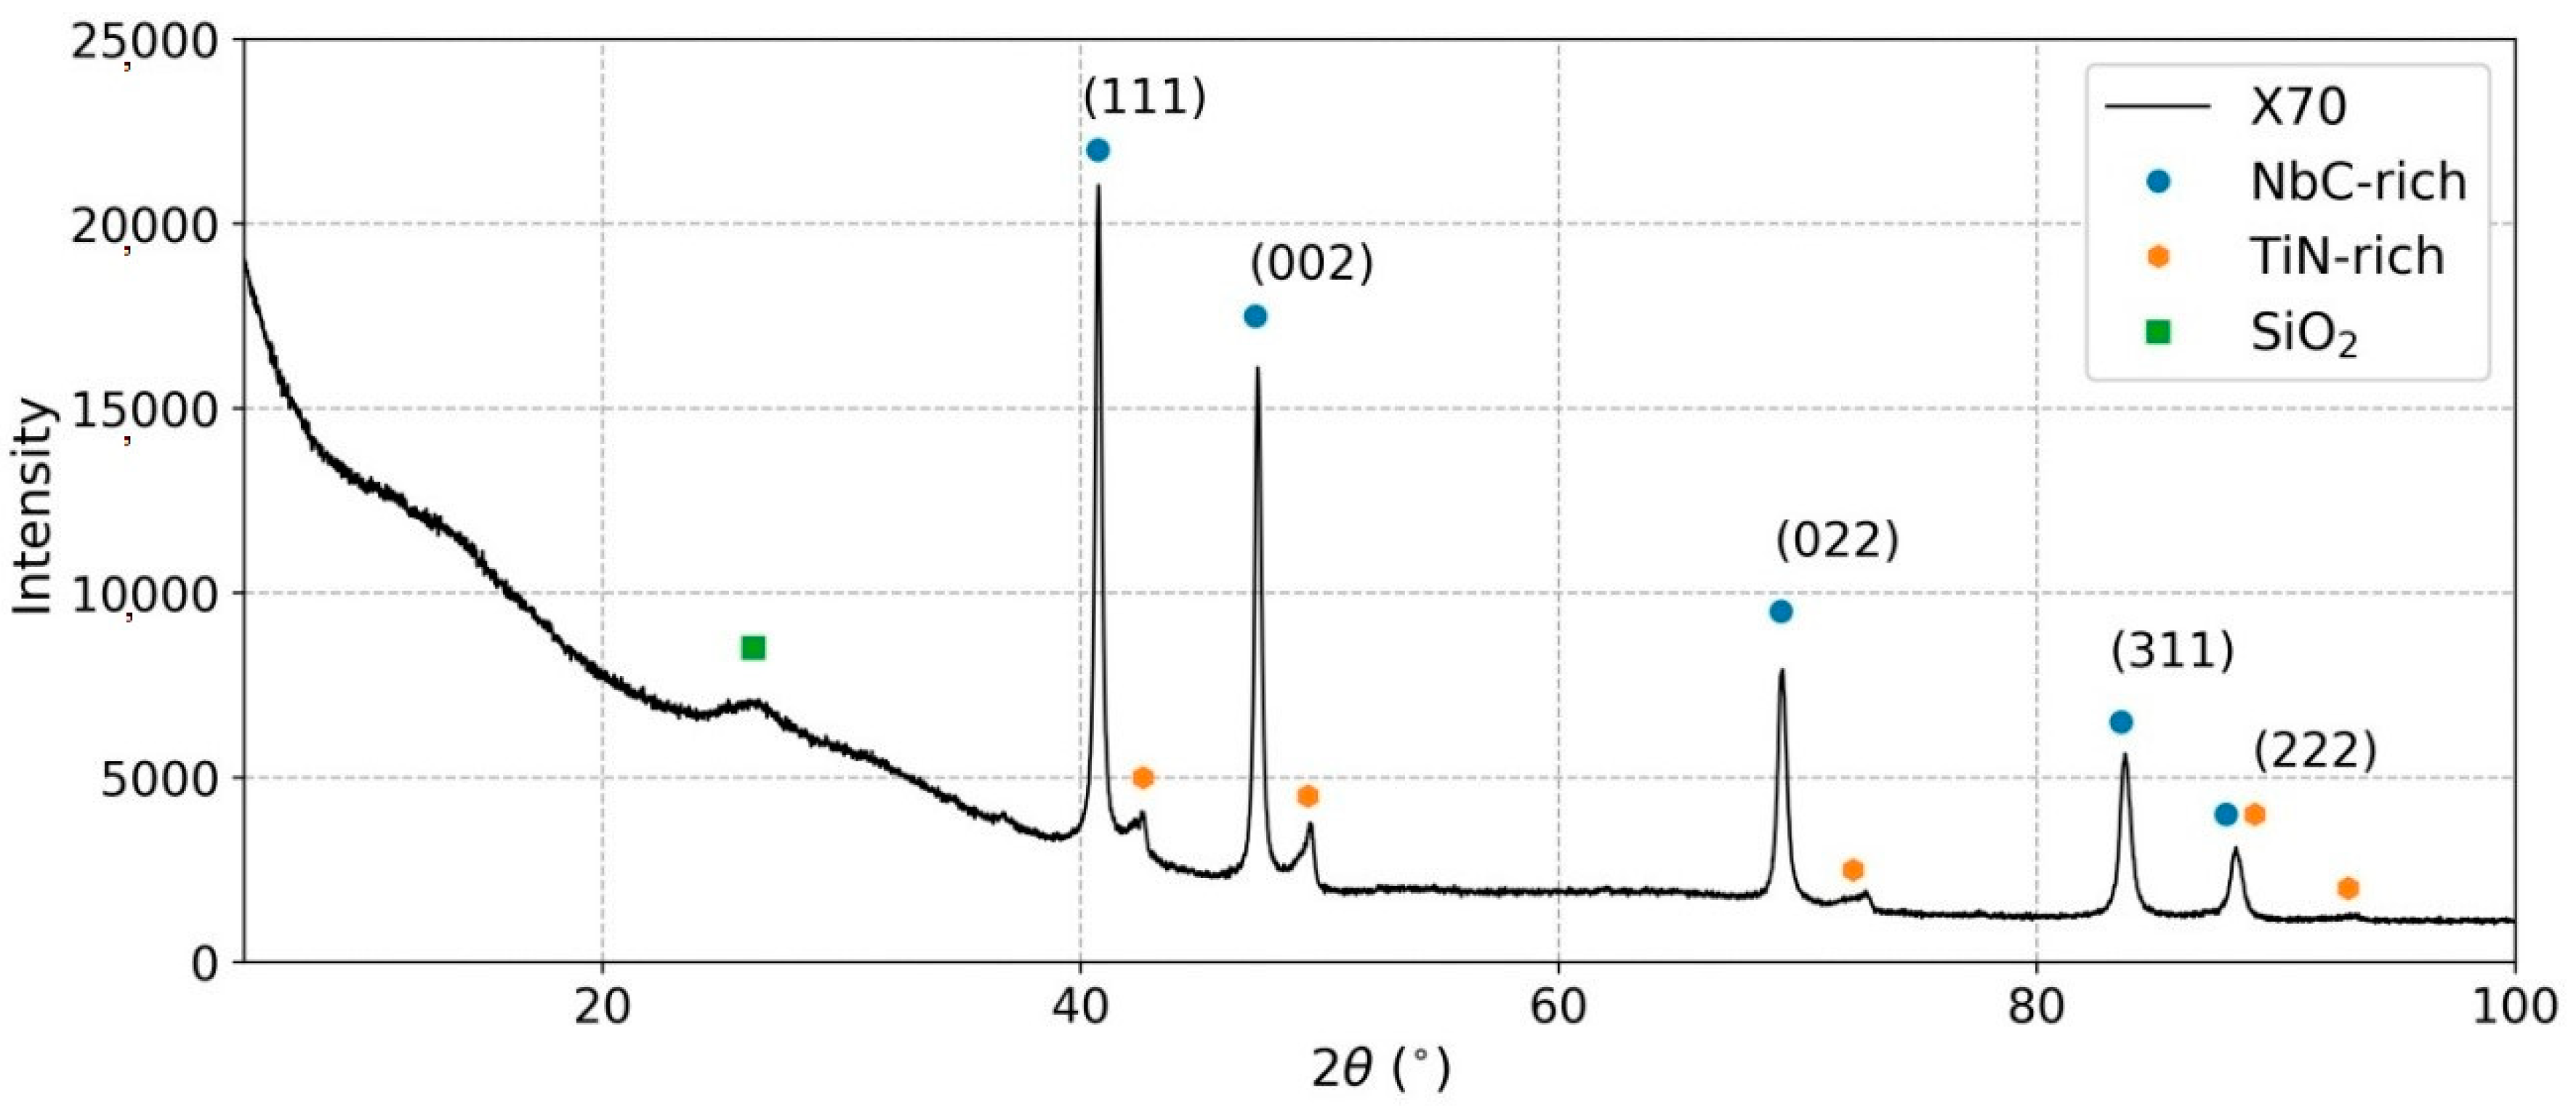
3.4. X-ray Diffraction
3.5. Rietveld Refinement
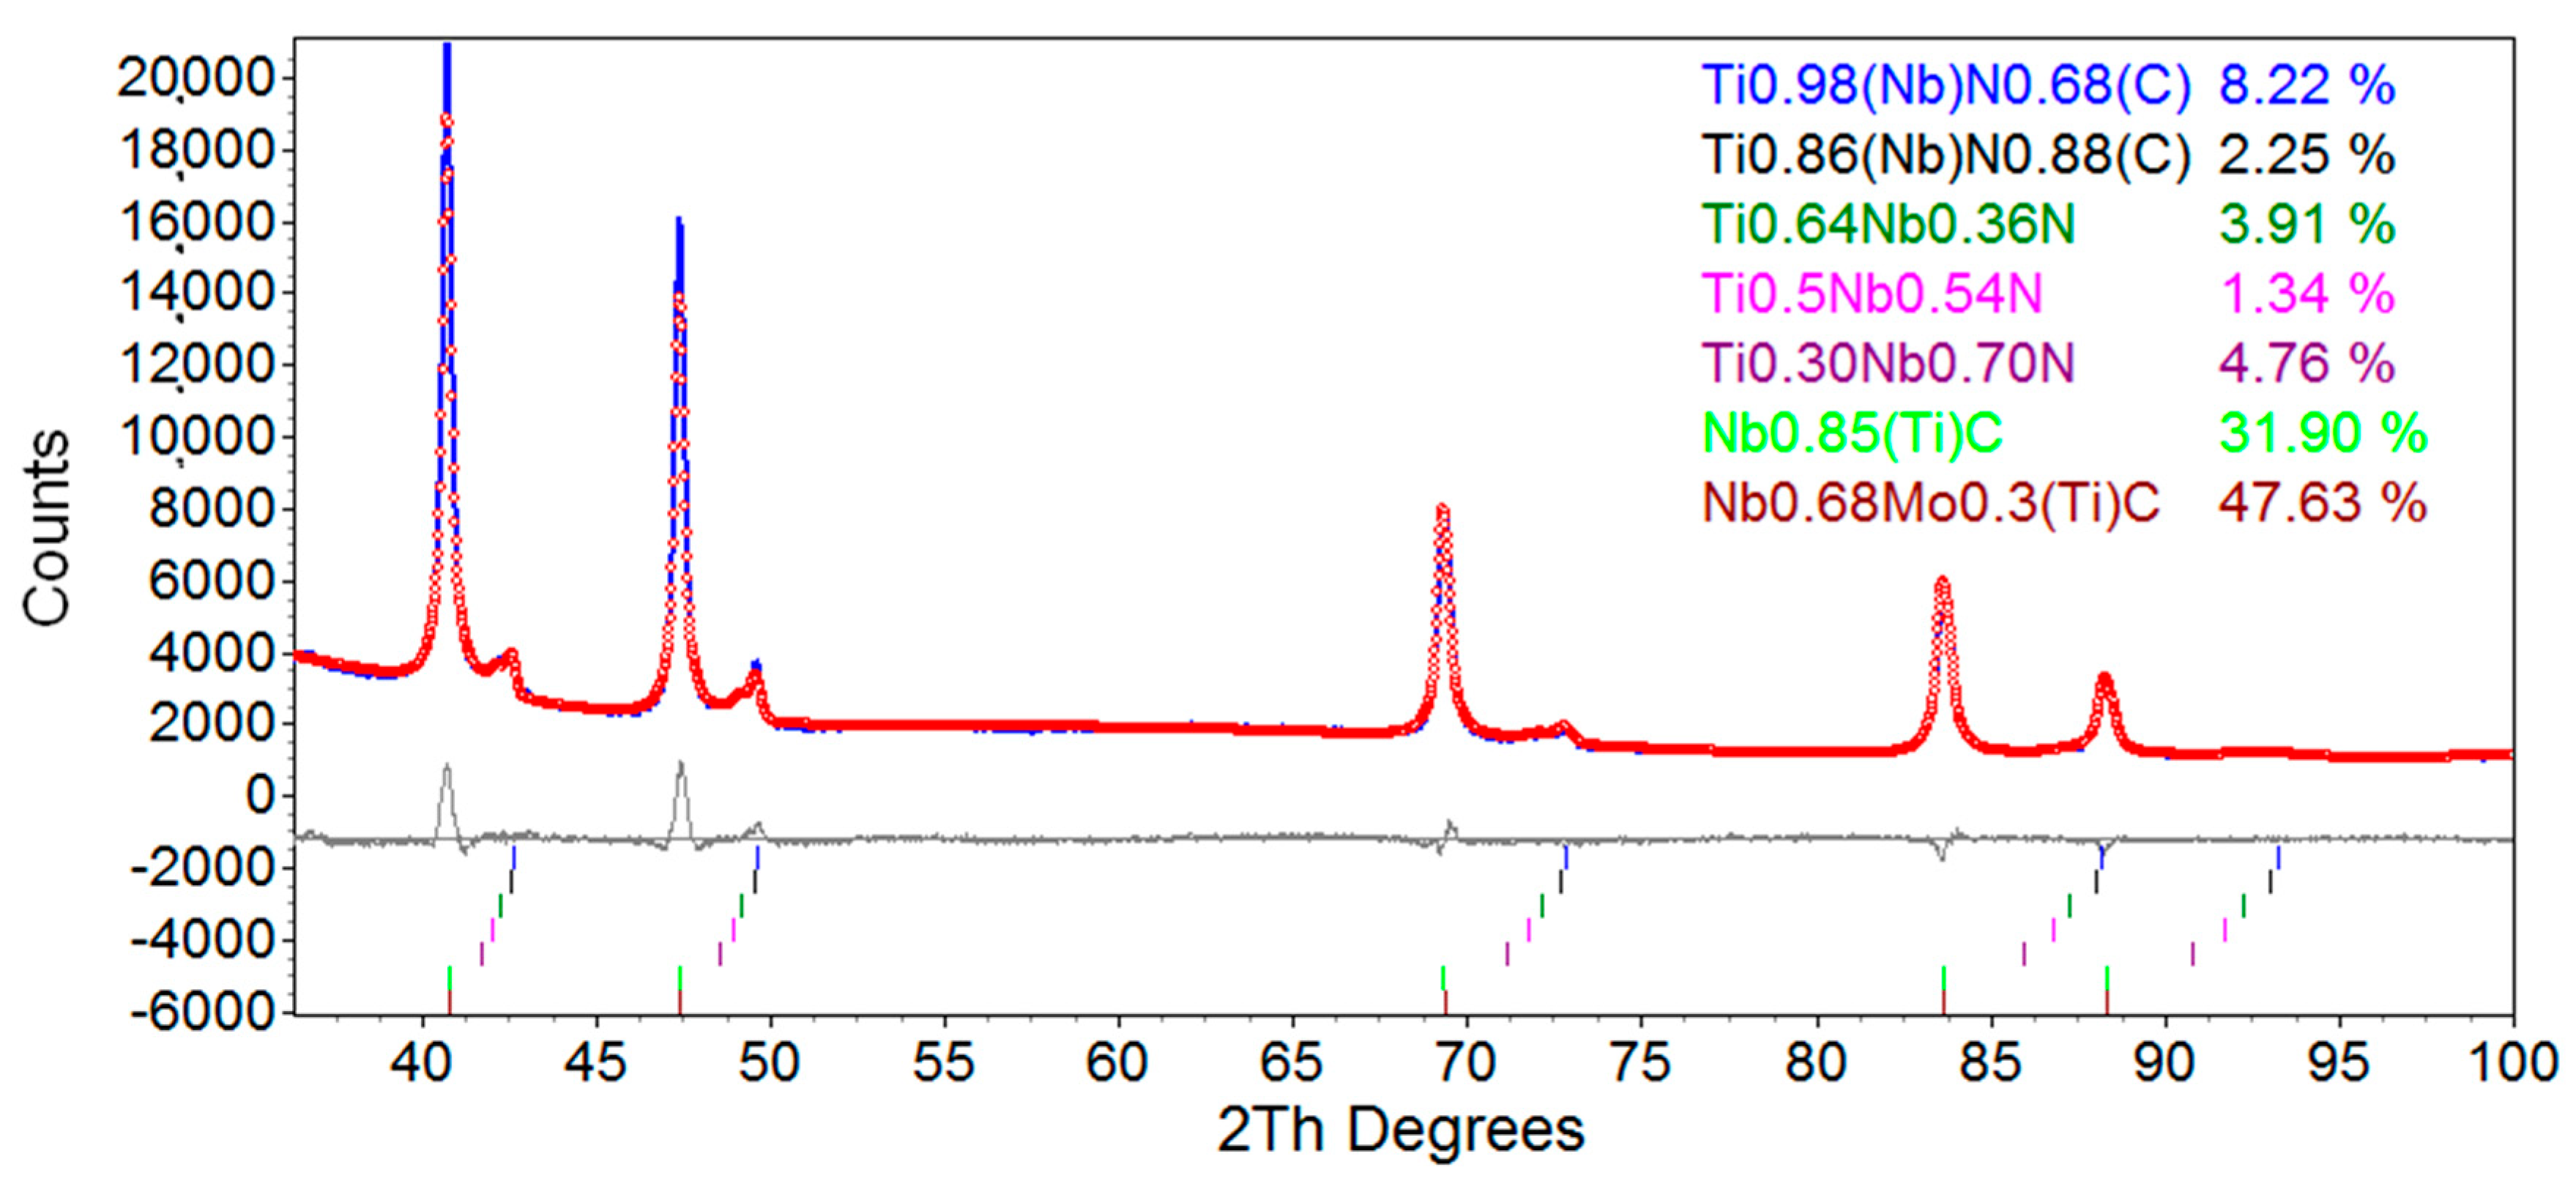
3.5.1. Rietveld Refinement of X70 Steel
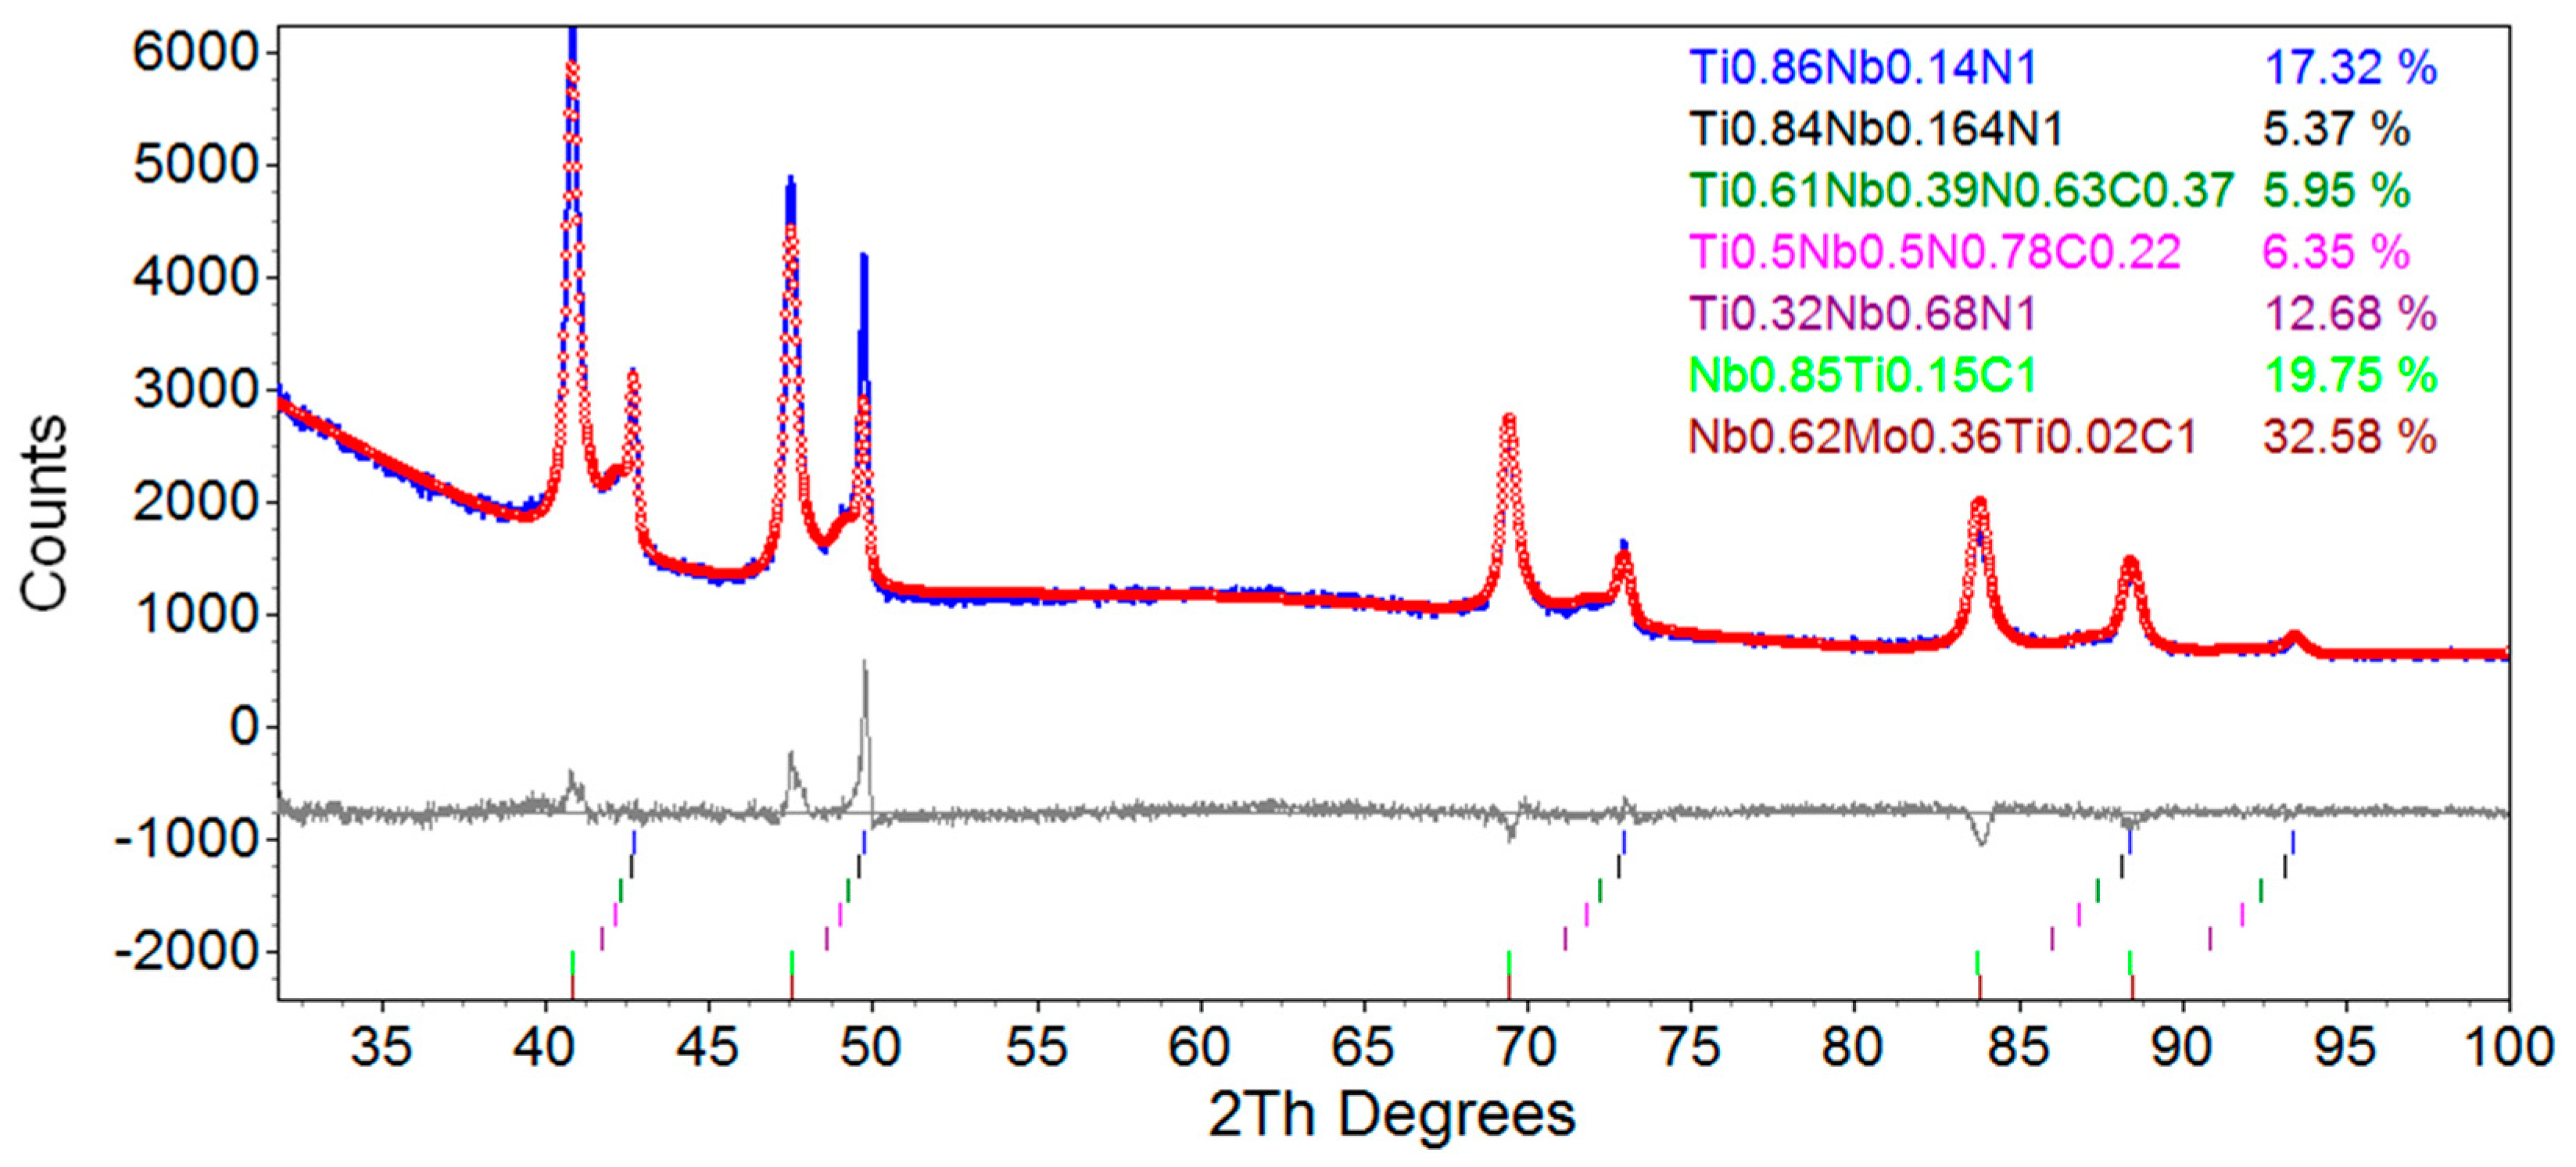
3.5.2. Rietveld Refinement of TWX70 Steel
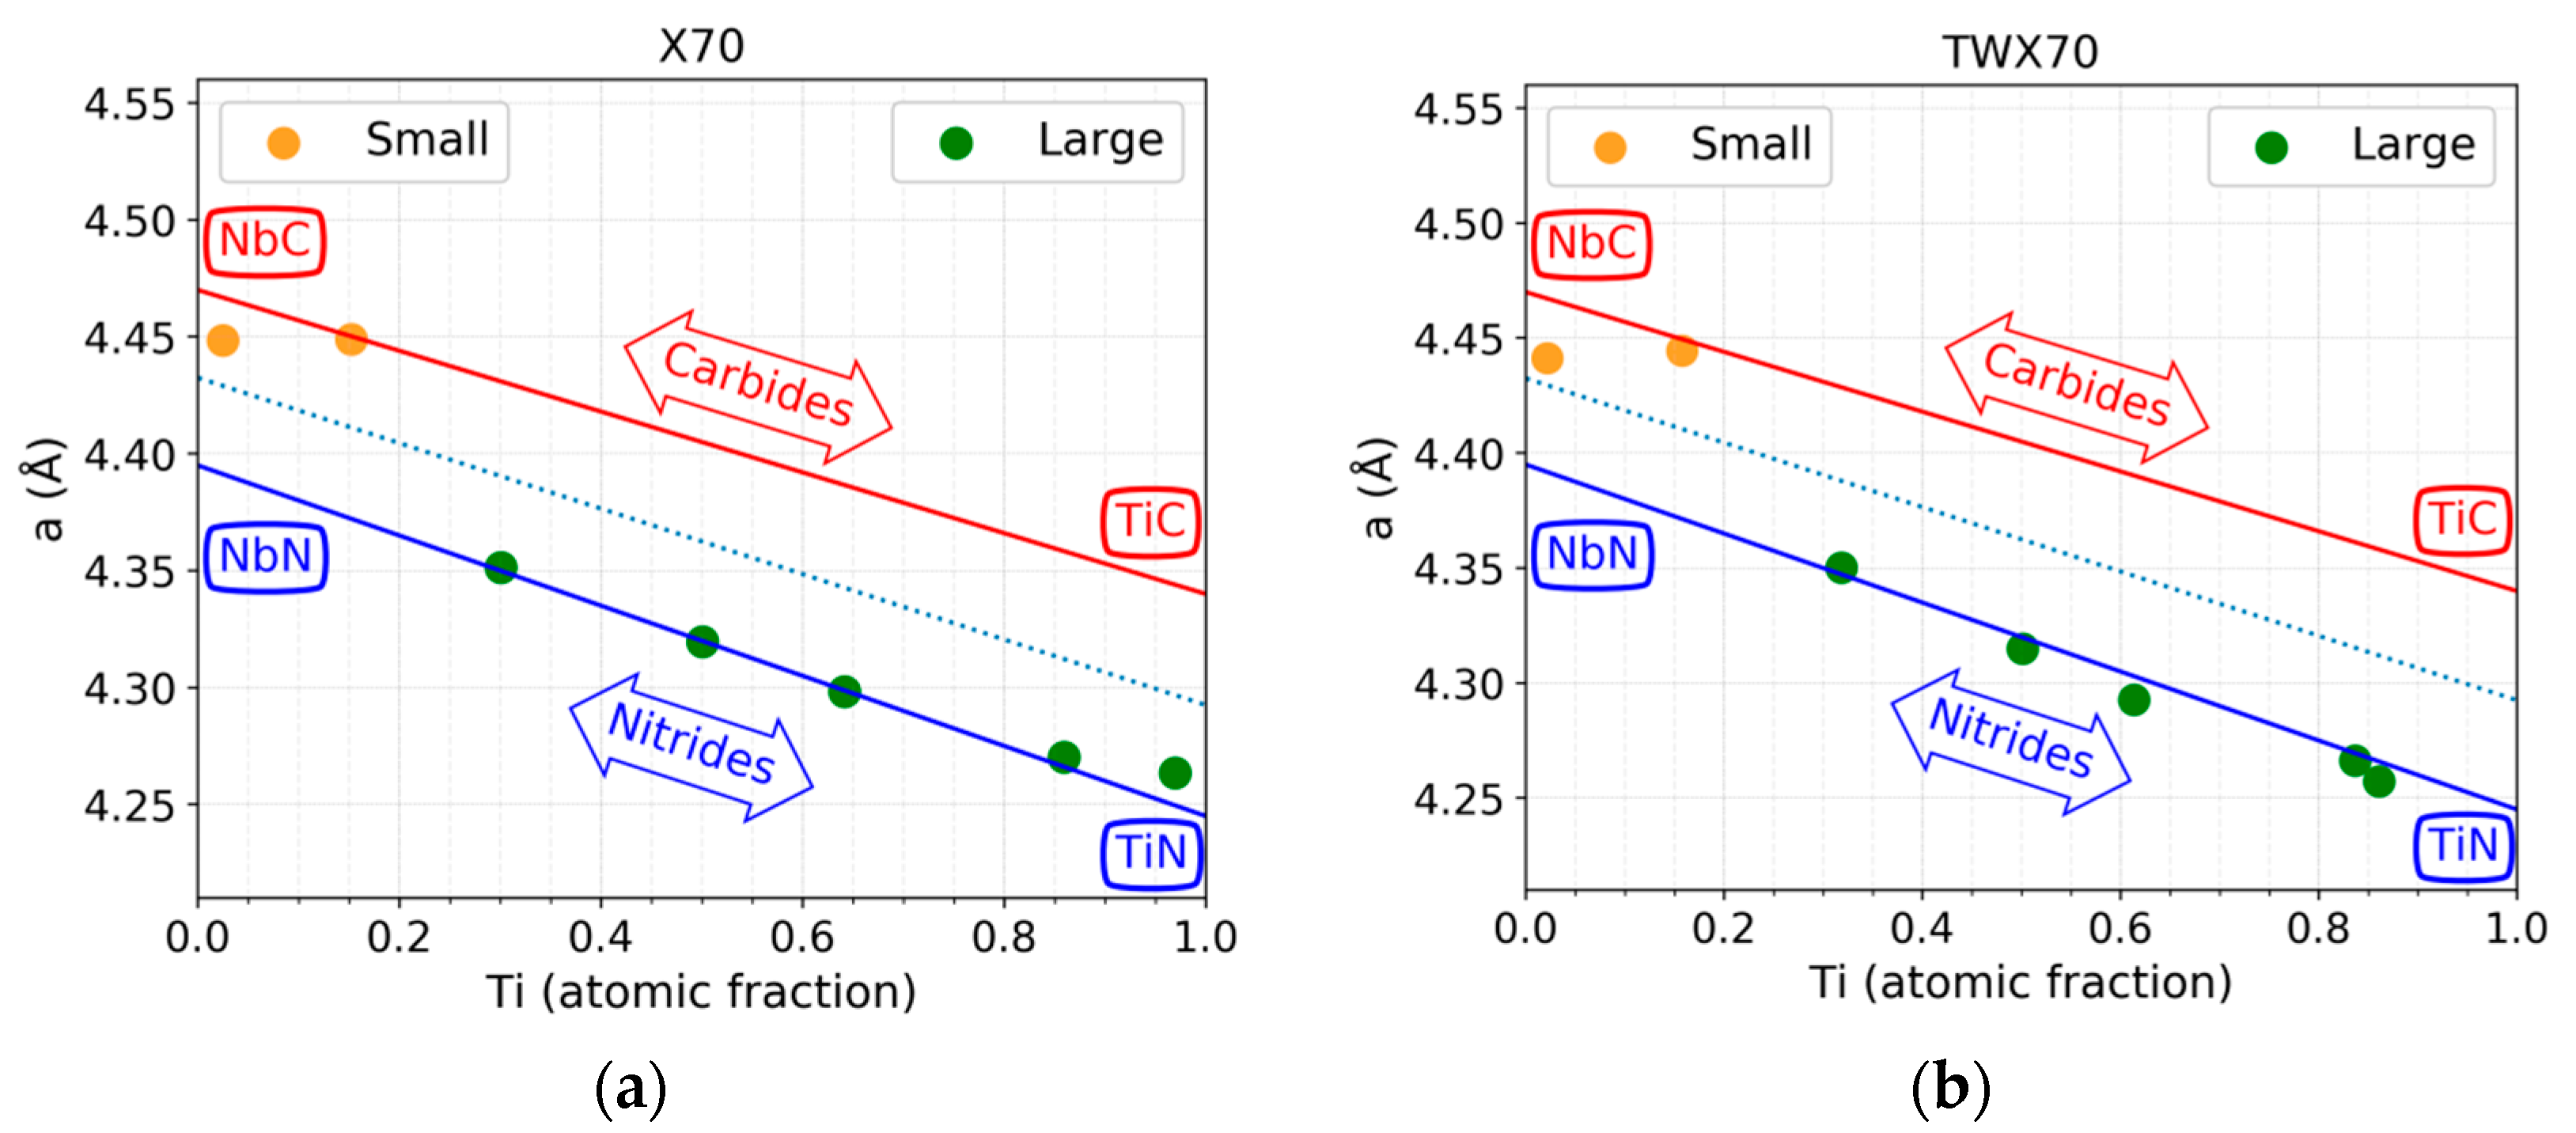
3.6. Lattice Parameter Comparison
4. Discussion
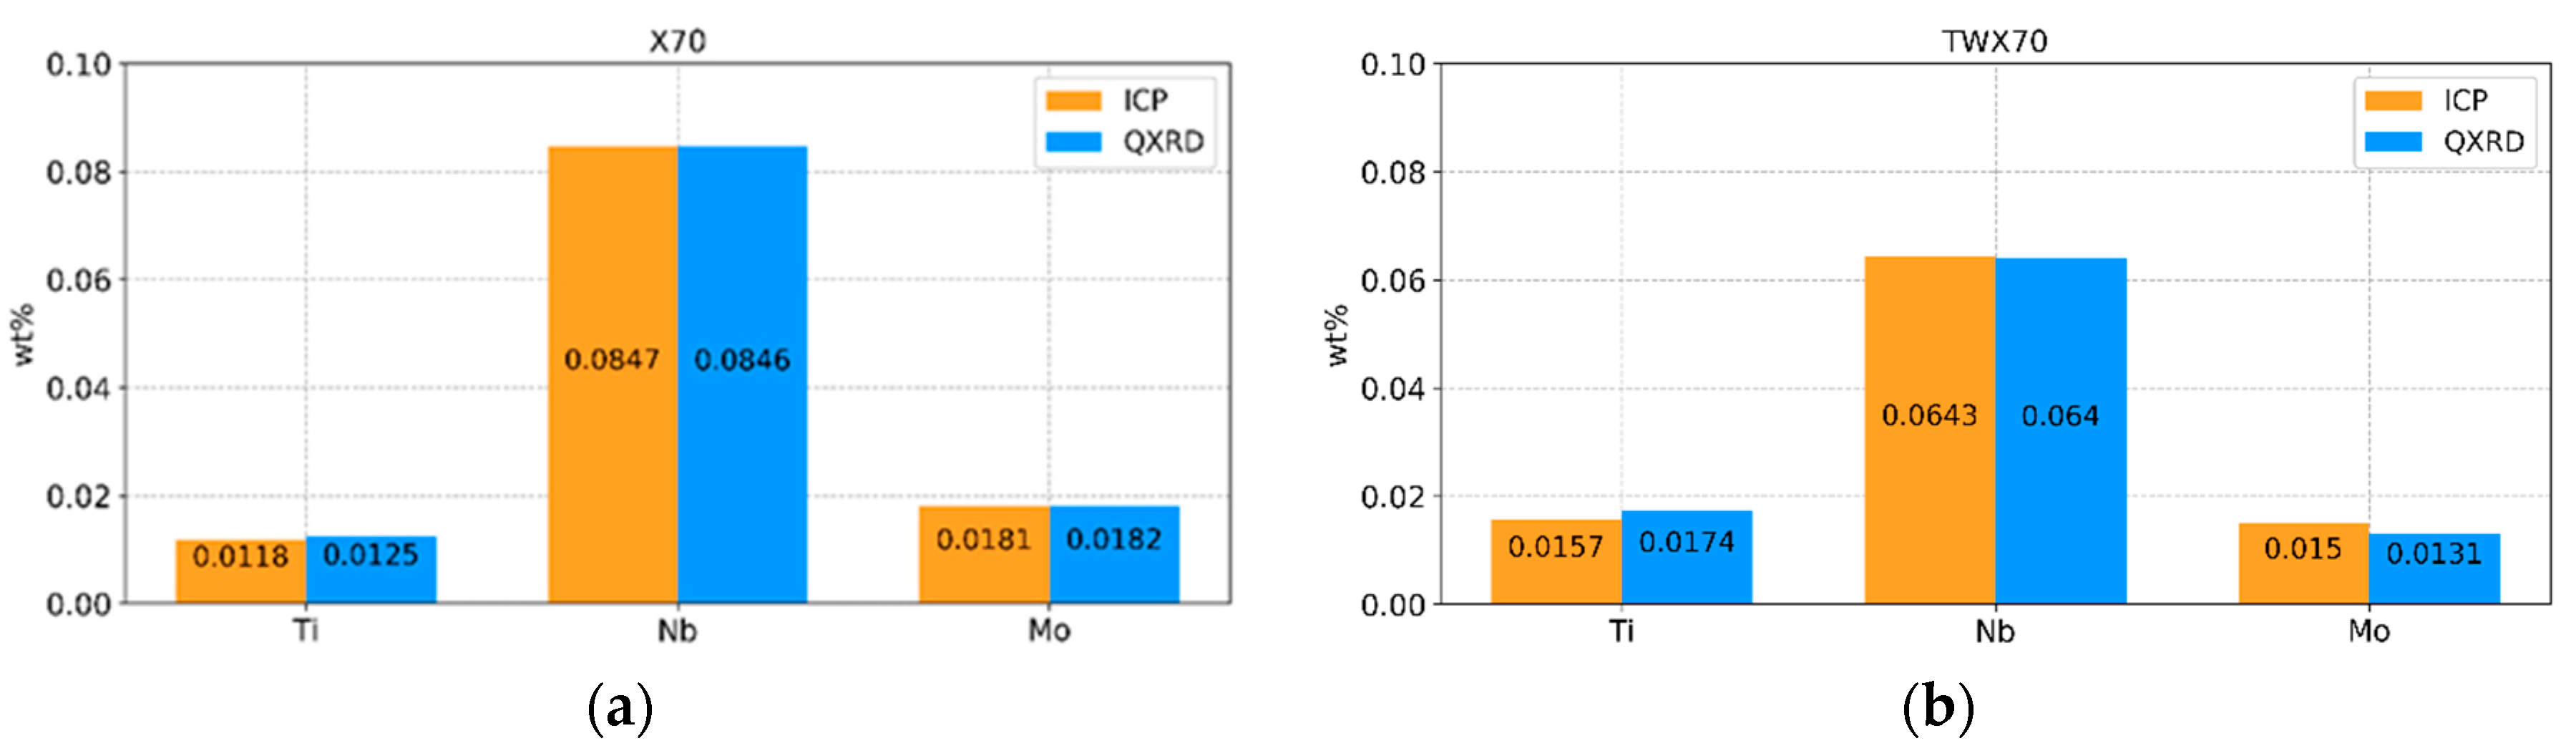
4.1. Mass Balance of Elements: Comparison between ICP and QXRD
4.2. Nano Sized Precipitates
4.3. Large Precipitates
5. Conclusions
- N2 injection during dissolution minimized/prevented the formation of amorphous SiO2 during the dissolution process.
- Rietveld refinement provided reasonably accurate nano precipitate atomic compositions and size values in the X70 microalloyed steels. These results were confirmed by direct SEM-EDX and ICP measurements.
- Similar types of precipitates (Ti/N-rich, Nb/C-rich, and Nb/Mo/C-rich) were detected in both X70 and TWX70 steels.
- Nano-sized precipitates with higher Mo levels and lower Nb levels were observed in the TWX70 steel. The presence of the higher Mo content nano-sized precipitates is attributed to the higher Mo content and lower Nb content in the TWX70 steel.
- Nano-sized precipitates in the thin-walled X70 steel were present in a higher volume fraction (0.113%) than in the thick-walled TWX70 steel (0.064%). This difference is consistent with a higher Nb content in the X70 steel versus the TWX70 steel.
Author Contributions
Funding
Acknowledgments
Conflicts of Interest
Abbreviations
| QXRD | Quantitative X-ray diffraction |
| ICP | Inductively coupled plasma mass spectrometry |
| EDX | Energy dispersive X-ray spectroscopy |
| SEM | Scanning electron microscopy |
| TEM | Transmission electron microscopy |
| TWX70 | Thick-walled (17 mm) X70 steel |
References
- Collins, L. Processing of Nb-Containing Steels by Steckel Mill Rolling. In Proceedings of the Niobium Science and Technology: Proceedings of the International Symposium Niobium, Orlando, FL, USA, 2–5 December 2001; pp. 527–542. [Google Scholar]
- Bai, D.; Cooke, M.; Asante, J.; Dorricott, J. Process for Making High Strength Micro-Alloy Steel. U.S. Patent US 6,682,613, 27 January 2004. [Google Scholar]
- Lu, J. Quantitative Microstructural Characterization of Microalloyed Steels. Ph.D. Thesis, University of Alberta, Alberta, AB, Canada, 2009. [Google Scholar]
- Liu, F.; Wang, J.; Liu, Y.; Misra, R.; Liu, C. Effects of Nb and V on microstructural evolution, precipitation behavior and tensile properties in hot-rolled mo-bearing steel. J. Iron Steel Res. Int. 2016, 23, 559–565. [Google Scholar] [CrossRef]
- Kutz, M. Handbook of Materials Selection; John Wiley and Sons Inc.: New York, NY, USA, 2002; p. 44. [Google Scholar]
- Gladman, T. The Physical Metallurgy of Microalloyed Steels; The Institute of Materials: London, UK, 1997. [Google Scholar]
- Elwazri, A.M.; Varano, R.; Siciliano, F.; Bai, D.; Yue, S. Characterisation of precipitation of niobium carbide using carbon extraction replicas and thin foils by FESEM. Mater. Sci. Technol. 2006, 22, 537–541. [Google Scholar] [CrossRef]
- Wiskel, J.; Ivey, D.G.; Henein, H. The Effects of Finish Rolling Temperature and Cooling Interrupt Conditions on Precipitation in Microalloyed Steels Using Small Angle Neutron Scattering. Metall. Mater. Trans. A 2008, 39B, 116–124. [Google Scholar] [CrossRef]
- Staron, P.; Jamnig, B.; Leitner, H.; Ebner, R.; Clemens, H. Small-angle neutron scattering analysis of the precipitation behavior in a maraging steel. J. Appl. Crystallogr. 2003, 36, 415–419. [Google Scholar] [CrossRef]
- Perrard, F.; Deschamps, A.; Maugis, P. Modelling the precipitation of NbC on dislocations in ferrite. Acta Mater. 2007, 55, 1255–1266. [Google Scholar] [CrossRef] [Green Version]
- Wiskel, J.; Lu, J.; Omotoso, O.; Ivey, D.; Henein, H. Characterization of Precipitates in a Microalloyed Steel Using Quantitative X-ray Diffraction. Metals 2016, 6, 90. [Google Scholar] [CrossRef]
- Lu, J.; Wiskel, J.; Omotoso, O.; Henein, H.; Ivey, D. Matrix dissolution techniques applied to extract and quantify precipitates from a microalloyed steel. Metall. Mater. Trans. A 2011, 42, 1767–1784. [Google Scholar] [CrossRef]
- Rietveld, H. Line profiles of neutron powder-diffraction peaks for structure refinement. Acta Crystallogr. 1967, 22, 151–152. [Google Scholar] [CrossRef] [Green Version]
- Rietveld, H. A profile refinement method for nuclear and magnetic structures. J. Appl. Crystallogr. 1969, 2, 65–71. [Google Scholar] [CrossRef] [Green Version]
- Popa, N.; Balzar, D. An analytical approximation for a size-broadened profile given by the lognormal and gamma distributions. J. Appl. Crystallogr. 2002, 35, 338–346. [Google Scholar] [CrossRef] [Green Version]
- Balzar, D.; Audebrand, N.; Daymond, M.R.; Fitch, A.; Hewat, A.; Langford, J.I.; Bail, A.L.; Louer, D.; Masson, O.; McCowan, C.N.; et al. Size–strain line-broadening analysis of the ceria round-robin sample. J. Appl. Crystallogr. 2004, 37, 911–924. [Google Scholar] [CrossRef]
- Standard Test Method for Acid-Insoluble Content of Copper and Iron Powders; ASTM International: West Conshohocken, PA, USA, 2015.
- Chatelier, C. Precipitation Analysis in Microalloyed X70 Steels and Heat Treated L80 and T95 Steels. Master’s Thesis, University of Alberta, Alberta, AB, Canada, 2017. [Google Scholar]
- Coelho, A. Topas Academic Version 4.1; Software for Analysis of Powder Diffraction Data; Coelho Software: Brisbane, Australia, 2007. [Google Scholar]
- Toby, B. R factors in Rietveld analysis: How good is good enough? Powder Diffr. 2006, 21, 67–70. [Google Scholar] [CrossRef]
- Hill, R.; Howard, C. Quantitative phase analysis from neutron powder diffraction data using the Rietveld method. J. Appl. Crystallogr. 1987, 20, 467–474. [Google Scholar] [CrossRef] [Green Version]


| Steel | Thickness | YS | UTS | %El | C | N | Nb | Mo | Ti | Cr | V |
|---|---|---|---|---|---|---|---|---|---|---|---|
| (mm) | (MPa) | (MPa) | (wt %) | ppm | (wt %) | (wt %) | (wt %) | (wt %) | (wt %) | ||
| X70 | 11 | 524.0 | 651.6 | 37 | 0.052 | 70 | 0.09 | 0.13 | 0.016 | 0.23 | 0.003 |
| TWX70 | 17 | 554.3 | 679.1 | 38 | 0.043 | 90 | 0.07 | 0.19 | 0.016 | 0.09 | 0.003 |
| Steel | Weight Steel | Volume Solution | T | Time | Weight Residue |
|---|---|---|---|---|---|
| (g) | (mL) | (°C) | (weeks) | (mg) | |
| X70 | 48.1474 | 2500 | 90 | 3 | 67.1 |
| TWX70 | 10.1308 | 500 | 90 | 1 | 12.2 |
| Parameter | Value |
|---|---|
| Radiation | Cobalt |
| Detector | D/Tex with Fe filter |
| 2θ range | 5–100° |
| Scan | 0.02°/step |
| Scan speed | 2°/min |
| Atomic Composition | a (Å) | εo (%) | Lvol (nm) | R (nm) | wt (%) |
|---|---|---|---|---|---|
| Ti0.97Nb0.03(N0.68C0.32) | 4.26 ± 0.02 | 0.14 ± 0.02 | 4000 | - | 8.2 ± 1.2 |
| Ti0.86Nb0.14(N0.88C0.12) | 4.27 ± 0.04 | 0.19 ± 0.03 | 4000 | - | 2.3 ± 0.3 |
| Ti0.64Nb0.36N | 4.30 ± 0.04 | 0.19 ± 0.03 | 4000 | - | 3.9 ± 0.6 |
| Ti0.50Nb0.50N | 4.32 ± 0.04 | 0.28 ± 0.04 | 4000 | - | 1.3 ± 0.2 |
| Nb0.70Ti0.30N | 4.35 ± 0.04 | 0.82 ± 0.12 | 4000 | - | 4.8 ± 0.7 |
| Nb0.85Ti0.15C | 4.45 ± 0.05 | 0 | 40.3 ± 6.1 | 15.6 ± 2.3 | 31.9 ± 4.8 |
| Nb0.68Mo0.30Ti0.02C | 4.45 ± 0.05 | 0 | 10.9 ± 1.6 | 4.2 ± 0.6 | 47.6 ± 7.1 |
| Atomic Composition | a (Å) | εo (%) | Lvol (nm) | R (nm) | wt (%) |
|---|---|---|---|---|---|
| Ti0.86Nb0.14N | 4.26 ± 0.02 | 0.10 ± 0.02 | 4000 | - | 17.3 ± 2.6 |
| Ti0.84Nb0.16N | 4.27 ± 0.04 | 0.23 ± 0.03 | 4000 | - | 5.4 ± 0.8 |
| Ti0.61Nb0.39(N0.63C0.37) | 4.29 ± 0.04 | 0.25 ± 0.04 | 4000 | - | 5.9 ± 0.9 |
| Ti0.50Nb0.50(N0.78C0.22) | 4.32 ± 0.04 | 0.27 ± 0.04 | 4000 | - | 6.4 ± 1.0 |
| Nb0.68Ti0.32N | 4.35 ± 0.04 | 0.99 ± 0.15 | 4000 | - | 12.7 ± 1.9 |
| Nb0.84Ti0.16C | 4.44 ± 0.05 | 0 | 28.9 ± 4.3 | 11.2 ± 1.7 | 19.8 ± 2.9 |
| Nb0.62Mo0.36Ti0.02C | 4.44 ± 0.05 | 0 | 13.2 ± 2.0 | 5.1 ± 0.8 | 32.6 ± 4.9 |
| Steel | Rietveld | EDX Composition (Mean at. Fraction) | RQXRD | RSEM | Vf | Vf-Total | σppt | ||
|---|---|---|---|---|---|---|---|---|---|
| Nb | Ti | Mo | (nm) | (nm) | (%) | (%) | (MPa) | ||
| X70 | Nb0.68Mo0.30Ti0.02C | 0.79 | 0.16 | 0.05 | 4.2 | 7.95 | 0.066 | 0.113 | 135.1 |
| Nb0.85Ti0.15C | 15.6 | - | 0.047 | ||||||
| TWX70 | Nb0.62Mo0.36Ti0.02C | 0.66 | 0.18 | 0.16 | 5.1 | 4.4 | 0.039 | 0.064 | 133.2 |
| Nb0.84Ti0.16C | 11.1 | 10.0 | 0.025 | ||||||
| Steel | Atomic Composition | Vf (%) | Total Vf (%) |
|---|---|---|---|
| X70 | Ti0.97Nb0.03N0.68C0.32 | 0.017 | 0.037 |
| Ti0.86Nb0.14N0.88C0.12 | 0.004 | ||
| Ti0.64Nb0.36N | 0.007 | ||
| Ti0.50Nb0.50N | 0.002 | ||
| Ti0.30Nb0.70N | 0.007 | ||
| TWX70 | Ti0.86Nb0.14N | 0.028 | 0.070 |
| Ti0.84Nb0.16N | 0.009 | ||
| Ti0.61Nb0.39N0.63C0.37 | 0.009 | ||
| Ti0.50Nb0.50N0.78C0.22 | 0.009 | ||
| Ti0.32Nb0.68N | 0.016 |
© 2018 by the authors. Licensee MDPI, Basel, Switzerland. This article is an open access article distributed under the terms and conditions of the Creative Commons Attribution (CC BY) license (http://creativecommons.org/licenses/by/4.0/).
Share and Cite
Chatelier, C.; Wiskel, J.B.; Ivey, D.G.; Henein, H. The Effect of Skelp Thickness on Precipitate Size and Morphology for X70 Microalloyed Steel Using Rietveld Refinement (Quantitative X-ray Diffraction). Crystals 2018, 8, 287. https://doi.org/10.3390/cryst8070287
Chatelier C, Wiskel JB, Ivey DG, Henein H. The Effect of Skelp Thickness on Precipitate Size and Morphology for X70 Microalloyed Steel Using Rietveld Refinement (Quantitative X-ray Diffraction). Crystals. 2018; 8(7):287. https://doi.org/10.3390/cryst8070287
Chicago/Turabian StyleChatelier, Corentin, J. Barry Wiskel, Douglas G. Ivey, and Hani Henein. 2018. "The Effect of Skelp Thickness on Precipitate Size and Morphology for X70 Microalloyed Steel Using Rietveld Refinement (Quantitative X-ray Diffraction)" Crystals 8, no. 7: 287. https://doi.org/10.3390/cryst8070287