Stress Relaxation Properties and Microscopic Deformation Structure in Bending of the C7025 and C7035 Alloy


1
Institute of Engineering Research, Jiangxi University of Science and Technology, Hongqi Ave. No. 86, Ganzhou 341000, China
2
School of Materials Science and Engineering, Jiangxi University of Science and Technology, Hongqi Ave. No. 86, Ganzhou 341000, China
*
Authors to whom correspondence should be addressed.
Crystals 2018, 8(8), 324; https://doi.org/10.3390/cryst8080324
Submission received: 27 June 2018
/
Revised: 8 August 2018
/
Accepted: 9 August 2018
/
Published: 14 August 2018
(This article belongs to the Special Issue Recrystallization of Metallic Materials )
Abstract
:Stress relaxation tests in cantilever bending were performed on the C7025 and C7035 alloys at 298 K and 393 K, respectively. The effect of stress-relief treatments on stress relaxation properties was investigated. The structural changes associated with the stress relaxation process were examined using transmission electron microscopy. The stress relaxation curve fits well to empirical formula σ* = [K’ln(t + α0) + C]−n for stress relaxation. The curves can be split into two stages. The stress drops fast at first and then it gets slower in the second stage, and tends towards a certain limited value after a long time. The curve and microstructure reveal that the C7035 alloy has a lower rate of stress relaxation and a higher anti-stress relaxation capacity than the C7025. The first reason is that the movement of vacancies required by spinodal decomposition is inhibited, and the quantity of cobalt-containing vacancies decreases dramatically in the C7035 alloy. The other reason is that the precipitated phases became uniformly diffused in the C7035 alloy. The precipitate phase is uniformly distributed in the grain boundaries and the matrix, during the relaxed condition, and thus the dislocation movement is blocked by the precipitate.
1. Introduction
C7025 alloys are widely used in the fabrication of conductor components and lead frame materials due to their excellent strength and conductivity [1,2,3]. However, C7035 alloys have higher strength, electrical conductivity and more appropriate stress relaxation properties [4,5]. The quality of materials used to construct lead frames and the conductors in components can be determined by their elastic limit and relaxation stability. One of the most important concerns in the design of contacts among various parts of a structure is the initial contact force. Most materials, whether metallic or non-metallic, loose a significant amount of their initial contact force over the time of their service. This time-dependent decrease of stress in a material under constant strain, e.g. a beam with fixed deflection, a spring under stress, a tight nut and bolt assembly, etc. is called stress relaxation. The phenomenon of stress relaxation is therefore of paramount importance in the selection of structural materials.
Stress relaxation is a distinct type of deformation, in which elastic strain changes to plastic strain under the action of thermal activation and stress [6,7]. The stress relaxation and creep exhibit some similarity in observed phenomena and it has been concluded that the nature of stress relaxation corresponds to creep behavior, so stress relaxation is generally explained using creep theory [8]. Parikin et al. [9] analyzed the stress relaxation properties of cold-rolled copper alloy at room temperature, and considered that the recovery and relaxation process was similar, which results in dislocation migration, dislocation rearrangement, and dislocation annihilation. The stress relaxation behavior of beryllium copper was studied by Li Yilian [10]. Due to the effect of elastic stress, beryllium atomic uphill diffusion occurs, Guinier Preston zone (G.P.) areas are formed, thus improving the stress relaxation and stabilty performance of the alloy at room temperature. It is important to characterize the stress relaxation behavior of elastic copper alloy not only in terms of the remaining stress after exposure to elevated temperatures, but also in terms of microstructural changes. The purpose of this paper is to present the results of low temperature stress relaxation tests performed with C7025 and C7035 alloys and attempt to ascertain the mechanism of microscopic deformation.
2. Experimental Section
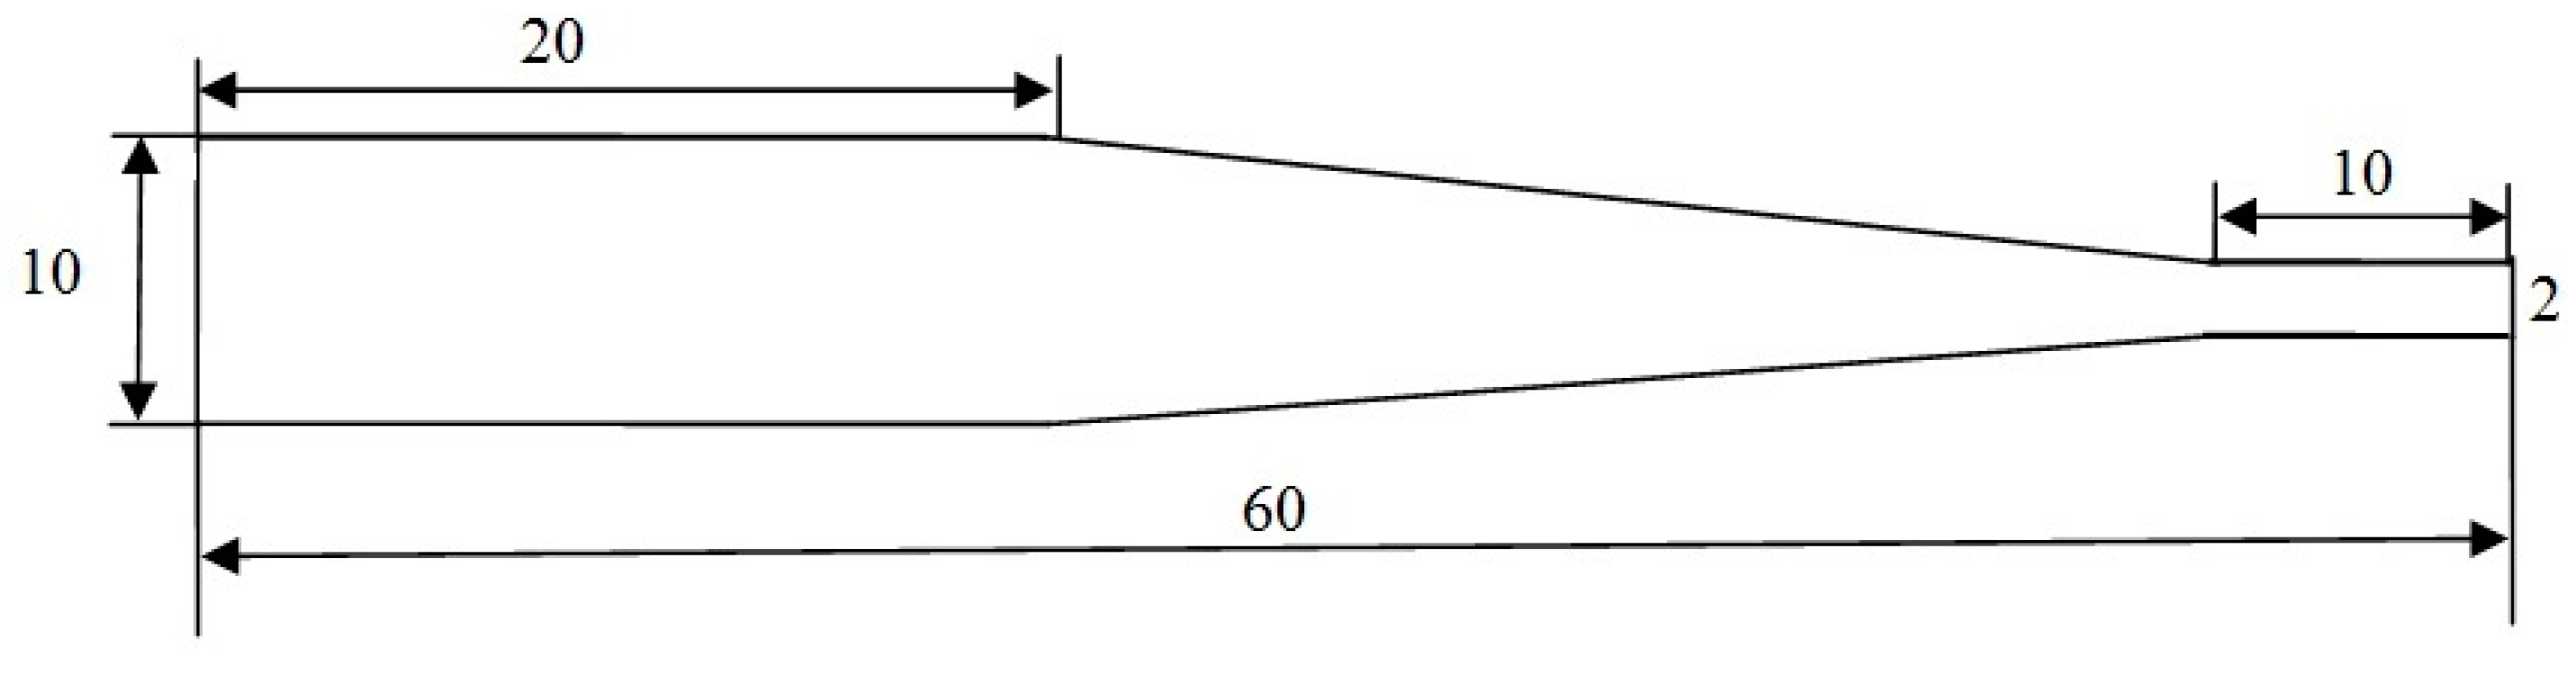
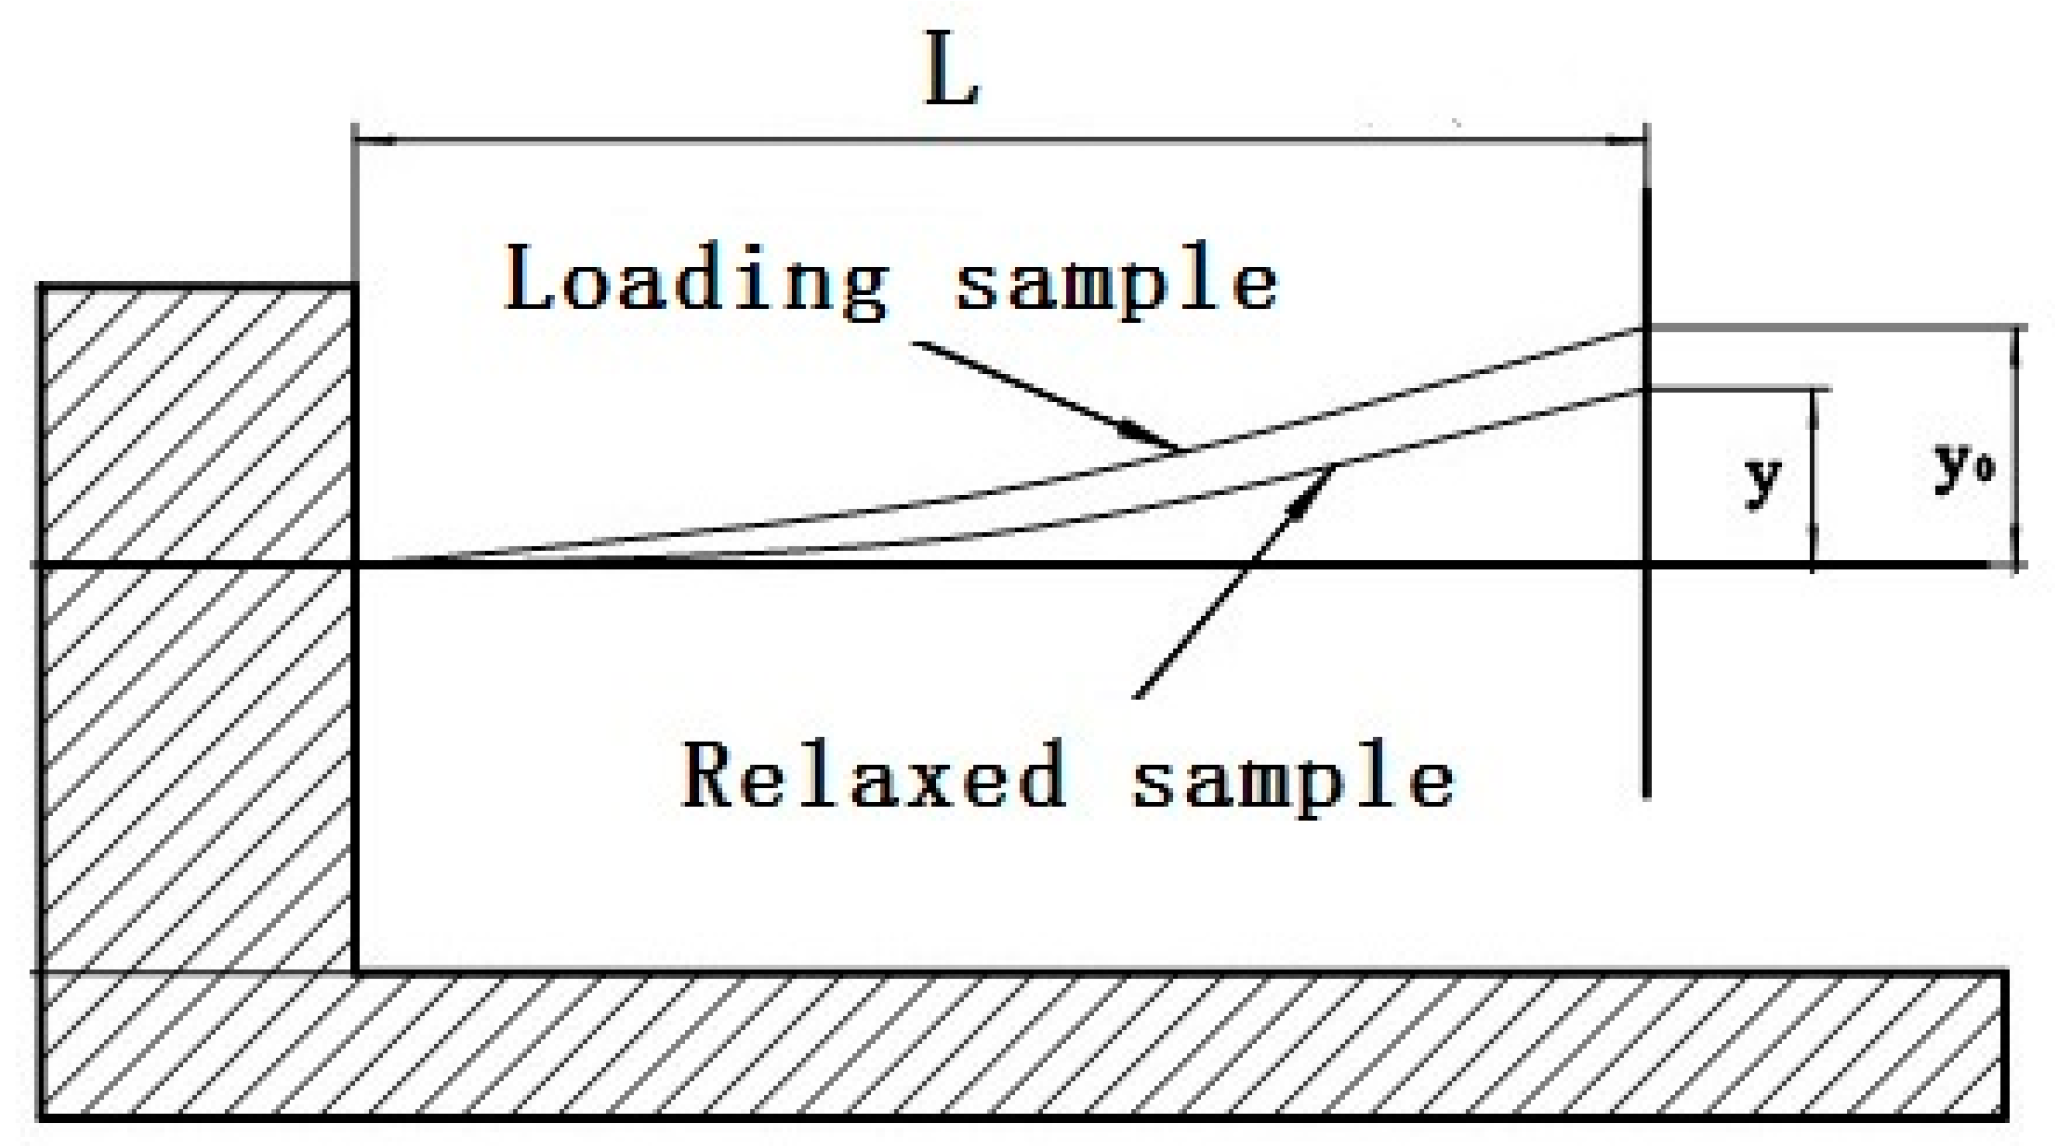
The materials selected for this study were C7025 and C7035 alloys in the form of plates with a thickness of 0.3 mm in a cold-rolled condition. The chemical composition of the alloys is shown in Table 1. Stress relaxation testing was carried out according to ASTM E328-2002(2008) standard method for plate products. The specimens for stress relaxation (Figure 1) were cut parallel to the rolling direction of the plate, using spark machinery from stock samples. A machine or system for special use has been developed to conduct the stress relaxation tests for plate (Figure 2). The configuration of the system is described in Reference [11] in detail. The stress relaxation was performed in a furnace at the test temperature. The temperature was monitored by a thermocouple placed in the grips near the specimen and the temperature was controlled to within ±1 K during the test. Stress relaxation was performed at room temperature (298 K) and at 393 K in a furnace, respectively. After a specified amount of time, the amount of relaxation (y) was measured with a tool microscope, and the residual stress (σr) was equal to σ0 × (y0 − y)/y.
Tensile testing was carried out on a WE-30 hydraulic universal material testing machine. Transmission electron microscopy samples were prepared using a conventional electro-polishing method with an electrolyte of 25 vol% HNO3 and 75 vol% CH3OH (Macklin Inc., Shanghai, China) at −30 °C. A JEM 2100 LaB6 transmission electron microscopy (JEOL Ltd, Akishima-shi, Japan) operating at 200 kV was employed to image the microstructure of the samples.
3. Calculation
During stress relaxation, the total strain (εt) remains constant. εt can be expressed as follows:
where σ0 is the initial stress and Ec is the modulus of the specimen.
εt = σ0/Ec = const
Total strain (εt) can be expressed as the sum of the elastic strain (εc) and inelastic strain (εp) [12]:
εt = εc + εp
Therefore, inelastic strain (εp) can be expressed as:
εp = εt − εc = (σ − σ0)/E
After differentiation, Equation (3) becomes:
In terms of the dislocation theory outlined by Orowan, the relationship between the rate of strain and the dislocation density can be expressed as [13]:
where Φ is the angle of the direction of dislocation, ρm is the mobile dislocation density, b is the Burgers vector and ν is the average dislocation velocity.
According to the semi-empirical observations of Johnston and Gilman, the average dislocation (ν) can be expressed as [14]:
where B and m are material constants for the test temperature respectively and σ* is the effective stress, which is defined as the difference between applied stress σ and long-range internal stress σi:
ν = B(σ*)m
σ* = σ − σi
The long-range internal stresses in the deformed metals have generally been associated primarily with the existence of dislocation pile-ups. It is a function as the testing temperature, strain range and the stress at the beginning of the relaxation process. In this test, these testing conditions remain unchanged during relaxation. For the sake of simplicity, the variation of σi can be neglected to a first approximation.
Taking the derivative of both sides with respect to t in Equation (7) results in:
Combining Equations (4)–(6) and (8), the following equation can be obtained:
The following discussion will be divided into two parts.
(i) It is assumed that the mobile dislocation density (ρm) will be unchanged during relaxation. Therefore, ρm is treated as constant, so dρm/dt = 0 and Equation (9) can be expressed as [15]:
where:
σ* = (Kt + α)−n
K = (m − 1) ΦEcρmbB
n = 1/(m − 1)
α = σ0*(1−m)
(ii) Dislocations in strongly deformed metals are frequently distributed heterogeneously on a microscale in alternating regions of high and low local dislocation density, respectively. For these metals the dynamic recovery process is, in principle, unavoidable due to their high elastic strain energy during relaxation. Dislocations can gain an additional degree of freedom through their ability to climb or cross slip at a given testing temperature. The mobile dislocation density is decreased due to the annihilation of the opposite sign’s dislocation by cross-slipping or climbing. The driving force results from the reduction of the elastic strain energy of the dislocations. Therefore, it is assumed that the mobile dislocation density, ρm, decreases with time as a hyperbola function at the constant testing temperature and the same starting stresses for copper alloys during relaxation. It is assumed that the mobile dislocation density (ρm) decreases with time:
where, ρm(t) is the mobile dislocation density at a certain time during relaxation. A and α0 are material constants at the test temperature respectively.
ρm(t) = A/(t + α0)
On integrating, Equation (9) can be expressed as:
where:
σ* = [K’ln(t + α0) + C]−n
K’ = (m − 1) ΦEcbBA
C = σ0*(1−m) − (m − 1) ΦEcbBA lnα0
4. Results
4.1. Dynamic Equation of Stress Relaxation
The mechanical properties of C7025 and C7035 alloys at room temperature in aging-cold-rolled conditions are listed in Table 2. Fifty percent of the elastic limit stress was used to set the initial stress for stress relaxation tests. The specimens were flexed to the desired initial stress level at 298 K and 393 K. The spring back deflection was proportional to the constraining force. Hence, by measuring permanent set as a function of time, the relationship between the remaining stress and time can be calculated.
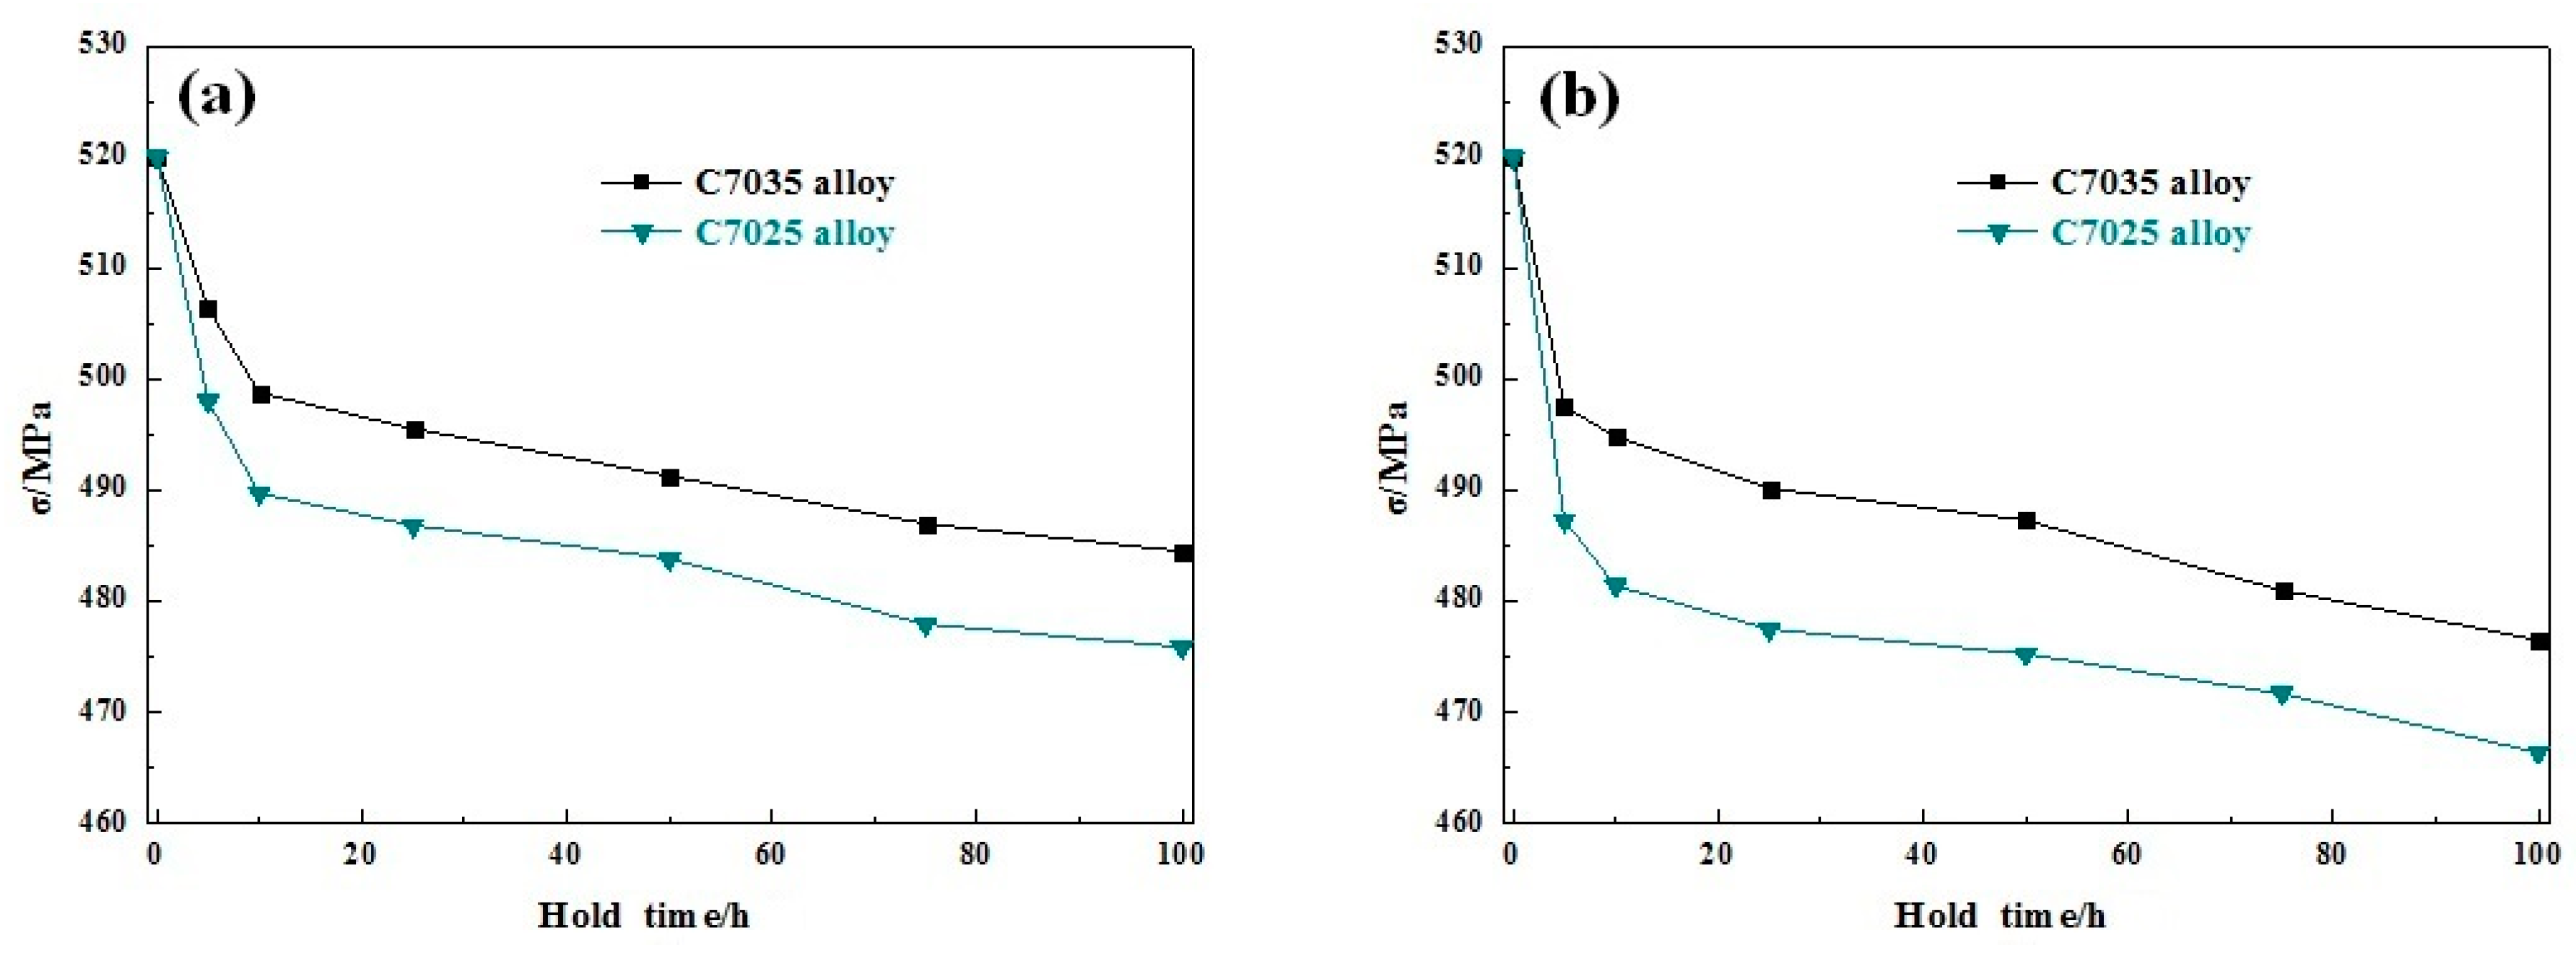
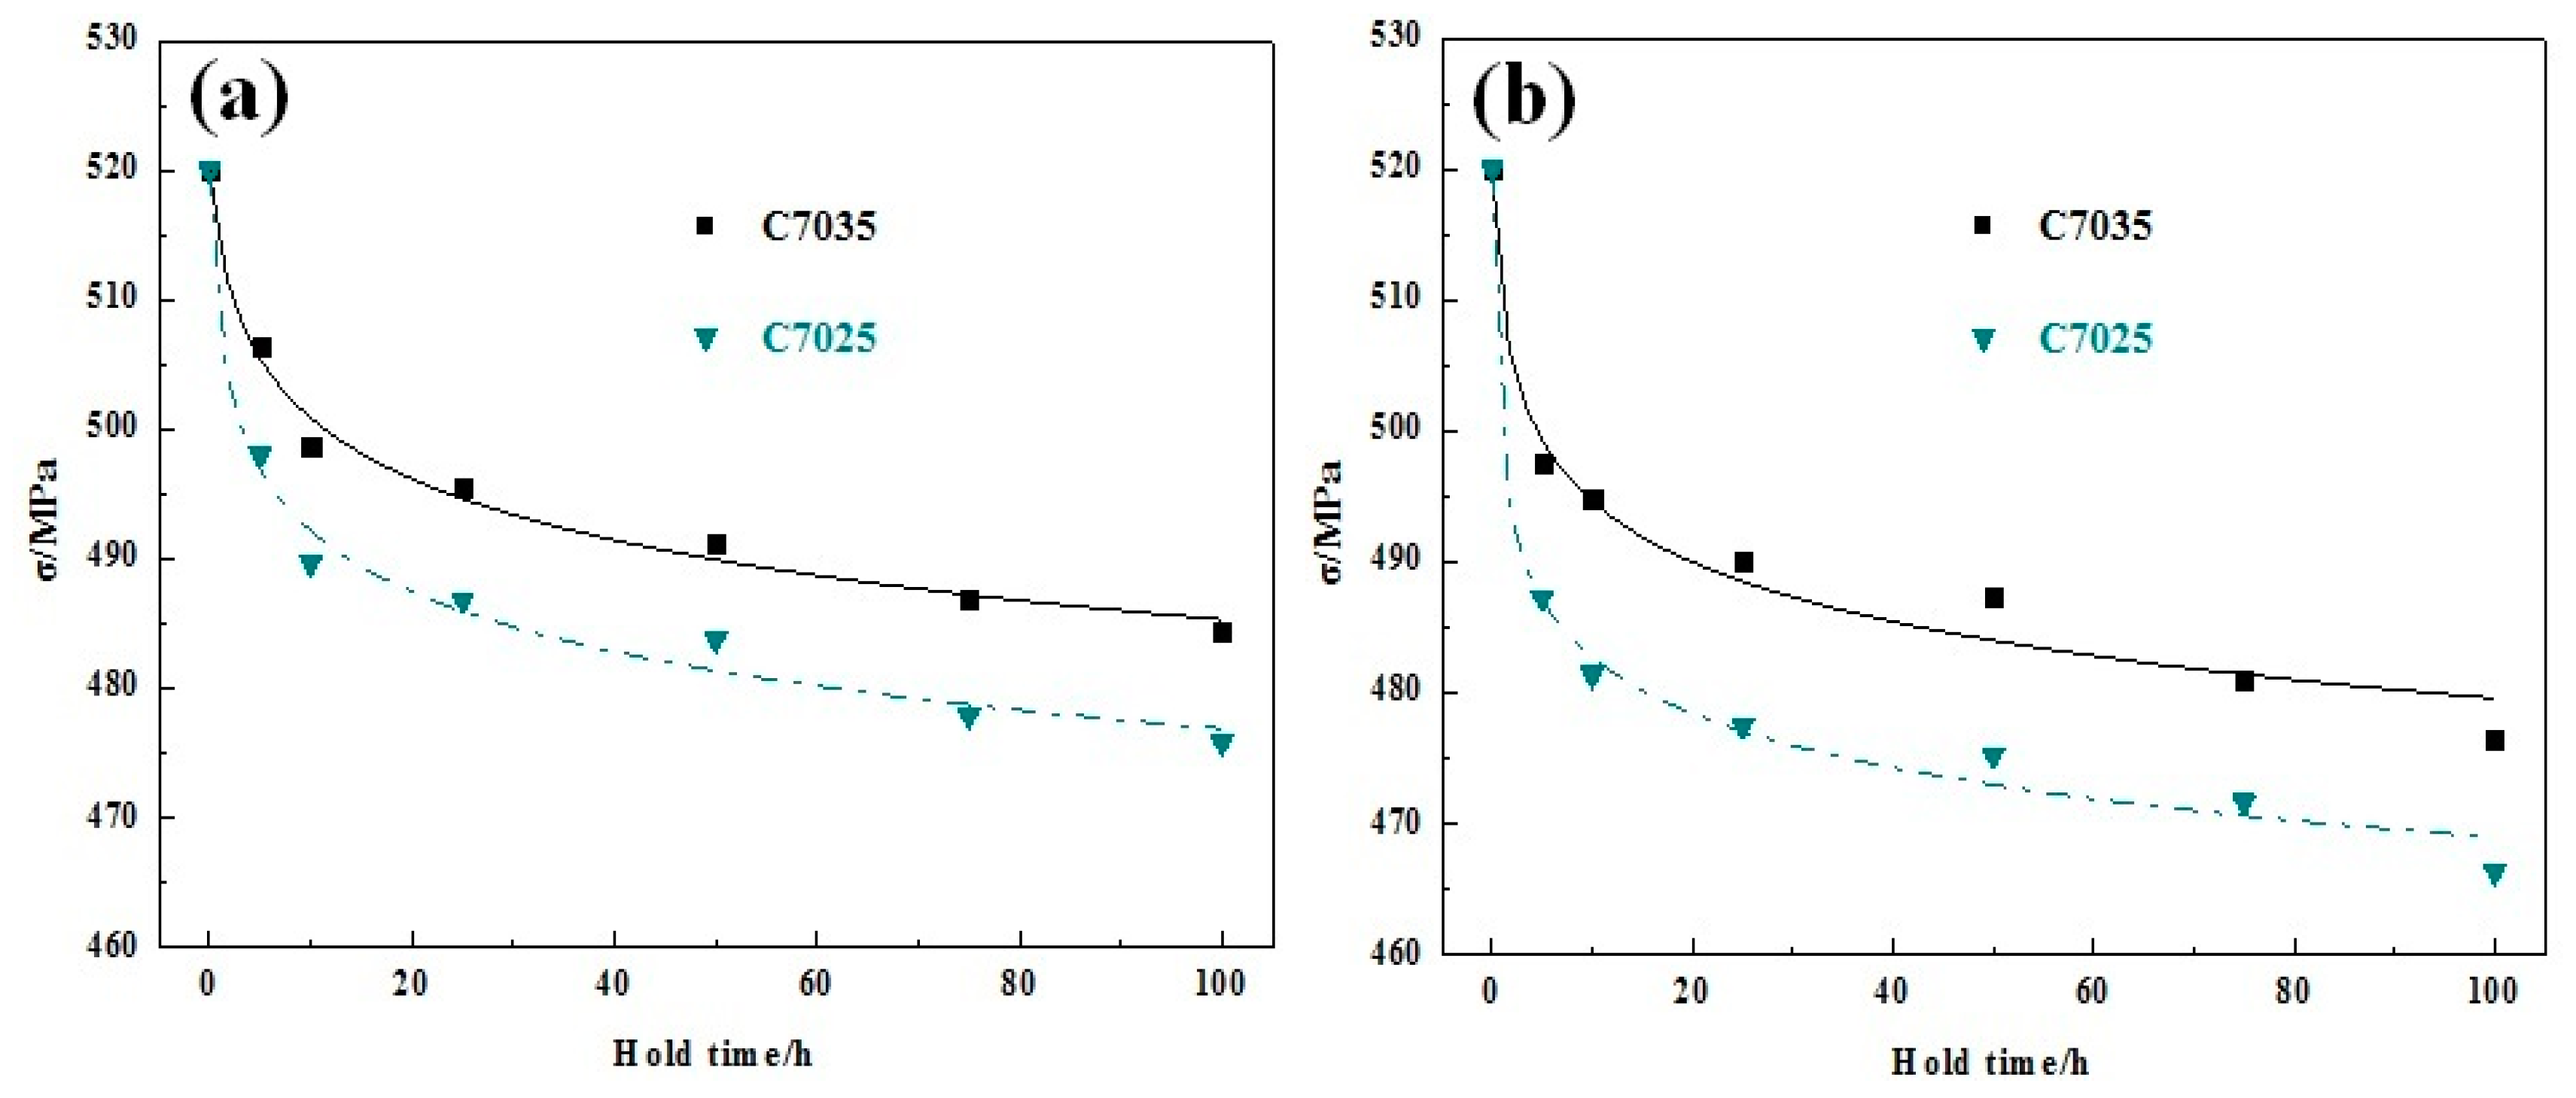
Stress relaxation curves for C7025 and C7035 alloys at 298 K and 393 K are shown in Figure 3. The curves are split into two stages. Stress relaxation occurred quickly in the first stage and slowly in the second stage, tending to a certain limit value after a long time.
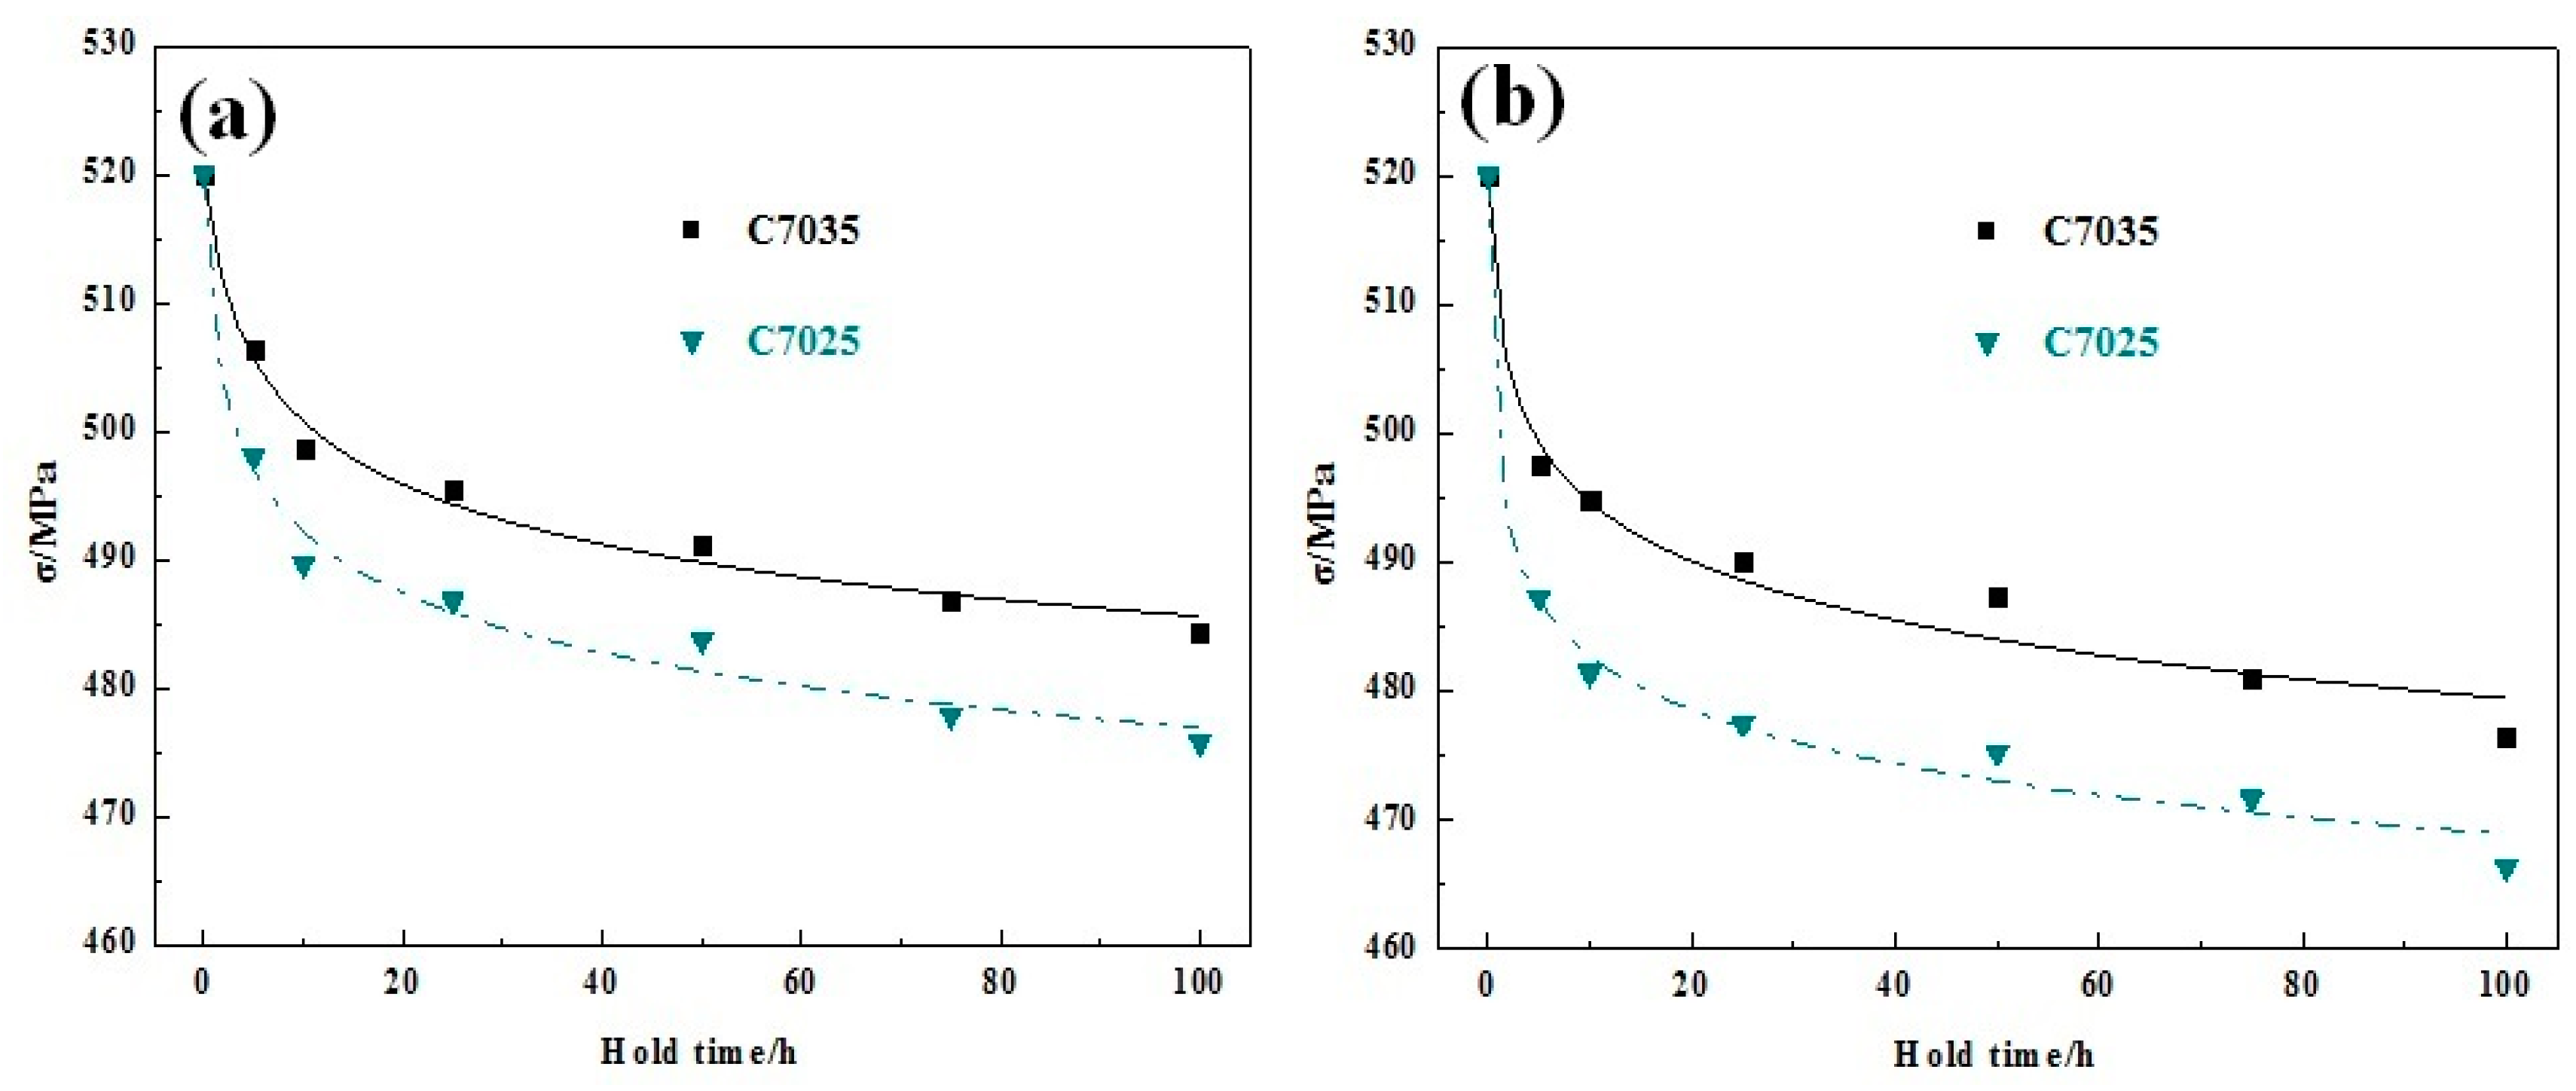
Numerical results after applying Equations (10) and (12) for the stress relaxation data of C7025 and C7035 at two different ways of modeling dislocation evolution for relaxation at 298 K and 393 K are shown in Table 3, Figure 4 and Figure 5. It can be seen from the results that the curve fits well with the empirical formula for stress relaxation.
4.2. Transmission Electron Microscopy Analysis of Relaxed Specimens
4.2.1. Before Stress Relaxation
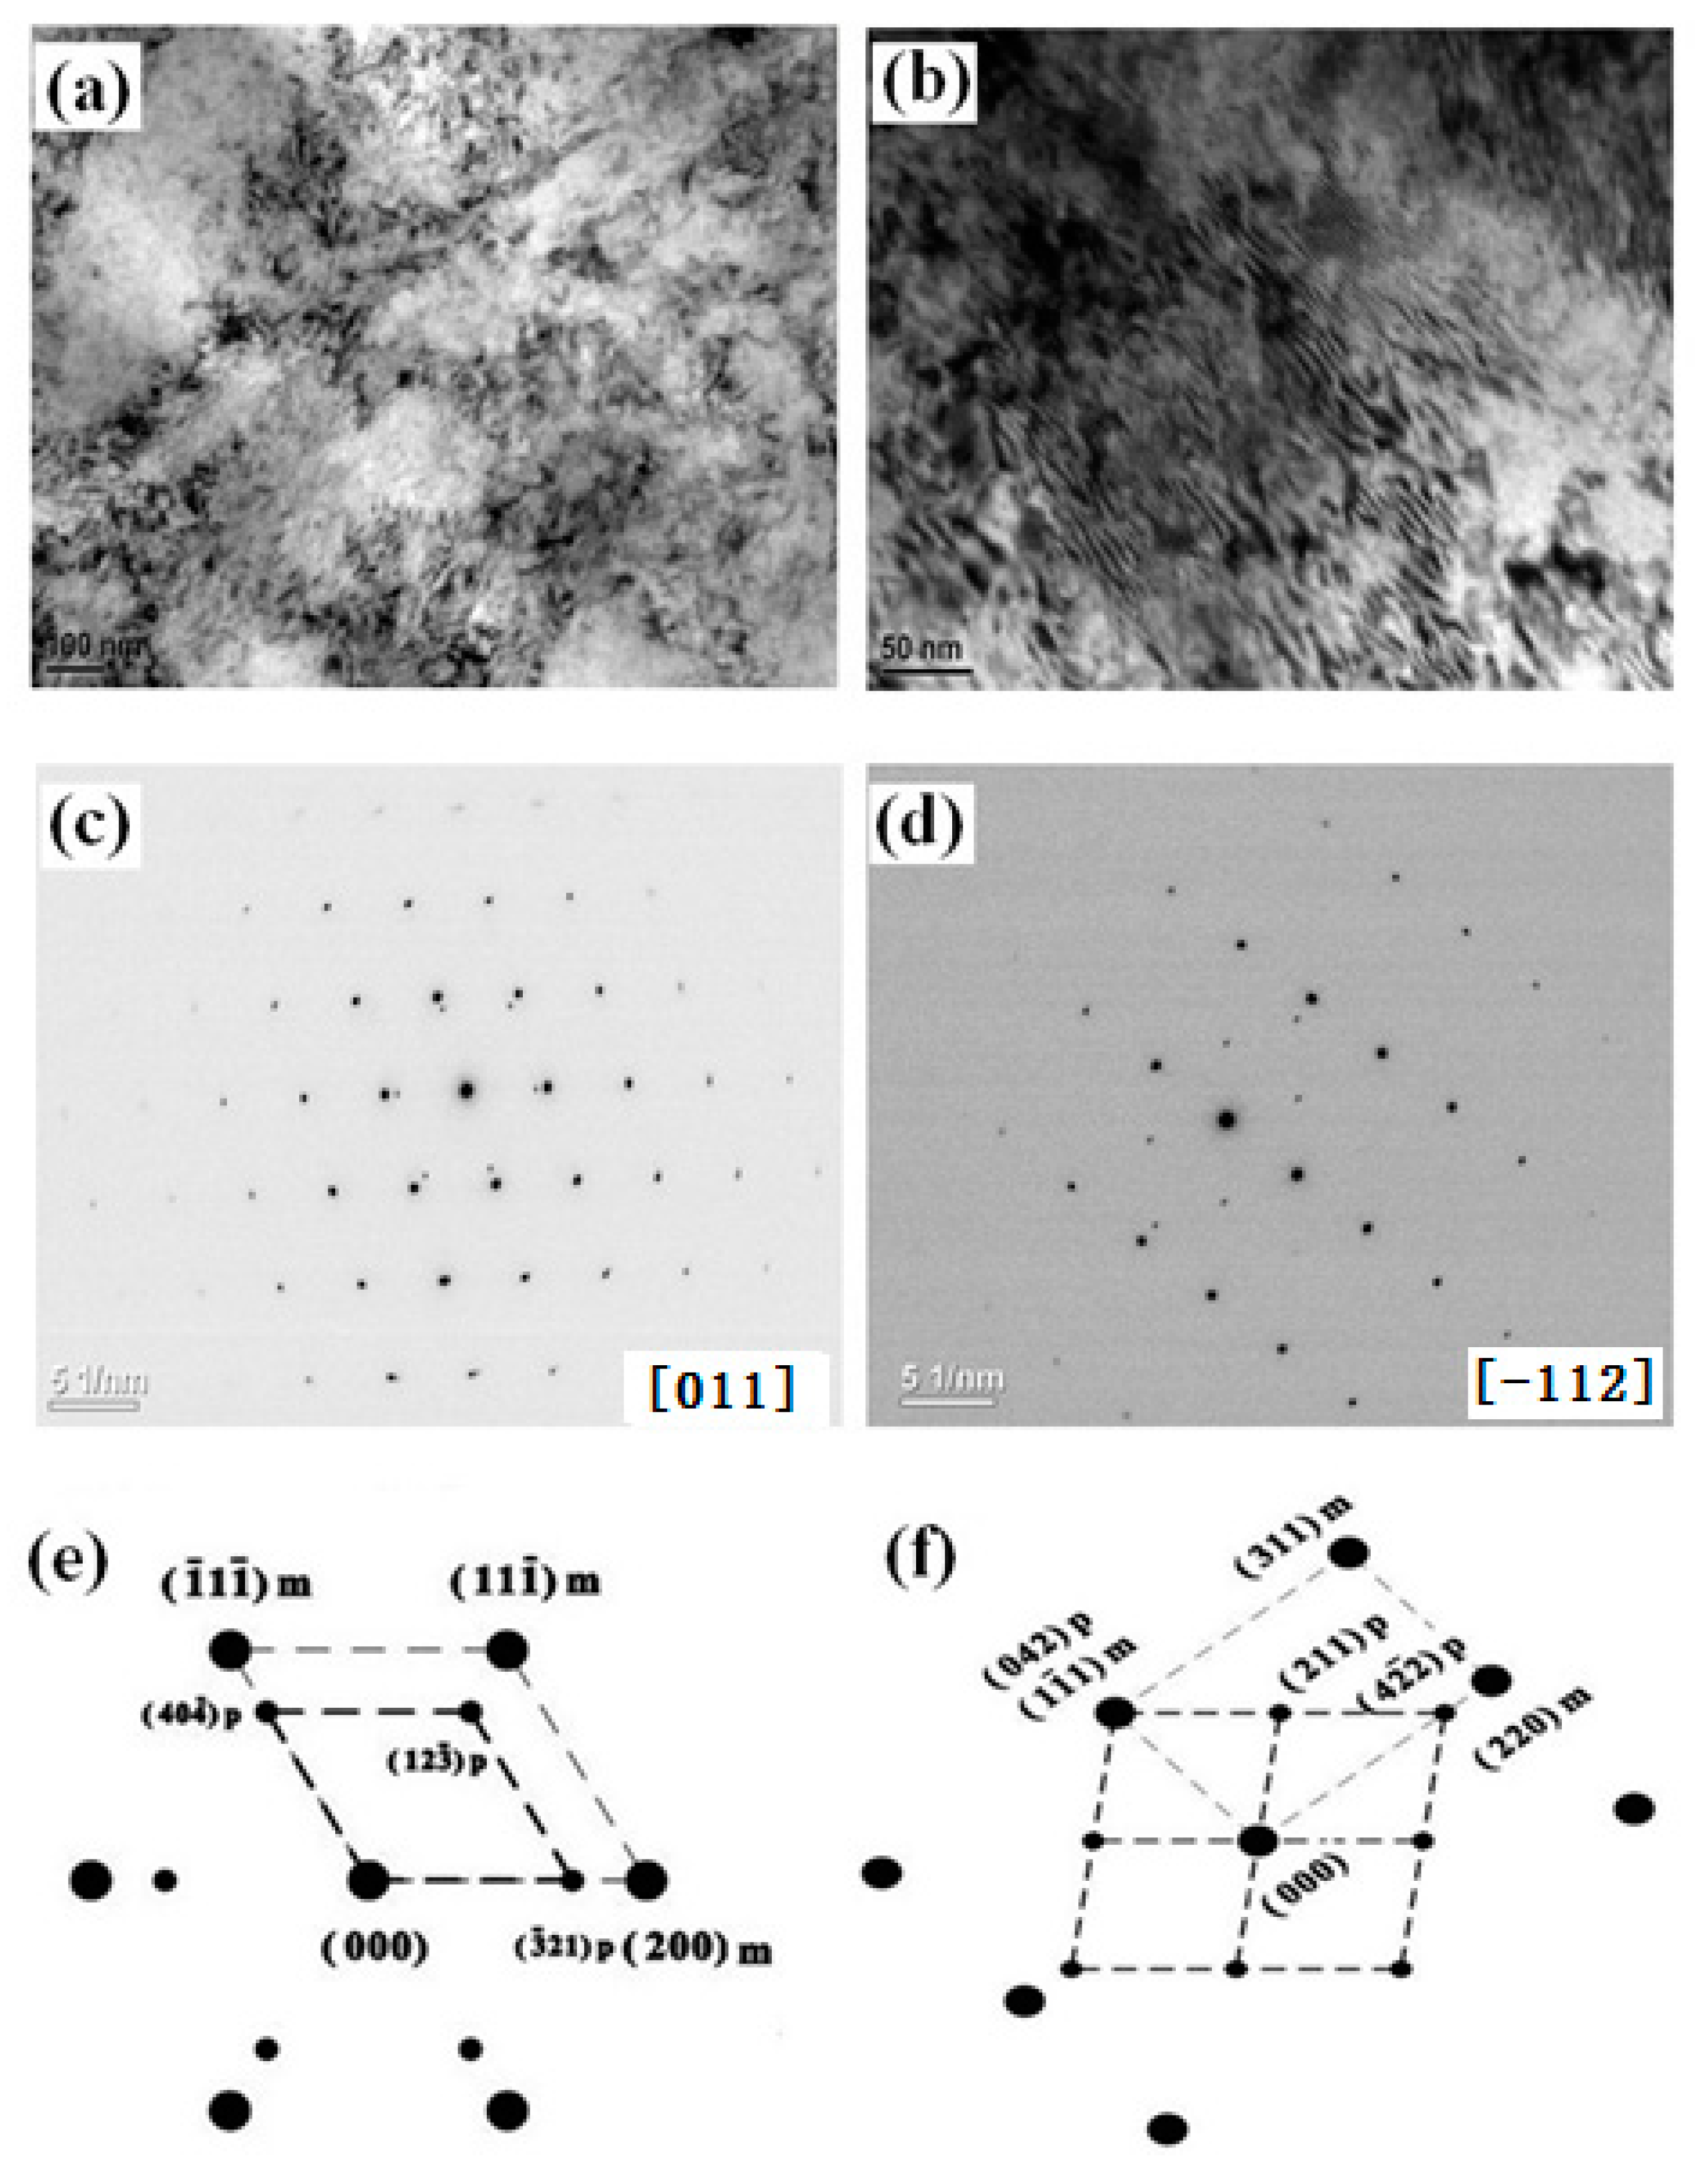
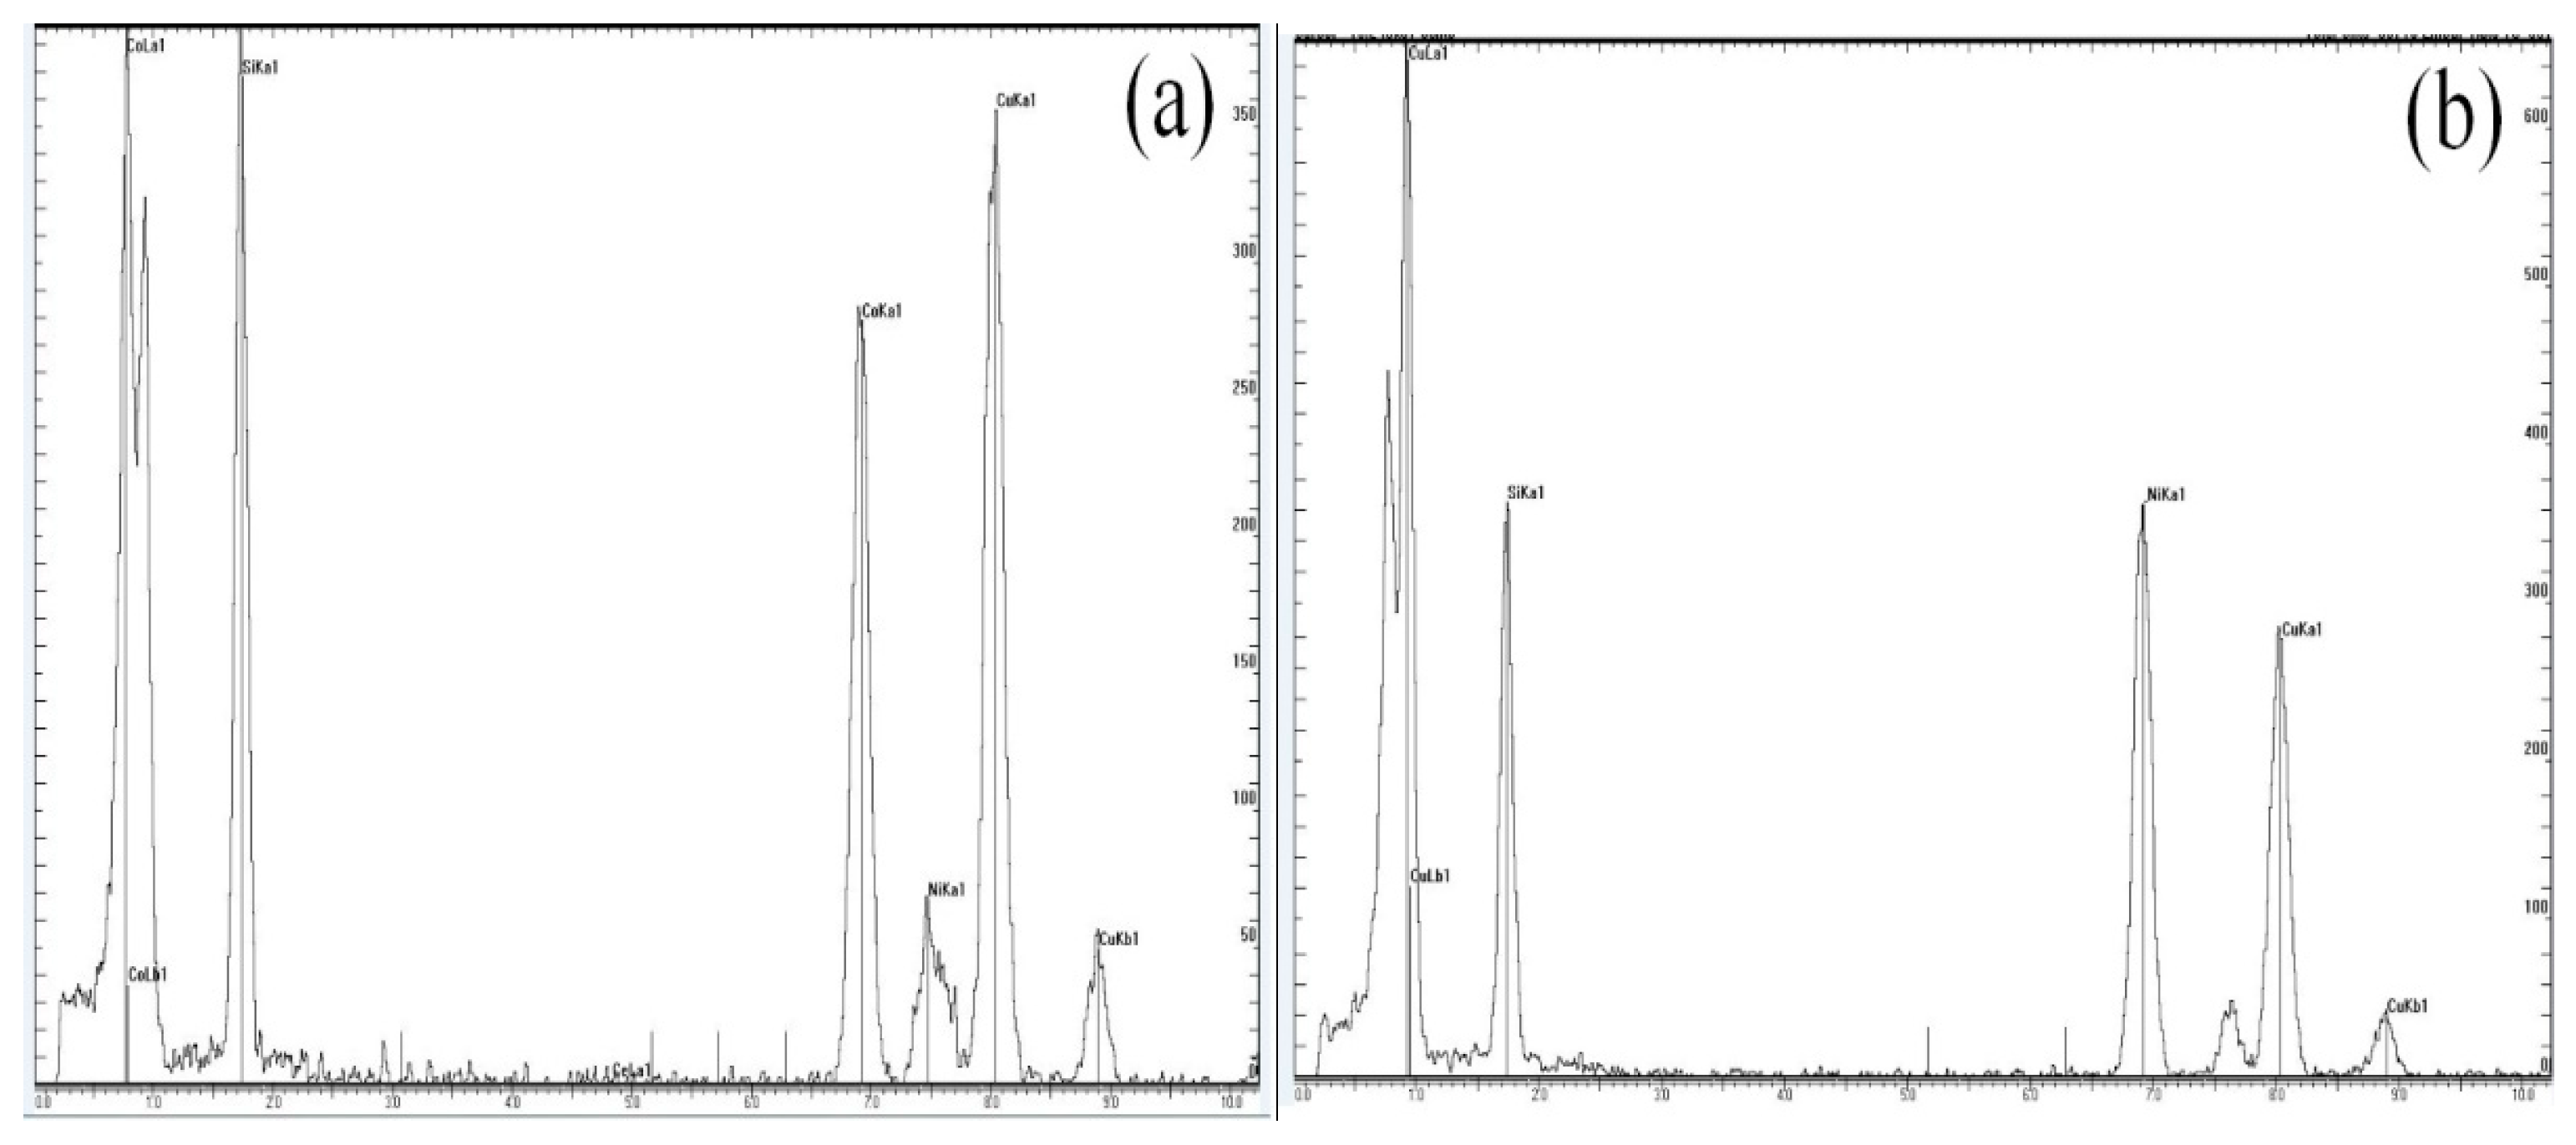
Discontinuous precipitation (DP) occurred along the grain boundaries, shown in Figure 6a,b. Discontinuous precipitation, also known as cellular precipitation, is a solid-state phase transformation that involves the conversion of a supersaturated solid solution into a solute-depleted matrix and precipitate phase across a moving boundary. Heterogeneous boundary precipitation and synchronous boundary migration occur during the grain-boundary DP reaction. DP colonies nucleate in grain boundaries and can either partially or completely engulf the original supersaturated matrix. The extent of discontinuous precipitation in the C7025 alloy was greater than in the C7035 alloy. As temperature and aging time increased, the cellular structures formed by discontinuous precipitation in the C7025 alloy underwent nucleation along the grain boundaries, including in-growth into the grains. Attachment of cellular structures onto the sub-boundaries caused a reduction in the resistance to mobile dislocation and an increase in the propensity for glide and climb. This finally results in a reduction in anti-stress-relaxation capacity. The diffraction patterns for Figure 6a,b are shown as Figure 6c,d, respectively. Figure 6e,f demonstrate that the second-phase particles were distributed intragranularly and along the grain boundaries, hindering the movement of dislocations. The Electronic Differential System (EDS) of the second-phase particles are shown in Figure 7. As can be seen from Figure 7, the C7025 alloy precipitated Ni2Si phase, and the C7025 alloy precipitated (Ni,Co)2Si phase. The relationship of the crystal orientations between matrix and precipitates follows [011]matrix //[111]precipitate, (−11−1)matrix //(10−1)precipitate; [−112]matrix //[32−4]precipitate, (110)matrix //(2−11)precipitate.
4.2.2. After Stress Relaxation
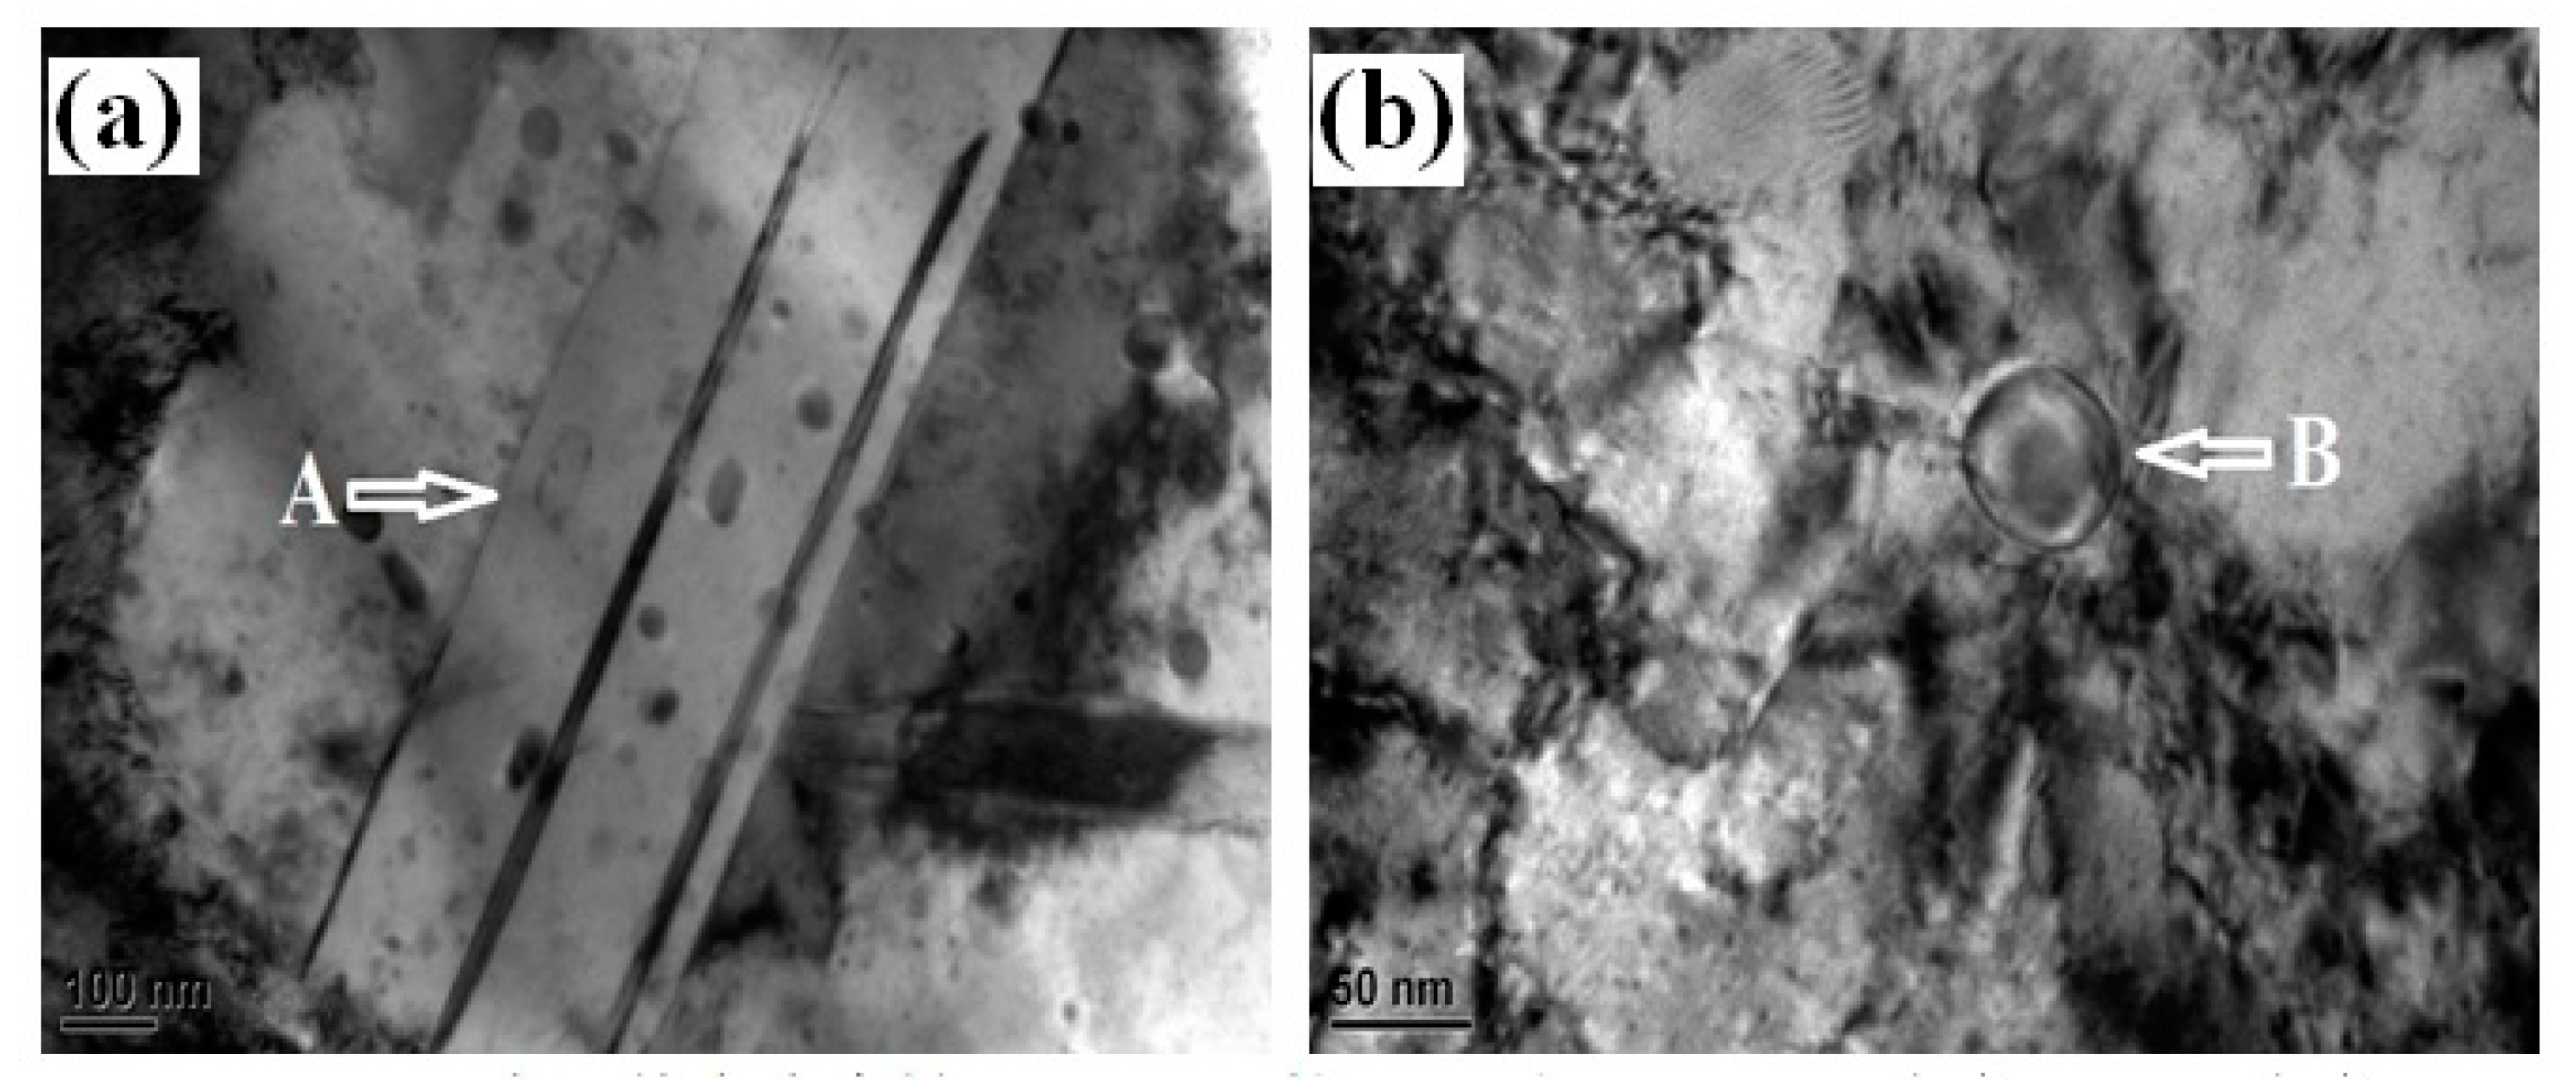
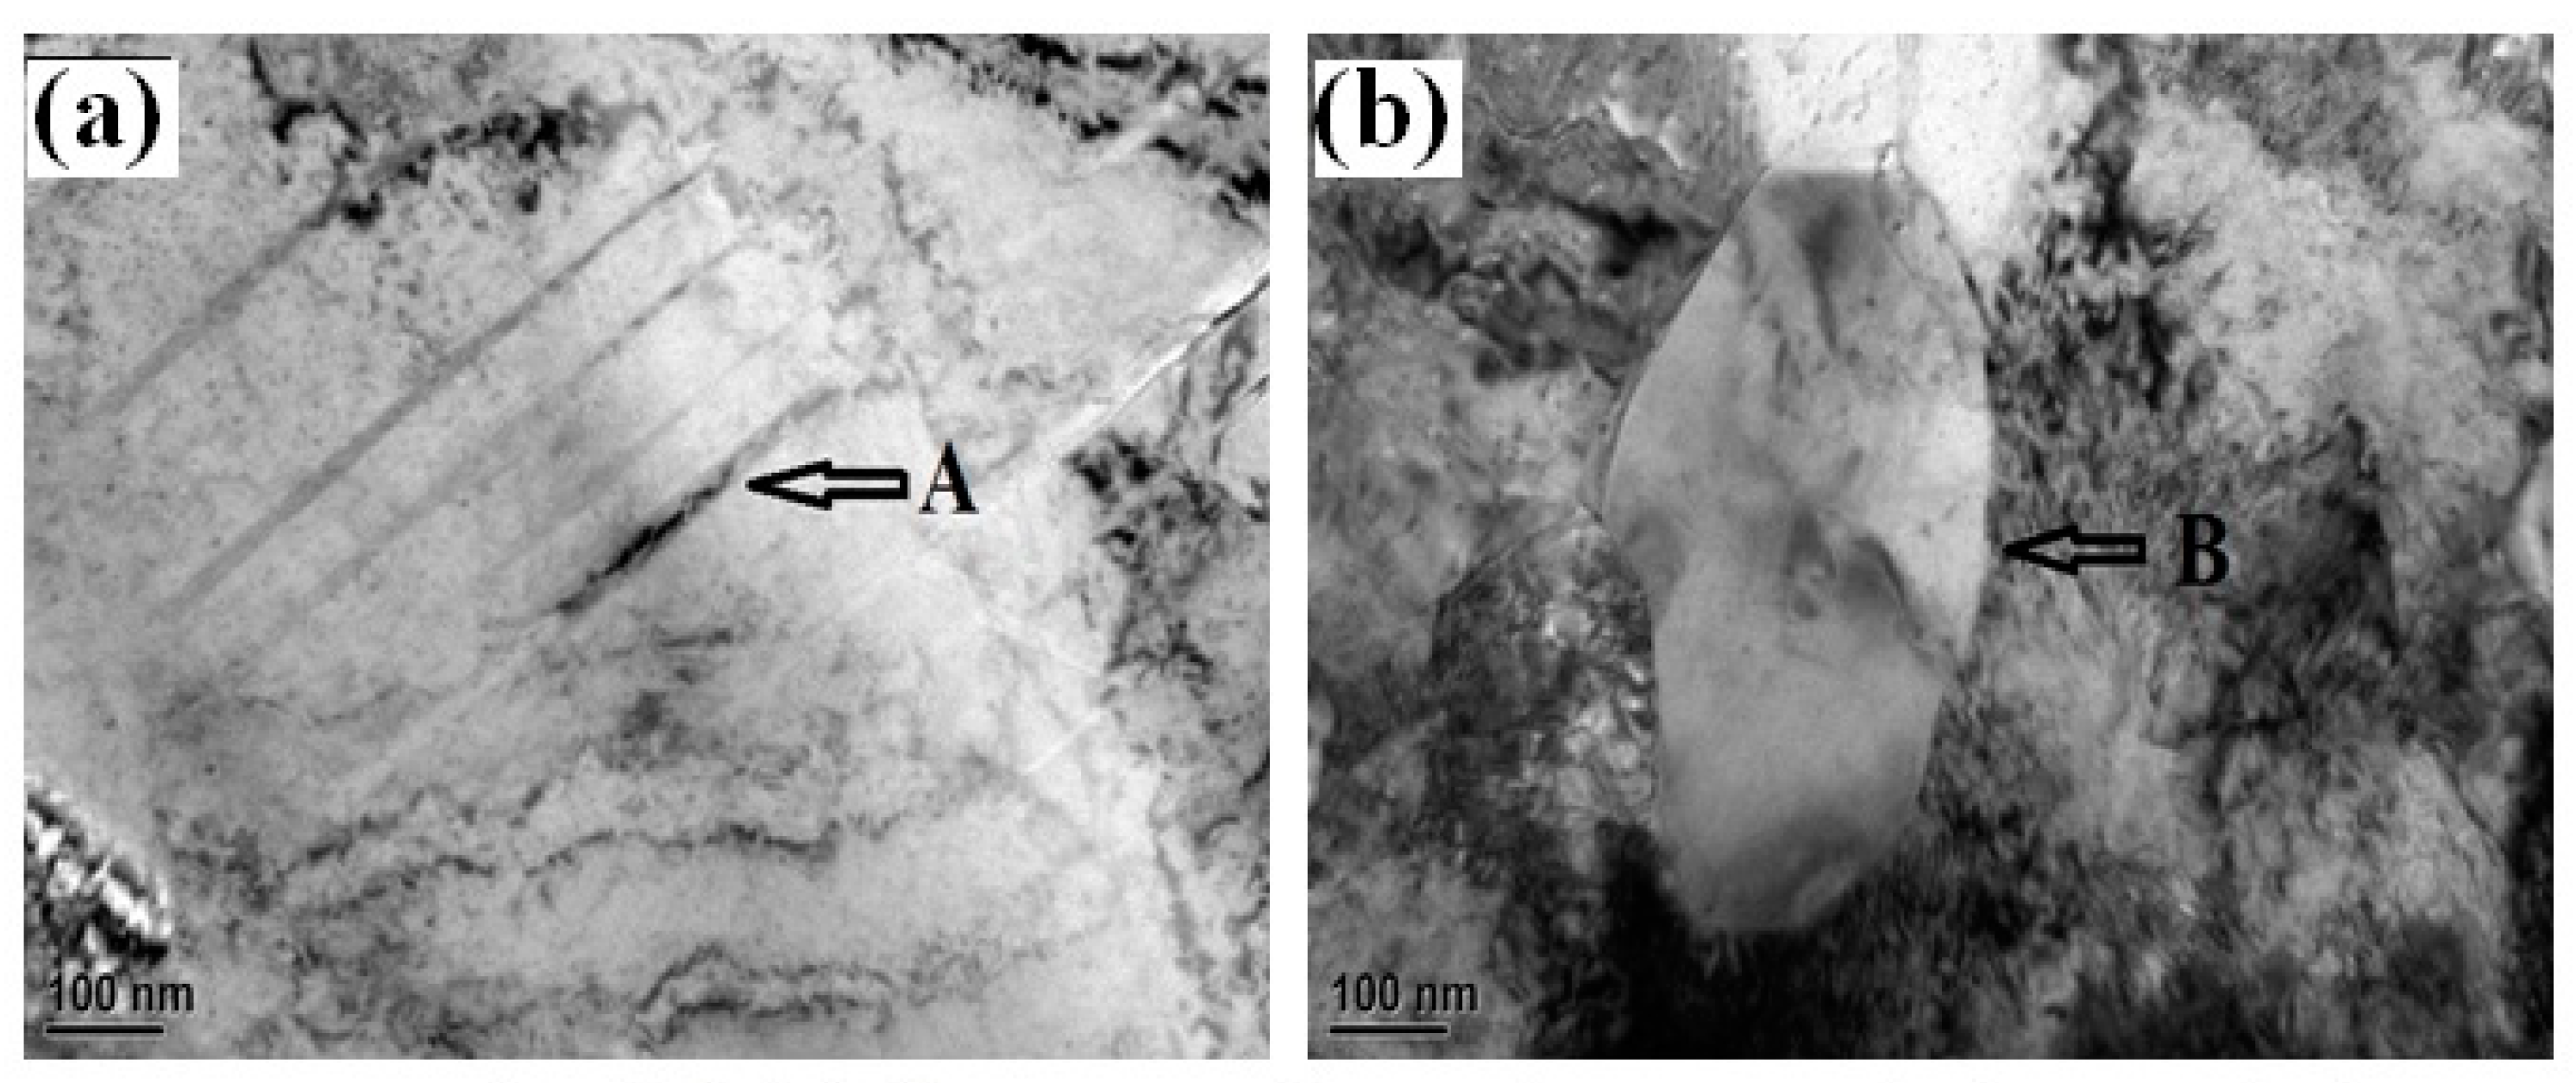
Compared with transmission electron microscopy images before relaxation, as can be seen from Figure 8, dislocation density decreased significantly after stress relaxation. This indicates that dislocation glide and climb occurred, recovery and slipping progress simultaneously during stress relaxation. In the C7035 alloy, partial substitution of nickel by cobalt promoted the precipitation of the second phase and twinning in the matrix. These phenomena have the effect of preventing dislocation migration. A comparison of transmission electron microscopy images of C7035 alloy with that of the C7025 alloy after stress relaxation for 100 h reveals the presence of twinning in the C7035 alloy (indicated by A in Figure 8a). For a dislocation to glide away from the twinning, greater energy is required. This is the reason twinning prevents dislocation, reducing the rate of stress relaxation in alloys and increasing the anti-stress relaxation capacity of the material. Significant discontinuous precipitation occurred in C7025 alloy, leading to the formation of cellular structures and a reduction in resistance to mobile dislocation along the sub-boundaries during stress relaxation. This further promoted glide and climb, increasing the rate of stress relaxation, and reducing anti-stress relaxation capacity. Besides discontinuous precipitation, dynamic recovery and recrystallization (indicated by B in Figure 8b) were observed in C7025 alloy during long-term stress relaxation. This process caused further reduction in stress and hence a decline in the anti-stress relaxation capacity. As shown in Figure 8, partial substitution of nickel by cobalt element in C7035 alloy promoted the formation of a precipitated phase and twinning, hindering discontinuous precipitation and mobile dislocation during stress relaxation. This further improved the anti-stress relaxation capacity of the material.
As relaxation temperature increased, the resistance to mobile dislocation decreased. In Figure 9, the interaction between dislocation and second-phase particles can be seen in the bending of dislocations pinned by adjacent second-phase particles. Streak structures appeared in the C7035 alloy (indicated by A in Figure 9a). These hindered the movement of dislocations, which were confined to the area between the streaks. Recrystallized structures occurred in the grains after stress relaxation of the C7025 alloy at high temperature for a long period of time (indicated by B in Figure 9a), which further reduced stress and caused a decline in anti-stress relaxation capacity of the material.
5. Discussion
During the first stage of stress relaxation, the rate of relaxation is faster because of the accelerated rate of dynamic recovery and recrystallization. Interactions between vacancies, and dislocations of the same and opposite sign accelerate realignment and movement of dislocations. Furthermore, at this stage of stress relaxation, a large number of mobile dislocations accumulate inside the grains, which reduces the resistance of dislocations–dislocations and dislocations–atoms interactions to mobile dislocation. For the above reasons, the anti-stress relaxation capacity at this stage is greatly reduced. The rate of stress relaxation is lower during the second stage of stress relaxation, when interactions between dislocations, second-phase particles and impurities cause multiplication of dislocations. As a result, the movement of dislocations is hindered. Transmission electron microscopy images show that the sub-grains are not formed uniformly along the grain boundaries and sub-boundaries, but concentrated locally. This causes heterogeneous deformation after stress relaxation (Figure 8). Because of hindered movement of dislocations in the regions of micro-plastic deformation, the pile-up of dislocations is observed, leading to stress concentration. Therefore, during the second stage of stress relaxation, the relaxation is caused by dislocation glide under high stress, which occurs at a lower rate. That explains the low rate of stress relaxation during the second stage [16,17,18].
Compared with the C7025 alloy, the C7035 alloy has a lower rate of stress relaxation and a higher anti-stress relaxation capacity. The presence of doped cobalt reduced the tendency towards spinodal decomposition because the solid solubility of cobalt in copper is lower than nickel’s, and cobalt is likely to bind to available vacancies. As a result, the movement of vacancies required by spinodal decomposition was inhibited [4], and the quantity of cobalt-containing vacancies decreased dramatically in the C7035 alloy. This further inhibited the glide of mobile dislocations and improved the anti-stress relaxation capacity. Furthermore, doped cobalt promoted precipitation from the matrix, the precipitated phases becoming uniformly diffused in the alloy matrix. During the process of stress relaxation, mobile dislocations were pinned by the second-phase particles in diffuse distribution. A stable Cottrell atmosphere was formed around the second-phase particles, so that dislocation clusters hindered the movement of the mobile dislocations, increasing anti-stress relaxation capacity while reducing the degree of stress relaxation. The precipitated phases were uniformly distributed along the grain boundaries and in the matrix. Mobile dislocations can move during stress relaxation until being pinned by the second-phase particles, which gives rise to the Cottrell atmosphere. As mobile dislocations deposit to form dislocation clusters, their movement is made difficult during the process of stress relaxation [19,20,21]. For these reasons, the degree of stress relaxation decreases, and so anti-stress relaxation capacity increases.
6. Conclusions
(1) The stress relaxation curves of the C7025 and C7035 alloys can be described in empirical formula of σ* = [K’ln(t + α0) + C]−n with great precision.
(2) The stress relaxation curves are split into two stages. Stress relaxes quickly in the first stage and slows down in the second stage and tends to a certain limit value after a long time. At the first stage of stress relaxation, a large quantity of mobile dislocations accumulate inside the grains, which reduces the resistance to mobile dislocation. Second-phase particles and impurities cause multiplication of dislocations in the second stage, which lead a lower rate of stress relaxation.
(3) The C7035 alloy has a lower rate of stress relaxation and a higher anti-stress relaxation capacity than the C7025 alloy. On one hand, this is because that the movement of vacancies required by spinodal decomposition is inhibited, and the quantity of cobalt-containing vacancies decrease dramatically in the C7035 alloy. On the other hand, the precipitated phases become uniformly diffuse in the C7035 alloy.
Author Contributions
Data curation, H.X. Formal analysis, J.H. Methodology, J.W. Supervision, X.X. Writing—review & editing, J.Z.
Funding
National Natural Science Foundation of China: 51561008 and 51461017. Key Program of Jiangxi Natural Science Foundation for Young Scholar: 20171ACB21044 and 20161BBE50030.
Acknowledgments
This work was supported by the National Natural Science Foundation of China (No. 51561008 and 51461017) and Key Program of Jiangxi Natural Science Foundation for Young Scholar (No. 20171ACB21044 and 20161BBE50030). Special thanks are given to Professor Liu Ruiqing and Wang Hang for enlightening discussions.
Conflicts of Interest
The authors declare no conflict of interest.
References
- Suzuki, S.; Shibutani, N.; Mimura, K.; Isshiki, M.; Waseda, Y. Improvement in strength and electrical conductivity of Cu–Ni–Si alloys by aging and cold rolling. J. Alloys Compd. 2006, 417, 116–120. [Google Scholar] [CrossRef]
- Monzen, R.; Watanabe, C. Microstructure and mechanical properties of Cu-Ni-Si alloys. Mater. Sci. Eng. A 2008, 482, 117–123. [Google Scholar] [CrossRef]
- Izawa, K.; Ozawa, A.; Kita, K.; Watanabe, C.; Monzen, R.J. Influence of Co on strength and microstructure of Cu-Ni-Co-Si alloy. Soc. Mater. Sci. Jan. 2014, 63, 401–408. [Google Scholar] [CrossRef]
- Xiao, X.P.; Yi, Z.Y.; Chen, T.T.; Liu, R.Q.; Wang, H. Suppressing spinodal decomposition by adding Co into Cu-Ni-Si alloy. J. Alloys Compd. 2016, 660, 178–183. [Google Scholar] [CrossRef]
- Wang, Q.S.; Xie, G.L.; Mi, X.J.; Xiong, B.Q.; Xiao, X.P. The precipitation and strengthening mechanism of Cu-Ni-Si-Co alloy. Chin. Mater. Conf. 2012, 749, 294–298. [Google Scholar] [CrossRef]
- Chen, J.F.; Jiang, J.T.; Zhen, L. Stress relaxation behavior of an Al-Zn-Mg-Cu alloy in simulated age-forming process. J. Mater. Process. Technol. 2014, 214, 775–783. [Google Scholar] [CrossRef]
- Xu, X.X.; San, X.Y.; Gong, Y.L. Studies on strength and ductility of Cu-Zn alloys by stress relaxation. Mater. Des. 2013, 47, 295–299. [Google Scholar]
- Chandler, H.D. A comparison between steady state creep and stress relaxation in copper. Mater. Sci. Eng. A 2010, 527, 6219–6223. [Google Scholar] [CrossRef]
- Parikin, Stress Relaxation Testing; ASTM: West Conshohocken, PA, USA, 1979; pp. 48–53.
- Li, Y.L.; Han, Y.J.; Yu, S.C. Stress relaxation properties and microstructure of Cu-Be alloys. Trans. Nonferrous Met. Soc. China 1993, 3, 62–65. [Google Scholar]
- Xiao, L.; Bai, J.L. Stress relaxation properties and microscopic deformation structure of H68 and QSn6.5-0.1 copper alloys at 353 K. Mater. Sci. Eng. A 1998, 244, 250–256. [Google Scholar] [CrossRef]
- Kula, E.; Weiss, V. Residual stress and stress relaxation; Plenum Press: New York, NY, USA, 1981; pp. 140–148. [Google Scholar]
- Orowan, E. Fracture and Strength of Solids [Metals]. Rep. Prog. Phys. 1948, 12, 185–232. [Google Scholar] [CrossRef]
- Johnston, W.J.; Gilman, J.J.J. Dislocation velocities, dislocation densities, and plastic flow in Lithium fluoride crystals. Appl. Phys. 1959, 30, 129–144. [Google Scholar] [CrossRef]
- Li, J.C.M. Dislocation dynamics in deformation and recovery. Can. J. Phys. 1967, 45, 493–509. [Google Scholar] [CrossRef]
- Virtanen, P.; Tiainen, T. Stress relaxation behavior in bending of high strength copper alloys in the Cu-Ni-Sn system. Mater. Sci. Eng. A 1997, 238, 407–420. [Google Scholar] [CrossRef]
- Povolo, F.; Tinivella, R. Stress relaxation in bending of type AISI 304 and A-286 steels at 773K. J. Mater. Sci. 1984, 19, 1851–1862. [Google Scholar] [CrossRef]
- Lee, D.H.; Nam, S.W.; Choe, S.J. Effect of microstructure and relaxation behavior on the high temperature low cycle fatigue of near-a-Ti-1100. Mater. Sci. Eng. A 2000, 291, 60–67. [Google Scholar] [CrossRef]
- Povarov, I.A. Stress relaxation in structural titanium alloys. Met. Sci. Heat Treat. 1982, 22, 433–452. [Google Scholar] [CrossRef]
- Mori, T. Diffusional relaxation around a second phase particle. Acta Metall. 1980, 28, 319–321. [Google Scholar] [CrossRef]
- Onaka, S. Kinetics of Stress relaxation caused by the combination of interfacial sliding and diffusiong: Two-dimensional analysis. Acta Mater. 1998, 46, 3821–3830. [Google Scholar] [CrossRef]
Figure 1.
Shape and size of stress relaxation specimen (unit: mm).

Figure 2.
The schematic diagram of experiments and methods with stress relaxation.

Figure 3.
Stress relaxation curves for the C7025 and C7035 alloys at 298 K (a) and 393 K (b).

Figure 4.
The equation fitting curve (σ* = (Kt + α)−n) compared with experimental values at 298 K (a) and 393 K (b).
Figure 4.
The equation fitting curve (σ* = (Kt + α)−n) compared with experimental values at 298 K (a) and 393 K (b).

Figure 5.
The equation fitting curve (σ* = [K’ln(t + α0) + C]−n) compared with experimental values at 298 K (a) and 393 K (b).
Figure 5.
The equation fitting curve (σ* = [K’ln(t + α0) + C]−n) compared with experimental values at 298 K (a) and 393 K (b).

Figure 6.
The organization of before-stress-relaxation (a) transmission electron microscopy image of the C7035 alloy; (b) transmission electron microscopy image of the C7025 alloy; (c) selected area diffraction patter of (a); (d) selected area diffraction patter of (b); (e) result of (c); (f) result of (d).

Figure 7.
The EDS of the second-phase particles (a) C7035 alloy; (b) C7025 alloy.

Figure 8.
Transmission electron microscopy images of stress relaxation after 100 h at 298 K (a) the C7035 alloy; (b) the C7025 alloy.
Figure 8.
Transmission electron microscopy images of stress relaxation after 100 h at 298 K (a) the C7035 alloy; (b) the C7025 alloy.

Figure 9.
Transmission electron microscopy images of stress relaxation after 100 h at 393 K (a) the C7035 alloy; (b) the C7025 alloy.
Figure 9.
Transmission electron microscopy images of stress relaxation after 100 h at 393 K (a) the C7035 alloy; (b) the C7025 alloy.


Table 1.
Composition for the experimental alloy.
| Alloy | Nickel | Silicon | Cobalt | Copper |
|---|---|---|---|---|
| C7025 | 2.6 | 0.6 | 0 | Balance |
| C7035 | 1.4 | 0.6 | 1.2 | Balance |
Table 2.
Mechanical properties of C7025 and C7035 alloys in aging-cold-rolled conditions.
| Alloy | Tensile Strength σb (MPa) | Yield Strength σs (MPa) | Elongation δ (%) |
|---|---|---|---|
| C7025 | 756 ± 20 | 535 ± 10 | 5~7 |
| C7035 | 838 ± 20 | 584 ± 10 | 5~7 |
Table 3.
Test results after applying the empirical equation.
| Alloy | Temperature | Dynamic Equation | Variance | Correlation Coefficient |
|---|---|---|---|---|
| C7035 | 298 K | σ* = 449.96 + 75.75 × (t + 1.61)−0.16 | 3.19 | 0.989 |
| 393 K | σ* = 108.98 + 401.91 × (t + 0.28)−0.02 | 8.71 | 0.978 | |
| C7025 | 298 K | σ* = 367.44 + 142.56 × (t + 0.31)−0.06 | 5.31 | 0.988 |
| 393 K | σ* = 63.18 + 433.9 × (t + 0.03)−0.02 | 5.02 | 0.992 | |
| C7035 | 298 K | σ* = [1.23 × 10⁻⁶ + 4.47 × 10⁻⁸ × (t + 0.95)]−0.46 | 2.89 | 0.991 |
| 393 K | σ* = [8.27 × 10⁻⁷ + 2.82 × 10⁻⁸ × (t + 0.36)]−0.45 | 8.28 | 0.979 | |
| C7025 | 298 K | σ* = [1.31 × 10⁻⁶ + 4.42 × 10⁻⁸ × (t + 0.28)]−0.46 | 5.30 | 0.988 |
| 393 K | σ* = [8.54 × 10⁻⁷ + 2.68 × 10⁻⁸ × (t + 0.05)]−0.45 | 4.86 | 0.992 |
© 2018 by the authors. Licensee MDPI, Basel, Switzerland. This article is an open access article distributed under the terms and conditions of the Creative Commons Attribution (CC BY) license (http://creativecommons.org/licenses/by/4.0/).
Share and Cite
MDPI and ACS Style
Xiao, X.; Xu, H.; Huang, J.; Wang, J.; Zhang, J. Stress Relaxation Properties and Microscopic Deformation Structure in Bending of the C7025 and C7035 Alloy. Crystals 2018, 8, 324. https://doi.org/10.3390/cryst8080324
AMA Style
Xiao X, Xu H, Huang J, Wang J, Zhang J. Stress Relaxation Properties and Microscopic Deformation Structure in Bending of the C7025 and C7035 Alloy. Crystals. 2018; 8(8):324. https://doi.org/10.3390/cryst8080324
Chicago/Turabian StyleXiao, Xiangpeng, Hai Xu, Jian Huang, Junfeng Wang, and Jianbo Zhang. 2018. "Stress Relaxation Properties and Microscopic Deformation Structure in Bending of the C7025 and C7035 Alloy" Crystals 8, no. 8: 324. https://doi.org/10.3390/cryst8080324
Note that from the first issue of 2016, this journal uses article numbers instead of page numbers. See further details here.