Article

Reducing the Induction Time Using Ultrasound and High-Shear Mixing in a Continuous Crystallization Process

1
Faculty of Engineering Technology, KU Leuven, Agoralaan building B box 8, 3590 Diepenbeek, Belgium
2
Department of Chemical Engineering, KU Leuven, Celestijnenlaan 200F Box 2424, 3001 Leuven, Belgium
*
Author to whom correspondence should be addressed.
Crystals 2018, 8(8), 326; https://doi.org/10.3390/cryst8080326
Submission received: 30 June 2018 / Revised: 30 July 2018 / Accepted: 31 July 2018 / Published: 14 August 2018
(This article belongs to the Special Issue Advances in Ultrasound Stimulated Crystallization)

Abstract

:
Continuous crystallization in tubular crystallizers is of particular interest to the pharmaceutical industry to accurately control average particle size, particle size distribution, and (polymorphic) shape. However, these types of crystallizers require fast nucleation, and thus, short induction times at the beginning of the flow process, which is challenging for larger and complex organic molecules. High shear and/or the presence of bubbles were identified to influence the nucleation behavior. This work investigates the effects of both high-shear mixing and ultrasound on the anti-solvent crystallization of paracetamol in acetone–water. Both devices generate intense amounts of shear and gas bubbles. Generally, the results show that increasing input power decreases the induction time significantly for both the rotor–stator mixer and ultrasound probe. However, the induction time is almost independent of the supersaturation for the ultrasound probe, while the induction time significantly increases with decreasing supersaturation for the rotor–stator mixer. In contrast, the particle size distribution for the rotor–stator mixer is independent of the supersaturation, while increasing supersaturation decreases the particle size for the ultrasound probe.

1. Introduction

In the pharmaceutical industry, crystallization is one of the most important units of operation, since more than 90% of all active pharmaceutical ingredients (APIs) are crystals of organic molecules. The crystallization process determines the final crystal properties such as particle size distribution (PSD), purity, shape, and polymorphic form, which greatly influence downstream processing and bioavailability [1,2,3,4].
Historically, pharmaceutical processes are mostly done in batch, including crystallization. However, recently there was a significant increase in interest for continuous processing to enhance product quality and reduce costs. Plug flow crystallizers (PFC) and mixed-suspension mixed-product removal (MSMPR) crystallizers are the two main types of continuous crystallizers. Plug flow can be approximated in tubular crystallizers, which have a narrow residence time distribution and a high surface-to-volume ratio allowing precise process control, while costs are minimized due to small process equipment and straightforward scale-up [5,6,7,8,9].
A lot of research was done on tubular crystallizers. However, studies often focused on components with relatively fast nucleation kinetics [2,5,7,10]. This leaves the nucleation of molecules with slow nucleation kinetics as one of the key challenges for tubular crystallizers. APIs typically belong to this last category due to their high molecular complexity, which is still increasing for recently developed drugs as indicated by their increasing molecular weights [11]. Slow nucleation kinetics can cause difficulties in tubular crystallizers, as residence times are limited and the stochastic nature of crystallization can make the induction times in the small volume of tubular crystallizers excessively long. Méndez del Rio et al. studied the tubular cooling crystallization of paracetamol at high supersaturations followed by batch growth [12]. However, no crystals were detected visually or through focused beam reflectance measurements (FBRM) at the end of the tubular crystallizer, meaning nucleation did not occur inside the tubular crystallizer or crystals were not able to grow to detectable sizes. Another challenge is fouling, which eventually leads to clogging. Whilst multiple solutions to fouling are suggested in literature, they often add a lot of complexity and can only limit fouling to a certain degree [10,13,14]. A general rule to minimize fouling is to work at low supersaturations; however, this decreases nucleation rates even more, highlighting the need to enhance nucleation at low supersaturations.
Sonocrystallization was extensively studied in batch and was shown to decrease induction times, increase nucleation rates, and reduce the particle size. Kaur Bhangu et al. studied the batch anti-solvent crystallization of paracetamol in ethanol–water [15]. Ultrasound significantly decreased the induction time, as well as the particle size, and even led to the formation of orthorhombic form II crystals in combination with the usually observed monoclinic form I. The mechanism behind sonocrystallization remains unclear; however, most research suggests that the effects are most likely associated with acoustic cavitation. Acoustic cavitation can be divided into stable cavitation, which entails the formation, growth, and oscillation of microbubbles under the influence of ultrasound waves, and transient cavitation, in which these microbubbles also violently collapse [15,16,17].
Ultrasound was also used to start and control nucleation in tubular crystallizers. In these cases, ultrasound was used at the beginning of the tubular crystallizer. Eder et al. used sonication to generate seeds during the cooling crystallization of acetylsalicylic acid in a tubular crystallizer [18]. Jiang et al. focused on controlling nucleation with ultrasound during the cooling crystallization of L-asparagine monohydrate in a tubular crystallizer, and found that the particle size could be controlled with ultrasonic power, which was explained by the increasing number of nuclei that were generated by ultrasound [19]. Jordens et al. studied seed generation in an ultrasound flow cell with growth in batch for the cooling crystallization of paracetamol. They found that the metastable zone width decreased significantly under sonicated conditions, and that the particle size decreased with increasing initial supersaturation [16]. These studies all indicate the suitability of ultrasound to enhance the nucleation rate in a tubular crystallizer.
High-shear rotor–stator mixers are mixers with a small gap between a high-speed rotor and a stator, and are widely used for chemical processes, such as homogenization, emulsification, grinding, etc. However, they are not often used during crystallization; rather, they are used during post-processing in the form of a wet mill to reduce the particle size. To our best knowledge, only Yang et al. previously used rotor–stator mixers to control nucleation [20,21]. They used an inline rotor–stator mixer to generate seeds for an MSMPR during the continuous cooling crystallization of paracetamol, and found that this could significantly decrease the time to reach steady state. They also found that an increasing tip speed resulted in a decreasing particle size due to increasing primary nucleation [20,21,22].
Both gas bubbles and high shear were shown to enhance nucleation rates, and both effects can originate from ultrasound and high-shear mixing. Ultrasound can generate cavitation bubbles that violently collapse, generating high shear, and high-shear mixers create high shear due to the velocity differential between the rotor and the stator, which can also result in cavitation bubbles [23]. During the batch cooling crystallization of succinic acid, Kleetz et al. found that gas bubbles significantly decreased the induction time. When they looked at the effects of supersaturation, gassing volume, and gassing time, they found that only supersaturation influenced the induction time [24]. Liu et al. concluded that the induction time is inversely related to the shear rate for the cooling crystallization of butyl paraben in Taylor–Couette flow [25]. Lee et al. used a low-frequency ultrasonic horn, a high-frequency ultrasonic plate transducer, and a rotor–stator mixer during the batch anti-solvent crystallization of sodium chloride in water–ethanol. They found that the stable cavitation produced by high-frequency ultrasound could also reduce the particle size, similar to low-frequency ultrasound and high-shear mixing, and that, therefore, the high shear and turbulence generated by bubble implosions of transient cavitation were not necessary to reduce the particle size [26].
This study focuses on inducing nucleation during the continuous anti-solvent crystallization of paracetamol in acetone–water. First attempts to start the anti-solvent crystallization of paracetamol in an acetone–water system using a conventional tubular crystallizer with a diameter of 1.6 mm failed to produce visually detectable crystals. Therefore, an ultrasound probe and a rotor–stator mixer were introduced for continuous seed generation, and were compared to each other using a small continuous flow cell that could fit both. The effects of different supersaturations and different power inputs were evaluated based on induction-time measurements, particle-size measurements, and inline microscopic images.

2. Materials and Methods

2.1. Chemicals

Prior to the experiments, 2 L of a 290 g/L paracetamol solution (acetaminophen, 98%, Alfa Aesar, Ward Hill, MA, USA) was made in a mixture of 60–40 acetone–water by volume %. Acetone was purchased from VWR (99.8% purity), and deionized water (max. 1.7 µS/cm) was used for all experiments.

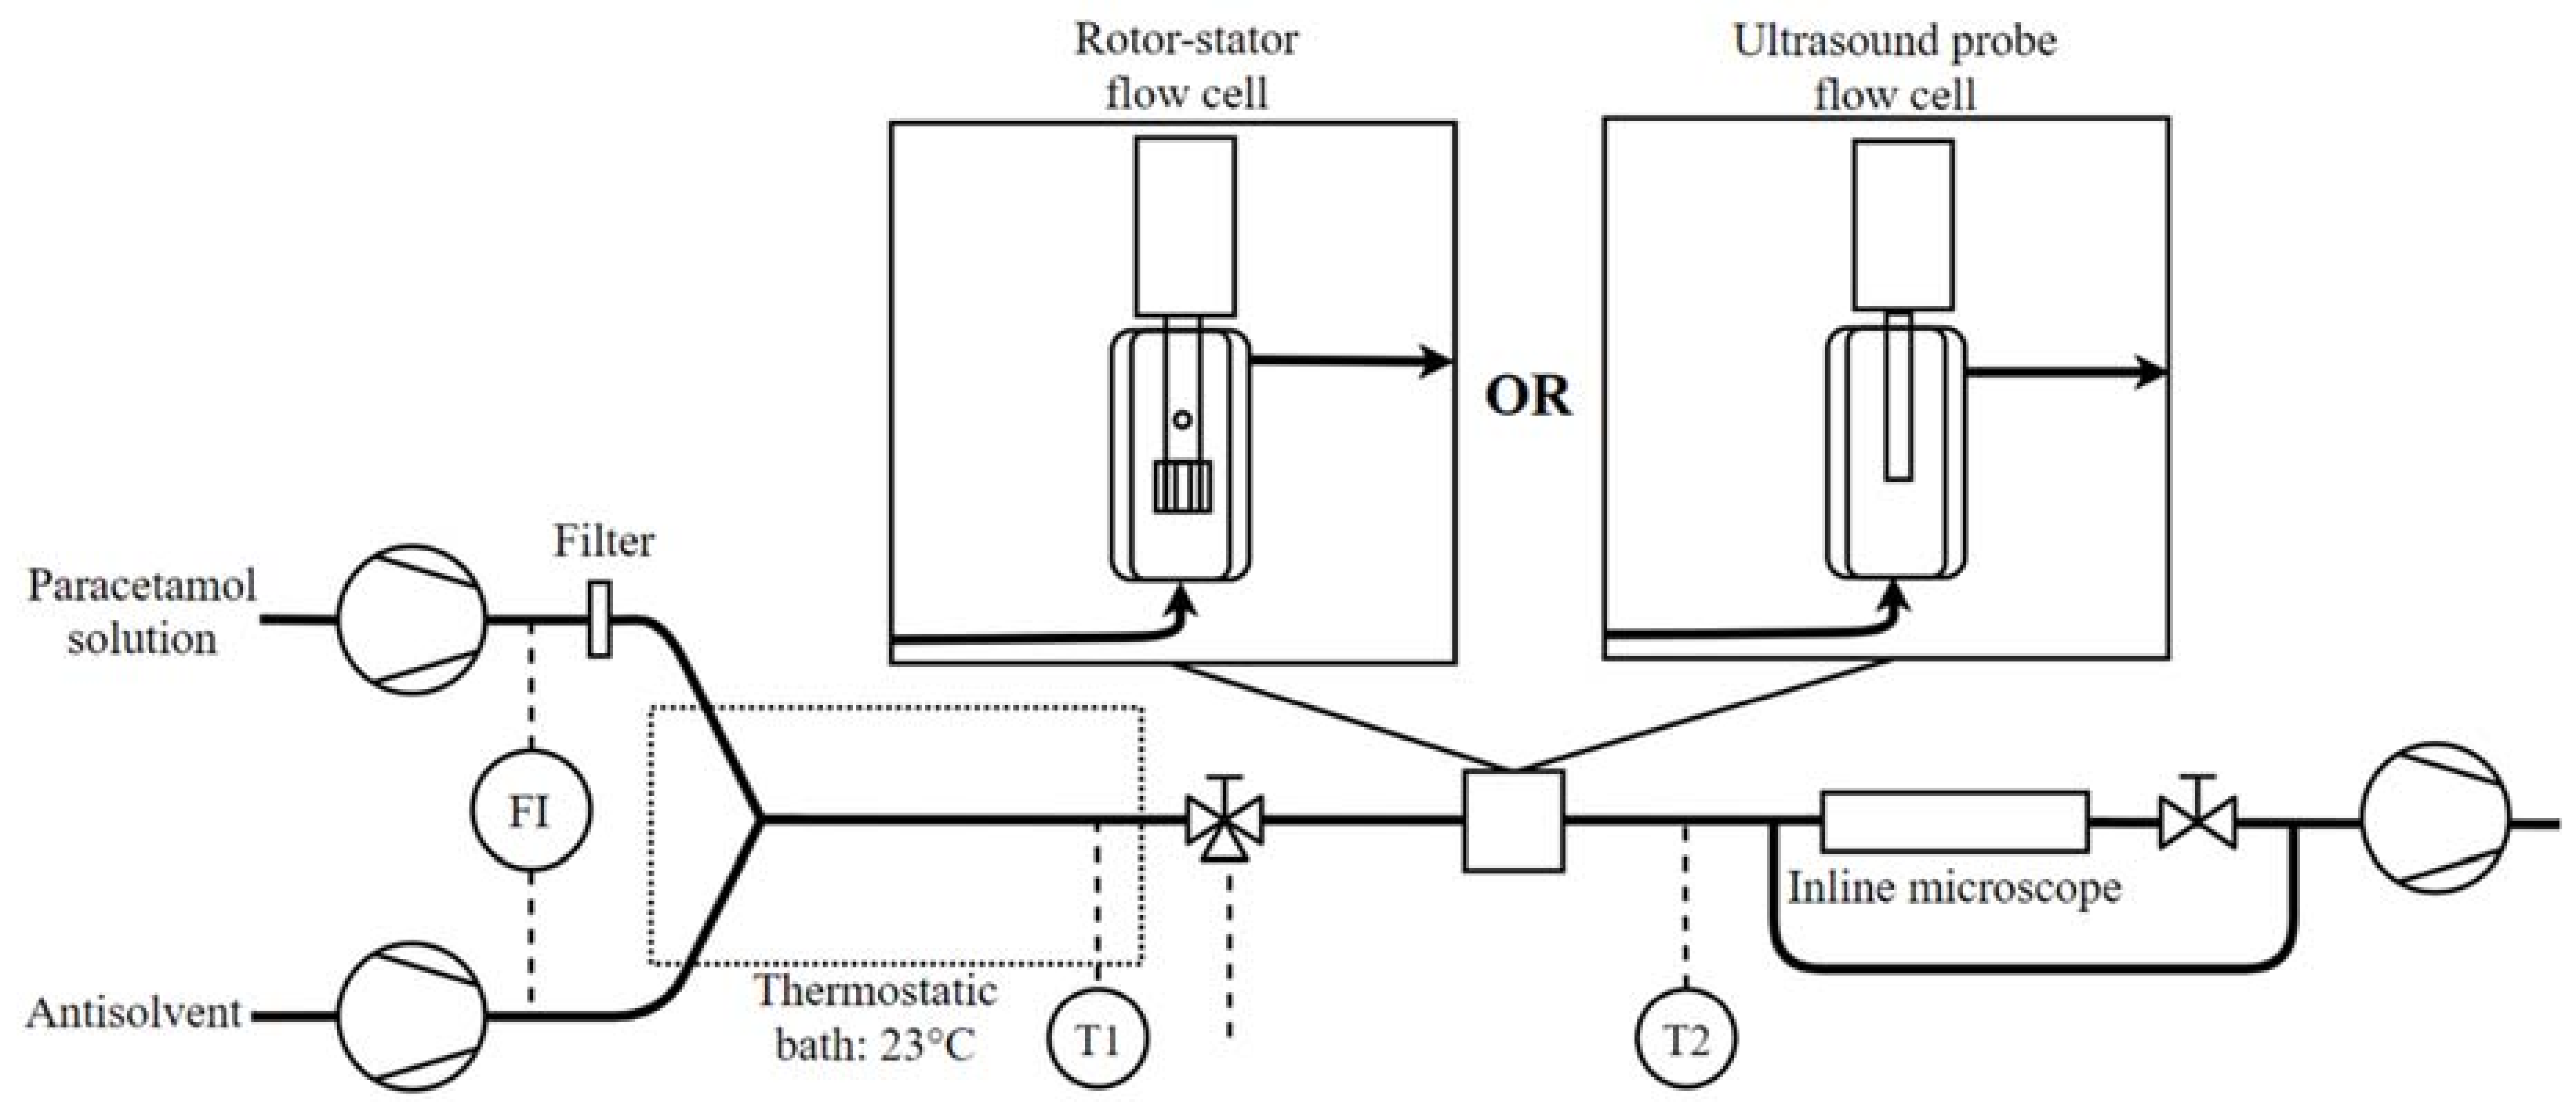
2.2. Experimental Set-Up

Figure 1 shows the experimental set-up which consisted of perfluoroalkoxy (PFA) tubing with an internal diameter of 1.6 mm, a 0.45-µm polytetrafluoroethylene syringe filter (ReZist, Whatman, Maidstone, UK), two digital flow meters (Mini CORI-FLOW, Bronkhorst, Bronkhorst, The Netherlands), a PEEK Y mixer (P-514, IDEX H&S, Oak Harbor, WA, USA), three multi-piston pumps (HPLH 200 PF, LaboCat, Ballrechten-Dottingen, Germany), K-type thermocouples logged with a TC-08 picologger, a thermostatic bath (Julabo heating element, Seelbach, Germany), a polypropylene three-way valve, a stainless-steel needle valve, and a jacketed glass flow cell with an internal volume of 21 mL (15-mm inner diameter, 100-mm height), which fit either a UP50H 30-kHz ultrasound probe (Heilscher Ultrasonics, Teltow, Germany) with an MS2 titanium tip, or an IKA T18 basic Ultra Turrax (IKA, Staufen im Breisgau, Germany) with an S18N10G rotor–stator head. The temperature in the glass flow cell was set at 23 °C with an external thermostatic bath (Ecosilver RE450, Lauda, Koenigshofen, Germany). Crystals were detected in a custom-made glass flow cuvette with an optical path length of 1 mm under a microscope (Zeiss Primo Star, 40× magnification, Oberkochen, Germany), which was fitted with a camera (uEye XS 2, iDS, Obersulm, Germany) that was controlled with the open-source software, µManager.

2.3. Experimental Procedure

Induction-time measurements were performed at different supersaturation ratios and calorimetric powers for both the ultrasound probe and the rotor–stator mixer. All experiments were executed at least three times. Prior to each experiment, the whole set-up was rinsed with acetone, which was then removed by evaporation using compressed air. After start-up of all pumps, the three-way valve was connected to the glass flow cell shortly after stable flows of both anti-solvent stream and paracetamol solution reached the entrance of the Y mixer. The flow cell had a volume of 21 mL, and, due to the low flow rates, behaved like an MSMPR. The ultrasound or rotor–stator mixer was turned on one minute after the flow cell was filled. From this point, the time until the first crystals were visually detected in the flow cuvette under the microscope was registered, which was defined as the induction time for this research.
If no crystals were detected within four minutes, the experiment was stopped, because long induction times are generally undesired for continuous crystallizers, as steady state should be reached as fast as possible. The time for the solution in the flow cell to reach the flow cuvette was approximately four seconds. The flow rate through the flow cuvette was optimized for crystal detection and image acquisition by a stainless-steel needle valve downstream, dividing the stream between the flow cuvette and a parallel stream. During the experiments, the mass flow rates of the paracetamol solution and the anti-solvent were monitored using two Coriolis meters, and used to calculate the exact supersaturation ratio. The pump at the end of the crystallizer was necessary to keep the volume in the flow cell constant, as the flow cell for the rotor–stator mixer and the ultrasound probe was open at the top, and therefore, under atmospheric pressure. The flow rates that were used during the experiments are given in Table 1. The supersaturation ratio (S) was calculated according to the following equation:
  S = C C * ,  
where C is the concentration of paracetamol during the experiments (g/L) and C* is the solubility of paracetamol according to Granberg et al. at 23 °C (g/L) [27].
After visual observation of crystallization, the suspension at the end of the reactor was filtered, and a video sequence of the flow cuvette was acquired using the camera. The crystals were filtered over a 2.7-µm filter (Whatman 542). The filtration times for the crystals obtained at supersaturation ratios of 1.39 and 1.28 were 3 and 5 min, respectively, in order to obtain enough crystals for PSD analysis. At the supersaturation ratio of 1.14, not enough crystals were obtained. After filtration, the crystals were washed with water (23 °C), and particle-size measurements of the crystals were performed using a laser diffractometer (Mastersizer 3000, Malvern Panalytical, Malvern, UK) in hexane. The exact procedure was described elsewhere [16].

2.4. Calorimetric Power Measurements

Calorimetric power measurements were performed for both the ultrasound probe and the rotor–stator mixer based on methods described in the literature [16,28,29]. The devices were inserted into a jacketed batch reactor with 200 mL of water. The batch reactor was stirred with a magnetic stirrer bar at 700 rpm and a K-type thermocouple logged the temperature. The jacket of the reactor was filled with air, which acted as insulation. The temperature increase over at least 5 min was recorded, and the calorimetric power (Pcal; W) was calculated using Equation (2).
  P c a l = m · c p · d T d t ,  
where m is the mass of the water (200 g) and cp is the heat capacity (4186 J/kg·K). This technique assumes that all the power coming from either the ultrasound probe or the rotor–stator was dissipated as heat in the solution. Table 2 and Table 3 give an overview of the used settings and the measured calorimetric powers. Experiments were done at four different calorimetric powers for both devices, and three corresponding calorimetric powers could be identified between the rotor–stator mixer and the ultrasound probe around 1.4, 2.6, and 4.3 W. For the rotor–stator mixer, the shear rates ( γ ˙ ; s−1) were also calculated according to the following equation:
  γ ˙ = v h ,  
where v is the linear speed for the rotor (m/s) and h is the gap between the rotor and the stator (0.35 mm).

3. Results and Discussion

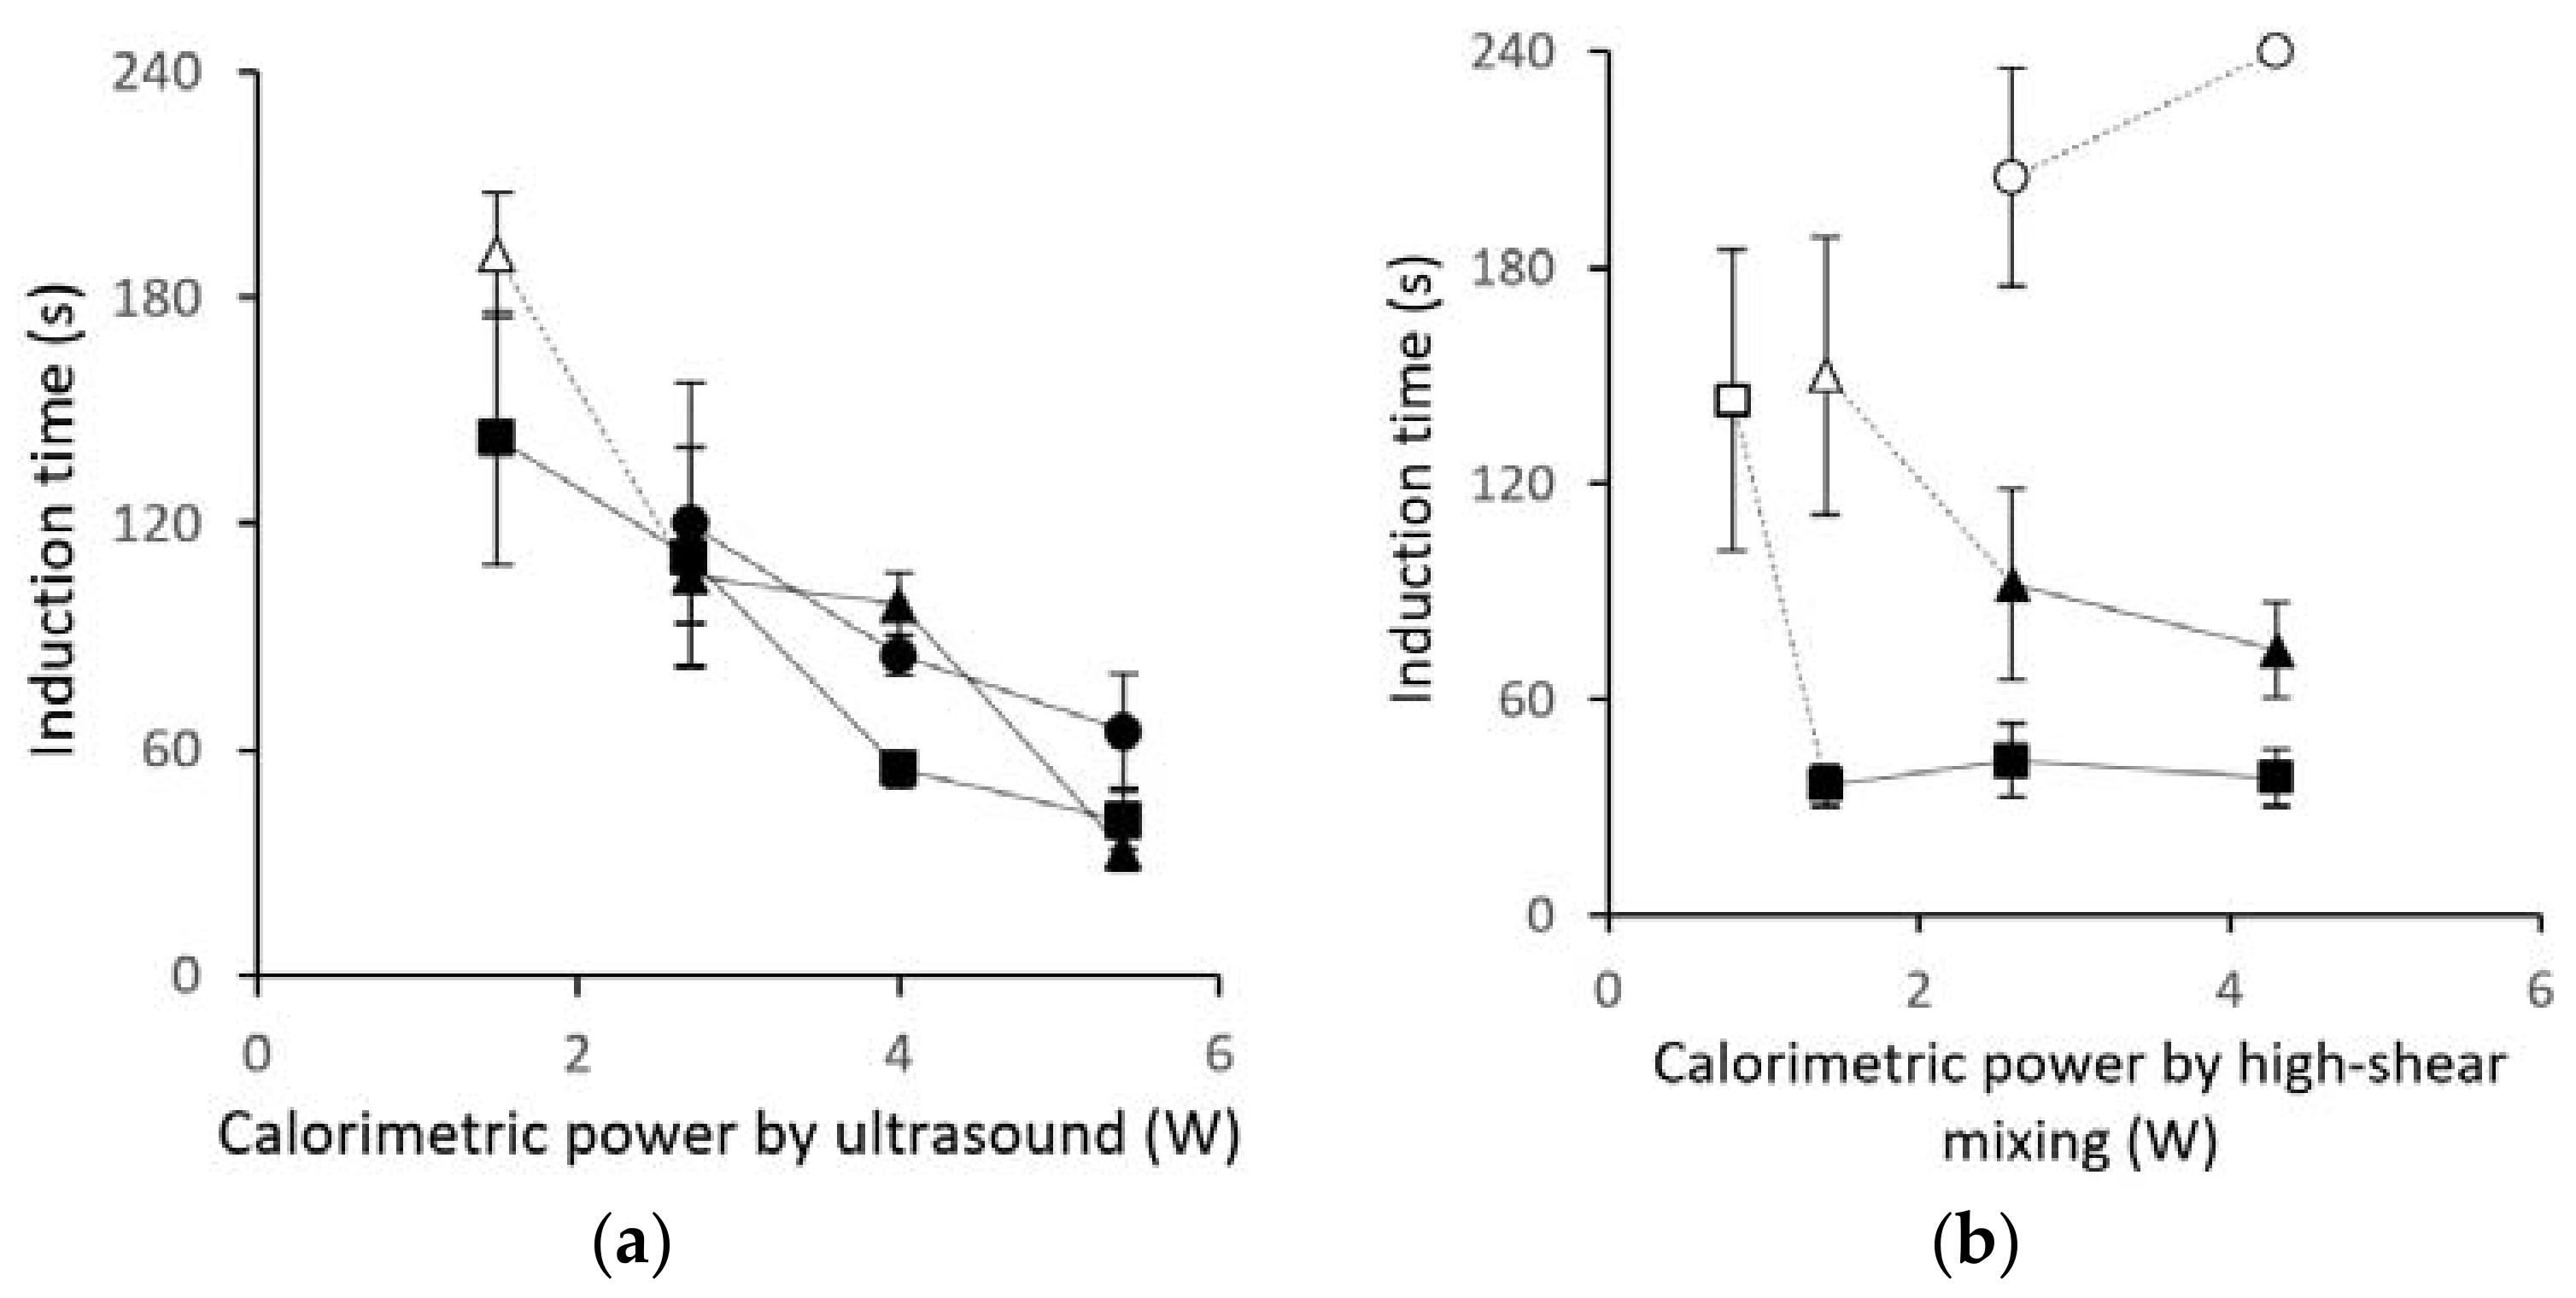
3.1. Induction-Time Measurements

Figure 2 shows the average induction time for the rotor–stator mixer and the ultrasound probe at different supersaturation ratios and different calorimetric powers. The points marked in white indicate those where at least one measurement exceeded the maximum measuring time of 240 s, and the mean and standard deviation were calculated with this value. The deviation on the induction times was high due to the stochastic nature of crystallization [17,25]. Experiments done without ultrasound or high-shear mixing always exceeded the maximum measuring time and are not shown. Note that both the ultrasound probe and the rotor–stator mixer created a large number of gas bubbles in mixtures of acetone–water.
For the ultrasound probe, the induction time decreased significantly with increasing calorimetric power, while the effect of supersaturation was insignificant for the different supersaturation ratios of 1.14, 1.28, and 1.39. However, the induction times for the rotor–stator mixer experienced a substantial effect due to supersaturation, as only one out of six measurements nucleated within 240 s at a supersaturation ratio of 1.14. At a supersaturation ratio of 1.28, the induction time decreased with increasing calorimetric power, and the rotor–stator was able to start nucleation reliably, meaning no measurements exceeded 240 s, at a calorimetric power of 2.6 W. At the highest supersaturation ratio of 1.39, the induction time was independent of the calorimetric power once a threshold value of around 1.5 W was reached. Above this power value, the induction time was approximately 40 s, while the nucleation could not be started reliably at lower values. For both ultrasound and high-shear mixing, the reproducibility of the process increased with decreasing induction time.
The decrease in induction time with increasing ultrasonic power can be explained by increasing cavitation activity. It is generally accepted that acoustic cavitation, or the effects associated with acoustic cavitation, such as bubble formation and shear due to bubble implosions and oscillations, cause enhanced nucleation during sonocrystallization. This effect of ultrasonic power input on the induction time was also observed in other research up until a limiting threshold value [17,23,30]. Interestingly, supersaturation did not seem to have a big effect on the induction time for the ultrasound probe. While it is generally reported that increasing supersaturation does decrease induction times during sonocrystallization, it is also reported that this effect becomes smaller and smaller with increasing ultrasonic power, explaining the results above. The ability of ultrasound to start the nucleation process, even at low supersaturations if enough energy is added, is particularly interesting for tubular crystallizers, as this creates a lot of flexibility during process development [23,30,31,32].
For the rotor–stator mixer, however, supersaturation did have a large effect on the induction time, in contrast to the ultrasound probe. During these experiments the rotor–stator mixer induced both gas bubbles and high shear, making it difficult to conclude the exact mechanism behind nucleation enhancement [24,25]. The induction time for the rotor–stator mixer also decreased with increasing calorimetric power until a threshold was reached; thereafter, the induction time did not reduce significantly anymore. These results are also in agreement with observations for both gassing and shear-induced nucleation, likely attributing the reduced induction times to one of these effects [3,24,25].
When comparing ultrasound to high-shear mixing, it was observed that both techniques could significantly reduce the induction time, while also increasing the reproducibility by decreasing the spread of the induction time. This was already mentioned in the literature for ultrasound, and shear- and gas-induced nucleation, but was not yet shown for rotor–stator mixers [3,24,25,33]. However, the mechanism via which both techniques induce nucleation during these experiments is hypothesized to be different, as there was a completely different influence of supersaturation. Ultrasound seems more suitable to start nucleation at lower supersaturations (1.14), which would make ultrasound more flexible toward process design. The mechanism in both techniques remains unclear though.

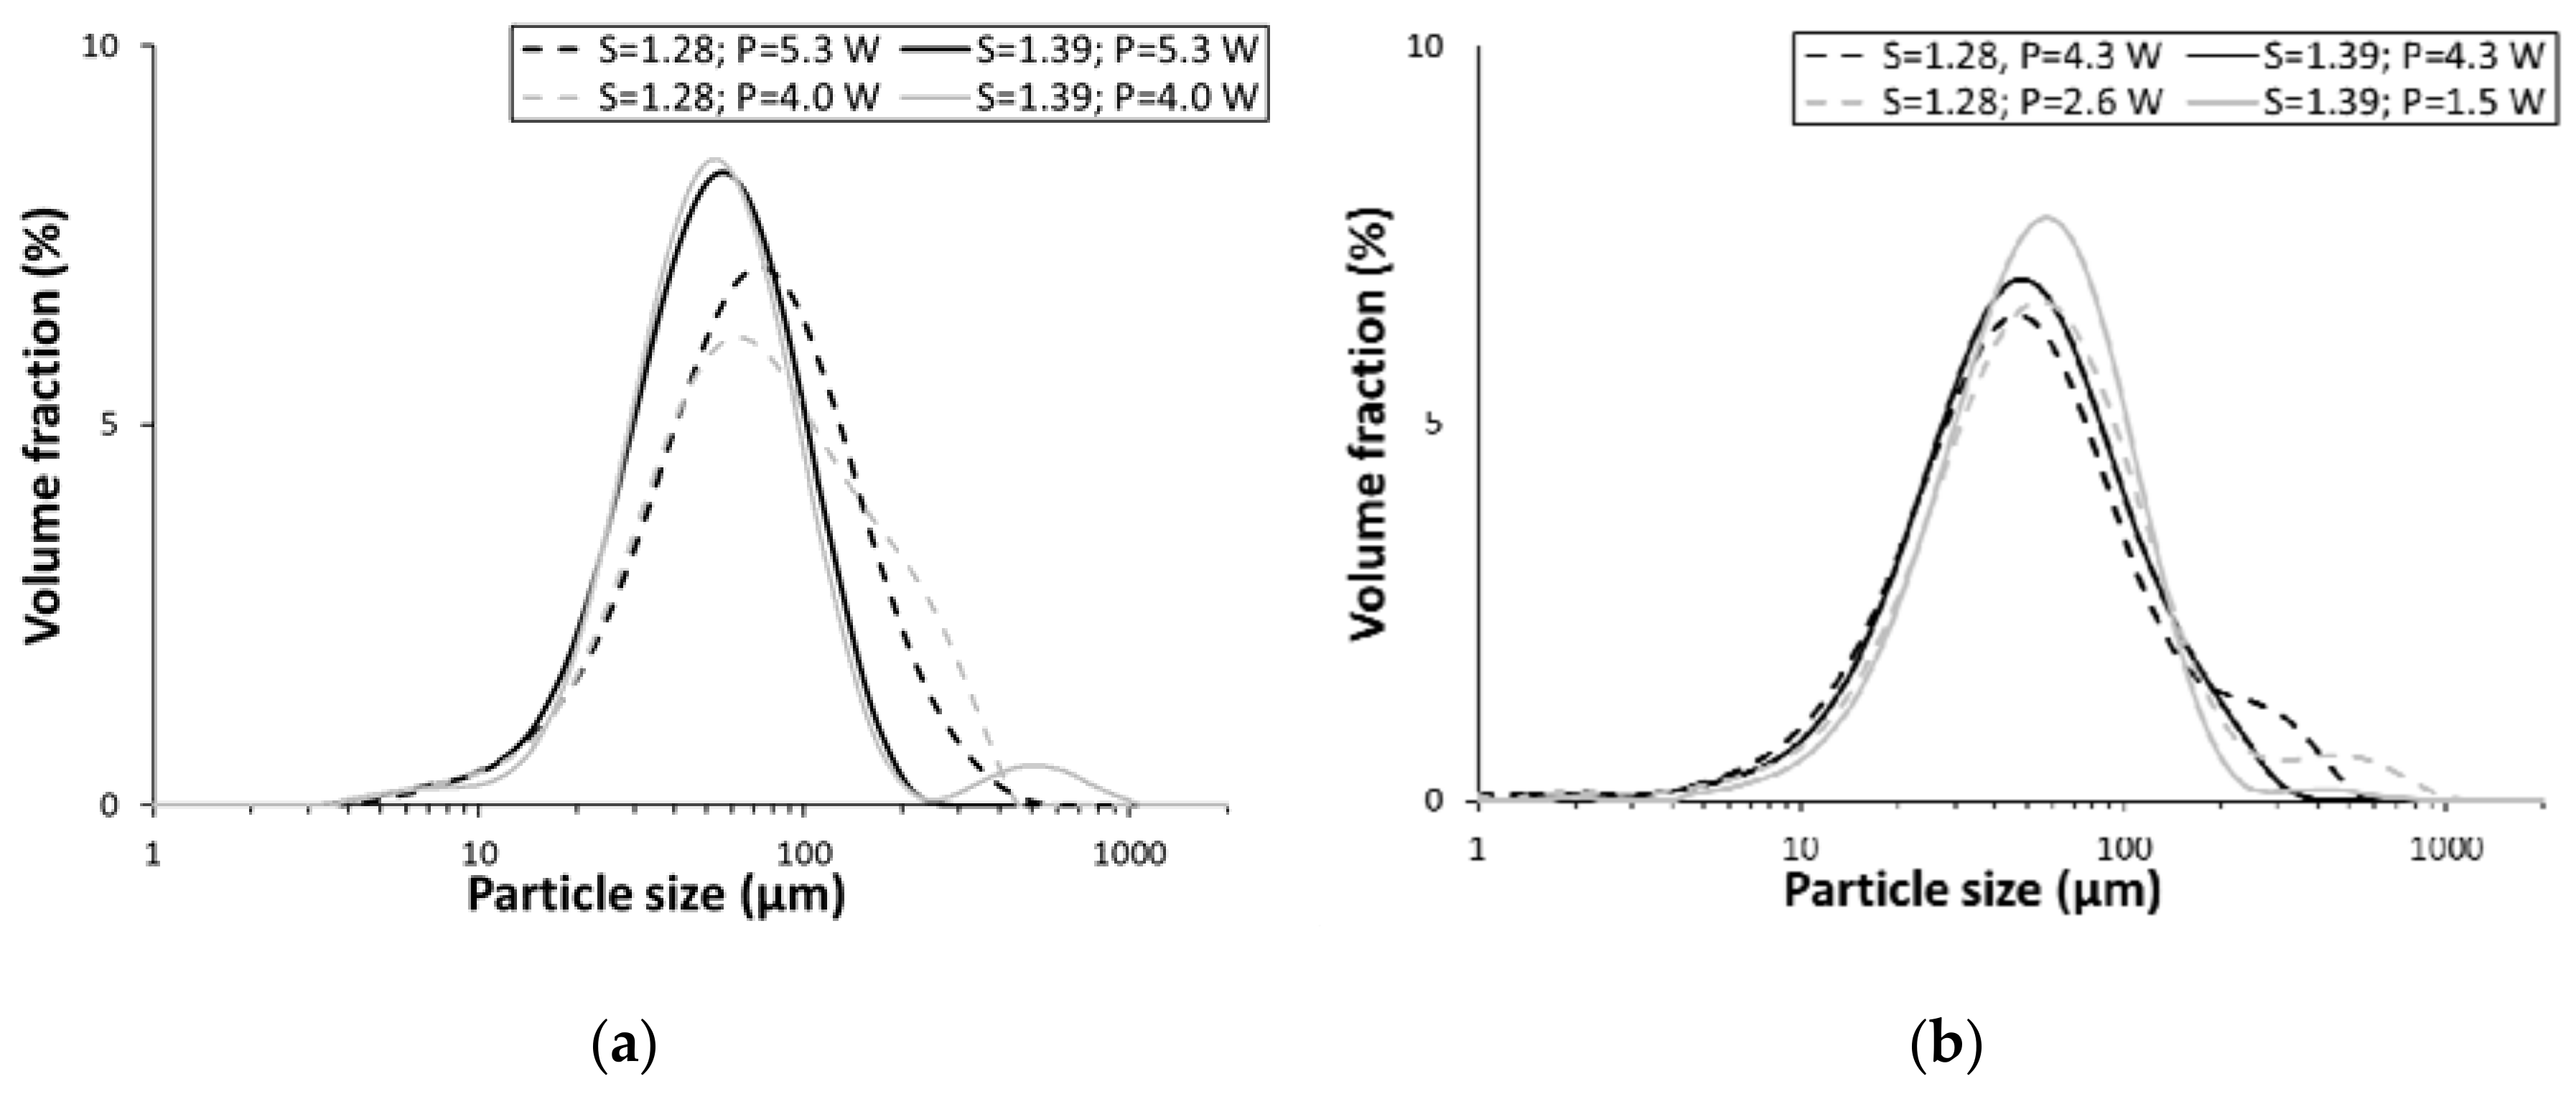
3.2. Particle-Size Measurements

Figure 3 shows the particle size distributions for both the ultrasound probe and the rotor–stator mixer that were obtained after filtration. The small secondary peaks noticed in the PSD at higher particle sizes were probably due to agglomeration during filtration, and were considered insignificant. Both devices were able to generate seeds with a mean particle size between 50 µm and 75 µm. For the ultrasound probe, supersaturation had a clear effect on the PSD, as an increase in supersaturation ratio from 1.28 to 1.39 reduced the mean particle size to 56 ± 2 µm from both 75 ± 2 µm and 73 ± 2 µm for 5.3 W and 4.0 W, respectively. For the rotor–stator mixer there was no significant effect of supersaturation on the PSD; however, an increase in calorimetric power slightly reduced the particle size, as the mean particle size decreased from 57 ± 2 µm to 50 ± 2 µm with an increase in power from 2.6 W to 4.0 W at a supersaturation ratio of 1.28, and decreased from 56 ± 2 µm to 51 ± 2 µm with an increase in power from 1.5 W to 4.0 W at a supersaturation ratio of 1.39.
The decrease in particle size with increasing supersaturation for the ultrasound probe was likely due to increasing number of nuclei that were formed under high supersaturation, as this generally leads to higher nucleation rates. This phenomenon was previously reported in the literature, and is not limited to ultrasound-induced nucleation, as it is also reported in the absence of ultrasound [5,12,16,34]. However, with increasing nucleation rates, decreased induction times would be expected, which was not the case when considering the induction-time experiments [24]. This might indicate that the larger number of particles was due to secondary nucleation, which is an effect that can also be enhanced by ultrasound [35].
The particle size distributions of the experiments done with the rotor–stator mixer were not influenced by supersaturation. This was in contrast with the experiments done under sonication, and is generally expected during crystallization, as higher supersaturation ratios generally mean increased nucleation rates, which was also observed for the induction times of the rotor–stator. A possible explanation could be that the crystals were milled in the rotor–stator to a constant size, and that this effect dominated in the flow cell. To the authors’ best knowledge, there are no reports in the literature about the effect of supersaturation on the PSD during nucleation using rotor–stator mixers.
The rotor–stator mixers slightly reduced the particle size with increasing input power, which was expected, as increased power results in higher shear rates which could result in increased nucleation rates and/or increased milling effects. This was also described by Yang et al., showing a decrease in chord length with increasing rotational speed of the rotor–stator mixer from 6000 to 10,000 rpm [21].

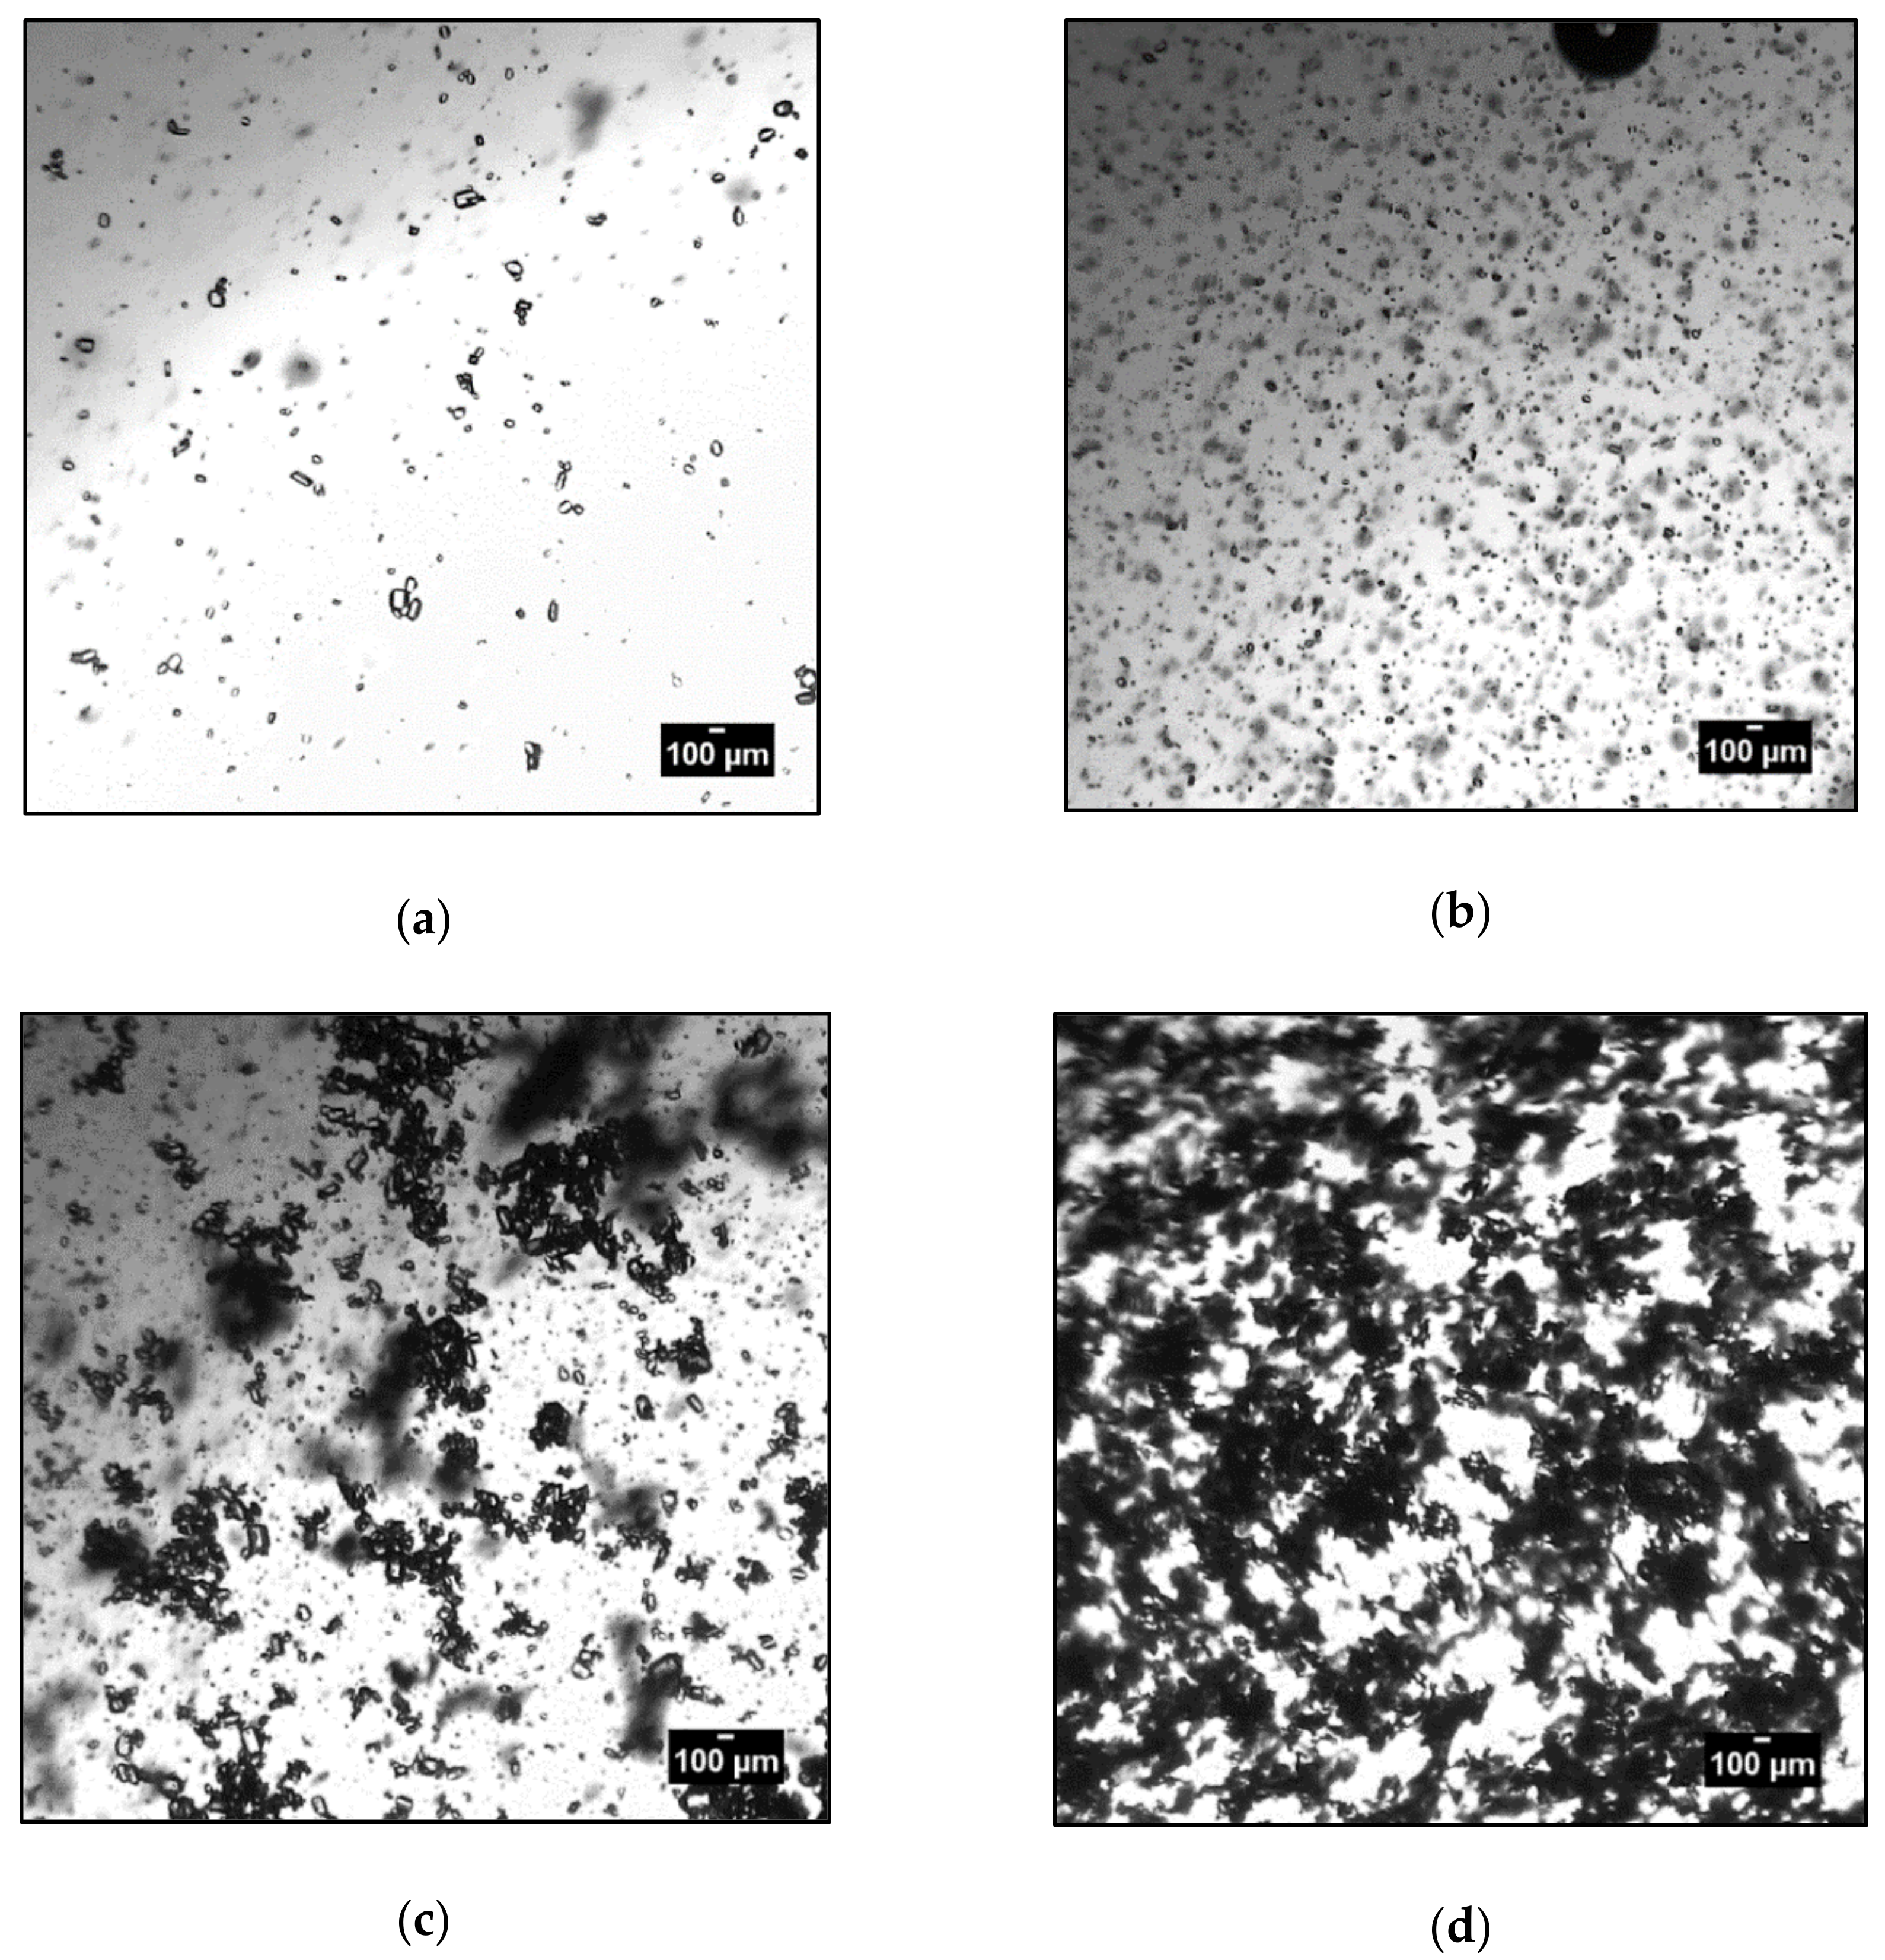
3.3. Agglomeration and Aggregation

Figure 4 shows the images that were taken of the crystals during the process using an inline microscope. At the start of the process, both ultrasound and high-shear mixing generated a lot of single crystals; however, over time, agglomeration and/or aggregation occurred. This effect happened much faster for the rotor–stator mixer, as a change from single crystals to fully agglomerated crystals occurred for the rotor–stator mixer in only 20 s at the highest supersaturation ratio of 1.39. This was in contrast to the ultrasound probe, where this took over 80 s, and even then, the degree of agglomeration was less, as observed in Figure 4. It was also observed that this happened faster at higher supersaturation ratios for both the ultrasound probe and the rotor–stator mixer. The change from single crystals to agglomerated crystals was due to the transient behavior of the flow cell. The flow cell acted as an MSMPR, and therefore, required a lot of time to reach steady state.
The agglomeration process went much faster for the rotor–stator mixer than for the ultrasound probe. This was likely the result of the higher degree of macromixing inside the flow cell for the rotor–stator mixer. The higher degree of macromixing increases the collision frequency which, in turn, increases agglomeration and aggregation. When the ultrasound probe was inserted, the macromixing was mainly due to acoustic streaming, which was significantly less than the macromixing that resulted from the high rotational speeds obtained using the rotor–stator mixer [36].

4. Conclusions

Complex organic molecules can have high induction times, which can be problematic for tubular crystallizers. In this study, both an ultrasound probe and a rotor–stator mixer were successfully used to initiate nucleation in a continuous crystallizer. Both devices showed a decrease in induction time with increasing power input. However, the induction time for the ultrasound probe showed almost no influence of supersaturation, while the induction time for the rotor–stator mixer strongly increased with decreasing supersaturation ratio. This enabled the ultrasound to start nucleation even at low supersaturation levels of 1.14. The rotor–stator mixer, in contrast, enabled nucleation only at supersaturation levels of 1.28 under the studied conditions. This might indicate that both devices enhanced nucleation according to a different mechanism, even though they both generated high amounts of shear and gas bubbles. Both devices generated particles with a mean size between 50 µm and 75 µm. In contrast to the induction-time measurements, supersaturation had a big effect on the particle size distribution for the ultrasound probe, while the PSD for the rotor–stator was unaffected by supersaturation.

Author Contributions

Conceptualization, A.V., S.S., J.J., and L.B. Data curation, A.V. Funding acquisition, L.T. Investigation, A.V. and S.S. Supervision, J.J., T.V.G., L.T., and L.B. Visualization, A.V. Writing–original draft, A.V. Writing–review and editing, S.S., J.J., T.V.G., L.T., and L.B.

Funding

This research was funded by the Agency for Innovation and Entrepreneurship (VLAIO) and Catalisti grant number PIF HBC.2017.0442.

Acknowledgments

The authors thank B. Gielen and R. Geertman for the discussion and for assessing the industrial relevance of the work.

Conflicts of Interest

The authors declare no conflict of interest.

References

  1. Wang, T.; Lu, H.; Wang, J.; Xiao, Y.; Zhou, Y.; Bao, Y.; Hao, H. Recent progress of continuous crystallization. J. Ind. Eng. Chem. 2017, 54, 14–29. [Google Scholar] [CrossRef]
  2. Zhao, Y.; Kamaraju, V.K.; Hou, G.; Power, G.; Donnellan, P.; Glennon, B. Kinetic identification and experimental validation of continuous plug flow crystallisation. Chem. Eng. Sci. 2015, 133, 106–115. [Google Scholar] [CrossRef]
  3. Forsyth, C.; Mulheran, P.A.; Forsyth, C.; Haw, M.D.; Burns, I.S.; Sefcik, J. Influence of controlled fluid shear on nucleation rates in glycine aqueous solutions. Cryst. Growth Des. 2015, 15, 94–102. [Google Scholar] [CrossRef]
  4. Zhang, D.; Xu, S.; Du, S.; Wang, J.; Gong, J. Progress of pharmaceutical continuous crystallization. Engineering 2017, 3, 354–364. [Google Scholar] [CrossRef]
  5. Alvarez, A.J.; Myerson, A.S. Continuous plug flow crystallization of pharmaceutical compounds. Cryst. Growth Des. 2010, 10, 2219–2228. [Google Scholar] [CrossRef]
  6. Ferguson, S.; Morris, G.; Hao, H.; Barrett, M.; Glennon, B. Characterization of the anti-solvent batch, plug flow and MSMPR crystallization of benzoic acid. Chem. Eng. Sci. 2013, 104, 44–54. [Google Scholar] [CrossRef]
  7. Ferguson, S.; Morris, G.; Hao, H.; Barrett, M.; Glennon, B. In-situ monitoring and characterization of plug flow crystallizers. Chem. Eng. Sci. 2012, 77, 105–111. [Google Scholar] [CrossRef]
  8. Wang, J.; Li, F.; Lakerveld, R. Process intensification for pharmaceutical crystallization. Chem. Eng. Process. Process Intensif. 2018, 127, 111–126. [Google Scholar] [CrossRef]
  9. Schaber, S.D.; Gerogiorgis, D.I.; Ramachandran, R.; Evans, J.M.B.; Barton, P.I.; Trout, B.L. Economic analysis of integrated continuous and batch pharmaceutical manufacturing: A case study. Ind. Eng. Chem. Res. 2011, 50, 10083–10092. [Google Scholar] [CrossRef]
  10. Jiang, M.; Zhu, Z.; Jimenez, E.; Papageorgiou, C.D.; Waetzig, J.; Hardy, A.; Langston, M.; Braatz, R.D. Continuous-flow tubular crystallization in slugs spontaneously induced by hydrodynamics. Cryst. Growth Des. 2014, 14, 851–860. [Google Scholar] [CrossRef]
  11. Davey, R.J.; Back, K.R.; Sullivan, R.A. Crystal nucleation from solutions—Transition states, rate determining steps and complexity. Faraday Discuss. 2015, 179, 9–26. [Google Scholar] [CrossRef] [PubMed]
  12. Méndez Del Río, J.R.; Rousseau, R.W. Batch and tubular-batch crystallization of paracetamol: Crystal size distribution and polymorph formation. Cryst. Growth Des. 2006, 6, 1407–1414. [Google Scholar] [CrossRef]
  13. Furuta, M.; Mukai, K.; Cork, D.; Mae, K. Continuous crystallization using a sonicated tubular system for controlling particle size in an API manufacturing process. Chem. Eng. Process. Process Intensif. 2016, 102, 210–218. [Google Scholar] [CrossRef]
  14. Wang, H.; Mustaffar, A.; Phan, A.N.; Zivkovic, V.; Reay, D.; Law, R.; Boodhoo, K. A review of process intensification applied to solids handling. Chem. Eng. Process. Process Intensif. 2017, 118, 78–107. [Google Scholar] [CrossRef]
  15. Kaur Bhangu, S.; Ashokkumar, M.; Lee, J. Ultrasound assisted crystallization of paracetamol: Crystal size distribution and polymorph control. Cryst. Growth Des. 2016, 16, 1934–1941. [Google Scholar] [CrossRef]
  16. Jordens, J.; Canini, E.; Gielen, B.; Van Gerven, T.; Braeken, L. Ultrasound assisted particle size control by continuous seed generation and batch growth. Crystals 2017, 7, 195. [Google Scholar] [CrossRef]
  17. Gielen, B.; Claes, T.; Janssens, J.; Jordens, J.; Thomassen, L.C.J.; Gerven, T.V.; Braeken, L. Particle size control during ultrasonic cooling crystallization of paracetamol. Chem. Eng. Technol. 2017, 40, 1300–1308. [Google Scholar] [CrossRef]
  18. Eder, R.J.P.; Schrank, S.; Besenhard, M.O.; Roblegg, E.; Gruber-Woelfler, H.; Khinast, J.G. Continuous sonocrystallization of acetylsalicylic acid (ASA): Control of crystal size. Cryst. Growth Des. 2012, 12, 4733–4738. [Google Scholar] [CrossRef]
  19. Jiang, M.; Papageorgiou, C.D.; Waetzig, J.; Hardy, A.; Langston, M.; Braatz, R.D. Indirect ultrasonication in continuous slug-flow crystallization. Cryst. Growth Des. 2015, 15, 2486–2492. [Google Scholar] [CrossRef]
  20. Yang, Y.; Song, L.; Zhang, Y.; Nagy, Z.K. Application of wet milling-based automated direct nucleation control in continuous cooling crystallization processes. Ind. Eng. Chem. Res. 2016, 55, 4987–4996. [Google Scholar] [CrossRef]
  21. Yang, Y.; Song, L.; Gao, T.; Nagy, Z.K. Integrated upstream and downstream application of wet milling with continuous mixed suspension mixed product removal crystallization. Cryst. Growth Des. 2015, 15, 5879–5885. [Google Scholar] [CrossRef]
  22. Rogers, T.L.; Cooke, M.; Hall, S.; Pacek, A.W.; Kowalski, A.J. Rotor-stator mixers. Chem. Eng. Trans. 2011, 24, 1411–1416. [Google Scholar] [CrossRef]
  23. Sander, J.R.G.; Zeiger, B.W.; Suslick, K.S. Sonocrystallization and sonofragmentation. Ultrason. Sonochem. 2014, 21, 1908–1915. [Google Scholar] [CrossRef] [PubMed]
  24. Kleetz, T.; Funke, F.; Sunderhaus, A.; Schembecker, G.; Wohlgemuth, K. Influence of gassing crystallization parameters on induction time and crystal size distribution. Cryst. Growth Des. 2016, 16, 6797–6803. [Google Scholar] [CrossRef]
  25. Liu, J.; Rasmuson, Å.C. Influence of agitation and fluid shear on primary nucleation in solution. Cryst. Growth Des. 2013, 13, 4385–4394. [Google Scholar] [CrossRef]
  26. Lee, J.; Ashokkumar, M.; Kentish, S.E. Influence of mixing and ultrasound frequency on antisolvent crystallisation of sodium chloride. Ultrason. Sonochem. 2014, 21, 60–68. [Google Scholar] [CrossRef] [PubMed]
  27. Granberg, R.A.; Rasmuson, A.C. Solubility of paracetamol in binary and ternary mixtures of water + acetone + toluene. J. Chem. Eng. Data 2000, 45, 478–483. [Google Scholar] [CrossRef]
  28. Jordens, J.; Gielen, B.; Braeken, L.; Gerven, T.V. Determination of the effect of the ultrasonic frequency on the cooling crystallization of paracetamol. Chem. Eng. Process. Process Intensif. 2014, 84, 38–44. [Google Scholar] [CrossRef] [Green Version]
  29. Kowalski, A.J.; Cooke, M.; Hall, S. Expression for turbulent power draw of an in-line Silverson high shear mixer. Chem. Eng. Sci. 2011, 66, 241–249. [Google Scholar] [CrossRef]
  30. Zeng, G.; Li, H.; Luo, S.; Wang, X.; Chen, J. Effects of ultrasonic radiation on induction period and nucleation kinetics of sodium sulfate. Korean J. Chem. Eng. 2014, 31, 807–811. [Google Scholar] [CrossRef]
  31. Kurotani, M.; Miyasaka, E.; Ebihara, S.; Hirasawa, I. Effect of ultrasonic irradiation on the behavior of primary nucleation of amino acids in supersaturated solutions. J. Cryst. Growth 2009, 311, 2714–2721. [Google Scholar] [CrossRef]
  32. Luque de Castro, M.D.; Priego-Capote, F. Ultrasound-assisted crystallization (sonocrystallization). Ultrason. Sonochem. 2007, 14, 717–724. [Google Scholar] [CrossRef] [PubMed]
  33. Gielen, B.; Kusters, P.; Jordens, J.; Thomassen, L.C.J.; Gerven, T.V.; Braeken, L. Energy efficient crystallization of paracetamol using pulsed ultrasound. Chem. Eng. Process. Process Intensif. 2017, 114, 55–66. [Google Scholar] [CrossRef]
  34. Dennehy, R.D. Particle Engineering Using Power Ultrasound. Org. Process Res. Dev. 2003, 7, 1002–1006. [Google Scholar] [CrossRef]
  35. Chow, R.; Blindt, R.; Chivers, R.; Povey, M. The sonocrystallisation of ice in sucrose solutions: Primary and secondary nucleation. Ultrasonics 2003, 41, 595–604. [Google Scholar] [CrossRef] [PubMed]
  36. Gielen, B.; Jordens, J.; Thomassen, L.; Braeken, L.; Gerven, T.V. Agglomeration control during ultrasonic crystallization of an active pharmaceutical ingredient. Crystals 2017, 7, 40. [Google Scholar] [CrossRef]
Figure 1. Schematic of the experimental set-up. Mixing inside the flow cell was either done with a 30-kHz ultrasound probe or a rotor–stator mixer.
Crystals 08 00326 g001
Figure 2. Induction time as a function of the applied calorimetric power at different supersaturation ratios (S = 1.14, ●; S = 1.28, ▲; S = 1.39, ■) for (a) the ultrasound probe, and (b) the rotor–stator mixer. Points marked in white (○, □, △) had at least one measurement that exceeded the maximum measuring time of 240 s.
Crystals 08 00326 g002
Figure 3. Particle size distributions after filtration obtained for (a) the ultrasound probe, and (b) the rotor–stator mixer.
Crystals 08 00326 g003
Figure 4. Images taken during the crystallization process in the flow cuvette under a microscope: (a) crystals shortly after the first crystals were detected (ultrasound probe; S = 1.39 and P = 4.0 W); (b) crystals shortly after the first crystals were detected (rotor–stator mixer; S = 1.39 and P = 2.6 W); (c) crystals 80 s after image (a) (ultrasound probe; S = 1.39 and P = 4.0 W); (d) crystals 20 s after image (b) (rotor–stator mixer, S = 1.39 and P = 2.6 W).
Crystals 08 00326 g004
Table 1. Overview of the used flow rates and calculated supersaturation ratios.
Flow Rate of Paracetamol Solution (g/min)Flow Rate of Anti-Solvent (g/min)Supersaturation Ratio (S)
17.16.01.14
14.98.41.28
13.510.01.39
Table 2. Overview of the settings used for the ultrasound probe and the calorimetric powers.
Amplitude (%)Power Input (W)Calorimetric Power (W)
40201.5
60302.7
80404.0
100505.4
Table 3. Overview of the settings used for the rotor–stator mixer, the calorimetric powers, and the calculated shear rates.
Rotational Speed (rpm)Shear Rate (s−1)Calorimetric Power (W)
11,00012,0000.8
15,50017,0001.4
20,00022,0002.6
24,00027,0004.3

