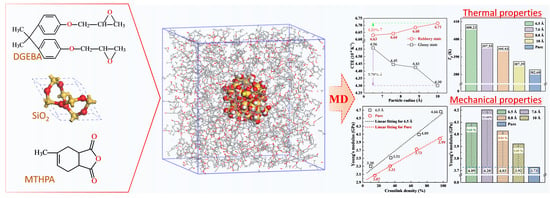
Micro-Structure and Thermomechanical Properties of Crosslinked Epoxy Composite Modified by Nano-SiO2: A Molecular Dynamics Simulation

 , ,
, ,
Abstract
:
1. Introduction
2. Model Construction and Simulation Details
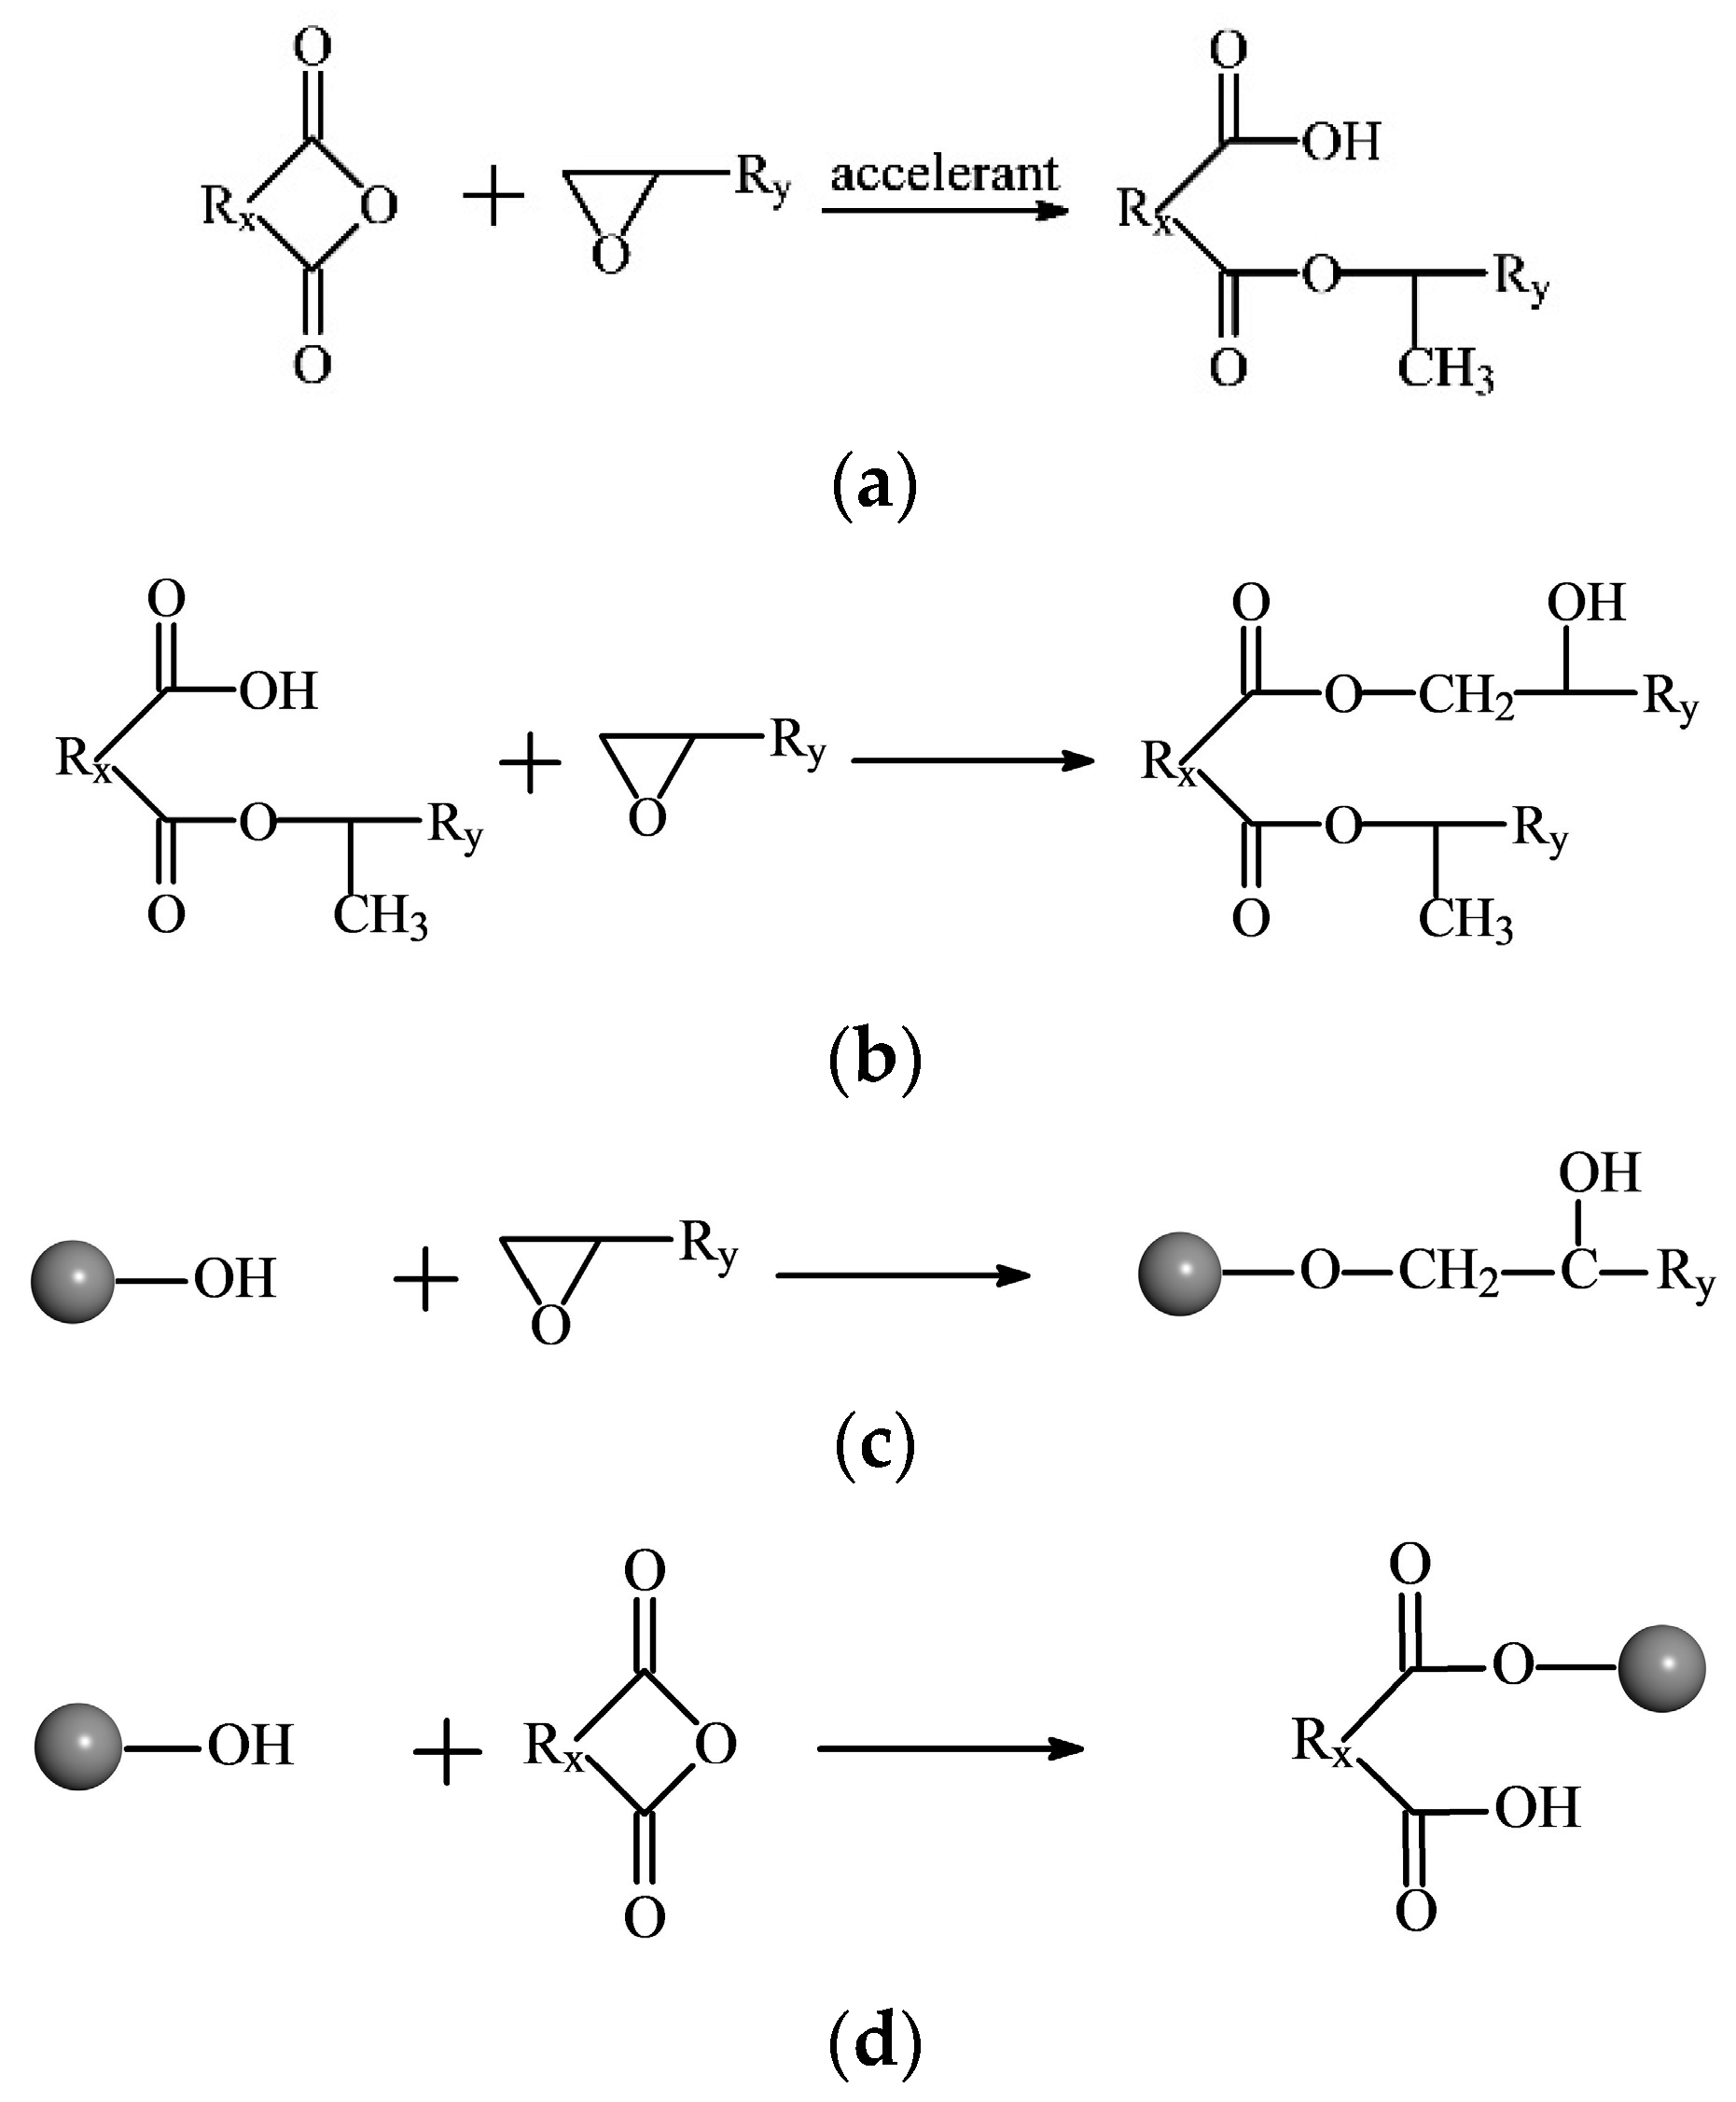
2.1. Reaction Mechanism of EP and Curing Agent
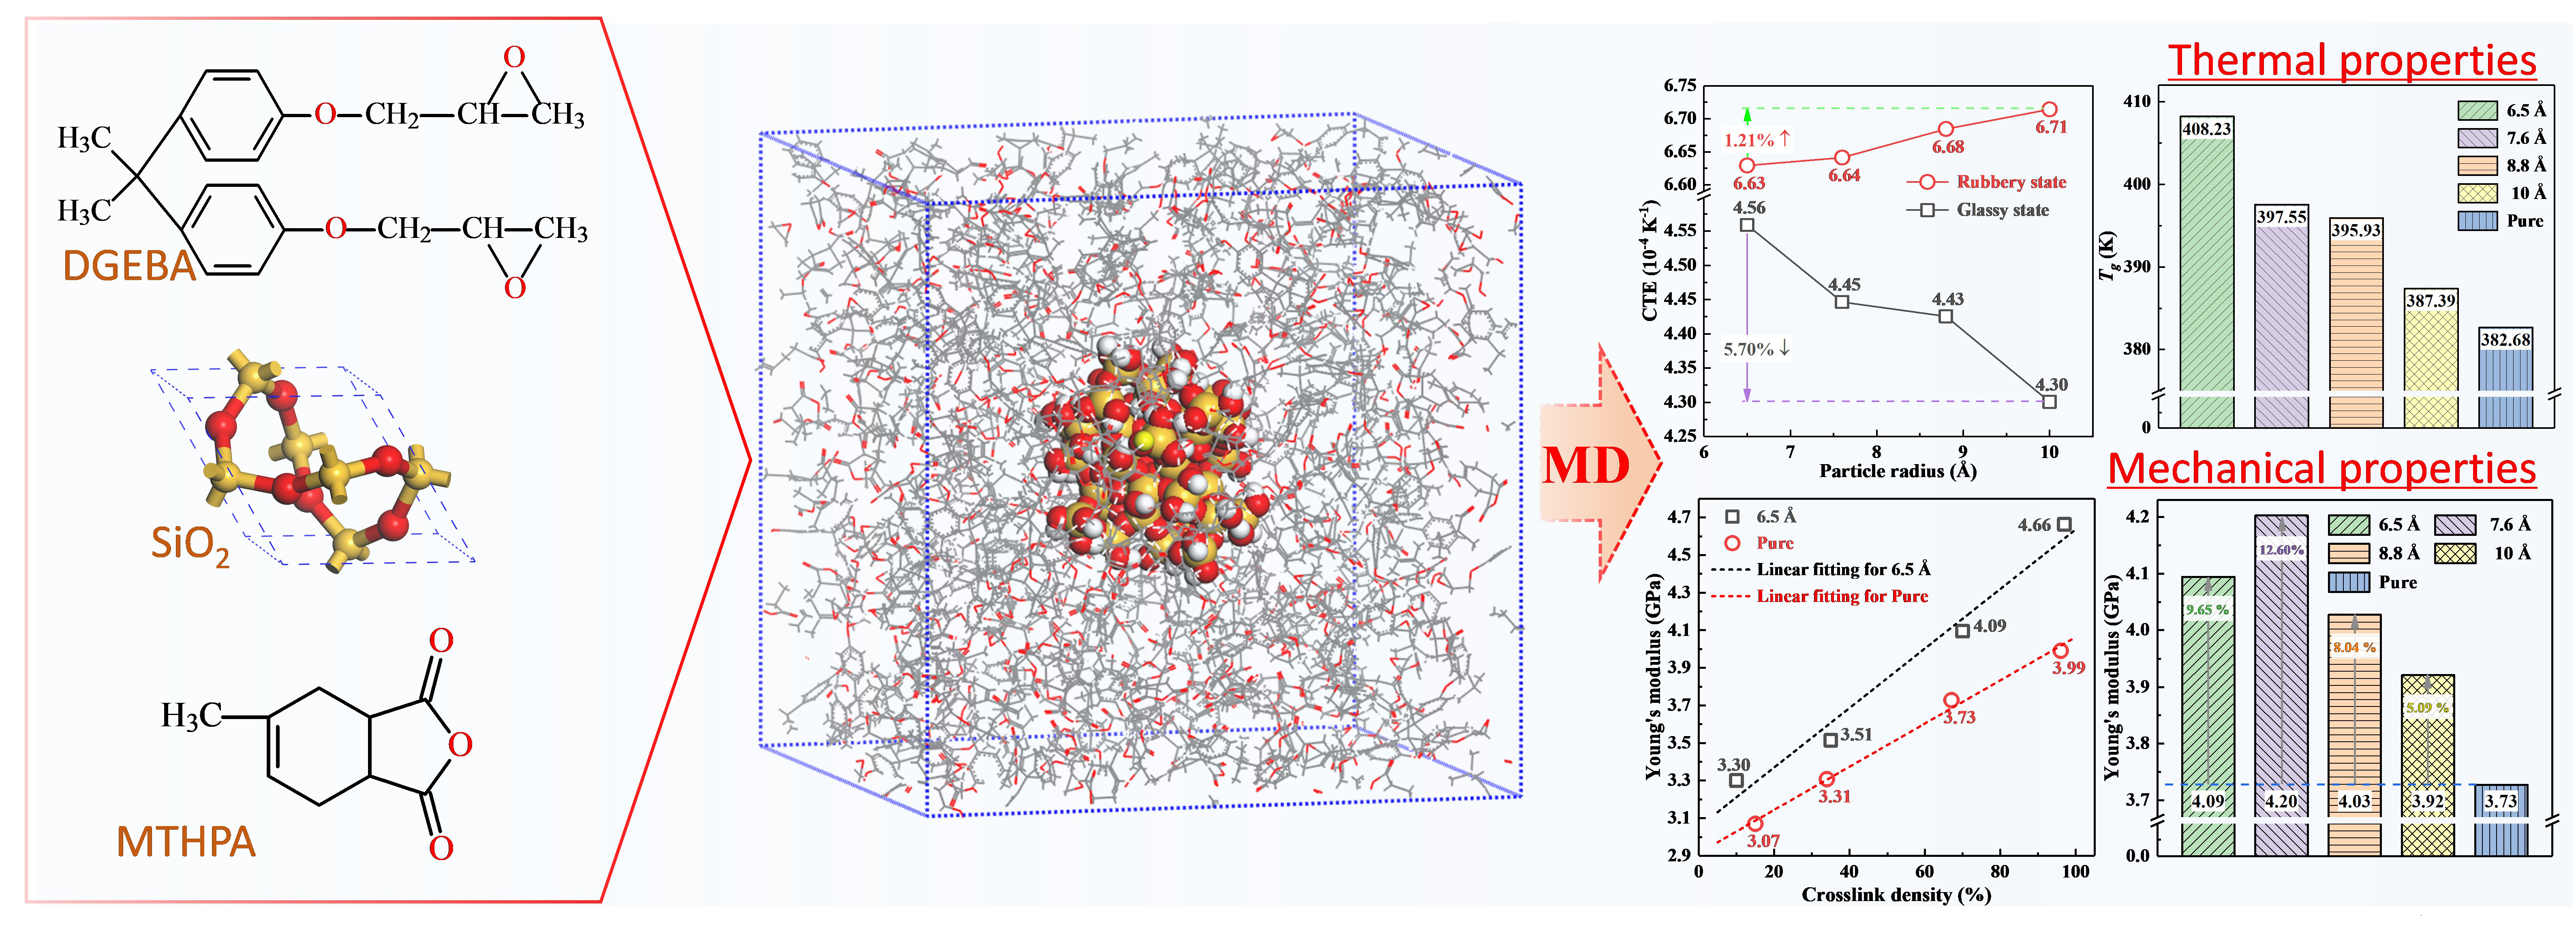
2.2. Construction of Crosslinked EP/SiO2 Composite Models
- (1)
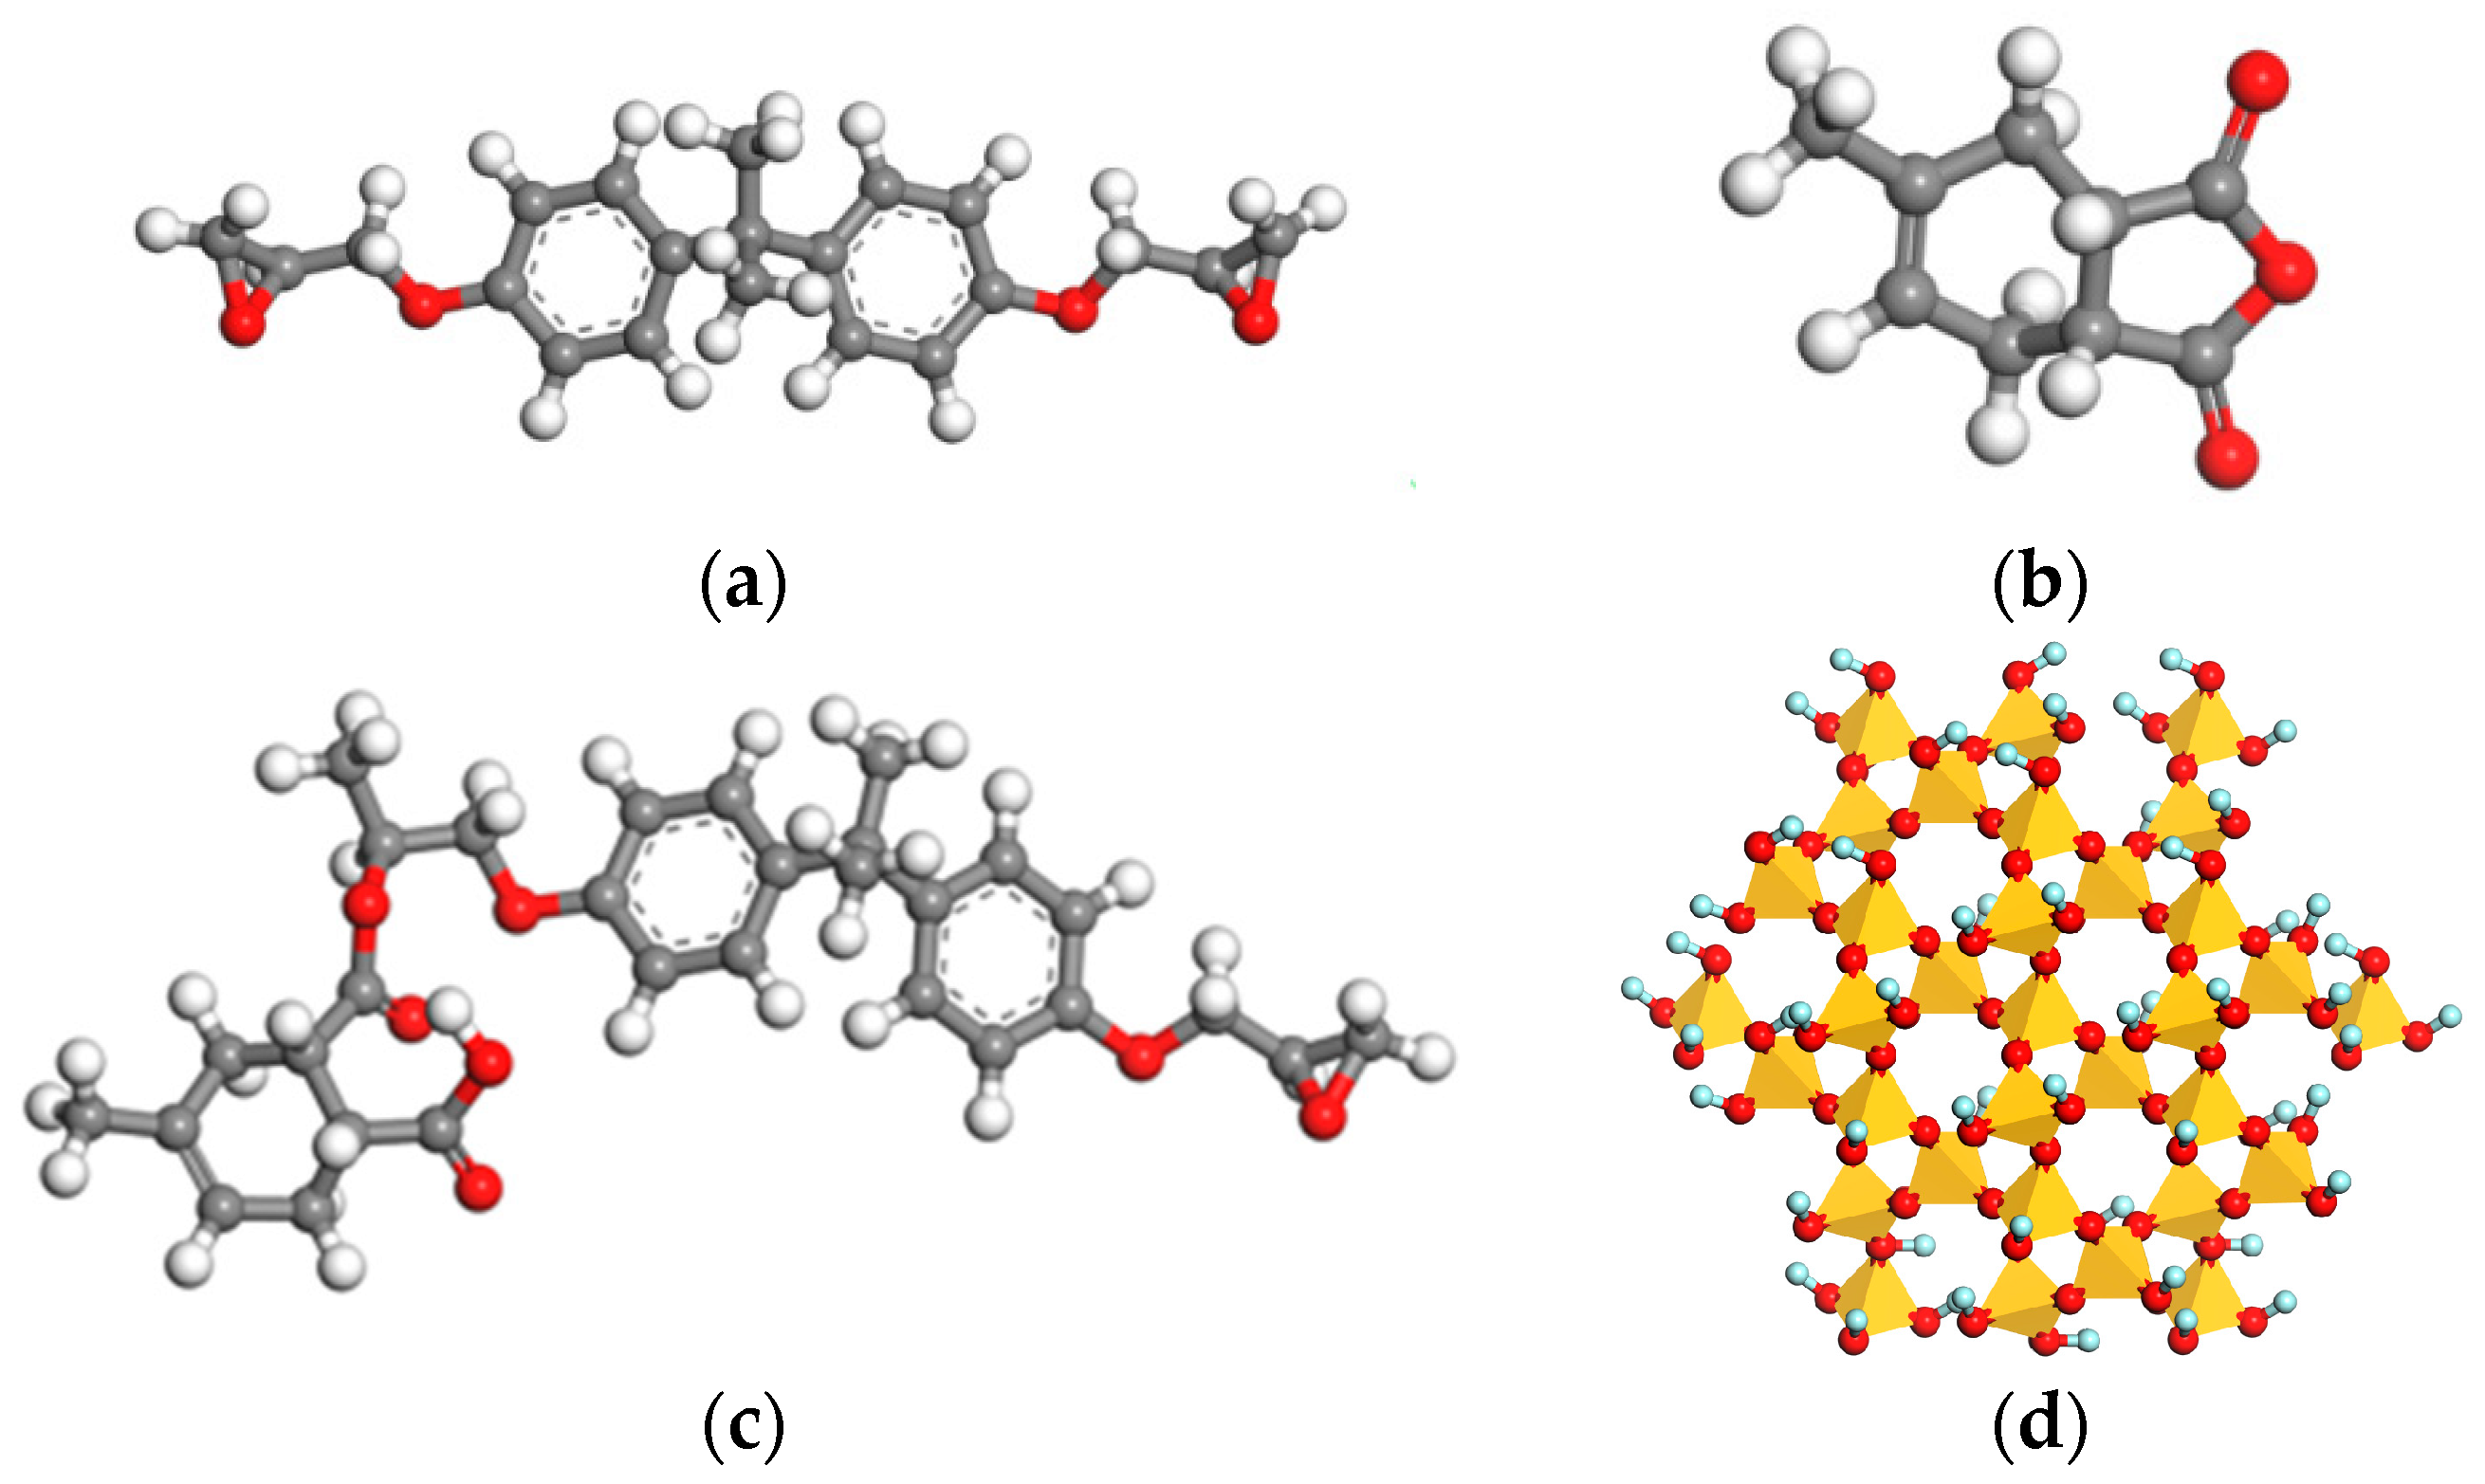
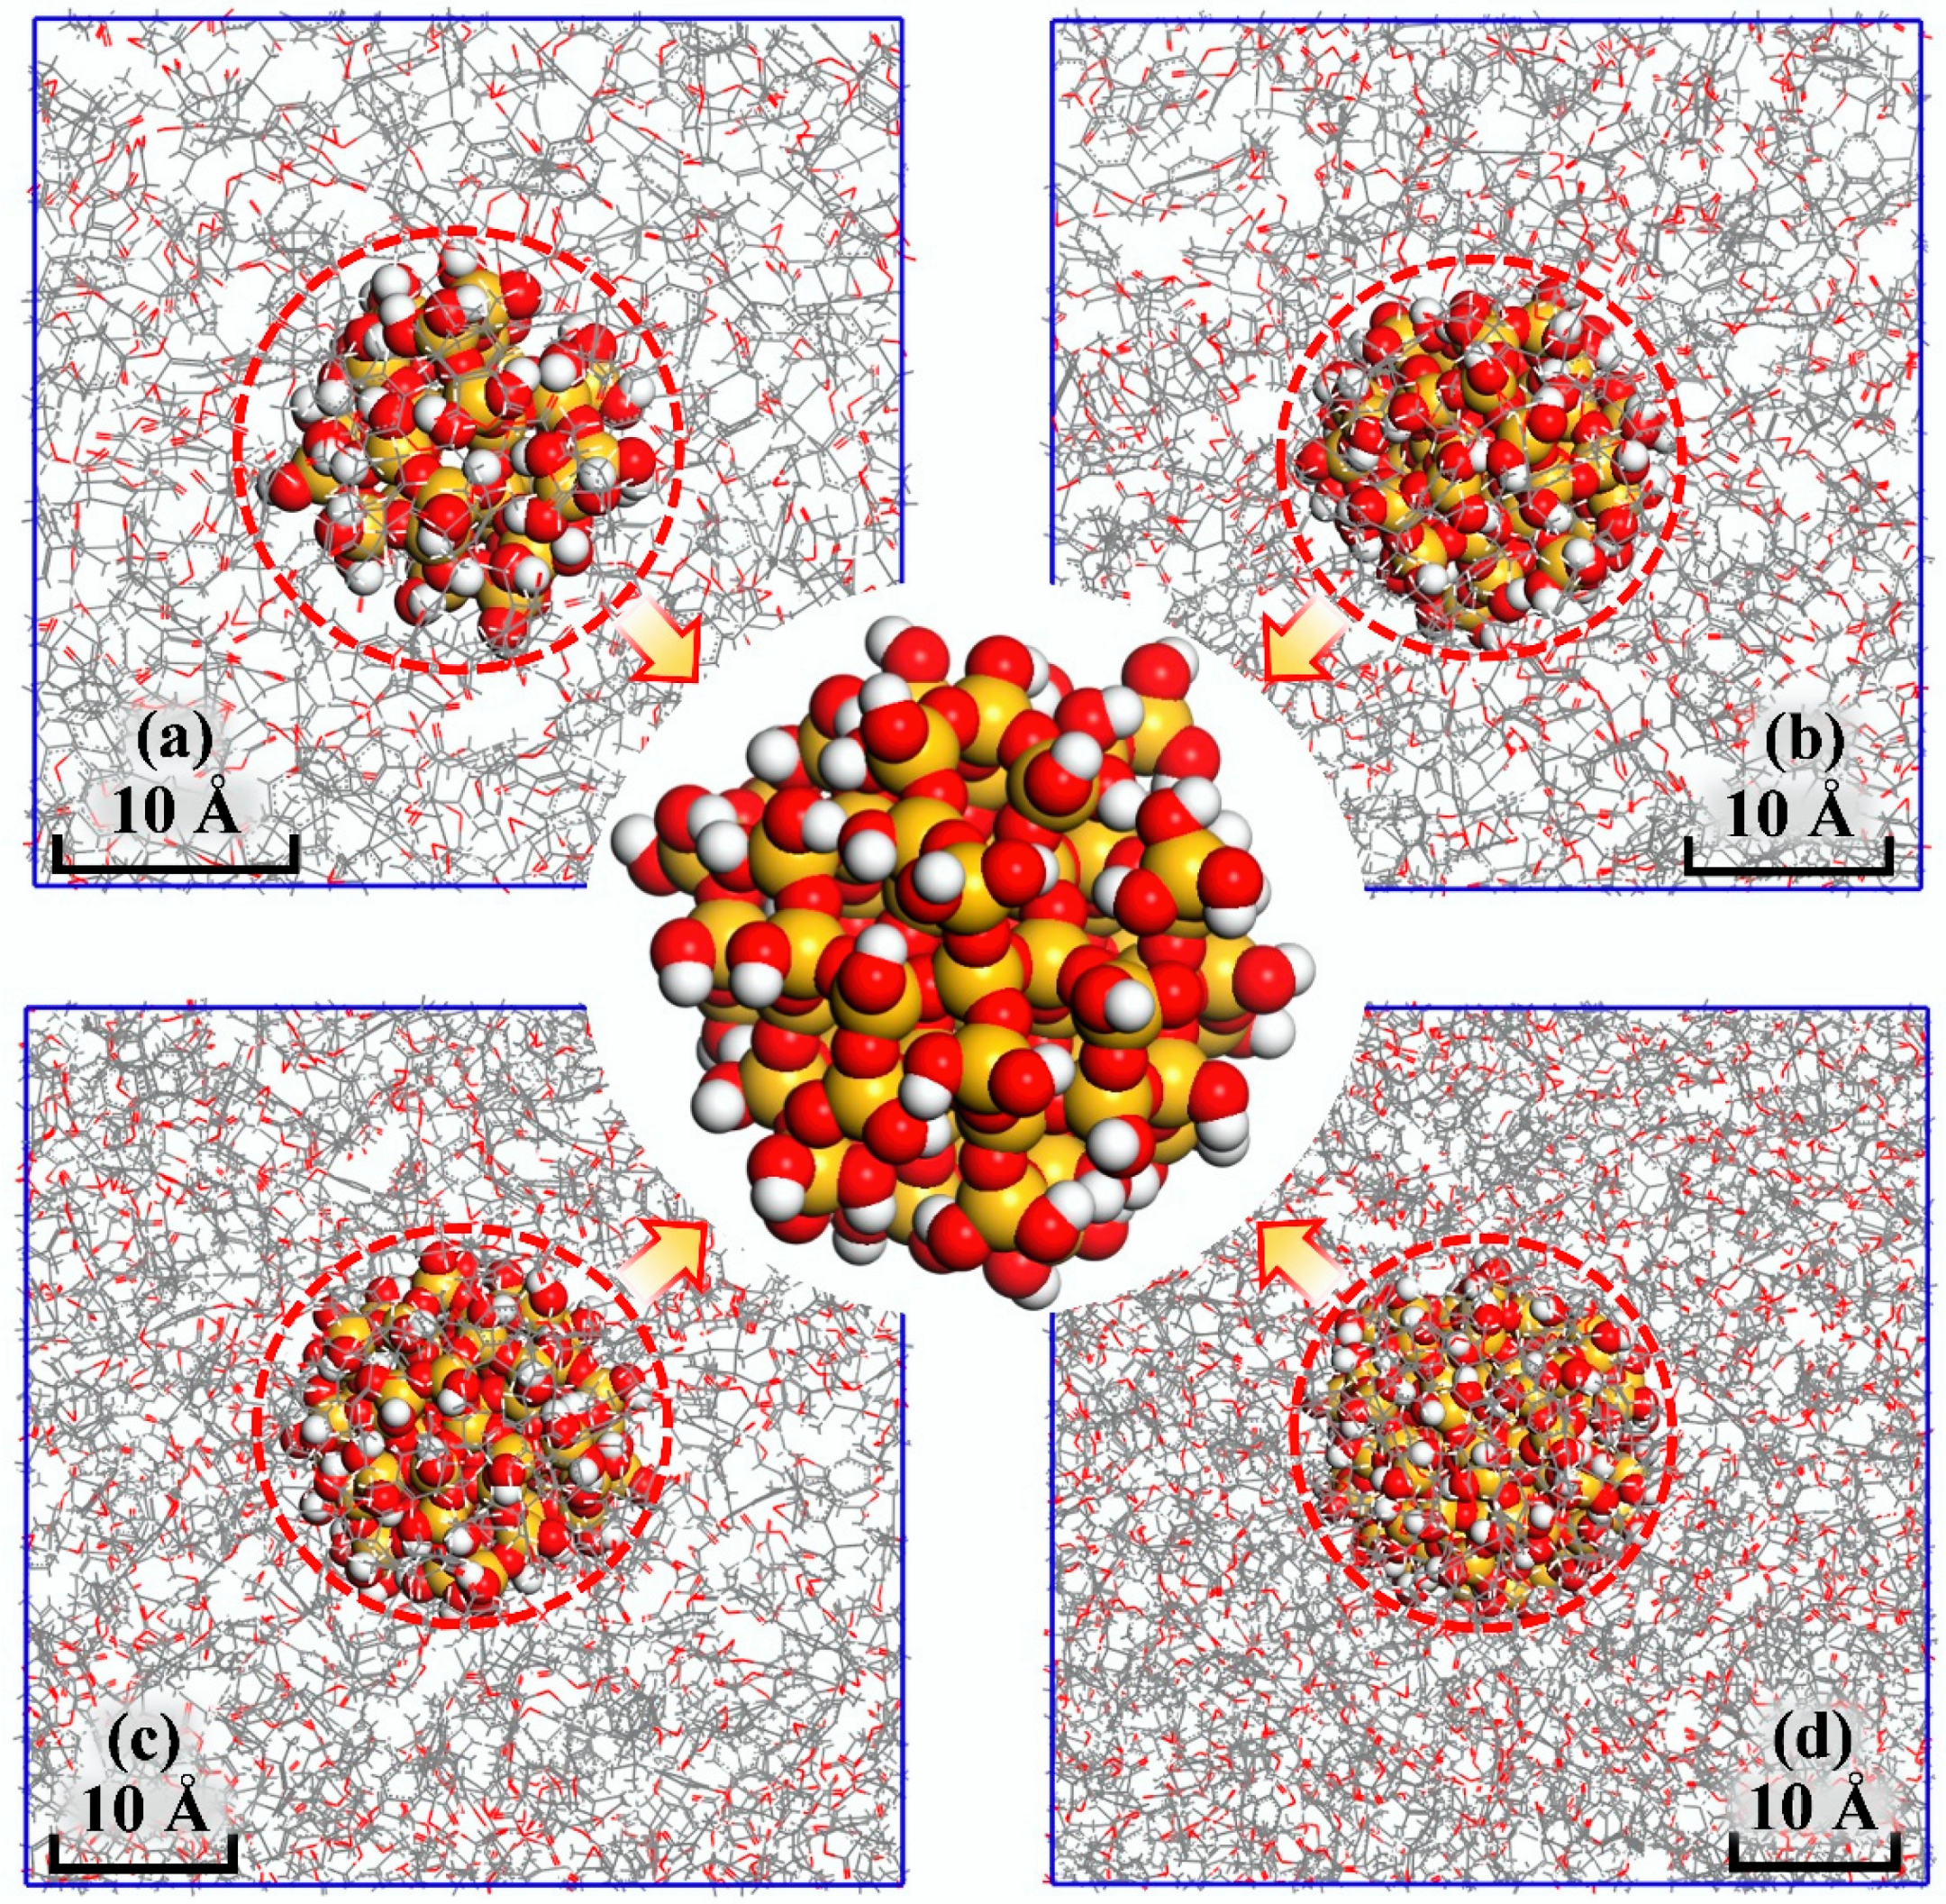
- Construct the molecular models of DGEBA, MTHPA, DGEBA-MTHPA and spherical nano-SiO2 with radiuses of 6.5 Å, 7.6 Å, 8.8 Å and 10 Å, respectively. Simulate the oxidation reaction of SiO2, so that the surface of fillers has massive hydroxyl groups [31,32]. Subsequently, optimize the structure of the above models and obtain the molecular models as shown in Figure 2.
- (2)
- Considering that the actual molar ratio of DGEBA and MTHPA is about 1:2 [20,33], we constructed amorphous molecular models of pure EP and EP nanocomposite with different filler sizes. Using periodic boundary conditions, the initial temperature of the model was set to be 580 K to facilitate the subsequent annealing process. Each nanocomposite model was filled with a nano-SiO2 particle to simulate the well-dispersed situation. The mass fraction of SiO2 in each system was maintained at 6.5% by adjusting the amount of the ingredients according to Table 1. Further, 10 amorphous molecular models with an initial crosslinking density of 10% were constructed under each system, and their geometric structures were optimized based on the minimum energy principle. The amorphous models with the lowest energy were selected for further simulation and calculation.
- (3)
- Perform a 200-ps MD simulation on each model under the NPT ensemble (the constant temperature and pressure ensemble). The specific details of the MD process are as follows. The time step was 1 fs. The temperature and pressure were controlled at 580 K and 1.0 × 10⁻⁴ GPa (which is one standard atmospheric pressure) respectively by applying the Andersen and Berendsen methodology [20,34]. In addition, the van der Waals interaction and electrostatic interaction were calculated by the atom-based and Eward method, respectively.
- (4)
- The scriptlet employed for the crosslinking reaction was written according to Section 2.1. The crosslinking was conducted in stages, and the molecular models with different crosslinking densities were obtained by conducting crosslinking reactions multiple times.
2.3. MD and Annealing Simulation
3. Simulation Results and Model Parameters
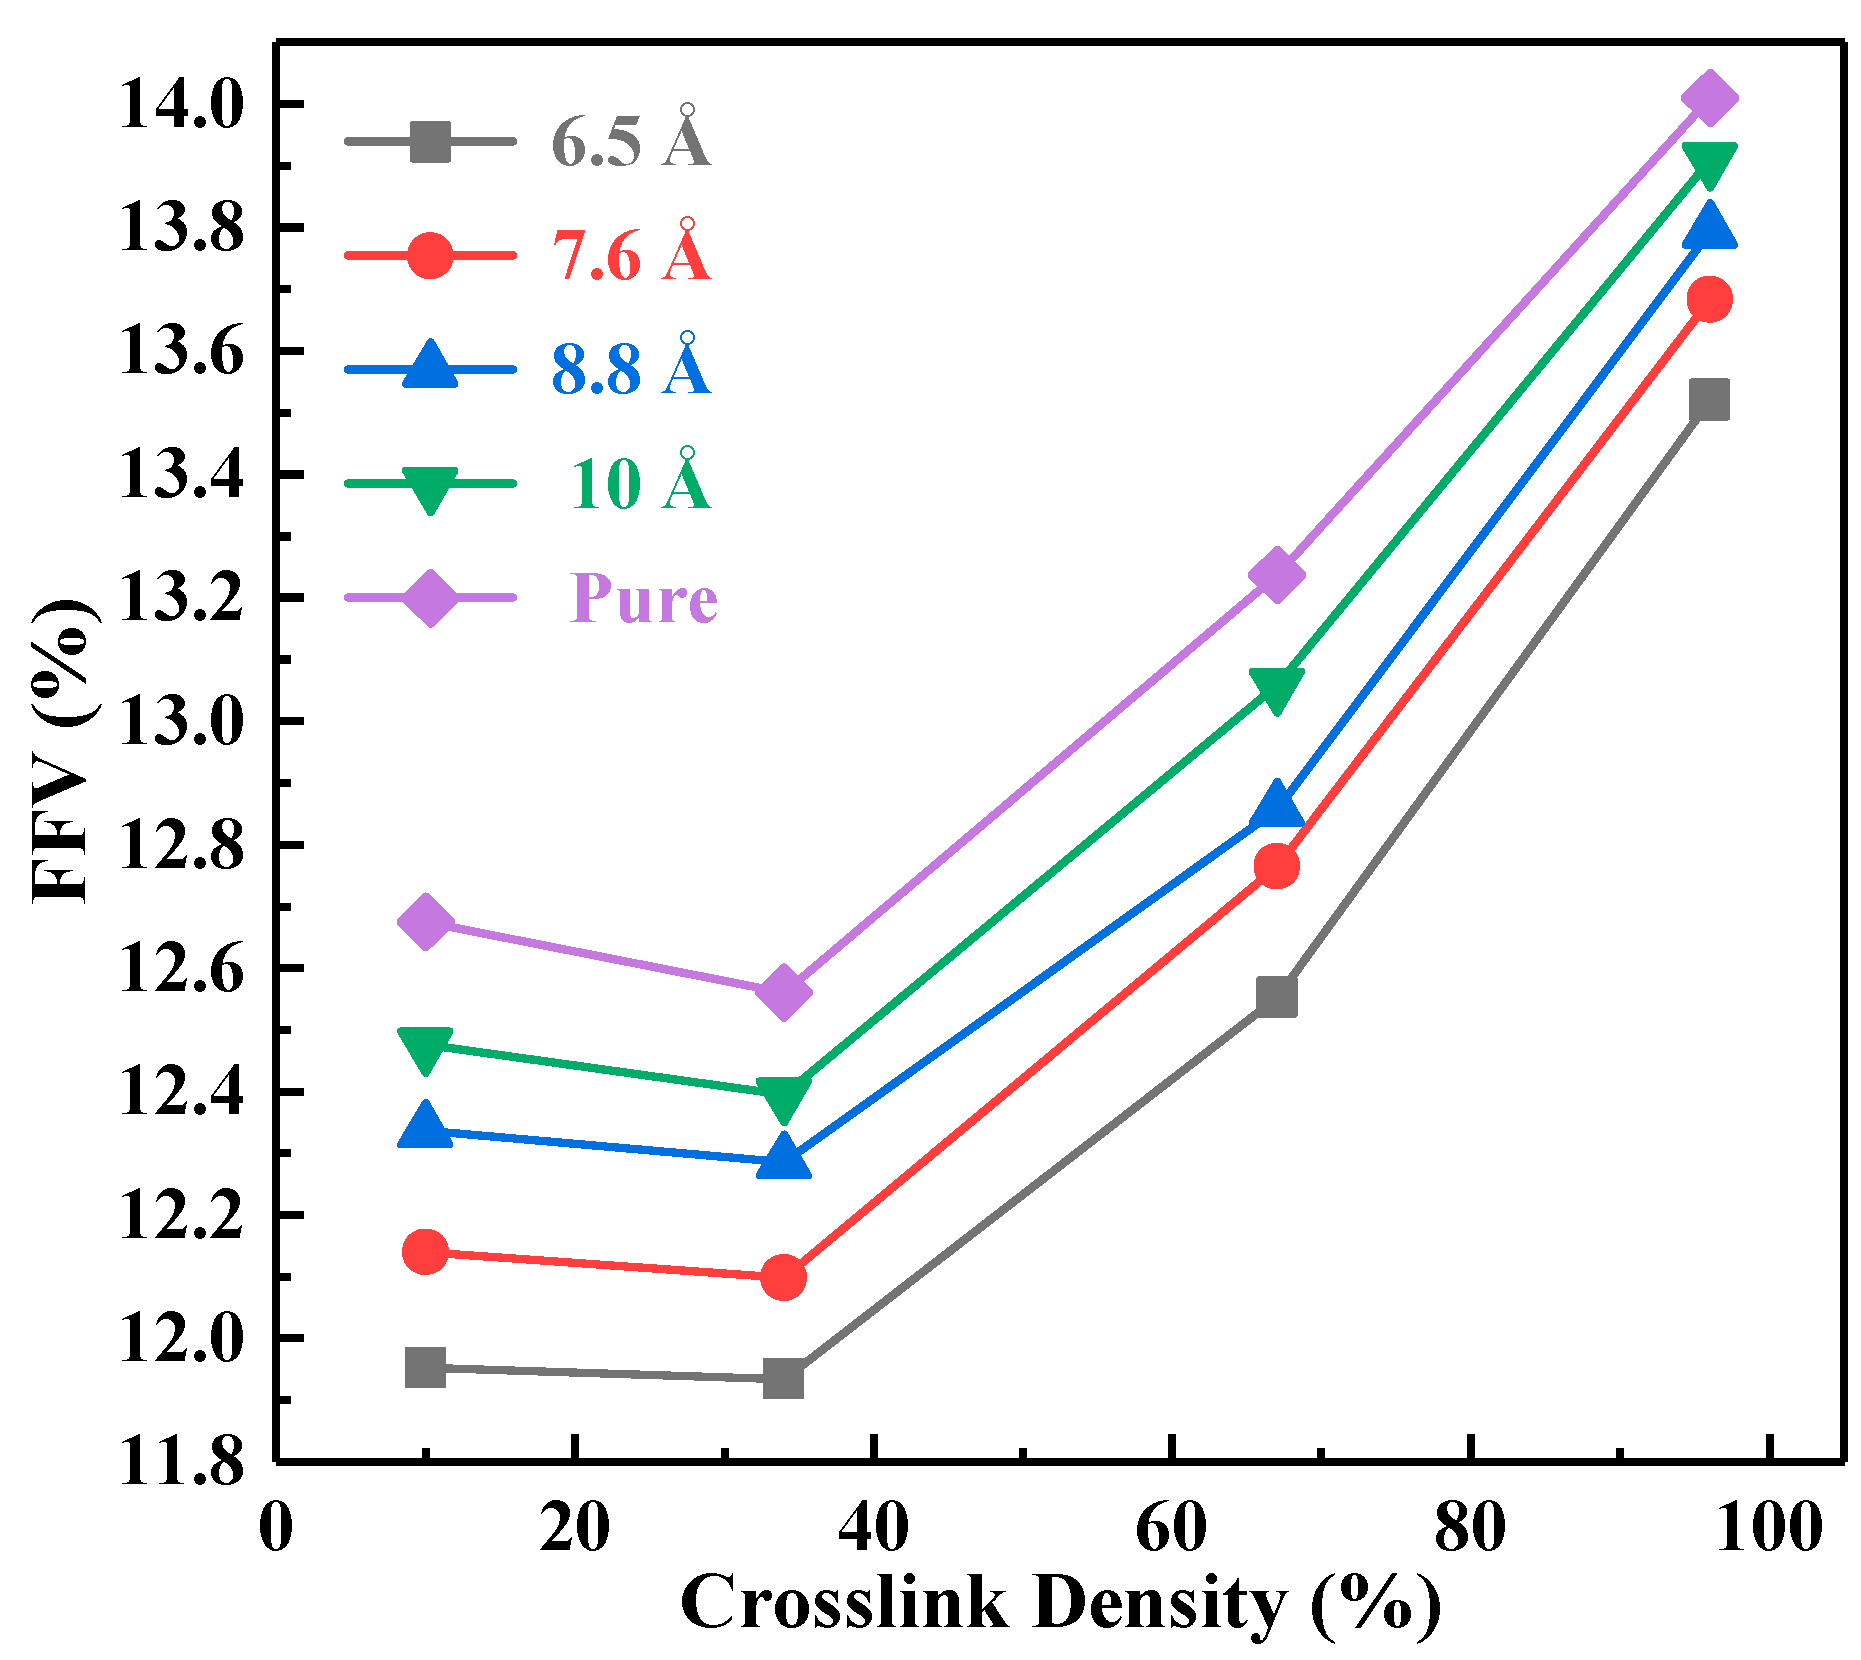
3.1. Free Volume
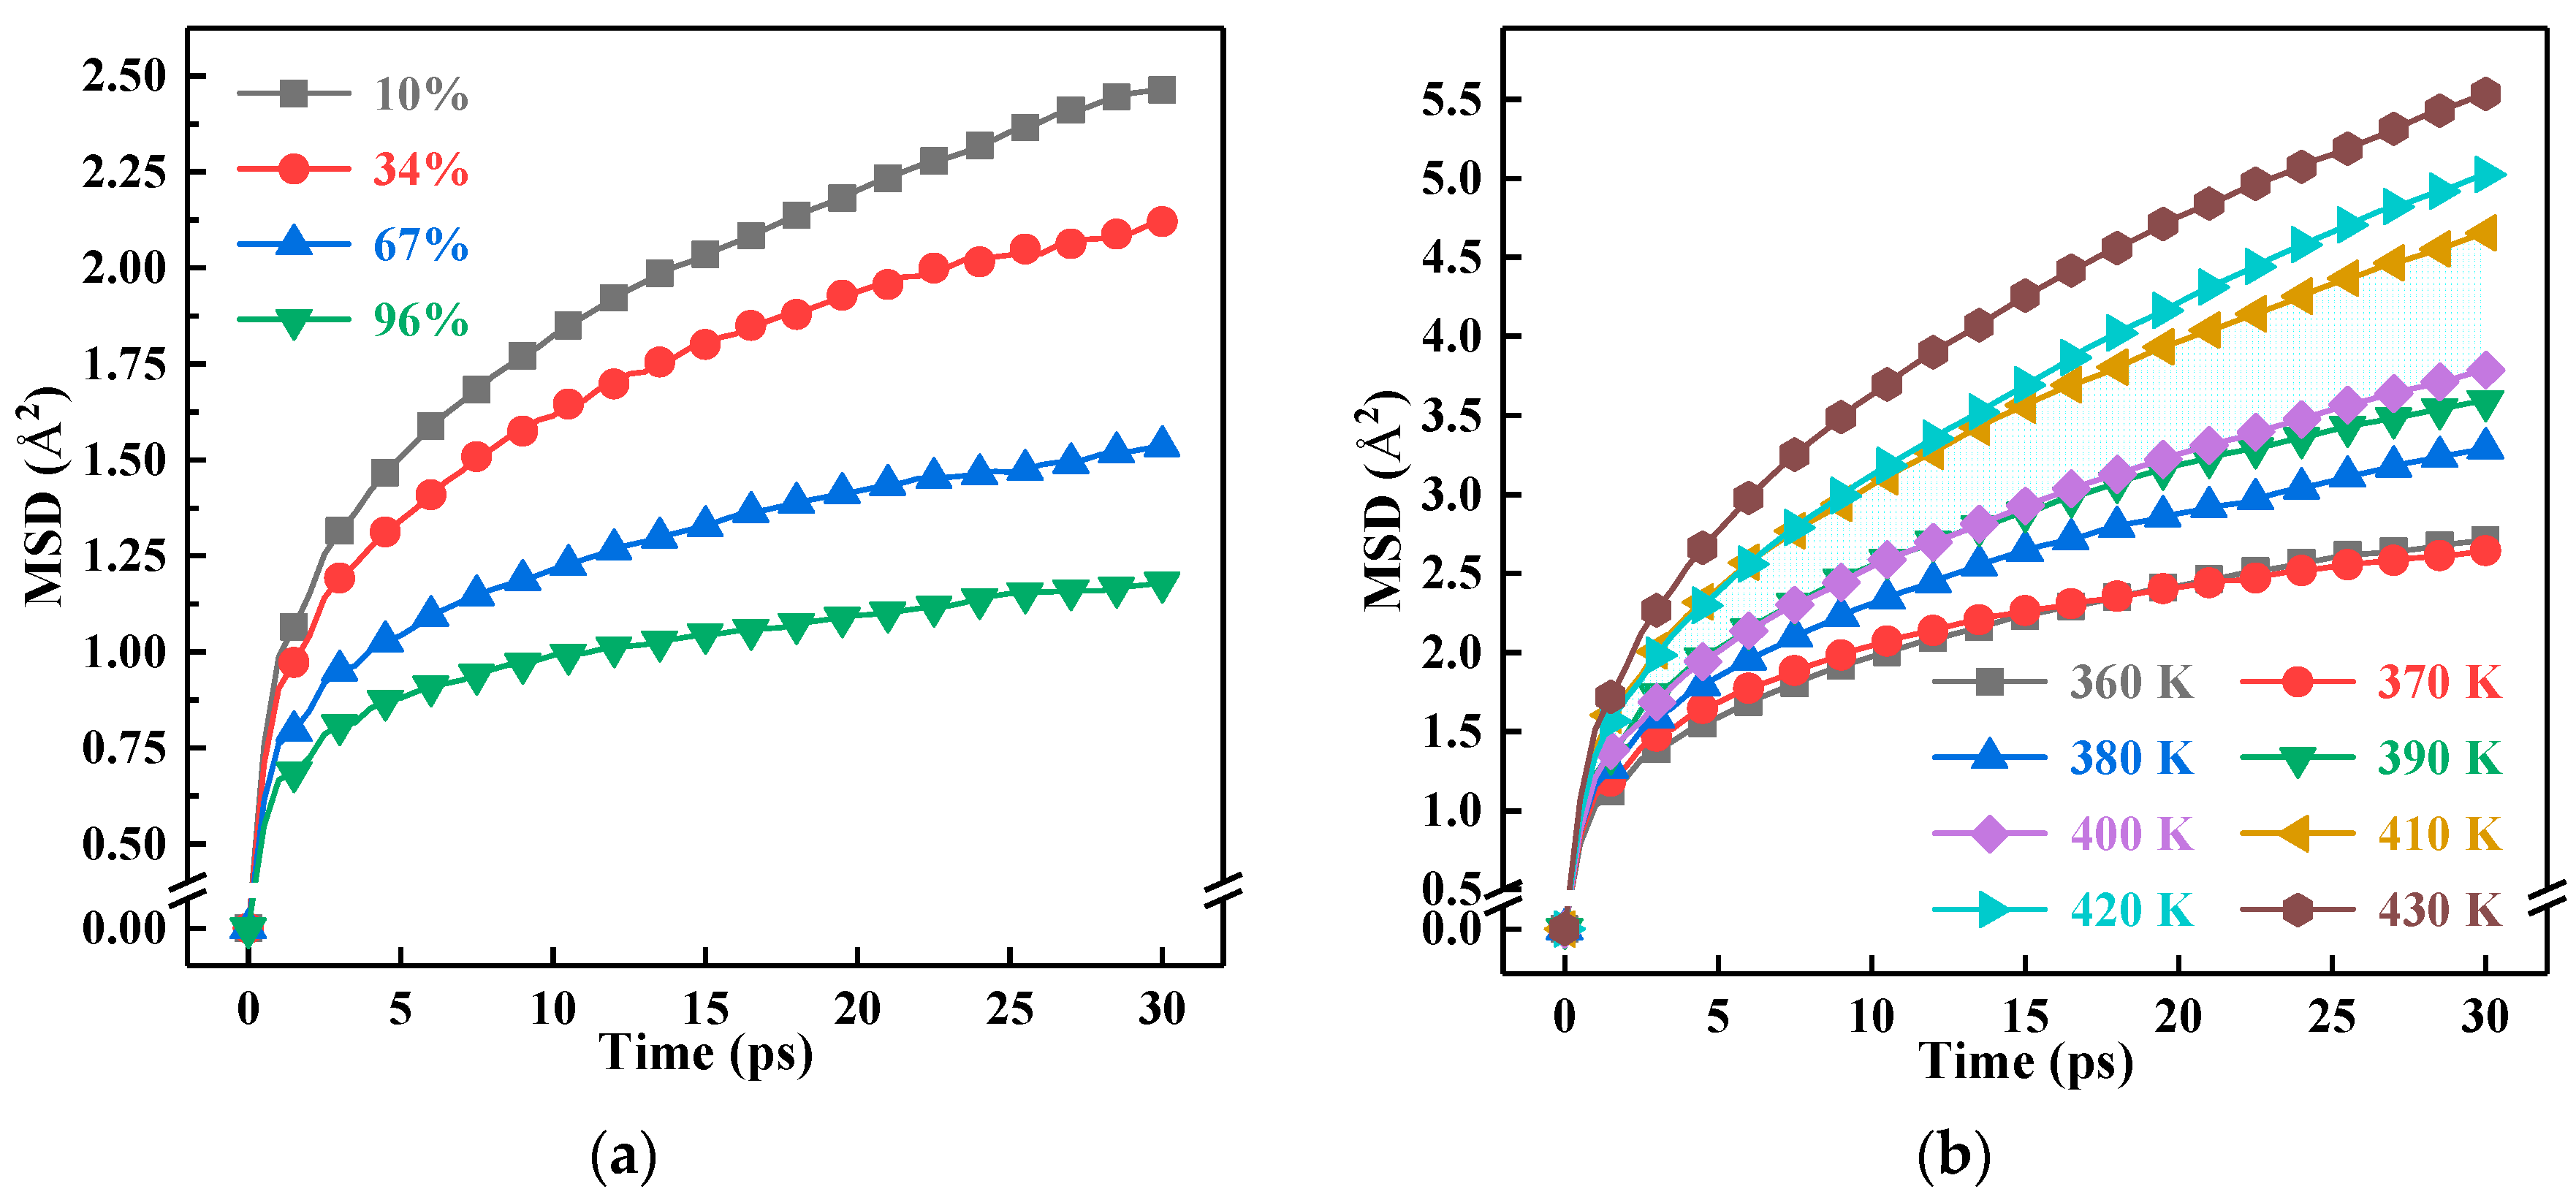
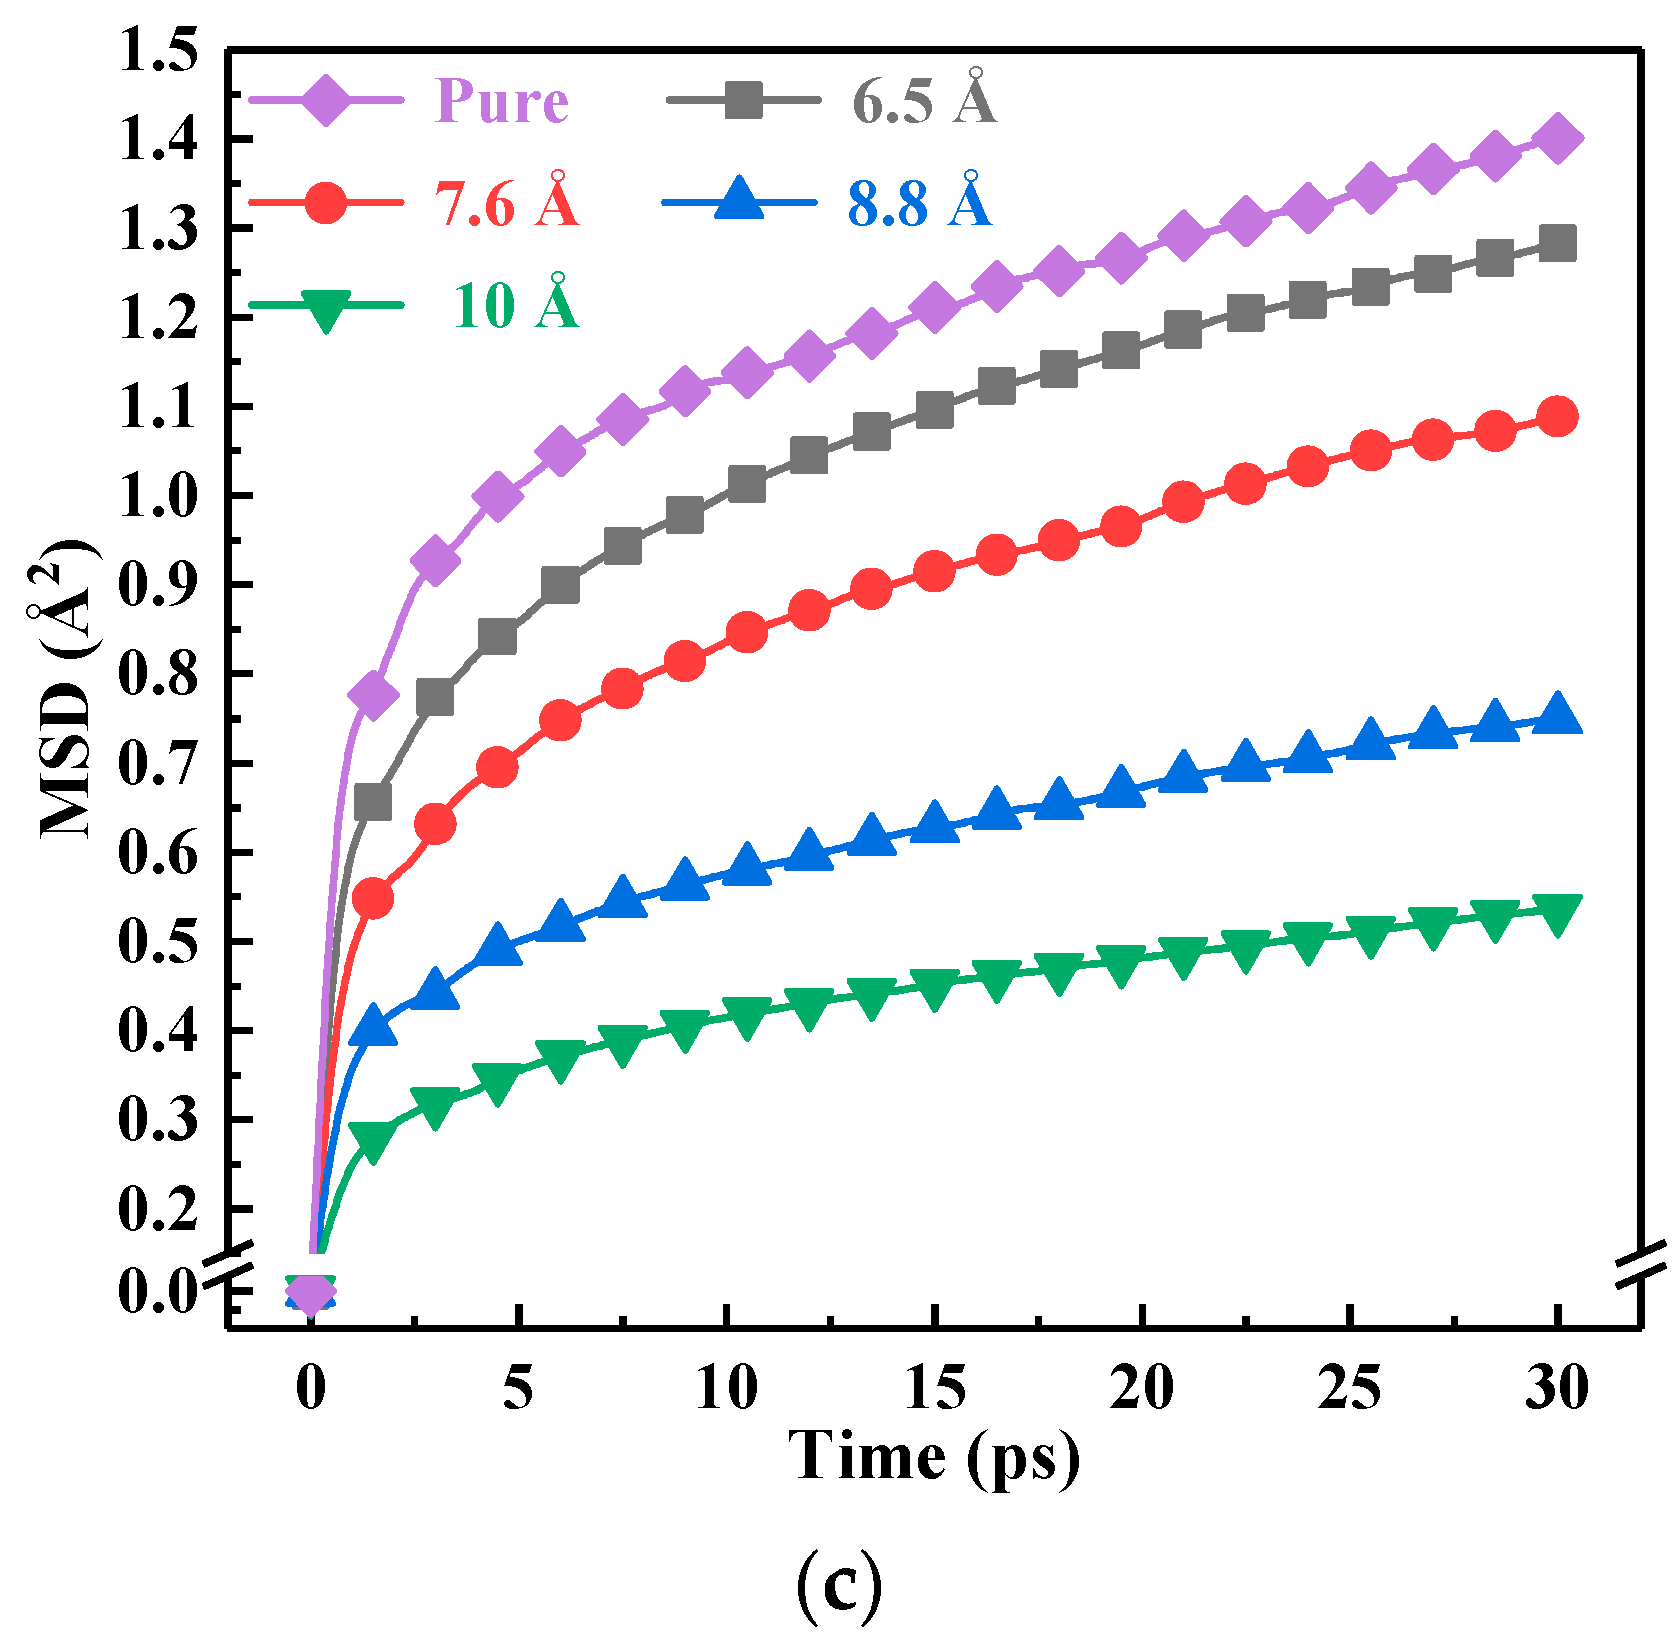
3.2. Segment Motion
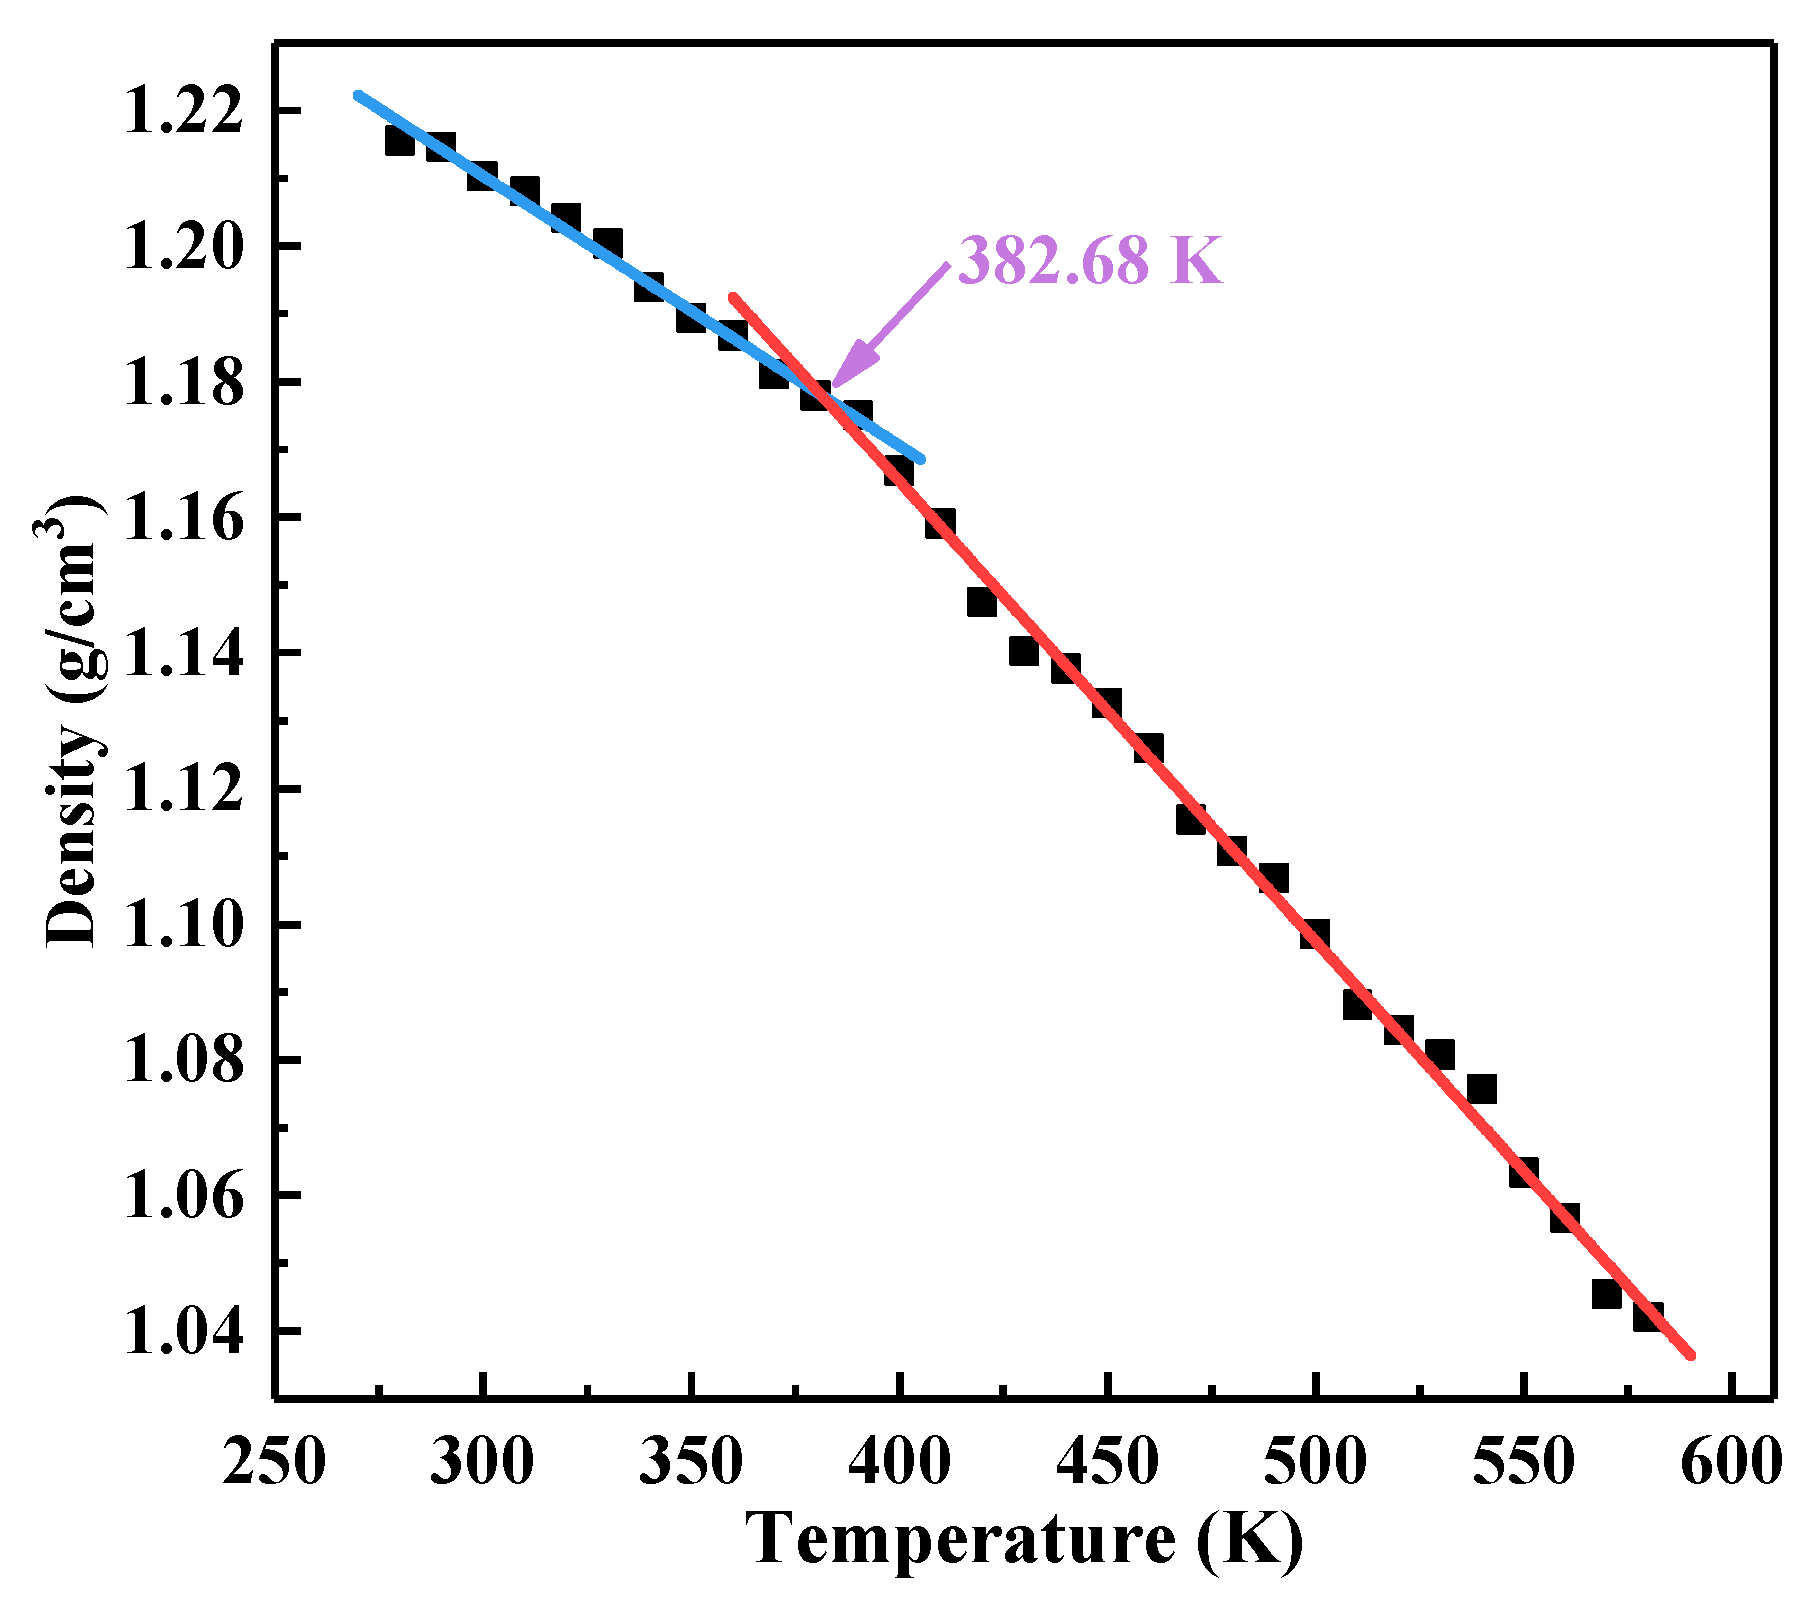
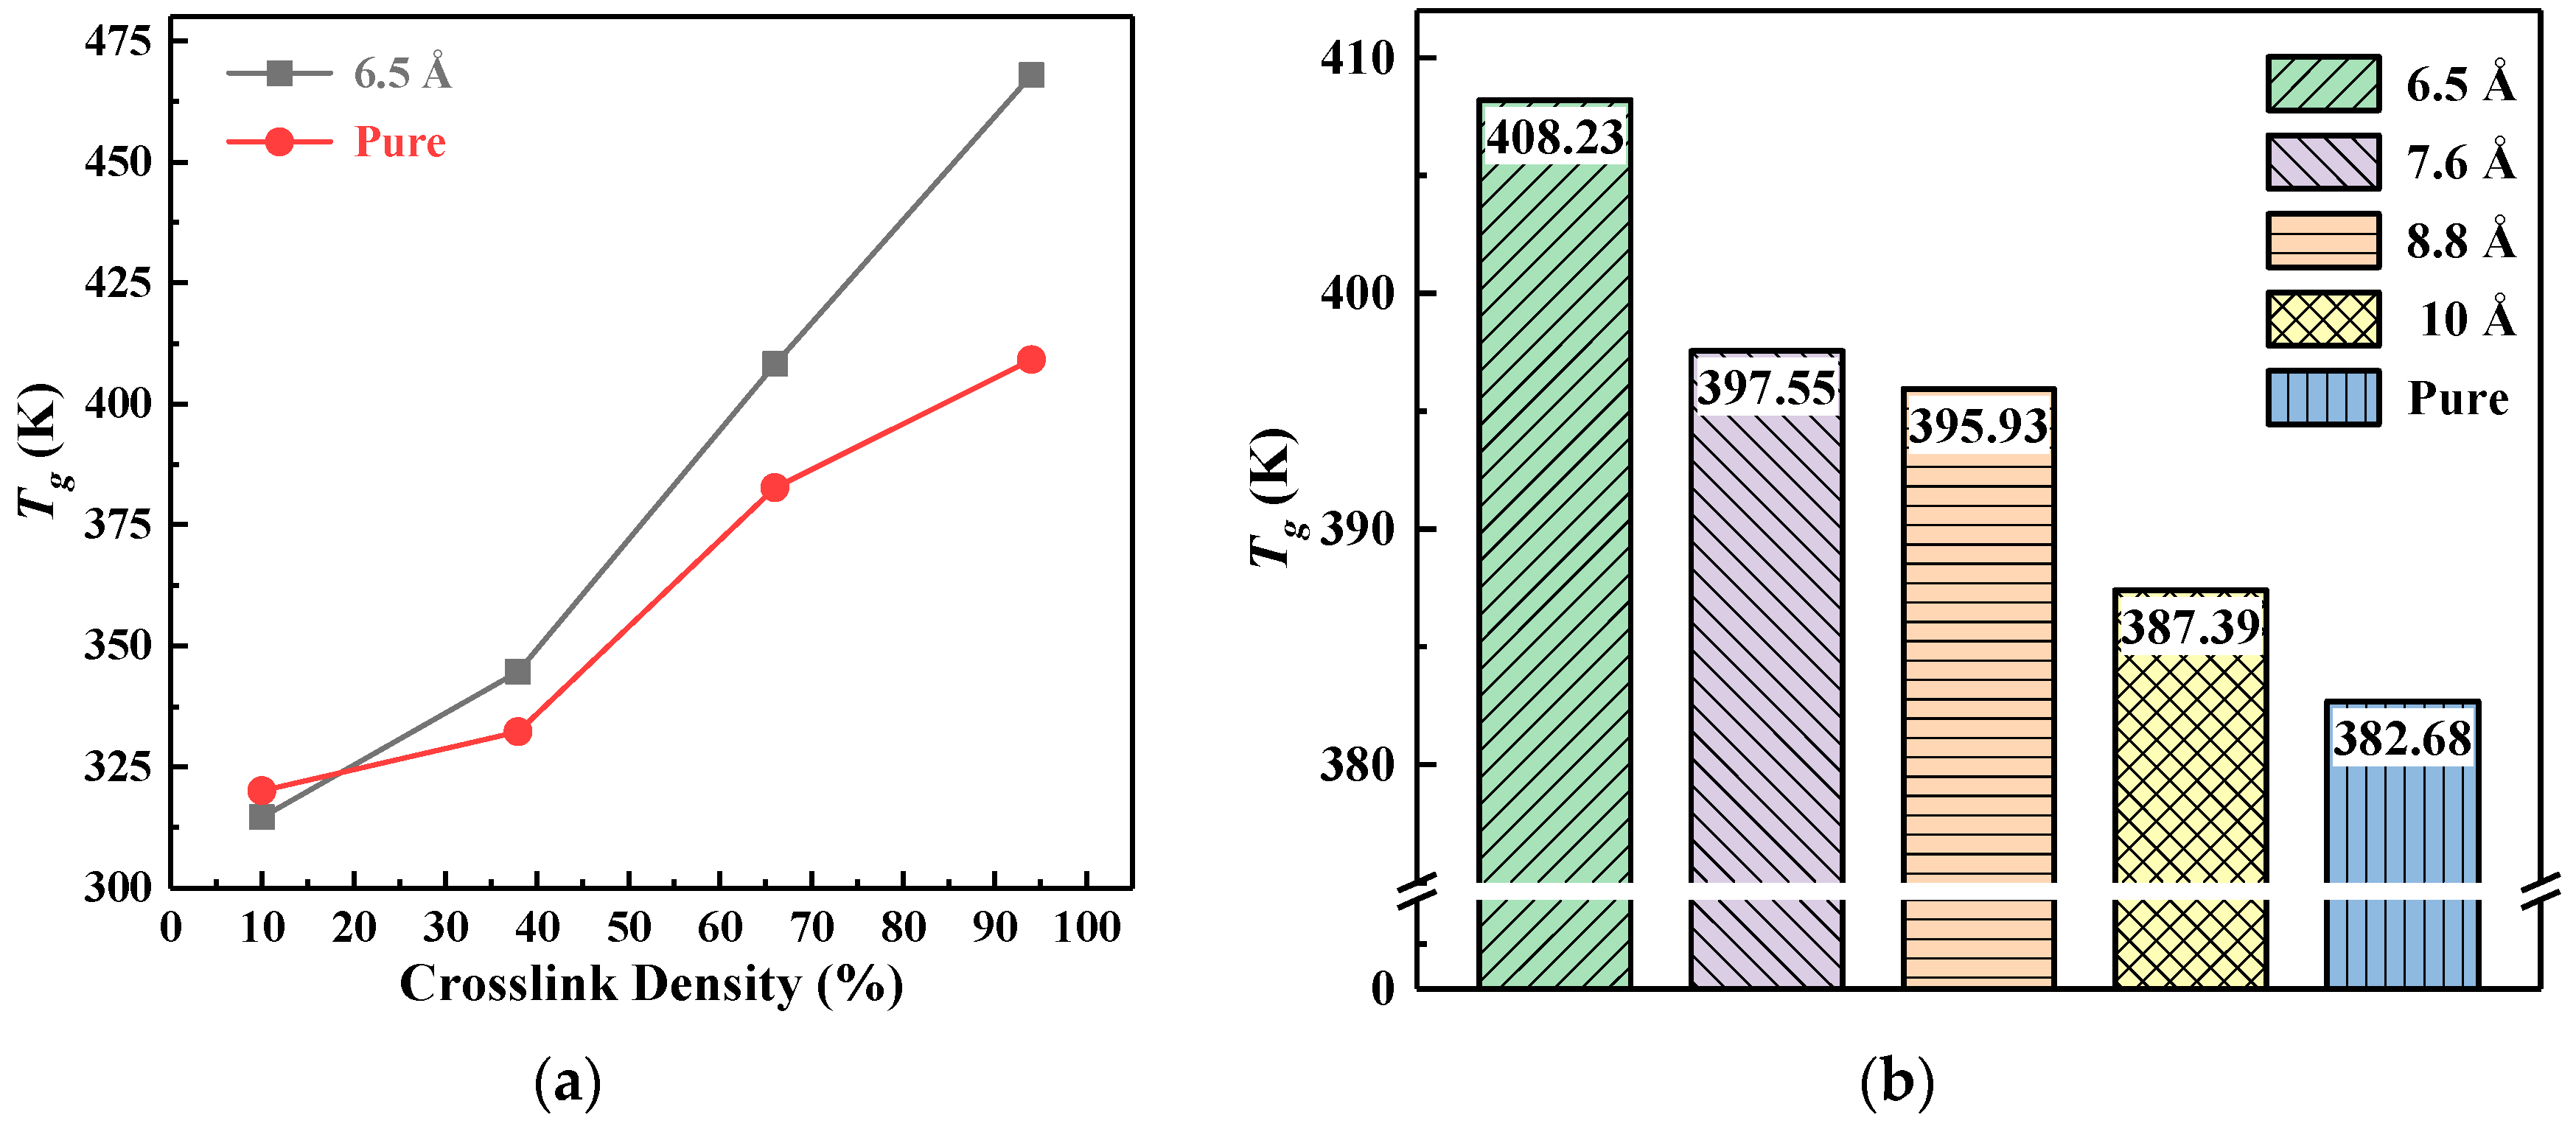
3.3. Glass Transition Temperature
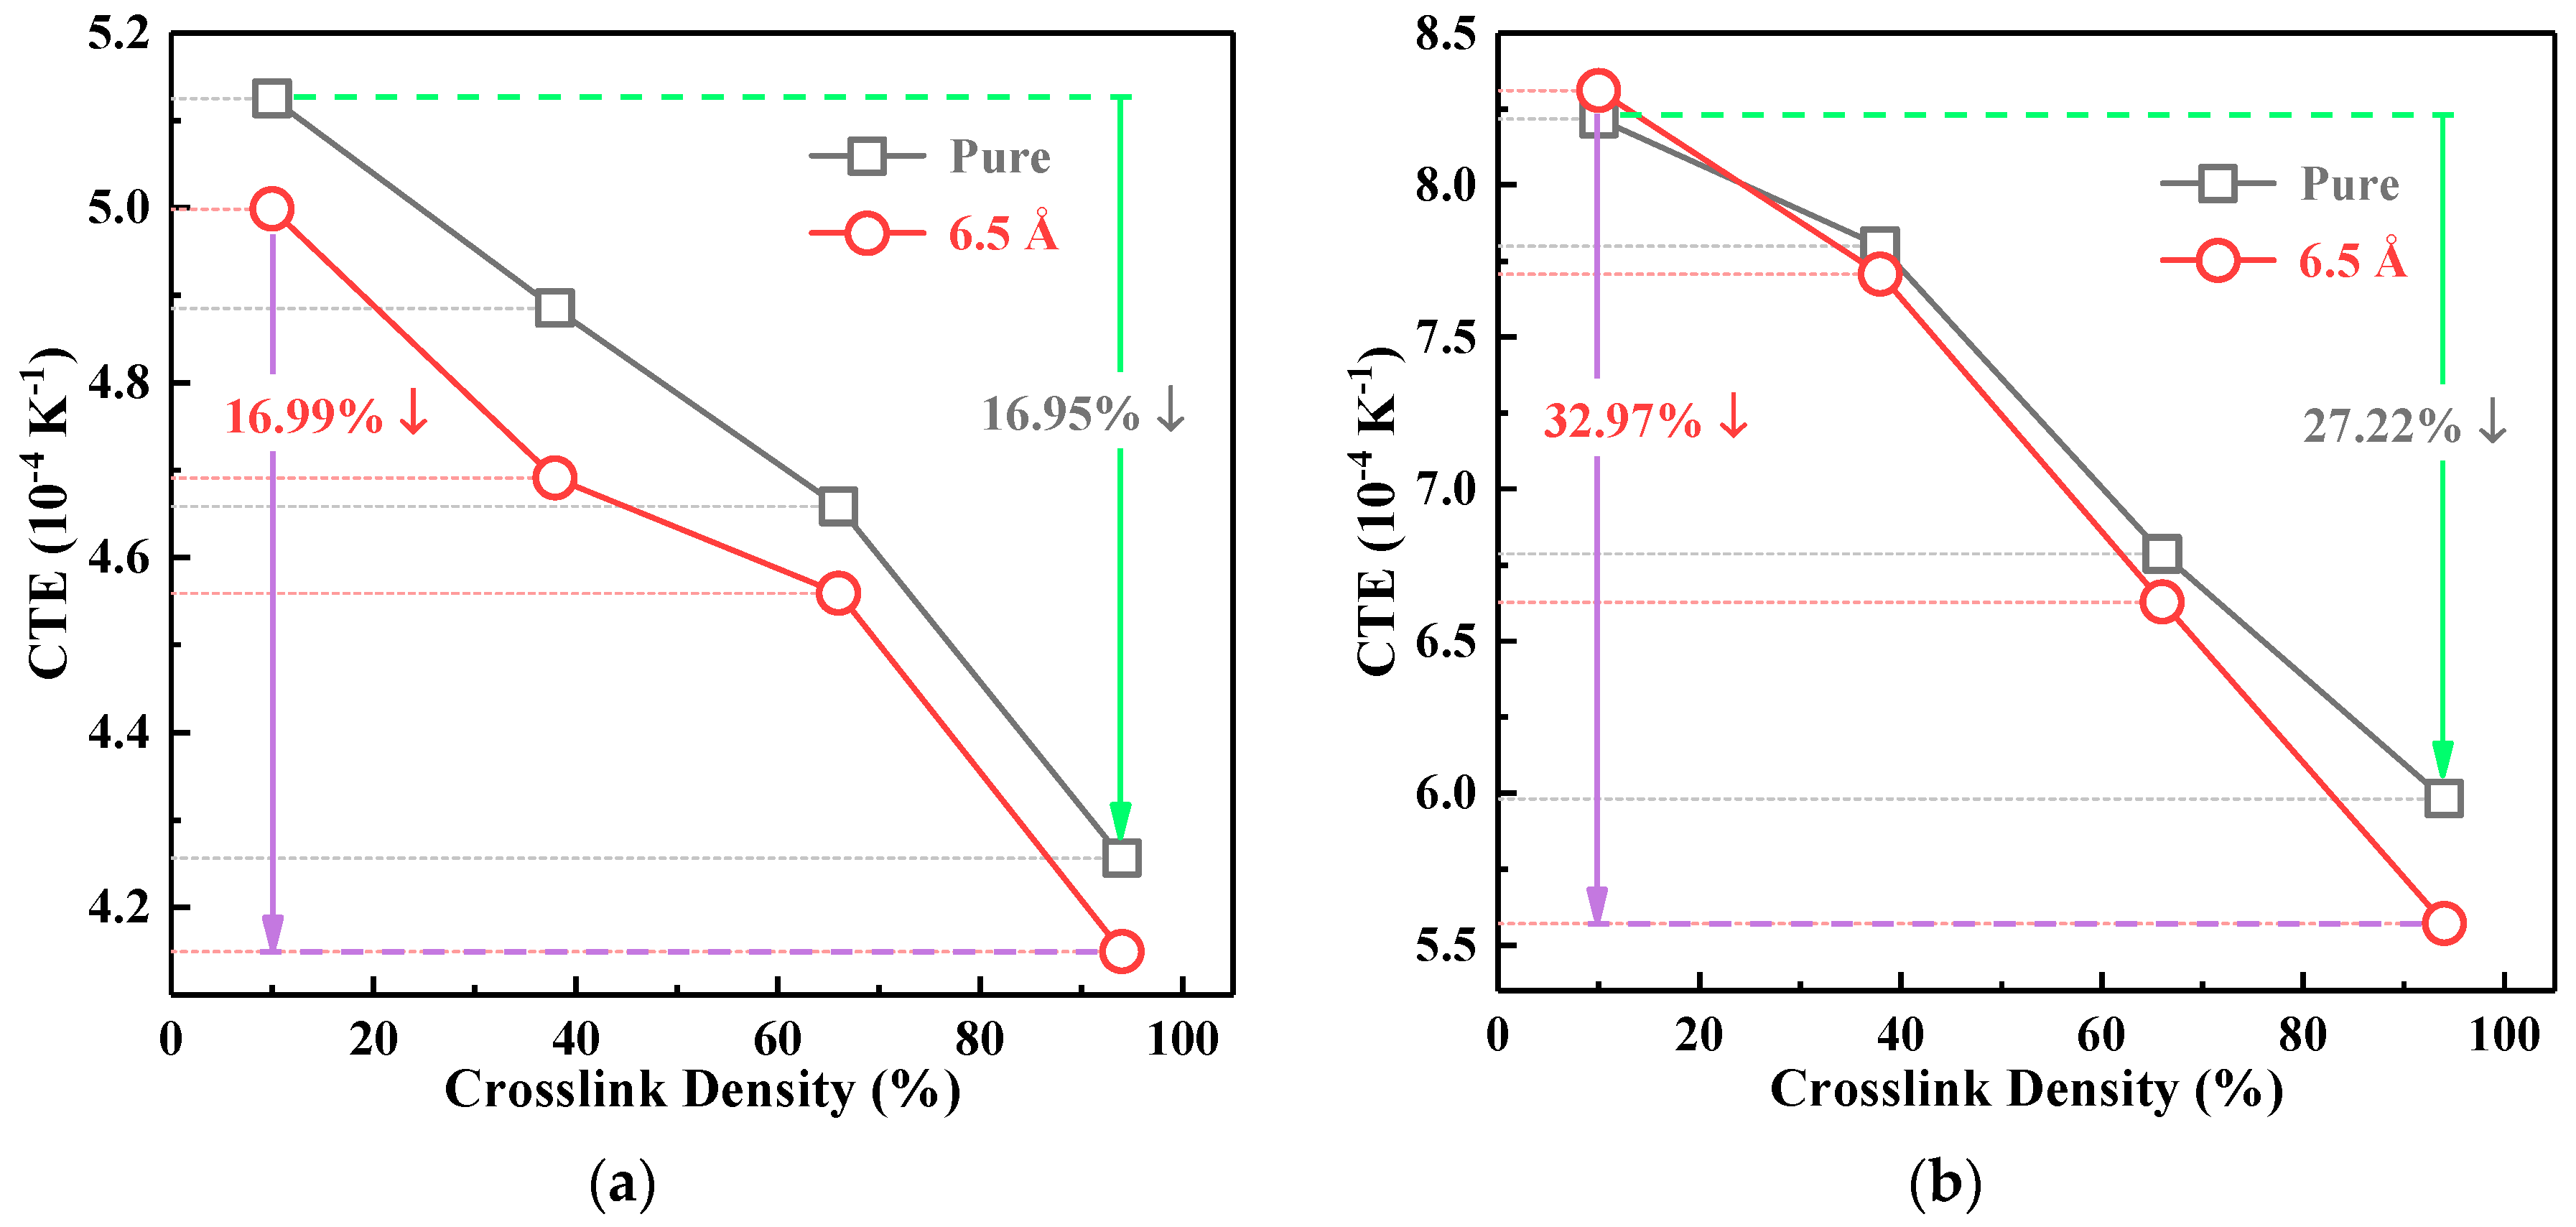
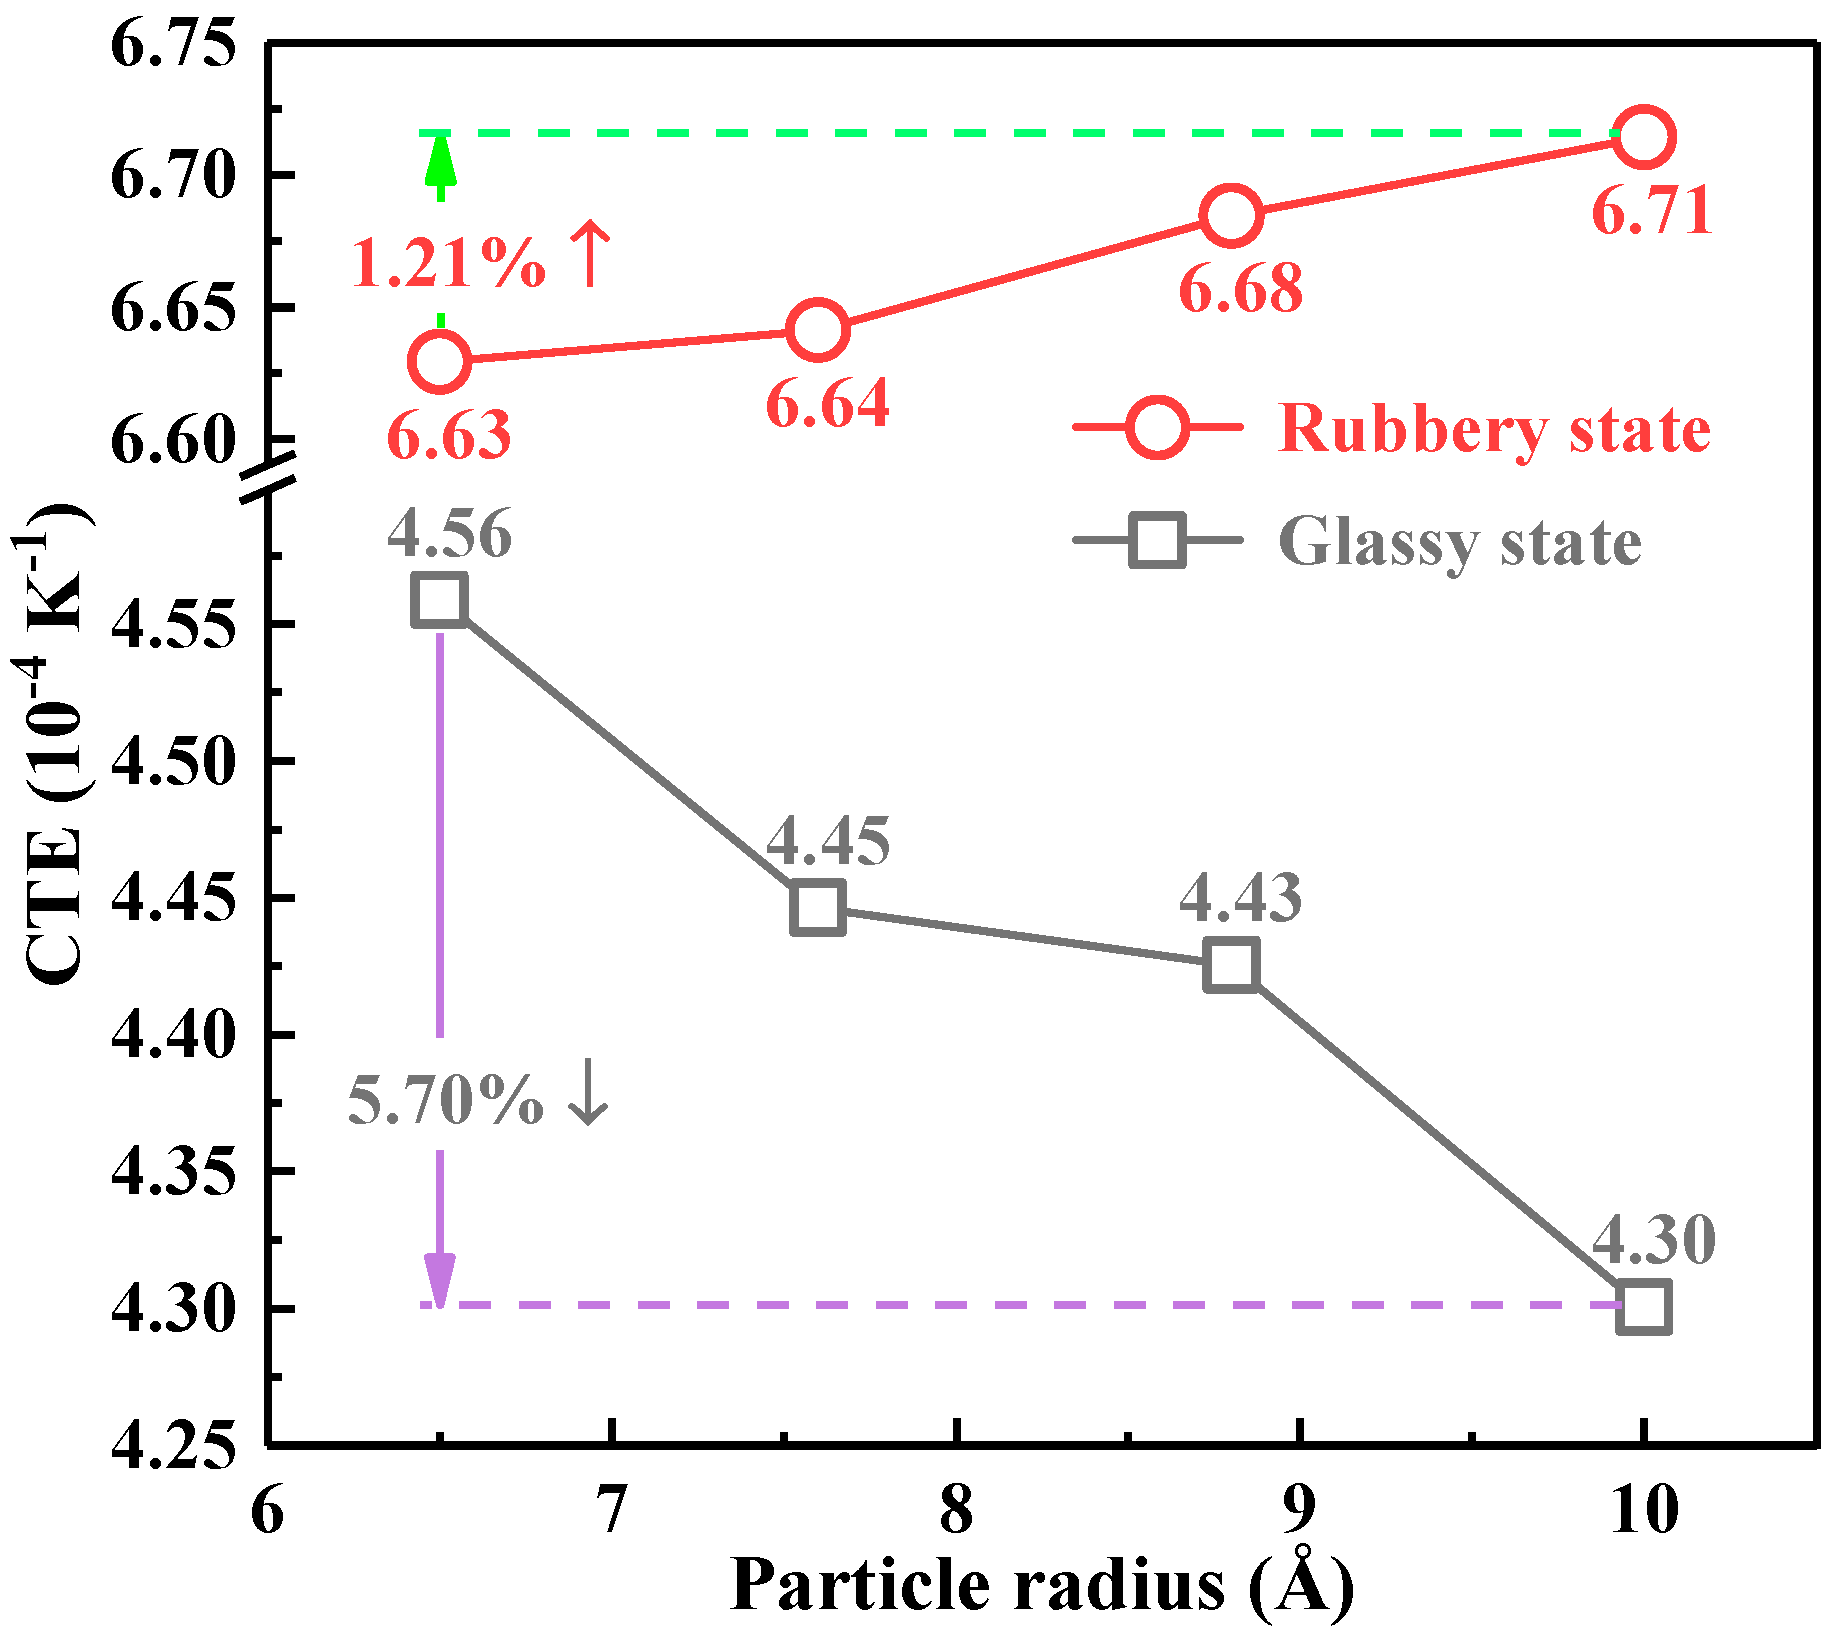
3.4. Coefficient of Thermal Expansion
3.5. Elastic Moduli
4. Conclusions
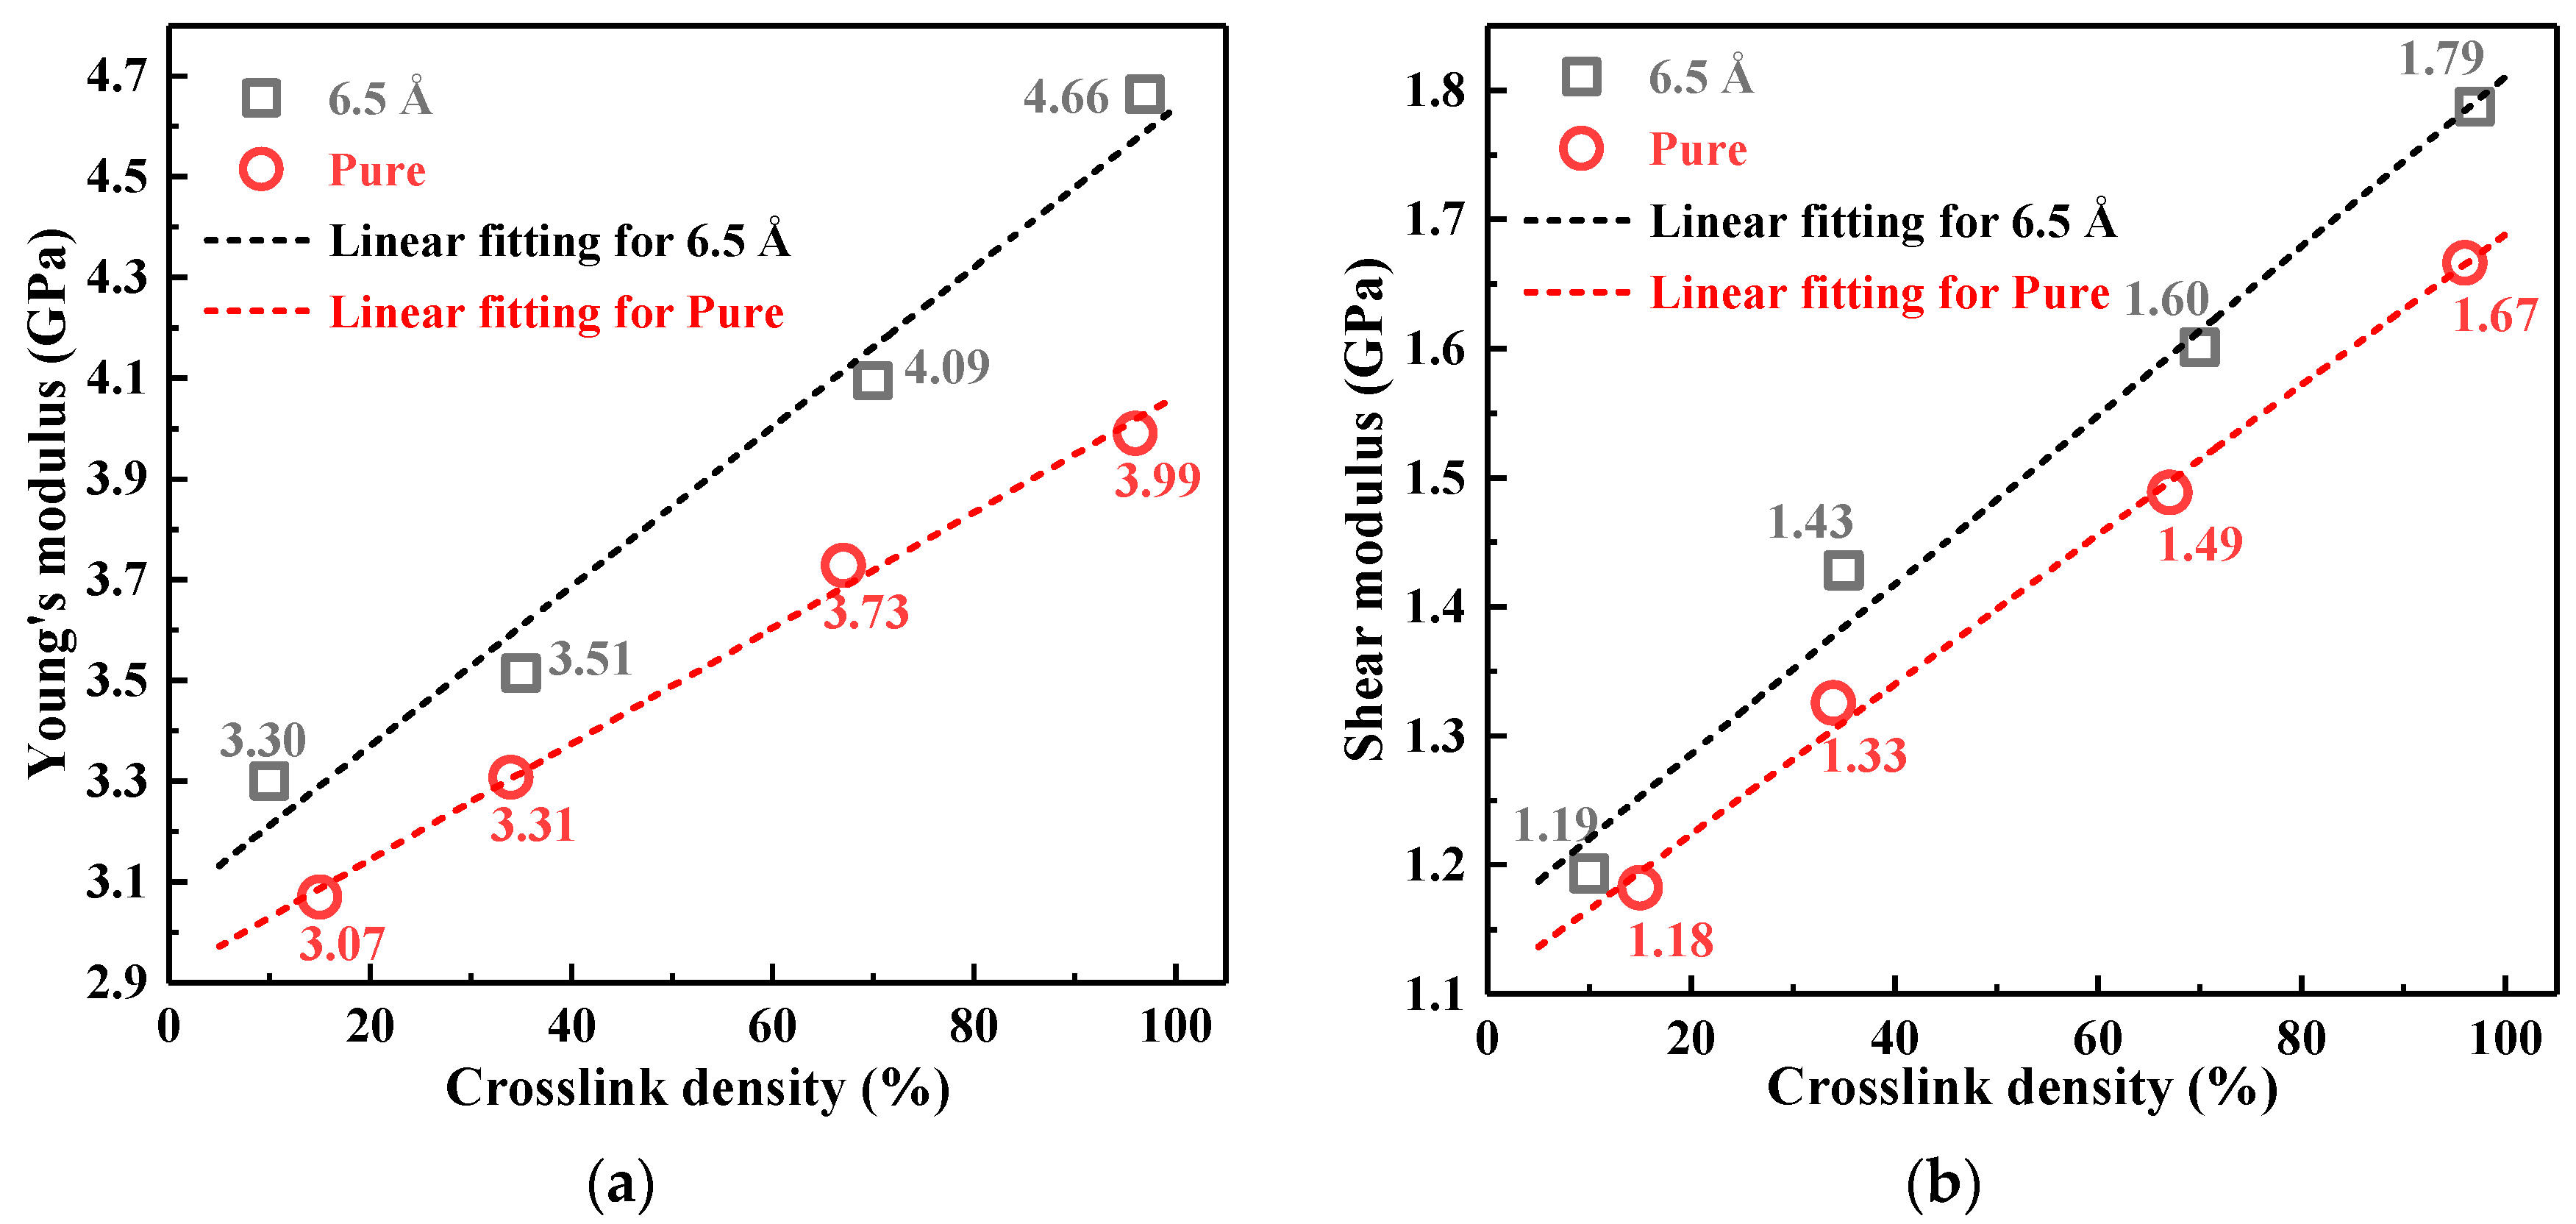
- The thermal and mechanical properties were improved by increasing the crosslinking density. With the increase of crosslinking density, the glass transition temperature (Tg) increased and the coefficient of thermal expansion (CTE) decreased; in addition, Young’s modulus and the shear modulus of the materials increased, and the mechanical properties were enhanced.
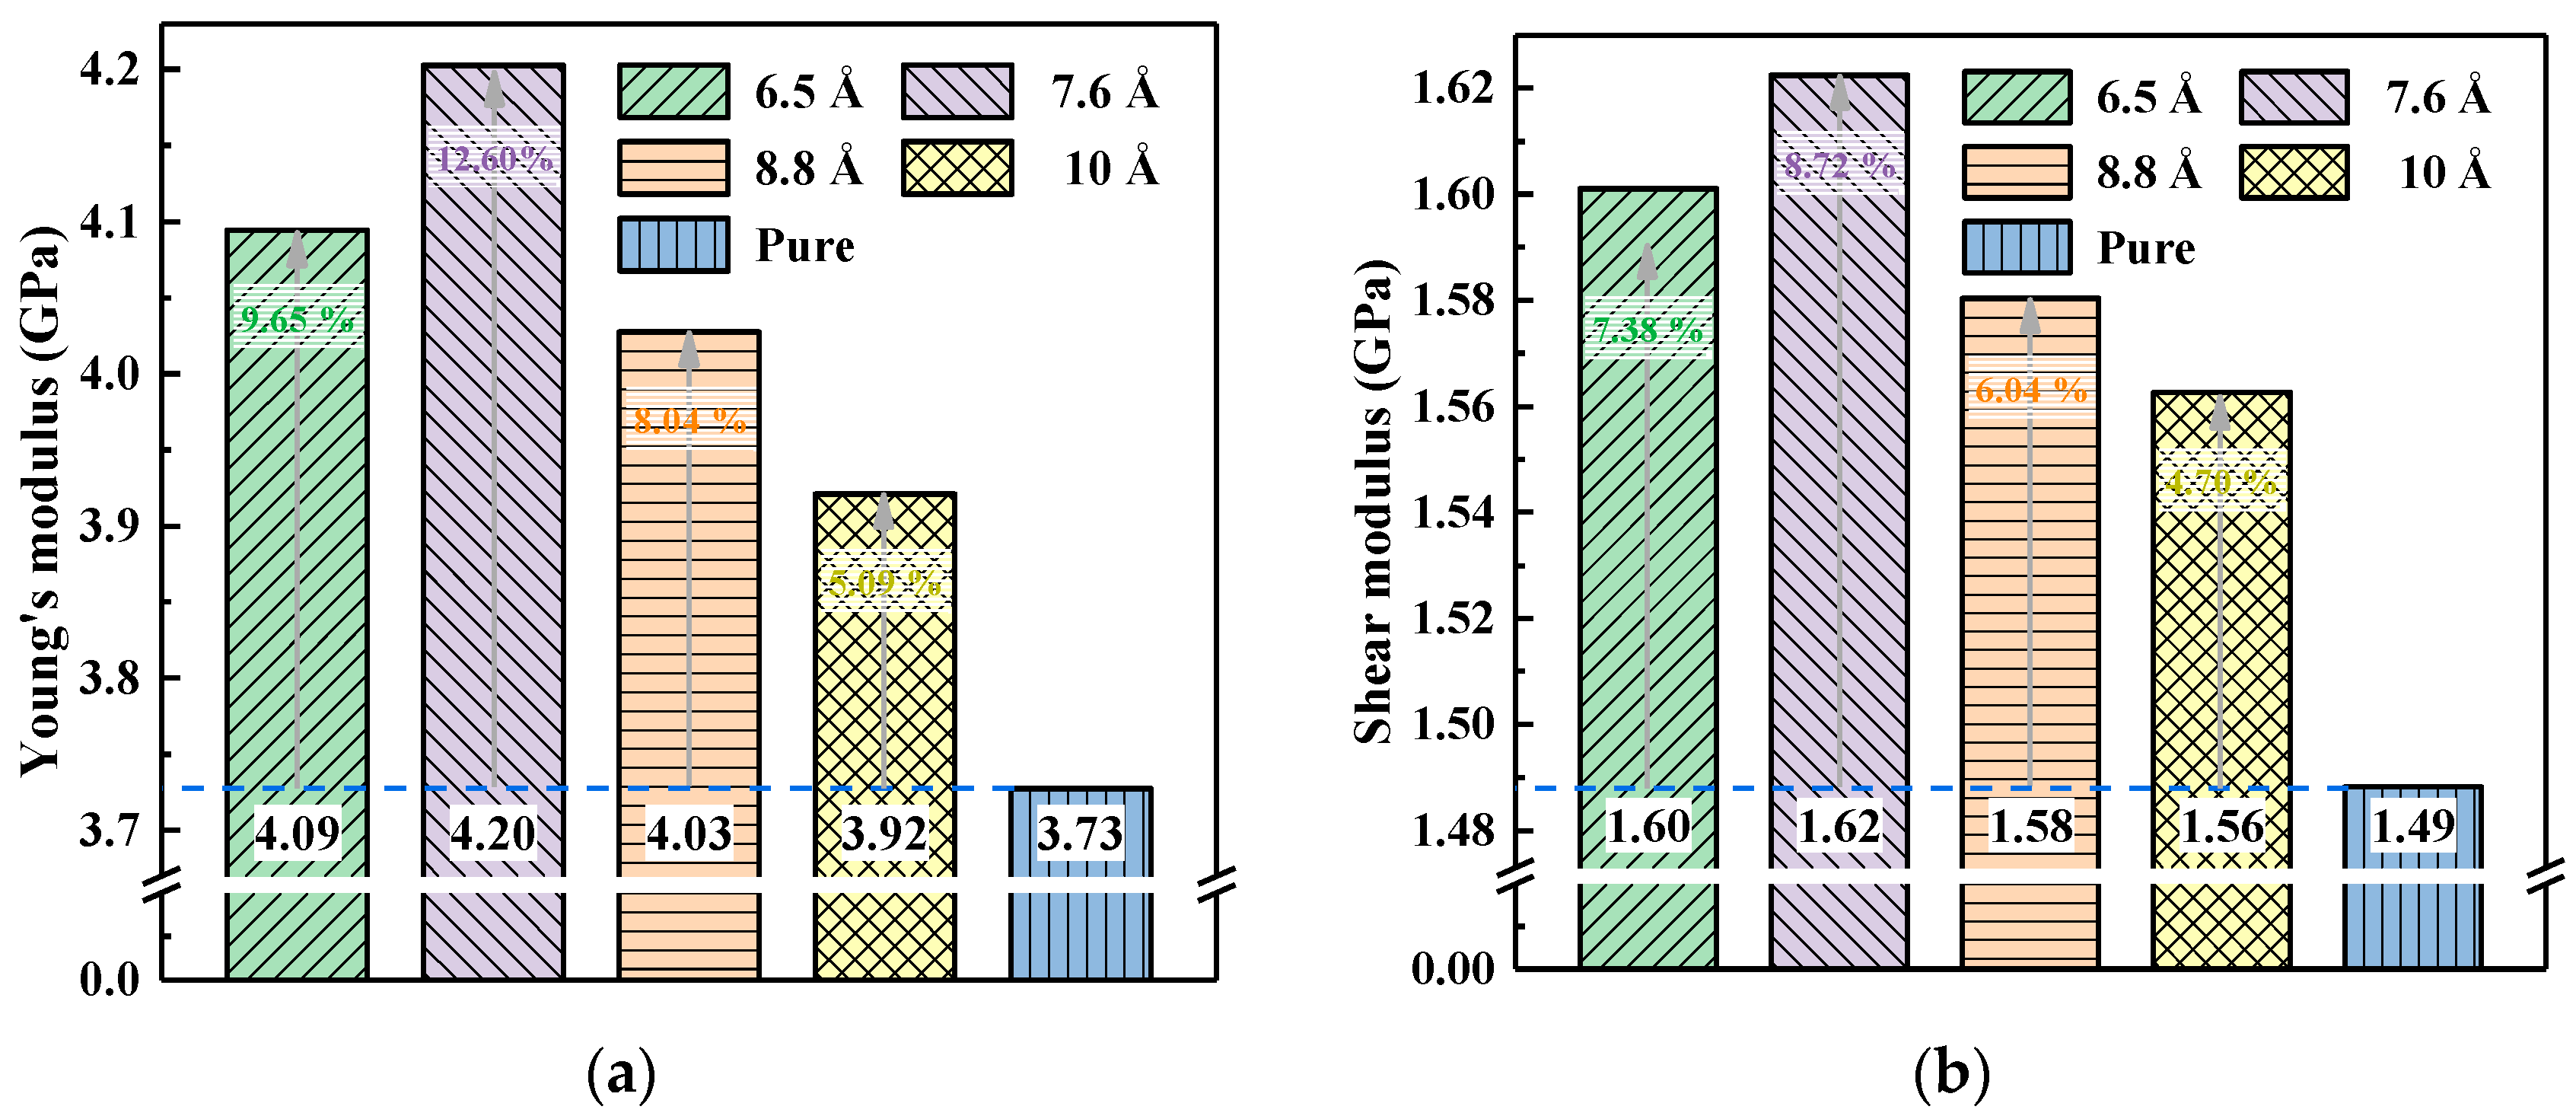
- Doping nano-SiO2 particles into epoxy resin effectively improved the thermal and mechanical properties, and the effectiveness was closely related to the particle size of nano-SiO2. The Tg value increased with the decreasing particle size. Compared with pure epoxy resin, the Tg of 6.5 Å composite model was increased by 6.68%. The variation of CTE in the glassy state demonstrated opposite trend as compared with Tg value. The CTE of 10 Å composite model was the lowest, which is 7.70% less than that of pure epoxy. In addition, the mechanical properties first increased and then decreased with the decreasing particle size. Both the Young’s modulus and shear modulus reached the maximum at the 7.6 Å, and increased by 12.60% and 8.72% respectively compared with pure epoxy.
- The thermal and mechanical properties are closely related to the Fraction of Free Volume (FFV) and Mean Squared Displacement (MSD). The crosslinking process and the nano-SiO2 doping reduced the FFV in the model, impeded the deformation and improved the elastic modulus of the system. Moreover, the decreasing FFV reduced the MSD of the model, limited the segment motion of the molecular chains and made it even harder for the glass transition.
Author Contributions
Funding
Conflicts of Interest
References
- Xie, Q.; Lin, H.F.; Zhang, S.; Wang, R.X.; Kong, F.; Shao, T. Deposition of SICxHyOz thin film on epoxy resin by nanosecond pulsed appj for improving the surface insulating performance. Plasma Sci. Technol. 2018, 20. [Google Scholar] [CrossRef]
- He, X.; Xu, X.; Wan, Q.; Bo, G.; Yan, Y. Synthesis and characterization of dimmer-acid-based nonisocyanate polyurethane and epoxy resin composite. Polymers 2017, 9, 649. [Google Scholar] [CrossRef]
- Kumar, S.; Krishnan, S.; Samal, S.K.; Mohanty, S.; Nayak, S.K. Toughening of petroleum based (DGEBA) epoxy resins with various renewable resources based flexible chains for high performance applications: A review. Ind. Eng. Chem. Res. 2018, 57, 2711–2726. [Google Scholar] [CrossRef]
- Zhou, X.; Qiu, S.; Xing, W.; Gangireddy, C.S.R.; Gui, Z.; Hu, Y. Hierarchical polyphosphazene@molybdenum disulfide hybrid structure for enhancing the flame retardancy and mechanical property of epoxy resins. ACS Appl. Mater. Interfaces 2017, 9, 29147–29156. [Google Scholar] [CrossRef] [PubMed]
- Bobby, S.; Samad, M.A. Enhancement of tribological performance of epoxy bulk composites and composite coatings using micro/nano fillers: A review. Polym. Adv. Technol. 2017, 28, 633–644. [Google Scholar] [CrossRef]
- Zabihi, O.; Ahmadi, M.; Nikafshar, S.; Chandrakumar Preyeswary, K.; Naebe, M. A technical review on epoxy-clay nanocomposites: Structure, properties, and their applications in fiber reinforced composites. Compos. Part B Eng. 2018, 135, 1–24. [Google Scholar] [CrossRef]
- Nikje, M.M.A.; Garmarudi, A.B.; Tehrani, Z.M.; Haghshenas, M.; Shakhesi, S. Thermal and mechanical evaluation of epoxy resin composites by synthesis of amine-based coupling agent-nano silica complex. Polym.-Plast. Technol. 2011, 50, 646–650. [Google Scholar] [CrossRef]
- Faridirad, F.; Ahmadi, S.; Barmar, M. Polyamide/carbon nanoparticles nanocomposites: A review. Polym. Eng. Sci. 2017, 57, 475–494. [Google Scholar] [CrossRef]
- Hoyos, M.; García, N.; Navarro, R.; Dardano, A.; Ratto, A.; Guastavino, F.; Tiemblo, P. Electrical strength in ramp voltage ac tests of ldpe and its nanocomposites with silica and fibrous and laminar silicates. J. Polym. Sci. Pol. Phys. 2008, 46, 1301–1311. [Google Scholar] [CrossRef]
- Njuguna, J.; Pielichowski, K.; Desai, S. Nanofiller-reinforced polymer nanocomposites. Polym. Adv. Technol. 2008, 19, 947–959. [Google Scholar] [CrossRef] [Green Version]
- Shao, T.; Liu, F.; Hai, B.; Ma, Y.F.; Wang, R.X.; Ren, C.Y. Surface modification of epoxy using an atmospheric pressure dielectric barrier discharge to accelerate surface charge dissipation. IEEE Trans. Dielectr. Electr. Insul. 2017, 24, 1557–1565. [Google Scholar] [CrossRef]
- Mo, H.; Huang, X.; Liu, F.; Yang, K.; Li, S.; Jiang, P. Nanostructured electrical insulating epoxy thermosets with high thermal conductivity, high thermal stability, high glass transition temperatures and excellent dielectric properties. IEEE Trans. Dielectr. Electr. Insul. 2015, 22, 906–915. [Google Scholar] [CrossRef]
- Yang, L.; Qi, C.; Wu, G.; Liao, R.; Wang, Q.; Gong, C.; Gao, J. Molecular dynamics simulation of diffusion behaviour of gas molecules within oil–paper insulation system. Mol. Simul. 2013, 39, 988–999. [Google Scholar] [CrossRef]
- Verma, A.; Parashar, A.; Packirisamy, M. Atomistic modeling of graphene/hexagonal boron nitride polymer nanocomposites: A review. WIREs Comput. Mol. Sci. 2018, 8, e1346. [Google Scholar] [CrossRef]
- Paquet, E.; Viktor, H.L. Molecular dynamics, monte carlo simulations, and langevin dynamics: A computational review. BioMed Res. Int. 2015, 2015, 183918. [Google Scholar] [CrossRef] [PubMed]
- Masoumi, S.; Arab, B.; Valipour, H. A study of thermo-mechanical properties of the cross-linked epoxy: An atomistic simulation. Polymer 2015, 70, 351–360. [Google Scholar] [CrossRef]
- Li, K.; Li, Y.; Lian, Q.; Cheng, J.; Zhang, J. Influence of cross-linking density on the structure and properties of the interphase within supported ultrathin epoxy films. J. Mater. Sci. 2016, 51, 9019–9030. [Google Scholar] [CrossRef]
- Odegard, G.M.; Jensen, B.D.; Gowtham, S.; Wu, J.; He, J.; Zhang, Z. Predicting mechanical response of crosslinked epoxy using reaxff. Chem. Phys. Lett. 2014, 591, 175–178. [Google Scholar] [CrossRef]
- Sirk, T.W.; Khare, K.S.; Karim, M.; Lenhart, J.L.; Andzelm, J.W.; McKenna, G.B.; Khare, R. High strain rate mechanical properties of a cross-linked epoxy across the glass transition. Polymer 2013, 54, 7048–7057. [Google Scholar] [CrossRef]
- Zhang, X.; Wen, H.; Wu, Y. Computational thermomechanical properties of silica–epoxy nanocomposites by molecular dynamic simulation. Polymers 2017, 9, 430. [Google Scholar] [CrossRef]
- Choi, J.; Yu, S.; Yang, S.; Cho, M. The glass transition and thermoelastic behavior of epoxy-based nanocomposites: A molecular dynamics study. Polymer 2011, 52, 5197–5203. [Google Scholar] [CrossRef]
- Chen, S.; Sun, S.; Steven, G.; Li, C.; Wang, X.; Hu, S. Molecular dynamics simulations of the interaction between carbon nanofiber and epoxy resin monomers. Acta Polym. Sin. 2015, 1158–1164. (In Chinese) [Google Scholar] [CrossRef]
- Zhu, R.; Pan, E.; Roy, A.K. Molecular dynamics study of the stress–strain behavior of carbon-nanotube reinforced epon 862 composites. Mater. Sci. Eng. A Struct. 2007, 447, 51–57. [Google Scholar] [CrossRef]
- Zheng, Y.; Chonung, K.; Wang, G.; Wei, P.; Jiang, P. Epoxy/nano-silica composites: Curing kinetics, glass transition temperatures, dielectric, and thermal-mechanical performances. J. Appl. Polym. Sci. 2009, 111, 917–927. [Google Scholar] [CrossRef]
- Li, W.; Feng, W.; Huang, H. High-performance epoxy resin/silica coated flake graphite composites for thermal conductivity and electrical insulation. J. Mater. Sci. Mater. Electron. 2016, 27, 6364–6370. [Google Scholar] [CrossRef]
- Hsieh, T.H.; Kinloch, A.J.; Masania, K.; Taylor, A.C.; Sprenger, S. The mechanisms and mechanics of the toughening of epoxy polymers modified with silica nanoparticles. Polymer 2010, 51, 6284–6294. [Google Scholar] [CrossRef] [Green Version]
- Liu, F.; Wang, Z.Q.; Liang, W.Y.; Qu, Y.W. Effect of nano-silica on flexural properties of epoxy resin. Adv. Mater. Res. 2011, 383–390, 3845–3848. [Google Scholar] [CrossRef]
- Lee, D.H.; Lee, N.; Park, H. Role of silica nanoparticle in multi-component epoxy composites for electrical insulation with high thermal conductivity. J. Am. Ceram. Soc. 2018, 101, 2450–2458. [Google Scholar] [CrossRef]
- Park, J.-J.; Lee, J.-Y. Effect of epoxy-modified silicone-treated micro-/nano-silicas on the electrical breakdown strength of epoxy/silica composites. IEEE Trans. Dielectr. Electr. Insul. 2017, 24, 3794–3800. [Google Scholar] [CrossRef]
- Li, Y.; Tian, M.; Lei, Z.; Zhang, J. Effect of nano-silica on dielectric properties and space charge behavior of epoxy resin under temperature gradient. J. Phys. D Appl. Phys. 2018, 51, 12530912. [Google Scholar] [CrossRef]
- He, J.M.; Huang, Y.D. Effect of silane-coupling agents on interfacial properties of CF/PI composites. J. Appl. Polym. Sci. 2007, 106, 2231–2237. [Google Scholar] [CrossRef]
- Zhang, X.; Chen, X.; Xiao, S.; Wen, H.; Wu, Y. Molecular Dynamics Simulation of Thermal-mechanical Properties of Modified SiO2 Reinforced Epoxy Resin. High Volt. Eng. 2018, 44, 740–749. (In Chinese) [Google Scholar] [CrossRef]
- Wu, C.; Xu, W. Atomistic molecular modelling of crosslinked epoxy resin. Polymer 2006, 47, 6004–6009. [Google Scholar] [CrossRef]
- Lu, Y.-Y.; Shu, Y.-J.; Liu, N.; Shu, Y.; Wang, K.; Wu, Z.-K.; Wang, X.-C.; Ding, X.-Y. Theoretical simulations on the glass transition temperatures and mechanical properties of modified glycidyl azide polymer. Comput. Mater. Sci. 2017, 139, 132–139. [Google Scholar] [CrossRef]
- Wei, Q.; Zhang, Y.; Wang, Y.; Yang, M. A molecular dynamic simulation method to elucidate the interaction mechanism of nano-SiO2 in polymer blends. J. Mater. Sci. 2017, 52, 12889–12901. [Google Scholar] [CrossRef]
- Huang, Y.Z.; Tian, Y.Z.; Li, Y.Y.; Tan, X.C.; Li, Q.; Cheng, J.; Zhang, J.Y. High mechanical properties of epoxy networks with dangling chains and tunable microphase separation structure. RSC Adv. 2017, 7, 49074–49082. [Google Scholar] [CrossRef] [Green Version]
- Kojio, K.; Furukawa, M.; Matsumura, S.; Motokucho, S.; Osajima, T.; Yoshinaga, K. The effect of cross-linking density and dangling chains on surface molecular mobility of network polyurethanes. Polym. Chem. UK 2012, 3, 2287–2292. [Google Scholar] [CrossRef]
- Asaad, J.; Gomaa, E.; Bishay, I.K. Free-volume properties of epoxy composites and its relation to macrostructure properties. Mater. Sci. Eng. A Struct. 2008, 490, 151–156. [Google Scholar] [CrossRef]
- Zhang, W.; Qing, Y.; Zhong, W.; Sui, G.; Yang, X. Mechanism of modulus improvement for epoxy resin matrices: A molecular dynamics simulation. React. Funct. Polym. 2017, 111, 60–67. [Google Scholar] [CrossRef]
- Wang, Y.-H.; Wang, W.-H.; Zhang, Z.; Xu, L.; Li, P. Study of the glass transition temperature and the mechanical properties of pet/modified silica nanocomposite by molecular dynamics simulation. Eur. Polym. J. 2016, 75, 36–45. [Google Scholar] [CrossRef]
- Chinkanjanarot, S.; Radue, M.S.; Gowtham, S.; Tomasi, J.M.; Klimek-McDonald, D.R.; King, J.A.; Odegard, G.M. Multiscale thermal modeling of cured cycloaliphatic epoxy/carbon fiber composites. J. Appl. Polym. Sci. 2018, 135. [Google Scholar] [CrossRef]
- Xue, Q.; Lv, C.; Shan, M.; Zhang, H.; Ling, C.; Zhou, X.; Jiao, Z. Glass transition temperature of functionalized graphene–polymer composites. Comput. Mater. Sci. 2013, 71, 66–71. [Google Scholar] [CrossRef]
- Lin, S.; Huang, Y.; Xie, D.; Min, D.; Wang, W.; Yang, L.; Li, S. Molecular relaxation and glass transition properties of epoxy resin at high temperature. Acta Phys. Sin. 2016, 65, 304–310. (In Chinese) [Google Scholar] [CrossRef]
- Shokuhfar, A.; Arab, B. The effect of cross linking density on the mechanical properties and structure of the epoxy polymers: Molecular dynamics simulation. J. Mol. Model. 2013, 19, 3719–3731. [Google Scholar] [CrossRef] [PubMed]


| Particle Size of SiO2 | Molecular Number of | Atomic Number | ||
|---|---|---|---|---|
| (Å) | DGEBA | MTHPA | DGEBA-MTHPA | |
| none | 40 | 90 | 10 | 4650 |
| 6.5 | 40 | 90 | 10 | 4838 |
| 7.6 | 65 | 146 | 16 | 7823 |
| 8.8 | 88 | 199 | 23 | 10,708 |
| 10 | 124 | 288 | 40 | 15,830 |
| Particle Size (Å) | Tg by Fitting Method (K) | Tg by MSD Curve Method (K) |
|---|---|---|
| 6.5 | 408.23 | 400–410 |
| 7.6 | 397.55 | 390–400 |
| 8.8 | 395.93 | 390–400 |
| 10 | 387.39 | 380–390 |
| Pure | 382.68 | 380–390 |
© 2018 by the authors. Licensee MDPI, Basel, Switzerland. This article is an open access article distributed under the terms and conditions of the Creative Commons Attribution (CC BY) license (http://creativecommons.org/licenses/by/4.0/).
Share and Cite
Xie, Q.; Fu, K.; Liang, S.; Liu, B.; Lu, L.; Yang, X.; Huang, Z.; Lü, F. Micro-Structure and Thermomechanical Properties of Crosslinked Epoxy Composite Modified by Nano-SiO2: A Molecular Dynamics Simulation. Polymers 2018, 10, 801. https://doi.org/10.3390/polym10070801
Xie Q, Fu K, Liang S, Liu B, Lu L, Yang X, Huang Z, Lü F. Micro-Structure and Thermomechanical Properties of Crosslinked Epoxy Composite Modified by Nano-SiO2: A Molecular Dynamics Simulation. Polymers. 2018; 10(7):801. https://doi.org/10.3390/polym10070801
Chicago/Turabian StyleXie, Qing, Kexin Fu, Shaodong Liang, Bowen Liu, Lu Lu, Xueming Yang, Zhengyong Huang, and Fangcheng Lü. 2018. "Micro-Structure and Thermomechanical Properties of Crosslinked Epoxy Composite Modified by Nano-SiO2: A Molecular Dynamics Simulation" Polymers 10, no. 7: 801. https://doi.org/10.3390/polym10070801