FluoroTome 1: An Apparatus for Tomographic Imaging of Radio-Fluorogenic (RFG) Gels

Abstract
:
1. Introduction
2. Historical Background
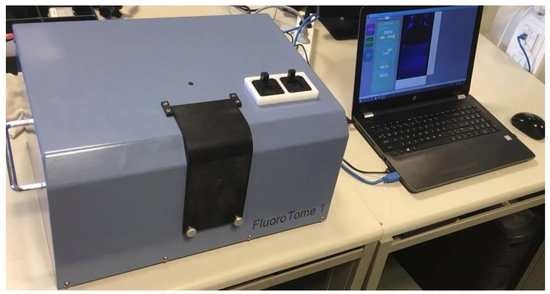
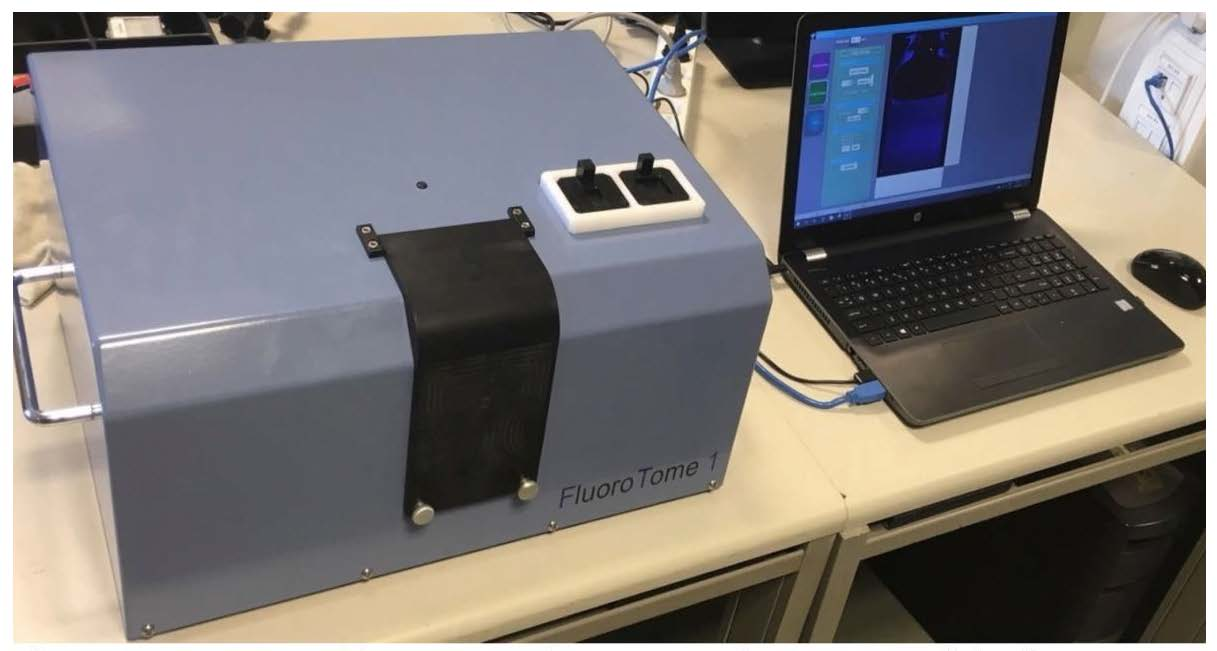
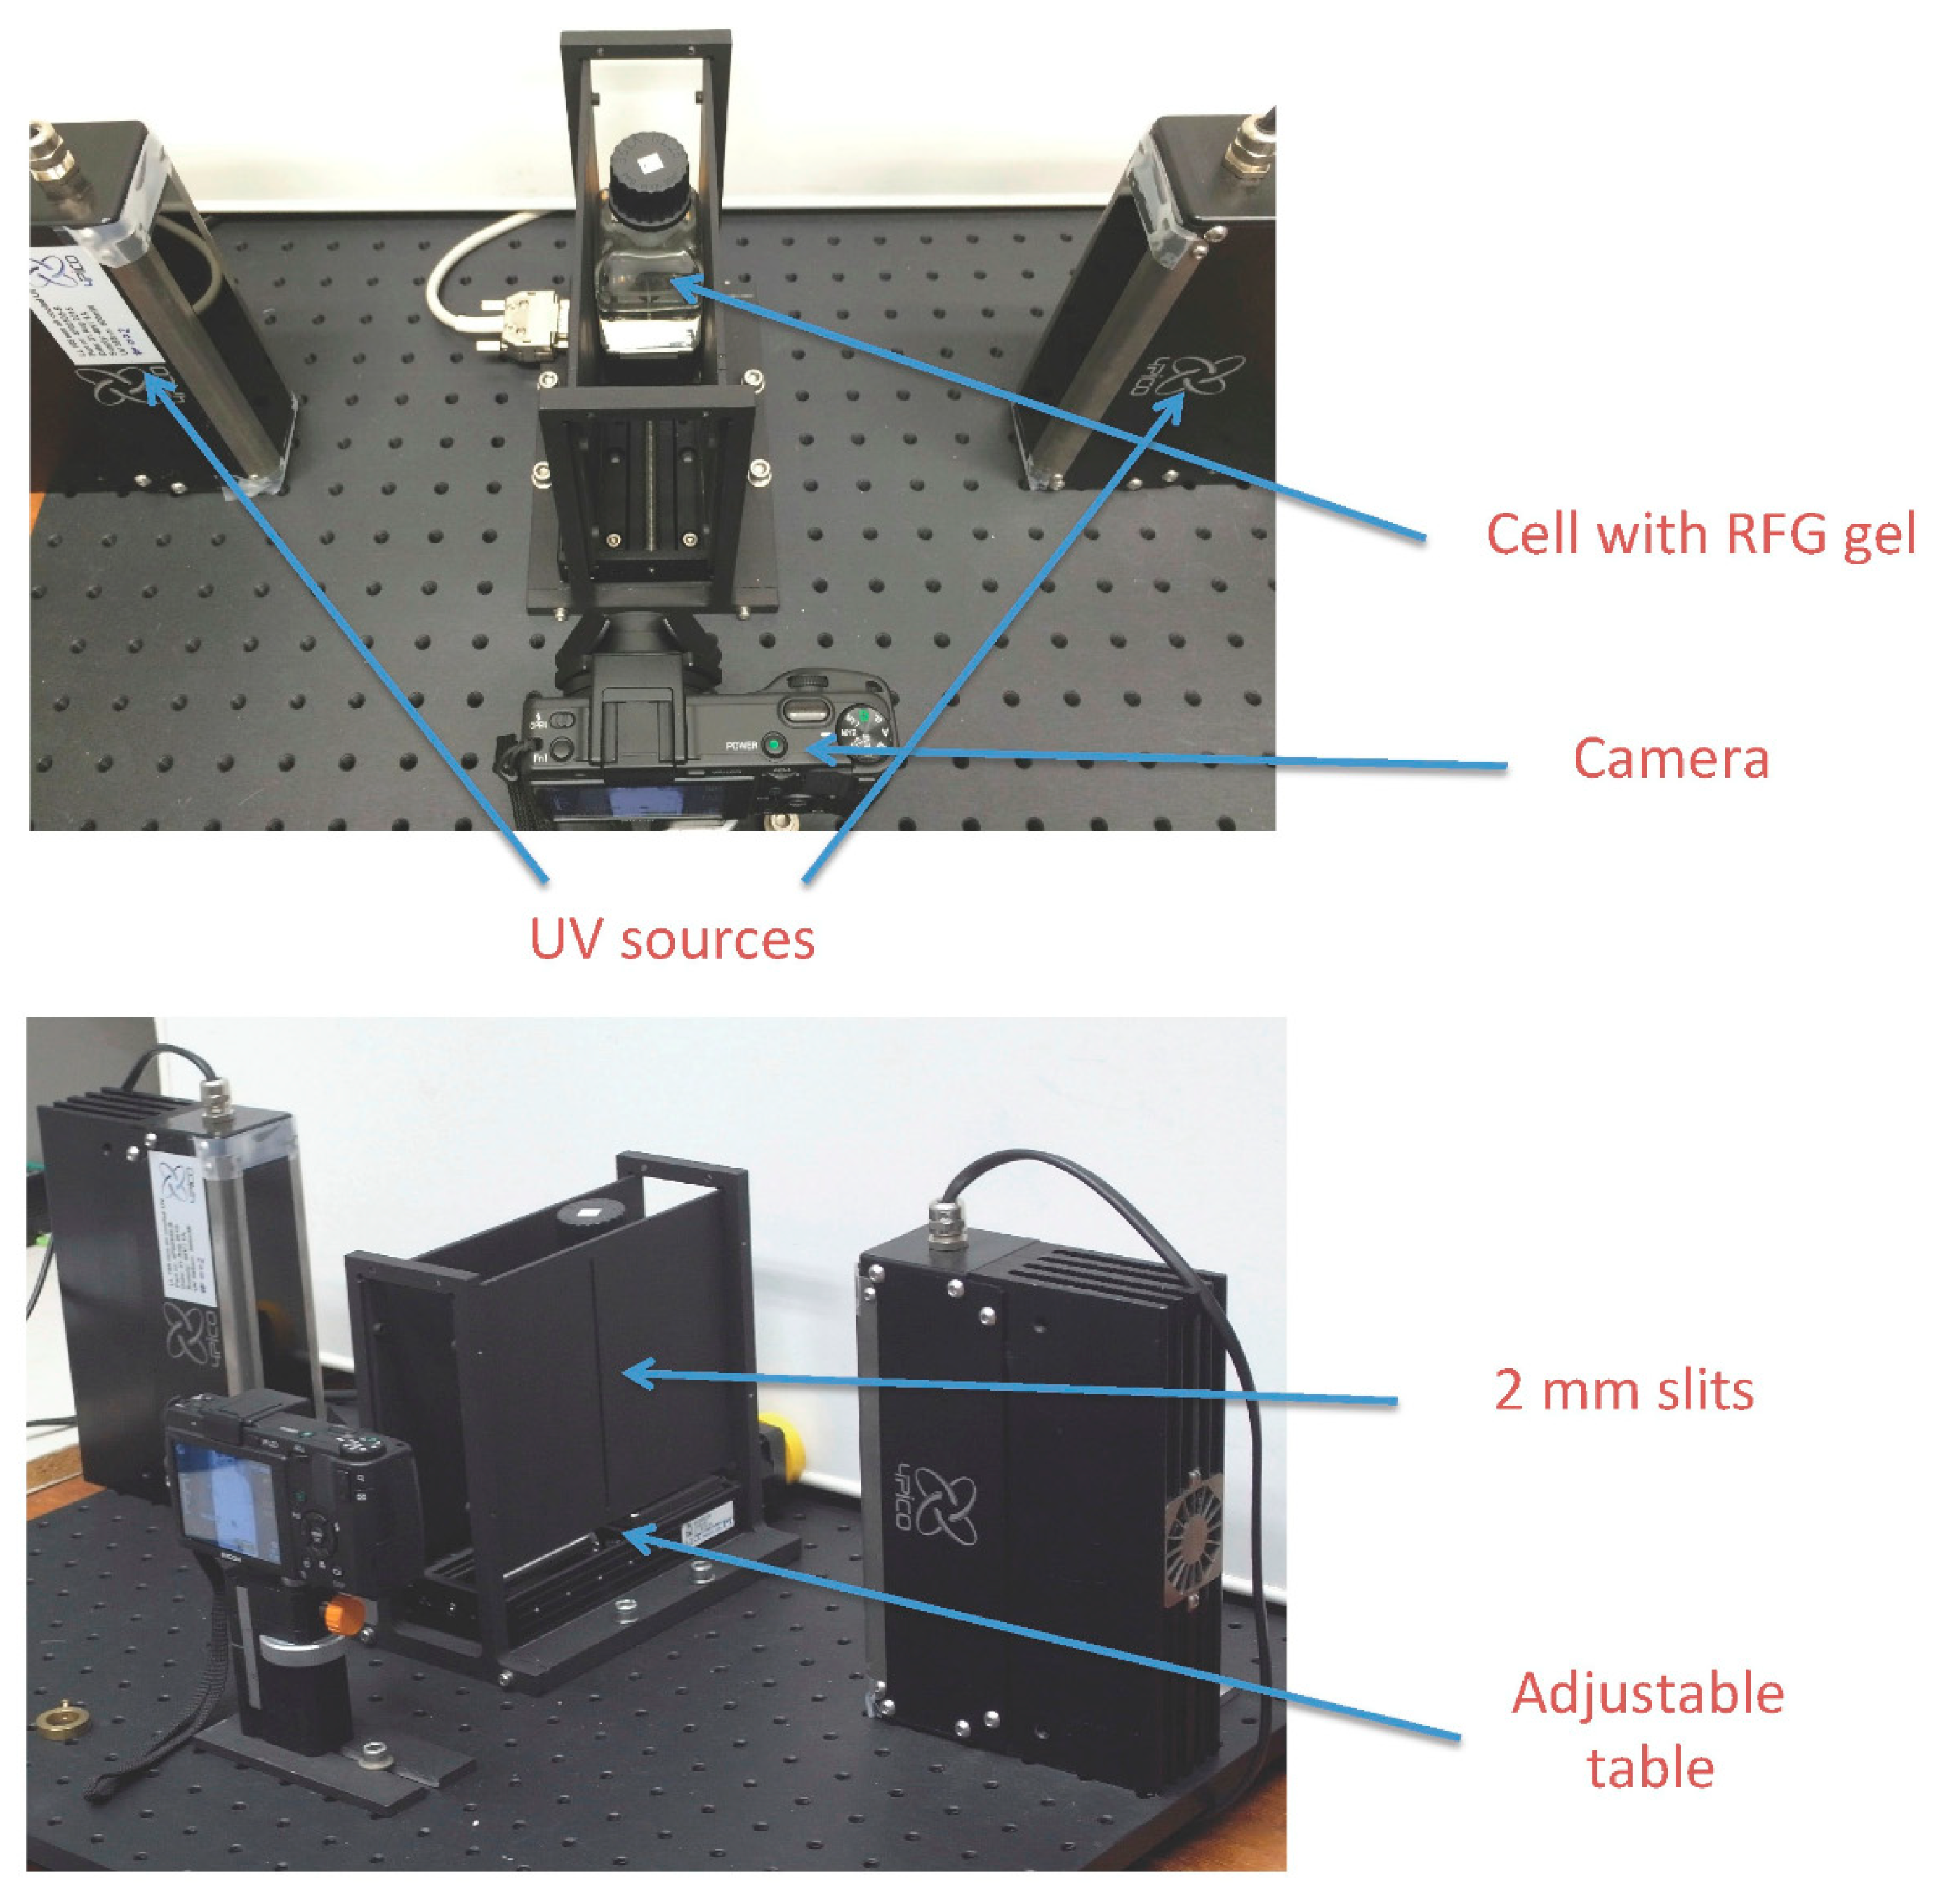
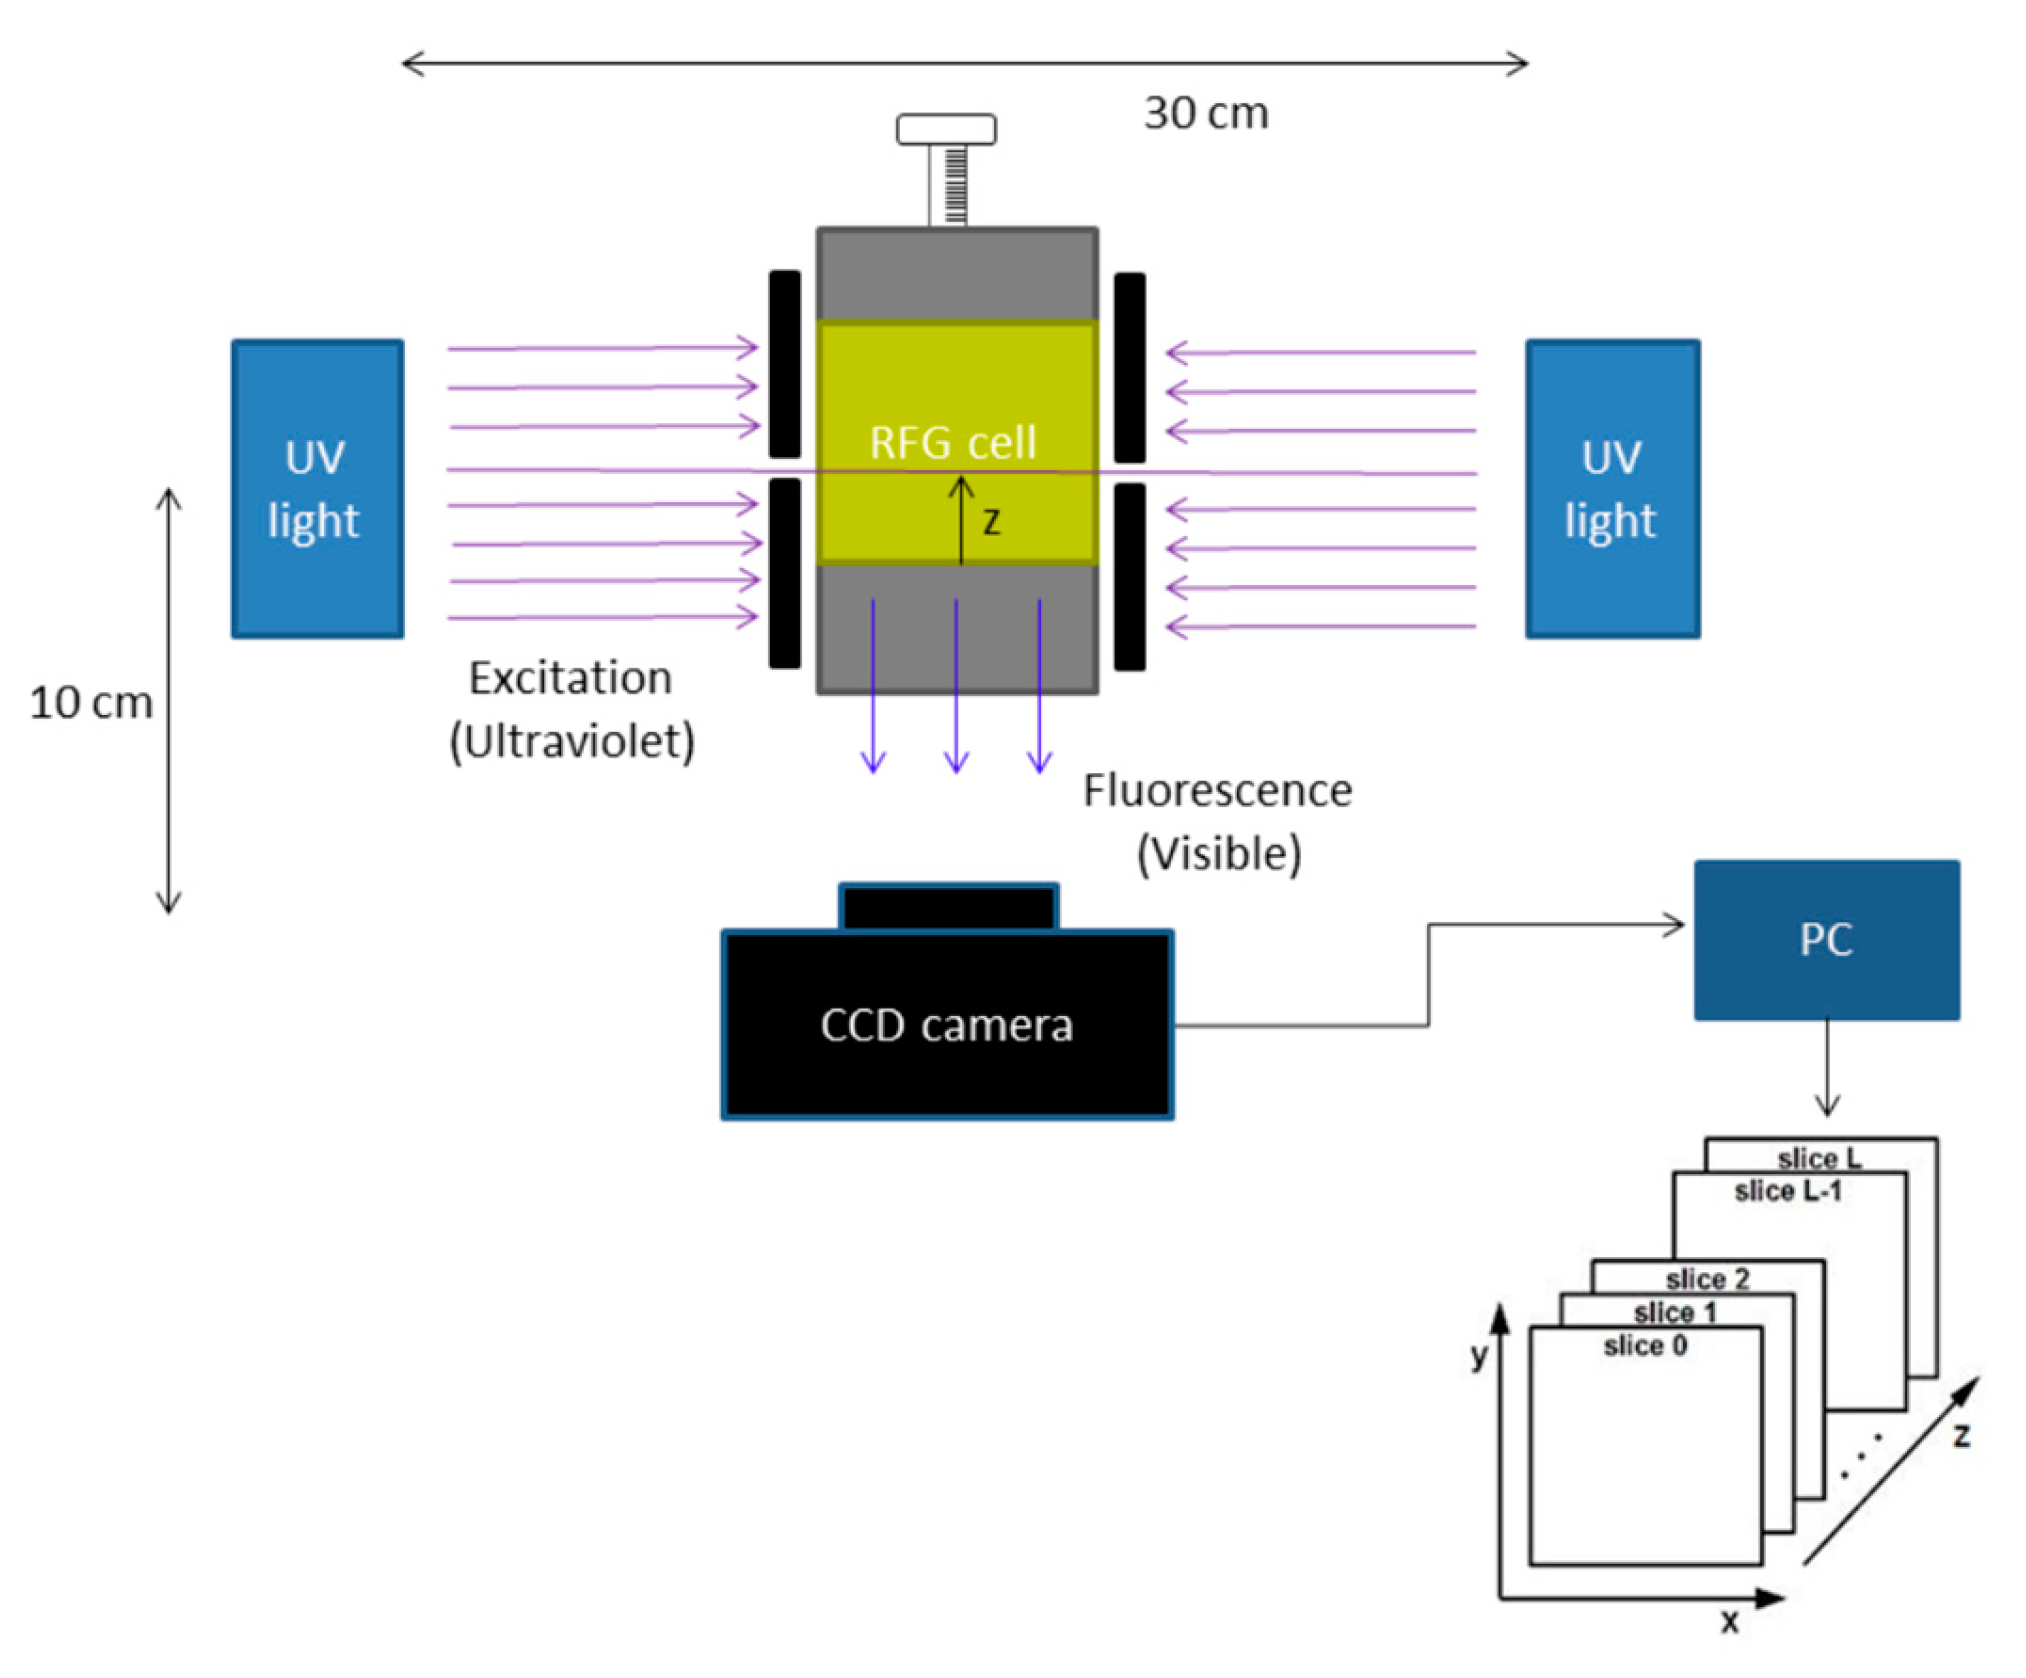
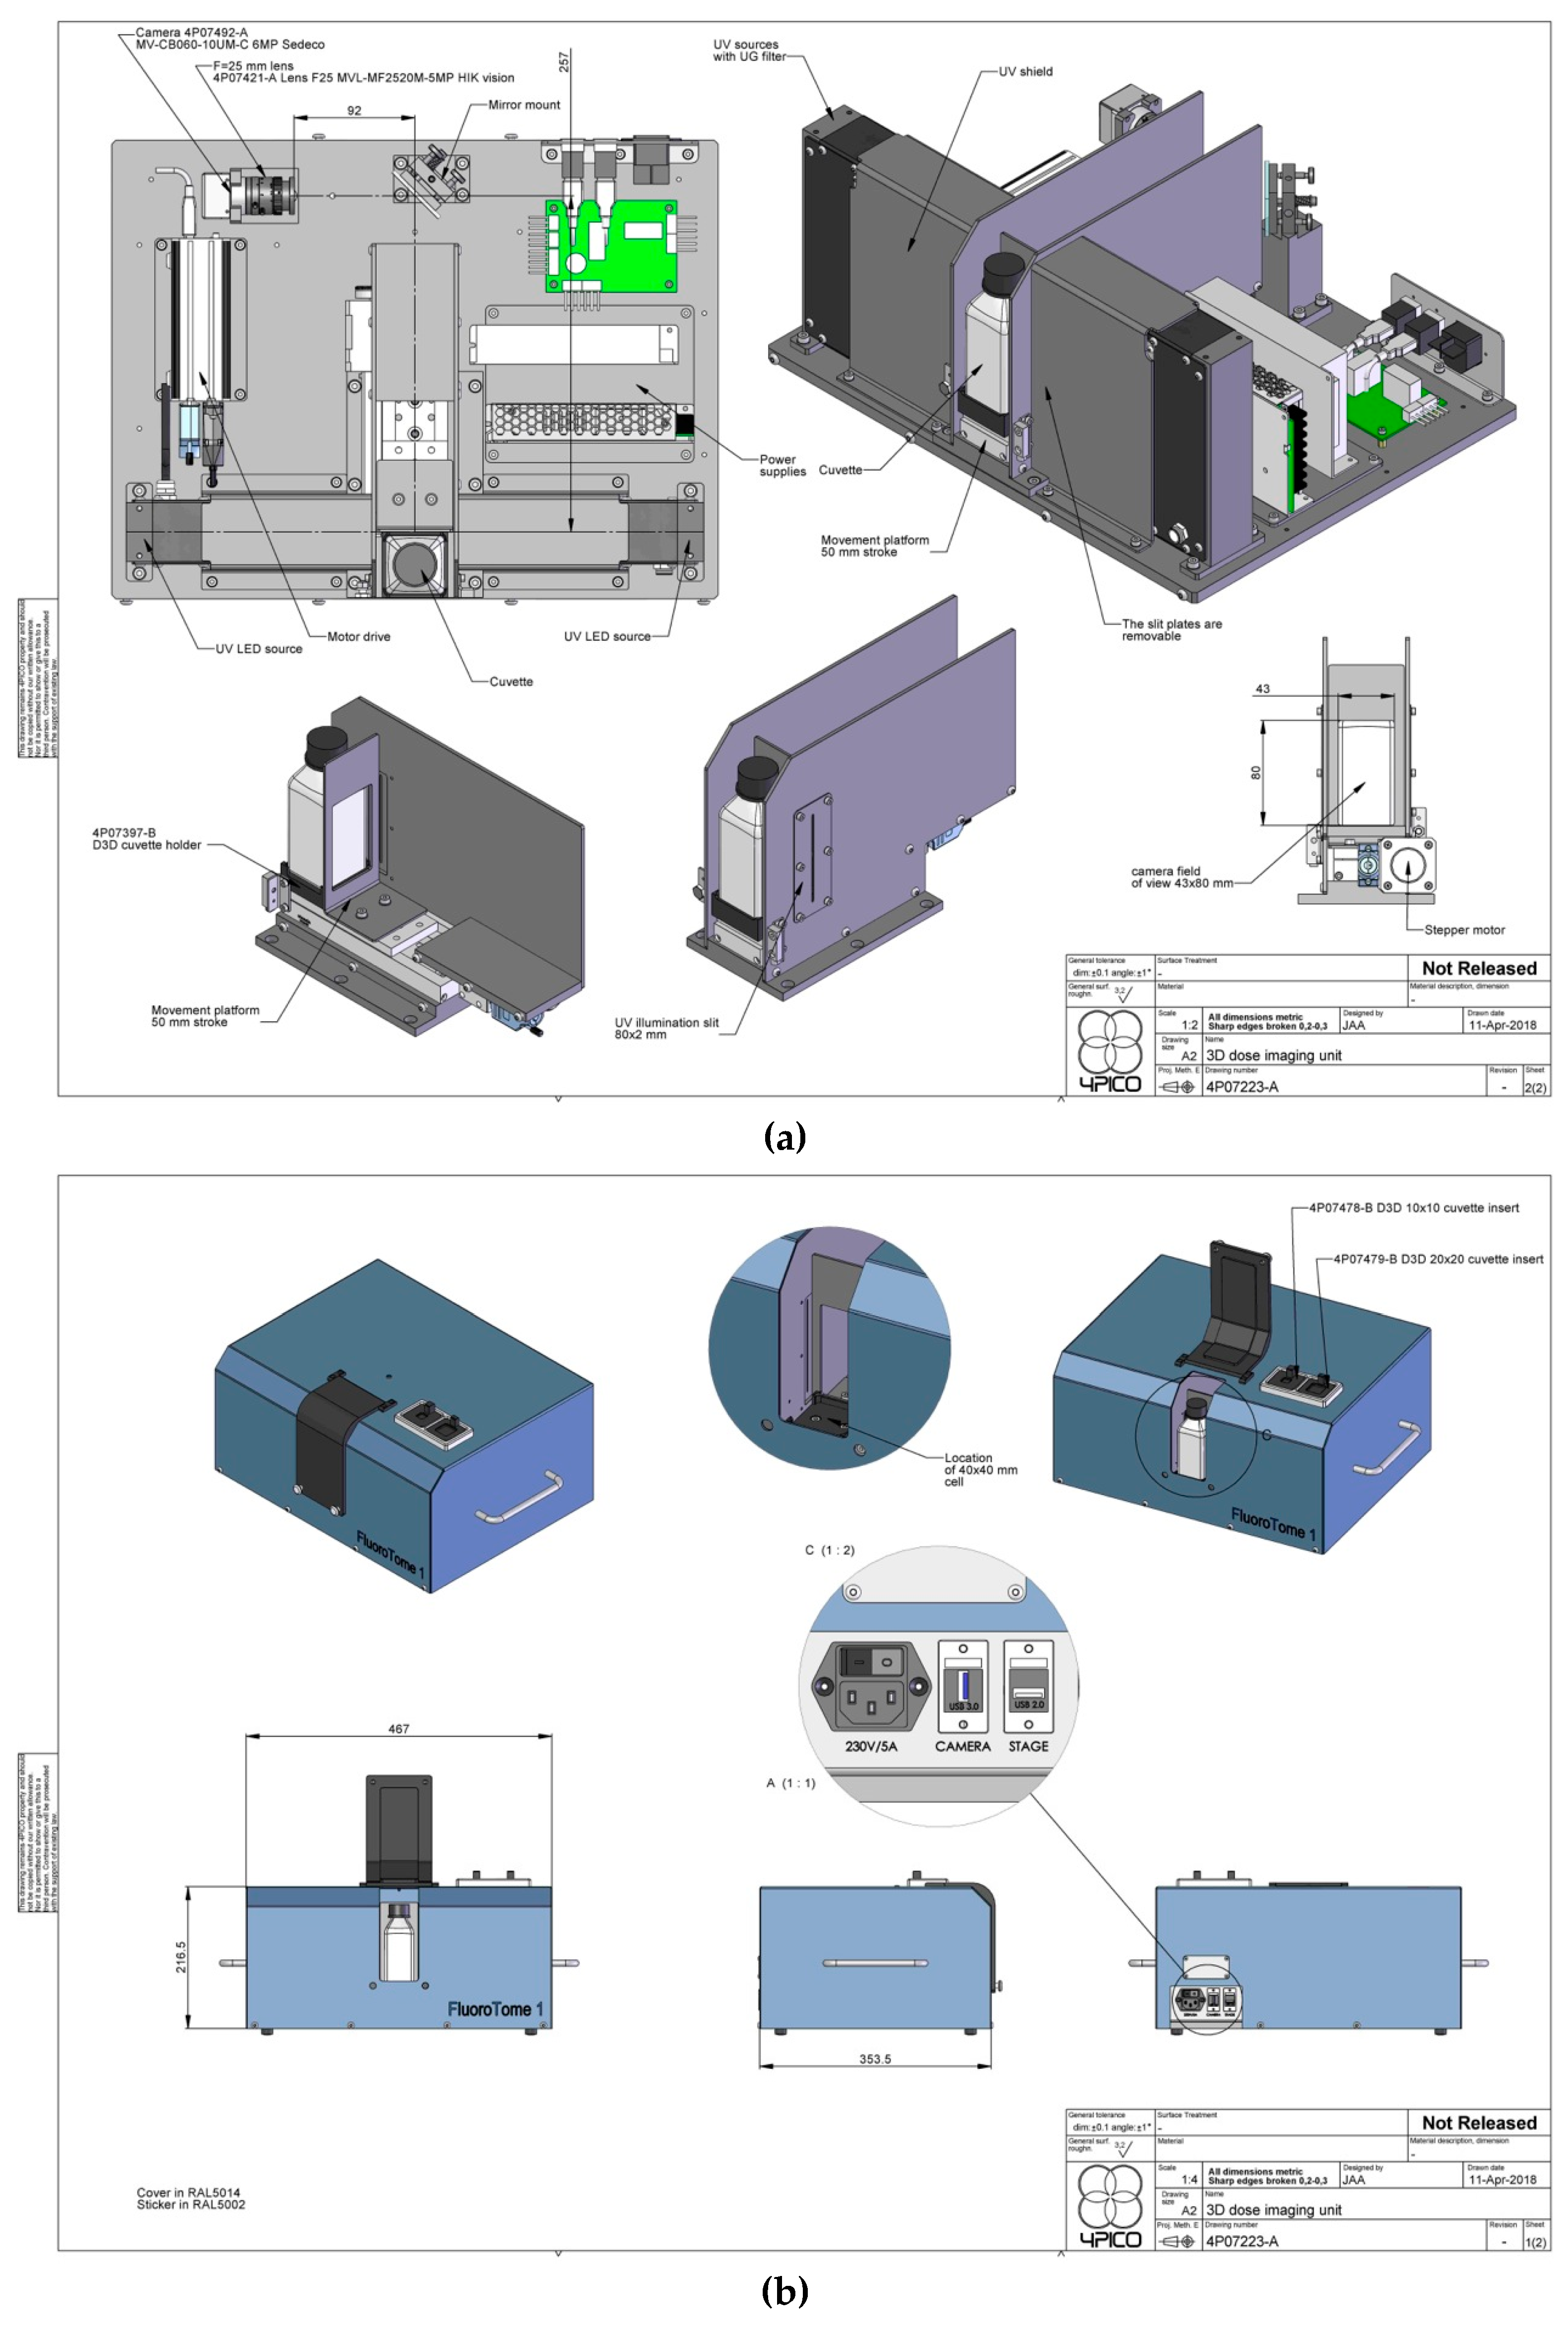
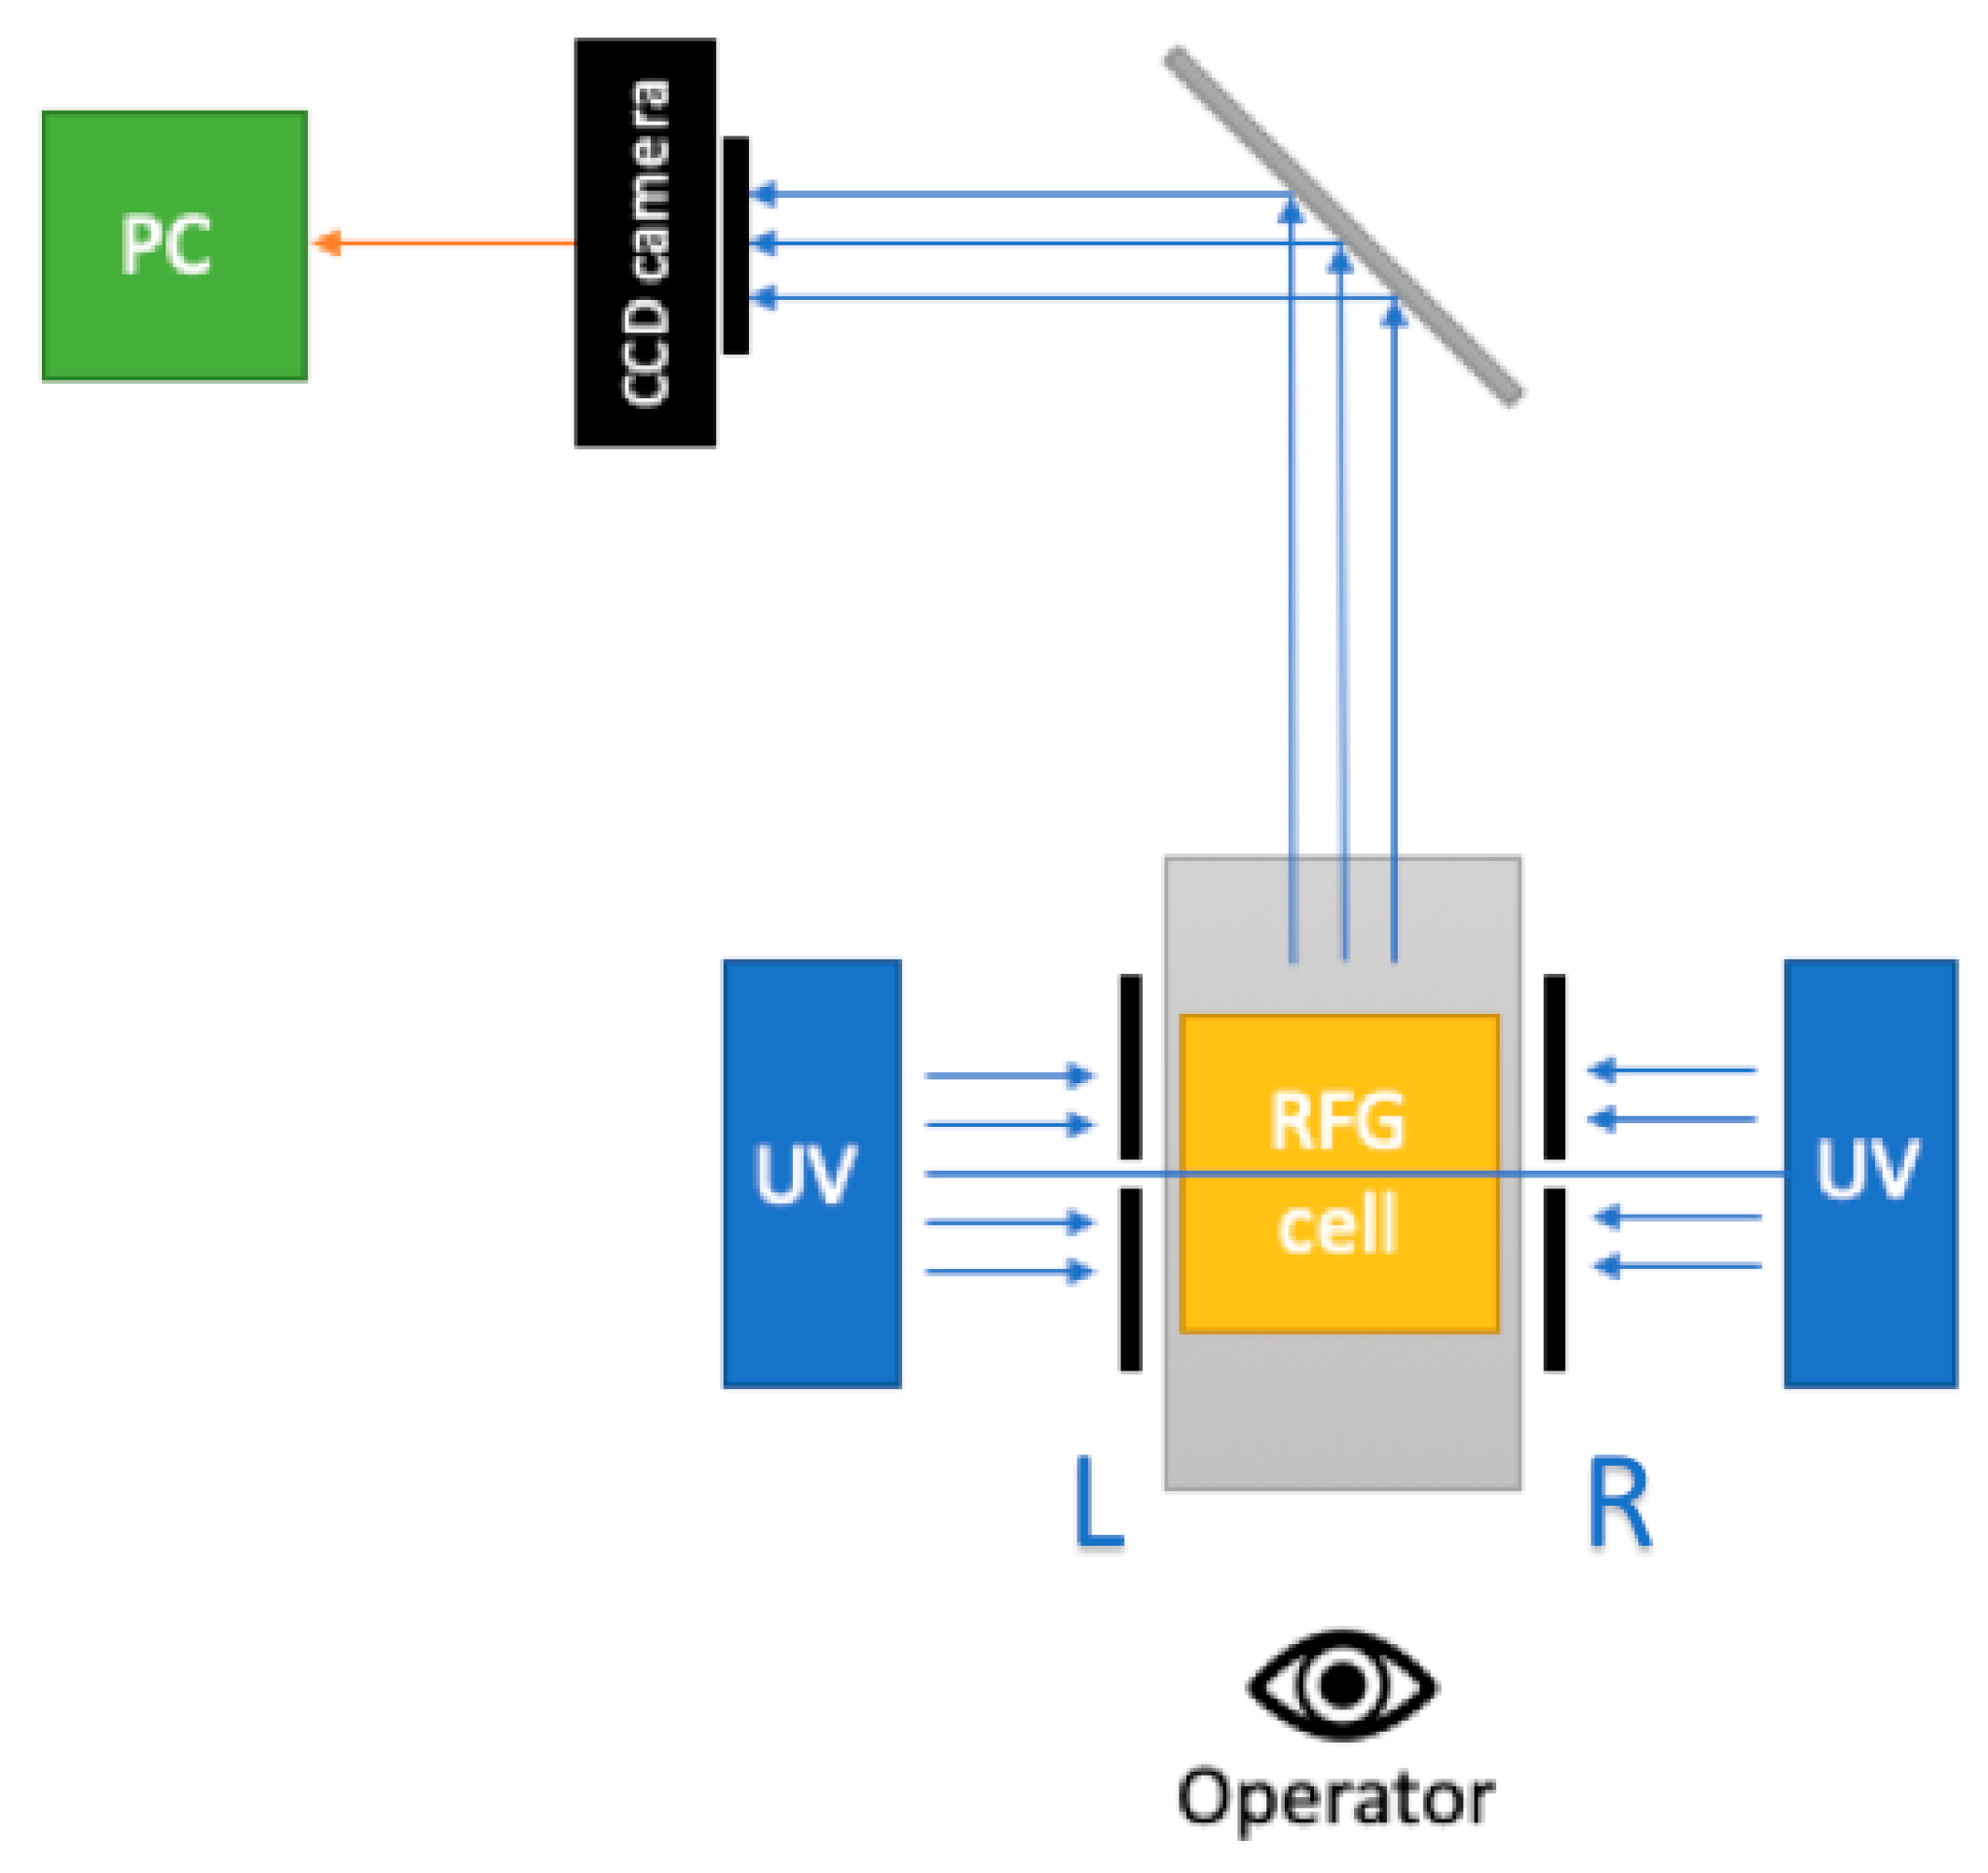
3. The FluoroTome 1 Apparatus
4. Test Procedures
4.1. UV Excitation
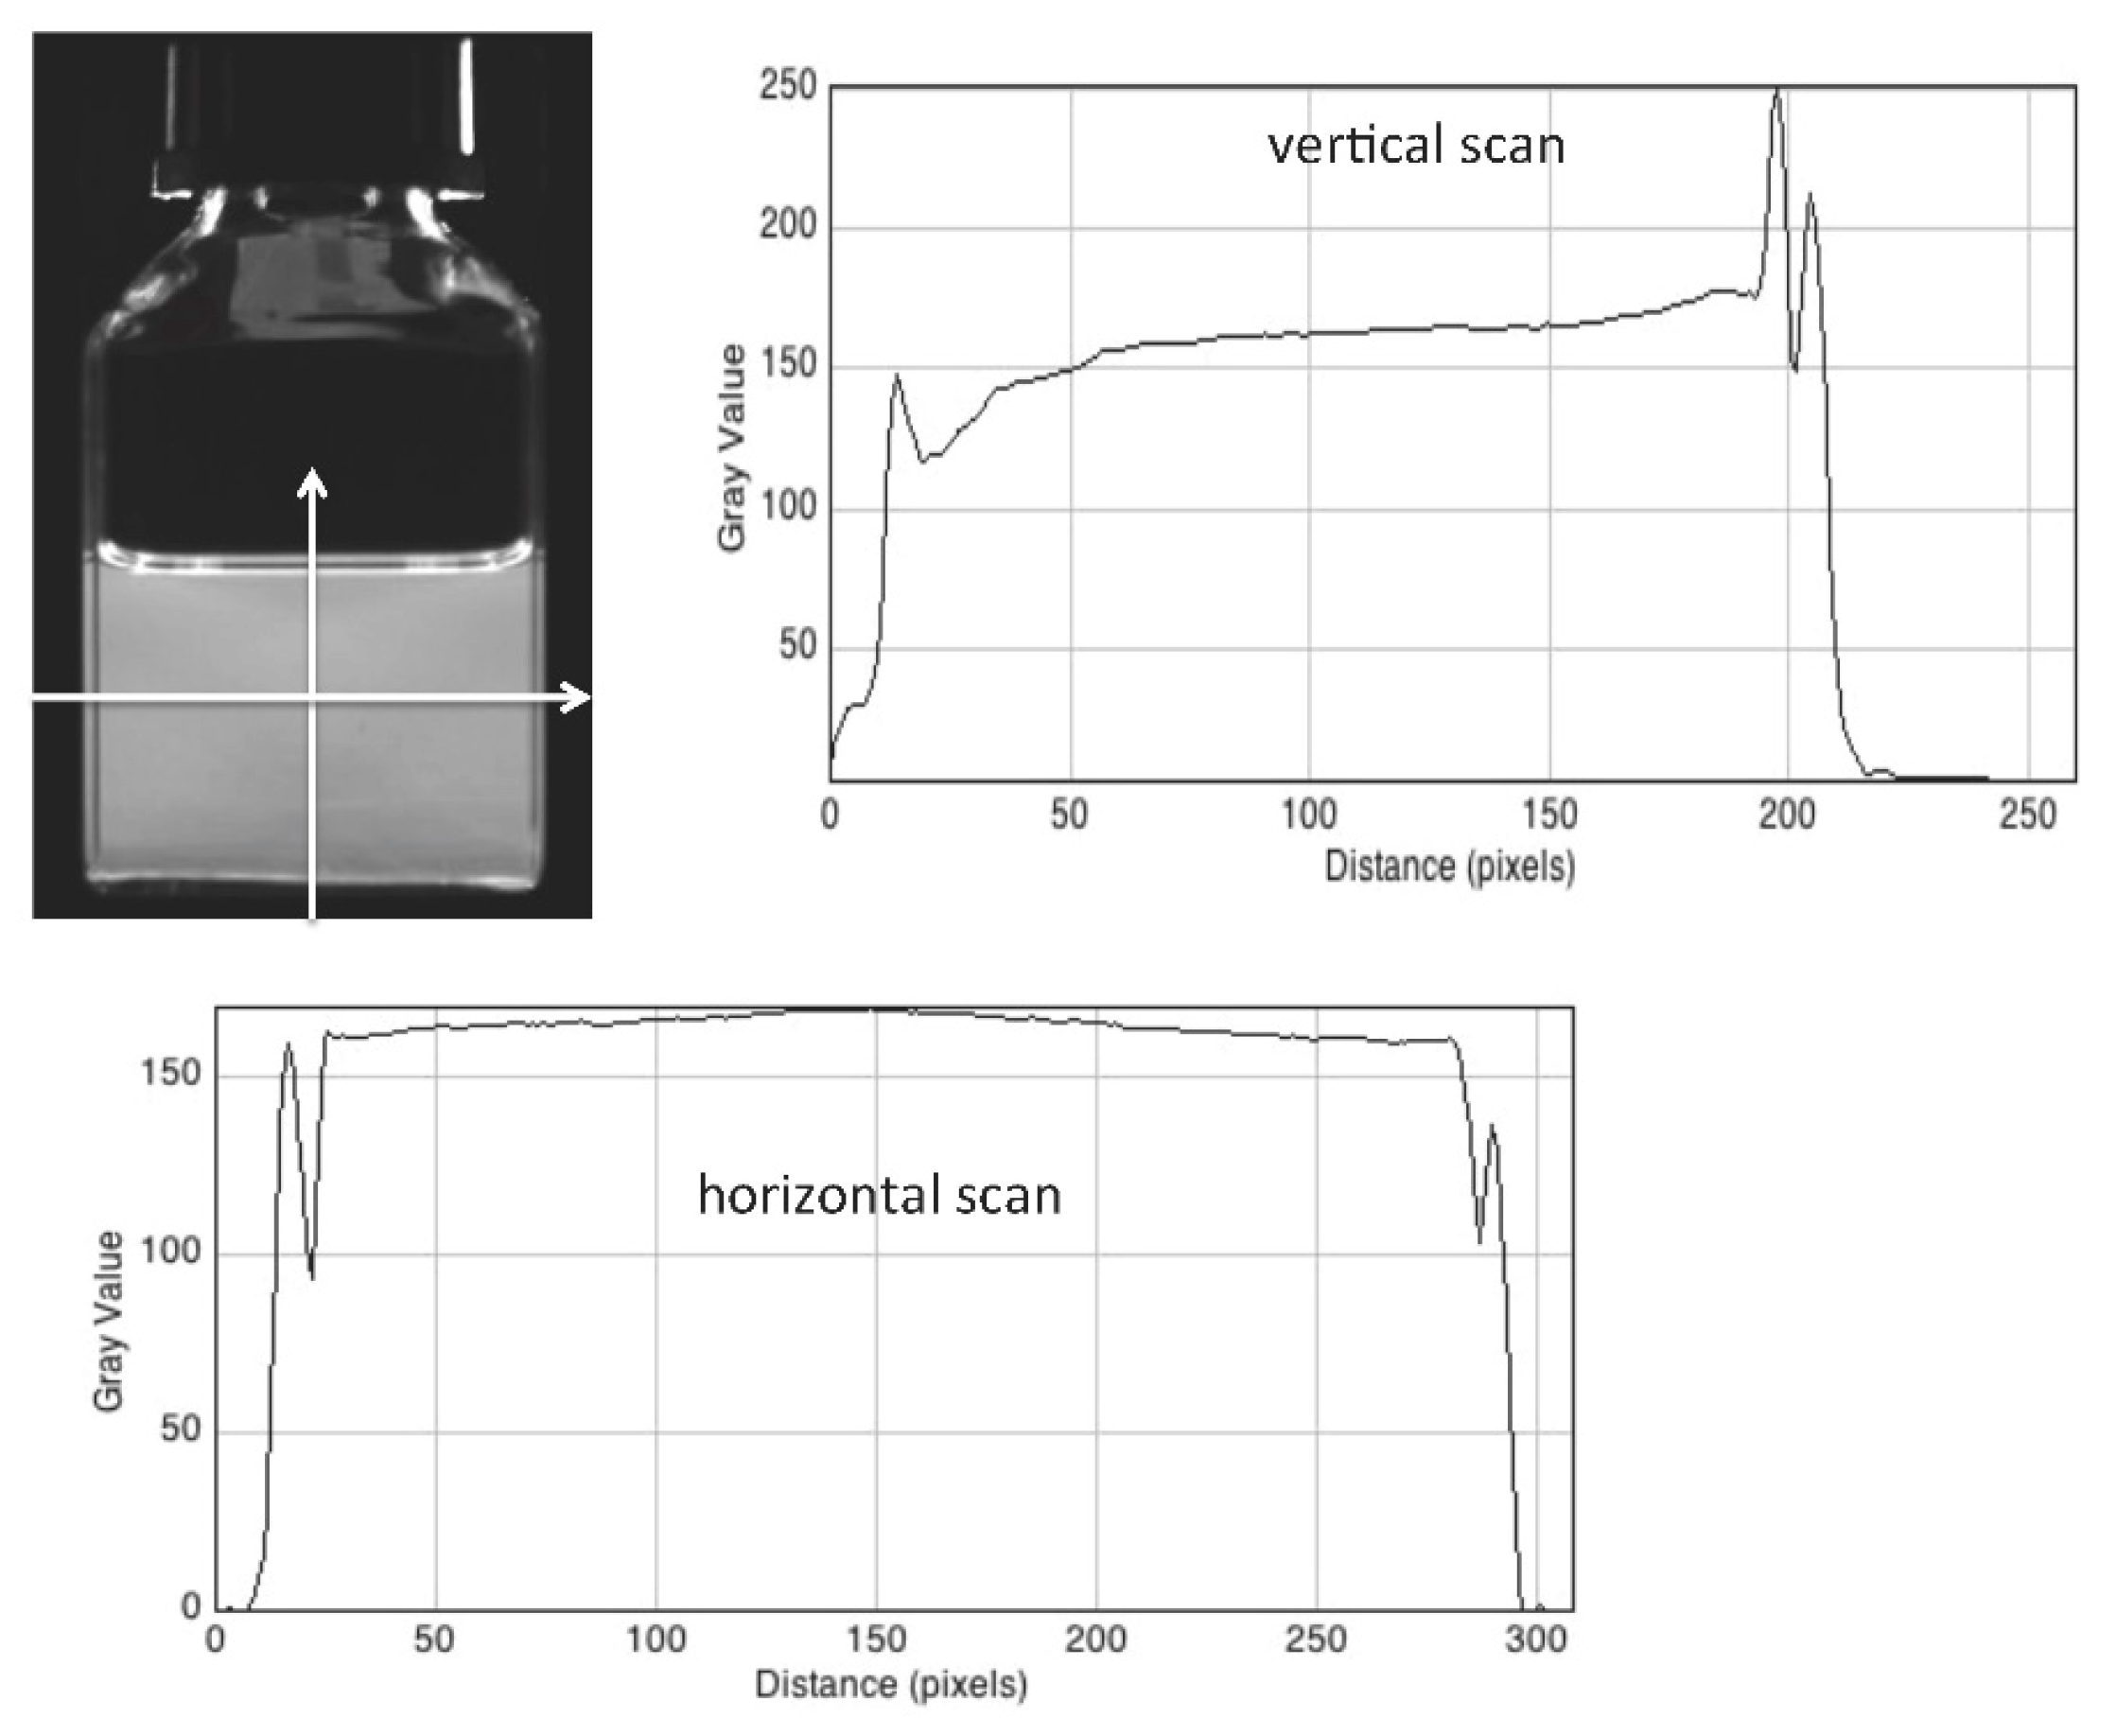
4.2. Fluorescence Detection
4.3. The Translation Stage
5. Preliminary, Irradiated RFG Gel Measurements
6. Conclusions
- (1)
- producing a thin sheet of uniform ultraviolet light.
- (2)
- transporting a liquid or gel medium through this UV sheet using a remote control translation stage over a distance of at least 50 mm.
- (3)
- making multiple digital photographic images of the fluorescence of an irradiated medium produced by the UV excitation as the sheet is scanned through the medium.
- (4)
- having a light-tight encasement; no darkroom requirement.
- (5)
- being readily portable and transportable with no special local facilities required.
- (6)
- capable of preliminary data processing on-site, within minutes of radiation exposure of a gel medium.
- (7)
- having a user-friendly software interface.
Supplementary Materials
Author Contributions
Funding
Conflicts of Interest
References
- Ibott, G. 9th International Conference on 3D Radiation Dosimetry. J. Phys. Conf. Ser. 2017, 847, 011001. [Google Scholar] [CrossRef] [Green Version]
- Pasler, M.; Hernandez, V.; Jornet, N.; Clark, C.H. Novel methodologies for dosimetry audits: Adapting to advanced radiotherapy techniques. Phys. Imaging Radiat. Oncol. 2018, 5, 76–84. [Google Scholar] [CrossRef] [Green Version]
- Watanabe, Y.; Warmington, L.; Gopishankar, N. Three-dimensional radiation dosimetry using polymer gel and solid radiochromic polymer: From basics to clinical applications. World J. Radiol. 2017, 9, 112–125. [Google Scholar] [CrossRef] [PubMed]
- Kron, T.; Lehmann, J.; Greer, P. Dosimetry of ionising radiation in modern radiation oncology. Phys. Med. Biol. 2016, 61, R167–R205. [Google Scholar] [CrossRef] [PubMed] [Green Version]
- Baldock, C.; De Deene, Y.; Doran, S.; Ibbott, G.; Jirasek, A.; Lepage, M.; McAuley, K.B.; Oldham, M.; Schreiner, L.J. Polymer gel dosimetry. Phys. Med. Biol. 2010, 55, R1–R63. [Google Scholar] [CrossRef] [PubMed]
- Warman, J.M.; de Haas, M.P.; Luthjens, L.H.; Denkova, A.G.; Yao, T. A radio-fluorogenic polymer-gel makes fixed fluorescent images of complex radiation fields. Polymers 2018, 10, 685. [Google Scholar] [CrossRef] [PubMed]
- Yao, T.; Gasparini, A.; De Haas, M.P.; Luthjens, L.H.; Denkova, A.G.; Warman, J.M. A tomographic UV-sheet scanning technique for producing 3D fluorescence images of x-ray beams in a radio-fluorogenic gel. Biomed. Phys. Eng. Express 2017, 3, 027004. [Google Scholar] [CrossRef] [Green Version]
- Luthjens, L.H.; Yao, T.; Warman, J.M. A polymer-gel eye-phantom for 3D fluorescent imaging of millimetre radiation beams. Polymers 2018, 10, 1195. [Google Scholar] [CrossRef] [PubMed]
- Warman, J.M.; Luthjens, L.H.; De Haas, M.P. High-energy radiation monitoring based on radio-fluorogenic co-polymerization. II: Fixed fluorescent images of collimated X-ray beams using an RFCP gel. Phys. Med. Biol. 2011, 56, 1487–1508. [Google Scholar] [CrossRef] [PubMed]
- Warman, J.M.; De Haas, M.P.; Luthjens, L.H.; Denkova, A.G.; Kavatsyuk, O.; Van Goethem, M.-J.; Kiewiet, H.H.; Brandenburg, S. Fixed fluorescent images of an 80 MeV proton pencil beam. Radiat. Phys. Chem. 2013, 85, 179–181. [Google Scholar] [CrossRef]
- Rasband, W.S. 1997–2009 ImageJ; US National Institutes of Health: Bethesda, MD, USA, 2008. Available online: http://rsb.info.nih.gov/ij/ (accessed on 17 September 2019).
- Yao, T. 3D Radiation Dosimetry Using a Radio-Fluorogenic Gel. Ph.D. Thesis, Technische Universiteit Delft, Delft, The Netherlands, 16 January 2017. [Google Scholar]
- Hubbel, J.H.; Seltzer, S.M. Tables of X-Ray Mass Attenuation Coefficients and Mass Energy-Absorption Coefficients from 1 keV to 20 MeV for Elements Z = 1 to 92 and 48 Additional Substances of Dosimetric Interest; No. PB-95-220539/XAB; National Inst. of Standards: Gaithersburg, MD, USA, 2004. [Google Scholar]
- Maeyama, T.; Shinnosuke, H. Nanoclay gel-based radio-fluorogenic gel dosimeters using various fluorescence probes. Radiat. Phys. Chem. 2018, 151, 42–46. [Google Scholar] [CrossRef]
- Sandwall, P.A.; Bastow, B.P.; Spitz, H.B.; Elson, H.R.; Lamba, M.; Connick, W.B.; Fenichel, H. Radio-fluorogenic gel dosimetry with coumarin. Bioengineering 2018, 5, 53. [Google Scholar] [CrossRef] [PubMed]


| Probe Height (mm) | Intensity (mW/cm2) | ||
|---|---|---|---|
| Left | Right | Mean | |
| 20 | 10.2 | 9.6 | 9.9 |
| 30 | 11.2 | 10.5 | 10.9 |
| 40 | 11.0 | 10.4 | 10.7 |
| 50 | 11.2 | 10.9 | 11.1 |
| 60 | 11.5 | 11.0 | 11.3 |
| 70 | 11.1 | 11.0 | 11.1 |
| 80 | 11.1 | 11.0 | 11.1 |
| 90 | 10.4 | 11.2 | 10.8 |
| 100 | 3.0 | 6.5 | 4.8 |
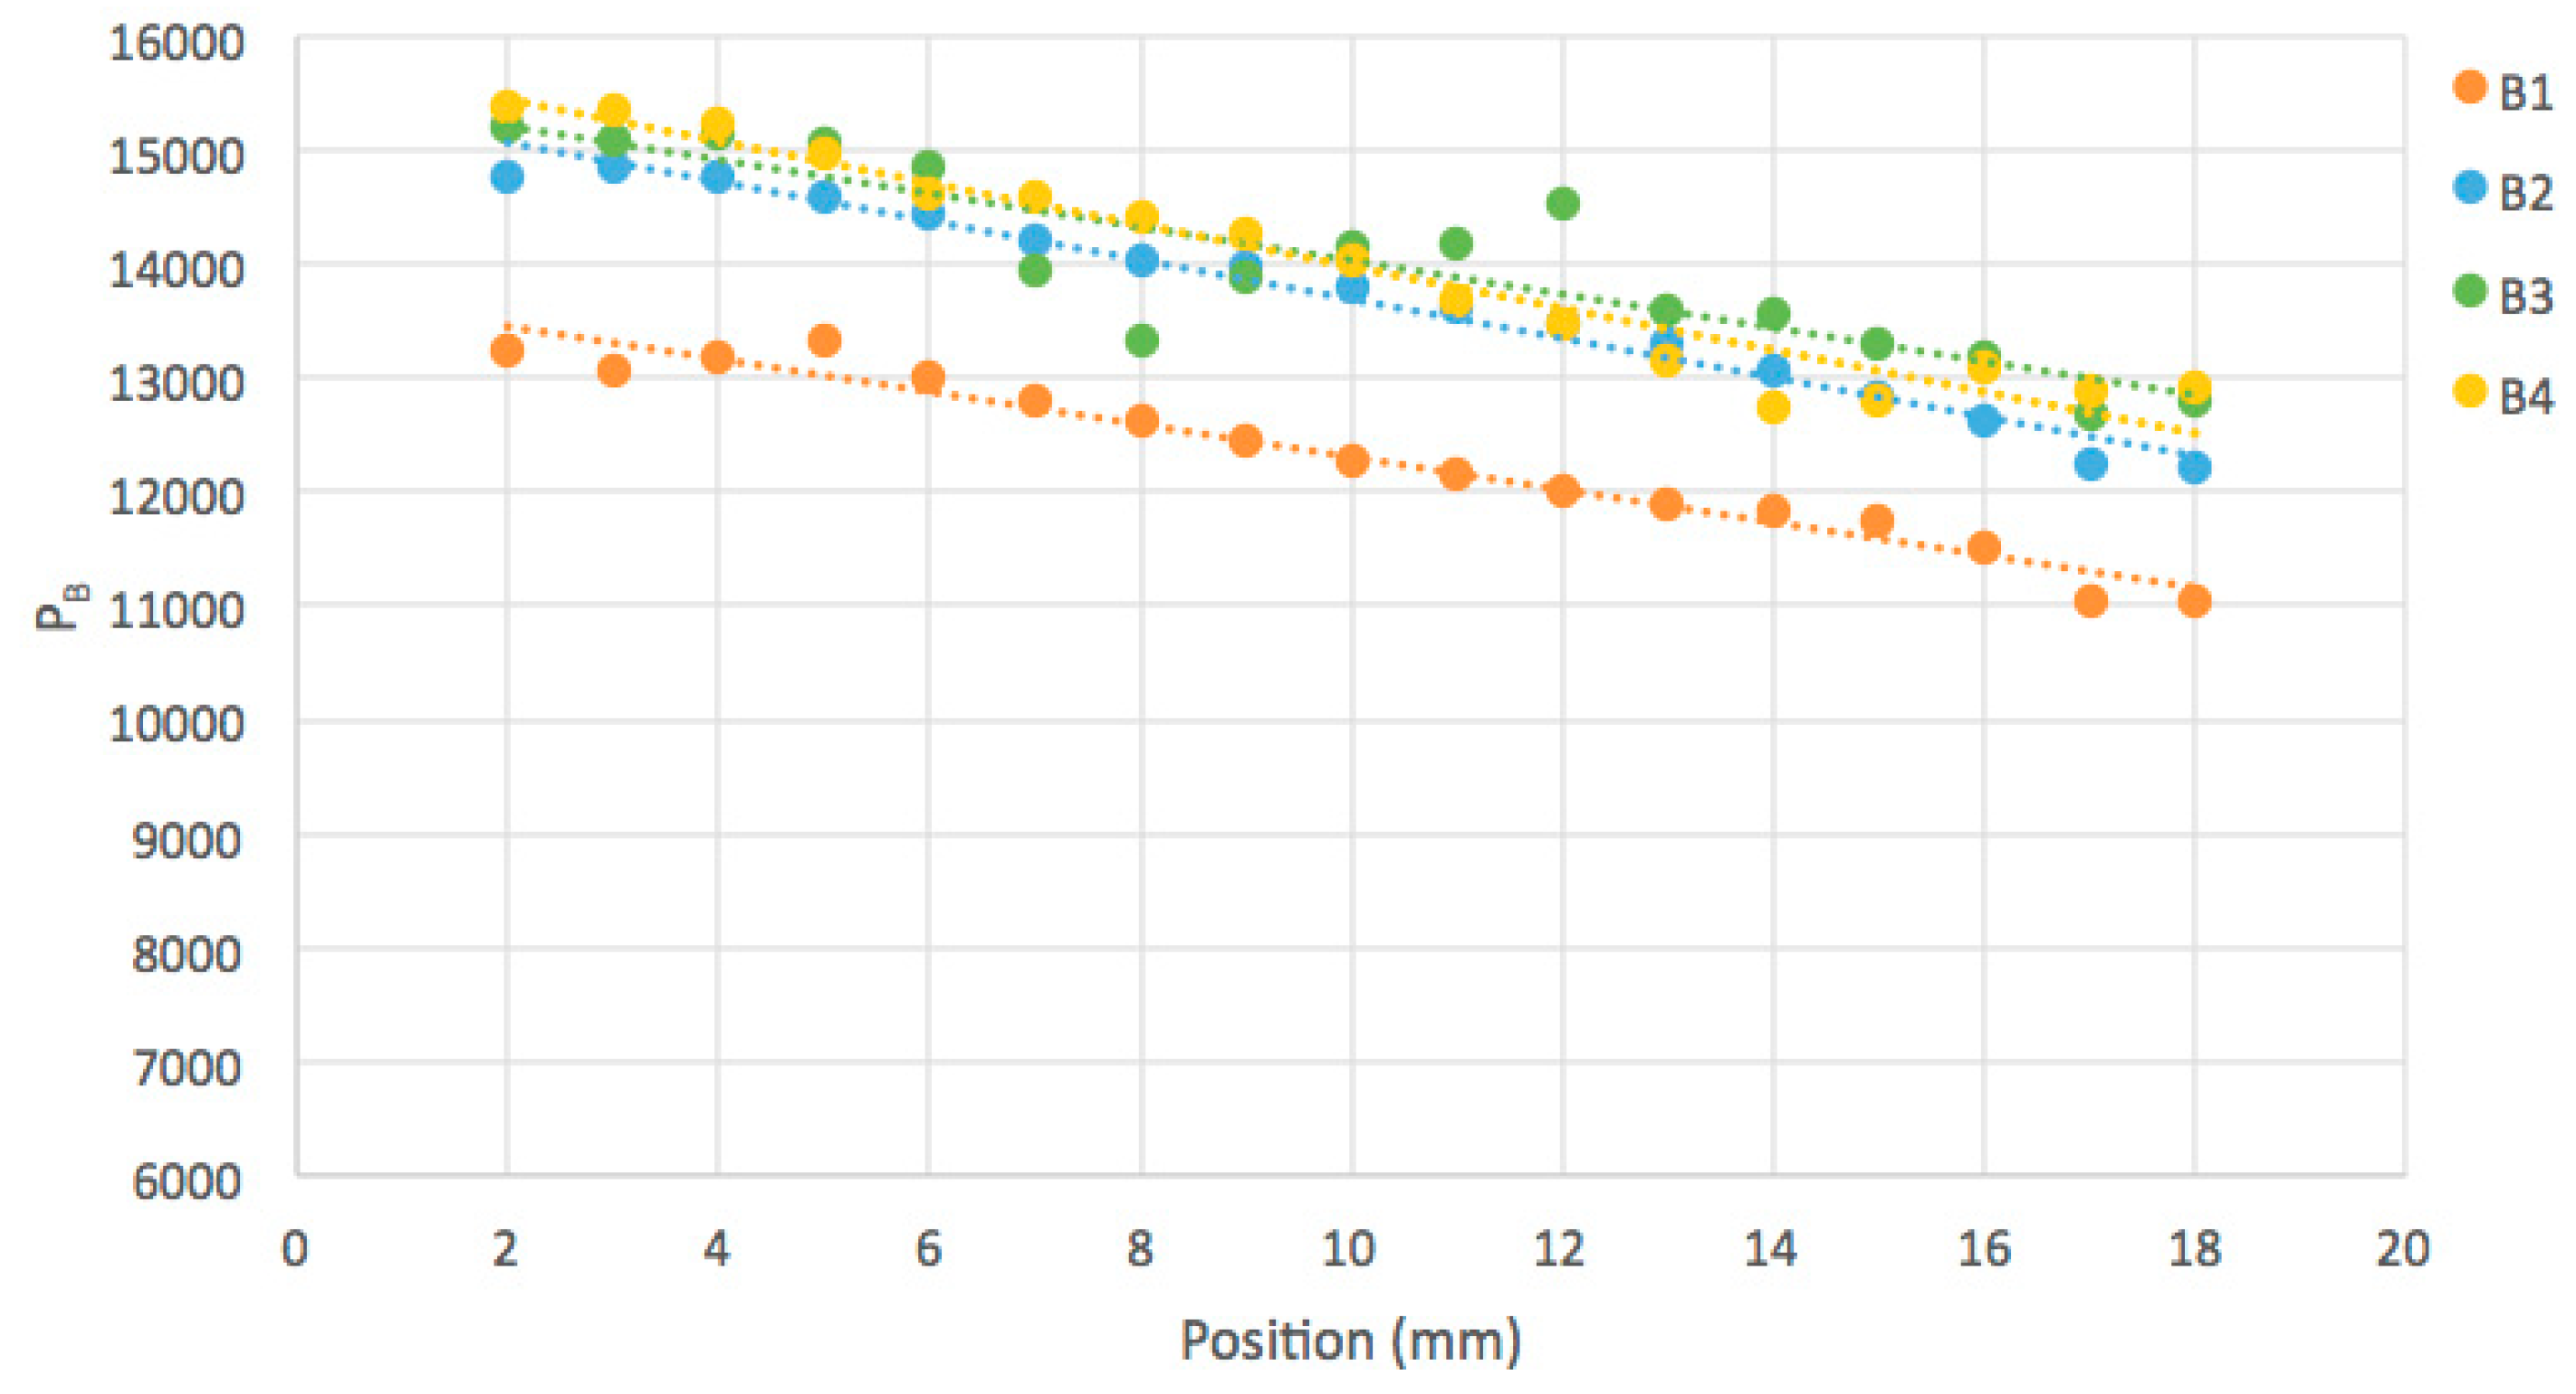
| Beam | Dose Rate, D’ (Gy/min) | Dose, D (Gy) | ΔI(10) | ΔI(18)/ΔI(2) | W (mm) | δW (mm) |
|---|---|---|---|---|---|---|
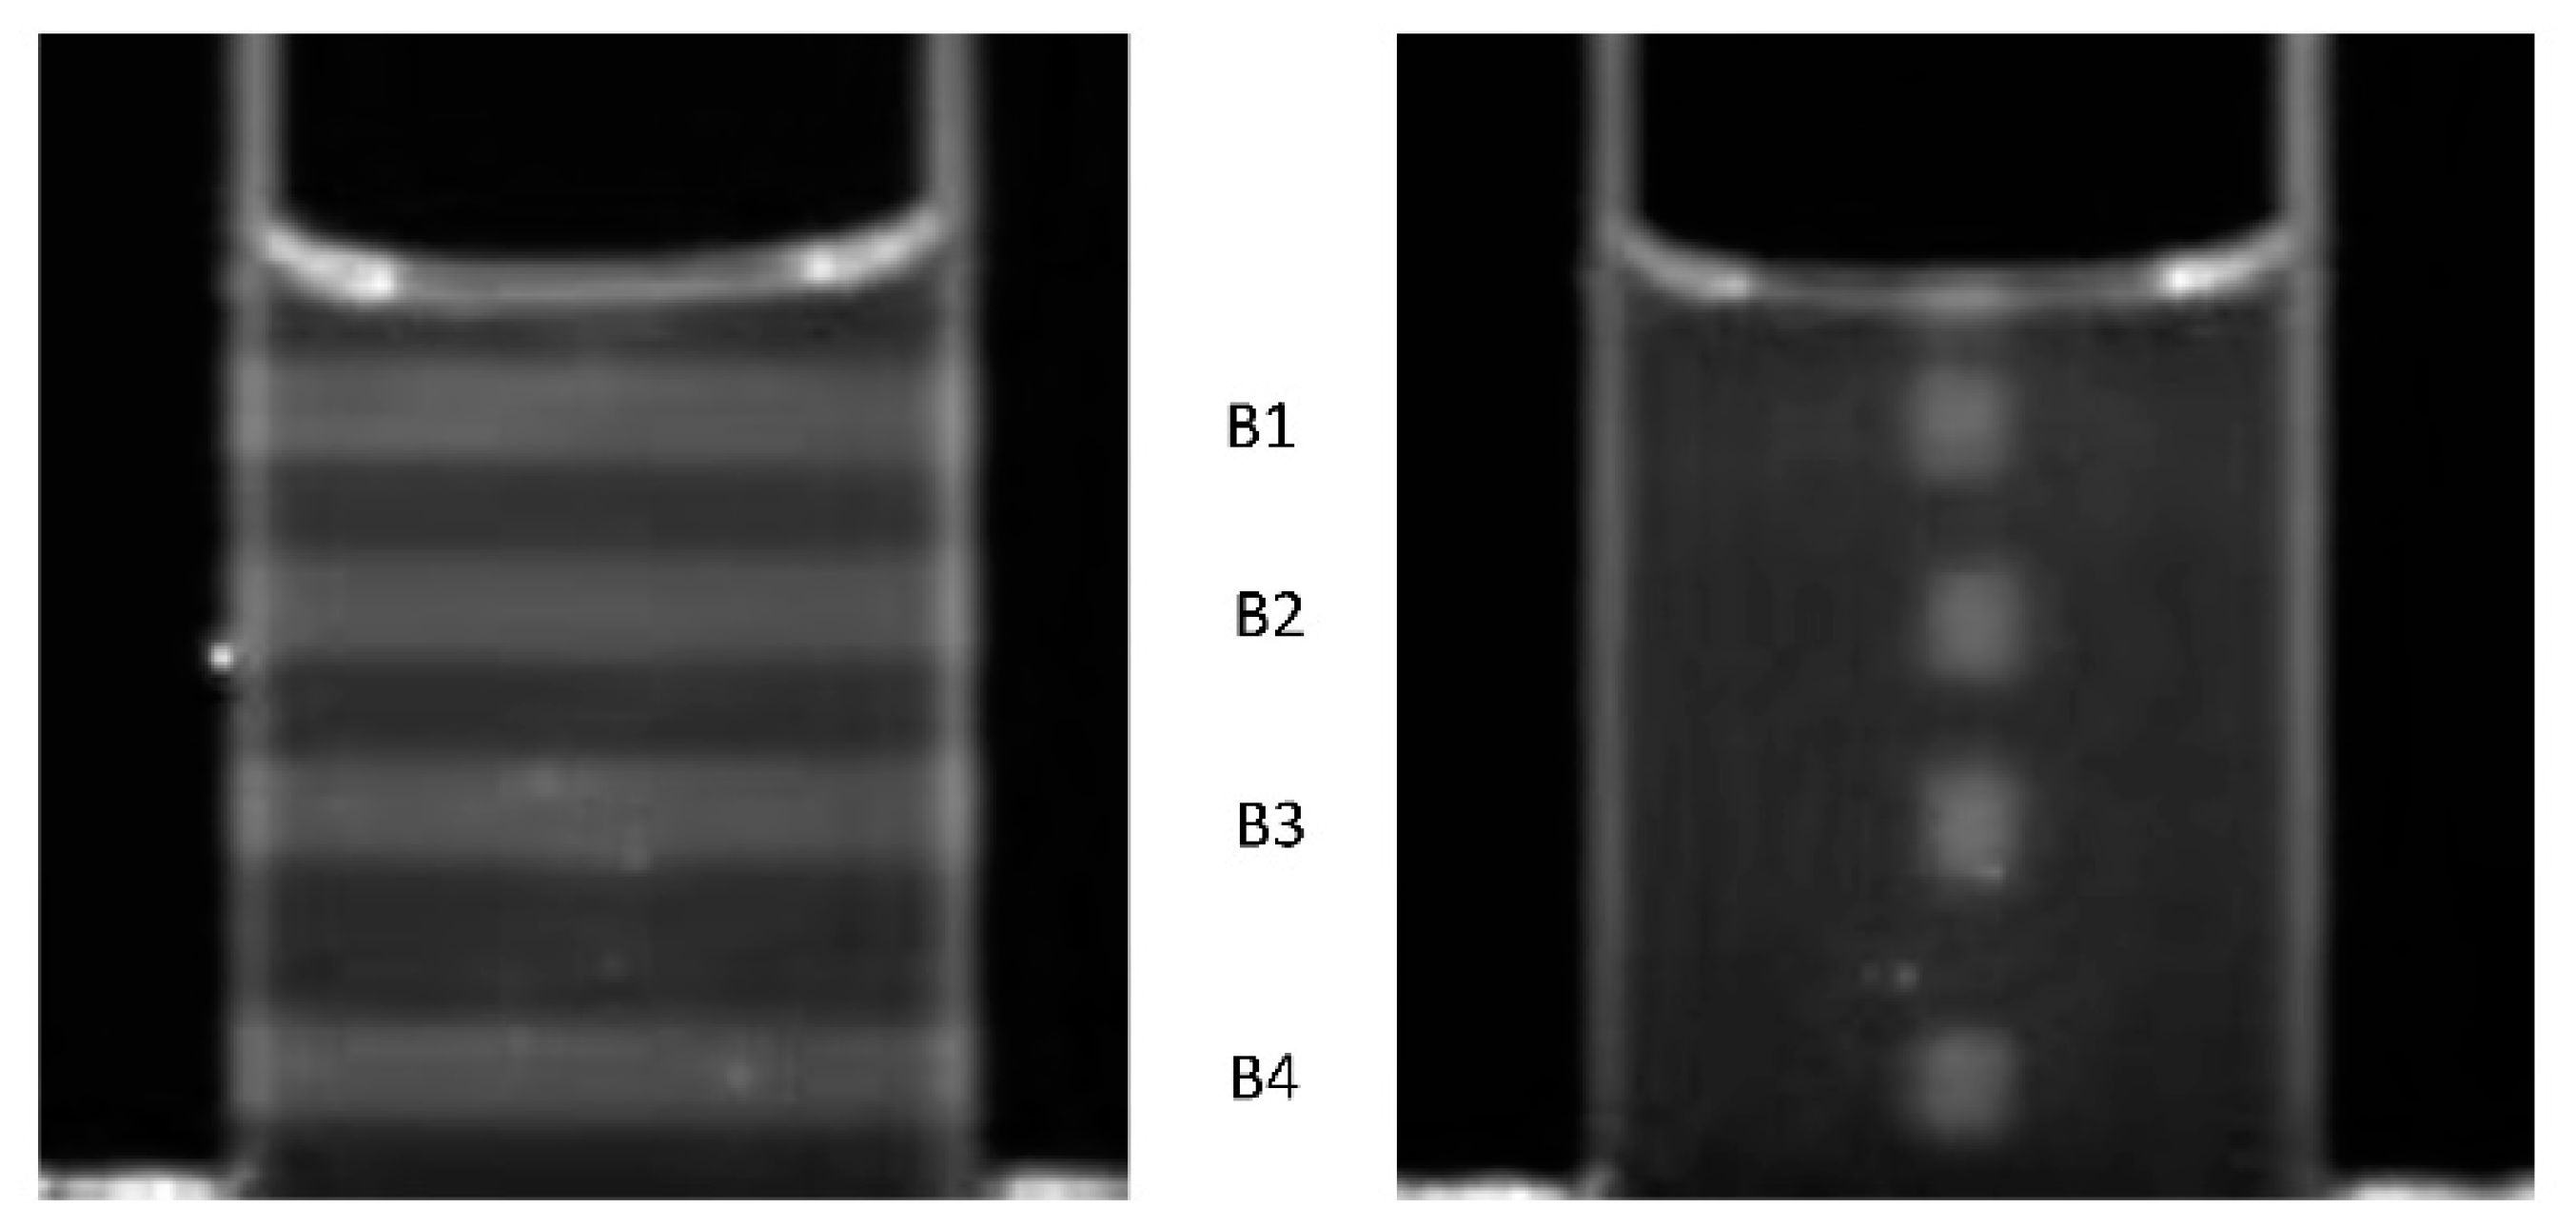
| B1 | 3.9 | 15.6 | 12,800 | 0.834 | 2.62 | 0.41 |
| B2 | 2.7 | 16.2 | 14,600 | 0.827 | 2.65 | 0.52 |
| B3 | 2.0 | 16.0 | 15,000 | 0.841 | 2.64 | 0.50 |
| B4 | 1.3 | 15.6 | 15,200 | 0.841 | 2.71 | 0.54 |
| averages | 15.9 | 0.836 | 2.66 | 0.49 |
© 2019 by the authors. Licensee MDPI, Basel, Switzerland. This article is an open access article distributed under the terms and conditions of the Creative Commons Attribution (CC BY) license (http://creativecommons.org/licenses/by/4.0/).
Share and Cite
Warman, J.M.; de Haas, M.P.; Luthjens, L.H.; Yao, T.; Navarro-Campos, J.; Yuksel, S.; Aarts, J.; Thiele, S.; Houter, J.; in het Zandt, W. FluoroTome 1: An Apparatus for Tomographic Imaging of Radio-Fluorogenic (RFG) Gels. Polymers 2019, 11, 1729. https://doi.org/10.3390/polym11111729
Warman JM, de Haas MP, Luthjens LH, Yao T, Navarro-Campos J, Yuksel S, Aarts J, Thiele S, Houter J, in het Zandt W. FluoroTome 1: An Apparatus for Tomographic Imaging of Radio-Fluorogenic (RFG) Gels. Polymers. 2019; 11(11):1729. https://doi.org/10.3390/polym11111729
Chicago/Turabian StyleWarman, John M., Matthijs P. de Haas, Leonard H. Luthjens, Tiantian Yao, Julia Navarro-Campos, Sölen Yuksel, Jan Aarts, Simon Thiele, Jacco Houter, and Wilco in het Zandt. 2019. "FluoroTome 1: An Apparatus for Tomographic Imaging of Radio-Fluorogenic (RFG) Gels" Polymers 11, no. 11: 1729. https://doi.org/10.3390/polym11111729