Structural Analysis of Aromatic Liquid Crystalline Polyesters

Abstract
: Laboratory preparations of liquid crystalline prepolymers, distillates accompanying prepolymers, final polymers, and sublimates accompanying final polymers were examined. NaOD/D2O depolymerization of prepolymers and polymers back to monomers with integration of the 1H NMR spectra showed up to 6% excess of carboxyls over phenol groups, caused partly by loss of the low-boiling comonomer hydroquinone through distillation during prepolymerization and leaving anhydride units in the polymer chain. ESI- MS and MS/MS of hexafluoroisopropanol extracts of the prepolymer detected small molecules including some containing anhydride groups; ESI+ MS showed the presence of small cyclic oligomers. 1H NMR (including TOCSY) spectra provided more quantitative analyses of these oligomers. The final polymerization increases the length of the polymer chains and sublimes out the small oligomers. Anhydride linkages remaining in the polymer must make LCP's more susceptible to degradation by nucleophilic reagents such as water, alkalis, and amines.
1. Introduction
LCP's, liquid crystalline aromatic polyesters, are a very important class of engineering polymer. Their low melt viscosities combined with their excellent mechanical properties make them extremely useful for the fabrication of intricate constructs for numerous optical and electronic devices. Their outstanding flame retardance, solvent resistance, and barrier properties offer still further advantages [1-3].
Because of ready availability from phenol and carbon dioxide, 4-hydroxybenzoic acid is the basic component of these resins. However, because its homopolymer is completely intractable and non-processable, it is copolymerized with 2,6-hydroxynaphthoic acid or with combinations of aromatic diols and dicarboxylic acids. Copolymerization is carried out by acetylating the phenolic components and heating the acetoxyacids under vacuum to drive off acetic acid. As this process requires temperatures greater than 300 °C, there is opportunity for various side reactions to occur. Because these may introduce unusual linkages with accompanying effects on polymer properties it becomes important to ascertain their nature and extent, which was the main goal of this study.
As large LCP molecules are essentially insoluble in known solvents, we used (a) quantitative NMR spectroscopic examination of depolymerization products and (b) NMR and mass spectroscopic examination of the smallest molecules produced in the polymerization.
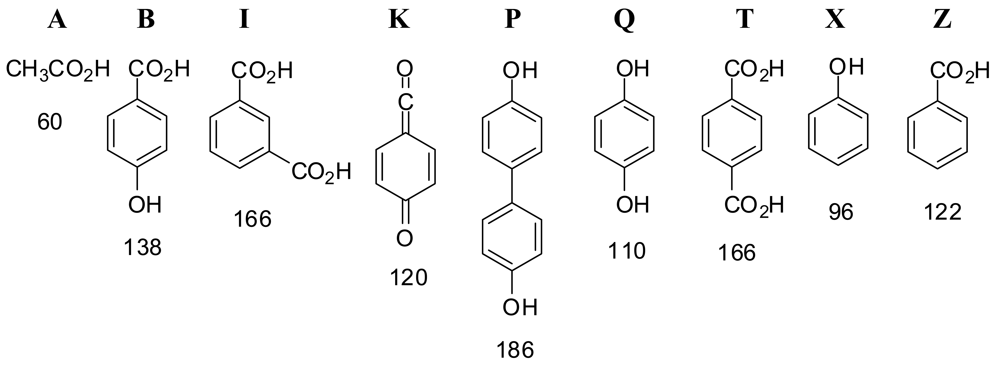
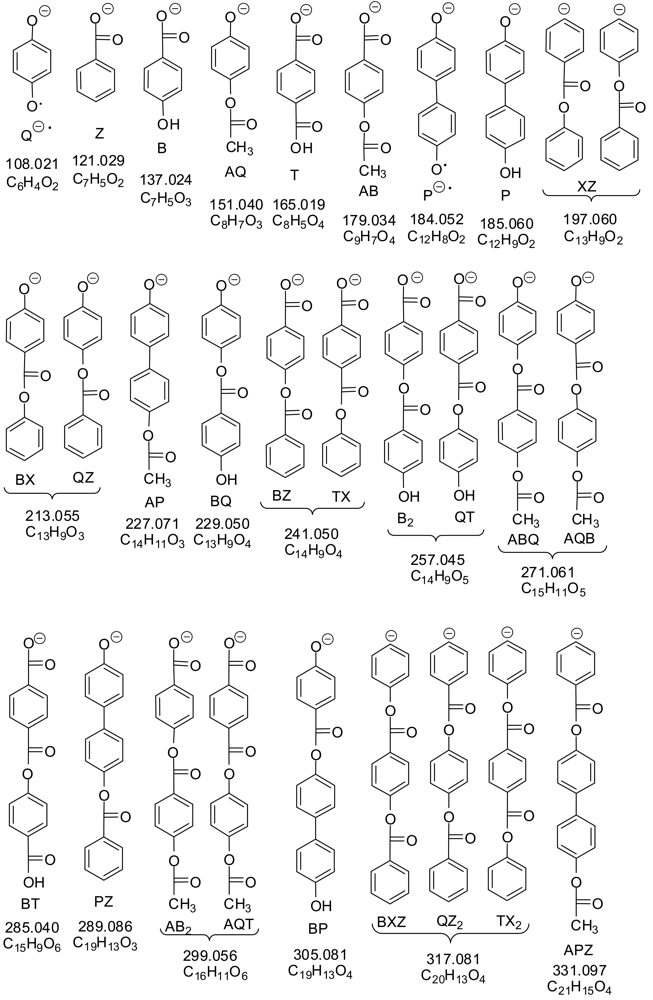
Figure 1 shows structures of compounds in this study. We examined the products from heating mixtures of bifunctional monomers 4-hydroxybenzoic acid (B), terephthalic acid (T), isophthalic acid (I), biphenol (P), and hydroquinone (Q) to ca. 312 °C with acetic anhydride while bubbling nitrogen through, producing a prepolymer and a liquid distillate comprised mostly of acetic acid (A); further heating under vacuum produced a polymer and a sublimate. The one-letter abbreviations in Figure 1 will be used for the bifunctional components of the feed (B, I, P, Q, T); phenol (X) and benzoic acid (Z), which arise from decarboxylation of the acids in the feed and contribute end groups in the polymer; and the B-derived ketoketene K, a likely intermediate at high temperatures. The numbers below the structures are their molecular weights.
2. Results and Discussion
2.1. Depolymerization of Prepolymers and Polymers with NaOD/D2O
A simple NaOD/D2O protocol which breaks all the ester and anhydride bonds took prepolymers and polymers back to the sodium salts of the starting materials. The mole percentages, reproducible to ±1%, showed mixtures of the disodium salts of the starting materials with about 1% of sodium acetate and less than 1% of any other materials. The average results from 9 samples of varied initial compositions are compiled in Table 1.
The starting materials were recovered in approximately their initial ratios except for hydroquinone Q, of which over half was gone in the prepolymer and two-thirds in the polymer. This was because hydroquinone, bp 285 °C, is the most volatile of the feed components except for acetic anhydride; the maximum temperature of the prepolymerization was ∼312 °C and of the final polymerization was ∼350 °C. Some of the hydroquinone may have distilled out as its acetate and/or diacetate, but with excess acetic anhydride in the distillate, only the diacetate was observed.
Note from the last column that about 6% more carboxyl groups than phenolic hydroxyl groups were found in the prepolymer products, and that the imbalance was slightly greater in the polymer; these numbers should be close to zero if the prepolymer and polymer are of high molecular weight and consist only of polyester units. Mn determinations gave results of 3,000–4,200 for prepolymers and 14,500–19,000 for polymers in this study. With the average unit mass ∼131 mass units, these values mean that end groups alone cannot account for the extra carboxyls observed upon hydrolysis: at Mn 3,000–4,200, end groups provide only about 3–4% of the functional groups after hydrolysis, and at Mn 14,500–19,000, end groups provide less than 1% of the functional groups after hydrolysis. Thus another explanation for the observed excess of carboxyl groups over phenolic groups in the products of these NaOD/D2O depolymerizations is needed.
2.2. NMR Analysis of Distillates Formed during Prepolymerization
Most of the further experiments were done with polymer 1 (Feed: 45 mole % B, 11% P, 16.5% Q, 27.5% T,) and polymer 2 (60% B, 5% I, 20% P, 15% T); note that polymer 1 had no isophthalic acid I and polymer 2 had no hydroquinone Q in the feed. Liquid distillates formed during their prepolymerizations were quantitatively analyzed by 1H NMR with integration. The distillates were >95% acetic acid, and were obtained in 93–96% of the amount expected if all the acetic anhydride in the feed came back as acetic acid in the distillate. Because the distillates also contained acetic anhydride, all phenolic groups were acetylated, which made the reaction mixture simple enough for quantitative analysis by integration of the peaks in the 1H NMR spectrum in CDCl3. The percentages of the six observed components, given in Table 2, were measured by integrating their bold-faced peaks: acetic acid at δ2.11s; acetic anhydride at 2.22s; hydroquinone diacetate at 2.28s, 7.09s; 4-acetoxybenzoic acid at 2.33s, 7.21d, 8.14d; biphenol diacetate at 2.33s, 7.15d, 7.55d; and phenyl acetate at 2.27s, 7.07d, 7.20t, 7.33t. Since the solvent was about half acetic acid/half CDCl3, the shifts differed slightly from those above, which are for the compounds in CDCl3 alone.
The main difference was that because polymer 1 had hydroquinone in the feed, the main component of its distillate after acetic acid and acetic anhydride was hydroquinone diacetate.
The majority of the 4-acetoxybenzoic acid may have distilled over as the lower-boiling ketoketene K, which after it condenses, adds acetic acid and then rearranges to its more stable isomer 4-acetoxybenzoic acid.
2.3. Anhydrides in the Main Chain
This is the simplest way of accounting for excess carboxylic acids over phenols on hydrolysis; anhydrides would certainly be hydrolyzed to carboxylic acids by NaOD/D2O. Anhydrides are expected since mixed anhydrides are main intermediates in the polymerization, which starts with the reaction of acetic anhydride with an aromatic acid to give a mixed aromatic acid-acetic acid anhydride and can continue with another aromatic acid to give a diaromatic anhydride and acetic acid [4,5]. The reasonableness of anhydride units in an LCP is also supported by the preparation of poly(terephthalic anhydride) [6]. Mass spectroscopic evidence is given below that anhydride groups are present.
2.4. Diaryl Ether Formation
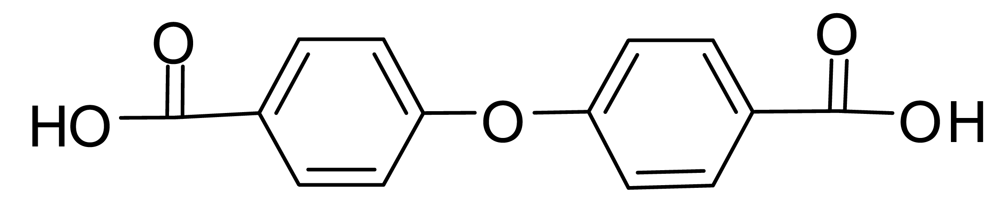
4-Hydroxybenzoic acid B should be particularly susceptible to nucleophilic aromatic substitution of the phenolic hydroxyl group by an addition-elimination mechanism since it has a carbanion-stabilizing carbonyl group in the para position. If the displacing group is the phenoxide ion from B, the product is 4,4′-oxybis(benzoic acid) (Figure 2). This process might be reversed during NaOD/D2O treatment, leading back to B. However, commercial 4,4′-oxybis(benzoic acid) was recovered unchanged under our conditions and mass spectra described below show it is not present in the prepolymers; thus ether formation is at most a minor side reaction (<1%) in the prepolymerization.
2.5. ESI− Mass Spectra of HFIP Extracts of Prepolymers
We tried to find mass spectral evidence for the presence of anhydride units in the polymer. We obtained excellent negative ion electrospray ionization (ESI−) mass spectra (MS) on the hexafluoroisopropanol (HFIP) extracts of prepolymers 1 (Q in feed) and 2 (no Q). The 50 largest peaks from the first extract, done using a Soxhlet apparatus for several hours, were for anions derived from oligomers containing carboxyl and/or phenolic groups. It was later found that simply heating at 60 °C and stirring in a vial with HFIP for 4 hours, cooling, and filtering or centrifuging, extracted enough of the small molecules from the prepolymer for mass spectroscopic analysis; with this simpler extraction method, many background peaks were larger than many of the sample peaks, but the latter could be recognized from a printout of high-resolution mass measurements. The spectral peaks observed for carboxylate and phenoxide anions up to molecular weight 500 are listed in Table 3, along with MS/MS peaks obtained by bombarding selected anions with inert gas (He, Ar, or N2) until they fragmented. Table 4 shows possible structures of anions observed in the MS and MS/MS of prepolymers 1 and 2, anions from the starting materials (B, P, Q, T), benzoate ion Z, and phenoxide ion X if only ester bonds and no anhydride bonds are present.
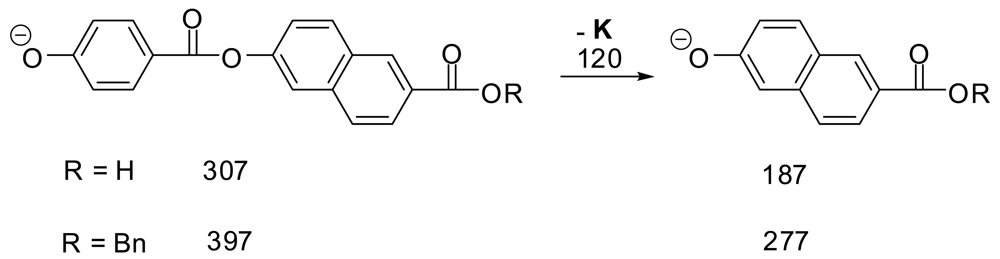
We have found ESI- to be much superior to MALDI− for LCP's since ESI− spectra are much freer from the scrambling of groups which was shown to occur with MALDI- on synthetic LCP oligomers [7]. We ran ESI- MS and MS/MS on two of the pure synthetic dimer samples from that study (Scheme 1) to look for scrambling. The mass spectra in each case gave 95–100% of the expected M–H anion and 0–5% of the peak for the additional loss of 120 (K). The MS/MS spectra of the M–H peak in each case showed massive loss of 120 (K) and no other peaks. These results support the view that under these conditions minimal scrambling occurs in ESI- mass spectra of LCP-type molecules.
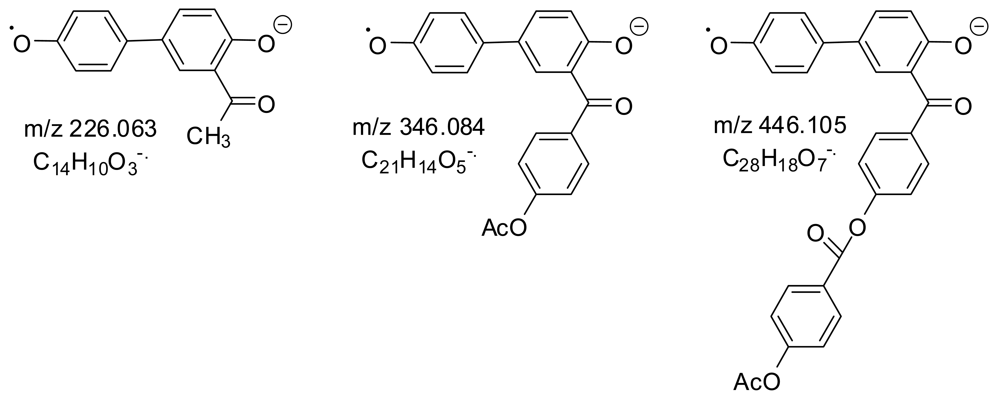
Ten of the anions (in bold in Table 3 along with masses within two mass units of them which were inadvertently selected as well) were selected for MS/MS. The usual losses from the intermediate anions in MS/MS, depicted in Scheme 2, were 42 (ketene from acetoxyl groups), 44 (CO2 from carboxyl groups or carboxylate ions), and 120 (unstable intermediate ketoketene K from a B unit with a phenoxide end). It was also presumed that LCP ester bonds could be cleaved as shown in the last reaction.
MS peaks were seen for all of the expected very low molecular weight oligomeric esters. The largest MS peaks came from species with an aryl acetate at one end and a carboxylate or phenoxide at the other: AP, APT, ABPT, and AB2PT. Only a few MS peaks came from a decarboxylation, indicating the mildness of the ESI- ionization procedure. On the other hand, collisions of the selected MS ions with inert gas atoms and molecules gave many MS/MS peaks from decarboxylations and the other reactions in Scheme 2. The majority of the MS/MS peaks (those shown in normal type) can be explained as coming from the structures in Table 4. The fourteen MS/MS peaks in bold can easily be explained only if anhydride groups as well as ester groups are present, providing evidence for anhydride groups in the polymer. Two examples are shown in Scheme 3.
In trying to consider all the oligomers for Table 4 which could be made using only ester bonds, it was useful to note that B2 is isomeric with QT; BX with QZ; BZ with TX; and PT with B2X, BQZ, and QTX. Molecular formulas which differ by two mass units were due to BQ being two mass units heavier than AP.
Some benzoyl Z end groups in the HFIP extracts of the prepolymers were observed in the mass spectra (Table 3: masses 121, 213, 241, 331, and 361), presumably arising from the decarboxylation of terephthalic acid T and T end groups. There was no clear MS evidence for phenoxide X end groups; however, as mentioned above, phenol (bp 182 °C, much lower than benzoic acid Z, bp 249 °C) was found in distillates as phenyl acetate.
MS/MS was useful in some cases for distinguishing which of the isomeric ions in Table 4 were present. For example, the absence of a 169 peak in the MS/MS of the 257 peak from loss of two CO2 units (mass 88) shows 4,4′-oxybis(benzoic acid), whose monoanion is depicted in Scheme 4, was not present, since a strong 169 peak was present in the MS/MS of the 257 peak of commercial 4,4′-oxybis(benzoic acid).
2.6. Carbene-Forming Eliminations in ESI− Mass Spectra
The two italicized MS/MS peaks in Table 3 (m/z 377 from 469; 299 from 467) could not be explained by the usual carbanion fragmentations in Scheme 2. They appear to come from the carbene-forming eliminations shown in Scheme 5.
2.7. Anion Radicals in ESI− Mass Spectra
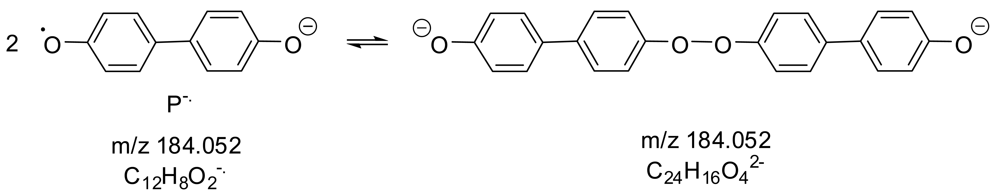
Besides the monoanions with their odd-numbered masses, several species were observed in the mass spectra with even-numbered masses, which come from anion-radicals or peroxides from their dimerization. Most obvious was a peak at m/z 184.052 for C12H8O2− · or C24H16O42− from species containing biphenol P, which may have one or both of the structures in Scheme 6. The analogous hydroquinone anion radical Q − was observed at m/z 108.022 in the MS/MS of QT.
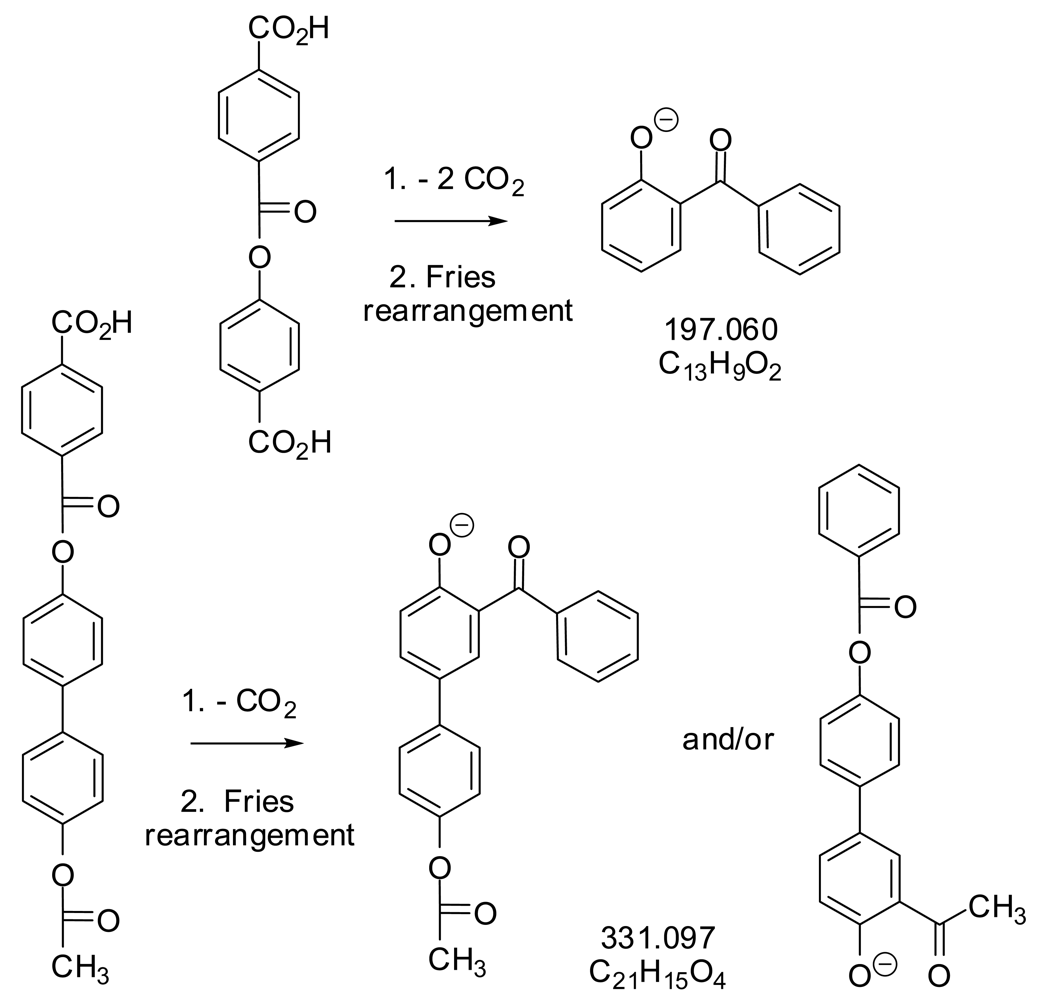
2.8. Fries Rearrangements
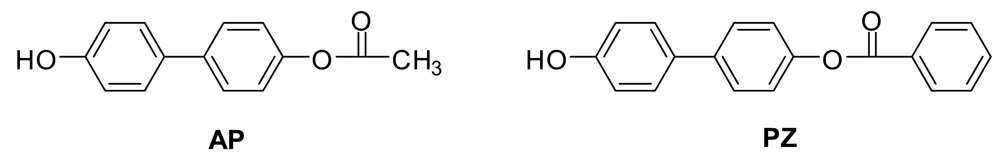
Several small mass spectral peaks for anion radicals provide evidence for small amounts of Fries rearrangements during the polymerization. The peaks as shown in Figure 3 are one mass unit lower than the very strong peaks for the anions of AP, ABP, and AB2P.
AP and PZ (Figure 4) were synthesized and subjected to ESI− MS and MS/MS to see if the Fries rearrangements described above were occurring under the mass spectral conditions. They were not, so the Fries rearrangement products observed above must be formed during the polymerizations.
Further evidence for Fries rearrangements during polymerization was the appearance of peaks at m/z 197 and m/z 331 in the mass spectra of prepolymers 1 and 2 (Table 3). Since these peaks appear in the ESI− spectra (mild conditions), they must come from phenoxide or carboxylate anions, so Fries rearrangements must have occurred during the prepolymerizations (Scheme 7).
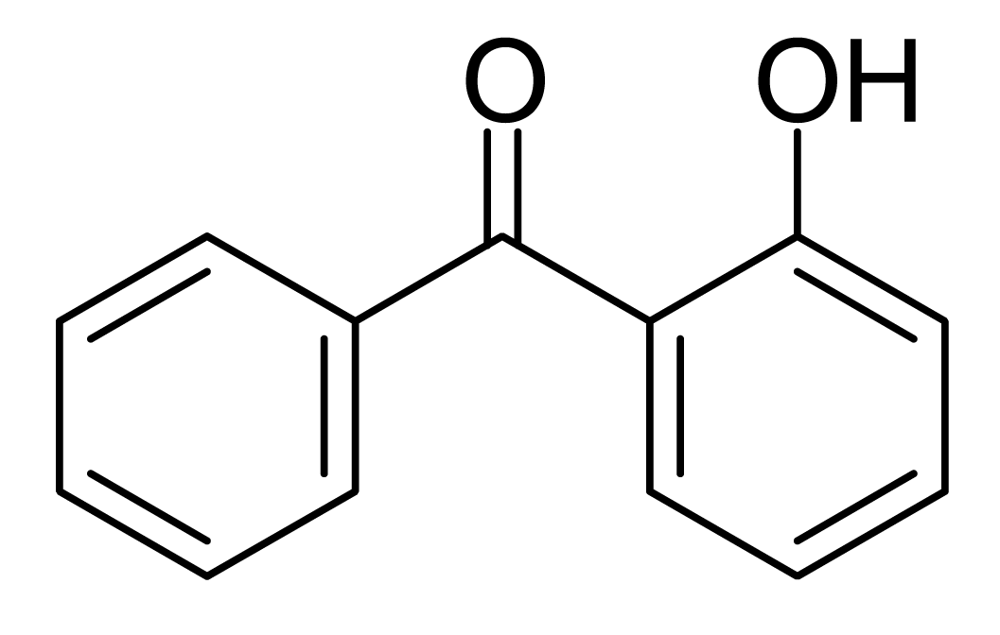
The NMR spectra of the products after NaOD/D2O treatment of the prepolymers and polymers do not show as much as 1% of any byproducts, so if Fries rearrangements are occurring as much as 1% of the time, they must be reversed by this treatment. Reverse Fries rearrangements are known, but 2-hydroxybenzophenone (Figure 5) did not yield benzoate and phenoxide ions but was recovered unchanged under our NaOD/D2O conditions, making it unlikely that there is more than 1% of Fries rearrangement product in the polymer. Fries rearrangements have been invoked to explain color formation in LCP's [8]; 2-hydroxybenzophenone itself is yellow.
2.9. ESI+ Mass Spectra of HFIP Extracts of Prepolymers
Weaknesses of the negative ion spectra discussed above are that they do not show linear oligomers lacking a carboxyl or phenol end group, and also miss the cyclic oligomers which usually accompany linear oligomers [9,10]. ESI+ spectra showed the cations listed in Table 5. No additional linear oligomers were observed, but there were peaks for the following cyclics (indicated with asterisks): dimers B2*/QT* (strong), trimers B3*/BQT* (stronger), and tetramers B4*/B2QT*/Q2T2*(weak). B2* was reported once before [11] but all the other cyclics are new. As described below, NMR spectra showed both B2* and QT* to be present.
2.10. End Groups in Oligomers from Prepolymers
It was of interest to note the end groups observed in the oligomers by MS and MS/MS, as these may be representative of all of the polymer molecules. Possible end groups are:
HOAr (phenol)
HO(CO)Ar (carboxyl)
AcOAr (acetate)
BzOAr (benzoate)
PhO(CO)Ar (phenyl ester)
AcO(CO)Ar (acetyl aryl anhydride)
BzO(CO)Ar (benzoyl aryl anhydride)
Only the first four of these were observed. To be observed in negative ion mass spectra, an oligomer must have at least one phenol or carboxyl grouping; any of the above groups might be present on the other end. The end groups observed in the main series in decreasing order of mass spectral intensities for a typical prepolymer with a charge of 60% B, 4% Q, 16% P, and 20% T are given in Table 6; they are listed in series formed by adding B units.
Adding the intensities of the observed mass spectral peaks for the oligomers gave the following relative abundances of the four observed end groups: carboxyl, 38%; acetate, 34%; phenol, 22%; benzoate, 7%. The PZ and Z series peaks show that there is considerable decarboxylation of terephthalic acid (T) units, providing benzoate (Z) end groups. On the other hand, the only place phenoxyl groups (X, from decarboxylation of B groups) were definitely observed in this study was in the distillate as discussed above. Unlike benzoic acid (bp 249 °C), phenol (bp 182 °C) generally distilled out rather than providing end groups.
The above percentages indicate an end group imbalance between 63% carboxyl groups and 37% phenol groups in these oligomers…a 26% difference. This compares to 55% carboxyl groups and 45% phenol groups (a 10% difference) from the NaOD/D2O depolymerization of this prepolymer. The end groups contribute to the imbalance and could be completely responsible for it if there were enough of them (i.e., if the molecular weight was low enough; as described above, it was not).
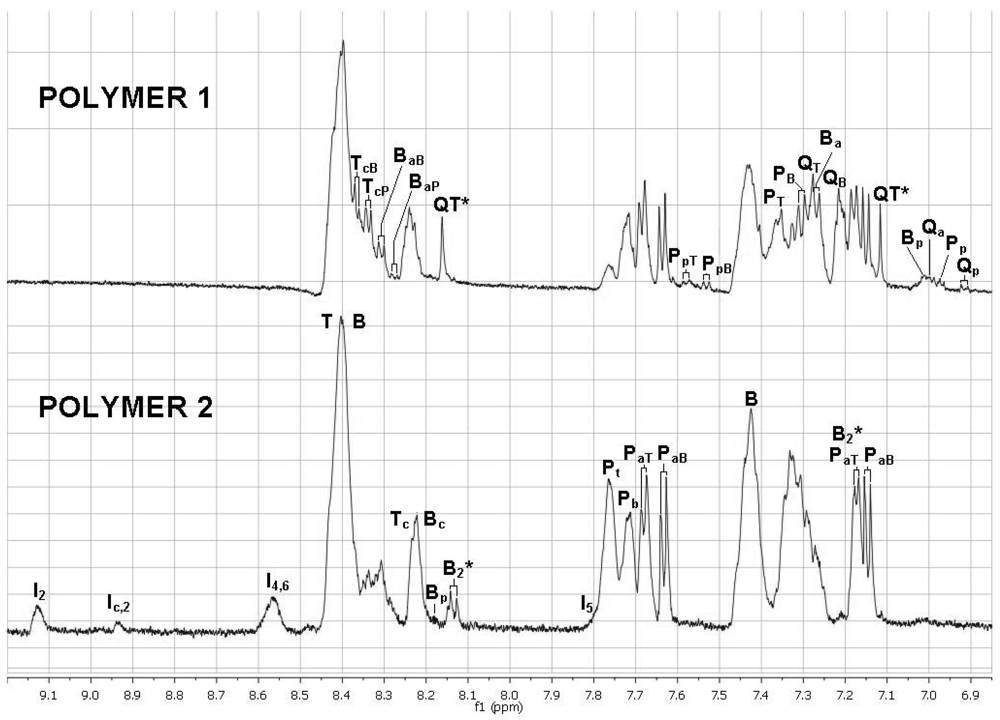
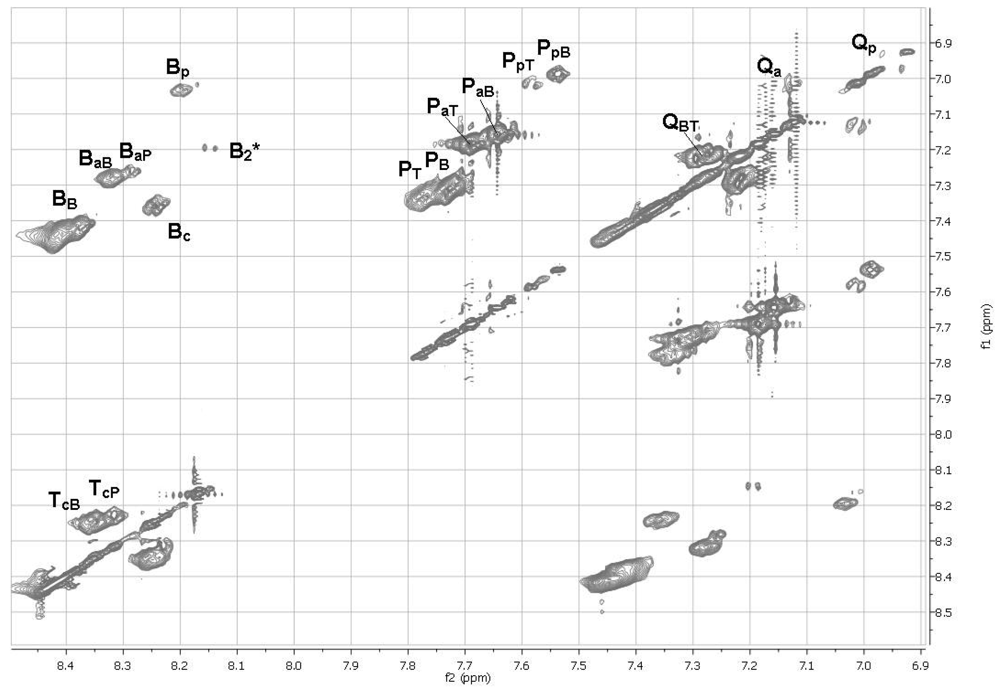
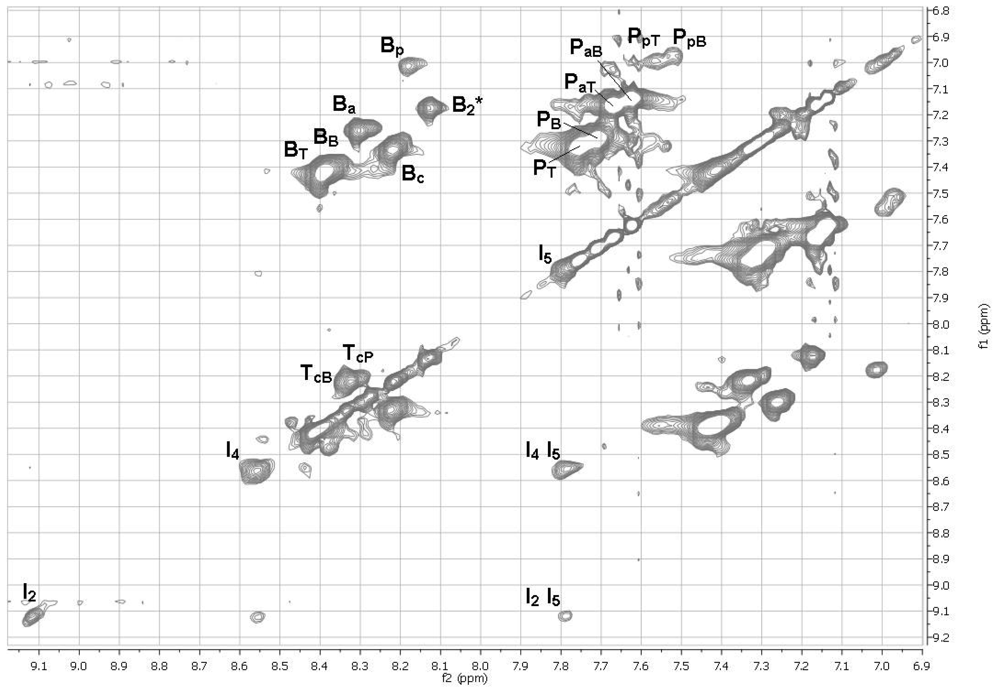
2.11. 1H NMR Spectra of HFIP Extracts of Prepolymers
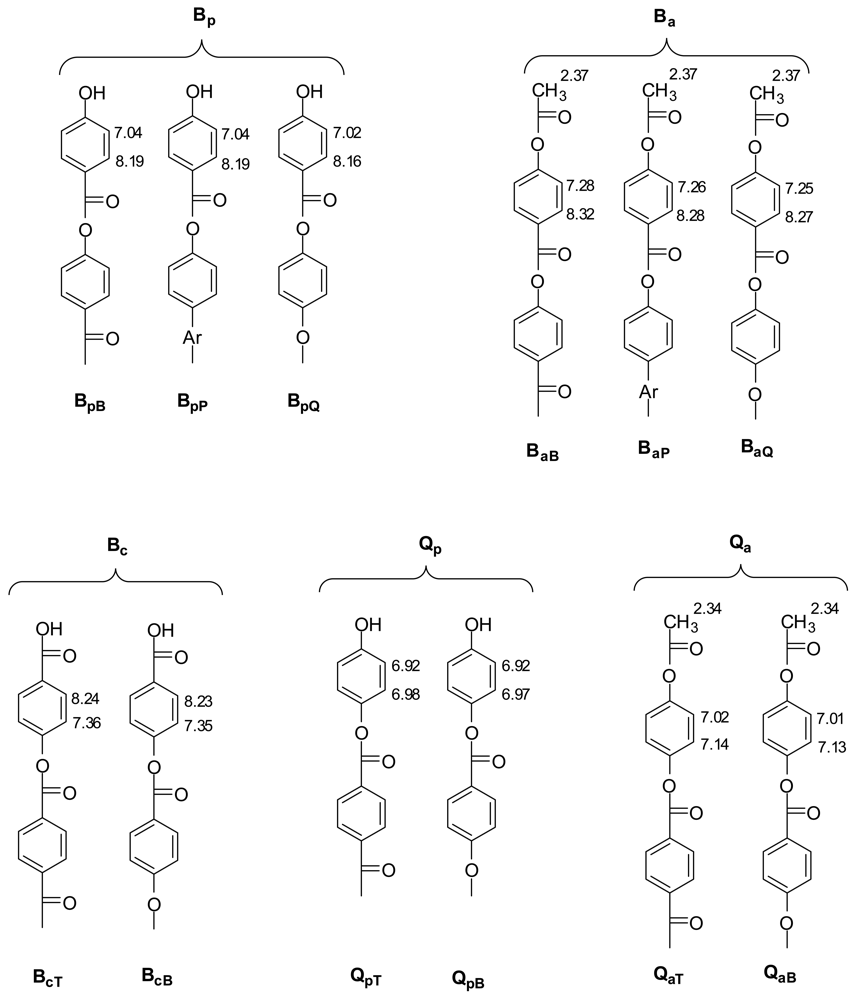
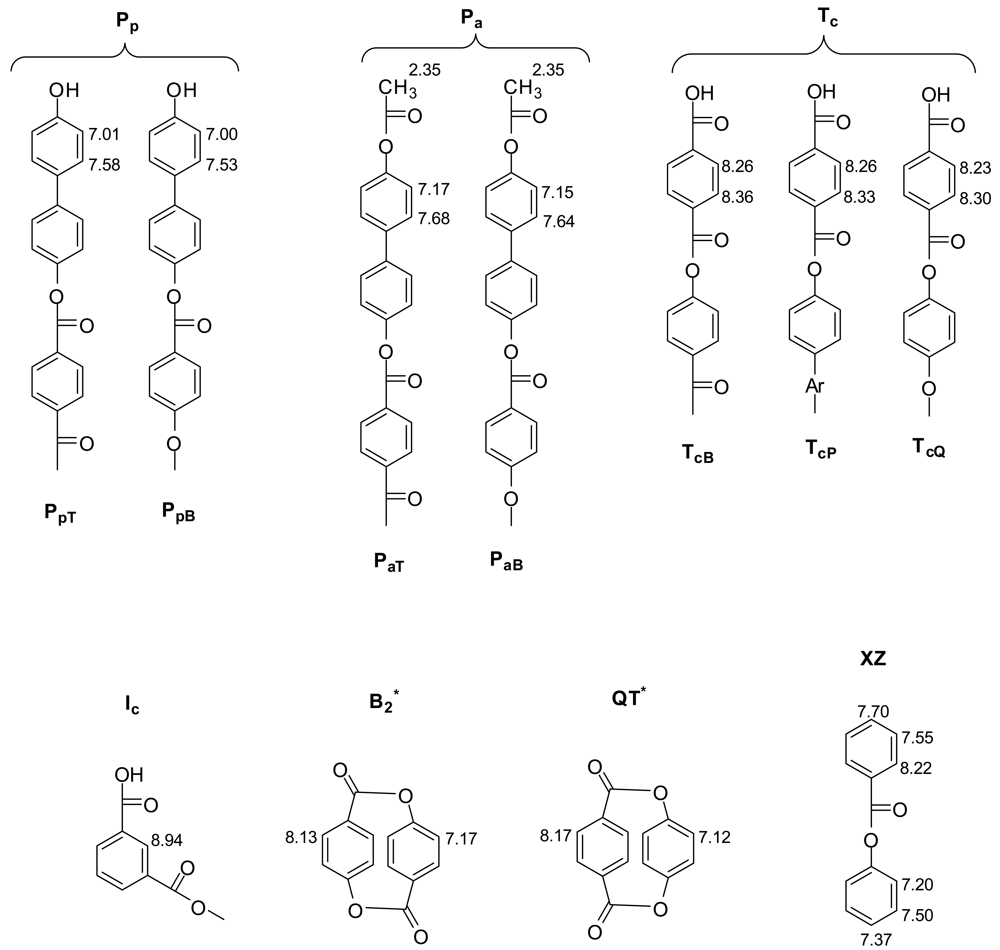
The smallest molecules extracted with HFIP were sufficiently soluble in HFIP for determinations of 1H NMR spectra. The 1D spectra (Figure 6) were complicated, but with the aid of TOCSY 2D spectra (Figures 7 and 8), the spectra of model compounds, and the expected upfield shifts within groups of similar compounds from electron-donating groups (OH > OAc > Ar > C=O), the peaks were assigned as listed in Tables 7 and 8. For the internal units (Table 7), the first letter indicates the central unit, the second (a subscripted capital letter) shows the group at one end, and the third (if present, a subscripted capital letter) shows the group at the other end. For the end groups (Table 8), the designation begins with the letter representing the aromatic group nearest the end, the second letter is superscripted and identifies the end group (a = acetate, c = carboxyl, p = phenolic hydroxyl), and a further subscripted letter (if present) indicates the next aromatic unit. It should be mentioned that the PaB end group values for the aromatic protons are within experimental area of those for the very similar acetylated monomer P(OAc)2 and the observed peaks are very likely partly due to the latter compound.
The NMR spectra show the presence of cyclic dimers B2* and QT*, where * signifies a cyclic oligomer. The cyclic trimers and tetramers detected by mass spectrometry must be present as well but their NMR peaks are included in the broad NMR peaks for the linear polymer units.
Integration of the aromatic protons α to the end functional groups in the 1H NMR spectra indicated the relative amounts to be Ac, ∼70%; COOH, ∼23%; and OH, ∼7%. This result, which shows the most HFIP-soluble small molecules, differs from the results with NaOD/D2O (which included all the monomers after depolymerization) and the mass spectral results (which included the most HFIP-soluble small molecules which ionized best).
2.12. Analysis of a Sublimate from an LCP Polymerization
The sublimate from polymer 2, an LCP polymerization with no hydroquinone in the feed, was selected for analysis. The sublimate had been washed with acetone to remove the smallest molecules, and nothing dissolved in CDCl3 for an NMR spectrum. The results of NaOD/D2O treatment followed by 1H NMR with integration are given in Table 9.
The sublimate was deficient in P and had extra T, causing a large imbalance with extra carboxyl groups. The TOCSY NMR spectrum of this sublimate was similar to that from the prepolymer but showed significant benzoate ester peaks (like those of the Z end of XZ in Table 8) formed by decarboxylation of T and/or I end groups upon long heating. The TOCSY spectrum also showed small crosspeaks not seen in other spectra which appear to arise from Fries rearrangements of the components during long heating.
3. Experimental Section
3.1. NMR and Mass Spectra
NMR spectra were obtained at 500 or 600 MHz on Bruker spectrometers in CDCl3, D2O, or HFIP (containing about 20% HFIP-OD for locking). ESI- and ESI+ mass spectra were measured on a Bruker 9.4 Tesla Apex Qh spectrometer; sample preparation involved diluting 1 μL of HFIP solution of the sample with 100 μL of 1:1 acetonitrile-water containing 0.1% formic acid (vital for protonation of ester groups in ESI+ spectra). Chemicals including 40 wt% NaOD/D2O were purchased from Sigma-Aldrich.
3.2. Depolymerization of Prepolymers and Polymers with NaOD/D2O
Polymer (8 mg) was stirred with 40 wt % NaOD/D2O (1 mL) in a vial at 60 °C for 1–2 days under argon, dilute with 4 mL of D2O to redissolve any precipitated disodium terephthalate, and an integrated 500 or 600 MHz 1H NMR spectrum was obtained. The peaks observed (relative to the HOD peak set at δ4.9) were for acetate ion A (δ ∼ 1.5) and dianions from starting materials: B (6.15, 7.25), I (7.1, 7.55, 7.85), P (6.2, 6.9), Q (6.0), and T (7.45).
4. Conclusions
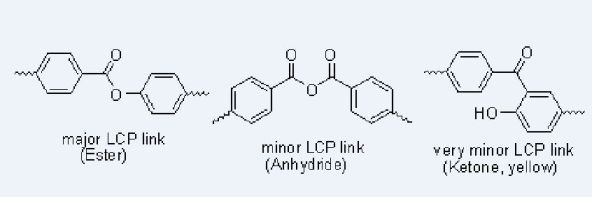
NaOD/D2O depolymerization of LCP's gave back the feed components but showed unexpectedly large excesses of carboxyl groups over phenol groups, especially when there were large amounts of hydroquinone in the feed. The missing hydroquinone was found as its diacetate in the distillate formed during prepolymerization. This appears to leave up to 6% of anhydride groups in the main chains of LCP's made in this way. Analyses of the HFIP extracts of prepolymers with ESI− and ESI+ mass spectrometry and NMR spectroscopy including TOCSY showed small amounts of small cyclics, the end groups on the linear oligomers, and some linear oligomers with anhydride groups in the main chain. Anhydride groups must render LCP's more susceptible to degradation by nucleophilic reagents. The Fries rearrangement products detected in very small amounts may account for yellowing in LCP's. Both anhydrides and Fries rearrangements produce kinks in the polymer chains.
Supplementary Material
polymers-03-00367-s001.pdf


| B | Q | P | I | T | I+T−Q−P | |
|---|---|---|---|---|---|---|
| Charge | 53.3 | 9.8 | 13.6 | 0.5 | 22.8 | 0.1 |
| Prepolymer | 56.9 | 4.2 | 14.4 | 0.3 | 24 | 5.7 |
| Polymer | 58.9 | 2.8 | 14.6 | 0.2 | 23.8 | 6.6 |
| Polymer number | Acetic acid | Acetic anhydride | Hydroquinone diacetate | 4-Acetoxy-benzoic acid | Biphenol diacetate | Phenyl acetate |
|---|---|---|---|---|---|---|
| 1 (with Q) | 99.3 | 0.5 | 0.16 | 0.05 | 0.01 | 0.01 |
| 2 (no Q) | 96 | 4 | 0 | 0.04 | 0.015 | 0.2 |
| ANION | MOL FORM | MASS | MS OF | MS/MS OF | |||
|---|---|---|---|---|---|---|---|
| Calcd | Obsd | #1 | #2 | #1 | #2 | ||
| Q −· | C6H4O2 | 108.021 | 108.022 | 257 | |||
| Z | C7H5O2 | 121.029 | 121.030 | w | w | 241 299 361 375 | |
| B | C7H5O3 | 137.024 | 137.025 | w | m | 257 299 | |
| AQ | C8H7O3 | 151.040 | 151.041 | m | |||
| T | C8H5O4 | 165.019 | 165.020 | s | s | 419 | 495 |
| AB | C9H7O4 | 179.034 | 179.035 | s | m | 419 | |
| P −· | C12H8O2 | 184.052 | 184.053 | m | m | 227 375 | 227 347 467 |
| P | C12H9O2 | 185.060 | 185.061 | w | w | 347 | |
| XZ | C13H9O2 | 197.060 | 197.061 | w | w | 361 | |
| BX/QZ | C13H9O3 | 213.055 | 213.056 | w | w | 257 299 419 | 299 419 467 |
| AP | C14H11O3 | 227.071 | 227.072 | s | s | 347 375 467 | 347 375 467 |
| BQ | C13H9O4 | 229.050 | 229.051 | m | 349 | ||
| BZ/TX | C14H9O4 | 241.050 | 241.051 | w | m | 361 | 495 |
| B2/QT | C14H9O5 | 257.045 | 257.046 | m | w | 299 377 419 497 | 419 469 |
| ABQ | C15H11O5 | 271.061 | 271.063 | m | |||
| BT | C15H9O6 | 285.040 | 285.042 | s | s | ||
| PZ | C19H13O3 | 289.086 | 289.088 | s | s | 361 375 | 375 |
| AB2/AQT | C16H11O6 | 299.056 | 299.058 | s | m | 419 467 | 467 |
| BP | C19H13O4 | 305.081 | 305.084 | m | w | 347 | |
| BXZ/QZ2/TX2 | C20H13O4 | 317.081 | 317.083 | w | 361 | ||
| APZ | C21H15O4 | 331.097 | 331.100 | w | w | 375 495 | 375 |
| B2X/BQZ/PT/QTX | C20H13O5 | 333.076 | 333.079 | m | m | 375 419 497 | 375,419 |
| ABP | C21H15O5 | 347.092 | 347.095 | s | s | 467 | 467 |
| B2Q | C20H13O6 | 349.071 | 349.076 | w | |||
| B2Z/BTX/QTZ | C21H13O6 | 361.071 | 361.075 | w | w | ||
| AB2X/ABQZ/APT/AQTX | C22H15O6 | 375.087 | 375.091 | s | s | 419 | 495 |
| B3/BQT | C21H13O7 | 377.066 | 377.070 | m | s | 419 469 497 | 419 |
| AB2Q/AQ2T | C22H15O7 | 391.082 | 391.087 | m | m | ||
| B2T/QT2 | C22H13O8 | 405.061 | 405.067 | m | s | ||
| BPZ/PTX | C26H17O5 | 409.108 | 409.11 | s | s | 495 | |
| AB3/ABQT | C23H15O8 | 419.077 | 419.082 | s | s | ||
| B2P/B2QX/BQ2Z/PQT/BQTX | C26H17O6 | 425.103 | 425.108 | m | m | 467 | |
| ABPZ/APTX | C28H19O6 | 451.118 | 451.125 | w | w | 495 | |
| B3X/B2QZ/BPT/BQTX/Q2TZ | C27H17O7 | 453.097 | 453.104 | m | m | 495 | 495 |
| AB2P/APQT | C28H19O7 | 467.113 | 467.120 | s | m | ||
| B3Q/BQ2T | C27H17O8 | 469.092 | 469.100 | w | |||
| B3Z/B2TX/BQTZ/PT2/QT2X | C28H17O8 | 481.091 | 481.101 | w | m | ||
| AB3X/AB2QZ/ABPT/ABQTX/AQ2TZ | C29H19O8 | 495.108 | 495.116 | s | s | ||
| B4/B2QT/Q2T2 | C28H17O9 | 497.087 | 497.096 | m | w | ||
 |
| CATION | MOL FORM | MASS | STRENGTH | |
|---|---|---|---|---|
| Calcd | Obsd | |||
| Ka | C7H5O3 | 121.0290 | 121.0284 | w |
| T | C8H5O4 | 167.0344 | 167.0341 | w |
| P | C12H8O2 | 187.0759 | 187.0753 | m |
| AP | C14H13O3 | 229.0865 | 229.0859 | s |
| B2*/QT* | C14H9O4 | 241.0501 | 241.0495 | s |
| B2/QT | C14H11O5 | 259.0607 | 259.0603 | w |
| ABQ | C15H13O5 | 273.0763 | 273.0758 | m |
| AB2/AQT | C16H13O6 | 301.0712 | 301.0707 | s |
| ABP | C21H17O5 | 349.1076 | 349.1072 | m |
| B3*/BQT* | C21H13O6 | 361.0712 | 361.0708 | s |
| AB2X/ABQZ/APT/AQTX | C22H17O6 | 377.1025 | 377.1024 | m |
| AB2Q/AQ2T | C22H17O7 | 393.0974 | 393.0971 | m |
| B2T/QT2 | C22H13O8 | 407.0767 | 407.0766 | w |
| AB3/ABQT | C23H17O8 | 421.0923 | 421.0920 | s |
| B3X/B2QZ/BPT/BQTX/Q2TZ | C27H19O7 | 455.1131 | 455.1125 | w |
| AB2P/APQT | C28H21O7 | 469.1287 | 469.1285 | m |
| B4*/B2QT*/Q2T2* | C28H17O8 | 481.0923 | 481.0916 | w |
| AB3X/AB2QZ/ABPT/ABQTX/AQ2TZ | C29H21O8 | 497.1036 | 497.1031 | s |
aprobably from HOC6H4(C=O)OAr oligomer ends.
| Series | End groups | Strength |
|---|---|---|
| APT/ABPT/AB2PT… | acetate and carboxyl | very strong |
| AP/ABP/AB2P… | acetate and phenol | very strong |
| PZ/BPZ/B2PZ… | benzoate and phenol | benzoate and phenol |
| PT/BPT/B2PT… | carboxyl and phenol | strong |
| Z/BZ/B2Z… | benzoate and carboxyl | medium |
| AB/AB2/AB3… | acetate and carboxyl | medium |
| T/BT/B2T… | 2 carboxyls | medium |
| PT2/BPT2/B2PT2… | 2 carboxyls | medium |
| AQ/ABQ/AB2Q… | acetate and phenol | weak |
| B/B2/B3… | carboxyl and phenol | weak |
| P/BP/B2P… | 2 phenols | weak |
| Q/BQ/B2Q… | 2 phenols | weak |
 |
 |
 |
| B | I | T | P | I+T−P | |
|---|---|---|---|---|---|
| Charge | 60.0 | 5.0 | 15.0 | 20.0 | 0 |
| Prepolymer | 60.7 | 5.6 | 15.6 | 18.2 | 3.0 |
| Polymer | 60.1 | 5.3 | 14.9 | 19.7 | 0.5 |
| Sublimate | 60.0 | 4.1 | 21.3 | 14.6 | 10.8 |
Acknowledgments
We thank the University of Arizona/NASA Space Grant Program for providing financial support to Cristina Contreras and Alexandru Dospinoiu.
References
- Han, H.; Bhowmik, P.K. Wholly aromatic liquid-crystalline polyesters. Progr. Polym. Sci. 1997, 22, 1431–1502. [Google Scholar]
- Jin, J.I.; Kang, C.S. Thermotropic main chain polyesters. Progr. Polym. Sci. 1997, 22, 937–973. [Google Scholar]
- Negi, Y.S.; Goyal, R.K. Development of thermotropic liquid crystalline polymers and their applications. Int. J. Plastics Technol. 2003, 7, 99–118. [Google Scholar]
- Huang, J.; Leblanc, J.P.; Hall, H.K., Jr. Model studies on the kinetics and mechanism of polyarylate synthesis by acidolysis. J. Poly. Sci. A 1992, 30, 345–354. [Google Scholar]
- Han, X.; Williams, P.A.; Padias, A.B.; Hall, H.K., Jr.; Sung, H.N.; Linstid, H.C.; Lee, C. A change in mechanism from acidolysis to phenolysis in the bulk copolymerization of 4-acetoxybenzoic acid and 6-acetoxy-2-naphthoic acid. Macromolecules 1996, 29, 8313–8320. [Google Scholar]
- Liu, J.; Long, T.C.; Geil, P.H.; Rybnikar, F. Poly(terephthalic anhydride) single crystals: Morphology and crystal structure. J. Polym. Sci. B 1996, 34, 2843–2851. [Google Scholar]
- Elandaloussi, E.H.; Somogyi, A.; Hall, D.E.; Padías, A.B.; Bates, R.B.; Hall, H.K., Jr. Resequencing of comonomer units of well-defined vectra oligomers during MALDI-TOF Mass spectral measurements. Macromolecules 2006, 39, 6913–6923. [Google Scholar]
- Dean, B.D. Chromophore formation in polyarylate diacetate chemistry. J. Polym. Sci. A 1992, 30, 2467–2470. [Google Scholar]
- Singletary, N.; Bates, R.B.; Jacobsen, N.; Lee, A.K.; Lin, G.; Somogyi, A.; Streeter, M.J.; Hall, H.K., Jr. Cyclic and linear polyamides from polycondensations of hexamethylenediamine and m-xylylenediamine with adipic, isophthalic, and terephthalic acids. Macromolecules 2009, 42, 2336–2343. [Google Scholar]
- Hoppin, C.; Bates, R.B.; Contreras, C.G.; Somogyi, A.; Streeter, M.J.; Hall, H.K., Jr. Poly(dibenzodiazocine)s: Analysis of low molecular weight fractions by MALDI-TOF MS. Polym. Bull. 2009, 63, 509–515. [Google Scholar]
- Kametani, T.; Fukumoto, K. Syntheses of heterocyclic compounds. LIX. Polyester. 2. Formation of polymer from p-hydroxy- or p-benzyloxybenzoic acid and the character of thionyl chloride. Yakugaku Zasshi 1960, 80, 1188–1192. [Google Scholar]
© 2011 by the authors; licensee MDPI, Basel, Switzerland. This article is an open access article distributed under the terms and conditions of the Creative Commons Attribution license (http://creativecommons.org/licenses/by/3.0/).
Share and Cite
Hall, H.; Ahad, S.; Bates, R.; Bertucci, M.; Contreras, C.; Dospinoiu, A.; Lin, G.; Singletary, N.; Somogyi, A. Structural Analysis of Aromatic Liquid Crystalline Polyesters. Polymers 2011, 3, 367-387. https://doi.org/10.3390/polym3010367
Hall H, Ahad S, Bates R, Bertucci M, Contreras C, Dospinoiu A, Lin G, Singletary N, Somogyi A. Structural Analysis of Aromatic Liquid Crystalline Polyesters. Polymers. 2011; 3(1):367-387. https://doi.org/10.3390/polym3010367
Chicago/Turabian StyleHall, Henry, Samiul Ahad, Robert Bates, Maria Bertucci, Cristina Contreras, Alexandru Dospinoiu, Guangxin Lin, Nancy Singletary, and Arpad Somogyi. 2011. "Structural Analysis of Aromatic Liquid Crystalline Polyesters" Polymers 3, no. 1: 367-387. https://doi.org/10.3390/polym3010367