Physical and Chemical Characterization of Poly(hexamethylene biguanide) Hydrochloride

Abstract
: We present the characterization of commercially available Poly(hexamethylene biguanide) hydrochloride (PHMB), a polymer with biocidal activity and several interesting properties that make this material suitable as a building block for supramolecular chemistry and “smart” materials. We studied polymer structure in water solution by dynamic light scattering, surface tension and capacitance spectroscopy. It shows typical surfactant behavior due to amphiphilic structure and low molecular weight. Spectroscopic (UV/Vis, FT-NIR) and thermal characterization (differential scanning calorimetry, DSC, and thermogravimetric analysis, TGA) were performed to give additional insight into the material structure in solution and solid state. These results can be the foundation for more detailed investigations on usefulness of PHMB in new complex materials and devices.1. Introduction
Poly(hexamethylene biguanide) hydrochloride, PHMB, is a cationic biocide marketed worldwide, due to its excellent antimicrobial activity, chemical stability, low toxicity and reasonable cost [1,2]. Effectiveness against cellular organisms is due to the very basic biguanide group attached to a flexible spacer, a hexamethylene group. Maximal biocidal efficiency is obtained when six methylene groups are used as spacer between biguanide groups [3,4]. In a recent paper, Koburger et al. [5] compared the antiseptic efficacy of triclosan, octenidine, PHMB, PVP-Iodine and chlorexidine digluconate; they concluded that PHMB was the most widely used antiseptic when prolonged use is needed and/or when prolonged contact is feasible.
Kaehn reviewed the mode of action and established applications of PHMB as biocide [4]. PHMB binds to the negatively charged phosphate head groups of phospholipids at bacteria cell wall, causing increased rigidity, sinking non-polar segments into hydrophobic domains, disrupting the membrane with subsequent cytoplasmic shedding culminating in cell death. PHMB can be found in swimming pool sanitizers, cosmetics, leather preservatives, contact lens disinfectants, cleanser in agriculture and food handling, in treatment of hatching eggs, fibers and textiles and technical fluids like cutting oils and glues [4]. To further study the mechanism of biocide action of PHMB, we recommend the reader to read [4] and references listed therein.
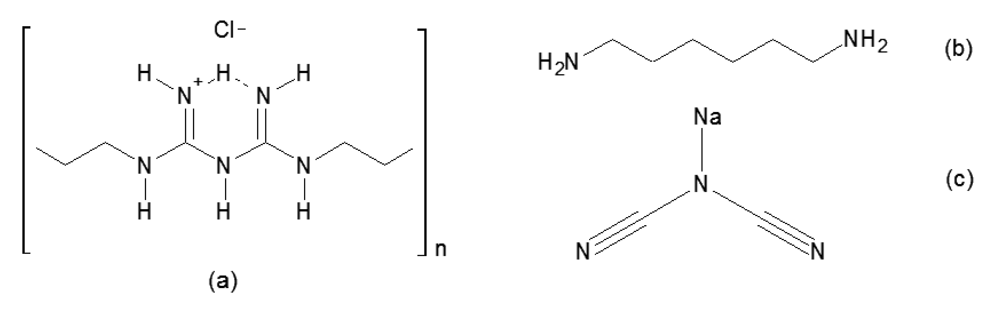
PHMB can be synthesized by different routes, but usually is obtained by polycondensation of sodium dicyanamide and hexamethylenediamine in two steps [3]. In Figure 1, schematic structures of PHMB and its monomers are presented.
The same properties that makes PHMB effective as biocide also makes it an interesting molecule to technological applications: It is as good a metal chelator as its parent molecule, biguanide [6]; the five conjugated amines can bind to neighboring molecules with multiple hydrogen bonds, which is attractive for supramolecular chemistry [7]; films of PHMB are transparent and very adherent to metal, plastics and glass; it is a proton conductor, potentially applicable to proton exchange membrane fuel cells [8]; finally, it is soluble in both water and alcohol, commonly used as solvents for paints and lacquers [9].
However, almost nothing is available in scientific literature regarding the physical and chemical properties of PHMB. When it is available, only partial and sometimes confusing data are provided. One of the few papers dealing with chemical and physical properties characterizes a customized synthesized material that does not reflect the commercially available products sold worldwide [10]. Technical literature provides some properties of commercial PHMB [1]; however, lacks details on how data was obtained. Even fundamental properties like molecular weight are not well supplied, which leads to misinterpretation [8].
Confident on the usefulness of such material to several new applications, this paper deals with the characterization of commercially available PHMB by several techniques, to serve as a foundation to applied researches on the fabrication of thin films, polymer blends, devices and “smart” materials. Structuration in water solutions is studied, some useful properties are determined and thermal and spectroscopic characterizations are presented.
2. Results and Discussion
2.1. Molecular Weight Distribution
Reports about molecular weight of PHMB cite determinations made by gel permeation chromatography, which results in values of weight-averaged molecular weight, M̅w, around 2,400 g mol−1 and average degree of polymerization X̅ = 12 [11]. With this low molecular weight, the chain ends cannot be neglected when calculating average molecular weights. Due to dynamic equilibrium of polymerization/depolymerization in step-growth synthesis, commercial PHMB has three possible groups at chain ends: Nitrile, guanidine or amine [12]. As a consequence, averaged molecular weight should be corrected to the mass of chain end groups. However, even neglecting the chain ends, X̅ cannot be 12 if we consider this average polymerization degree as being numeric, since the molar mass of PHMB mer is 219.72 g mol−1. The degree of polymerization is a measurement related to the molecular weight determination, and no explicit information is given about what measurement of X̅ is being informed; it could be (number-average) or (weight-average) and even (viscosity-average) or (z-average); it depends on which molecular weight was measured (for a better description of polymer synthesis parameters, see [13]). Additional information is usually given and is very relevant: The chain length is restricted to a maximum size of 40–42 mers. It allowed us to do a simulation of the correct degree of polymerization.
Usually, the number-average degree of polymerization, , is informed for polymers, but this is not the case for PHMB. We fitted the most probable distribution for step-growth polymerization [13] to a condition of maximum chain length of 40 mers, considering that the cumulative mass of polymers attains 99.99% when all chain weights are summed up to 40 mers length. The fractional polymer conversion was adjusted to fit the desired cumulative mass distribution. The result is , and M̅w = 1,517 g mol−1 with p = 0.747, meaning that chains with four mers are numerically the most prevalent. However, this simulation does not agree with the reported X̅ = 12, nor with a M̅w ≈ 2,400 g mol−1; then we adjusted the distribution to fit and to 12 to see if more coherent results are obtained. The results are compared in Table 1.
It is clear that none of these conditions fits the literature reports for all parameters; as said before, it is known that equilibrium of polymerization/depolymerization exists, with depolymerization happening by biguanide break resulting in one cyanamide chain end and one guanidine chain end. Longer chains (>40 mers) will break up into smaller chains that can undergo interchange reactions,complicating the estimation of the true molecular weight distribution. This process can explain the maximum chain length around 40 mers with a weight-averaged degree of polymerization of 12. The resulting number-average degree of polymerization , M̅w = 2,639 g mol−1, M̅w = 1,429 g mol−1 and averaged mer mass is 223.16 g mol−1, based on the best approximation by simulations.
2.2. Polymer Structuration in Aqueous Solutions
The small size of PHMB chains, in fact an oligomeric material, leads to a solution behavior which is atypical when compared with heavier polymers. The viscosity is similar to the water viscosity even in high weight fractions. A 10%-weight solution in water has a dynamic viscosity (at 1.67 Hz, 100 rpm) of 2.1 mPa s, not much higher than water (0.89 mPa s) [14]. Such a low value could barely be measured by the rotational viscometer used; therefore, a complete stress-strain curve could not be made.
The alternating structure of hydrophilic-hydrophobic segments in PHMB chain indicates, potentially, a particular conformation in water solution, where the hydrophobic methylenic segments points toward the center of a sphere, and the hydrophilic, mono protonated biguanide groups point outward. The result is a micelle similar to a typical surfactant micelle, but formed by segments of a polymer chain, not by adjacent independent molecules. Since the chain must fold in a very particular way, the entropy associated is much lower than a random coil conformation; therefore, the hydration enthalpy must be high to overcome the negative entropy contribution. The very high solubility of PHMB in water (>40% w/w) is a proof of the high hydration enthalpy.
If micelles are formed, we expect to see very small particles in the size range of 1–10 nm in an experiment of dynamic light scattering (DLS) [15], taking into account the size determined by DLS is the size of the micelle plus the hydration layer that must exist to counterbalance the negative charge of the counter-ion of protonated biguanide group, i.e., in such a case, a chloride ion. It is important to also note that preceding a DLS experiment we must ensure that: (a) The light absorption at wavelength used (in our case, 633 nm) is not very high; (b) That sample fluorescence, if any, is negligible at the wavelength used; and (c) The refractive index of material being tested is known. We measured these properties and the results are reported in the following sections.
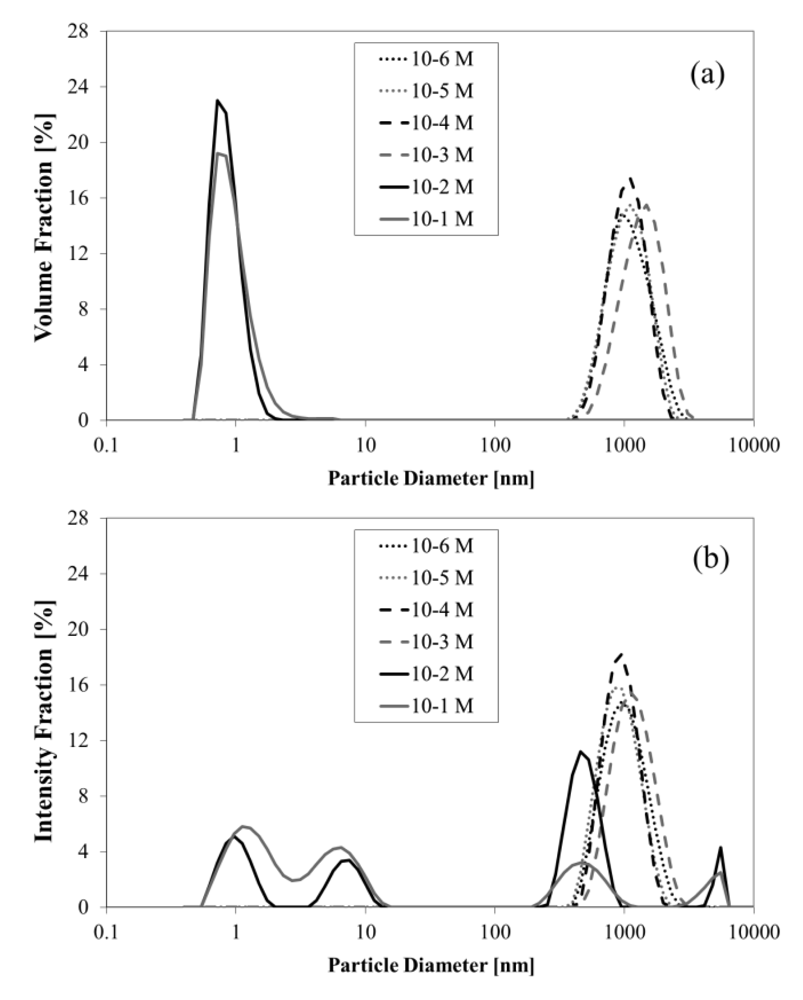
To test the hypothesis of micelle formation, we performed DLS experiments to determine particle size in a range of concentrations from 10−6 to 0.927 mol dm−3. We observed a size transition when concentration rises from 10−3 to 10−2 mol dm−3, changing from large aggregates to very small particles. In Figure 2(a), the volume distribution suddenly changes when this concentration is attained. In Figure 2(b), the scattering intensity distribution helps to reveal that large aggregates are still present in concentration of 10−2 mol dm−3, but in much lower volume fraction since they do not appear in the volume distribution.
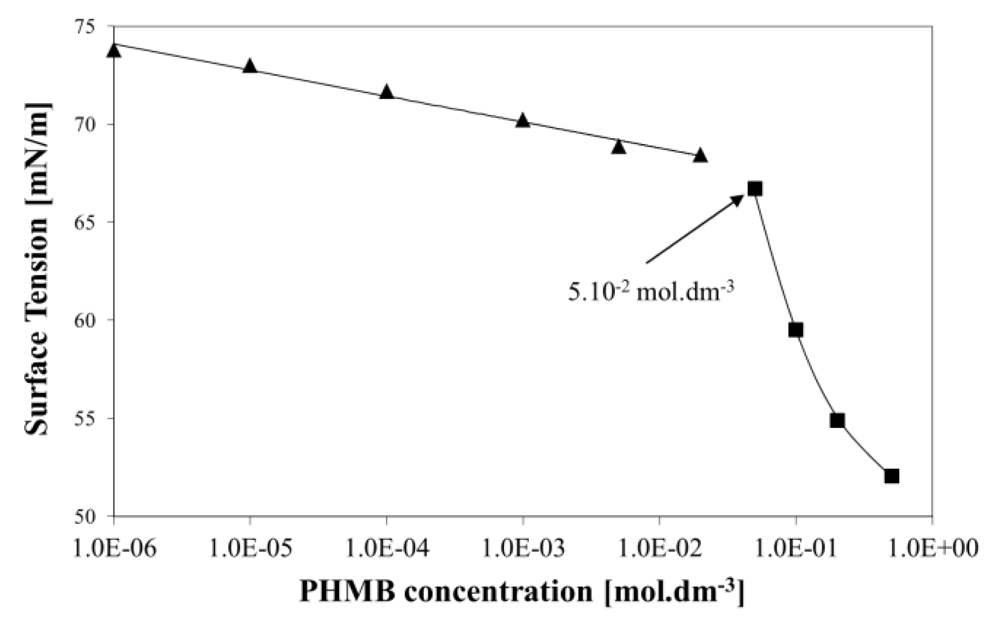
Figure 3 shows the surface tension (γ) as a function of concentration measured by pendant drop goniometry in air. The surface tension follows a linear trend of slow decay up to 2 × 10⁻² mol dm−3, after that an exponential-like decay happens, a typical behavior of a surfactant above its critical micelle concentration (CMC) [16]. At 5 × 10⁻² mol dm−3, the decay trend has already changed; so, the CMC lies somewhere between 2 to 5 × 10⁻² mol dm−3.
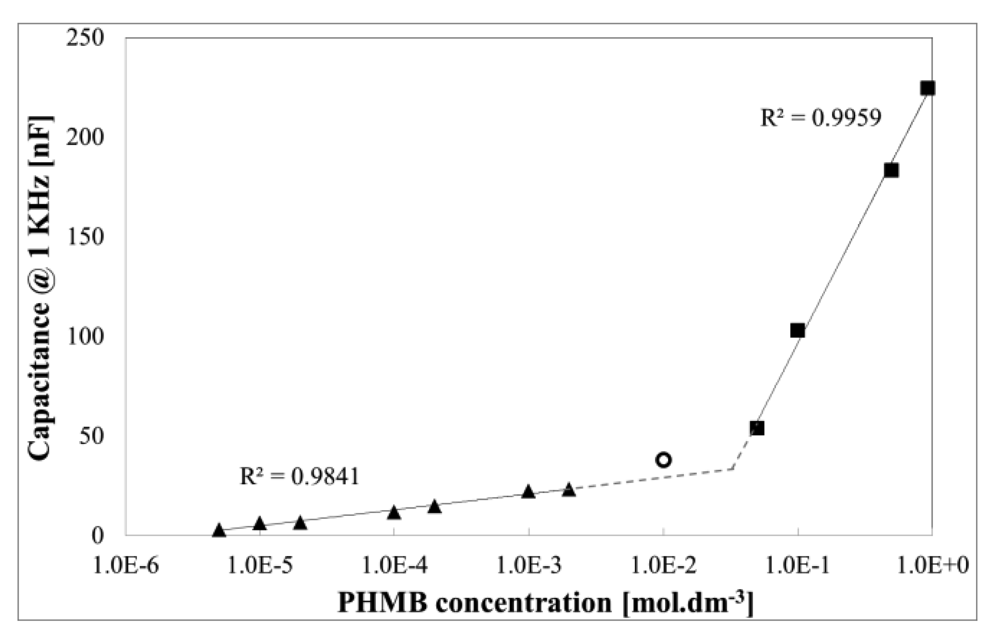
In a further experiment to understand the structure of PHMB in solution, we performed electrochemical impedance measurements to evaluate how the electrode-particle interaction occurs. If our presumption of micelle formation is right and behavior of PHMB is similar to a typical surfactant, a hemimicelle should be formed over the electrode when a concentration near the CMC is reached, evolving to an admicelle as concentration increases. Electrical impedance is very sensitive to interface structure; PHMB is expected to be a good electrical insulator, so the impedance of the electrode should increase in a non-linear way with micellar structuration. We measured electrical capacitance at varying concentrations, from the most diluted to the most concentrated, after a fixed time of adsorption (two minutes), and observed two distinct regimes of capacitance increment, both following power laws, but when concentration is 5 × 10⁻² mol dm−3 or higher, a much steeper increase in capacitance can be observed. The concentration of 1 × 10⁻² mol dm−3 lies in the transition of the two regimes, as seen in Figure 4.
When the concentration is low, polymer chains in Brownian motion reach the electrode surface and become adsorbed in a disordered way, forming a layer called hemimicelle. This disordered layer reflects the low order existing in the bulk solution; when concentration increases, more polymer chains hit the electrode surface per unit time, thickening the layer, and the measured capacitance increases proportionally. However, when the CMC is reached, the order in the bulk solution suddenly changes and micelles hit the electrode surface, becoming adsorbed in a distinct way. The adsorbed layer is still poorly ordered, but much thicker and with high free volume fraction. Such architecture leads to a much higher increase in capacitance with concentration still following a power law, but growing much faster compared with the hemimicellar growth.
As seen in Table 2, the three experiments roughly agree on the concentration range for CMC. Surface tension and impedance measurements disagree for the lower limit, but the most relevant is the higher limit as CMC is the maximum concentration after which the material adopts globular conformation. Thus, we can accept, until more refined measures are undertaken, 5 × 10⁻² mol dm−3 as being roughly the CMC value for commercial PHMB in water at 273 K.
2.3. Spectroscopic Characterization
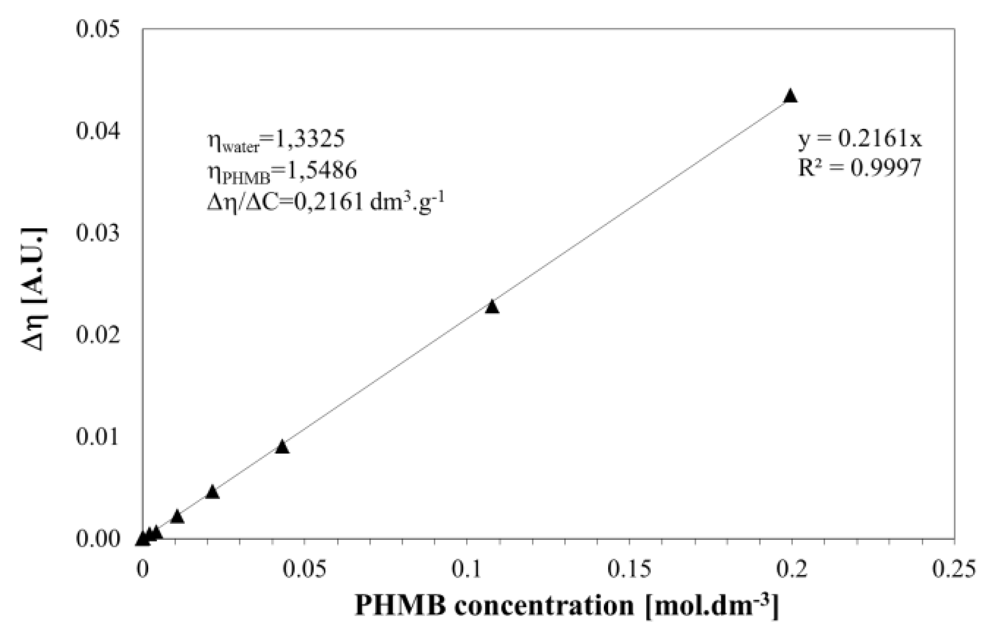
Index of refraction was measured by extrapolation of refractive index of the water solutions of PHMB in a digital refractometer (Figure 5). Extrapolating to 100% weight fraction of PHMB, the refractive index is 1.5486, and the refractive index increment of the solution dη/dC = 0.2161 dm3 g−1.This last parameter is fundamental to molecular weight determination by static light scattering through Debye plots.
Index of refraction is a fundamental parameter for dynamic light scattering, and should be provided in the same wavelength as the laser source. Our refractometer uses a 598 nm light source but the laser source from the Zetasizer is centered at 633 nm, so, an error may exist. As PHMB absorption is negligible at this spectral range, this error was neglected.
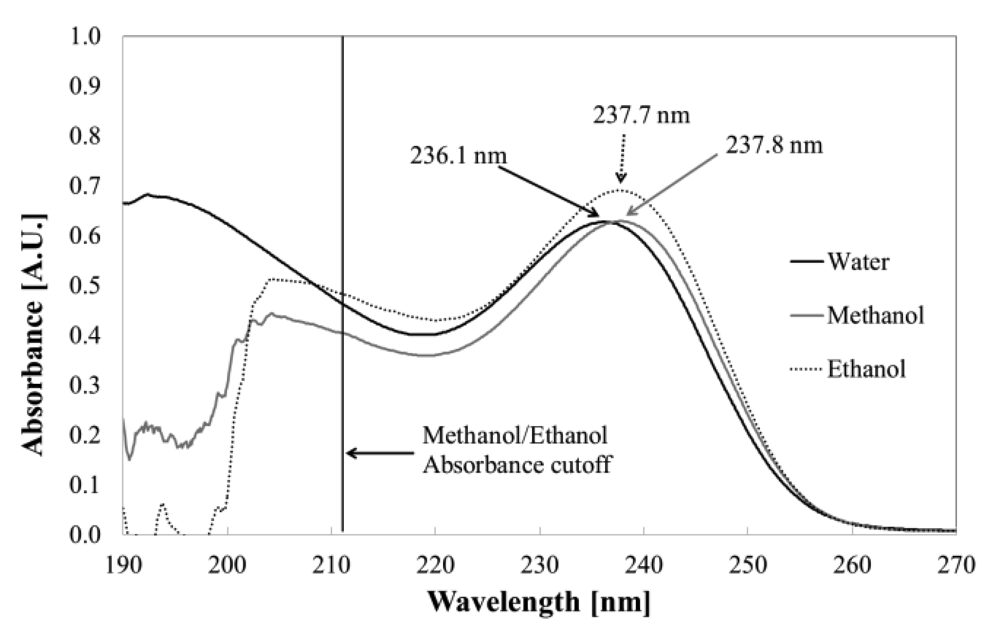
Aqueous solutions of PHMB show no absorption in the visible range, but strong bands at 236 nm (ε = 1,297 m2 mol−1), attributed to π-π* transition of –C=N– in the biguanide group [17], and 192.4 nm (ε =1,409 m2 mol−1) attributed to π-π* transition from –C–NH– groups [18].
As seen in Figure 6, in the methanolic solution, a small bathochromic shift of 1.7 nm can be observed in the –C=N– band, with almost unchanged ε; for ethanolic solution, the shift is the same compared to water, but ε increases to 1,428 m2 mol−1. Due to high absorption above 210 nm from the solvent, the band at 192 nm could not be observed in alcoholic solutions.
The decreased polarity of alcohols compared to water explains the bathochromic shift because a more polar solvent will stabilize the polar ground state of protonated biguanide. Ethanol has a dielectric constant comparable to that of methanol, and both well below the dielectric constant of water.
Moreover, the higher molar absorption coefficient for ethanolic solution arises from this difference in polarity: Ethanol has lower polarity and lower tendency to form hydrogen bonds. Dielectric constant and Hansen solubility parameters of selected solvents for PHMB are presented in Table 3; we can easily observe that the energy associated to polarity is lower for ethanol when compared to all other solvents, and hydrogen bonding tendency is lower when compared to methanol and water. Clearly, weaker interaction of biguanide with solvent molecules allows higher energy absorption, thus increasing the molar absorption coefficient. It can also explain why solubility in ethanol is the lowest in all of tested solvents, being lower than 1% in weight, in accordance with literature [9]. To further test our hypothesis, we dissolved PHMB at same concentration in N,N-dimethylformamide (DMF), dimethylsulfoxide (DMSO) and m-cresol; unfortunately these solvents have strong absorption under 300 nm, making it impossible to measure the PHMB absorption profile and reach a conclusion on the solvathocromic effect.
In our discussion about micellar structure of PHMB in water, we stated that since the chain should fold in a very particular way, the entropy at this conformation is much lower than in a random coil conformation; hence, the hydration enthalpy must be high to overcome the contribution from negative entropy. As in ethanol, the interaction polymer-solvent is much lower, we do not expect a micellar structure for PHMB in this solvent; if this is the case, it will further corroborate the discussion drawn in this section. This experiment will be performed and results published in the future.
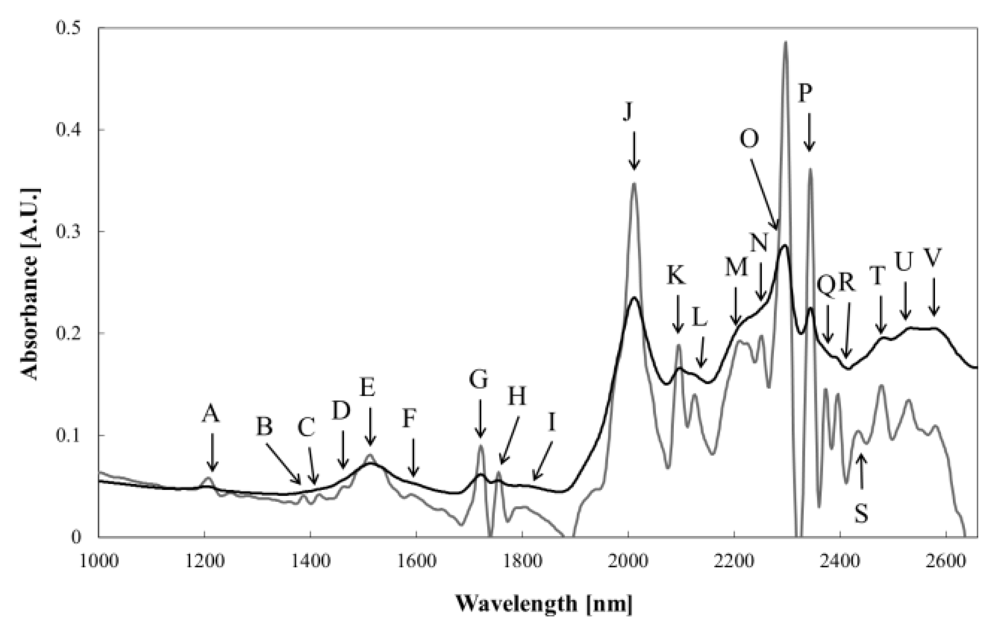
Infrared absorption spectrum of PHMB was obtained by near-infrared spectroscopy (NIR). While spectroscopy in the mid-infrared (MIR) shows fundamental bands associated with bond vibrations, NIR presents harmonic and combination bands; the easer preparation, higher signal-to-noise ratio and fast analysis make this technique very interesting. In Figure 7 we present the NIR spectrum from PHMB film cast from water solution over a quartz plate. The original spectrum shows few bands, but deconvolution uncovers several additional vibrations. The most important are those located at 2,000–2,400 nm range, corresponding to nitrogen-related vibrations, including combination bands due to nitrogen-carbon bonds in the biguanide pseudo-aromatic ring. Remaining bonds are due to methylene groups and residual hydration water. Bands associated to chlorine ion are not present, but the "bonded" behavior of some vibrations may be due to chloride interference on –N–H vibrations. Assignment for NIR bands are listed in Table 4.
2.4. Thermal Analysis
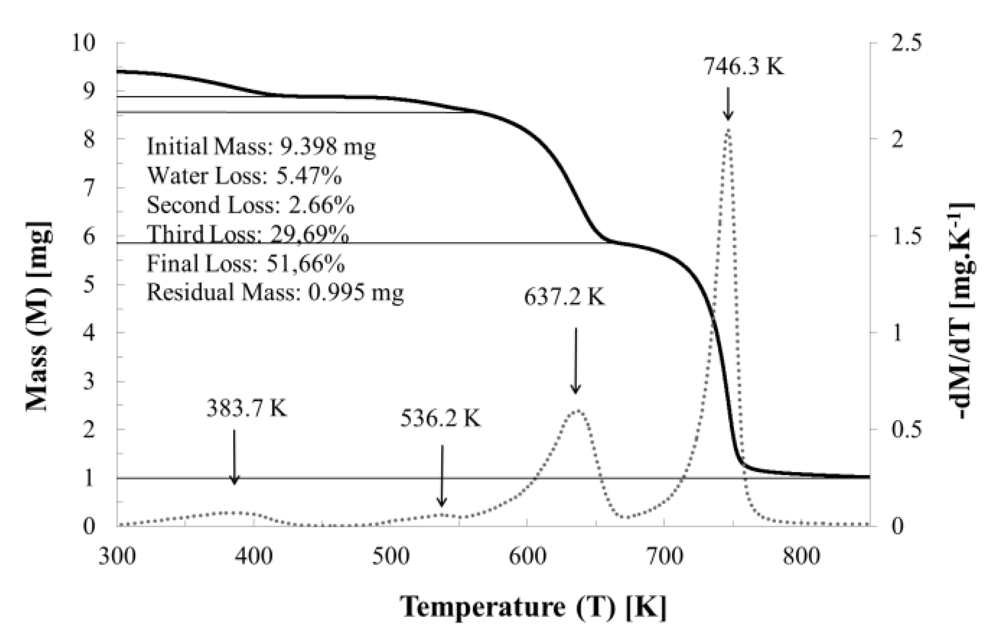
Thermogravimetric analysis (TGA) of PHMB shows a clear water loss up to 420 K, with a water mass of 5.47% (Figure 8); it means less than one water molecule per biguanide group in the solid material. Probably, a higher amount of water is adsorbed at material surface and an even lower molar ratio of water to biguanide is present in the material bulk. It is an important aspect to consider when evaluating the water effect in material properties. The mass loss with peak at 536 K is believed to be the loss of guanidine from chain ends, and the loss at 637 K is the guanidine and chloride loss from broken biguanide groups, with extensive backbone fragmentation. At 746 K the degradation of backbone takes place, leaving 11.2% of mass (in polymer basis), probably graphite and carbon nitride.
The TGA thermogram shows that up to 480 K negligible polymer mass loss is observed; if degradation occurs, the mass is preserved, which means that reactions like ring formation, crosslinking and depolymerization/repolymerization must occur to keep mass unchanged. Chain degradation at temperatures above 463 K is reported by East et al. [10].
Differential scanning calorimetry (DSC) thermograms of PHMB are poorly resolved if obtained from samples cast from water solutions. Excessive water loss changes the mass and heat flow considerably making it almost impossible to observe clear transitions. To overcome this problem, firstly the sample was dried and thermal history destroyed running a heating ramp up to 463 K and keeping isothermally for five minutes. Thereafter, it was cooled to 193 K at 5 K min−1, again to 463 K, and finally to an ambient temperature.
After the first heating ramp, a clear glass transition was detected both in cooling and heating, at ∼341 K; but no fusion or crystallization occurred, indicating that if crystallization takes place it is a very slow process, needing a very long heat treatment time.
The amorphous nature of PHMB agrees with previous reports, but the glass transition disagrees with results obtained from literature [5,7]. One explanation is presence of water, which has a plasticizing effect, and a distinct molecular weight. Actually, if PHMB has a glass transition above ambient temperature it should be a rigid material when dry; extensive drying of PHMB film is effective in turning the plastic, sticky material into a brittle film. Leaving the film exposed at environment air, the sticky behavior is recovered. We conclude that water is a good plasticizer for PHMB, which is very hygroscopic, and it points to the need of completely anhydrous samples to determine glass transition temperature.
A second explanation is the formation of melamine rings and crosslinking after degradation at high temperatures; it was previously observed for PHMB at temperatures above 463 K, where the increase in Tg from 318 to 323 K for material made by melt polymerization is attributed to degradation side-reactions [10]. In our case, an increase of 18–23 K is too much to be only due to degradation since it is not expected to occur with high yield at temperatures below 463 K. We believe that both phenomena, water plasticization and thermal degradation, contribute to the distinct glass transition temperature observed.
To gather further evidence, a DSC heating ramp up to 523 K was performed to verify the Tg shift to higher temperatures which are expected if degradation plays an important role in this phenomena. The Tg was shifted to ∼355 K in both cooling and heating (2nd heating ramp), proving how relevant degradation is for the thermal properties of PHMB.
It is noteworthy that the glass transition temperature cited by East et al. in Table 1 [10] and in the discussion that follows does not match the temperature determined by the tangent method (or by first derivative method) when applied to the DSC thermograms presented in Figure 5(A) [10]. The Tg, when evaluated from this graphic must be in the range 333–353 K, matching the results we obtained, but reasonably far from the result of 318–323 K presented in that paper. The reason for these conflicting results is unknown.
3. Experimental Section
PHMB was supplied by Arch Biocides do Brasil as Vantocil™ IB, a 20% w/w solution in water. Water used in all experiments was reagent grade supplied by a Barnstead™ Diamond ultrapurification system. All solvents used were of 99% minimum purity. For dynamic light scattering, interfacial tension and refractivity experiments, PHMB solution was previously filtered in a Milipore™ Millex membrane with 450 nm pore diameter.
Particle size by dynamic light scattering was measured in a Malvern Zetasizer Nano ZS with a red laser using disposable acrylic cuvettes. Electrochemical impedance measurements were performed using interdigitated electrodes of sputtered gold over NiCr in a BK7 glass base, with 50 pairs of parallel tracks, each with 10 μm width, 5,000 μm length and 10 μm inter track spacing. A Solartron 1260A Impedance Gain/Phase Analyzer was used to apply 10 mV of senoidal voltage at 1 KHz. Surface tension measurements were performed in a KSV 101 goniometer by pendant drop goniometry.
Viscosity measurement was made in a Brookfield LV DV-I torque rheometer using a small sample adapter, filled with 7 mL of solution, at 100 rpm with spindle #18. UV/Vis absorption measurements were performed in a Shimadzu UV-1601 UV/Vis/NIR spectrophotometer using quartz cuvettes of 1.00 cm path length. Refractive index was measured in an Atago RX-5000α digital refractometer. FT-NIR transmission spectrum was measured in a Perkin Elmer Spectrum 100N FT-NIR spectrometer with InGaAs detector, with 16 cm−1 resolution, from a film cast from aqueous solution.
Differential scanning calorimetry was performed in a TA Instruments Q100 DSC with aluminum pan and N2 flux (50 cm3 h−1). To avoid over-pressurization due to water vaporization, a small hole (<1 mm) was drilled in the pan lid. Thermogravimetric analysis was performed in a TA Instruments Q500 TGA using a platinum crucible, under N2 flux and heating rate of 10 K min−1.
Unless otherwise noted, all measurements were made at 293 K.
4. Conclusions
Commercially available PHMB can be a very useful material for supramolecular chemistry due to abundance of hydrogen bond sites (amines), good chelation properties, easy processing from aqueous solutions, and low cost. However, detailed information about physical and chemical properties is lacking. This paper contributes to clarify some relevant points to allow further work on application of PHMB for building new complex materials and devices.
We show that in water solutions, PHMB behaves as a low-foaming surfactant, with a critical micellar concentration near 5 × 10⁻² mol dm−3 in water at 293 K. It is poorly soluble in ethanol, but soluble in methanol, DMSO, DMF and m-cresol. It is easily processable to films, but water balance is crucial to mechanical stability since water is a plasticizer: High water contents led to sticky, mechanically unstable films; completely anhydrous film is very brittle and hygroscopic.
Investigations of blends and organometallic polycomplexes of PHMB with adjustable optical, thermal and mechanical properties are underway in our laboratory. New reports about these investigations will be published in the near future.


| Target Parameter | N=40 | ||
|---|---|---|---|
| t | 0.7470 | 0.8463 | 0.9166 |
| 3.95 | 6.50 | 12.0 | |
| 6.90 | 12.0 | 23.0 | |
| Mer mass (g mol−1) | 225.82 | 223.16 | 221.45 |
| 868.5 | 1,429 | 2,634 | |
| 1,517 | 2,639 | 5,049 | |
| PDI | 1.75 | 1.85 | 1.92 |
| n, 99.99% cumulative mass | 40 | 70 | 134 |
| Measurement Method | Concentration (mol dm−3) | |
|---|---|---|
| Lower Limit | Higher Limit | |
| Dynamic Light Scattering | 10−3 | 10−2 |
| Pendant Drop Goniometry | 2 × 10⁻² | 5 × 10⁻² |
| Capacitance at 1.0 KHz | 2 × 10⁻³ | 5 × 10⁻² |
| Solvent | ε (A.U.), 25 °C | Solubility parameters (MPa1/2) | |||
|---|---|---|---|---|---|
| δT | δd | δp | δh | ||
| Water | 80.1 | 47.8 | 15.5 | 16.0 | 42.3 |
| Dimethyl sulfoxide | 46.7 | 26.7 | 18.4 | 16.4 | 10.2 |
| Dimethyl formamide | 36.7 | 24.9 | 17.4 | 13.7 | 11.3 |
| Methanol | 32.7 | 29.6 | 15.1 | 12.3 | 22.3 |
| Ethanol | 24.5 | 26.5 | 15.8 | 8.8 | 19.4 |
| m-Cresol | 11.8 | 24.1 | 18.0 | 8.9 | 13.3 |
| Peak | Wavelength (nm) | Bond (Vibration) | Remarks |
|---|---|---|---|
| A | 1,206 | C–H (3ν) | Methylene |
| B | 1,388 | SiOH | Quartz subtrate |
| C | 1,416 | C–H | Methylene combinations |
| D | 1,436 | N–H (2ν)/C–H | Primary amine/methylene combination |
| E | 1,464 | N–H (2ν) | Secondary amine |
| F | 1,590 | O–H (2ν) | Water, bonded |
| G | 1,722 | C–H (2ν) | Methylene |
| H | 1,756 | C–H (2νs) | Methylene |
| I | 1,804 | O–H | Combination from water, bonded |
| J | 2,012 | N–H/C–N | Combination from –[N(H)]2–C=N– |
| K | 2,096 | O–H (3δ) | Water |
| L | 2,126 | N–H/C=N | Combination from –[N(H)]2–C=N– |
| M | 2,210 | N–H/C–N/C=N | Combination from –[N(H)]2–C=N– |
| N | 2,252 | N–H | Bonded, from amides |
| O | 2,298 | N–H | Bonded, from amides |
| P | 2,344 | C–H (2ν) & C–H (δ) | Combination, from methylene |
| Q | 2,372 | C–H (2νs) & C–H (δ) & C–C (ν) | Combination, from methylene |
| R | 2,396 | C–H (ν)/C–C (ν)/C–H (δ)/C–C (δ) | Aromatic biguanide ring |
| S | 2,434 | C–H (ν)/C–C (ν)/C–H (δ)/C–C (δ) | Aromatic biguanide ring |
| T | 2,478 | C–H (3δ) | Aromatic biguanide ring |
| U | 2,530 | C–N (2νa) | C–N–C from biguanide |
| V | 2,580 | C–H (ν)/C–H (ω)/C–C (ω) | Aromatic biguanide ring |
Acknowledgments
We would like to thank MCT/FINEP, CAPES, CNPq and EMBRAPA for financial support.
References
- Vantocil™ IB Antimicrobial-Technical Information Bulletin; Arch Chemicals, Inc.: Cheschire, CT, USA, 2005.
- Roth, B.; Brill, F.H.H. Polihexanide for wound treatment—how it began. Skin Pharmacol. Physiol. 2010, 23 suppl. 1, 4–6. [Google Scholar]
- Rose, F.L.; Swain, G. Polymeric Diguanides. Great Britain Patent 702,268, 13 January 1954. [Google Scholar]
- Kaehn, K. Polihexanide: A safe and highly effective biocide. Skin Pharmacol. Physiol. 2010, 23 suppl. 1, 7–16. [Google Scholar]
- Koburger, T.; Hübner, N.-O.; Braun, M.; Siebert, J.; Kramer, A. Standardized comparison of antiseptic efficacy of triclosan, PVP-iodine, octenidine dihydrochloride, polyhexanide and chlorhexidine digluconate. J. Antimicrob. Chemother. 2010, 65, 1712–1719. [Google Scholar]
- Ray, P. complex compounds of biguanides and guanylureas with metallic elements. Chem. Rev. 1961, 61, 313–359. [Google Scholar]
- Lebel, O.; Maris, T.; Wuest, J.D. Hydrogen-bonded networks in crystals built from bis(biguanides) and their salts. Can. J. Chem. 2006, 84, 1426–1433. [Google Scholar]
- Britz, J.; Meyer, W.H.; Wegner, G. Poly(alkylene biguanides) as proton conductors for high-temperature PEMFCs. Adv. Mater. 2010, 22, E72–E76. [Google Scholar]
- European Chemicals Agency. CLH report—Proposal for Harmonised Classification and Labeling; Substance Name: Polyhexamethylene biguanide or Poly(hexamethylene) biguanide hydrochloride or PHMB, France, February 2010. Available online: http://echa.europa.eu/doc/consultations/cl/clh_axrep_france_phmb.pdf (accessed on 20 February 2010).
- East, G.C.; McIntyre, J.E.; Shao, J. Polybiguanides: Synthesis and characterization of polybiguanides containing hexamethylene groups. Polymer 1997, 38, 3973–3984. [Google Scholar]
- Abad-Villar, E.M.; Etter, S.F.; Thiel, M.A.; Hauser, P.C. Determination of chlorhexidine digluconate and polyhexamethylene biguanide in eye drops by capillary electrophoresis with contactless conductivity detection. Anal. Chim. Acta 2006, 561, 133–137. [Google Scholar]
- O'Malley, L.P.; Hassan, K.Z.; Brittain, H.; Johnson, N.; Collins, A.N. characterization of the biocide polyhexamethylene biguanide by matrix-assisted laser desorption ionization time-of-flight mass spectrometry. J. Appl. Polym. Sci. 2006, 102, 4928–4936. [Google Scholar]
- Odian, G. Principles of Polymerization, 4th ed.; Wiley Interscience: Hoboken, NJ, USA, 2004; pp. 80–87. [Google Scholar]
- Kestin, J.; Sokolov, M.; Wakeham, W.A. Viscosity of liquid water in the range −8 ° C to 150 °C. J. Phys. Chem. Ref. Data 1978, 7, 941–948. [Google Scholar]
- McClements, D.J.; Dungan, S.R. Light scattering study of solubilization of emulsion droplets by non-ionic surfactant solutions. Colloid. Surf. A-Physicochem. Eng. Asp. 1995, 104, 127–135. [Google Scholar]
- Para, G.; Hamerska-Dudrab, A.; Wilkb, K.A.; Warszyńskia, P. Surface activity of cationic surfactants, influence of molecular structure. Colloid. Surf. A-Physicochem. Eng. Asp. 2009, 365, 215–221. [Google Scholar]
- Nandi, S.D. Spectrophotometric (UV) investigation on biguanide and substituted biguanides. Tetrahedron 1972, 28, 845–853. [Google Scholar]
- Woźniak, B.; Dera, J. Light Absorption in Sea Water; Springer: New York, NY, USA, 2007; pp. 124–126. [Google Scholar]
- Hansen, C.M. Hansen Solubility Parameters: A User's Handbook, 2nd ed.; CRC Press: Boca Raton, FL, USA, 2007; p. 38. [Google Scholar]
- Workman, J., Jr.; Weyer, L. Practical Guide to Interpretative Near-Infrared Spectroscopy; CRC Press: Boca Raton, FL, USA, 2008; pp. 240–262. [Google Scholar]
© 2011 by the authors; licensee MDPI, Basel, Switzerland. This article is an open access article distributed under the terms and conditions of the Creative Commons Attribution license (http://creativecommons.org/licenses/by/3.0/).
Share and Cite
De Paula, G.F.; Netto, G.I.; Mattoso, L.H.C. Physical and Chemical Characterization of Poly(hexamethylene biguanide) Hydrochloride. Polymers 2011, 3, 928-941. https://doi.org/10.3390/polym3020928
De Paula GF, Netto GI, Mattoso LHC. Physical and Chemical Characterization of Poly(hexamethylene biguanide) Hydrochloride. Polymers. 2011; 3(2):928-941. https://doi.org/10.3390/polym3020928
Chicago/Turabian StyleDe Paula, Gustavo F., Germano I. Netto, and Luiz Henrique C. Mattoso. 2011. "Physical and Chemical Characterization of Poly(hexamethylene biguanide) Hydrochloride" Polymers 3, no. 2: 928-941. https://doi.org/10.3390/polym3020928