Simplified Reflection Fabry-Perot Method for Determination of Electro-Optic Coefficients of Poled Polymer Thin Films

Abstract
: We report a simplified reflection mode Fabry-Perot interferometry method for determination of electro-optic (EO) coefficients of poled polymer thin films. Rather than fitting the detailed shape of the Fabry-Perot resonance curve, our simplification involves a technique to experimentally determine the voltage-induced shift in the angular position of the resonance minimum. Rigorous analysis based on optical properties of individual layers of the multilayer structure is not necessary in the data analysis. Although angle scans are involved, the experimental setup does not require a θ-2θ rotation stage and the simplified analysis is an advantage for polymer synthetic efforts requiring quick and reliable screening of new materials. Numerical and experimental results show that our proposed method can determine EO coefficients to within an error of ∼8% if poled values for the refractive indices are used.1. Introduction
Second-order nonlinear polymers have been widely studied because of their potential applications in high-speed communication and signal processing [1]. A simple and reliable characterization method for linear electro-optic (EO) coefficients has been an important issue because researchers who are extensively working on the development of new materials prefer a simple method to quickly screen newly-engineered nonlinear optical (NLO) polymers. Measurements of the EO coefficients of second-order NLO polymers (NLOP) have often been carried out using a reflective arrangement introduced by Teng and Man as well as by Schildkraut, both in 1990 [2,3]. However, in many cases, large systematic errors can result from the simple analysis because it ignores potential multiple reflection effects in a stratified structure [4,5]. In 2006, Park et al. reported a rigorous analysis of the Teng-Man technique taking into account all layers of the sample structure to get a reliable result [4]. This analysis requires accurate layer information, such as anisotropic refractive indices and thickness of each layer. Although single angle of incidence data and analysis can be performed, more extensive data taking at multiple angles together with a fitting process gives the most reliable results.
Using a reflective sample structure as one of the mirrors, Mach-Zehnder interferometry [6,7] and a Michelson interferometry method [8] have been reported for measuring EO coefficients as well as piezoelectric contributions [7,8]. They can also be shown to have similar systematic errors if multiple reflection effects are ignored. In addition, these interferometric methods require careful aligning of the signal and reference beams and the interference pattern is susceptible to drift. Although the Mach-Zehnder method can be used to determine both r13 and r33, the Michelson method can only measure r13 and a separate experimental technique must be used to get r33. The modified attenuated total reflection (ATR) method [9,10] can also measure r13 and r33 separately, without an assumption for the value of the ratio r13/r33 as required in both the simple and rigorous Teng-Man reflection methods [2-4]. The metal electrode must be removed to enable ATR characterization in order to couple light into the nonlinear thin film using a prism. Removal of the electrode, however, eliminates the option to re-pole the sample under different poling conditions in the process of optimization.
A spectroscopic Fabry-Perot (FP) method was introduced by Uchiki et al. [11] for the characterization of both second- and third-order nonlinearities. This method requires inclusion of a complete picture of the multilayer structure parameters in the analysis. Eldering et al. [12] demonstrated the use of a transmission mode FP etalon with angle scanning at a fixed wavelength to study second-order nonlinear properties of polymer materials by fitting numerical data based on a relatively simple analysis of the multilayer structure requiring two semitransparent electrodes. O'Brien et al. [13] introduced a variation of the transmission FP technique using a thick glass substrate. The use of FP analysis was later applied by Pretre et al. [14] to decal-deposited reflection FP structures in order to measure complex linear optical and electro-optic parameters as well as to characterize the inverse piezoelectric contribution. This analysis takes into account the complete multilayer structure properties and requires fitting the detailed shape of the Fabry-Perot resonance curve. This reflective FP method also requires a θ-2θ rotation stage in the experimental setup.
In this paper, we present a somewhat simplified experimental setup not requiring a θ-2θ rotation stage together with a simplified analysis of reflection mode Fabry-Perot interferometry. As in the rigorous FP analysis methods [14], a transparent yet highly reflective layer such as a transparent conducting oxide (TCO) or thin gold is employed. In this simplified technique, however, the analysis of data does not require separate measurement and fitting of the optical properties of the electrodes, as is required in earlier [14] rigorous FP methods. Rather than fitting the detailed shape of the Fabry-Perot resonance curve as in [14], our simplification involves a technique to experimentally determine the voltage-induced shift in the angular position of the resonance minimum. The simplified method can give a reliable measurement within an error of ∼8% at telecommunication wavelengths of 1,300 nm and 1,550 nm without including the complete multilayer structure in the analysis. We show numerical simulations using rigorous analysis to justify the simplified analysis for extracting EO coefficients. Experimental results are given and we discuss limitations and errors depending on optical properties of the electrode layers and nonlinear films.
2. Experimental Setup and Data Analysis
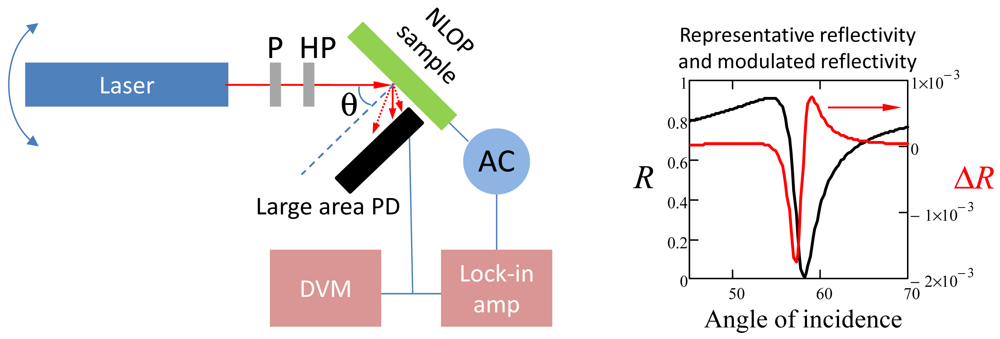
Angle-dependent reflectivity and voltage-modulated reflectivity data are collected using the experimental setup shown in Figure 1. A polarizer and half wave plate are used to produce the two independent linearly polarized states. A large area infrared photo-detector is used to detect reflected light over a wide range of angles of incidence in order to collect angular data without the need for the θ-2θ rotation stage used in [14] to maintain alignment as the laser source arm rotates.
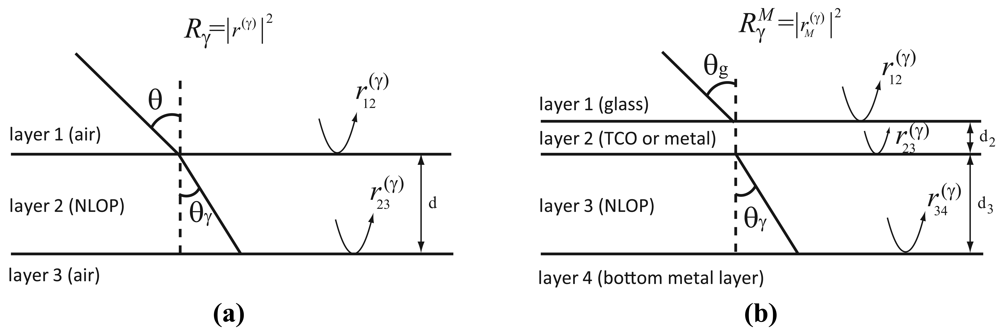
In order to analyze the experimental data for determination of the two independent EO coefficients r13 and r33 of poled polymer thin films, we consider the phase condition for reflection minima for two different FP resonator structures shown in Figure 2: (a) the idealized simple three layer structure (air/NLOP/air) and (b) the multilayer structure (glass/TCO/NLOP/metal). We first use the mathematical expression for reflectivity to discuss the phase condition from the simple three layer structure, which can be found in most optics textbooks [15]. Then we revisit the rigorous expression for reflection from a multilayer structure, which has already been described previously [11,14], for application of the phase condition to the practical multilayer structure and for justification of our simplified analysis.
2.1. Simplified Analysis Based on Ideal Three Layer Fabry-Perot Structure
The reflection coefficient for the simple three-layer FP resonator can be obtained using Airy's formula [15]. It is well known that the intensity of a reflected wave is a periodic function with respect to the phase of the reflected wave. In the case that the film is lossless, the reflectivity is given by
From the angular shift Δθ of reflectivity minima, the modulated refractive indices Δns and Δnp can be calculated using Equation (6). Δno = Δns is then obtained directly. Δne is obtained from Δnp and Δno using the index ellipsoid for a uniaxial anisotropic medium [15], viz.,
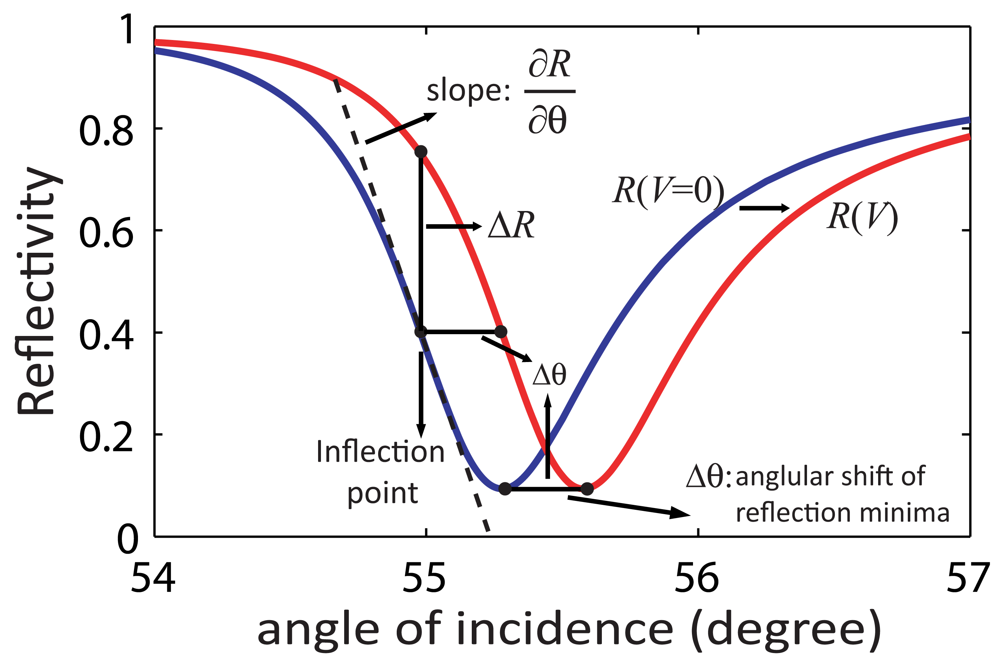
Experimentally, direct observation of the angular shift of reflectivity minima under an applied voltage V is not easy because of the small angular shift and uncertainty of minima position. Application of a high voltage for direct observation may lead to damage on the thin film and the metal electrode. Use of a lock-in amplifier permits measurement of small modulations, but it is impossible to detect modulation at the reflection minima because the slope of the reflectivity is zero at the minima. Figure 3 shows representative reflectivity curves with and without an applied voltage. Assuming the new reflectivity curve R(V) under the external voltage V is only shifted slightly in θ from R(V = 0), by expanding to 1st order we have
The modulated reflectivity ΔRγ is measured by lock-in amplifier at incident angles around the reflectivity minima where the voltage-modulated reflectivity is in the linear regime for validation of a Taylor expansion to first order. These angles can be found where the reflectivity has the largest gradient, viz., inflection points. The derivative ∂Rγ/∂θ is numerically calculated from experimental reflectivity data as a function of angle of incidence. The changes of refractive index Δno and Δnp are calculated using
Equations (9), (11), and (12) are all that is needed to determine r13 and r33 in this simplified model. In the next section, we explore the validity of using Equation (6) for the practical multilayer structure of Figure 2(b). It should again be noted that Equation (6) holds only at the reflectivity minima. Therefore, the angle at the inflection point should be close enough to the reflectivity minima in order to minimize a possible systematic error. Such a sharp reflectivity curve can be obtained from a high Q resonator structure containing a highly reflective transparent electrode layer. A transmission type FP method with two transparent conducting electrodes can be used, but the low finesse resulting from the relatively low reflectivity would cause broadening of the transmission peak [14].
2.2. Rigorous Analysis Justification of the Simplified Method for a Practical FP Structure
A practical poled polymer thin film sample is a multilayer structure glass/(TCO or metal)/NLOP/metal as shown in Figure 2(b). Similar to the simple FP structure, the reflection coefficient of the multilayer structure has the form [15]
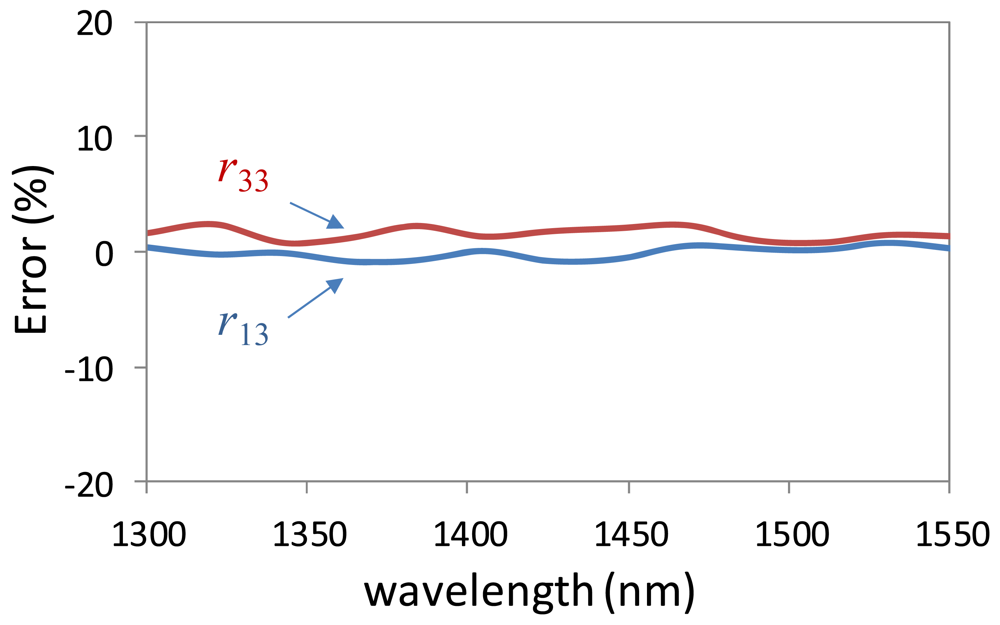
Figure 4 shows the simulated errors of r13 and r33 with varying wavelengths of 1,300 nm–1,550 nm for one of the many parameter combinations we explored We assumed a 4 μm thick NLOP film with dispersive anisotropic indices and EO coefficients (no = 1.73, ne = 1.75, r13 = 50 pm/V, and r33 = 150 pm/V at 1,550 nm) on 30 nm thick gold layer and calculated the angular shift of the reflection minima obtained from Equation (14) under the application of 5 V to the film. Then, Equations (9), (11), and (12) were used to extract values for EO coefficients from the changes of anisotropic refractive indices and subsequently compared with the input EO coefficients to obtain the error estimate as shown in Figure 4. The overall errors of both r13 and r33 in the telecommunication wavelength range fall under ∼3%, indicating that Equation (6) is valid for the analysis of the multilayer FP structure shown in Figure 2(b). It should be noted that we use Equation (14) for numerical modeling to verify the proposed method, but not for data analysis.
In principle, one should multiply the reflection coefficient in Equation (13) by the transmission coefficients at the air/glass and glass/air interfaces, but these do not contribute to the calculation of Δθ because they cancel out in Equation (10). Also, angle-dependent transmission at the detector facet is canceled out when the calculation of Equation (10) is performed.
Error in the EO coefficients can also result from the uncertainty in the film thickness and anisotropic indices, no and ne. This error is directly proportional to the uncertainty in the film thickness while the uncertainty in the refractive indices produces about three times higher errors in the EO coefficients because of the cubic dependence indicated in Equation (12). For example, assuming that an unpoled refractive index is 1.71 and the birefringence after the poling process is 0.03 with no = 1.7 and ne = 1.73, one might simply use the unpoled index for the analysis, which makes 0.6% and 1.2% errors in no and ne, respectively; then the errors in r13 and r33 caused only by the uncertainty in refractive indices are about 1.8% and 3.5%, respectively. In order to minimize these errors, the film thickness and anisotropic indices should be measured more precisely by prism coupling or other techniques, such as ellipsometry, after collection of the reflection FP data and removal of the metal layer. Although removal of the metal layer is also required for the ATR measurement technique, the data analysis is more straightforward in our simplified FP method.
3. Numerical Simulations to Determine Range of Validity
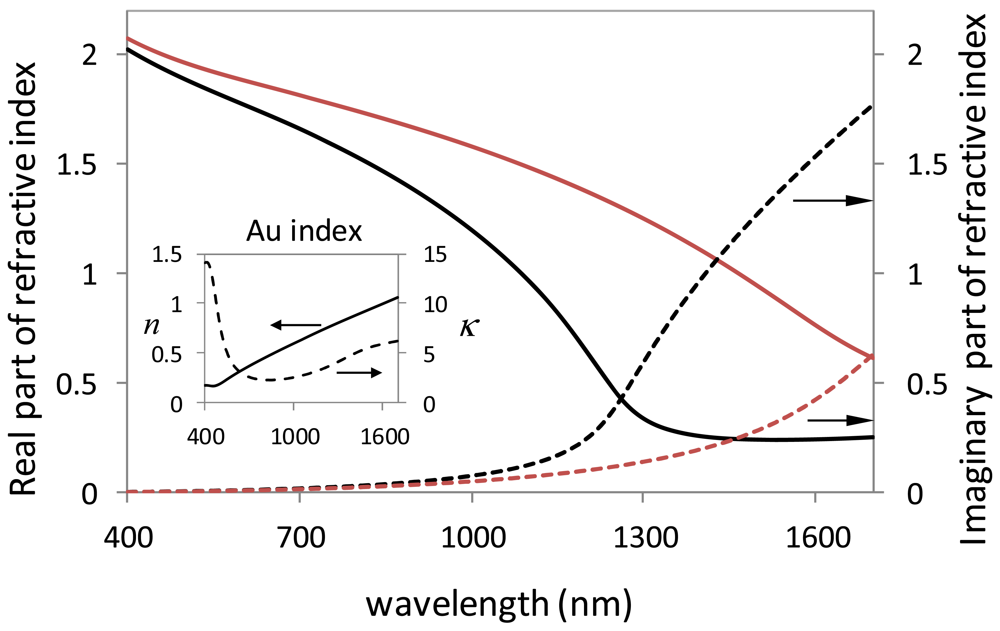
We investigated the suitability of both ITO and a thin gold layer as the transparent electrode to determine which type of electrode is appropriate for reliable estimation of EO coefficients. Numerical simulation has been performed based on the equations described in Section 2. We simulated three different cases using 30 nm thick gold and two different ITOs as the transparent electrode. The complex index of refraction, n and κ, of gold from [16] was used for the numerical calculation. Optical properties of two different ITOs, one manufactured by Delta Technology (DT) and the other by Thin Film Devices (TFD), were measured using a J. A. Woollam ellipsometer VASE® as shown in Figure 5. In the infrared, the linear absorption resulting from the extinction coefficient κ of 200 nm thick DT ITO is seen to be larger than that of 45 nm thick TFD ITO and it becomes even larger as the wavelength increases.
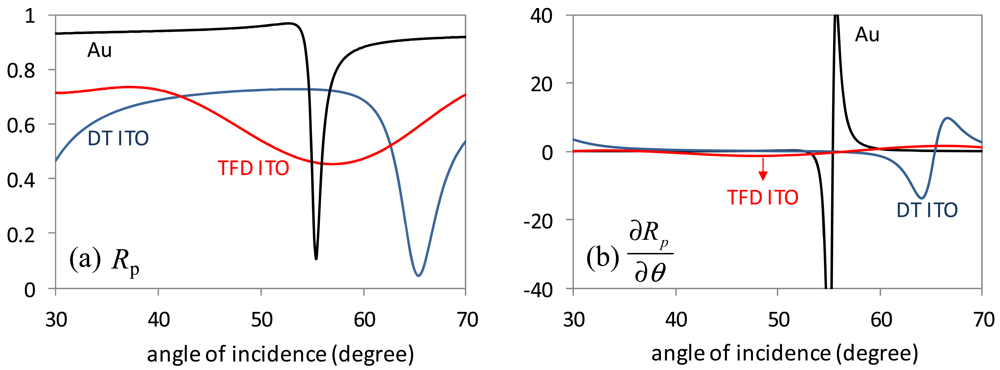
Figure 6(a) shows simulated reflectivities of p-polarized light [15,17] from multilayer structures containing either 30 nm thick gold or one of two ITO's (DT and TFD) as a top transparent electrode between the glass substrate and the NLOP film layer. The bottom metal (gold) layer is assumed to be ∼3 times thicker than its skin depth in order to ignore the back reflection from the gold/air interface. The sample containing 30 nm thick gold shows the highest finesse because of the strong reflection from gold, while the reflectivity dip from the TFD ITO layer is much broader than that of the DT ITO layer because it is relatively thin and has a smaller extinction coefficient as shown in Figure 5. A low Q factor as shown in the sample containing a TFD ITO layer turns out to be inappropriate for the proposed FP method because of the large systematic error resulting from the use of Equation (10) to determine the voltage-induced angular shift of the resonance minimum. The derivative of these reflectivity curves are shown in Figure 6(b). They were numerically calculated from the simulated reflectivity curves.
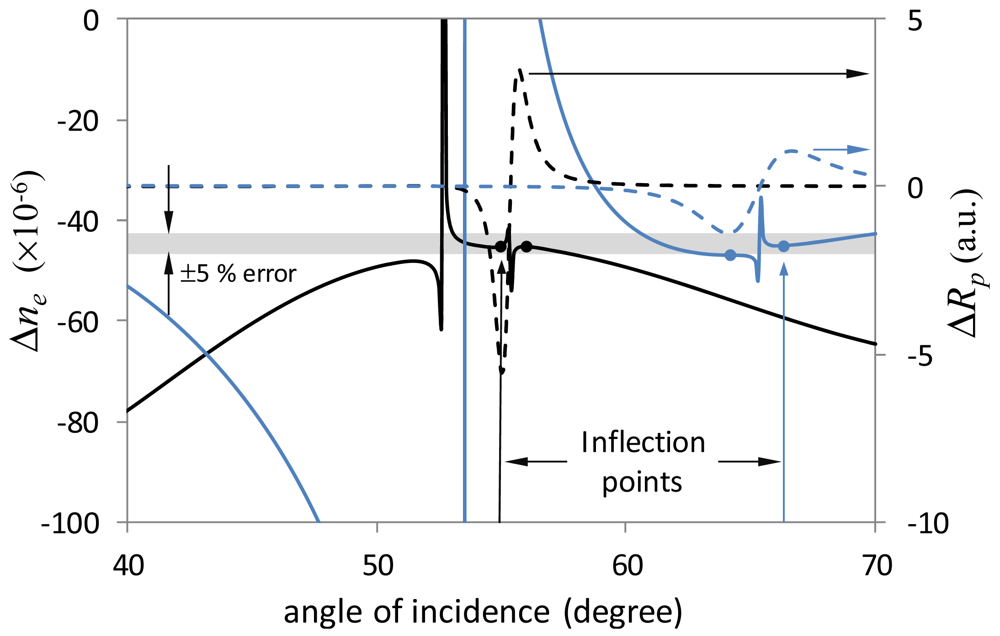
Figure 7 shows simulated Δne and ΔRp using Equations (9), (11) and (14) at 1,550 nm when a 30 nm thick gold layer and a 200 nm thick DT ITO were used as the transparent electrode. We find for both cases that the modulated refractive index Δne, which is directly proportional to the EO coefficient r33, is within about 5% at the angle of incidence corresponding to the highest reflectivity modulation. Note that higher accuracy (less than 2% error) was achieved from the sample containing the 30 nm thick gold layer. Typical indices of refraction for NLOPs range from 1.5 to 2 at telecommunication wavelengths. In this range of refractive index and at the wavelengths of 1,300 nm and 1,550 nm, numerical simulations indicate that less than 4% error is expected to be obtained with the 30 nm gold layer, whereas the DT ITO gave less than 6% error with varying thickness and refractive index. For s-polarized light, the modulated refractive index showed much smaller errors (within 2%) compared to p-polarized light.
The sample containing the TFD ITO layer, however, may give an error higher than 50% because of its low finesse resulting from relatively low reflectivity of the TFD ITO. Therefore, careful selection of a transparent conducting oxide should be made in order to make a higher Q resonator structure and reduce the error from using the simplified analysis. Once a highly reflective (absorptive) transparent conducting layer such as DT ITO or thin Au layer is employed in the sample, Equation (11) in the simplified method can be used to measure EO coefficients within an error of ∼5% if the refractive indices, thickness, and angles are known precisely. On the contrary, when the simple analysis is used in other ellipsometric or interferometric methods such as Teng-Man, Mach-Zehnder, and Michelson, multiple reflection effects caused by a highly reflective transparent conducting layer may give a much larger error. We also note that a large linear absorption by the nonlinear film will result in broadening of the reflectivity and lowering the Q factor, which could affect the accuracy. However, we find that this method is still appropriate even for a highly absorptive film provided κ= is not greater than ∼0.01, corresponding to ∼3,000 dB/cm at telecommunication wavelengths. The electro-chromic effect, the change of the extinction coefficient with applied field, can be ignored in this range of the extinction coefficient κ. Also, Equation (6) is still valid because only the real part of the phase term in Equation (4) determines the phase condition for the reflection minima.
In this simulation, we ignored any inverse piezoelectric contribution, but it can be characterized as described in the Appendix. According to [7], use of a modulation frequency above ∼1 kHz can minimize piezoelectric effects for AJLZ53/APC to d33 < ∼2 pm/V. A d33 less than ∼1 pm/V was reported for the materials investigated in [8,14]. However, materials with a relatively large piezoelectric contribution compared to EO effects would require piezoelectric measurements for accurate determination of EO coefficients. It is clear that the uncertainty of this simplified technique strongly depends on the finesse of FP structures and we claimed that highly reflective transparent conducting layer such as DT ITO or thin Au layer can be used for the EO characterization within ∼5% error provided the refractive indices, thickness and angular positions are known precisely. An uncertainty of ±0.5° in the angular position of the reflection minimum and ∼2% error in thickness can cause ∼1% and ∼2% errors in the EO coefficients, respectively. Including these uncertainties from angular position and film thickness, the total error of the simplified FP technique is expected to be about 8%. As discussed earlier, using unpoled rather than poled values for the refractive index can typically contribute another 2% and 4% error in r13 and r33, respectively.
For characterization at telecommunication wavelengths, the nonlinear film must have appropriate thickness in order to have a reflectivity dip within a range of angle of incidence from about 30–60°. This is also true for the previous reflective FP method introduced in [14] when using infrared wavelengths. For example, when the film index is about 1.7 at the wavelength of 1,550 nm, a 4–5 μm thick film will guarantee a reflectivity dip in this angle of incidence range. A rough rule of thumb is d3>3.7λ. Lower refractive index and shorter wavelength allow the NLOP film to be thinner. A thicker film may limit poling efficiency because a higher voltage for maintaining the same poling electric field can lead to damage on the film and/or the electrode. Note that there will also be bands of smaller film thickness (d3<3.7λ) allowing resonances in the measurable angle of incidence range, but their prediction requires the use of Equation (14).
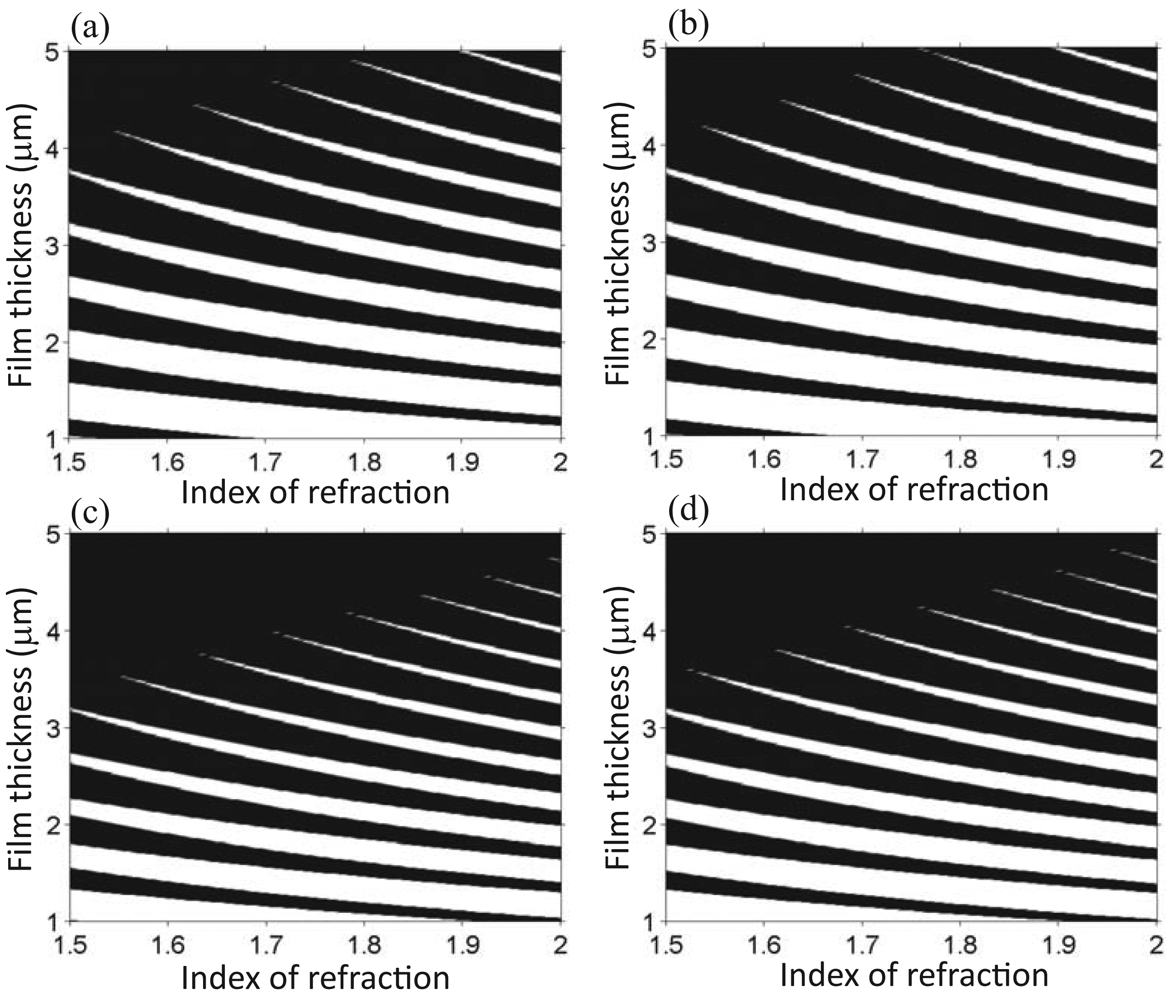
Figure 8 shows existence maps for reflection minima as a function of unpoled refractive index and film thickness within the range of angles of incidence between 30° and 60° when 20 nm thick gold is used as a transparent electrode for wavelengths of 1,320 nm and 1,550 nm. Increasing the gold thickness to 30 nm has little effect on the plots. Birefringence Δn (=ne − no) of the nonlinear film will slightly shift the reflection minima, but Δn of less than ∼0.06 will not affect the maps very much. When birefringence is large, on the other hand, one might need to extend the range of angles to capture a reflection minimum. For wavelengths other than 1,320 nm and 1,550 nm, Equation (14) can be applied to predict the angular position of the reflection minima to find the appropriate film thickness.
4. Experimental Example
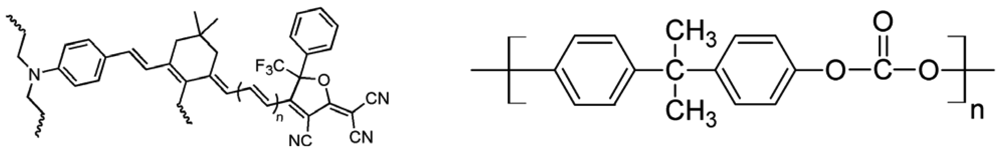
A nonlinear polymer thin film was prepared with 30 wt.% of AJLZ53, in an amorphous polycarbonate (APC) host as shown in Figure 9. The 10 wt.% doped polymer (AJLZ53 + APC) was dissolved in dibromomethane for a few hours. The solution was filtered through 0.2 μm poly(tetrafluoroethylene) (PTFE) filters and spin-coated to produce a ∼5 μm thick film on 200 nm thick indium tin oxide (ITO)/glass substrate manufactured by Delta Technologies (Product #: CB-40IN-0111). The film was dried under vacuum overnight at 80 °C to remove residual solvent. A 100 nm thick gold layer was deposited on the film using an electron-beam evaporator (CHA Mark-40) to serve as a poling electrode and reflector. Poling was performed in an inert nitrogen gas atmosphere near the glass transition temperature of 135 °C. The sample was heated up at 10 °C/min and the voltage was slowly increased to ∼50 V/μm. Once the temperature of 135 °C was reached, the sample was cooled down to room temperature rapidly with the voltage on.
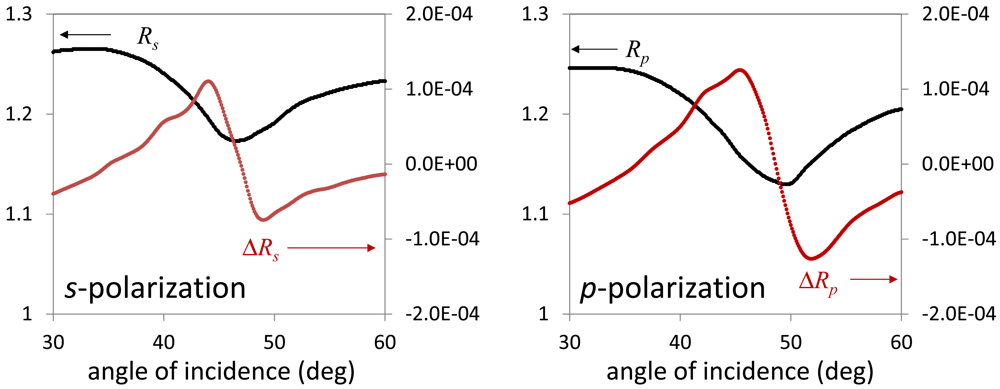
Figure 10 shows the experimental data from 30 wt.% AJLZ53/APC. Because we employed highly reflective DT ITO in this sample, the simplified method was used to estimate EO coefficients. The procedure is as follows. (i) Measure the reflectivity curves using a DC voltmeter and the modulated reflectivity curves using a lock-in amplifier as a function of angle of incidence for s- and p- polarized light as shown in Figure 10; (ii) Numerically calculate the derivatives of each experimental reflectivity curve ; (iii) Calculate the angular shift of the reflection minimum using Equation (10) applied at the maximum modulation point (inflection point); (iv) Calculate the voltage-induced changes in refractive indices and finally the EO coefficients using Equations (11) and (12), respectively, with known film thickness and anisotropic indices of refraction.
The poled anisotropic indices and thickness can be obtained precisely using the prism coupling technique. In our case, the gold layer was subsequently etched in order to perform an attenuated total reflection (ATR) experiment using a modified prism coupling setup [10] for verification of results from the simplified FP method as well as to obtain measurement of the thickness and anisotropic refractive indices. We obtained 15 pm/V and 50 pm/V for r13 and r33, respectively, using the simplified FP analysis, which showed good agreement (within ∼5%) with the values of 16 pm/V and 52 pm/V for r13 and r33 obtained using the ATR method.
5. Conclusions
We have presented a simplified reflection-mode Fabry-Perot method for estimation of EO coefficients of poled polymer thin films using a highly reflective transparent electrode layer. In the simple Teng-Man reflective method [2,3], a highly reflective electrode layer can produce FP effects at infrared wavelengths and result in large errors in the EO coefficients. Here, on the other hand, we have shown that we can utilize enhanced FP effects and typical NLOP samples that are incorporated with the highly reflective electrode layer such as gold or highly absorbing ITO are found to be able to give a reliable estimation of EO coefficients r13 and r33 separately within an error of 8–10% without a complete analysis of the multilayer structure. Rigorous analysis of the multilayer structure based on Equations (13) and (14) and optical properties of transparent electrode layer (TCO or thin metal) are not necessary for the analysis. However, accurate measurement of film thickness and anisotropic indices are important to avoid additional uncertainty in the EO coefficients. The 30 wt.% AJLZ53 in APC host poled under a relatively low poling field of 50 V/m showed an r33 of ∼50 pm/V at 1,550 nm. The EO response of the chromophore AJLZ53 yielded higher r33 values measured independently elsewhere [7] under a higher poling field of 100 V/m. Finally we expect that the simplified FP analysis combined with a highly reflective transparent conducting layer will be an advantage for polymer synthetic efforts requiring quick and reliable screening of new nonlinear polymer materials.


Acknowledgments
Dong Hun Park and Warren N. Herman thank Victor Yun for assistance in construction of a Fabry-Perot experimental setup.
Appendix
Here, we describe a technique to determine the inverse piezoelectric coefficient of a poled polymer thin film when two or more reflection minima are observed in a reflectivity curve. Taking the derivative of Equation (5) gives
Using the reverse of this 2 × 2 matrix gives
References
- Lindsay, G.A.; Singer, K.D. Polymers for second-order nonlinear optics. ACS Symp. Ser. 1995. [Google Scholar] [CrossRef]
- Teng, C.C.; Man, H.T. Simple reflection technique for measuring the electro-optic coefficient of poled polymers. Appl. Phys. Lett. 1990, 56, 1734–1736. [Google Scholar]
- Schildkraut, J.S. Determination of the electro optic coefficient of a poled polymer film. App. Opt. 1990, 29, 2839–2841. [Google Scholar]
- Park, D.H.; Lee, C.H.; Herman, W.N. Analysis of multiple reflection effects in reflective measurements of electro-optic coefficients of poled polymers in multilayer structures. Opt. Express 2006, 14, 8866–8884. [Google Scholar]
- Michelotti, F.; Belardini, A.; Larciprete, M.C.; Bertolotti, M.; Rousseau, A.; Ratsimihety, A.; Schoer, G.; Mueller, J. Measurement of the electro-optic properties of poled polymers at λ = 1.55 mm by means of sandwich structures with zinc oxide transparent electrode. Appl. Phys. Lett. 2003, 83, 4477–4479. [Google Scholar]
- Norwood, R.A.; Kuzyk, M.G.; Keosian, R.A. Electro-optic tensor ratio determination of side-chain copolymers with electro-optic interferometry. J. Appl. Phys. 1994, 75, 1869–1874. [Google Scholar]
- Greenlee, C.; Guilmo, A.; Opadeyi, A.; Himmelhuber, R.; Norwood, R.A.; Fallahi, N.; Luo, J.; Huang, S.; Zhou, X.-H.; Jen, A.K.-Y.; Peyghambarian, N. Mach-Zehnder interferometry method for decoupling electro-optic and piezoelectric effects in poled polymer films. Appl. Phys. Lett. 2010, 97, 041109–041109-3. [Google Scholar]
- Shi, W.; Ding, Y.J.; Mu, X.; Yin, X.; Fang, C. Electro-optic and electromechanical properties of poled polymer thin films. Appl. Phys. Lett. 2001, 79, 3749–3751. [Google Scholar]
- Chen, A.; Chuyanov, V.; Garner, S.; Steier, W.H.; Dalton, L.R. Modified attenuated total reflection for the fast and routine electro-optic measurement of nonlinear optical polymer thin films. Tech. Dig. Org. Thin Films Photonics Appl. 1997, 14, 158–160. [Google Scholar]
- Park, D.H. Characterization of Linear Electro-Optic Effect of Poled Organic Thin Films. Ph.D. thesis, University of Maryland, College Park, MD, USA, 2008. [Google Scholar]
- Uchiki, H.; Kobayashi, T. New determination method of electro-optic constants and relevant nonlinear susceptibilities and its application to doped polymer. J. Appl. Phys. 1988, 64, 2625–2629. [Google Scholar]
- Eldering, C.A.; Knoesen, A.; Kowel, S.T. Use of Fabry-Perot devices for the characterization of polymeric electrooptic films. J. Appl. Phys. 1991, 69, 3676–3686. [Google Scholar]
- O'Brien, N.F.; Dominica, V.; Caracci, S. Electro-refraction and electro-absorption in poled polymer Fabry-Perot etalons. J. Appl. Phys. 1996, 79, 7493–7500. [Google Scholar]
- Prêtre, Ph.; Wu, L.-M.; Hill, R.A.; Knoesen, A. Characterization of electro-optic polymer films by use of decal-deposited reflection Fabry-Perot microcavities. J. Opt. Soc. Am. B 1998, 15, 379–392. [Google Scholar]
- Yeh, P. Optical Waves in Layered Media; John Wiley & Sons: Hoboken, NJ, USA, 1988. [Google Scholar]
- Rakić, A.D.; Djurišić, A.B.; Elazar, J.M.; Majewski, M.L. Optical properties of metallic films for vertical-cavity optoelectronic devices. Appl. Opt. 1998, 37, 5271–5283. [Google Scholar]
- Born, M.; Wolf, E. Principles of Optics, 7th ed.; Cambridge University Press: Cambridge, UK, 1999. [Google Scholar]
© 2011 by the authors; licensee MDPI, Basel, Switzerland. This article is an open access article distributed under the terms and conditions of the Creative Commons Attribution license (http://creativecommons.org/licenses/by/3.0/).
Share and Cite
Park, D.H.; Luo, J.; Jen, A.K.-Y.; Herman, W.N. Simplified Reflection Fabry-Perot Method for Determination of Electro-Optic Coefficients of Poled Polymer Thin Films. Polymers 2011, 3, 1310-1324. https://doi.org/10.3390/polym3031310
Park DH, Luo J, Jen AK-Y, Herman WN. Simplified Reflection Fabry-Perot Method for Determination of Electro-Optic Coefficients of Poled Polymer Thin Films. Polymers. 2011; 3(3):1310-1324. https://doi.org/10.3390/polym3031310
Chicago/Turabian StylePark, Dong Hun, Jingdong Luo, Alex K.-Y. Jen, and Warren N. Herman. 2011. "Simplified Reflection Fabry-Perot Method for Determination of Electro-Optic Coefficients of Poled Polymer Thin Films" Polymers 3, no. 3: 1310-1324. https://doi.org/10.3390/polym3031310