1. Introduction
Historically, photonic materials such as the natural opal, and butterfly wings have attracted much attention due to their beautiful colors. More recently, photonic materials have gained considerable interest due to their ability to manipulate and control the flow of light in systems, which could have a great impact on the computing and communications industries [
1]. Their interesting properties, whether beautiful color or manipulation of light, are a result of refractive index/dielectric periodicity at the length scale of the wavelength of light striking the material, and not due to the addition of dyes or pigments to the materials [
2,
3,
4]. For instance, opal gemstones have refractive index order periodicity in three dimensions (3D). Materials can also have structural periodicity in two dimensions (2D) and one dimension (1D), all of which yield their own interesting optical properties and colors.
Important to this submission, are 1D optical materials. For example, Bragg mirrors are generally composed of layers of alternating refractive index, which are periodically arranged in only one dimension; the reflected/refracted light at the interface of each layer leads to constructive/destructive interference, resulting in color. However, other 1D optical materials, such as Fabry-Pérot etalons, interferometers, and waveguides exist. While they are similar to Bragg stacks in that they are ordered in 1D, they are more specifically composed of a dielectric cavity confined between two reflective surfaces. An example of a typical Fabry-Pérot etalon (or simply etalon) is shown schematically in
Figure 1(A). Light enters the etalon, and resonates in the cavity between the mirrors, resulting in light interference. This interference yields specific wavelengths of light that are reflected/transmitted. The material will appear visibly colored if the distance between the mirrors, or the refractive index of the dielectric, is such that visible light wavelengths are reflected. The specific wavelengths that are reflected/transmitted can be predicted from the following equation:
![Polymers 04 00134 i001]()
where λ is the wavelength maximum of the peak (s), m is the peak order, n is the refractive index of the dielectric, d is the spacing between the mirrors, and θ is the angle of incidence [
5].
Figure 1.
(
A) A traditional Fabry-Pérot etalon; (
B) poly (
N-isopropylacrylamide) based microgel etalons depicting (a,c) two reflective Au surfaces sandwiching (b) a microgel layer, all on (d) a cover glass support. Reproduced with permission from [
15] Copyright (2011) WILEY-VCH Verlag GmbH & Co. KGaA, Weinheim.
Our group fabricates etalons by sandwiching poly (
N-isopropylacrylamide) (pNIPAm) microgels (colloidally stable hydrogel particles) between two thin metal planar surfaces, as in
Figure 1(B). PNIPAm is one of the most well-known and studied “intelligent” polymers, which exhibits unique thermoresponsivity. That is, at room temperature, pNIPAm is in a random coil conformation, while it transitions to a globular conformation when heated >~31 °C. This process is accompanied by water expulsion from the polymer. This transition is fully reversible, so when the pNIPAm is returned to T < ~31 °C, the polymer transitions back to the random coil conformation and is resolvated with water. These unique properties of pNIPAm have been used to synthesize a variety of colloidally stable particles, also referred to as microgels/nanogels. Like linear pNIPAm, when the temperature of pNIPAm based microgels is raised above ~31 °C, they deswell by expelling their solvating water, and reswell by absorbing water below ~31 °C. The addition of comonomers to the pNIPAm based microgels can influence their responsivity, e.g., acrylic acid (AAc) is commonly added to pNIPAm based microgels to impart them with pH responsivity, and also to serve as a reactive group for further modification of the microgels [
6,
7,
8,
9]. AAc has a pK
a of ~4.25, so when pNIPAm-
co-AAc microgels are at a pH above the pK
a for AAc the collapse transition is hindered due to Coulombic repulsion between the deprotonated AAc in the microgels. Interestingly, full thermoresponsivity can be recovered by simply lowering the pH to a value below 4.25. Additionally, pNIPAm based microgels can also be made responsive to ionic strength, glucose [
10], protein binding [
11], and DNA hybridization by introduction of various comonomers. Although pNIPAm based microgels can be modified to affect a myriad of material properties and functions, the most important aspect for the work here is their potential to tune “lattice” spacing and color in ordered materials, as in
Figure 1(B) [
12,
13,
14,
15].
Previously, pNIPAm based microgels have been used to construct “colored” photonic materials. The Lyon group and others have made significant progress in developing pNIPAm microgel based colloidal crystals [
16,
17,
18,
19]. They found that the spacing between the microgels had a profound effect on the reflected light wavelength, and thus the resultant color. The Lyon group has also made significant strides to understand and characterize the assembly process [
20,
21,
22,
23,
24]. The Kawaguchi group showed that by simply drying microgel suspensions of various concentrations on substrates, a photonic material could be generated; the concentration of the microgel suspension could control the resultant particle-particle spacing, and thus change the overall optical properties of the thin film [
4]. Enlightened by Kawaguchi’s work, other researchers used capillary forces [
25,
26], the environment [
27] and nature of the particle [
28,
29], and the surface chemistry [
30] to control the spacing and color of the resultant films. Subsequent work has further expanded this knowledge to include an understanding of the effect of temperature [
31,
32], charge or magnetic field [
33,
34], pH [
35], and hydrophobic/hydrophilic interactions [
36] on the formation of microgel films and their optical properties.
In this submission, we show that pNIPAm microgel based etalons can be fabricated to exhibit a single bright color [
12,
13,
15], and because the microgels exhibit a diameter that is dependent on temperature and pH, the mirror-mirror spacing can be dynamically tuned resulting in color tunability based on Equation (1). For these systems, it is known that the mirror-mirror distance dominates the etalon’s optical properties. These devices have been shown to be extremely sensitive to temperature, shifting >300 nm spectrally in response to an increase in temperature of ~15 °C, with the majority of the shift occurring over ~7 °C. This high sensitivity makes these devices excellent prospects for optical sensing applications. The rest of the submission is focused on microgel based etalons.
2. PNIPAm Microgel Based Etalons
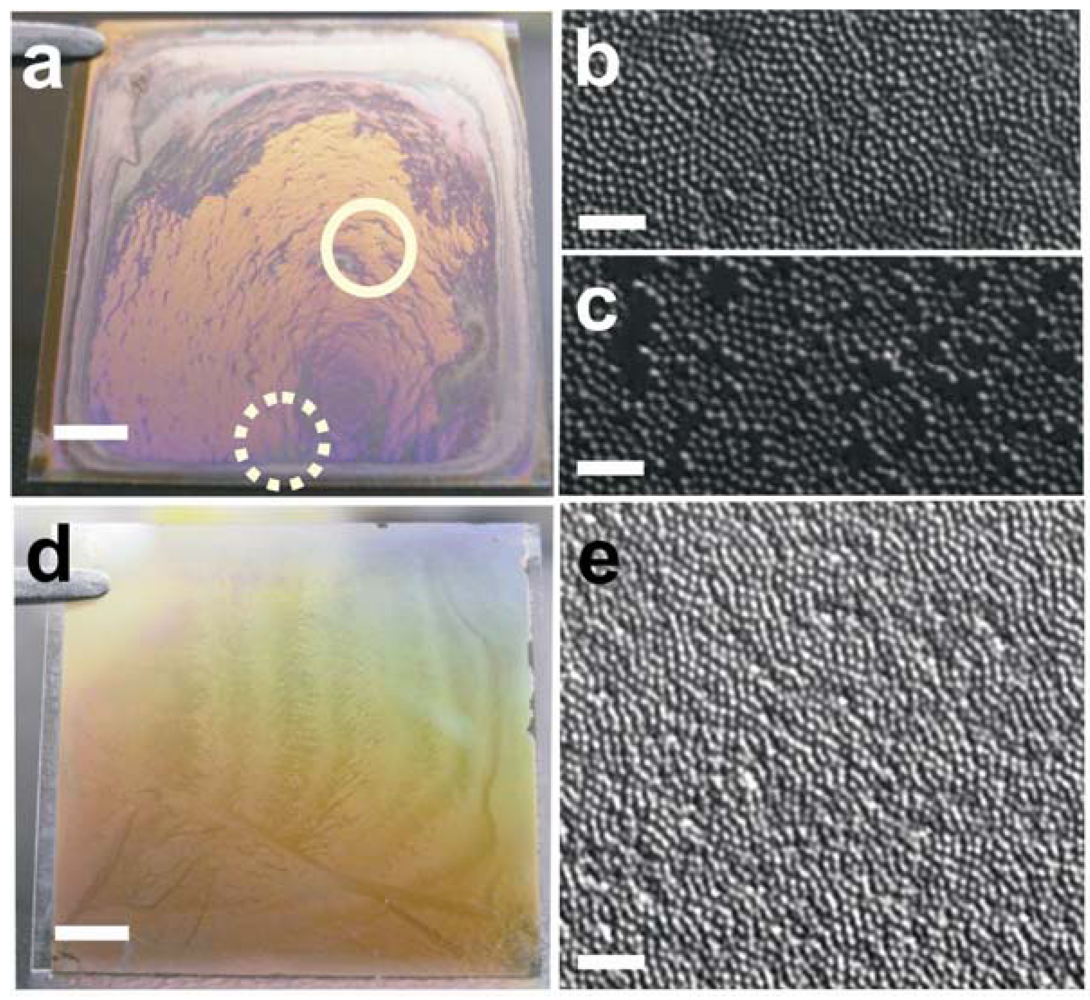
Initial studies of pNIPAm microgel based etalons in our group began by drying a 775 µL of a 5% (v/v) solution of ~1.5 µm diameter pNIPAm-co-AAc microgels onto a Au coated glass cover slip (2 nm Cr was used as an adhesion layer followed by 15 nm Au). To make an etalon, a subsequent 2 nm Cr/15 nm Au overlayer was deposited on the initial microgel layer, a photograph of the etalon in air is shown in
Figure 2(a).
Figure 2(b,c) show differential interference microscopy (DIC) images of the resultant microgel film in
Figure 2(a), prior to the Cr/Au overlayer addition. As seen from
Figure 2(a–c), the film’s color and microgel packing density is nonuniform across the etalon surface, which is most likely due to the low concentration of the microgel solution being used to make the etalons, resulting in the so-called “coffee-ring effect” [
37,
38]. More concentrated microgel solutions were dried onto Au, but complete uniformity was never achieved with this approach.
Figure 2.
Photographs and differential interference microscopy (DIC) images of films fabricated using (
a) the drying method and corresponding DIC images of an area that is an (
b) etalon corresponding to the solid circle in (a) and an area that (c) is not an etalon corresponding to the dashed circle in (a). (
d) A photograph of a film fabricated using the “paint-on” method and the corresponding (
e) DIC image of the film. DIC images were taken using a 100x oil immersion objective before the addition of Cr/Au overlayer, scale bars are 5 µm. Scale bars in the photographs are 5 mm. Reprinted with permission from [
13] Copyright (2011) American Chemical Society.
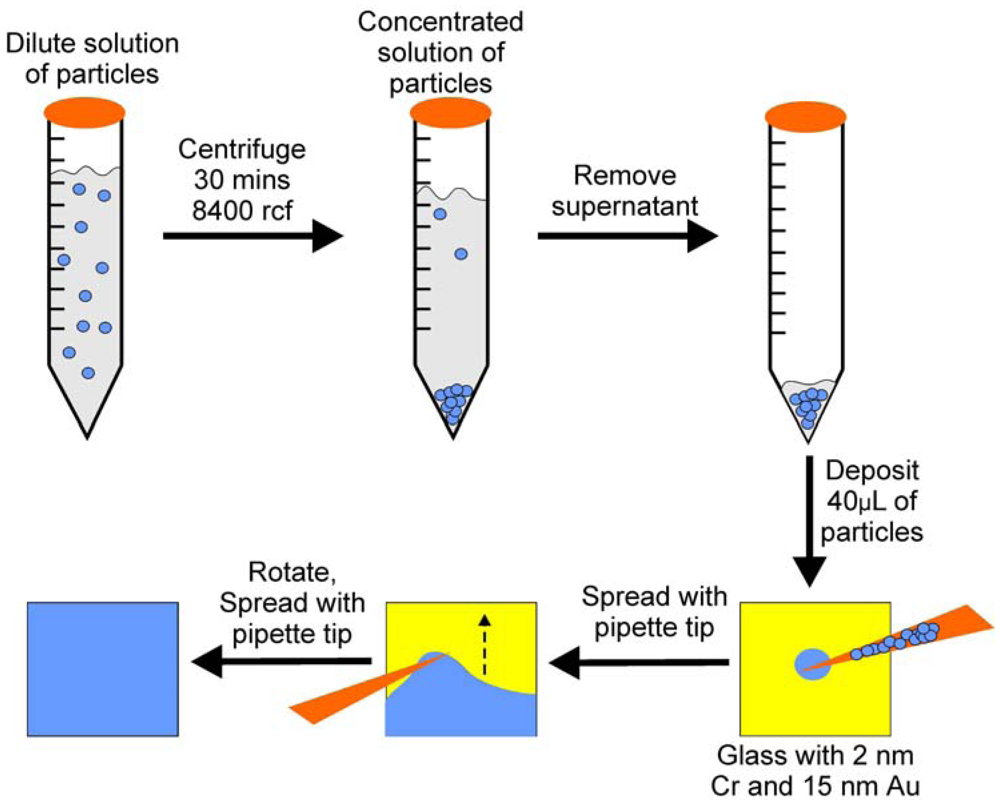
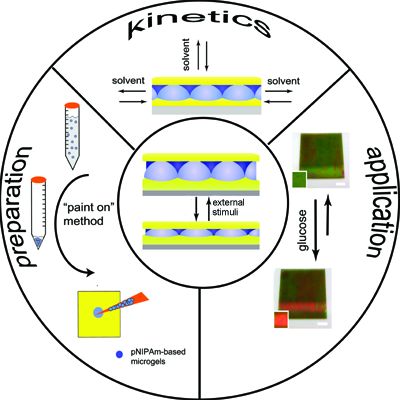
To overcome the coffee-ring effect we developed a novel microgel deposition technique, which involves “painting” microgels onto a metal substrate [
12,
13,
14]. As illustrated in
Scheme 1, concentrated microgels are continuously spread onto an annealed, clean, Au coated glass substrate until the layer is completely dry. Once completely dry, the film is rinsed with deionized water and soaked in a deionized water bath overnight at ~30 °C, in order to remove any microgels not directly bound to the Au substrate. Compared to the air dried films, this technique yields an extremely uniform etalon both visually, and microscopically, as can be seen in
Figure 2(d,e).
Scheme 1.
The “Paint-on” method used to fabricate etalons. Reprinted with permission from [
13] Copyright (2011) American Chemical Society.
Scheme 1.
The “Paint-on” method used to fabricate etalons. Reprinted with permission from [
13] Copyright (2011) American Chemical Society.
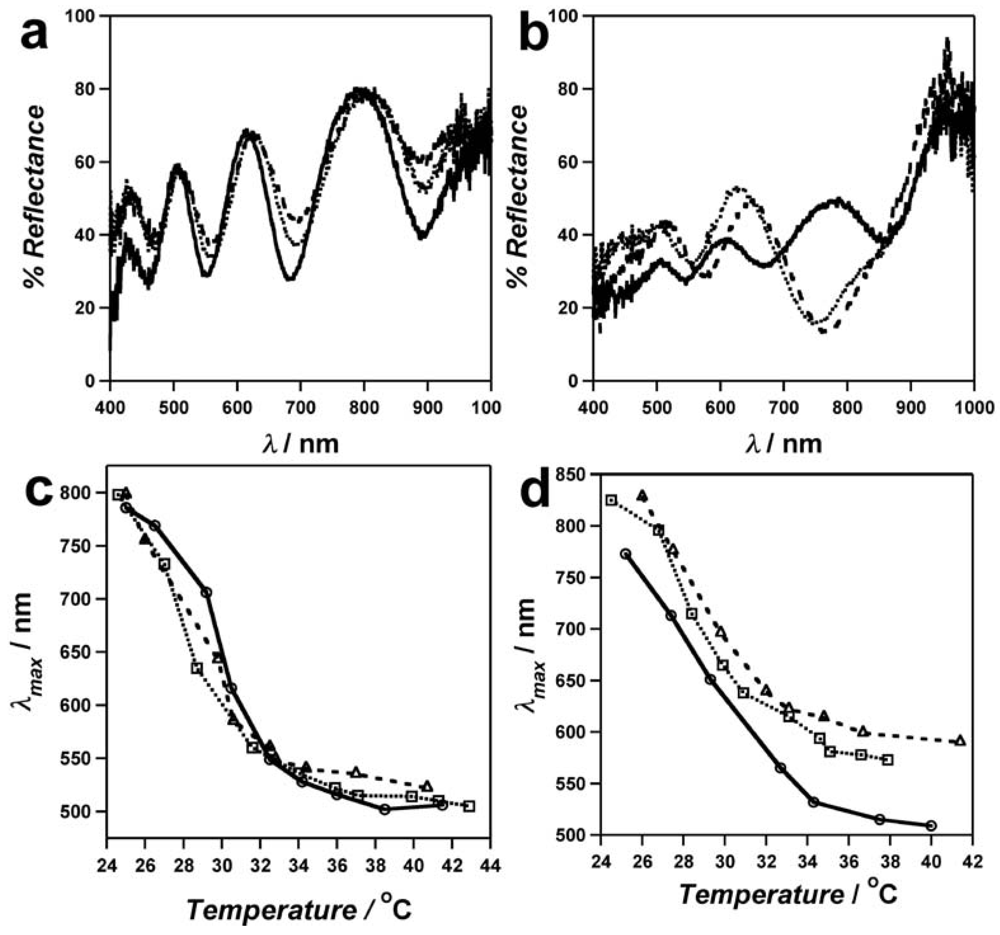
The spectral quality of the “painted” etalons is far superior to the air dried films, as determined by collecting reflectance spectra on random locations of the solvated etalon.
Figure 3(a) shows spectra obtained at three randomly selected regions of a “painted” etalon; we can note that from spot to spot the spectra were comparable. However, the reflectance spectra for the same microgels using air-dried method were much more variable with position being probed on the etalon (
Figure 3(b)). Moreover, one out of four randomly chosen regions did not exhibit reflectance spectra because that region did not have the required “monolithic” microgel layer required to form the optical cavity of the etalon.
The homogeneity of the response of the painted and air-dried etalons to temperature was also compared,
Figure 3(c,d). Three random spots of the respective etalons were probed as a function of temperature, and it was observed that the regions of the painted etalon exhibit similar λ
max values at all temperatures, while the air-dried regions were far less uniform from spot to spot. Therefore, the “paint-on” method is clearly superior to the drying protocol. This technique has also been used to deposit microgels containing various functionalities on Au, as well as to deposit microgels on a variety of metals including: Ti, Ni, Al, Fe, Ag, Cu (data not shown).
Figure 3.
Reflectance spectra from three randomly selected areas of an etalon fabricated using the (
a) “Paint-on” method and the (
b) overnight drying method. Plots of λ
max versus temperature for randomly selected regions (the three different regions in the spectra in (a,b) of films fabricated using the (
c) “Paint-on” method and the (
d) overnight drying method. All data were collected for in pH 3 water (I.S. = 1) solution. Reprinted with permission from [
13] Copyright (2011) American Chemical Society.
As can be observed visually, the color of the painted etalon is uniform. While the spectra from spot-to-spot are reproducible, each spectrum exhibits multiple peaks at various wavelengths for a given n and d. These multiple peaks make prediction of the spectral and visible color difficult. For our future sensing efforts, we would like etalons that exhibit a single reflectance peak in the visible region of the spectrum. This will allow the desired device color and spectrum to be pre-decided and microgels rationally chosen such that the desired etalon can be fabricated. To fabricate etalons that exhibit single peaks in the visible spectral region, Equation (1) predicts that microgels with the correct combination of refractive index and diameter are needed. For example, large diameter microgels should lead to multiple reflectance peaks, while the opposite is true for microgels with a small diameter. To test this, microgels with various hydrodynamic diameters (D
H) were synthesized and used to paint on Au coated substrates to yield etalons with variable dielectric thicknesses, see
Table 1.
Table 1.
Physical properties of microgels.
Table 1.
Physical properties of microgels.
| Microgel | pNIPAm-co-AAc-1 | pNIPAm-co-AAc-2 | pNIPAm-co-AAc-3 | pNIPAm-co-AAm[c] | pNIPAm-co-VAA[d] |
|---|
| Hydrodynamic diameter, DH [nm] [a] | 1,548 (±69) | 659 (±21) | 229 (±10) | 653 (±10) | 603 (±17) |
| Etalon thickness [nm] [b] | 1,004 (±98) | 440 (±36) | 127 (±16) | 544 (±56) | 347 (±46) |
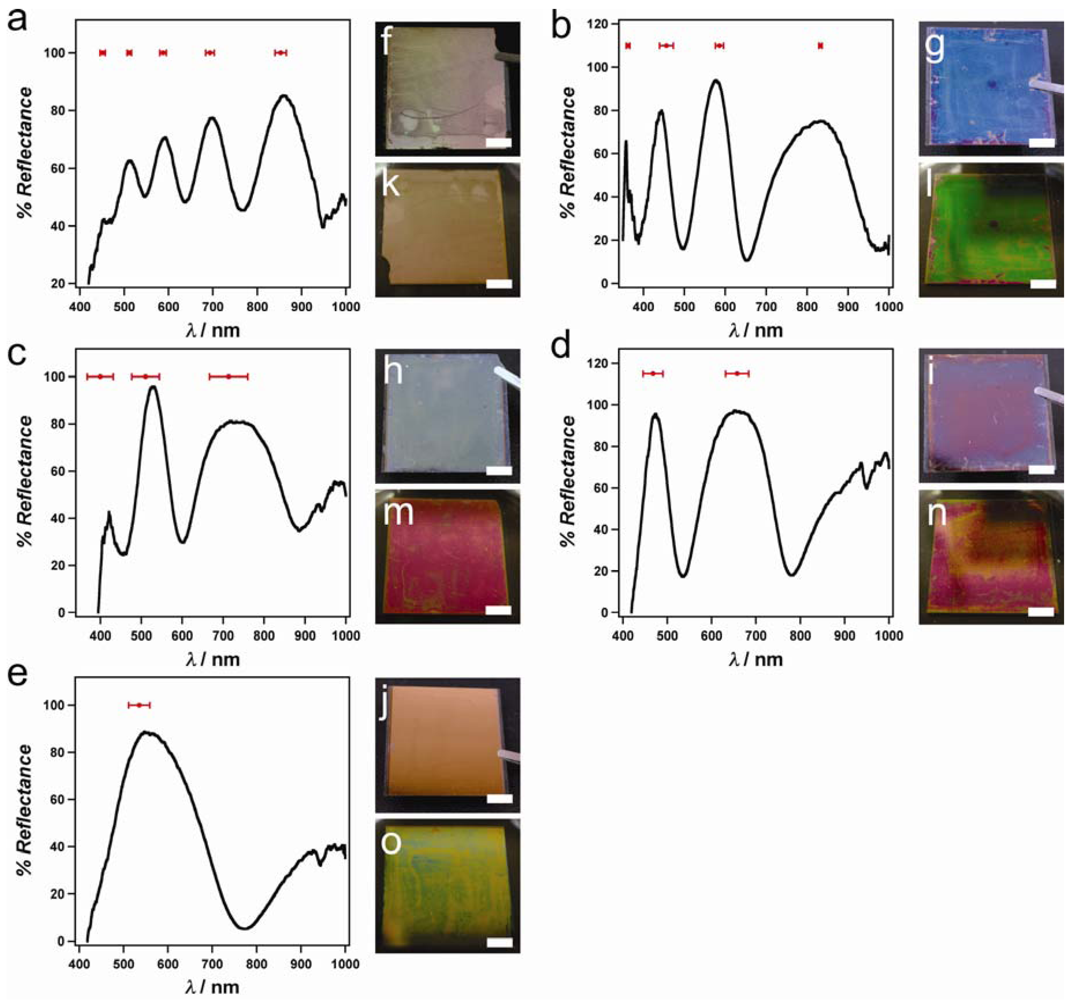
Figure 4.
Representative spectra for etalons composed of (
a) pNIPAm-
co-AAc-1, (
b) pNIPAm-
co-AAm, (
c) pNIPAm-
co-AAc-2, (
d) pNIPAm-
co-VAA, (
e) pNIPAm-
co-AAc-3 microgels (see
Table 1), obtained in pH 3 formate buffer. The average peak position (± one standard deviation) from six spectra is shown in red above each spectrum. (f–j) Photographs for etalons in the dry state, and (k-o) hydrated in pH 3 formate buffer. The photographs are of the same etalons that exhibited the spectra in (a–e). Scale bars for photographs are 5 mm. Reproduced with permission from [
12] Copyright (2011) WILEY-VCH Verlag GmbH & Co. KGaA, Weinheim.
If we use a refractive index of 1.37 for a solvent swollen pNIPAm-
co-AAc microgel, from Equation (1) the dielectric layer thickness should be less than 400 nm to achieve a single reflectance peak in the visible. From the data in
Figure 4, we find that the number of the distinct peaks in the visible region of the reflectance spectra decrease with decreasing D
H. Specifically, etalons which were constructed from microgels with a D
H of ~230 nm yielded only 1 distinct peak at ~535 nm. From these data, it is apparent that slightly larger microgels would yield a slightly red-shifted reflectance peak, and vice versa. We went on to illustrate that microgels of a similar D
H, but different mechanical properties, could also affect the number of reflectance peaks observed.
Table 1 shows that “soft” microgels yielded an etalon with a smaller dielectric thickness compared to “stiff” microgels, even though the initial D
H values were very similar. Stiffness was inferred by comparing the initial hydrodynamic diameter of the microgels to the AFM measured etalon thickness. Stiffer microgels yield a dielectric thickness that is close to their hydrodynamic diameter, while softer microgels yield a dielectric thickness much smaller than their hydrodynamic diameter.
In addition to determining the factors that control the optical properties of the etalons, the group is investigating what controls the deswelling rate of the etalons. To study this, we exploit the variable collapse transition temperature of the microgels in water with varying solvent concentrations—a phenomenon referred to as cononsolvency [
39,
40,
41,
42,
43].
Specifically, the etalons were equilibrated in water at 25 °C (pH 3.0, ionic strength 2 mM). Following equilibration, methanol (MeOH) was added to bring the concentration to 30% (v/v) MeOH:H2O. Because of “cononsolvency”, the microgel’s collapse transition is lowered to ~18 °C and thus the microgels instantly collapse and the Au mirrors come close to each other, resulting in a spectral blue shift of a given reflectance peak, according to Equation (1). The shifts were monitored over time, for etalons with various overlayer thicknesses. To reduce any error caused by different absolute shifts in wavelength for different etalons, the percentage shift (% Shift) at a particular time was calculated using Equation (2):
λmax is the wavelength of the monitored peak at a particular time point, λinitial is the initial peak position, and λfinal is the final peak position.
For this section, λmax was always the highest wavelength peak in each spectrum. Since the etalons were fabricated with the same microgels, and by the same “paint-on” method, the highest wavelength peaks in each etalon’s spectrum is assumed to be the same order of reflection, therefore they can all be directly compared.
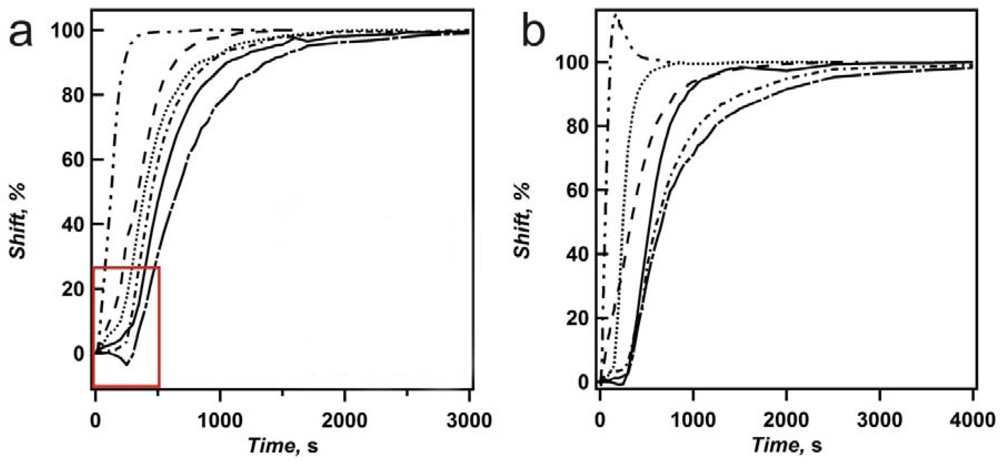
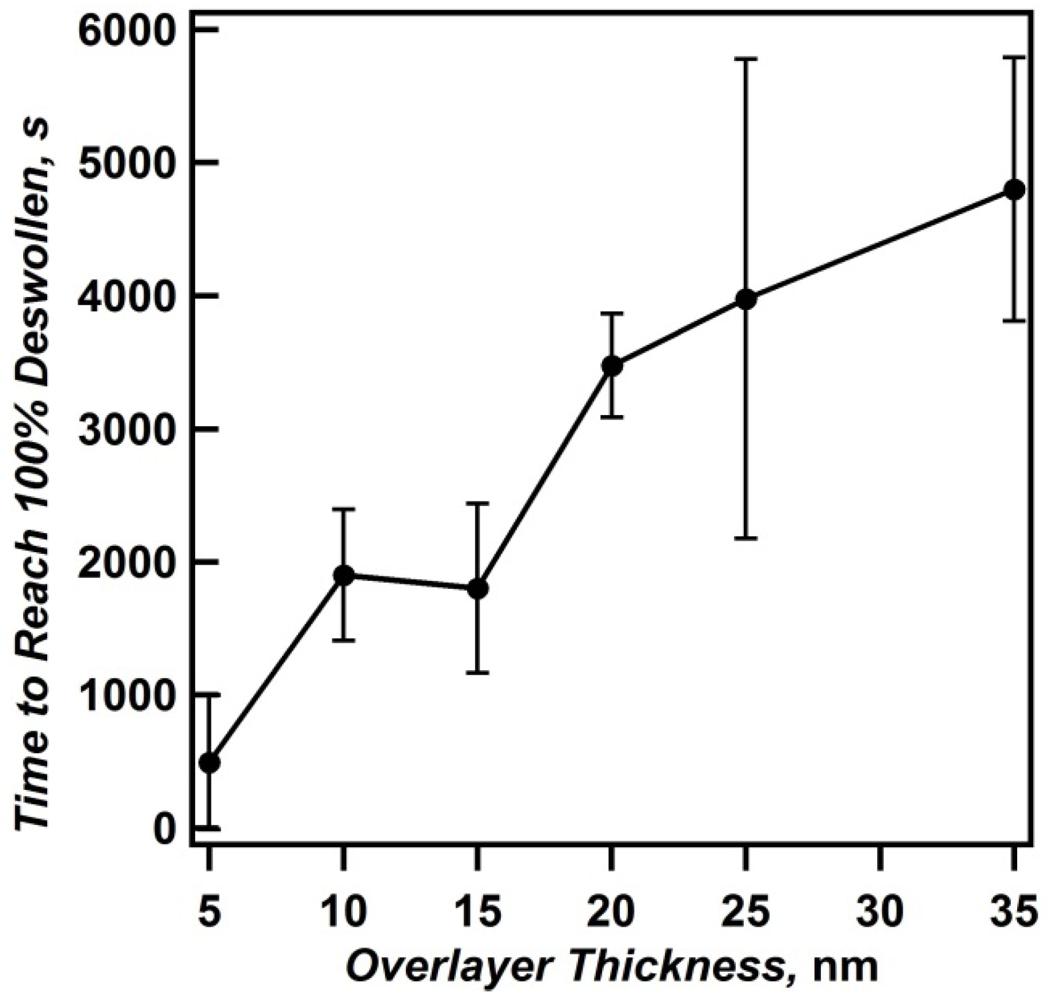
From
Figure 5 and
Figure 6, it is apparent that the deswelling time increases as the overlayer thickness increases. For our system, we hypothesize that thicker Au overlayers have less pores than etalons with thin Au overlayers. Therefore, the exchange through the thinner layers is much easier, hence leading to faster kinetics. This hypothesis is also supported by the work of Norrman
et al., [
44] who observed that thick Au overlayers on glass have more surface coverage than thin Au layers. Furthermore, we observed that the rate of MeOH entering the etalon, via diffusion through the Au overlayer or the edges, increases as a function of increasing overlayer thickness. As the overlayer thickness increases, the etalon requires more time to initially respond to the introduction of MeOH.
Figure 5.
Deswelling curves for two different sets of etalons (
a,b), made of the same microgels, using the same painting method. The percent shift of the high wavelength peak in the reflectance spectrum is plotted as a function of time. Plots shown are: 5 nm (− · · −), 10 nm (− − −), 15 nm (···), 20 nm (solid), 25 nm (− · −), and 35 nm (— - —). Deswelling was induced by introducing a 30% (v/v) MeOH/water solution (2 mM I.S.) held at 25 °C. Reprinted with permission from [
14] Copyright (2011) American Chemical Society.
Figure 6.
The time required for etalons of various overlayer thicknesses to reach 100% deswollen. Error bars are the standard deviations for the averages from two different sets of independently fabricated samples. Reprinted with permission from [
14] Copyright (2011) American Chemical Society.
Figure 6.
The time required for etalons of various overlayer thicknesses to reach 100% deswollen. Error bars are the standard deviations for the averages from two different sets of independently fabricated samples. Reprinted with permission from [
14] Copyright (2011) American Chemical Society.
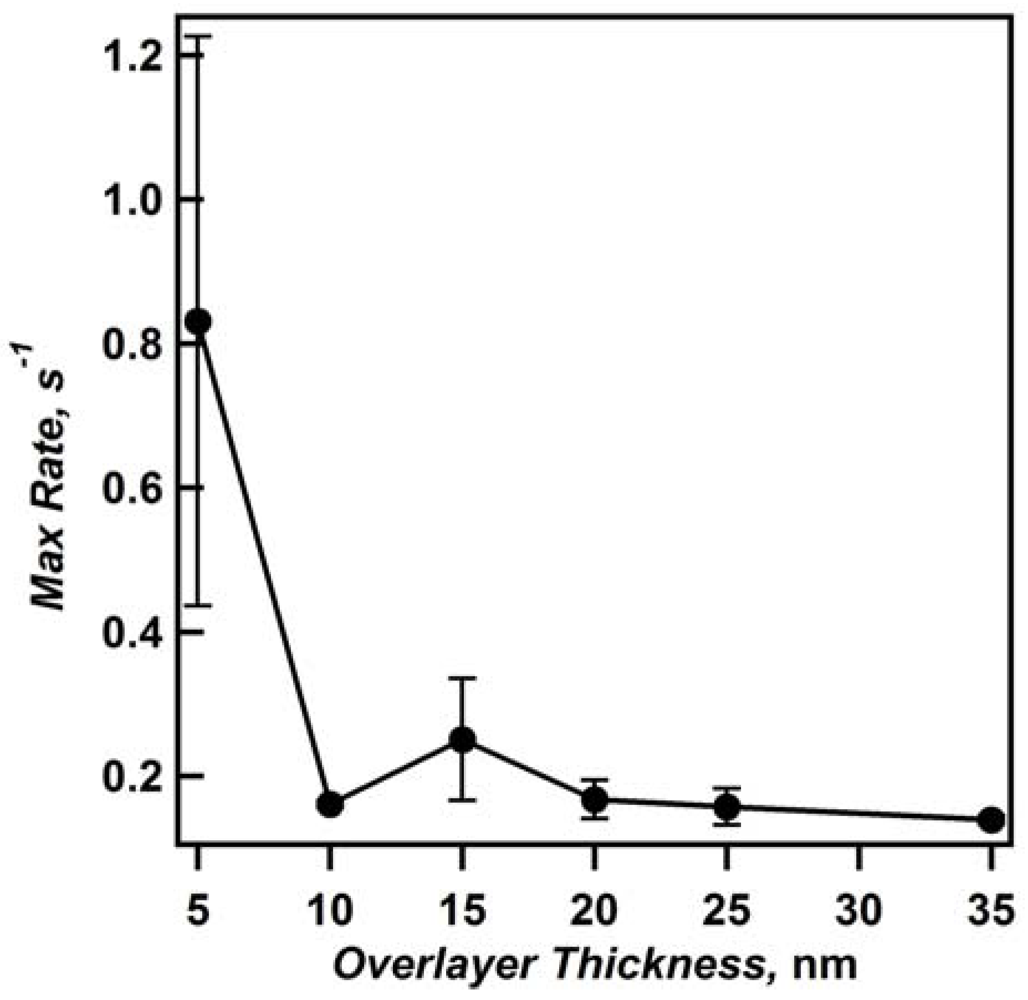
Figure 6 shows the time required for etalons of various overlayer thickness to reach 100% deswollen, and reveals that the thinnest Au overlayer (5 nm) requires less time to reach 100% deswollen than any other film. Furthermore, the trend of increasing deswelling time with increasing overlayer thickness is observed. By defining the slope of the line in the deswelling phase as the maximum deswelling rate, in units of % shift per second (s
−1), we see that the thinnest Au overlayers have greater max rates than thicker overlayers, again both suggesting the thin Au overlayers allow solvent to more easily exchange with the environment (
Figure 7). Therefore, we assume that the preferred route of solvent exchange with the microgel layer is through the overlayer, although diffusion out of the side of the unsealed etalon can also occur.
Figure 7.
Plot of maximum rate of deswelling for etalons with different overlayer thicknesses. Data averaged from two sets of independently fabricated etalons, with standard deviation shown using error bars. Reprinted with permission from [
14] Copyright (2011) American Chemical Society.
Figure 7.
Plot of maximum rate of deswelling for etalons with different overlayer thicknesses. Data averaged from two sets of independently fabricated etalons, with standard deviation shown using error bars. Reprinted with permission from [
14] Copyright (2011) American Chemical Society.
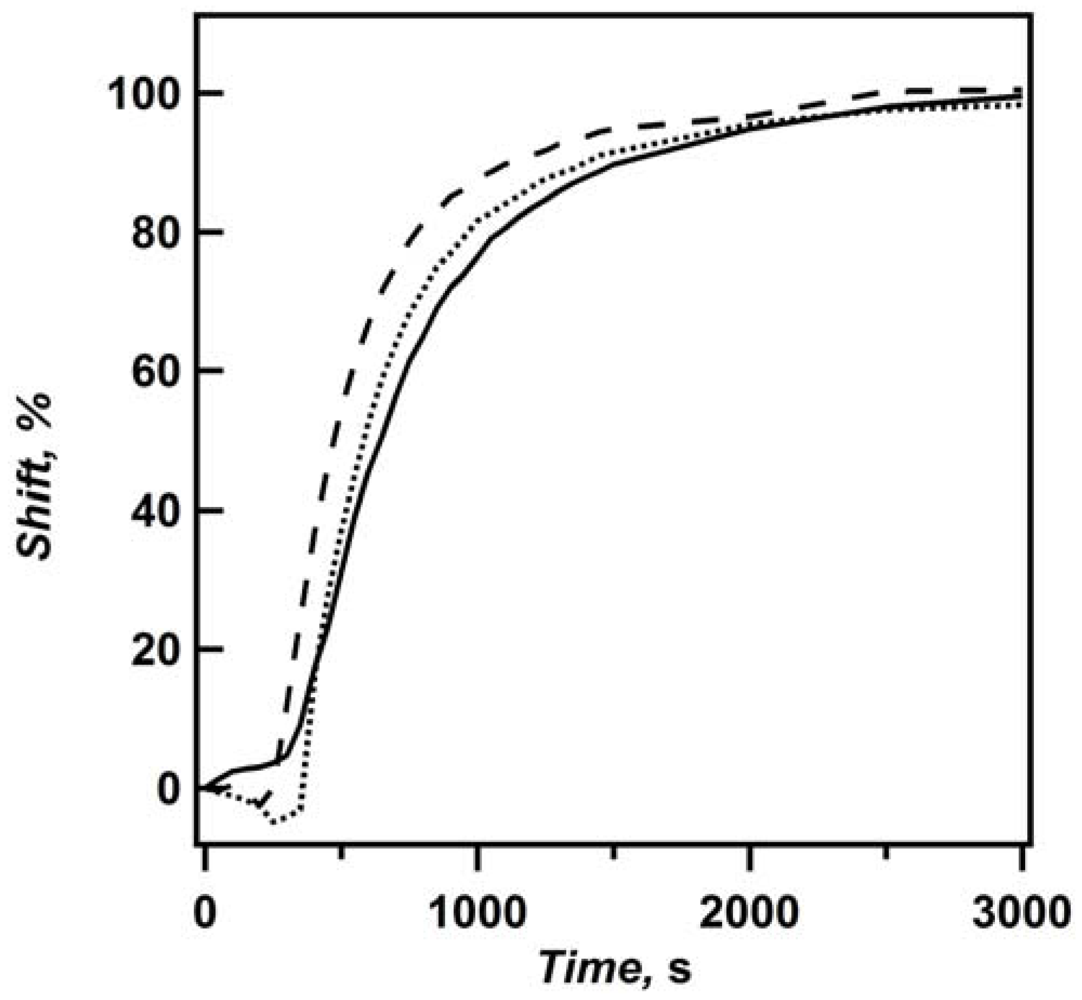
However, from the above data, we cannot conclude that solvent exchange occurs exclusively through the Au overlayer. That is because the sides of the etalon are not sealed, and therefore there is some possibility of solvent exchanging through the sides. To investigate this further, we observed the deswelling kinetics for etalons of varying dimensions. If solvent is exchanging through the sides of the etalon, then the time required for the etalon to completely deswell should decrease as the etalon’s dimensions decrease. To investigate this, a 6.25 cm
2 (2.5 cm × 2.5 cm) etalon with a 25 nm Au overlayer was deswollen. The kinetics of this larger etalon was compared to a smaller etalon cut from the larger one (with a glass cutting tool), with an area of ~2.5 cm
2 (~1.0 cm × ~2.5 cm), followed by further cutting this etalon down to ~0.9 cm
2 (~0.9 cm × ~1.0 cm). The resultant deswelling curves probed at the same region (center of the etalon) are shown in
Figure 8. It is apparent that when the etalon becomes smaller, it reaches 100% deswollen faster. Also, the lag phase for the smallest etalon is reduced. This behavior is hypothesized to be due to solvent exchange through the edges of the etalon, therefore requiring less distance for the solvent to diffuse out of the etalon before the microgels can fully contract, and change the etalon’s color. Our conclusion from all the kinetics observed above is that solvent preferentially exits the microgel dielectric layer through the Au overlayer, but more solvent exchanges through the sides when the overlayer thickness increases.
Figure 8.
Plot of percent shift as a function of time for etalons with 25 nm overlayers and areas of (solid) 6.25 cm
2, (···) ~2.5 cm
2, and (− − −) ~0.9 cm
2. Reprinted with permission from [
14] Copyright (2011) American Chemical Society.
Figure 8.
Plot of percent shift as a function of time for etalons with 25 nm overlayers and areas of (solid) 6.25 cm
2, (···) ~2.5 cm
2, and (− − −) ~0.9 cm
2. Reprinted with permission from [
14] Copyright (2011) American Chemical Society.
Fast deswelling kinetics will be useful to the group, especially for our efforts with developing point-of-care (POC) diagnostics. To demonstrate the etalons potential for sensing applications, glucose sensitive microgels were synthesized by modification with of AAc modified pNIPAm based microgels with 3-aminophenylboronic acid (APBA). It is well known that APBA modified microgels increase their diameter in the presence of glucose [
45,
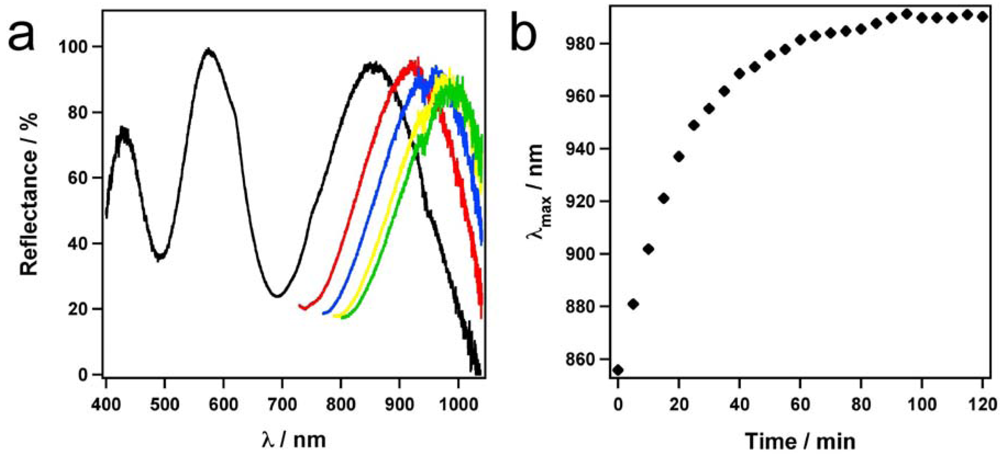
46]. Etalons were fabricated from the APBA modified microgels, and their spectral properties in the absence and presence of glucose were monitored. We exposed them to a 3 mg/mL solution of glucose in pH 9 carbonate buffer and monitored one reflection peak over time. From
Figure 9(a), we see a ~134 nm spectral shift in the most red-shifted peak from 856 nm to 990 nm. As seen in
Figure 9(b), the majority of the spectral shift occurs within 30 min of glucose introduction. Interestingly, the visual color of the APBA modified microgel based etalons varied after glucose introduction from green to red (
Figure 10), which can allow us to read “diagnostic test” results visibly. Finally, we investigated if spatially isolated regions of a single etalon are capable of actuating independently. If so, the color of a single etalon can be changed in one area, without affecting the color of the etalon in another region. Etalons in this study were fabricated from pNIPAm-
co-AAc microgels using the “paint-on” method. The experiment was conducted by locating three reflectance probes at different spots on a single etalon. pH 3.0, 4.0, 7.0 solutions were added between the reflectance probes and the etalon, and the reflectance spectra for the different spots collected as a function of temperature. From the data in
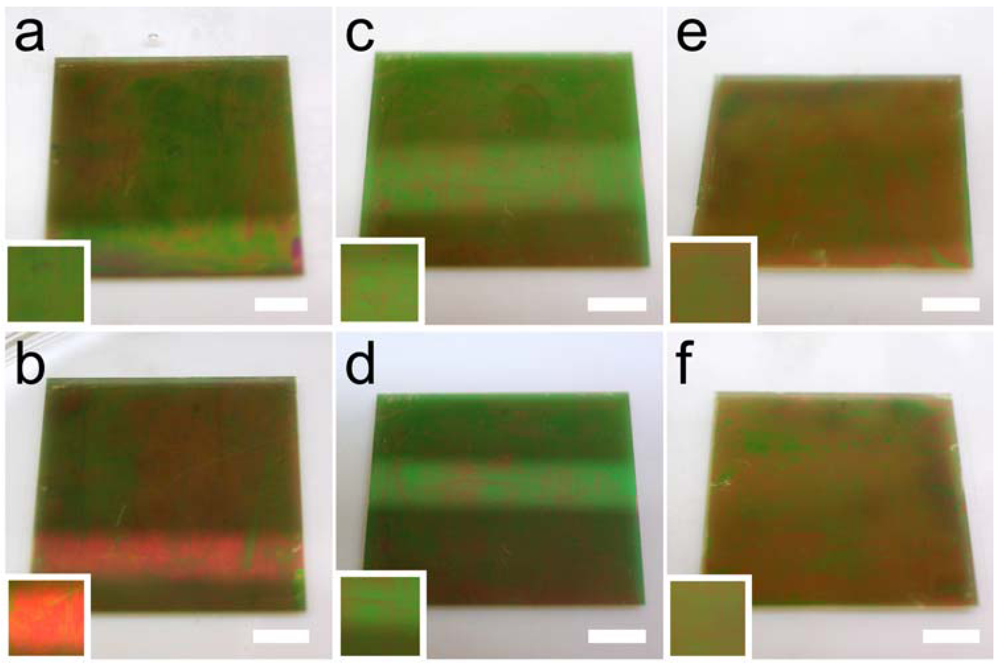
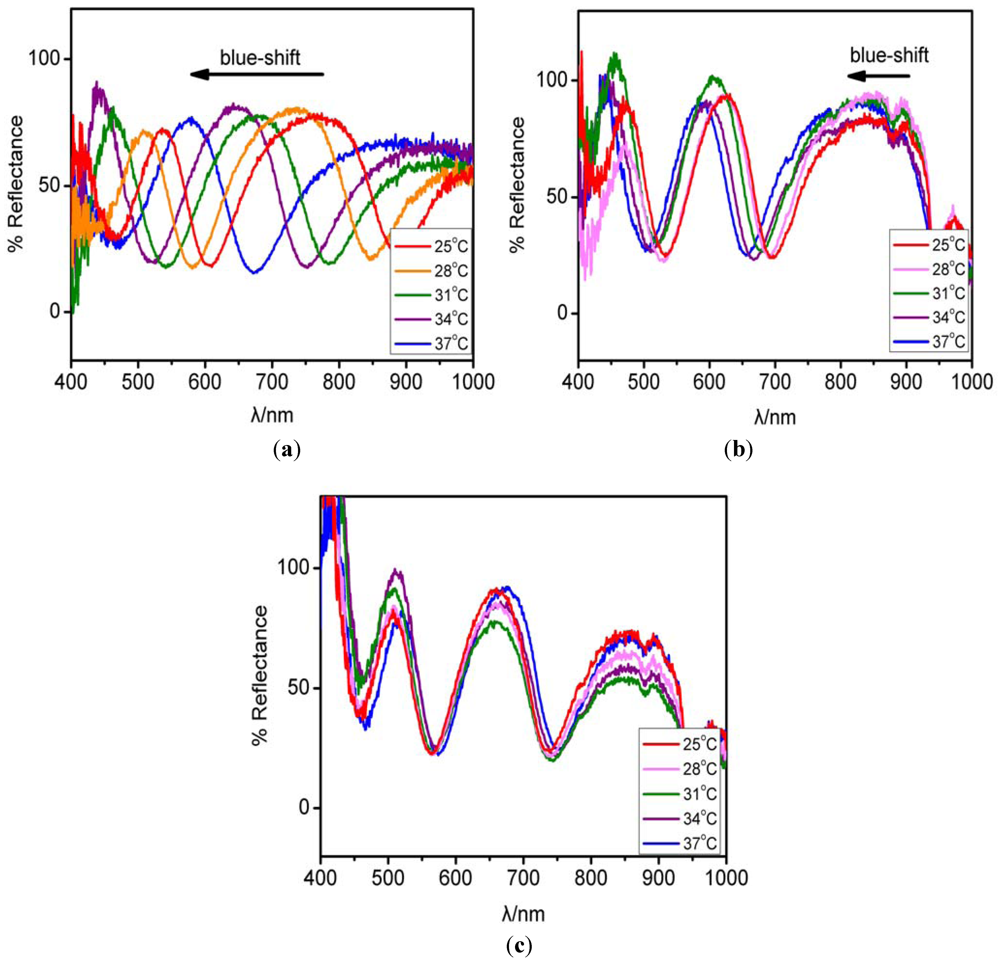
Figure 11, it is apparent that the peak (~800 nm) significantly blue-shifts with increasing temperature, while the spots at pH 4.0 and 7.0 shift minimally over the same temperature range. This will be used by our group to develop biosensors for disease detection and environmental monitoring.
Figure 9.
(a) Reflectance spectra over time after introduction of a 3 mg/mL glucose solution to an etalon constructed with APBA modified microgels. The black line represents the initial spectrum, the red, blue, yellow, and green lines represent the spectrum after 15, 30, 60, and 120 min respectively. (b) Plot of the high wavelength peak position in (a) as a function of time after glucose addition. Total spectral shift is ~134 nm.
Figure 10.
APBA-functionalized microgel etalons show visible color differences when they are soaked in (a) 5 mM pH 9 carbonate buffer versus (b) a pH 9 carbonate buffer containing 3 mg/mL glucose for 2 hours. Various etalon controls, e.g., (c,d) etalons fabricated by exposure to APBA only, and (e,f) EDC only, show no significant color change (c, e) before and (d, f) after glucose exposure. Image insets show a cropped image of the approximate center ~1 cm2 for each etalon, where the etalons were monitored spectrally, to better display the color change. Note, the color intensity (not the color) was increased in the inset. Scale bars are ~5 mm.
Figure 11.
Optical properties of an etalon fabricated from pNIPAm-co-AAc microgels. Reflectance spectra for the etalon as a function of temperature at different spots (a) pH 3.0 (b) pH 4.0 (c) pH 7.0.
Figure 11.
Optical properties of an etalon fabricated from pNIPAm-co-AAc microgels. Reflectance spectra for the etalon as a function of temperature at different spots (a) pH 3.0 (b) pH 4.0 (c) pH 7.0.


