3.1. Synthesis
Block-copolymer grafted SiO
2 nanoparticles were synthesized by sequential reversible addition-fragmentation chain transfer (RAFT) polymerization from the surface of the nanoparticles [
18]. RAFT provides quantitative control over the molecular weight and polydispersity (PDI) of each block. The graft density can be adjusted from approximately 0.01 chains/nm
2 to 0.7 chains/nm
2 [
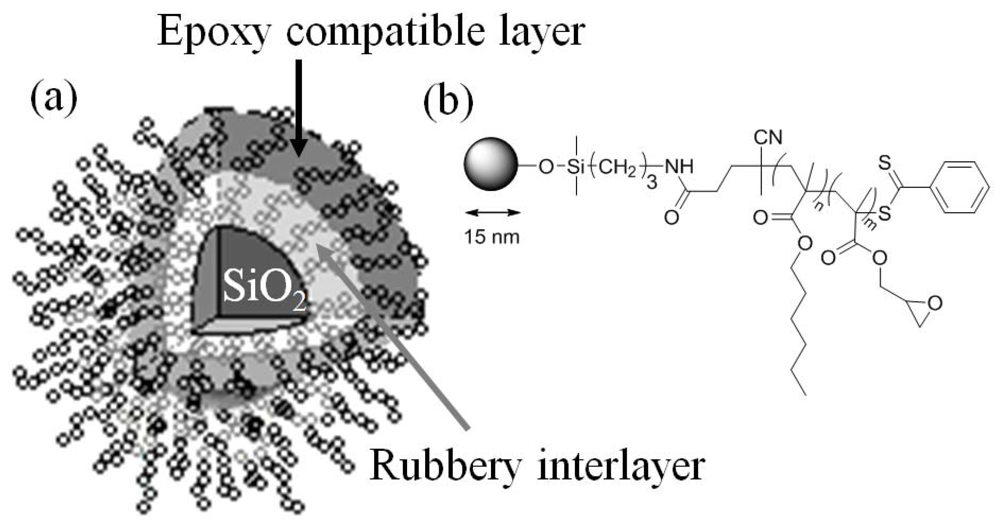
19]. To ensure that the epoxy compatible layer is compact enough to reduce the epoxy monomer penetration and shield the rubbery interlayer, nanoparticles with high graft density of 0.7 chains/nm
2 were prepared.
The polymerization of each monomer on SiO
2 nanoparticles was studied separately prior to block copolymer (PHMA-
b-PGMA) synthesis. The results of the RAFT polymerization of HMA (hexylmethacrylate) and GMA (glycidylmethacrylate) are shown in
Figure 2. This figure shows that the PHMA molecular weight increased almost linearly with the reaction time. However, the PDI of the PHMA did not vary significantly during the reaction process. The polymerization of GMA on the SiO
2 nanoparticles exhibited a similar linear relationship between molecular weight and reaction time with slightly higher PDI.
Figure 2.
Plots showing the dependence of molecular weight and PDI on reaction time for the RAFT polymerization of HMA (a) and GMA (b) (5 M in THF) at 60 °C with AIBN as initiator (1.5 × 10⁻⁵ M) mediated with RAFT agent anchored silica nanoparticles (1.5 × 10⁻⁴ M; 0.61 chains/nm2). The gel permeation chromatography (GPC) system was calibrated with poly(methyl methacrylate) standards.
The rubbery block was synthesized at two molecular weights, 20 kg/mol and 40 kg/mol, to study the effect of the rubbery interlayer thickness on the mechanical properties of the copolymer grafted SiO2 nanocomposites. To ensure good dispersion of the rubbery block grafted SiO2 nanoparticles, a 20 kg/mol PGMA block was grown from the 20 kg/mol PHMA block. Similarly, a 40 kg/mol PGMA block was grown from the 40 kg/mol PHMA block. The nanocomposites are therefore denoted as 20k20k for the 20 kg/mol PHMA and 20 kg/mol PGMA grafted SiO2 filled epoxy and 40k40k for the 40 kg/mol PHMA and 40 kg/mol PGMA grafted SiO2 filled epoxy.
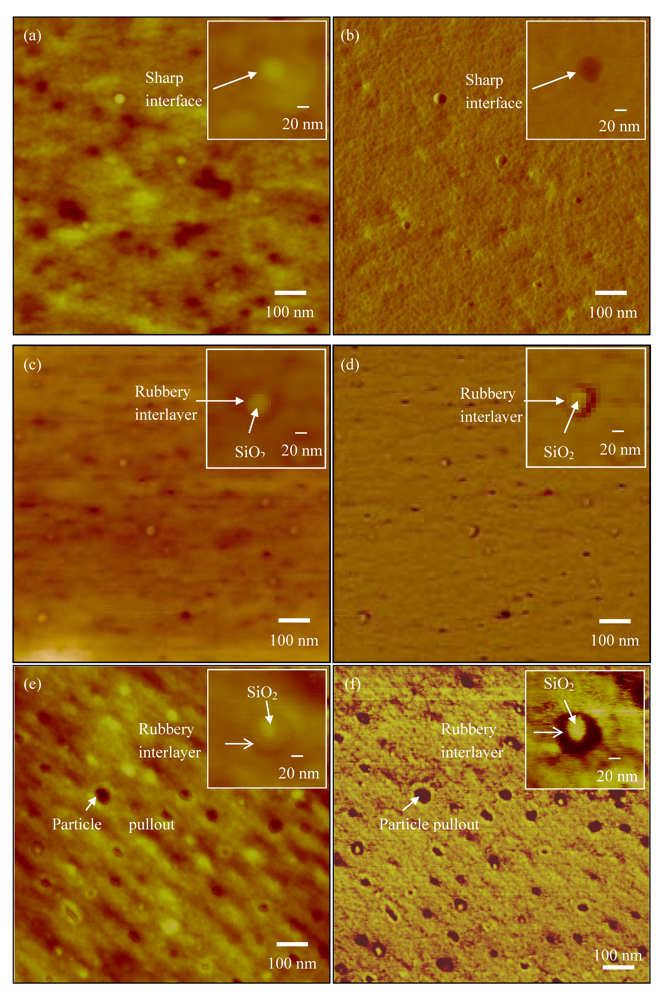
Good dispersion was achieved in both the 20k20k and the 40k40k systems as shown in the AFM images in
Figure 3. To show that the PHMA is acting as a rubbery interlayer, AFM images were taken comparing the PHMA-
b-PGMA systems to silica nanoparticles with only PGMA attached. Nanocomposites with a loading of 0.3 vol% SiO
2 cores were used for AFM observation to ensure that the grafted particles were isolated. A sharp phase change between the SiO
2 cores and the epoxy matrix was observed in the solely PGMA grafted SiO
2 epoxy nanocomposites (see
Figure 3(a,b)). When the PHMA is present, a softer interphase can be seen in both the 20k20k and the 40k40k systems (see
Figure 3(c–f)). This softer interphase appears darker than the epoxy matrix in the phase images (see
Figure 3(d,f)).
Figure 3.
(a) AFM height image of 0.3 vol% PGMA-SiO2/epoxy; (b) AFM phase image of 0.3 vol% PGMA-SiO2/epoxy; (c) AFM height image of 0.3 vol% 20k20k-SiO2/epoxy; (d) AFM phase image of 0.3 vol% 20k20k-SiO2/epoxy; (e) AFM height image of 0.3 vol% 40k40k-SiO2/epoxy; (f) AFM phase image of 0.3 vol%40k40k-SiO2/epoxy.
The ratio of the rubbery interlayer thickness to the SiO
2 radius of the 20k20k and the 40k40k systems was analyzed based on at least 10 particles from each AFM image using an image processing program ImageJ [
20]. The measured values were compared to the ratio calculated using the rubbery block molecular weight, graft density and bulk PHMA density of 1.0007 g/cm
3. The comparison is summarized in
Figure 4.
Figure 4.
A comparison between the measured and calculated ratio of the rubbery interlayer thickness (t) and the radius (r) of the particle cores for particles with a 20 kg/mol and 40 kg/mol PHMA rubbery interlayer.
Figure 4.
A comparison between the measured and calculated ratio of the rubbery interlayer thickness (t) and the radius (r) of the particle cores for particles with a 20 kg/mol and 40 kg/mol PHMA rubbery interlayer.
Both the calculated and the measured results showed that the rubbery interlayer thickness increases as expected with increasing molecular weight. The AFM images were taken using a tip with a radius of 7 nm. Because the tip radius was on the order of the radius of the particle, the apparent particle size in the AFM image is greater than the real particle size. This contributes to the discrepancy between the calculation and the measured interlayer thickness to particle radius ratio. Due to this limitation of the AFM imaging, the calculated rubbery interlayer to particle core ratio was used when calculating the volume percent of the rubbery interlayer in the nanocomposites. The volumetric loading of the SiO
2 cores in the current paper, together with the volumetric ratio of the PHMA rubbery interlayer to the SiO
2 cores and the volumetric fraction of the SiO
2 cores in the polymer-SiO
2 nanoparticles are summarized in
Table 1.
Table 1.
Volumetric loading of the copolymer grafted SiO2/epoxy nanocomposites prepared in the paper. The volume ratio of the PHMA rubbery interlayer to that of the SiO2, and the volumetric fraction of the SiO2 core in the polymer grafted SiO2 nanoparticles for both 20k20k and 40k40k are also calculated and summarized.
3.2. Curing and Glass Transition Temperature
The PGMA outer block of the copolymer grafted SiO
2 nanoparticles introduces additional epoxy groups to the composite, which can influence the curing process of the matrix by decreasing the stoichiometric anhydride hardener to epoxy ratio. This can impact the glass transition temperature and the mechanical properties of the nanocomposites. The curing can be further complicated when one considers that the PGMA layer might scavenge epoxy and anhydride monomers (because the PGMA layer is epoxy compatible), probably at different efficiency. The difference in the curing process between the nanocomposites and the neat epoxy alone can impact the glass transition temperature and mechanical properties. However, we can still study the influence of the rubbery interlayer on the glass transition temperature and the mechanical properties of the nanocomposites by separating the effect of the interlayer from the influence of the anhydride/epoxy ratio. The impact of the anhydride to epoxy ratio on the glass transition temperature and the mechanical properties of the neat epoxy was studied. The curing of neat epoxy with an anhydride to epoxy ratio from 0.8 to 1.2 was analyzed using modulated differential scanning calorimetry. The influence of the ratio on the curing mechanism (evaluated by curing activation energy) and the degree of curing completion (indicated by glass transition temperature) was quantified. The activation energy for curing was calculated from the Kissinger equation [
21,
22,
23],
![Polymers 04 00187 i001]()
where
Tq,p is the temperature at the heat flow peak generated by a heating rate of
q.
E is the activation energy of the curing reaction and
R is the gas constant. The activation energy was measured from the slope of
![Polymers 04 00187 i010]() vs.
vs. ![Polymers 04 00187 i011]()
.
Table 2 shows the average activation energy to cure the neat epoxy with an anhydride to epoxy ratio (denoted as R in
Table 2) of 0.8, 1 and 1.2. The activation energy of the three systems was similar (within 0.2%). However, at a ratio of 1.2 there is a 7% decrease in the T
g from the 1:1 ratio. Therefore, changing the anhydride to epoxy ratio by 20% from the stoichiometric ratio does not change the curing mechanism, but does change the extent of curing completion.
Table 2.
The glass transition temperature of the epoxy systems.
Table 2.
The glass transition temperature of the epoxy systems.
| Material | vol% of SiO2 Cores | R * | Activation Energy (J/g) | Tg (°C) |
|---|
| Neat epoxy | | 0.8 | 74.3 | 110 |
| | | 1 | 75.8 | 112 |
| | | 1.2 | 76.7 | 105 |
| 20k20k | | | | |
| | 0.1% | 0.99 | | 109 |
| | 0.3% | 0.98 | | 110 |
| | 0.6% | 0.96 | | 105 |
| | 1% | 0.93 | | 100 |
| 40k40k | | | | |
| | 0.1% | 0.98 | | 110 |
| | 0.2% | 0.97 | | 110 |
| | 0.3% | 0.95 | | 109 |
The impact of the anhydride to epoxy ratio on the mechanical properties of unfilled epoxy was also determined.
Figure 5 shows the mechanical properties (Young’s modulus and strain-to-break) of the neat epoxy with anhydride to epoxy ratio from 0.4 to 1.2. It is observed that the modulus and strain-to-break of the neat epoxy remain unchanged in the window of 0.8 to 1, suggesting that the mechanical properties of the epoxy matrix are insensitive to the degree of curing completion when the anhydride to epoxy ratio is between 0.8 and 1 in the current study. Similar results have been found for other anhydride cured epoxies [
24].
Figure 5.
Modulus and strain-to-break of the neat epoxy with different anhydride/resin ratios.
Figure 5.
Modulus and strain-to-break of the neat epoxy with different anhydride/resin ratios.
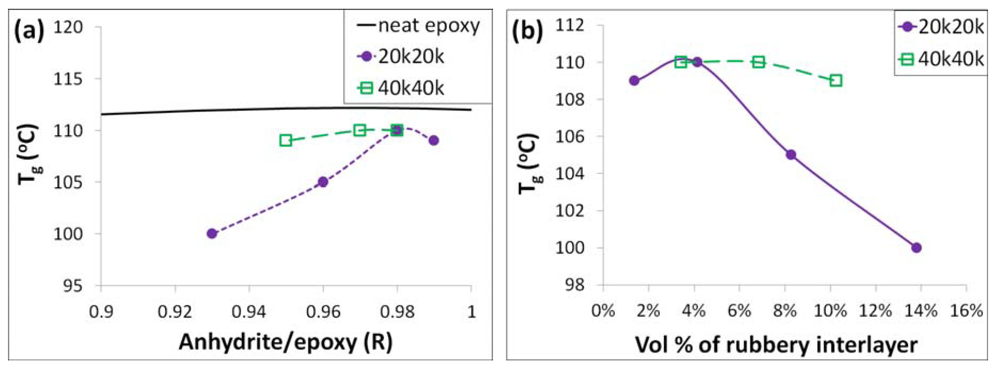
Because the glass transition temperature and the mechanical properties of the neat epoxy are not significantly altered for the anhydride to epoxy ratios from 0.8 to 1; the addition of the PGMA layer only alters the potential anhydride/epoxy ratio from 0.9 to 1 (also calculated in
Table 2); and the amount of epoxy and anhydride monomer that penetrates the brush is unknown, the anhydride to epoxy ratio was not altered for the nanocomposites. Based on the study above, the impact of the grafted polymer on the glass transition temperature could be extracted from the difference between the relationship of the anhydride to epoxy ratio and the glass transition temperature of the nanocomposites (
Figure 6(a)). It is interesting to note that the glass transition temperature of the composites is always lower than the neat epoxy, which is due to the existence of the grafted polymer. As shown in
Figure 6(b), the 20k20k system exhibited a larger decrease in T
g at the same volumetric loading of the PHMA rubbery layer as the 40k40k composites. This suggests that the drop in T
g of the 20k20k composites is not due to the rubbery volume percent alone. The reason for this interesting phenomenon is unclear.
Figure 6.
Plots of glass transition temperature vs. (a) anhydride/epoxy ratio R of different epoxy systems; (b) the rubbery interlayer volume percent in the 20k20k and the 40k40k systems.
Figure 6.
Plots of glass transition temperature vs. (a) anhydride/epoxy ratio R of different epoxy systems; (b) the rubbery interlayer volume percent in the 20k20k and the 40k40k systems.
3.3. Mechanical Properties of HMA-b-GMA-SiO2/Epoxy Nanocomposites
To understand whether the rubbery interlayer thickness in the current study will alter the mechanical properties of the rubbery interlayer, temperature sweep dynamic mechanical analysis was performed on the neat epoxy, 0.3 vol% and 1 vol% 20k20k-SiO
2 and 0.3 vol% 40k40k-SiO
2/epoxy nanocomposites. The temperature sweep curves for all four systems are shown in
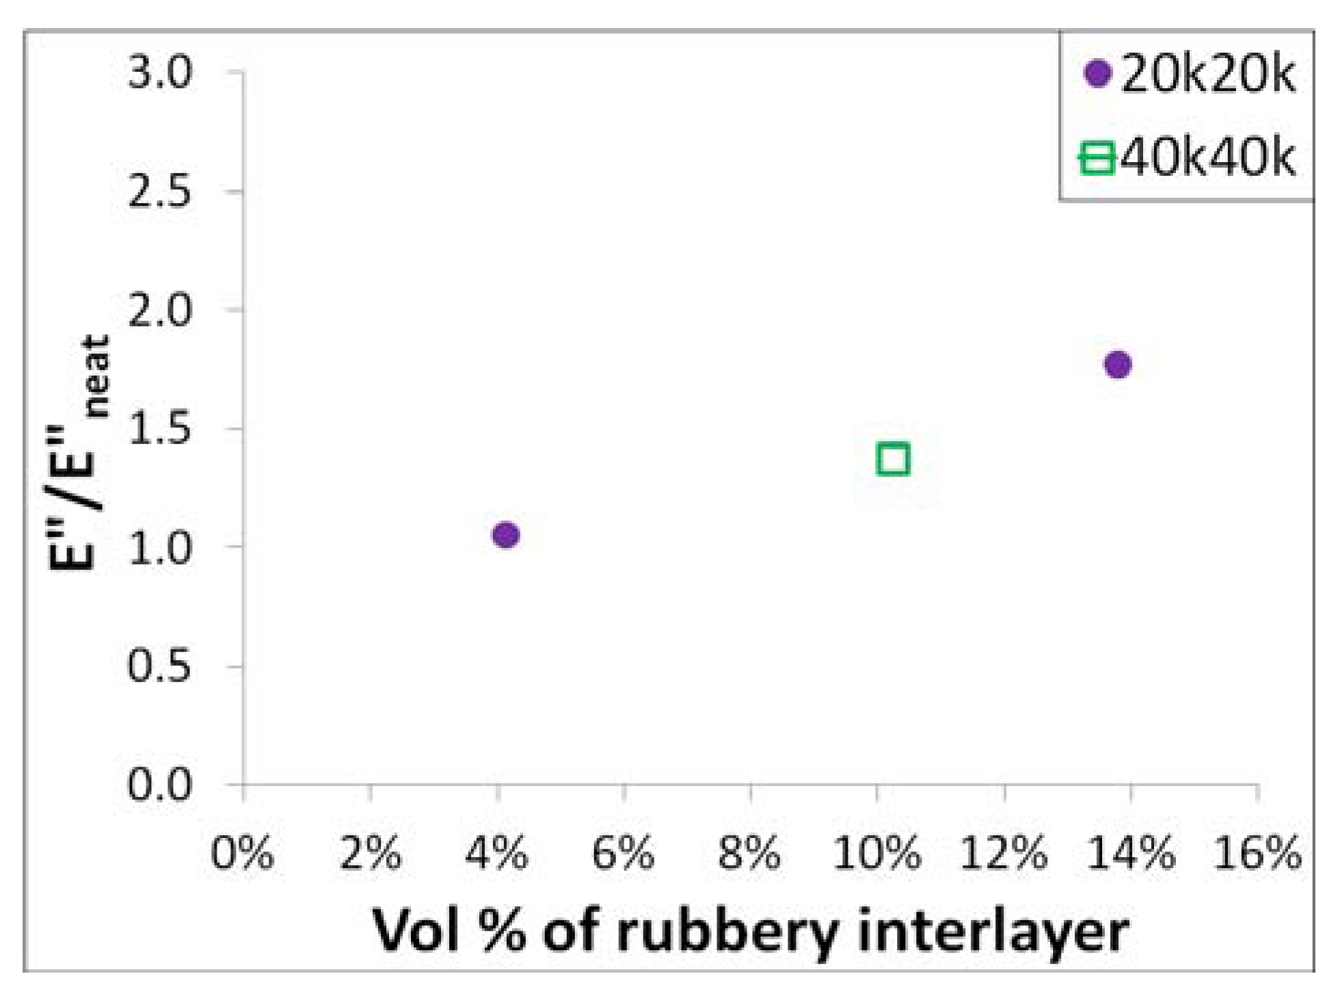
Figure 7. There are two peaks in the loss modulus curve: the glass transition and β-transition for the unmodified epoxy. An additional peak was observed in the loss modulus curves of the 1 vol% 20k20k-SiO
2/epoxy around 0 °C. The β-transition broadens at around 0 °C for the 0.3 vol% 40k40k-SiO
2/epoxy. Neither a peak nor a broadening at 0 °C is obvious in the 0.3 vol% 20k20k-SiO
2. The peak around 0 °C is due to the existence of the rubbery interlayer, and matches the glass transition temperature of the PHMA, which has been reported to be around 0 °C [
25,
26]. A plot of the loss modulus increase at 0 °C
vs. the volume percent of the rubbery interlayer is shown in
Figure 8, showing that the increase in the loss modulus is almost linearly proportional to the volume percent of the rubbery interlayer. This data suggests that the dynamic mechanical properties of the PHMA interlayer are insensitive to the molecular weights that were studied in the paper.
Figure 7.
A temperature sweep of the neat epoxy and PHMA-b-PGMA grafted SiO2 epoxy nanocomposites. (a) Storage modulus vs. temperature; (b) Loss modulus vs. temperature.
Figure 7.
A temperature sweep of the neat epoxy and PHMA-b-PGMA grafted SiO2 epoxy nanocomposites. (a) Storage modulus vs. temperature; (b) Loss modulus vs. temperature.
Figure 8.
The rubbery interlayer volume fraction vs. the ratio of loss modulus of the nanocomposites and that of the neat epoxy at 0 °C.
Figure 8.
The rubbery interlayer volume fraction vs. the ratio of loss modulus of the nanocomposites and that of the neat epoxy at 0 °C.
Important information about the matrix molecular weight between crosslinks M
c and toughenability can be drawn from the DMA data. It is believed that lightly crosslinked epoxies (M
c > 500 g/mol) can be toughened more efficiently by rubbers than highly crosslinked epoxies (M
c < 500 g/mol). The toughening effect levels off as the molecular weight between crosslinks increases (M
c > 3000 g/mol) [
27]. The M
c of the epoxy matrix can be calculated from the following equation based on the theory of rubber elasticity [
28]:
![Polymers 04 00187 i002]()
where
ρ is the density of an epoxy at temperature
T,
R is the gas constant and
Er is the storage modulus of the epoxy at 50 °C above its glass transition temperature. A comparison of the toughenability of the studied DGEBA/anhydride epoxy to that of a highly crosslinked and a lightly crosslinked epoxy from the literature is shown in
Table 3. The fracture energy of the lightly crosslinked epoxy matrix with M
c = 679 g/mol improved by a factor of 3 with the addition of 5 wt% rubber, while at the same filler concentration the fracture energy increased by a factor of about 2.5 for the highly crosslinked epoxy matrix with M
c = 260 g/mol. The studied epoxy with M
c = 312 g/mol is a highly crosslinked epoxy with small toughenability.
Table 3.
A comparison of the toughenability of the epoxy used in this study to some literature systems.
Table 3.
A comparison of the toughenability of the epoxy used in this study to some literature systems.
| System | Mc (g/mol) | G1c (J/m2) | G1c at 5 wt% Rubber (J/m2) |
|---|
| DGEBA/anhydride (the system used in the current work) | 312 | 281 | |
| DGEBA+DDS [27] | 260 | 150 | 400 |
| DGEBA+DDS [27] | 679 | 4500 | 14000 |
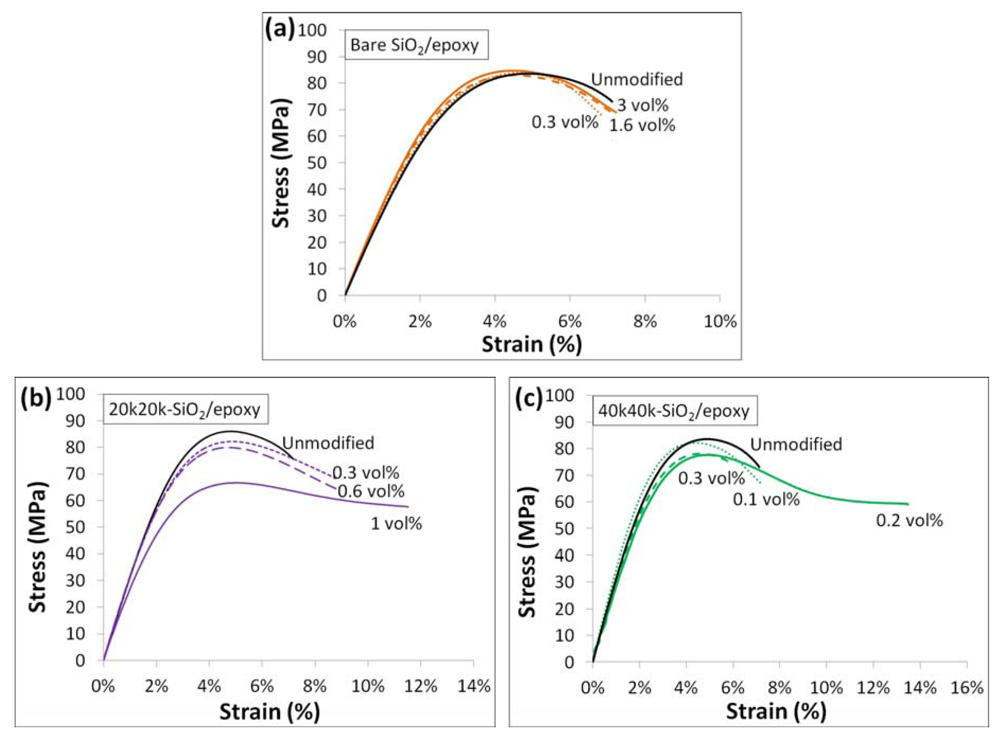
The tensile properties, including Young’s modulus, tensile strength and strain-to-break of the neat epoxy, 20k20k-SiO
2, 40k40k-SiO
2 and untreated SiO
2 filled epoxy nanocomposites with different loadings are summarized in
Table 4. The strain-to-break of the rubbery grafted SiO
2/epoxy nanocomposites increased with increasing loading. A
t-test shows that the strain-to-break of the rubbery grafted SiO
2/epoxy nanocomposites is significantly larger than the neat epoxy at a confidence level of 95% (except at 0.1% SiO
2 core), while the strain-to-break of the bare SiO
2/epoxy nanocomposites showed no statistical difference from the neat epoxy. This suggests that the increase in the copolymer grafted SiO
2/epoxy nanocomposites was not due to the existence of the SiO
2 cores but the existence of the rubbery layer. Representative stress strain curves of all three composites studied are shown in
Figure 9.
Figure 10 shows the relationship between the rubbery interlayer volume percent and the mechanical properties of the nanocomposites. Both the 40k40k and 20k20k systems improve the strain-to-break and the tensile toughness with a similar trend (
Figure 10(a)), with the 40k40k showing a better improvement below 8 vol% of the rubbery interlayer. However, an obvious decrease in the modulus and tensile strength in the 40k40k systems occurs at a lower rubbery interlayer volume fraction than in the 20k20k system (
Figure 10(b)). Therefore, the 20k20k system can achieve similar improvement in ductility and tensile toughness of the matrix but maintain better modulus and tensile strength than the 40k40k system. It is thus possible that an improvement in the strain-to-break, while maintaining modulus and tensile strength, can be achieved by reducing the interlayer thickness and increasing the particle loading.
Table 4.
The tensile properties of the nanocomposites and the neat epoxy. Error estimates are the measured standard deviations.
Table 4.
The tensile properties of the nanocomposites and the neat epoxy. Error estimates are the measured standard deviations.
| Sample | fsilica cores | εb (%) | (t-test) | UTS (MPa) | E (GPa) | Area under σ-ε Curve
W (MPa or 10−6 J/m3) |
|---|
| Neat | | 7.36 ± 0.41 | | 83.73 ± 1.15 | 3.30 ± 0.07 | 5.3 ± 1.6 |
| Bare- SiO2 | 0.3 | 6.99 ± 0.34 | - | 83.54 ± 0.34 | 3.40 ± 0.05 | 5.3 ± 0.4 |
| 1.6 | 7.19 ± 0.96 | 9% | 83.46 ± 1.10 | 3.43 ± 0.10 | 5.7 ± 1.0 |
| 3 | 7.24 ± 1.74 | 19% | 84.24 ± 0.94 | 3.67 ± 0.09 | 6.0 ± 0.9 |
| 20k20k-SiO2 | 0.1 | 7.18 ± 0.35 | 74% | 82.35 ± 1.15 | 3.17 ± 0.09 | 5.6 ± 1.2 |
| 0.3 | 9.49 ± 1.02 | 98% | 79.60 ± 1.37 | 3.18 ± 0.08 | 6.1 ± 1.4 |
| 0.6 | 9.07 ± 0.30 | 93% | 75.72 ± 1.00 | 3.26 ± 0.13 | 5.8 ± 1.0 |
| 1 | 11.52 ± 0.45 | 99% | 66.67 ± 1.33 | 2.81 ± 0.05 | 6.4 ± 1.3 |
| 40k40k-SiO2 | 0.1 | 7.68 ± 0.54 | 93% | 78.62 ± 0.70 | 3.32 ± 0.08 | 5.6 ± 0.8 |
| 0.2 | 12.50 ± 0.76 | 98% | 77.93 ± 0.22 | 2.94 ± 0.05 | 6.7 ± 0.3 |
| | 0.3 | 6.91 ± 1.59 | 97% | 76.63 ± 2.05 | 3.02 ± 0.19 | 5.4 ± 1.9 |
Figure 9.
Representative stress strain curves for (a) bare SiO2/epoxy nanocomposites; (b) 20k20k-SiO2/epoxy nanocomposites; and (c) 40k40k-SiO2/epoxy nanocomposites at different volumetric loadings of SiO2 cores.
Figure 9.
Representative stress strain curves for (a) bare SiO2/epoxy nanocomposites; (b) 20k20k-SiO2/epoxy nanocomposites; and (c) 40k40k-SiO2/epoxy nanocomposites at different volumetric loadings of SiO2 cores.
Figure 10.
A plot of (a) strain-to-break; and (b) modulus vs. vol% of PHMA rubbery interlayer for the 20k20k and 40k40k systems.
Figure 10.
A plot of (a) strain-to-break; and (b) modulus vs. vol% of PHMA rubbery interlayer for the 20k20k and 40k40k systems.
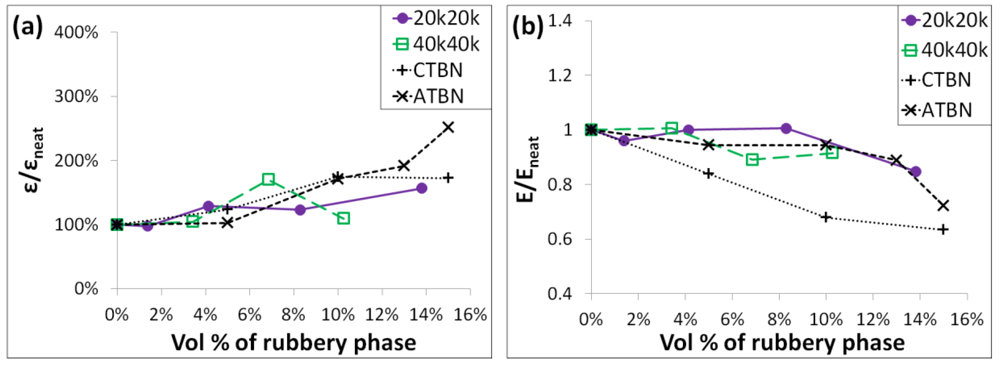
A comparison of the normalized modulus and strain-to-break of the new rubbery copolymer grafted SiO
2/epoxy nanocomposites to some conventional liquid rubber filled epoxy composites at similar testing conditions and with a similar matrix is shown in
Figure 11. The grafted SiO
2/epoxy nanocomposites exhibit a slightly larger extent of strain-to-break increase at low loadings of the rubbery phase than the conventional rubbers (see
Figure 11(a)), but maintain the Young’s modulus better than some conventional rubber fillers, especially for the 20k20k system.
Figure 11.
(
a) Comparison of the improvement in the strain-to-break
vs. the volumetric loading of the rubbery phase between the rubbery copolymer grafted SiO
2/epoxy nanocomposites and conventional rubber (CTBN and ATBN) filled epoxy composites; (
b) Comparison of the Young’s modulus
vs. the volumetric loading of the rubbery phase between the rubbery copolymer grafted SiO
2/epoxy nanocomposites and conventional rubber (CTBN and ATBN) filled epoxy composites [
29].
3.4. Fracture Mechanisms
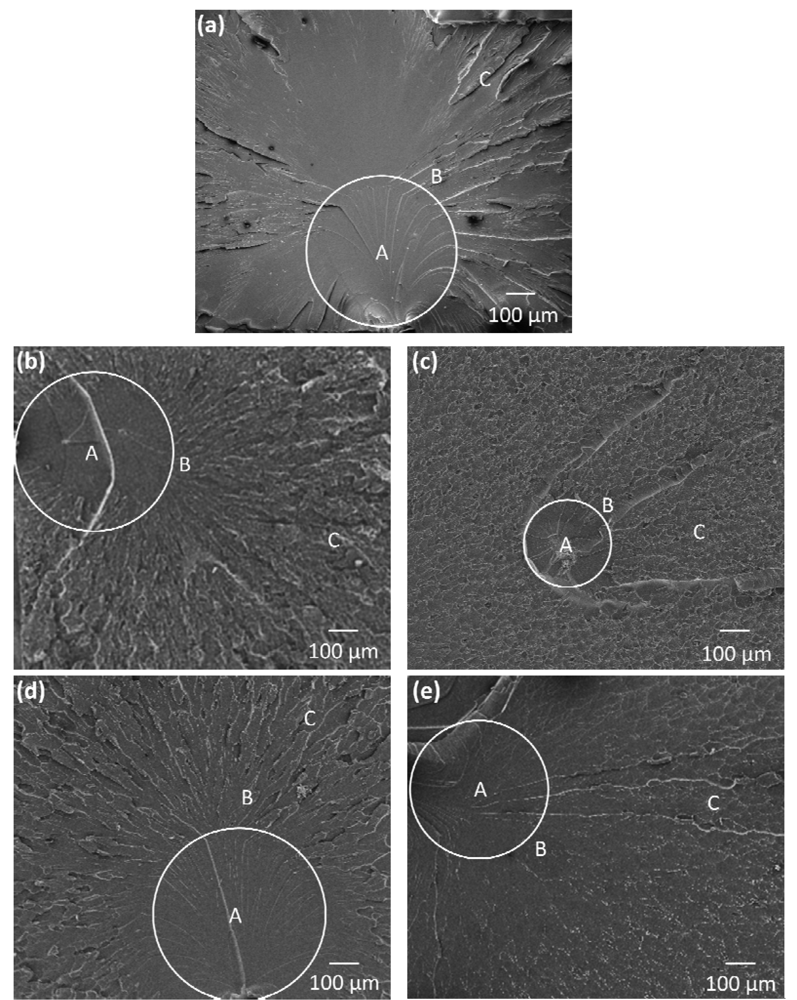
A brittle fracture surface usually consists of a mirror zone, mist zone and hackle zone [
11]. The mirror zone is the slow crack propagation region next to the crack initiation site. It is usually smooth because the crack is propagating within a plane. As the crack starts to grow faster, a narrow mist zone is developed, where the crack is still propagating in the original crack growth plane. Right after the mist zone, cracks began to bifurcate into 3D planes, leading to a rough hackle zone [
30]. The fracture surfaces of the neat epoxy, 20k20k-SiO
2/epoxy at 0.3 and 1 vol% SiO
2 cores and 40k40k-SiO
2/epoxy at 0.1 and 0.2 vol% SiO
2 cores after tensile failure are shown in
Figure 12–
Figure 14. The three zones are observed in all the materials. The mirror zones are marked in white circles on the overview SEM images in
Figure 12.
Figure 12.
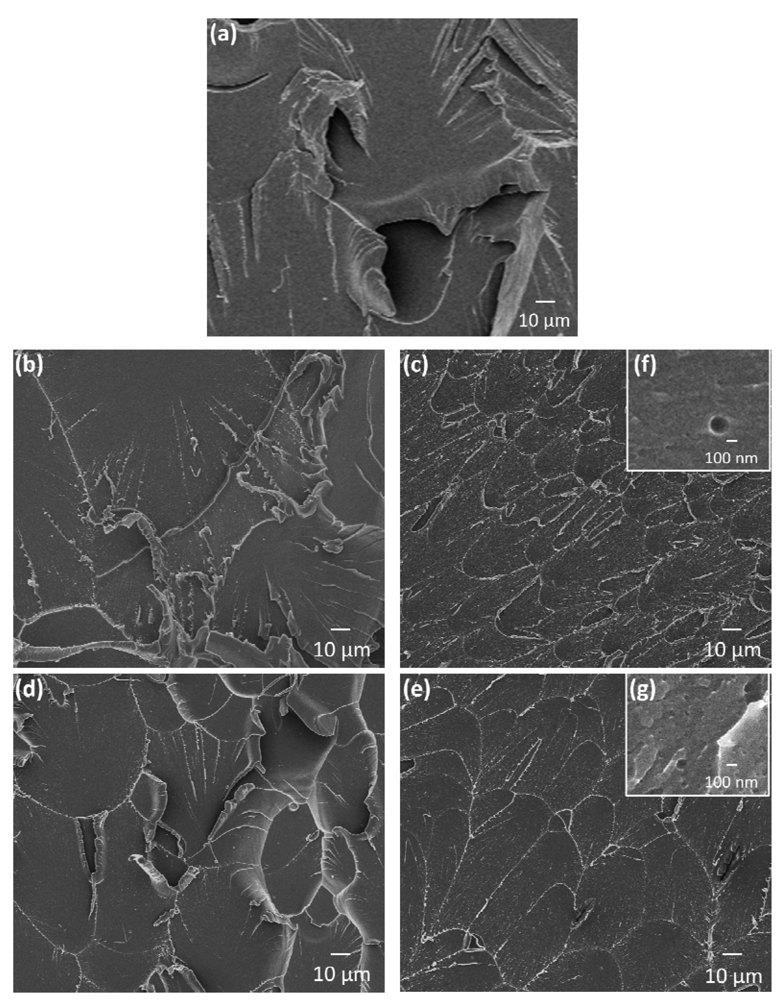
Scanning Electron Micrographs showing the tensile fracture surfaces of (a) the neat epoxy; (b) 0.3 vol% 20k20k-SiO2 nanocomposites; (c) 1 vol% 20k20k-SiO2 nanocomposites; (d) 0.1 vol% 40k40k-SiO2 nanocomposites; and (e) 0.2 vol% of 40k40k-SiO2 nanocomposites. ”A”: mirror zone, ”B”: mist zone and ”C”: hackle zone.
Figure 12.
Scanning Electron Micrographs showing the tensile fracture surfaces of (a) the neat epoxy; (b) 0.3 vol% 20k20k-SiO2 nanocomposites; (c) 1 vol% 20k20k-SiO2 nanocomposites; (d) 0.1 vol% 40k40k-SiO2 nanocomposites; and (e) 0.2 vol% of 40k40k-SiO2 nanocomposites. ”A”: mirror zone, ”B”: mist zone and ”C”: hackle zone.
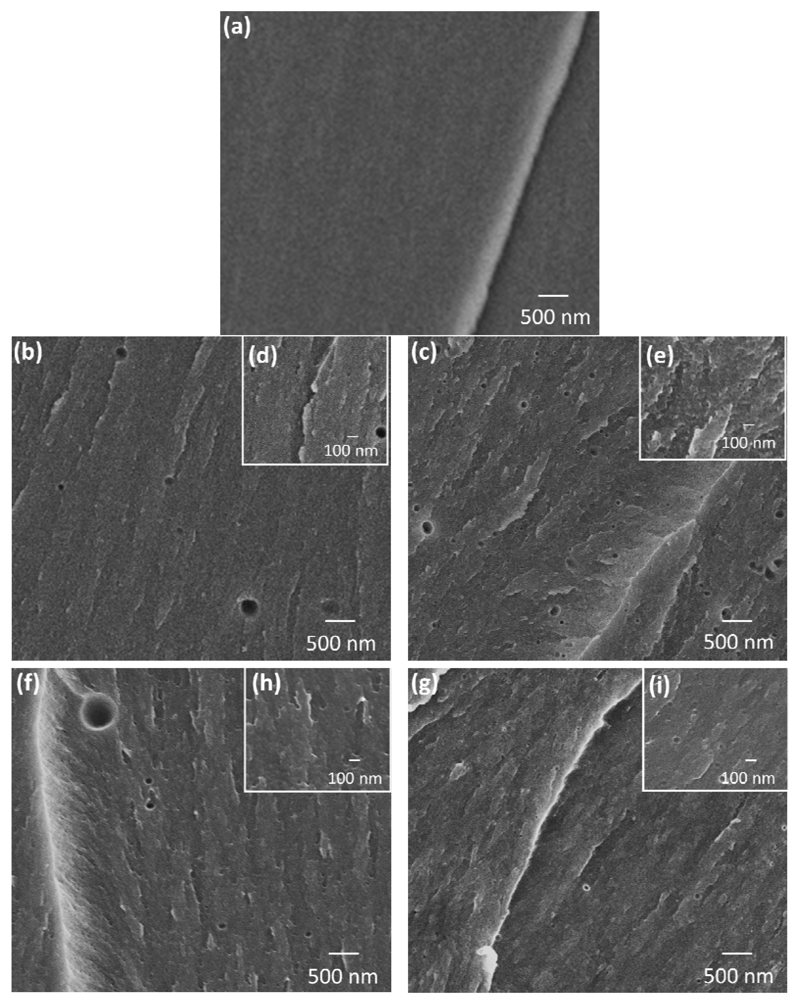
Cavitation or plastic void growth of the rubber layer can be seen in the magnified mirror zones of the nanocomposites (see
Figure 13(b–e)), which promotes plastic deformation in the matrix, hinders crack growth, and generates a rougher mirror zone surface. This leads to the improvement in ductility and toughness in the rubbery copolymer grafted SiO
2 nanoparticle composites as shown in
Table 4 and
Figure 9 and
Figure 10. Note that the 20 kg/mol PHMA and 40 kg/mol PHMA grafted rubbery interlayer exhibit cavitation or void growth (
Figure 13(b–i)), which might result in similar extent of the improvement in ductility of the epoxy matrix at the same volume percent of the rubbery interlayer.
Figure 13.
Scanning Electron Micrographs showing the ‘mirror’ zone on tensile fracture surfaces of (a) neat epoxy; (b), (d) 0.3 vol% of 20k20k-SiO2 nanocomposites; (c), (e) 1 vol% of 20k20k-SiO2 nanocomposites; (f), (h) 0.1 vol% 40k40k-SiO2 nanocomposites; and (g), (i) 0.2 vol% of 40k40k-SiO2 nanocomposites.
Figure 14.
SEM images of the hackle zones of (a) the neat epoxy and the nanocomposites with (b) 0.3 vol% of 20k20k-SiO2; (c) 1 vol% of 20k20k-SiO2; (d) 0.1 vol% of 40k40k-SiO2; (e) 0.2 vol% of 40k40k-SiO2; (f) higher magnification for 1 vol% 20k20k; and (g) higher magnification for 0.2 vol% 40k40k.
Figure 14.
SEM images of the hackle zones of (a) the neat epoxy and the nanocomposites with (b) 0.3 vol% of 20k20k-SiO2; (c) 1 vol% of 20k20k-SiO2; (d) 0.1 vol% of 40k40k-SiO2; (e) 0.2 vol% of 40k40k-SiO2; (f) higher magnification for 1 vol% 20k20k; and (g) higher magnification for 0.2 vol% 40k40k.
The features in the hackle zone for the neat epoxy and low concentration copolymer grafted SiO
2/epoxy nanocomposites (marked as region “C” in
Figure 12 and shown in
Figure 14) have random 3D features. This is because crack branching produces severe surface roughening; however, it doesn’t effectively retard crack growth [
31]. Unlike the neat epoxy and the nanocomposites at low loadings, the 1 vol% 20k20k and 0.2 vol% 40k40k show features of parabolic patterned markings (see
Figure 14(c,e)). The formation of the parabolic markings is believed to be a result of interaction between the crack front and the cavitation, which has also been observed in this region (see
Figure 14(f,g)) [
32]. This interaction might also contribute to the improvement of the ductility and tensile toughness of the epoxy nanocomposites at those loadings, as they achieved the most improvement compared to other loadings, which do not show the parabolic markings in the hackle zone (see
Table 3).
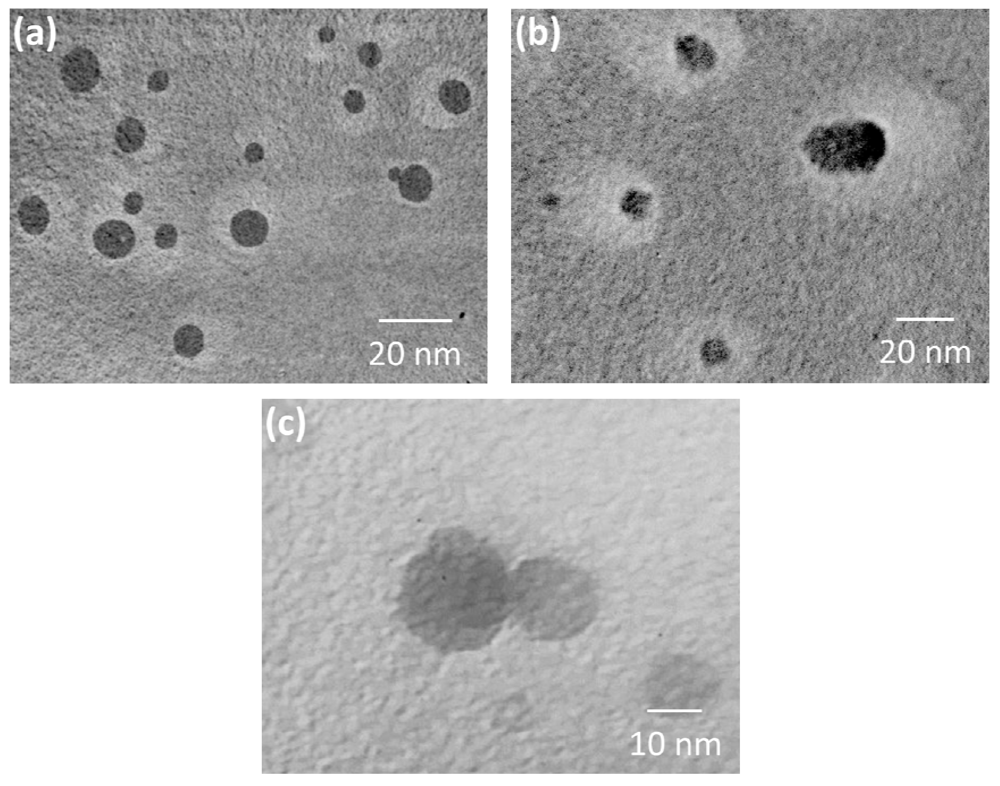
To understand the leading mechanisms for the improvement of the mechanical properties of the epoxy matrix by the rubbery grafted SiO
2 nanoparticles, transmission electron microscopy (TEM) micrographs of thin slices of material perpendicular to the fracture surface were taken. The TEM micrographs of the fracture damage zone of the 1 vol% 20k20k nanocomposite and the 0.3 vol% 40k40k nanocomposites are shown in
Figure 15. There are voids around the SiO
2 nanoparticles and it is caused by the rubbery interlayer cavitation and deformation. Similar images taken of non-deformed samples did not show the contrast exhibited here.
Figure 15.
Transmission electron micrographs near the fracture surface of (a) 1 vol% 20k20k nanocomposites; (b) 0.3 vol% 40k40k nanocomposites; and (c) 1 vol% 20k20k as prepared.
Figure 15.
Transmission electron micrographs near the fracture surface of (a) 1 vol% 20k20k nanocomposites; (b) 0.3 vol% 40k40k nanocomposites; and (c) 1 vol% 20k20k as prepared.
The cavitation causes permanent failure in the rubbery interlayer, which results in energy release. The energy released by cavitation is negligible and does not contribute to the toughening directly but makes it easy for the matrix to deform plastically, as proven by Bagheri and Pearson
et al. who found that the toughening efficiency is similar for rubbers with different cavitation resistance and pre-formed voids, which did not involve any cavitation energy [
33]. Rubber cavitation, however, is usually followed by plastic void growth extending to the matrix and local shear yielding [
34], both of which are believed to be primary toughening mechanisms in rubber filled epoxy. The irreversible plastic void-growth in the matrix dissipates energy and contributes to the enhanced fracture energy, and the local shear yielding can promote plastic deformation in the matrix, which also improves the fracture energy [
35].
There are well-established models from Huang and Kinloch predicting the contribution of plastic void growth and shear banding to the fracture energy in a process zone at the tip of a pre-crack under plane strain uniaxial tension [
38]. In this study, we have tested the tensile properties and thus the model cannot be used directly. Because energy density is an intensive property, which is independent of volume of the process zone, the dissipated strain-energy density instead of the fracture energy of the tensile fracture is theoretically calculated to compare to the measured tensile strain-energy density. The dissipated strain-energy density (
Uv) for a void in the epoxy to undergo plastic void growth was quantitatively studied by Huang and Kinloch [
38] and is expressed as:
![Polymers 04 00187 i003]()
where
p is the local hydrostatic stress, and
fv and
fr are the volumetric loading of the voids and rubbery interlayer. Since
fv and
fr of the current studied system can be measured and calculated, the only unknown parameter is the local hydrostatic stress, which is different from that in the process zone at a crack tip as given by Huang and Kinloch [
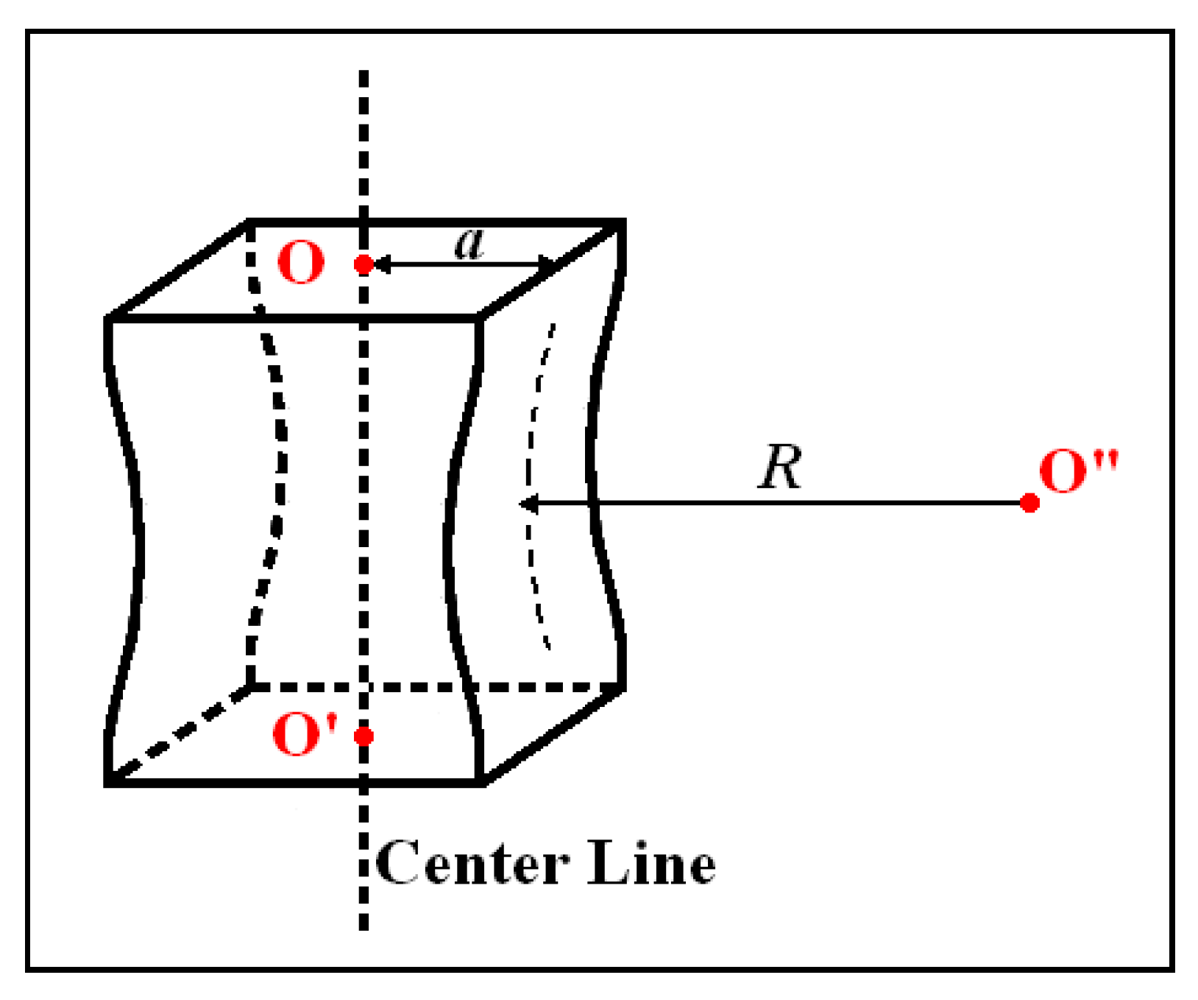
38]. Once necking has occurred in a specimen under a uniaxial plane strain tensile test, there is a triaxial stress state in the onset region of the neck [
36,
37,
38]. When the neck profile is concave is there a hydrostatic stress state. The hydrostatic stress at the concave profile region in the uniaxial tension can be calculated from the following equations [
40,
41,
42]:
![Polymers 04 00187 i004]()
where
σyt is the yield stress of the material;
FT is the local triaxiality factor;
a/R is the ratio of half of the cross-section edge
a to the profile radius
R of the neck as shown in
Figure 16. There is an empirical relationship [
42] between
a/R and
εb and
εn which are the strain at break and the strain at the onset of necking, respectively.
εb and
εn were determined experimentally.
Figure 16.
Neck region of a tensile bar.
Figure 16.
Neck region of a tensile bar.
The strain energy density of a tensile test can be calculated as the area underneath the stress strain curve (Equation (15)), which is also known as the tensile toughness:
where
εb is the strain-to-break;
σ and
ε are stress and strain of a tensile curve; and
W is the strain energy density (or tensile toughness). The difference in the tensile toughness of the composites and the epoxy matrix is equal to the strain energy density contribution from all operating toughening mechanisms. Since the plastic void growth mechanism is obviously happening as shown in
Figure 15, the following equation holds
where the subscript c and u mean the composite and unmodified epoxy; and Uv is the strain energy density contributed by plastic void growth. The sum is the sum of the strain energy contribution by other operating mechanisms.
Figure 17.
(a) Distribution of SiO2 core size, 20 kg/mol PHMA-SiO2 and void surrounded SiO2 in 20k20k systems; (b) Distribution of SiO2 core size, 40 kg/mol PHMA-SiO2 and void surrounding SiO2 in 40k40k systems.
Figure 17.
(a) Distribution of SiO2 core size, 20 kg/mol PHMA-SiO2 and void surrounded SiO2 in 20k20k systems; (b) Distribution of SiO2 core size, 40 kg/mol PHMA-SiO2 and void surrounding SiO2 in 40k40k systems.
Characterization of the deformation due to plastic void growth and the size distribution of SiO
2 nanoparticles were measured from 5 TEM micrographs and are summarized in
Figure 17. The distribution of rubbery layer thickness is given in
Figure 4. The distribution of the void sizes of both systems is overlapping; however the weighted mean of the void size in both systems shows that the voids are slightly bigger than the rubbery interlayer size as summarized in
Table 6. The volume difference between the void and the rubbery layer was used to calculate the plastic void growth contribution to the tensile toughness.
Table 6.
Weighted mean of rubbery interlayer size and void size in both 20k20k and 40k40k systems.
Table 6.
Weighted mean of rubbery interlayer size and void size in both 20k20k and 40k40k systems.
| | vol% of SiO2 Cores | Weight Mean of Rubbery Interlayer Thickness (nm) | vol% of Rubbery Interlayer | Weight Mean of Void Size from the Surface of the SiO2 to the Edge of the Void | vol% of Void |
|---|
| 20k20k | 0.1% | 6.33 | 1.03% | 6.83 | Not measured yet |
| | 0.3% | | 3.08% | | Not measured yet |
| | 0.6% | | 6.16% | | 6.98% |
| | 1.0% | | 10.26% | | 11.63% |
| 40k40k | 0.1% | 10.16 | 2.46% | 11.47 | 3.07% |
| | 0.2% | | 4.93% | | 6.13% |
| | 0.3% | | 7.39% | | 9.20% |
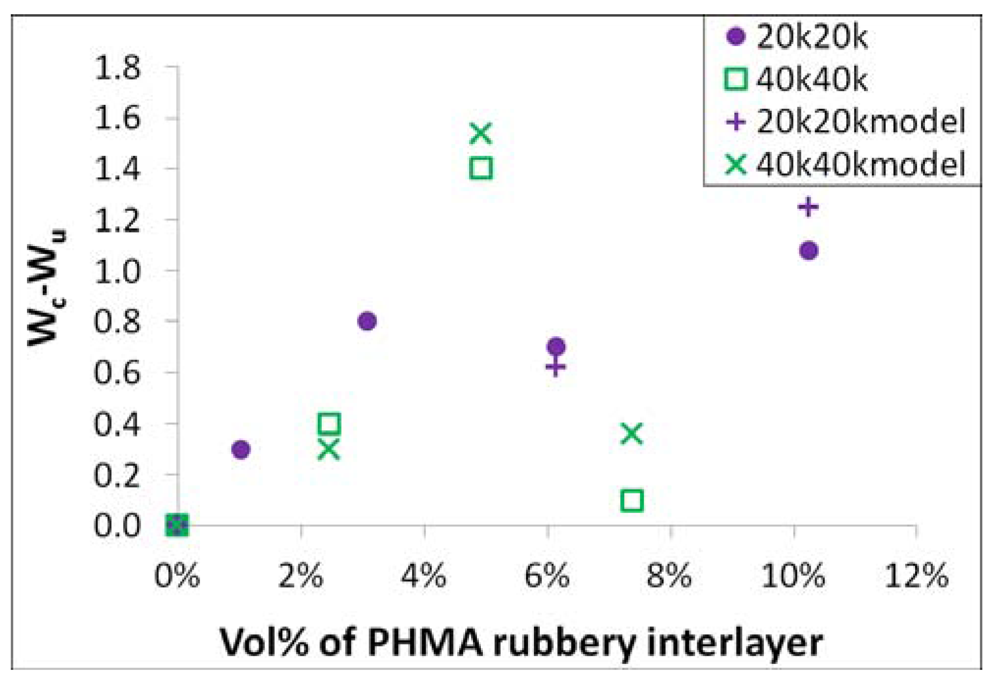
By substituting the volume increase that occurs after rubbery interlayer cavitation in Equations (11) and (16), the fracture mechanism involving plastic void growth is compared with the experimental data of both systems in
Figure 18. There is a good match between the theoretical model and experimental data for the 40k40k system of all three tested loadings and the 20k20k system above 4 vol% of the rubbery interlayer. The plastic void growth was not yet measured for the 20k20k system at low loadings, so no comparison is made. From this analysis, the plastic void growth mechanism is believed to be the leading mechanism for improving the tensile toughness in the studied copolymer grafted SiO
2/epoxy nanocomposites.
Figure 18.
Plastic void growth mechanism in rubbery interlayer grafted SiO2/epoxy.
Figure 18.
Plastic void growth mechanism in rubbery interlayer grafted SiO2/epoxy.
Localized shear yielding [
39,
40,
41,
42] is another possible phenomenon following rubbery interlayer cavitation. Localized shear yielding will decrease the composites yield strength. The tensile results in
Table 4 show that the yield strength decreases as the rubbery interlayer volume percent increases. In addition, the voids around the SiO
2 nanoparticles in both 20k20k and 40k40k systems shown in
Figure 15 are elliptical although not oriented. However, the shear bands were not visible in a TEM, and thus the contribution from shear banding is unclear.
Other fracture mechanisms such as crack bridging and pinning [
43] and crack deflection [
44,
45] might also be operating. Crack bridging is unlikely due to the small dimensions of the rubbery layer. Crack pinning is a possible mechanism, since the crack might propagate at slower velocity when it meets the plastic void growth region around the SiO
2 nanoparticles. However there is no clear crack pinning feature on the fracture surface of the nanocomposites in
Figure 12–
Figure 14, indicating the region of plastic deformation around the SiO
2 nanoparticles might not be big enough to launch this mechanism. Wetzel
et al. [
46] found that crack deflection increases with increasing content of rigid nanoparticles. However, in the current study, the volume percent of the SiO
2 cores is less than 1 vol%, which is unlikely to cause significant crack deflection. At such low particle volume percent, Wetzel
et al. observed a large discrepancy between the crack deflection model and experimental data for 13 nm Al
2O
3 nanoparticle filled epoxy. Therefore, the energy release by crack deflection is probably negligible in the current study.


 vs.
vs.  . Table 2 shows the average activation energy to cure the neat epoxy with an anhydride to epoxy ratio (denoted as R in Table 2) of 0.8, 1 and 1.2. The activation energy of the three systems was similar (within 0.2%). However, at a ratio of 1.2 there is a 7% decrease in the Tg from the 1:1 ratio. Therefore, changing the anhydride to epoxy ratio by 20% from the stoichiometric ratio does not change the curing mechanism, but does change the extent of curing completion.


