Richness of Side-Chain Liquid-Crystal Polymers: From Isotropic Phase towards the Identification of Neglected Solid-Like Properties in Liquids


Abstract
:1. Introduction

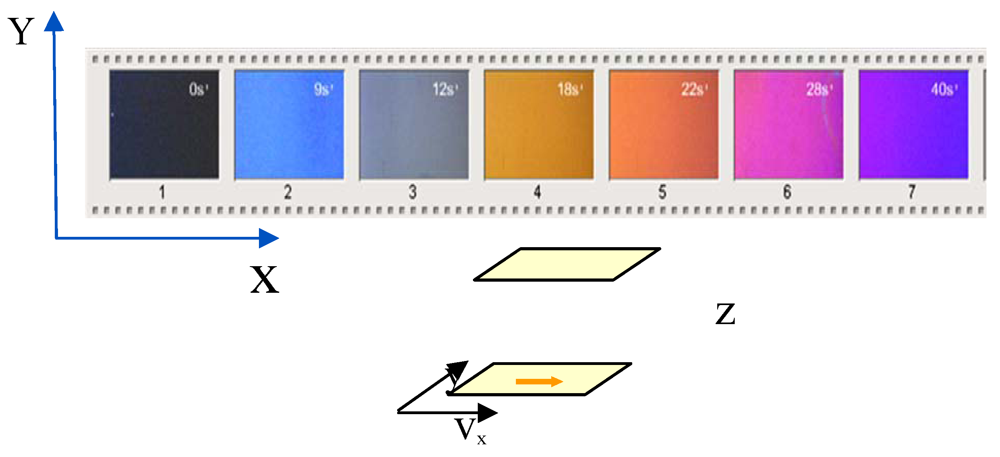
 : ratio of the velocity ν of the moving surface to the gap thickness e in Figure 1). This birefringence (Figure 2) is the signature of the formation above the N-I transition temperature, of a non-equilibrium nematic phase oriented along the velocity axis. The first observation of shear-induced transition in the isotropic phase of thermotropic liquid crystal polymers was made by P. T. Mather in 1997 on a main-chain polymer [1]. The phenomenon was then identified a decade ago on a series of Side-Chain Liquid-Crystal Polymers (SCLCPs) evidencing the generic character of the shear-induced transition [2]. Small Angle neutron Scattering (SANS) experiments have shown that under flow, the mesogens adopt a specific orientation parallel to the chain in the shear-induced phase [2]. This specific non-equilibrium conformation excludes an interpretation in terms of a simple shift of the transition temperatures (for an overview of the chain conformation in liquid crystal phases at rest and under flow see [3,4,5,6,7]).

| Samples | SCLCP: PANO2 | PBuA | Heptadecane |
|---|---|---|---|
| Chemical formula |  |  |  C17H36 |
| Supplier | LLB-Philipps-Univ. Marburg | Polymer Source Inc. | Sigma-Aldrich Co. |
| Molecular weightPolydispersity indexNumber of repetitive units | Mw = 54,000 g∙mol−1 I = Mw/Mn = 1.2 n = 160 | Mw = 20,000 g∙mol−1 I = Mw/Mn = 1.1 n = 160 | M = 240 g∙mol−1 n = 16 |
| Transition temperatures | Tg–33 °C–Nematic–94.5 °C–Isotropic | Tg = −64 °C Amorphous | Tm = 21 °C Crystalline |
2. Experimental
 ) with G0, the shear modulus, γ0, the strain amplitude defined as the ratio of the displacement to the sample gap and Δ the phase shift between the input and the output waves, i.e., in terms of shear elastic (G′) and viscous (G″) moduli:σ (ω) = γ0. (G′(ω).sin(ω.t) + G″(ω).cos(ω.t)), with G′ the component in phase with the strain, and G″ the out-of-phase component and γ0 the strain amplitude. It should be stressed that the formalism in terms of G′ and G″ imposes that the resulting stress wave keeps the shape of the imposed strain wave (sinusoidal-like). Finally, the thermal environment (air-pulsed oven) ensures a temperature stability of ±0.05 °C. The sample was placed between plate-plate fixtures (10 mm diameter). Improved contacts between the liquid and the substrate are obtained by using wetting fixtures made of alumina [28,33].
 3. Results and Discussion
3.1. Non-Monotonic Flow Curve: Characterisation of the Flow Birefringence
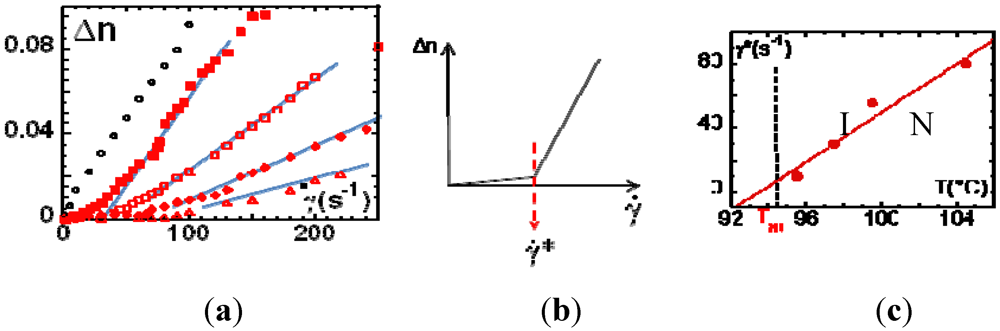
 , one observes a strong departure of the birefringence. This non-linear behavior is interpreted, in the frame of the pre-transitional fluctuation coupling model [10] (Figure 3(b)), as a non-equilibrium, first-order phase transition, characterized by an alignment of the liquid crystal moieties along the velocity direction. The texture free from defects indicates a homogeneously aligned nematic phase (Figure 2). Figure 3(c) illustrates the critical shear rate corresponding to the onset of the emergence of the shear-induced birefringence. The (non-equilibrium) characteristic time
  (Figure 3(c)) varies from 0.1 s up to 10−2 s. τ * is about 102 to 105 larger than the orientational order fluctuations’ lifetime [35], excluding a coupling with the shear flow, in agreement with the first observations carried out on other SCLCPs [14]. This shear-induced birefringence resembles the foreseen non-equilibrium N-I transition but it is not. Is there an equivalence between the birefringence timescales (τ *) and the characteristic timescales of the rheological behavior (stress-optical rule)?
 ) at different temperatures away from TNI: T-TNI: −2°C(○),+1°C(
  ),+3°C(
  ),+5°C(
  ),+10°C(Δ). The wavelength is λ=4,700 Å; (b) Theoretically expected behavior: At low shear rates, the paranematic phase exhibits a flow birefringence proportional to the shear rate. Above a critical shear rate, the non-linear behavior indicates the onset of the shear-induced phase transition; (c) Critical shear rate versus temperature. The corresponding (non-equilibrium) characteristic time is defined by: Sample: PANO2 at 0.060mm (
  ) gap thickness.
) at different temperatures away from TNI: T-TNI: −2°C(○),+1°C( ),+3°C( ),+5°C( ),+10°C(Δ). The wavelength is λ=4,700 Å; (b) Theoretically expected behavior: At low shear rates, the paranematic phase exhibits a flow birefringence proportional to the shear rate. Above a critical shear rate, the non-linear behavior indicates the onset of the shear-induced phase transition; (c) Critical shear rate versus temperature. The corresponding (non-equilibrium) characteristic time is defined by: Sample: PANO2 at 0.060mm ( ) gap thickness.
) gap thickness.
) at different temperatures away from TNI: T-TNI: −2°C(○),+1°C( ),+3°C( ),+5°C( ),+10°C(Δ). The wavelength is λ=4,700 Å; (b) Theoretically expected behavior: At low shear rates, the paranematic phase exhibits a flow birefringence proportional to the shear rate. Above a critical shear rate, the non-linear behavior indicates the onset of the shear-induced phase transition; (c) Critical shear rate versus temperature. The corresponding (non-equilibrium) characteristic time is defined by: Sample: PANO2 at 0.060mm ( ) gap thickness.
3.2. Influence of the Gap Thickness and the Nature of the Substrate on the (Stationary) Flow Behavior
 and
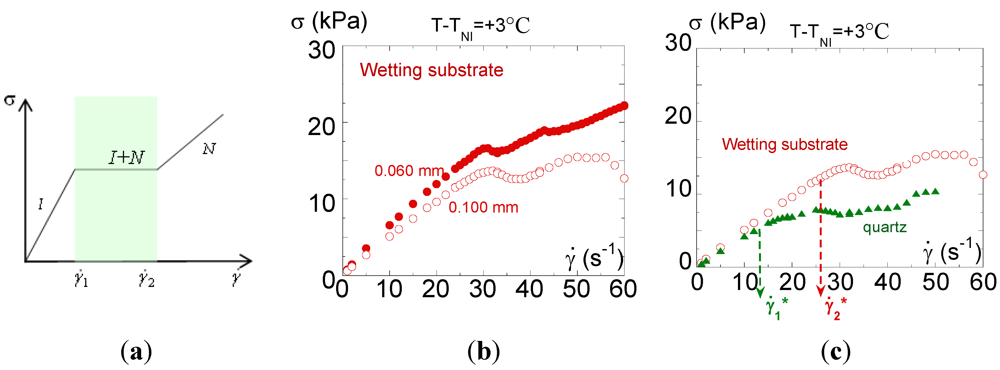
and  , to maintain the average imposed strain rate. Finally, at high shear rates, a new Newtonian branch should emerge corresponding to the induced nematic phase [10]. Concentrated systems of wormlike micelles [16,17,18,19,20,21,22,38,39] near a nematic transition are known to yield a non-monotonic flow curve of this form [10,16,17,18,19,20]; while more dilute systems exhibit a non-monotonic flow curve interpreted as an effect of flow on the reptation-reaction dynamics [40]. In this description, the stress plateau displayed upon applying an increasing shear rate is supposed to depend on the nature of the interface between the coexisting phases [10,12,13] but not on the nature of the substrate.
  ) e=0.060 mm ( ); (c) Steady-state measurements (flow curve): Evolution of the shear stress σversus shear rate measured at the same thickness (e = 0.100 mm) and the same temperature (at T – TNI = +3°C) on a quartz surface (
  : weak wetting) and a wetting surface ( : alumina) respectively (plate-plate geometry).
) e=0.060 mm ( ); (c) Steady-state measurements (flow curve): Evolution of the shear stress σversus shear rate measured at the same thickness (e = 0.100 mm) and the same temperature (at T – TNI = +3°C) on a quartz surface ( : weak wetting) and a wetting surface ( : alumina) respectively (plate-plate geometry).
: weak wetting) and a wetting surface ( : alumina) respectively (plate-plate geometry).
) e=0.060 mm ( ); (c) Steady-state measurements (flow curve): Evolution of the shear stress σversus shear rate measured at the same thickness (e = 0.100 mm) and the same temperature (at T – TNI = +3°C) on a quartz surface ( : weak wetting) and a wetting surface ( : alumina) respectively (plate-plate geometry). ) is constant. Both Figure 4(b) and Figure 4(c) display a non-Newtonian behavior indicating a coupling with the flow, i.e., the isotropic phase contains relaxation times of the order of the inverse of the shear rate (
  ). At low shear rates, the shear stress is nearly linear with the shear rate defining a quasi-Newtonian regime. At about 20–30 s−1, a second regime is identifiable by a slight overshoot followed by a lowering of the stress slope and even a stress plateau at 0.100 mm gap. The stress overshoot at about 20–30 s−1 seems to be coherent with the onset of the shear-induced birefringence (Figure 3(a)). The second regime seems to be coherent with the appearance of the shear-induced phase. A thickness dependence of the flow curve is clearly observable over 30 s−1, whereas the influence of the nature of the substrate (Figure 4(c)) is noticeable from the lowest shear rate (10 s−1). In the case of the quartz substrate (which provides a weak wetting), the shear stress is lower and the non-linear behavior appears earlier when a wetting substrate is used. The affinity of the liquid to the substrate is a necessary condition to transmit the shear motion (see [33] for a relationship between wetting and boundary conditions).
  The effective shear rate is:
  .
.
 , then
  . In this scheme, the sliding process is outlined by a no-zero velocity νs with respect to the walls (Figure 5 (a)). The sliding velocity, νs can be extracted from the values at the same shear stress of the shear rates measured at two different thicknesses following the relationship:
  < 5 s−1; see Figure 4(b,c)). The three distinct zones in Figure 5(b) can be interpreted as different sliding regimes and thus an interpretation of the flow curve (σversus ) (Figure 4(b,c)) in terms of instabilities.
3.3. Identification of a Finite Low Frequency Solid-Like Response
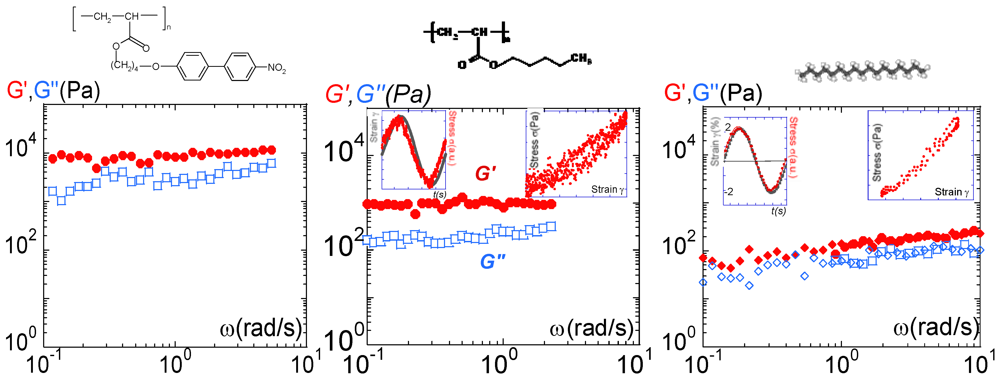
 10,000 Pa) which is about one order of magnitude higher than the viscous response (G′ > G″). The viscous component being negligible, the primary response of the isotropic phase is elastic, i.e., solid-like. Moreover, the quasi-constant shear elastic and viscous moduli versus frequency attest to a solid-like response. Under weak solicitation, the liquid does not flow but resists with significant elasticity. These elastic interactions cannot be related to reminiscent liquid crystal properties (no birefringence is detectable in the isotropic phase under weak strain solicitation). The isotropic phase is thus a fragile but long-range, elastically-correlated “self-assembly”. The action of the flow is a shear-melting. Above a threshold (defined by the elastic modulus), the “self-assembly” collapses and flows. Rheological and birefringence curves displayed in Figure 3 and Figure 4 reflect therefore what is happening after the collapse. At this state, the system is more or less shear-molten, depending on the shear rate. The timescales in the non-linear regime can hardly be related to any characteristic time. ) and the viscous (G″:
  ) moduli of PANO2 at 3°C above the NI transition, 0.050 mm gap thickness and 0.3% strain amplitude; (b) Frequency dependence of the elastic (G′: ) and the viscous (G″: ) moduli of PBuA at room temperature (Tg = −63°C), 0.020 mm gap thickness and 0.5% strain amplitude (from reference [29]). Two insets have been added to illustrate the quasi-superposition of the strain input wave (
  ) and of the torque output wave ( ), and the corresponding Lissajous cycle respectively; (c) Frequency dependence of the elastic (G′: : 0.5% strain,
  : 1% strain) and the viscous (G″: □: 0.5% strain, ◊: 1% strain) moduli of the heptadecane at 3°C above the crystallization (Tf = 21°C) temperature and 0.058 mm gap thickness. Two insets illustrate the quasi-superposition of the strain input wave ( ) and of the torque output wave ( ) and to display the corresponding Lissajous cycle.
) and the viscous (G″: ) moduli of PANO2 at 3°C above the NI transition, 0.050 mm gap thickness and 0.3% strain amplitude; (b) Frequency dependence of the elastic (G′: ) and the viscous (G″: ) moduli of PBuA at room temperature (Tg = −63°C), 0.020 mm gap thickness and 0.5% strain amplitude (from reference [29]). Two insets have been added to illustrate the quasi-superposition of the strain input wave ( ) and of the torque output wave ( ), and the corresponding Lissajous cycle respectively; (c) Frequency dependence of the elastic (G′: : 0.5% strain, : 1% strain) and the viscous (G″: □: 0.5% strain, ◊: 1% strain) moduli of the heptadecane at 3°C above the crystallization (Tf = 21°C) temperature and 0.058 mm gap thickness. Two insets illustrate the quasi-superposition of the strain input wave ( ) and of the torque output wave ( ) and to display the corresponding Lissajous cycle.
: 1% strain) and the viscous (G″: □: 0.5% strain, ◊: 1% strain) moduli of the heptadecane at 3°C above the crystallization (Tf = 21°C) temperature and 0.058 mm gap thickness. Two insets illustrate the quasi-superposition of the strain input wave ( ) and of the torque output wave ( ) and to display the corresponding Lissajous cycle.
) and the viscous (G″: ) moduli of PANO2 at 3°C above the NI transition, 0.050 mm gap thickness and 0.3% strain amplitude; (b) Frequency dependence of the elastic (G′: ) and the viscous (G″: ) moduli of PBuA at room temperature (Tg = −63°C), 0.020 mm gap thickness and 0.5% strain amplitude (from reference [29]). Two insets have been added to illustrate the quasi-superposition of the strain input wave ( ) and of the torque output wave ( ), and the corresponding Lissajous cycle respectively; (c) Frequency dependence of the elastic (G′: : 0.5% strain, : 1% strain) and the viscous (G″: □: 0.5% strain, ◊: 1% strain) moduli of the heptadecane at 3°C above the crystallization (Tf = 21°C) temperature and 0.058 mm gap thickness. Two insets illustrate the quasi-superposition of the strain input wave ( ) and of the torque output wave ( ) and to display the corresponding Lissajous cycle. 103 Pa whereas G′(PANO2) 104 Pa. Clearly, the liquid crystal moieties have an important cohesive role interplaying as connectors. The reinforcement is about 10 times stronger when the polyacrylate chain is substituted by nitrobiphenyl groups. This observation confirms the assumption that the elasticity of the isotropic phase originates from intermolecular interactions. These intermolecular interactions are reinforced by polar and/or polar-induced interactions when the molecules possess liquid crystal moieties. The intermolecular interactions of PBuA are essentially governed by weak van der Waals interactions. 80–100 Pa, i.e., 10 times smaller than the one of PBuA and about 100 times weaker than PANO2, we demonstrate that the solid-like property is a generic character inherent to the liquid state.
 4. Conclusions
Acknowledgments
References and Notes
- Mather, P.T.; Romo-Uribe, A.; Han, C.D.; Chang, S.S. Rheo-optical evidence of a flow-induced isotropic-nematic transition in a thermotropic liquid-crystalline polymer. Macromolecules 1997, 30, 7977–7989. [Google Scholar]
- Pujolle-Robic, C.; Noirez, L. Observation of shear-induced nematic-isotropic transition in side-chain liquid crystal polymers. Nature (London) 2001, 409, 167–171. [Google Scholar] [CrossRef]
- Noirez, L.; Keller, P.; Cotton, J.P. On the structure and the chain conformation of side-chain liquid-crystal polymers. Liq. Cryst. 1995, 18, 129–148. [Google Scholar]
- Pépy, G.; Noirez, L.; Keller, P.; Lambert, M.; Moussa, F.; Cotton, J.P.; Strazielle, C.; Lapp, A.; Hardouin, F.; Mauzac, M.; et al. Observation of the conformation and structure of some liquid-crystal polymers by small-angle neutron scattering. Makromol. Chem.-Macromol. Chem. Phys. 1990, 191, 1383–1392. [Google Scholar] [CrossRef]
- Noirez, L.; Pépy, G.; Benguigui, L. Smectic order and backbone anisotropy of a side chain liquid-crystalline polymer by small-angle neutron scattering. J. Phys. II 1991, 1, 821–830. [Google Scholar]
- Noirez, L.; Lapp, A. Shear flow induced transition from liquid-crystalline to polymer behavior in side-chain liquid crystal polymers. Phys. Rev. Lett. 1997, 78, 70–73. [Google Scholar] [CrossRef]
- Noirez, L. Shear induced smectic-A-smectic-C transition in side-chain liquid-crystalline polymers. Phys. Rev. Lett. 2000, 84, 2164–2167. [Google Scholar]
- Hess, S. Pre- and post-transitional behavior of the flow alignment and flow- induced phase transition in liquid crystals. Naturforsch. Z. 1976, 31a, 1507–1513. [Google Scholar]
- Hess, S.; Ilg, P. On the theory of the shear-induced isotropic-to-nematic phase transition of side chain liquid-crystalline polymers. Rheol. Acta 2005, 44, 465–477. [Google Scholar]
- Olmsted, P.D.; Goldbart, P. Theory of the nonequilibrium phase transition for nematic liquid crystals under shear flow. Phys. Rev. A 1990, 41, 4578–4581. [Google Scholar]
- Olmsted, P.D.; Goldbart, P. Isotropic-nematic transition in shear flow: State selection, coexistence, phase transitions, and critical behavior Phys. Rev. A 1992, 46, 4966–4993. [Google Scholar] [CrossRef]
- Olmsted, P.D.; David Lu, C.-Y. Coexistence and phase separation in sheared complex fluids Phys. Rev. E 1999, 60, 4397–4415. [Google Scholar]
- Cates, M.E.; Fielding, S.M. Rheology of giant micelles. Adv. Phys. 2006, 55, 799–879. [Google Scholar]
- Noirez, L. Origin of shear-induced phase transitions in melts of liquid-crystal polymers. Phys. Rev. E 2005, 72, 51701–51704. [Google Scholar]
- Mendil, H.; Baroni, P.; Grillo, I.; Noirez, L. The frozen state in the liquid phase of side-chain liquid-crystal polymers. Phys. Rev. Lett. 2006, 96, 077801–077804. [Google Scholar]
- Schmitt, V.; Lequeux, F.; Pousse, A.; Roux, D. Flow behavior and shear induced transition near an isotropic/nematic transition in equilibrium polymers. Langmuir 1994, 10, 955–961. [Google Scholar]
- Berret, J.F.; Roux, D.C.; Porte, G.; Linder, P. Shear-induced isotropic-to-nematic phase transition in equilibrium polymers. Europhys. Lett. 1994, 25, 521–526. [Google Scholar]
- Decruppe, J.P.; Cressely, R.; Makhloufi, R.; Cappelaere, E. Flow birefringence experiments showing a shear-banding structure in a CTAB solution. Colloid Polym. Sci. 1995, 273, 346–351. [Google Scholar]
- Cappelaere, E.; Cressely, R.; Decruppe, J.P. Linear and non-linear rheological behavior of salt-free aqueous CTAB solutions. Colloid Surf. A 1995, 104, 353–374. [Google Scholar]
- Cappelaere, E.; Berret, J.F.; Decruppe, J.P.; Cressely, R.; Lindner, P. Rheology, birefringence, and small-angle neutron scattering in a charged micellar system: Evidence of a shear-induced phase transition. Phys. Rev. E 1997, 56, 1869–1878. [Google Scholar] [CrossRef]
- Salmon, J.B.; Colin, A.; Manneville, S. Velocity profiles in shear-banding wormlike micelles. Phys. Rev. Lett. 2003, 90, 2283031–2283034. [Google Scholar]
- Lettinga, M.P.; Manneville, S. Competition between shear banding and wall slip in worm-like micelles. Phys. Rev. Lett. 2009, 103, 2483021–2283024. [Google Scholar]
- Fisher, E.; Callaghan, P.T. Is a birefringence band a shear band? Europhys. Lett. 2000, 50, 803809. [Google Scholar]
- Fisher, E.; Callaghan, P.T. Shear banding and the isotropic-to-nematic transition in wormlike micelles. Phys. Rev. E 2001, 64, 11501–11515. [Google Scholar]
- Feindel, K.; Callaghan, P.T. Anomalous shear banding: Multidimensional dynamics under fluctuating slip conditions. Rheol. Acta 2010, 49, 1003–1013. [Google Scholar]
- Finkelmann, H. Synthesis, Structure and Properties of Liquid Crystalline Side Chain Polymers. In Handbook of Liquid Crystals: High Molecular Weight Liquid Crystals; Dietrich, D., John, W.G., George, W.G., Hans, W.S., Volkmar, V., Eds.; Academic Press: Salt Lake, UT, USA, 2008; Part II, Chapter 3. [Google Scholar]
- Decobert, G.; Soyer, F.; Dubois, J.C. Chiral liquid crystalline side chain polymers. Polym. Bull. 1985, 14, 179–185. [Google Scholar]
- Baroni, P.; Mendil, H.; Noirez, L. Méthode de détermination des propriétés dynamiques d'un matériau fluide ou solide déformable. France Patent 05 10988, 27 November 2005. [Google Scholar]
- Mendil, H.; Baroni, P.; Noirez, L. Solid-like rheological response of non-entangled polymers in the molten state. Eur. Phys. J. E 2006, 19, 77–86. [Google Scholar]
- Noirez, L.; Baroni, P.; Mendil-Jakani, H. The missing parameter in rheology: Hidden solid-like correlations in viscous liquids, polymer melts and glass formers. Polym. Int. 2009, 58, 962–968. [Google Scholar]
- Noirez, L.; Baroni, P. Revealing the solid-like nature of glycerol at ambient temperature. J. Mol. Struct. 2010, 972, 16–21. [Google Scholar]
- Noirez, L.; Mendil-Jakani, H.; Baroni, P. Identification of finite shear-elasticity in the liquid state of molecular and polymeric glass-formers. Philos. Mag. 2011, 91, 1977–1986. [Google Scholar] [Green Version]
- The following equation (Tolstoi theory 1952) links the wetting property (determined via the contact angle θ method) to the slippage ability (via the slippage length b defined as the distance from the surface corresponding to the origin of the velocity gradient as shown): b~ exp(σ2.γ(1-cos θ)/kT)-1, θ=0 in the case of total wetting (σ is related to the molecule size and γ to the surface tension).
- de Gennes, P.G.; Prost, J. The Physics of Liquid Crystals; Oxford University Press: New York, NY, USA, 1974. [Google Scholar]
- Reys, V.; Dormoy, Y.; Gallani, J.L.; Martinoty, P.; Le Barny, P.; Dubois, J.C. Short-range-order effects in the isotropic phase of a side-chain polymeric liquid crystal. Phys. Rev. Lett. 1988, 61, 2340–2343. [Google Scholar]
- Pujolle-Robic, C.; Olmsted, P.D.; Noirez, L. Transient and stationary flow behavior of side chain liquid-crystalline polymers: Evidence of a shear-induced isotropic-to-nematic phase transition. Europhys. Lett. 2002, 59, 364–369. [Google Scholar]
- Pujolle-Robic, C.; Noirez, L. Identification of nonmonotonic behaviors and stick-slip transition in liquid crystal polymers. Phys. Rev. E 2003, 68, 0617061–0617065. [Google Scholar]
- Berret, J.F.; Roux, D.C.; Porte, G. Isotropic-to-nematic transition in wormlike micelles under shear. J. Phys. II 1994, 4, 1261–1279. [Google Scholar]
- Berret, J.F.; Porte, G. Metastable versus unstable transients at the onset of a shear-induced phase transition. Phys. Rev. E 1990, 60, 4268–4271. [Google Scholar] [CrossRef]
- Spenley, N.A.; Cates, M.E.; McLeish, T.C.B. Nonlinear rheology of wormlike micelles. Phys. Rev. Lett. 1993, 71, 939–942. [Google Scholar]
- Larson, R.G. The Structure and Rheology of Complex Fluids; Oxford University Press: New York, NY, USA, 1999. [Google Scholar]
- Brochard, F.; de Gennes, P.G. Shear-dependent slippage at a polymer/solid interface. Langmuir 1992, 8, 3033–3037. [Google Scholar]
- Jérome, B. Surface effects and anchoring in liquid crystals. Rep. Prog. Phys. 1991, 54, 391–451. [Google Scholar]
- Jérôme, B.; Commandeur, J.; de Jeu, W.H. Backbone effects on the anchoring of side-chain polymer liquid crystals. Liq. Cryst. 1997, 22, 685–692. [Google Scholar]
- Choate, E.P.; Cui, Z.; Forest, M.G. Effects of strong anchoring on the dynamic moduli of heterogeneous nematic polymers. Rheol. Acta 2008, 47, 223–236. [Google Scholar]
- Choate, E.P.; Forest, M.G. A classical problem revisited: Rheology of nematic polymer monodomains in small amplitude oscillatory shear Rheol. Acta 2006, 46, 83–94. [Google Scholar]
- Lakrout, H.; Creton, C.; Ahn, D.; Shull, K.R. Influence of molecular features on the tackiness of acrylic polymer melts. Macromoleculars 2001, 34, 7448–7458. [Google Scholar]
- Badmaev, B.B.; Bazaron, U.B.; Derjaguin, B.V.; Budaev, O.R. Measurement of the shear elasticity of polymethylsiloxane liquids. Phys. B 1983, 122, 241–246. [Google Scholar]
- Derjaguin, B.V.; Bazaron, U.B.; Zandanova, K.T.; Budaev, O.R. The complex shear modulus of polymeric and small-molecule liquids. Polymer 1989, 30, 97–103. [Google Scholar]
- Badmaev, B.B.; Dembelova, T.; Damdinov, B.; Makarova, D.; Budaev, O. Influence of surface wettability on the accuracy of measurement of fluids effective shear modulus. Colloids Surf. A Physicochem. Eng. Asp. 2011, 383, 90–94. [Google Scholar]
- Gallani, J.L.; Hilliou, L.; Martinoty, P.; Keller, P. Abnormal viscoelastic behavior of side-chain liquid-crystal polymers. Phys. Rev. Lett 1994, 72, 2109–2112. [Google Scholar]
- Martinoty, P.; Hilliou, L.; Mauzac, M.G.; Benguigui, L.; Collin, D. Side-chain liquid crystal polymers: Gel-like behavior below their gelation points. Macromoleculars 1999, 32, 1746–1752. [Google Scholar]
- Collin, D.; Martinoty, P. Dynamic macroscopic heterogeneities in a flexible linear polymer melt. Phys. A 2002, 320, 235–248. [Google Scholar]
- Clasen, C.; McKinley, G.H. Gap-dependent microrheoetry of complex liquids. J. Non-Newton. Fluid Mech. 2004, 124, 1–10. [Google Scholar] [CrossRef]
- Wang, S.-Q.; Ravindranath, S.; Wang, Y.; Boukany, P. New theoretical considerations in polymer rheology: Elastic breakdown of chain entanglement network. J. Chem. Phys. 2007, 127, 064903:1–064903:14. [Google Scholar]
- Chushkin, Y.; Caronna, C.; Madsen, A. Low-frequency elastic behavior of a supercooled liquid. EPL 2008. [Google Scholar]
- Granato, A.V. The shear modulus of liquids. J. Phys. IV 1996, 6, C8-1–C8-9. [Google Scholar]
- Granato, A.V. Mechanical properties of simple condensed matter. Mater. Sci. Eng. A 2009, 521, 6–11. [Google Scholar]
- Dyre, J.C. Solidity of viscous liquids. III. α relaxation. Phys. Rev. E 2005, 72, 011501:1–011501:7. [Google Scholar]
- Volino, F. Théorie visco-élastique non-extensive VI. Application à un liquide formant une phase vitreuse : L’orthoterphényl (OTP). Ann. Phys. 1997, 22, 181–231. [Google Scholar] [CrossRef]
- Ibar, J.P. Do we need a new theory in polymer physics? J.M.S.-Rev. Macromol. Chem. Phys. 1997, C37, 389–457. [Google Scholar]
- Guenza, M. Intermolecular effects in the center-of-mass dynamics of unentangled polymer fluids. Macromolecules 2002, 35, 2714–2722. [Google Scholar]
© 2012 by the authors; licensee MDPI, Basel, Switzerland. This article is an open-access article distributed under the terms and conditions of the Creative Commons Attribution license (http://creativecommons.org/licenses/by/3.0/).
Share and Cite
Noirez, L.; Mendil-Jakani, H.; Baroni, P.; Wendorff, J.H. Richness of Side-Chain Liquid-Crystal Polymers: From Isotropic Phase towards the Identification of Neglected Solid-Like Properties in Liquids. Polymers 2012, 4, 1109-1124. https://doi.org/10.3390/polym4021109
Noirez L, Mendil-Jakani H, Baroni P, Wendorff JH. Richness of Side-Chain Liquid-Crystal Polymers: From Isotropic Phase towards the Identification of Neglected Solid-Like Properties in Liquids. Polymers. 2012; 4(2):1109-1124. https://doi.org/10.3390/polym4021109
Chicago/Turabian StyleNoirez, Laurence, Hakima Mendil-Jakani, Patrick Baroni, and Joachim H. Wendorff. 2012. "Richness of Side-Chain Liquid-Crystal Polymers: From Isotropic Phase towards the Identification of Neglected Solid-Like Properties in Liquids" Polymers 4, no. 2: 1109-1124. https://doi.org/10.3390/polym4021109