Article

Voltage Effect in Holograms of Polyvinyl Alcohol with FeCl3

by
Arturo Olivares-Pérez
1,*,
Mary Paz Hernández-Garay
2,
Santa Toxqui-López
3,
Israel Fuentes-Tapia
1 and
Manuel Jorge Ordóez-Padilla
1
1
Optics Department, National Institute of Astrophysics, Optics and Electronics, Luis Enrique Erro No. 1, Z.P. 72840, Puebla, Mexico
2
Department of Optics, Faculty of Physics, Complutense University of Madrid, Madrid 28040, Spain
3
Engineering Faculty, Autonomous University of Puebla, University City, Puebla, Z.P. 72000, Puebla, Mexico
*
Author to whom correspondence should be addressed.
Polymers 2014, 6(3), 899-925; https://doi.org/10.3390/polym6030899
Submission received: 23 December 2013 / Revised: 24 February 2014 / Accepted: 6 March 2014 / Published: 21 March 2014

Abstract

:
We show experimentally that the metallic salt, FeCl3, at different concentrations, provides photosensitivity and conductivity characteristics with poly(vinyl alcohol) material. The holographic recording in this photosensitive material was made in real time. The effect of applied voltage on holographic diffraction gratings in the recording process and the changes in their diffraction efficiency, depending on their composition, are shown. In addition, we describe the photo-mechanism, physicochemical processes, and water condensations involved in changes of the formation of images due to applied voltage. The results suggest that polymers doped with metallic salts may have potential as inexpensive photosensitive materials that are easy to work under normal laboratory condition.

1. Introduction

Holographic materials research aims to create new materials with properties tailored to particular applications for various engineering and technological purposes. To date, polymeric materials, such as poly(methyl methacrylate), poly(vinyl alcohol) (PVA), and others, have been widely investigated for holographic applications [1,2,3].
Photopolymers possess good optical properties, good light sensitivity, a large dynamic range, flexibility, and low cost [4]. Among them, PVA-based films are of particular interest owing to the ease of fabrication of components; this polymer is important to industry because of its large-scale applications, for example, in biomaterials, biosensors, electrochemical sensors, membranes with selective permittivity, viscous media for controlling the crystallization process of salts, and because it is non-toxic, non-carcinogenic, biodegradable, biocompatible, water-soluble, and inexpensive [5].
The PVA material used here is polymer (organic material) doped by metallic salts [6]; inorganic additives, such as transition metal salts, considerably affect the structural, optical, and electrical properties of the polymer [6,7]. PVA is a synthetic biocompatible polymer; it has a large number of hydroxyl groups that can react with many types of functional groups, thus, it has very important applications that exploit the OH group and hydrogen bonds [8]. There are a large number of studies regarding the variety of polymer–metal systems with the aim of understand the nature and characterizing the obtained [9]. Doping of iron oxides into PVA can provide interesting phenomena involving the structure and properties of holographic register samples (diffraction gratings) [10].
Other studies have been performed with nanoparticles in organic polymers with different salts, liquid crystal, zeolite, and nanocomposites [11,12,13,14], and other work with nanoparticles, applying an electric field [15,16,17], with interesting results, different to the work described in this manuscript.
One of the first works on amplitude-phase hologram recording on PVA films doped with Iron (III) chloride (FeCl3-PVA films) was reported by Budkevich et al. [18]. They used FeCl3-PVA films to determine the contributions of the amplitude and phase components to the diffraction efficiency. They used low-temperature photolysis, in which the individual stages could be observed. Manivannan et al. [19] used PVA doped with iron (III) chloride as a real-time holographic recording medium for the first time. Their study emphasized that the reported polymeric materials doped with Cr (VI) and Fe (III) were suitable as potential candidates for real-time holographic recording, involving no thermal or chemical treatment. Bulinski et al. [20] used inorganic salts in the form of chlorides of mixed-valence metal ions (FeCl3) to dope a PVA solution. They analyzed the changes in its optical properties under UV exposure and the presence of hetero-doping elements, such as Fe pairs, with multiple valence states of the individual ions.
To our knowledge, little is available in the literature regarding the analysis of PVA doped with metal salts for possible use as a holographic and conductive material [21,22]. This manuscript presents an investigation of the optical and electrical properties of FeCl3-PVA samples with varied concentrations of FeCl3.
This manuscript is not intended to show a highly competitive material for forming display holograms, such as dichromated gelatin or some commercial films, such as (Slavich®, Pereslavl-Zalessky, Russia). Although the mixture of PVA: FeCl3 is a material that has been reported in other studies. This material is well known by its limitation as of the large amount of energy required to obtain good diffraction gratings. The intention of this manuscript is to show interesting results and update the published information, as is known in these materials, 12 J/cm2 of energy is the optimal energy to produce a diffraction grating with a diffraction efficiency >34% [19]. However, some studies show a symmetrical distribution between energy vs. efficiency, which is not entirely correct. In this manuscript, we show experimental results that do not follow this symmetry for all cases and concentrations with which we work. This manuscript reports interesting original results on the behavior of polymer holographic diffraction gratings when a voltage is applied.
The manuscript is organized as follows: in Section 2, we describe the sample preparation and report the chemical characteristics of solutions with different concentrations of FeCl3. We also present the holographic recording method and the optical setup used to make the diffraction gratings. In Section 3, we describe our experimental results; we explore the diffraction efficiency with respect to the chemical and physical characteristics of the samples, and the exposure energy and spatial frequency of the gratings. We analyzed the conductive characteristics of the sample, as well as the changes in the diffraction efficiency when we applied a voltage to the holographic recording plane. We discuss the optical and electrical effects of the dopant concentration. Concluding remarks are presented in Section 4.

2. Experimental Section

2.1. Preparation of Aqueous Solutions

The components of the photopolymer films are PVA and iron (III) chloride (see Table 1). First, the polymeric matrix was prepared in aqueous solution; this solution is called solution S1 (PVA + H2O), and the PVA content is 7% with respect to the H2O volume. Aqueous solution S2 (FeCl3 + H2O) was formed using 10% FeCl3 (powder) with respect to the H2O volume. Solutions S1 and S2 are base solutions in terms of the weight-weight percentage (% w/w).
Table 1. Components of photopolymer material.
ComponentChemical formulaPurity (%)Molecular weight (g/mol)Solution weight (%)
Poly(vinyl alcohol)(C2H4O) x95.030,0007
Iron (III) chlorideFeCl398.0126.7510
Normal laboratory environmental conditions of 19 to 22 °C and relative humidity of 30%–35% were used. The samples (films) were prepared (identified as A to F) with the concentrations shown in Table 2.
Iron (III) ions have an affinity with water and form strong chemical bonds (metal-oxygen). The properties of these depend of different chemical bonds around them in aqueous solutions [23]. If the bond group is very polar, it has a high bonding force with the ion. The complexes with water are more stable than other groups with neutral chemical bonds. Water is an excellent solvent for salts as it forms stable complexes with the metallic ions [23]. The bonding force that characterizes a molecule is a stability measure of complex that the molecule forms with H+. Groups with strong chemical bonding capacity around H will be able to form stable complexes with metallic ions [24].
The pH parameter was influenced by the FeCl3 concentration [23,25]. The pH change affected the characteristics of samples. If the FeCl3 concentration of the aqueous solutions is high, the electron transfer will be high and strong oxidation will occur around the sample. The pH of the aqueous solutions, was measured with a pH-meter (Conductronics ph15®, Puebla, Mexico). In Table 2, we can see the pH values at different concentrations of the photosensitive agent.
Table 2. Solution S1 and S2, are the base solutions. The second and third columns show pH and refraction index of different PVA + FeCl3 concentration.
ID (S1%:S2%)pH (a.u.)Refractive index (a.u.)
A = (10:1)2.641.494
 B = (10:1.5)2.471.504
C = (10:2)2.331.520
 D = (10:2.5)2.251.530
E = (10:3)2.231.540
F = (10:5)2.161.545
S1: PVA + H2O; S2: FeCl3 + H2O. Percentages are % w/w.

2.2. Preparation of Samples

Glass (Lauka®) was used as the substrate in this experiment. To obtain an appropriate volume of material (thickness) it is necessary to deposit, on a glass substrate, the aqueous solution of PVA-FeCl3.
A gravity method was adopted to dry the coating, thus, it was necessary to protect the photosensitive emulsion plate from falling dust particles during the sample drying time. The total thickness of each sample was 44 ± 1 µm. however in Section 3.3 experimental results of holographic recording at different thicknesses of samples are shown (the most representative thicknesses). The refraction index of the samples varies with the FeCl3 concentration, thus, the molecular weight is related to the refractive index, as we can see in Table 2.
Samples with PVA-FeCl3 ratios greater than 10:5 have crystallization due to the high salt concentration. Some dark zones may appear in the sample, which mean a reduction in optical transmittance [5]. This crystallization generates opacity and scattering in the sample surface, making holographic recording difficult. A necessary condition for holographic recording is that the samples be translucent; this characteristic facilitates the recording and reconstruction of gratings. On the other hand, the concentration of the photosensitive agent determines the photosensitivity of samples [26]. Thus, the absorbance profiles of the samples differ, as shown in Figure 1 (we show the profiles for samples A, C, E, and F as the most representative). All the graphs exhibit the same behavior, indicating that the materials prepared and deposited on the glass substrates are uniform and homogenous.
The absorbance of the samples on the glass substrate was measured with an UV-visible spectrometer (Perkin Elmer Lambda 3B®, Waltham, MA, USA). Although the samples have a small absorbance in the visible zone, they have high absorbance over the UV range. This opens the possibility of using the samples for applications in this range [4].
Figure 1. Absorbance profiles for different concentrations of poly(vinyl alcohol) (PVA) + FeCl3 (samples A, C, E, and F).
Polymers 06 00899 g001

2.3. Holographic Recording

The optical setup for holographic recording is shown in Figure 2, which shows the optical components used to generate an interference zone. A 445 nm diode (Lasever Inc.®, Ningbo, China) was used for recording holographic gratings with an output power of up to 300 mW. The beam incident on the holographic material is linearly polarized (Polarization S); we ensure the polarization using a linear polarizer after the laser output. The main beam is split into two arms (A and B) using a beam splitter; both arms are linearly polarized and also have geometric symmetry, forming an isosceles triangle between mirrors M1 and M2 (the angle formed is θ), and the interference zone. The two beams impinge at a point (interference zone) where they form an interference pattern. The power of light at this point is around 53.0 × 10⁻³ W/cm2 in the recording area.
Figure 2. Experimental setup for recording holographic gratings. CBS: cube beam splitter.
Polymers 06 00899 g002
We use this symmetry varying the distance Z, thus, the modulation of transfer function was obtained, and the results can be seen in Figure 6. These graphs represent the results of thirteen measurements. The size of the interference zone can be changed if we place a collimator before the prism system. We can obtain an interference zone 5 mm diameter; its size also varies with the angle between the array arms and the interference zone, due to astigmatic effect of M1 and M2. Diffraction gratings with high quality can be obtained by increasing the stability of the interference pattern, for reducing noise. Using active control technique, and technique of null detection with piezoelectric mirrors [27,28].

2.4. Volume Resistivity by Four-Point Technique

A feature of each sample is its conductivity when a DC voltage is applied through electrodes. Thus, two major methods are available for measuring the volume resistivity: (a) bridge measurements of the resistance and (b) a four-point technique, in which the potential drop is measured between a pair of electrodes in a constant current established by a second pair of electrodes. The second technique is widely used in mobility measurements on metals and semiconductors, but has been little used for salts [6]. The four-point volume resistivity test with an applied voltage was used for sample C (which is the most stable) according to standards ASTM D4496 [29]; the results depended on the sample geometry and the electrodes. We applied a DC voltage of 10, 20, or 30 V directly to electrodes 2 and 3, at the same time, the volume resistivity was measured using a digital multimeter (Tektronix TX3®, Beaverton, OR, USA) connected to electrodes 1 and 4. The experimental model for measuring the resistivity and obtaining the volume resistivity of the samples is shown in Figure 3, and the volume resistivity was obtained using the expression:
Polymers 06 00899 i001
Here: VR = Volume resistivity (ohm.mm); V = Electrical potential difference between electrodes (V ± 0.1 V); A = Sample area perpendicular to the flow of current (mm2), defined as:
A = W × t
W = Sample width (mm ± 0.5mm); t = Sample thickness (µm ± 1 µm); I = Current across the sample (amp ± 0.1 amp); d = Distance between the electrodes where the voltage is measured (mm ± 0.5 mm).
Figure 3. Physical model for measuring the resistivity and volume resistivity of the sample.
Polymers 06 00899 g003
The results obtained with this arrangement are shown in Figure 9 and show the volume resistivity measured in real time under applied voltages of 10, 20, and 30 V.

2.5. Electrodes Arrangement of Copper (+) and Ferrite (−) for Holographic Grating Recording

The samples (C and F) are placed at interference area of the experimental setup as shown in Figure 2. There is a distance between electrodes of 5 mm, which apply a voltage of 30 V DC. The electrodes with a better performance were copper (+) and ferrite (−), however, Section 5 describes the influence of the electrodes due to their polarity, which can be seen in the experimental results.
The interference pattern makes contact with the electrodes perpendicularly. That is the interference pattern that is in contact with both electrodes, see Figure 4.
Figure 4. Scheme of experimental design for electrodes connection with the material where the interference pattern is formed due to holographic recording.
Polymers 06 00899 g004
The recording process is continuously in the exposure time (minutes) during a voltage of 30 V is applied. As a necessary condition, the samples must have some moisture so that the process of ion transportation can be carried out and, in addition, to observe the changes in diffraction efficiency. The diffraction efficiency of gratings was measured in real time. When the sample is completely dried the process of ion transportation is not carried out, and unsatisfactory results are obtained. That is, the diffraction grating is not recorded.

3. Results and Discussion

3.1. Experimental Results

Holographic Recording vs. FeCl3 Concentration

The holographic recording was made using a diode laser (Lasever Inc.®) selecting the time of exposure used in the recording. The intensity was measured with a radiometer (International Light, Model IL 1700®, Chicago, IL, USA).
Each sample was placed at the interference point between the incident beams. The power of incident beam was 53.0 × 10⁻³ ± 1 × 10⁻⁴ W/cm2 at λ = 445 nm in the recording area. The exposure time was changed of each sample to vary the exposure energy (J/cm2). All the holograms were recorded with an angle θ of 5.8° between the beams A and B (Figure 2), this correspond to a frequency of 454 lines/mm with 445 nm, as it generates the maximum diffracted intensity. The diffraction efficiency expresses the intensity of the diffracted light with respect to the incident beam [30]. We used a He-Ne laser (632 nm) as a probe beam to reconstruct the holographic gratings, with an incident intensity on the grating of Ii = 40.0 × 10⁻³ ± 1 × 10⁻⁴ W/cm2. This is generally determined by the ratio of the power intensity at the first-order (the sum of both orders, ±1) of the diffracted light beam I±1 to the incident power of the beam Ii at normal incidence, given by:
Polymers 06 00899 i002
The intensity I±1 can be compensated for the reflection losses at both surfaces of the glass substrate. In all cases, only a single diffracted order was observed. The behavior of each sample (made with A-F concentration) was observed while the exposure times were changing in recording the holographic gratings.
The best results were obtained for sample C (with a PVA:FeCl3 ratio of 10:2) at an exposure time of 30 to 1800 s). The maximum first-order diffracted intensity was I±1 = 10.4 × 10⁻³ W/cm2, which corresponds to a diffraction efficiency of η = 26%.
The sample C is similar to the sample F (with a PVA:FeCl3 ratio of 10:5), with respect to exposure time. However, the diffraction intensity from sample F was I±1 = 1.2 × 10⁻³ W/cm2, which corresponds to diffraction efficiency of η = 3%, at the same spatial frequency.
The Figure 5 shows the maximum diffraction efficiency of each sample. These results suggest the concentration that will produce a holographic grating with diffraction efficiency >26% (results for sample C).
Figure 5. Diffraction intensity versus energy for samples C (PVA:FeCl3 ratio of 10:2) and F (PVA:FeCl3 ratio of 10:5).
Polymers 06 00899 g005
The diffraction efficiency of sample C was >26% ± 0.5%, which is equivalent to 15 ± 1 × 10⁻³ J/cm2 of exposure energy approximately, on the other hand, the diffraction efficiency was <5% ± 0.5% for sample F. The results obtained in this section show that there is an optimum exposure energy for holographic grating recording. This is of 12.72 ± 1 × 10⁻³ J/cm2 , which is equivalent to 240 s.

3.2. Spatial Frequency

Dependence of the diffraction efficiency on the angle between the writing beams was obtained. The distance of the photosensitive sample from the mirrors that send the light beams to the holographic point area was varied. Thus, we can change all the beam angles between the two arms of the set up (Figure 2). In this manner, we obtained the spatial frequency for C and F (see Figure 6). Each sample was at 12.72 J/cm2 using a diode laser (λ = 445nm). The spatial frequency was calculated with the Bragg Equation [31].
Figure 6. Diffraction efficiency for samples C and F with different spatial frequency.
Polymers 06 00899 g006
The diffraction efficiency versus the spatial frequency of sample C is shown in Figure 6. When the diffraction grating has a low spatial frequency, the diffraction efficiency is high. It is around 26% at the first order, with a spatial frequency of 454 lines/mm, and exhibited decay with increasing spatial frequency, with a spatial frequency of 1132 lines/mm the diffraction efficiency is around 4.6%. With sample F, with low spatial frequencies, the diffraction efficiency is the order of 3% at the first order, with a high spatial frequency the diffraction efficiency is around 0.4%. The diffraction efficiency of holographic gratings on this photopolymer material is better at a low spatial frequency as shown by the curves in Figure 6; this is due to the natural response of the spatial modulation of the material, as with in many photosensitive materials [2]. The diffraction efficiency curves depend only on the nature of the material, in Section 3.6.1 a physicochemical reaction diagram is described, a possible mechanism that explains how the image is recorded in the material. The physical phenomenon involved in this process would be that the grooves, of the gratings at low frequency, are formed with more energy per area than high-frequency grooves. This energy stimulates the photo crosslinking and the condensation of water droplets between the grooves of the grating (see Figure 18b. The data was used to generate Figure 6, with errors of the order of 0.5% in the diffraction efficiency and ± 2.5 lines/mm in the spatial frequency. These error values are not displayed in Figure 6, due to the scales of this plotting.

3.3. Holographic Recording at Different Thicknesses

The thickness of the film is crucial to the performance of the diffraction gratings. As mentioned in Section 2.2 (preparation of samples), samples with PVA-FeCl3 ratios greater than 10:5 have crystallization due to the high salt concentration. This crystallization generates opacity and scattering in the sample surface, making holographic recording difficult for sample C, with prepared samples of thicknesses at 44 μm, and C2 with 88 μm. The diffraction efficiency was dramatically reduced (by a factor of three) when the thickness was increased by a factor of two. This material became more opaque with increasing thickness, and exposure to light, which reduces the diffraction efficiency of gratings made with this material, see Figure 7.
Figure 7. Diffraction efficiency for samples C, C2, and F with different thickness.
Polymers 06 00899 g007
In addition, for sample F the diffraction efficiency at a thickness of 52 μm was eight times smaller than the sample C at a thickness of 44 μm. We did not obtain satisfactory results when we increased the thickness of this material, thus, the diffraction efficiency was <3%. Furthermore, we note that the opacity of the material was higher than that of sample C. Thus, it is not feasible to increase the F thickness sample by opacity and crystallization, clarifying that the opacity of the material occurs mainly when exposed to laser to form the grating. The F sample thickness of 52 µm corresponds to one milliliter of material prepared on an area of 25 cm2. Due to the concentration, that is different from the sample C, the physical thickness is different, as shown in Table 3.
Table 3. Liquid solutions poured into a 25 cm2 area to determine the thickness, at 25 °C and a relative humidity of 33%.
ConcentrationAmounts poured into 25 cm2 area (mL ± 0.1mL)Thickness (µm ± 1 µm)Exposure time (min ± 1 s)Maximum efficiency of first order (% ± 0.5%)
10:2 (Sample C)144426
10:2 (Sample C2)28848.6
10:5 (Sample F)15243
10:5 (Sample F2)21034

3.4. Conductive Characteristics of the Samples

Thus, far we have determined the diffraction efficiency of the photosensitive material with respect to the FeCl3 concentration in the samples. This section focuses mainly on the structural, electrical, and holographic properties of PVA samples doped FeCl3. First, the impedance of samples C and F with respect to the electrode gap was obtained, and consequently measures its conductivity.
Subsequently, the volume resistivity of samples, with respect to voltage applied in the real time, was obtained. Finally, we analyze the effects of applied voltage in the holographic grating, specifically, diffraction efficiency based on exposure energy.

3.4.1. Impedance and Conductivity Measurements of Photosensitive Material

The impedance of samples C and F, using a digital multimeter (Tektronix TX3®, Beaverton, OR, USA), was measured. The impedance measurements (Ω ± 1) were made for both samples, C and F, of 44 ± 1 μm thick in normal environmental conditions. Figure 8 shows the measured impedance with respect to the electrode gap length (±0.5 mm). The experimental results show that the conduction of electricity in samples F is relatively high, around of kilo-ohms, thus, the material has the conductivity properties. This suggests the possibility of doping PVA with other dopant agents to obtain more efficient photosensitive samples.
Figure 8. Impedance versus electrode separation on the surface of samples C and F.
Polymers 06 00899 g008
The impedance of the samples can be represented by a polynomial fit y = 2.612 + 0.432x for sample C and y = 3.675 + 0.062x for sample F, where y corresponds to impedance and x is the electrode gap (mm) used for each concentration. As expected, the impedance is higher for sample C than for sample F; thus, the conductivity is higher for the latter, due to the large number of hydroxyl groups that can react with the functional groups of FeCl3. The importance of Figure 8 is to determine the optimal distance from the electrodes to obtain the voltage measurement respect to diffraction efficiency as shown in Figure 10, Figure 11, Figure 12, Figure 14, Figure 15, Figure 16 and Figure 17, the optimal distance corresponds to the minimum impedance, as in our particular experiment, the separation between copper and ferrite electrodes is 5 mm.

3.4.2. Volume Resistivity by Four-Point Technique

DC voltage of 10 ± 0.1 V, 20 ± 0.1 V, or 30 ± 0.1 V was applied directly to electrodes 2 and 3; at the same time, the volume resistivity was measured using a digital multimeter (Tektronix TX3®) connected to electrodes 1 and 4. The experimental model for measuring the resistivity and the volume resistivity of samples can be seen in Figure 3, on the other hand, the results with this arrangement are shown in Figure 9.
Figure 9. (a) Volume resistivity and (b) polynomial fit of volume resistivity of sample C in real time under applied voltages of 10, 20, and 30 V.
Polymers 06 00899 g009
The fit made to the points shown in Figure 9a, and expressed in Figure 9b, allows us a better visualization of the behavior and distribution of data. The volumetric resistivity increases rapidly after 20 s applying 10 V so the values began to decline. On the other hand, the volumetric resistivity has an almost linear behavior up to 360 s, when 20 V is applied. The volumetric resistivity to 30 V, shows the volumetric resistivity maximum values obtained in the INAOE (Institute National of Astrophysics Optical y Electronic) laboratory, with a maximum between 250 and 400 s. There is a discontinuity at 100 s in Figure 9a which is not shown in Figure 9b. This discontinuity is important because there is a maximum carrying ionic load between the copper and ferrite electrodes into the sample when 30 V is applied. Is important emphasize that the maximum volumetric resistivity coincides with maximum diffraction efficiencies in the same time period, see Figure 10, Figure 11, Figure 12, Figure 14, Figure 15, Figure 16 and Figure 17.

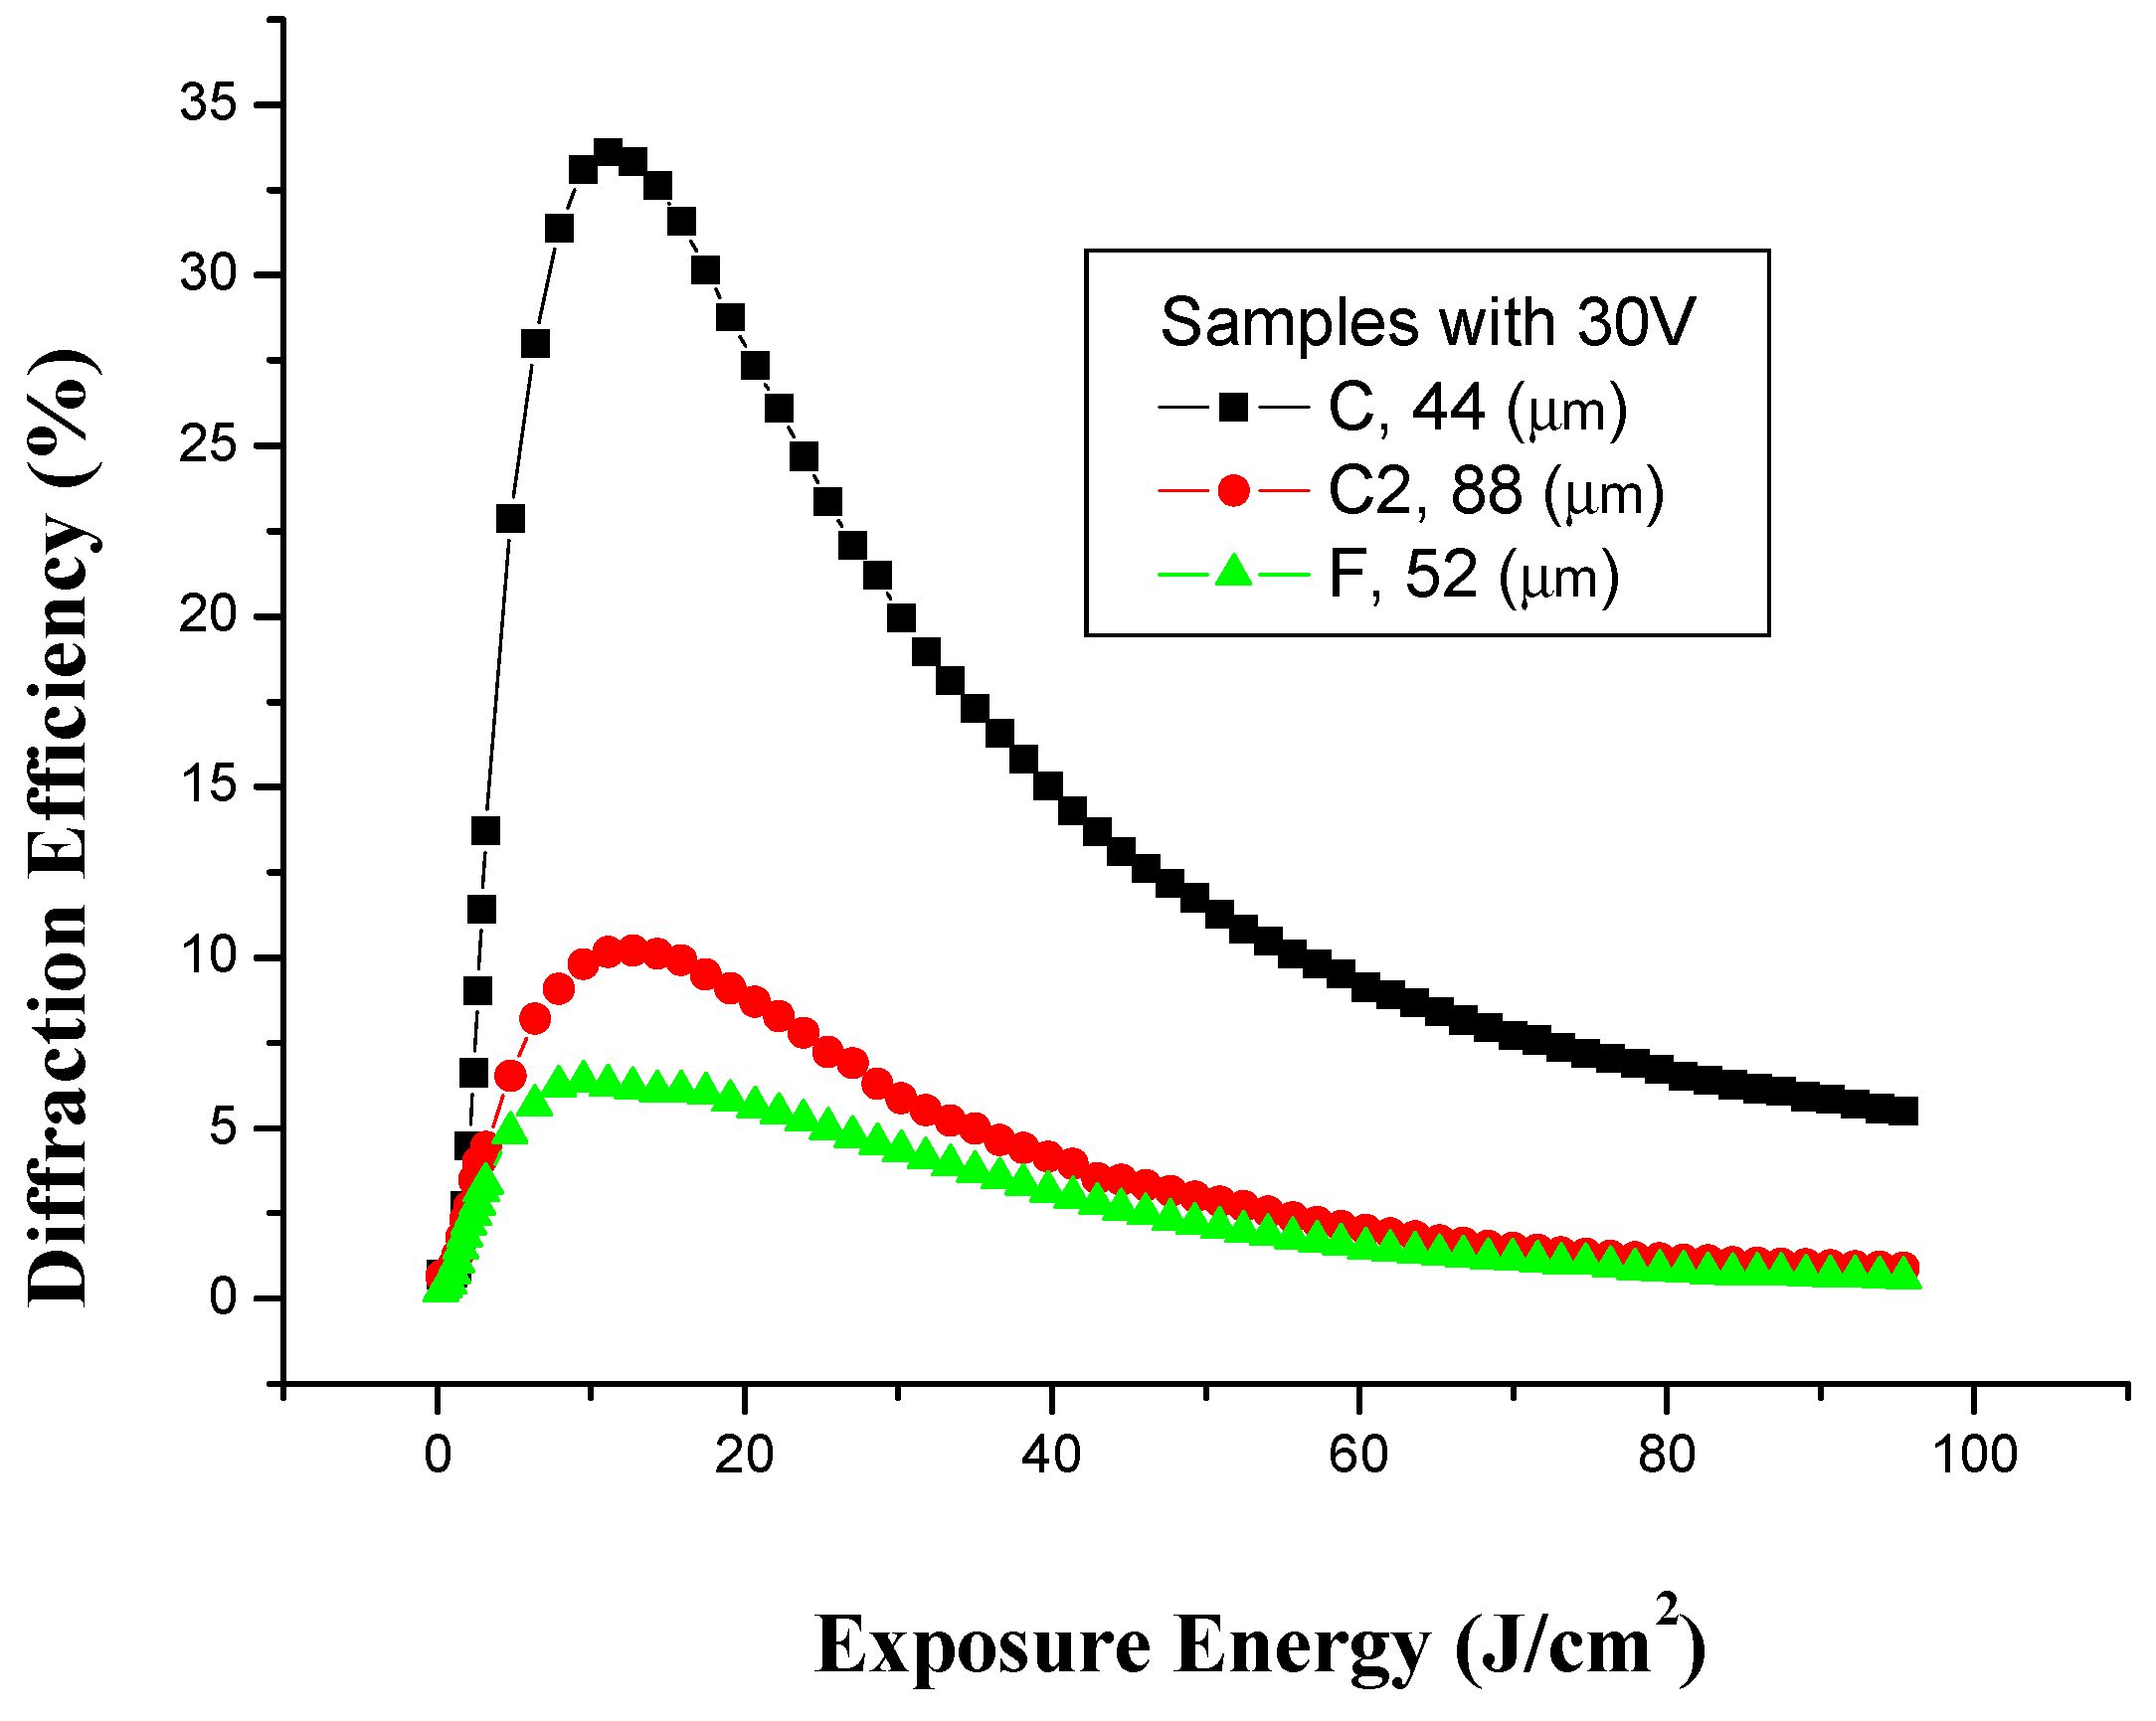
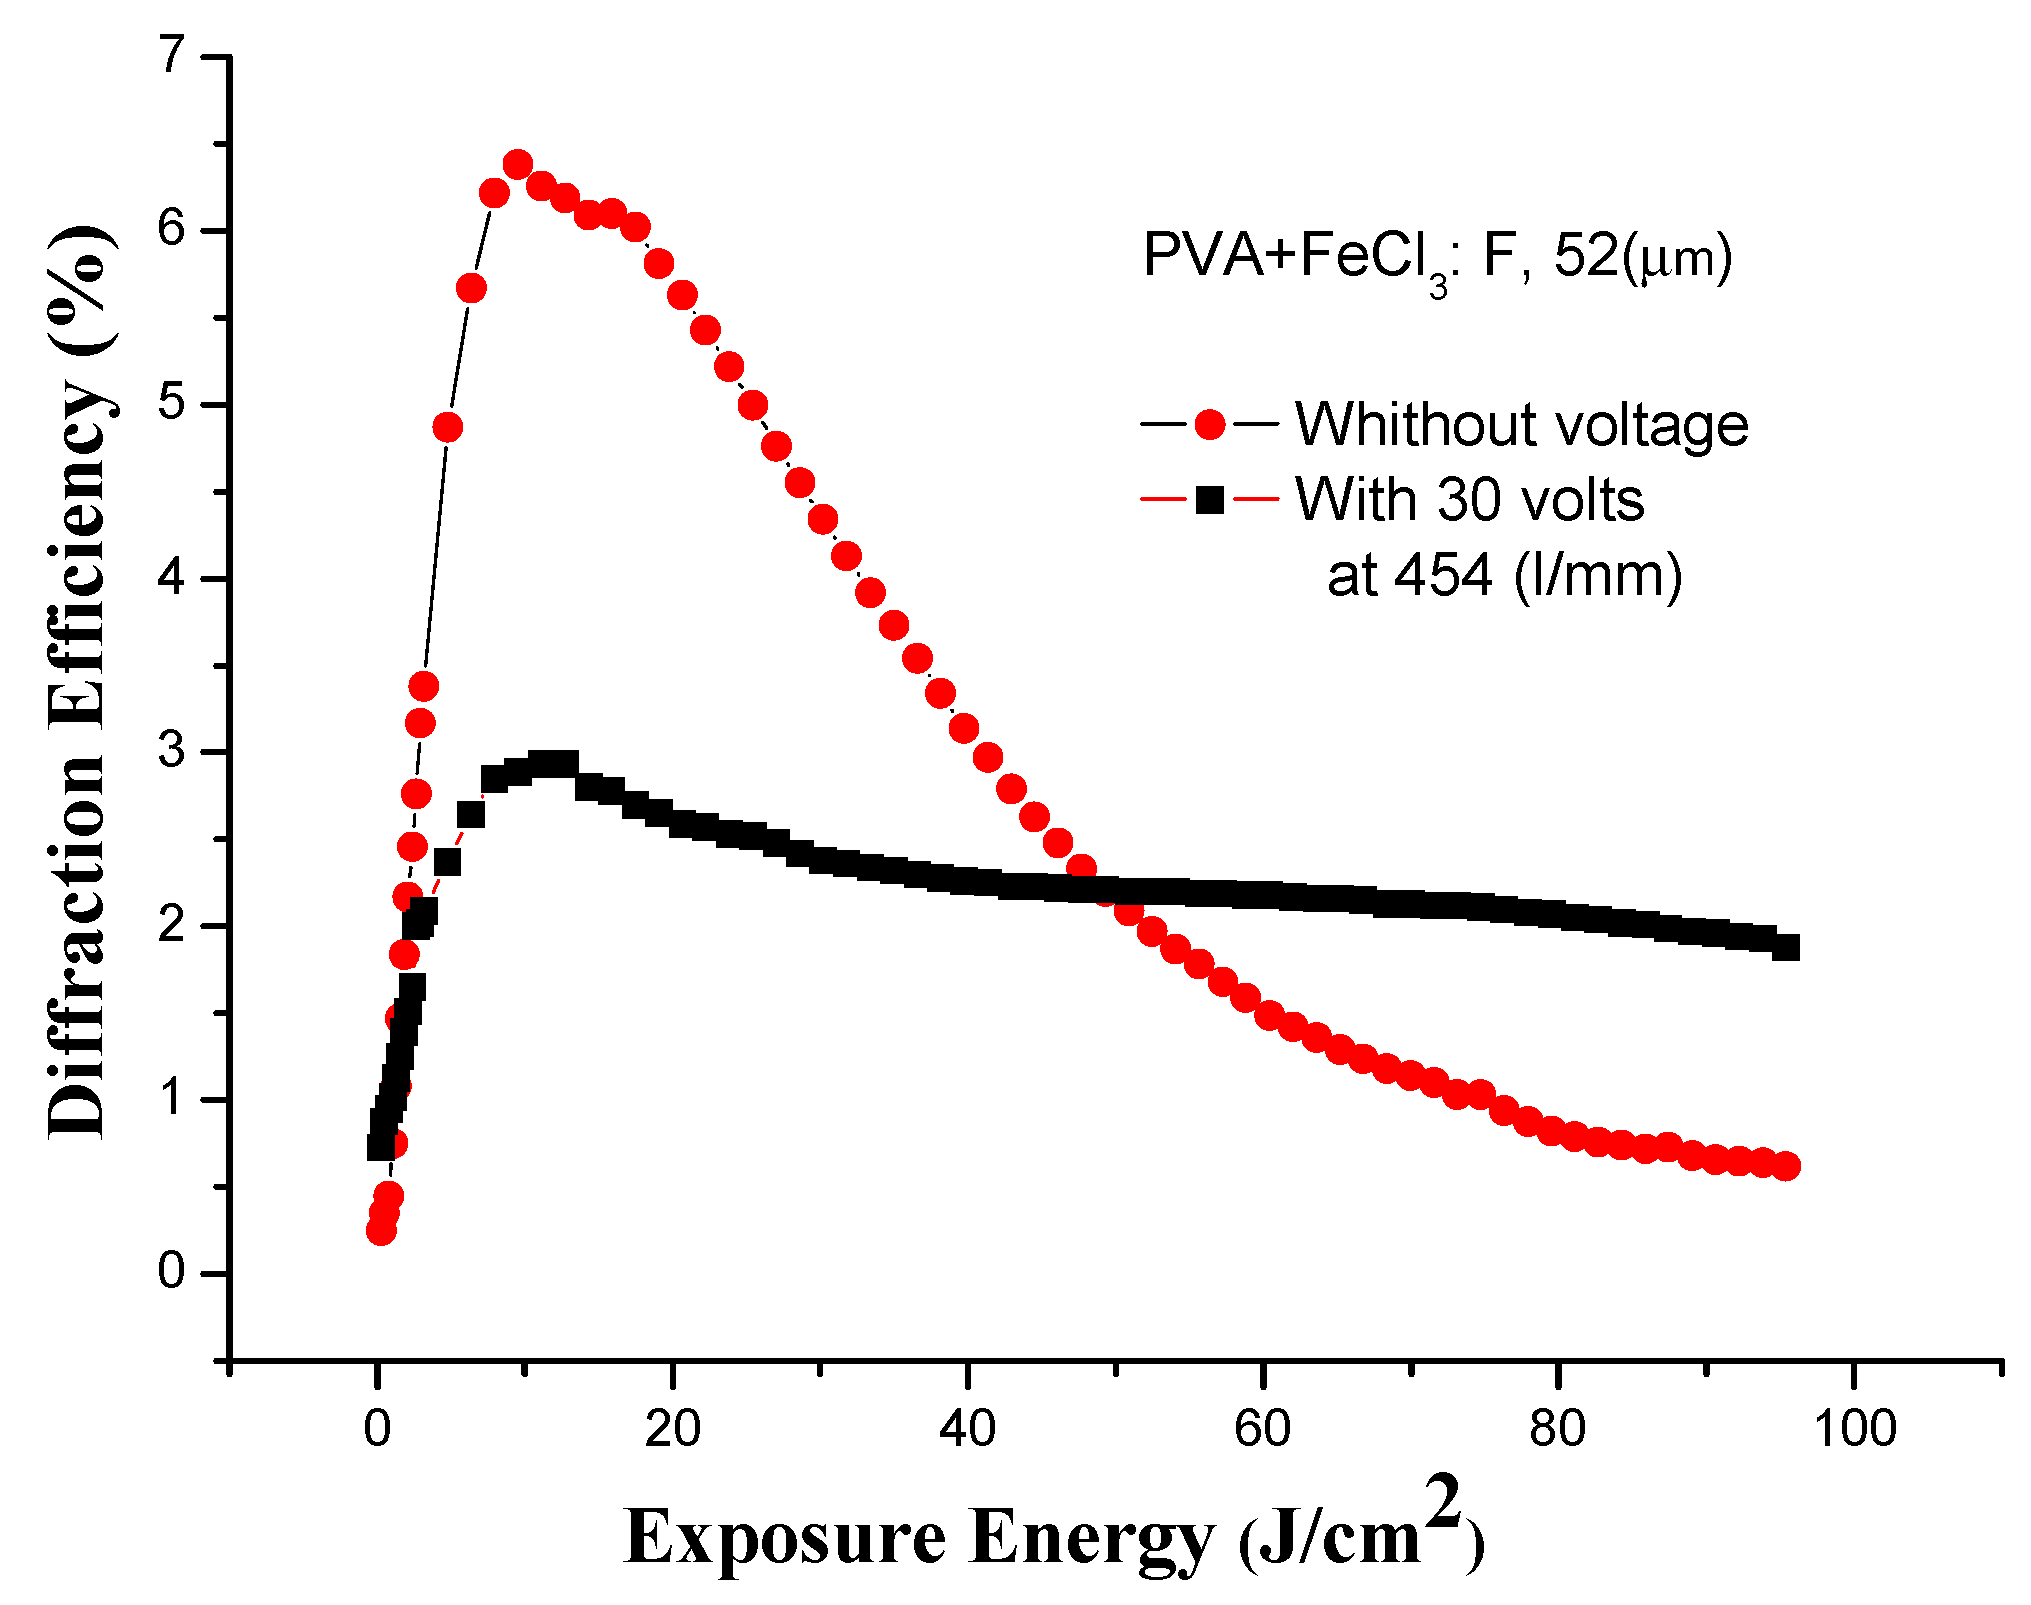
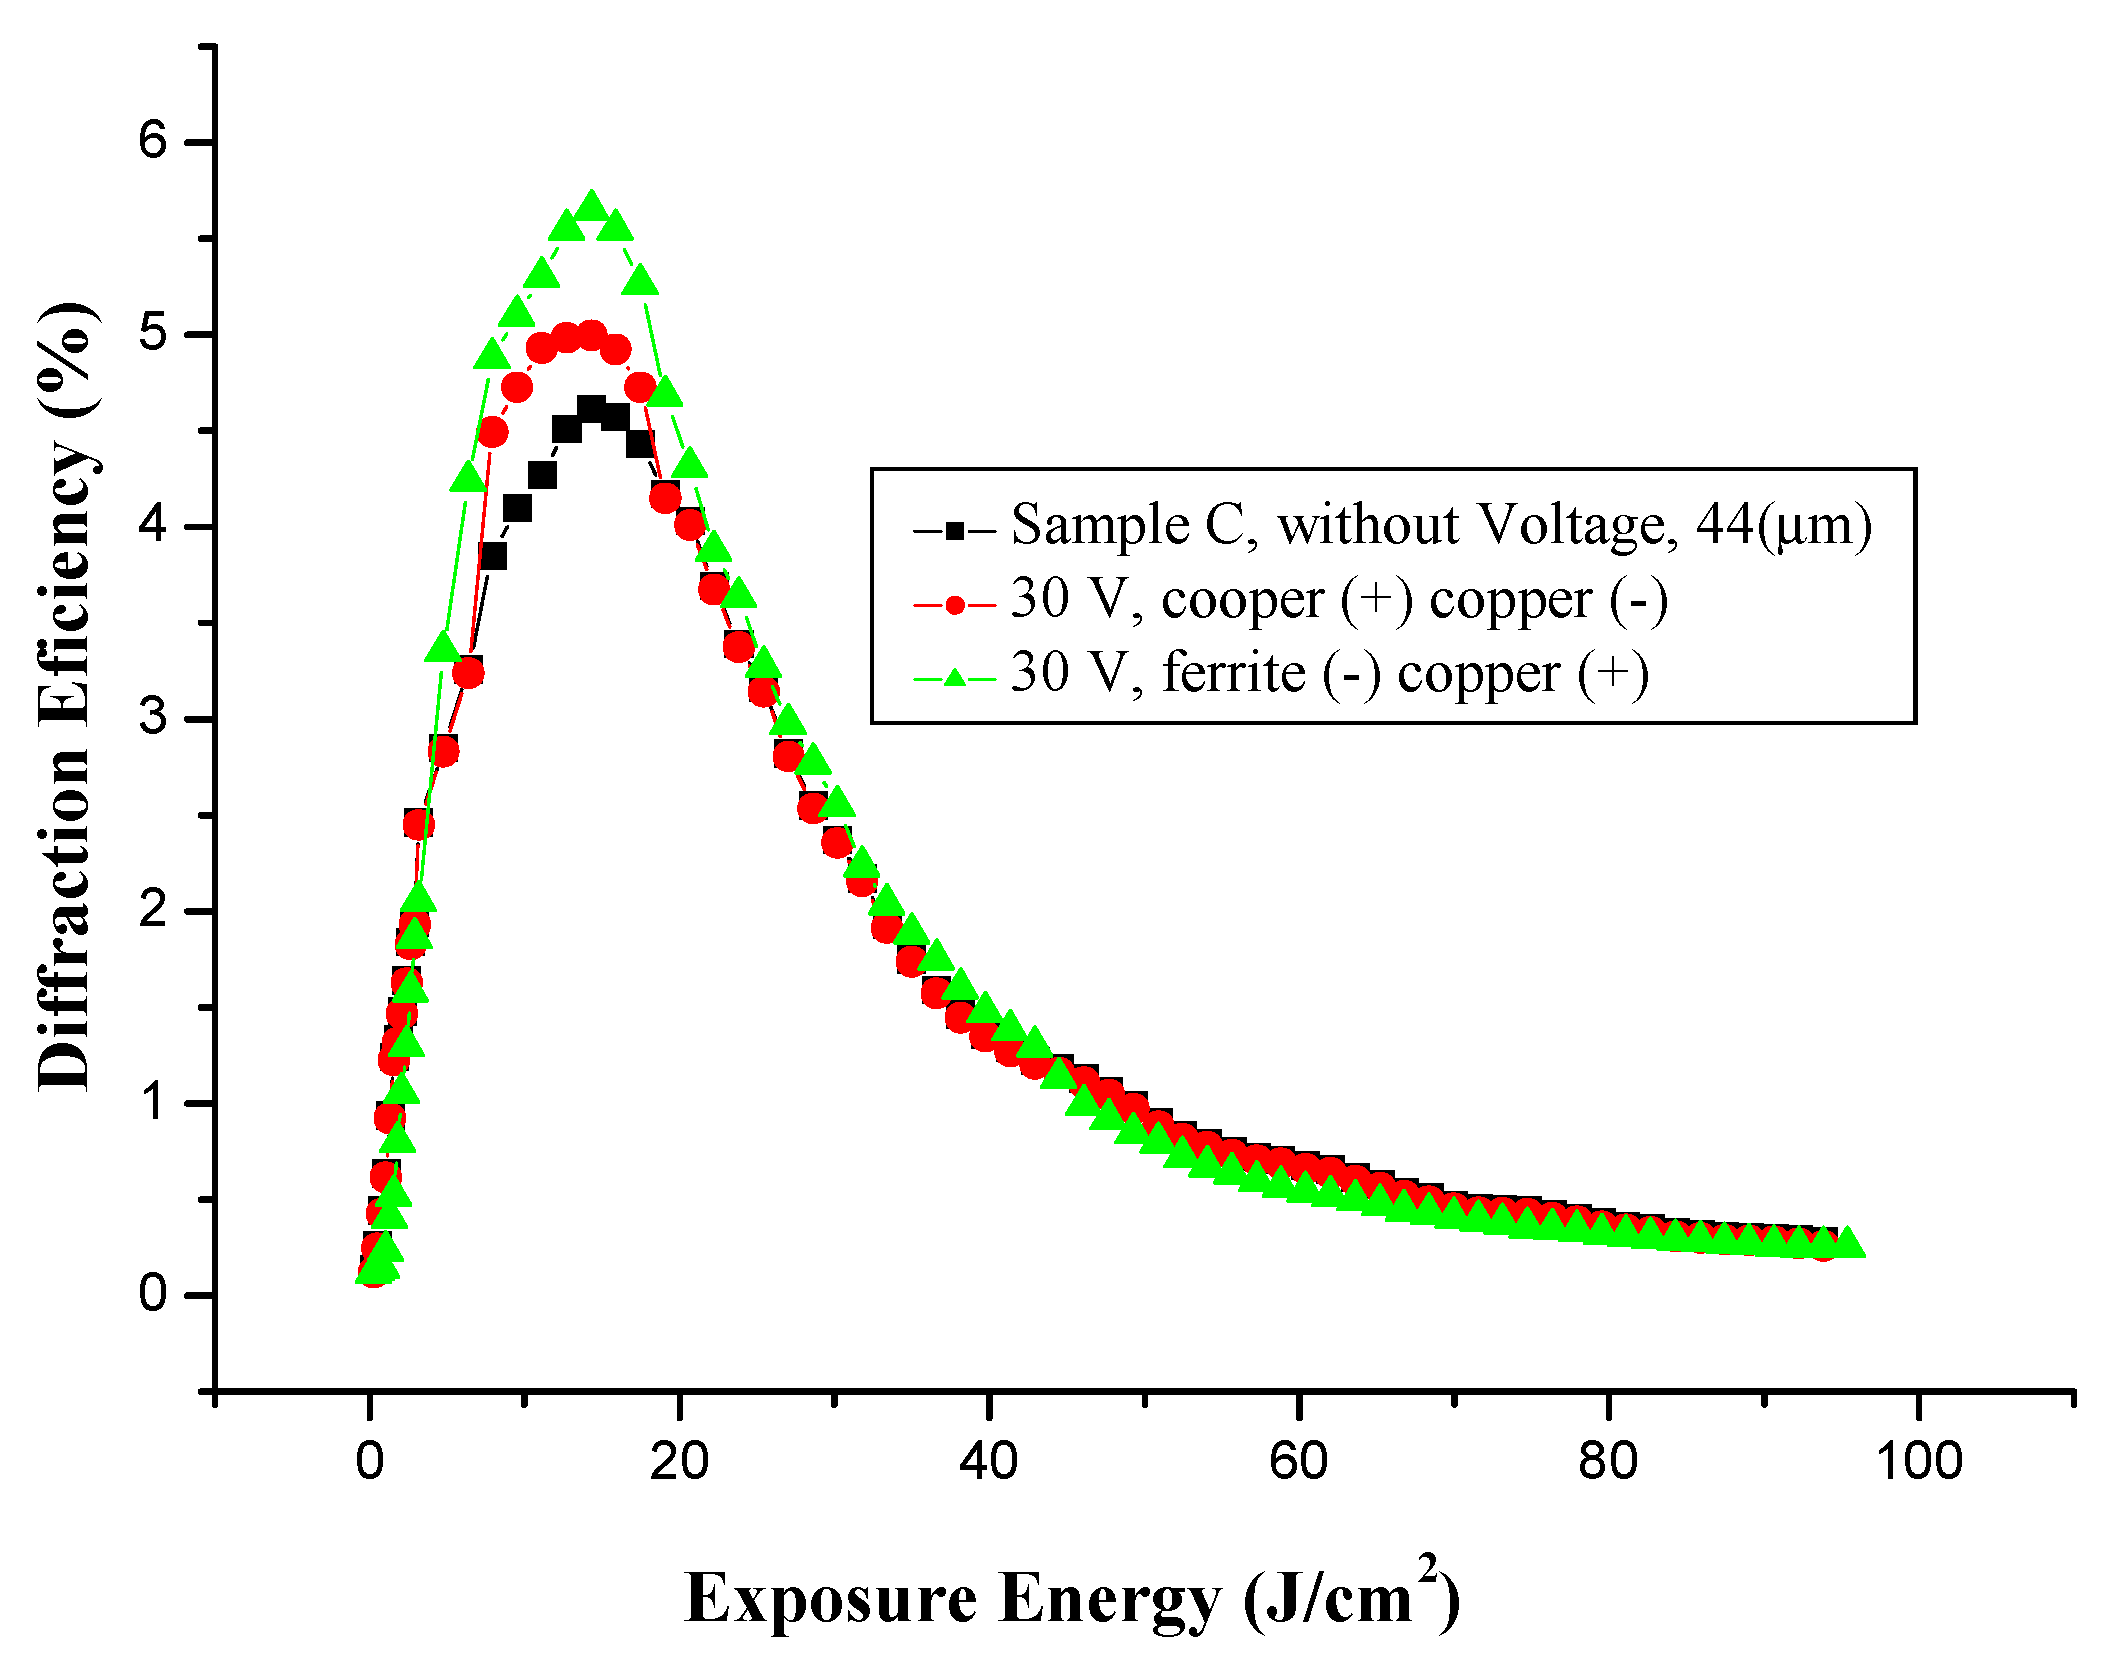
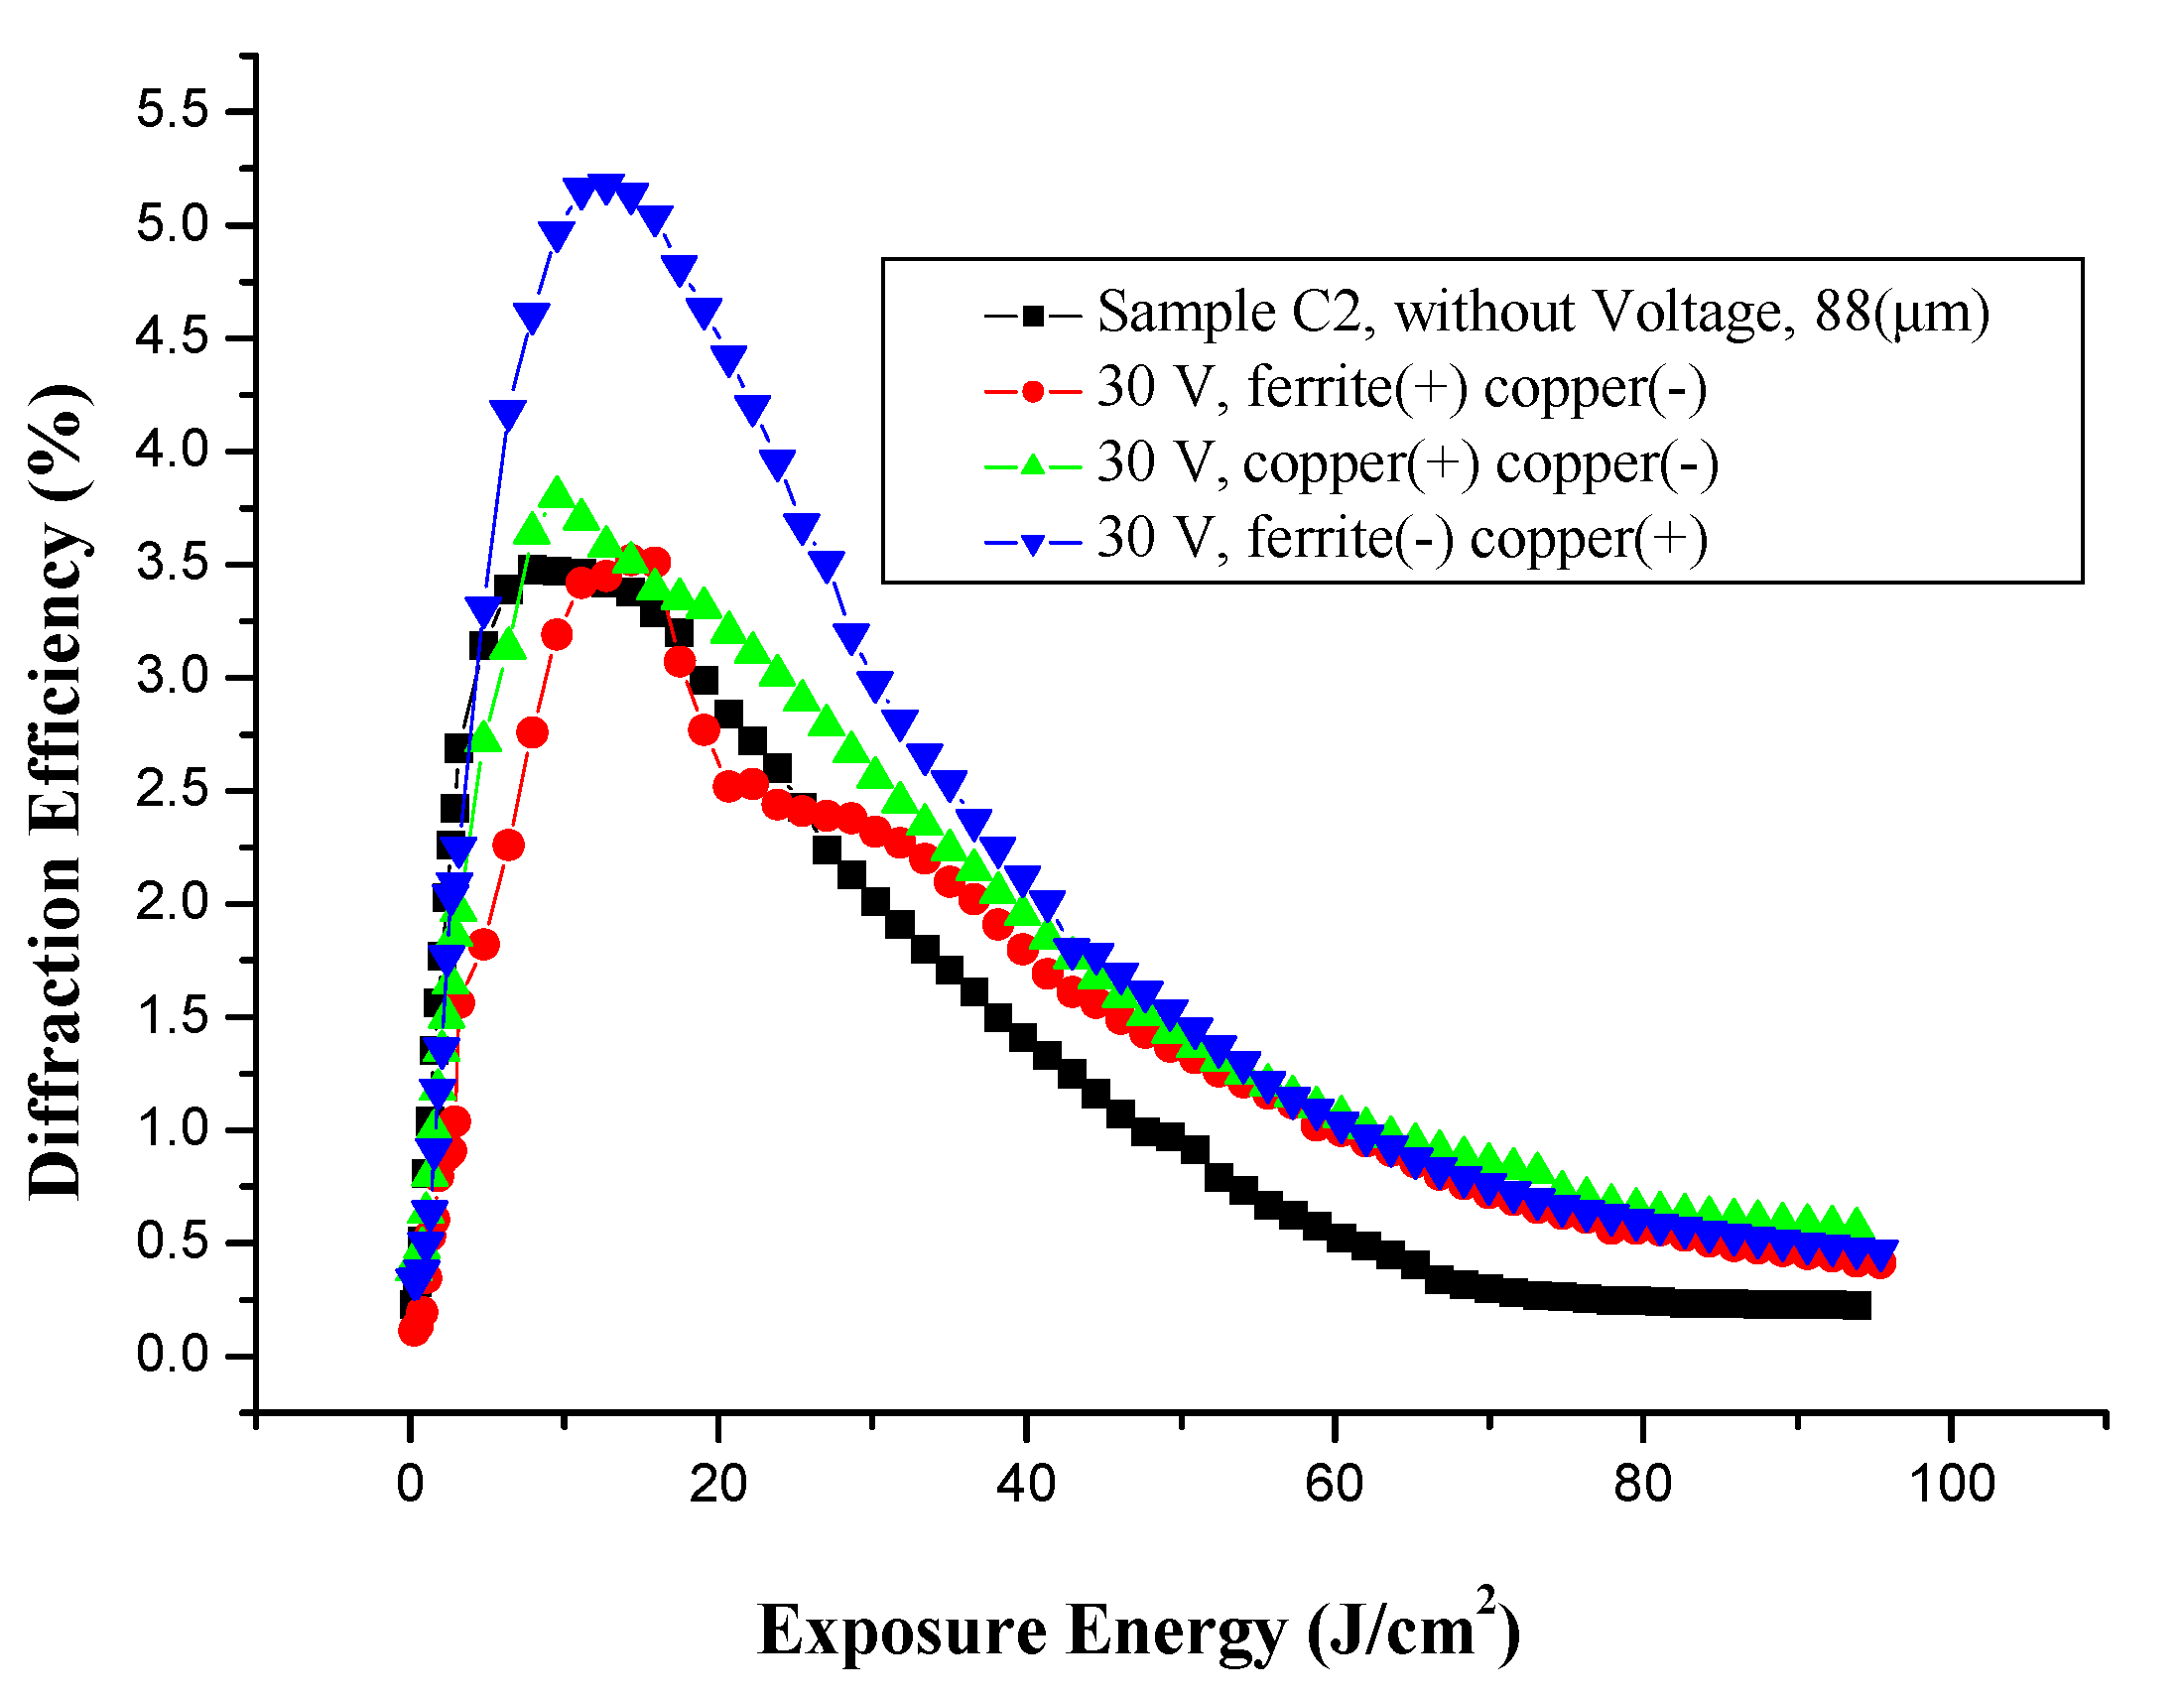
3.5. Effect of Voltage on Holographic Recording

Here, we analyze the possible changes in the diffraction efficiency in response to the application of a DC voltage to the samples during real-time recording. To obtain the behavior, with and without an applied voltage during hologram formation, we implemented on the experimental model, a pair of electrodes, one of copper (+) and the other ferrite (−), with a spacing of 5 mm (these electrodes are placed perpendicular to the grooves of the grating) in the optical setup (at the interference zone in Figure 2 and Figure 4). A DC voltage of 30 V is applied between the electrodes. The power source (B&K Precision Corp., Yorba Linda, CA, USA) providing the DC voltage is connected to the sample. Figure 10 shows the behavior of the photosensitive film to different thicknesses and different concentrations of C and F, respectively, where it is observed that the thickness of 44 µm, with concentration C, is the optimal, when a voltage is applied to the sample for diffraction grating with 454 lines/mm.
Figure 10. First-order diffraction intensity vs exposure time with applied voltage of 30 V for grating with 454 lines/mm, made from sample C, C2, and F with different thickness.
Polymers 06 00899 g010
Table 4 shows the details of Figure 10, the curves plotted with exposure times up to 30 min and the peaks of efficiency are centered at the times described in table. As can be seen, the sample thickness is an important factor for thicknesses greater than 44 microns, the diffraction efficiency decreases, by which the samples becomes darker due to the concentration of (FeCl3) and light. That is, these films have a yellowish brown appearance that darkens with the thickness and photoreduction by light (samples C and F), but sample F, with more concentration, it is not feasible to increase the thickness due to problems of opacity and crystallization.
Table 4. Shows the values of diffraction efficiency of Figure 10.
ConcentrationThickness (µm ± 1µm)Voltage in the registration process ferrite (−), copper (+) (V ± 0.1V)Exposure time (min ± 1 s)Maximum diffraction efficiency to first order (% ± 0.5%)
C 10:24430V3.534.2
C2 10:28830V410.2
F 10:55230V36.4
To analyze the voltage effect, we need to obtain the diffraction efficiency, thus, the diffracted beam is measured simultaneously during hologram recording with a probe beam (He-Ne laser, CVI Melles Griot, 30 mW, λ¼ 632.8 nm). The intensity of the diffracted beams (orders +1 and −1) is that measured at first order using a radiometer (International Light, Model IL 1700®). The diffracted beam is measured during hologram recording as a function of exposure time. The experiment is realized with and without an applied voltage for a grating with a spatial frequency of approximately 454 lines/mm; the grating was prepared from sample C, which yielded the best results. The results are shown in Figure 11.
Figure 11. First-order diffraction intensity vs. exposure time with and without an applied voltage of 30 V for grating with 454 lines/mm, made from sample C.
Polymers 06 00899 g011
Significant differences when the grating was recorded with and without the applied voltage are showed in Figure 11. The curve without the voltage is the same as that presented in Figure 7 (black points), with the voltage is the presented in Figure 10 (black points). At same exposure energy, the curve with the voltage shows significant differences in the diffraction efficiency. The sample increases the diffraction efficiency by a factor of 1.3 times when a voltage has been applied.
Figure 12 shows an important difference with and without the applied voltage. The curve without the voltage is the same as that presented in Figure 7 (green points), with the voltage is the presented in Figure 10 (green points). Sample F increases the diffraction efficiency by a factor of two times when voltage has been applied. Sample F, with more concentration of FeCl3, generates a significant difference when the voltage applied to the grating. However, with this concentration, when irradiated with a laser, the grating is darkens, causing a reduction in diffraction efficiency. The curve, with voltage applied, tends to increase and exhibits higher diffraction efficiency than without voltage applied, thus, the diffraction gratings under an applied voltage are more sensitive than those without voltage.
Figure 12. First-order diffraction intensity vs. exposure time with and without an applied voltage of 30 V for grating with 454 lines/mm, made from sample F.
Polymers 06 00899 g012
The polymer with plasticizers in environmental humidity has it some solvation effect (process of attraction and association of molecules of a solvent with molecules or ions of a solute) on the polymer with environmental humidity.
A plasticizer with water molecules can provide mobility of the metallic ions, resulting in an increase in the conductivity; on the other hand, it increases the intermolecular distance, thereby reducing the intensity of the intermolecular bonding forces. PVA is a plasticizer that helps in the ionic transfer, which, somehow, is involved in diffraction efficiency and it is also possible to add other plasticizers to increase, even more, the diffraction efficiency. The gratings with DC voltage in the exposure process have modulated their diffraction efficiency; this permits some flexibility in the design of holographic gratings [32,33]. This material may have behavioral changes by temperature, because it works as a hydrogel due to PVA and FeCl3 [34,35,36].

3.5.1. Diffraction Pattern

Diffraction gratings recorded in the sample C showed high diffraction efficiency, two photographs of the diffraction pattern of the gratings, as shown in Figure 13 were obtained. Image (a) is the diffraction pattern without voltage, image (b) is the diffraction pattern using 30 V. In both diffraction patterns, higher orders are displayed in a grating with a spatial frequency of 454 lines/mm. The diffraction efficiency to first order was obtained with the sum of the energies of the orders +1 and −1, represented by Figure 13, is noteworthy to observe that the light intensity of the +1 and −1 orders of (b) is higher than in (a), these differences helped to form Figure 11 and Figure 12.
Figure 13. Diffraction pattern, (a) without voltage and (b) with voltage of 30 V, for grating with 454 lines/mm, made from sample C.
Polymers 06 00899 g013
The diffraction pattern images were taken on a dark screen, by reflection, so they look a little skewed the diffracted orders. The image (b) shows less contrast than (a), this is due to problems of saturation of the camera.
The image (b) regularly presents more noise than (a), this is due to increased diffraction efficiency which is described in Section 3.5.4

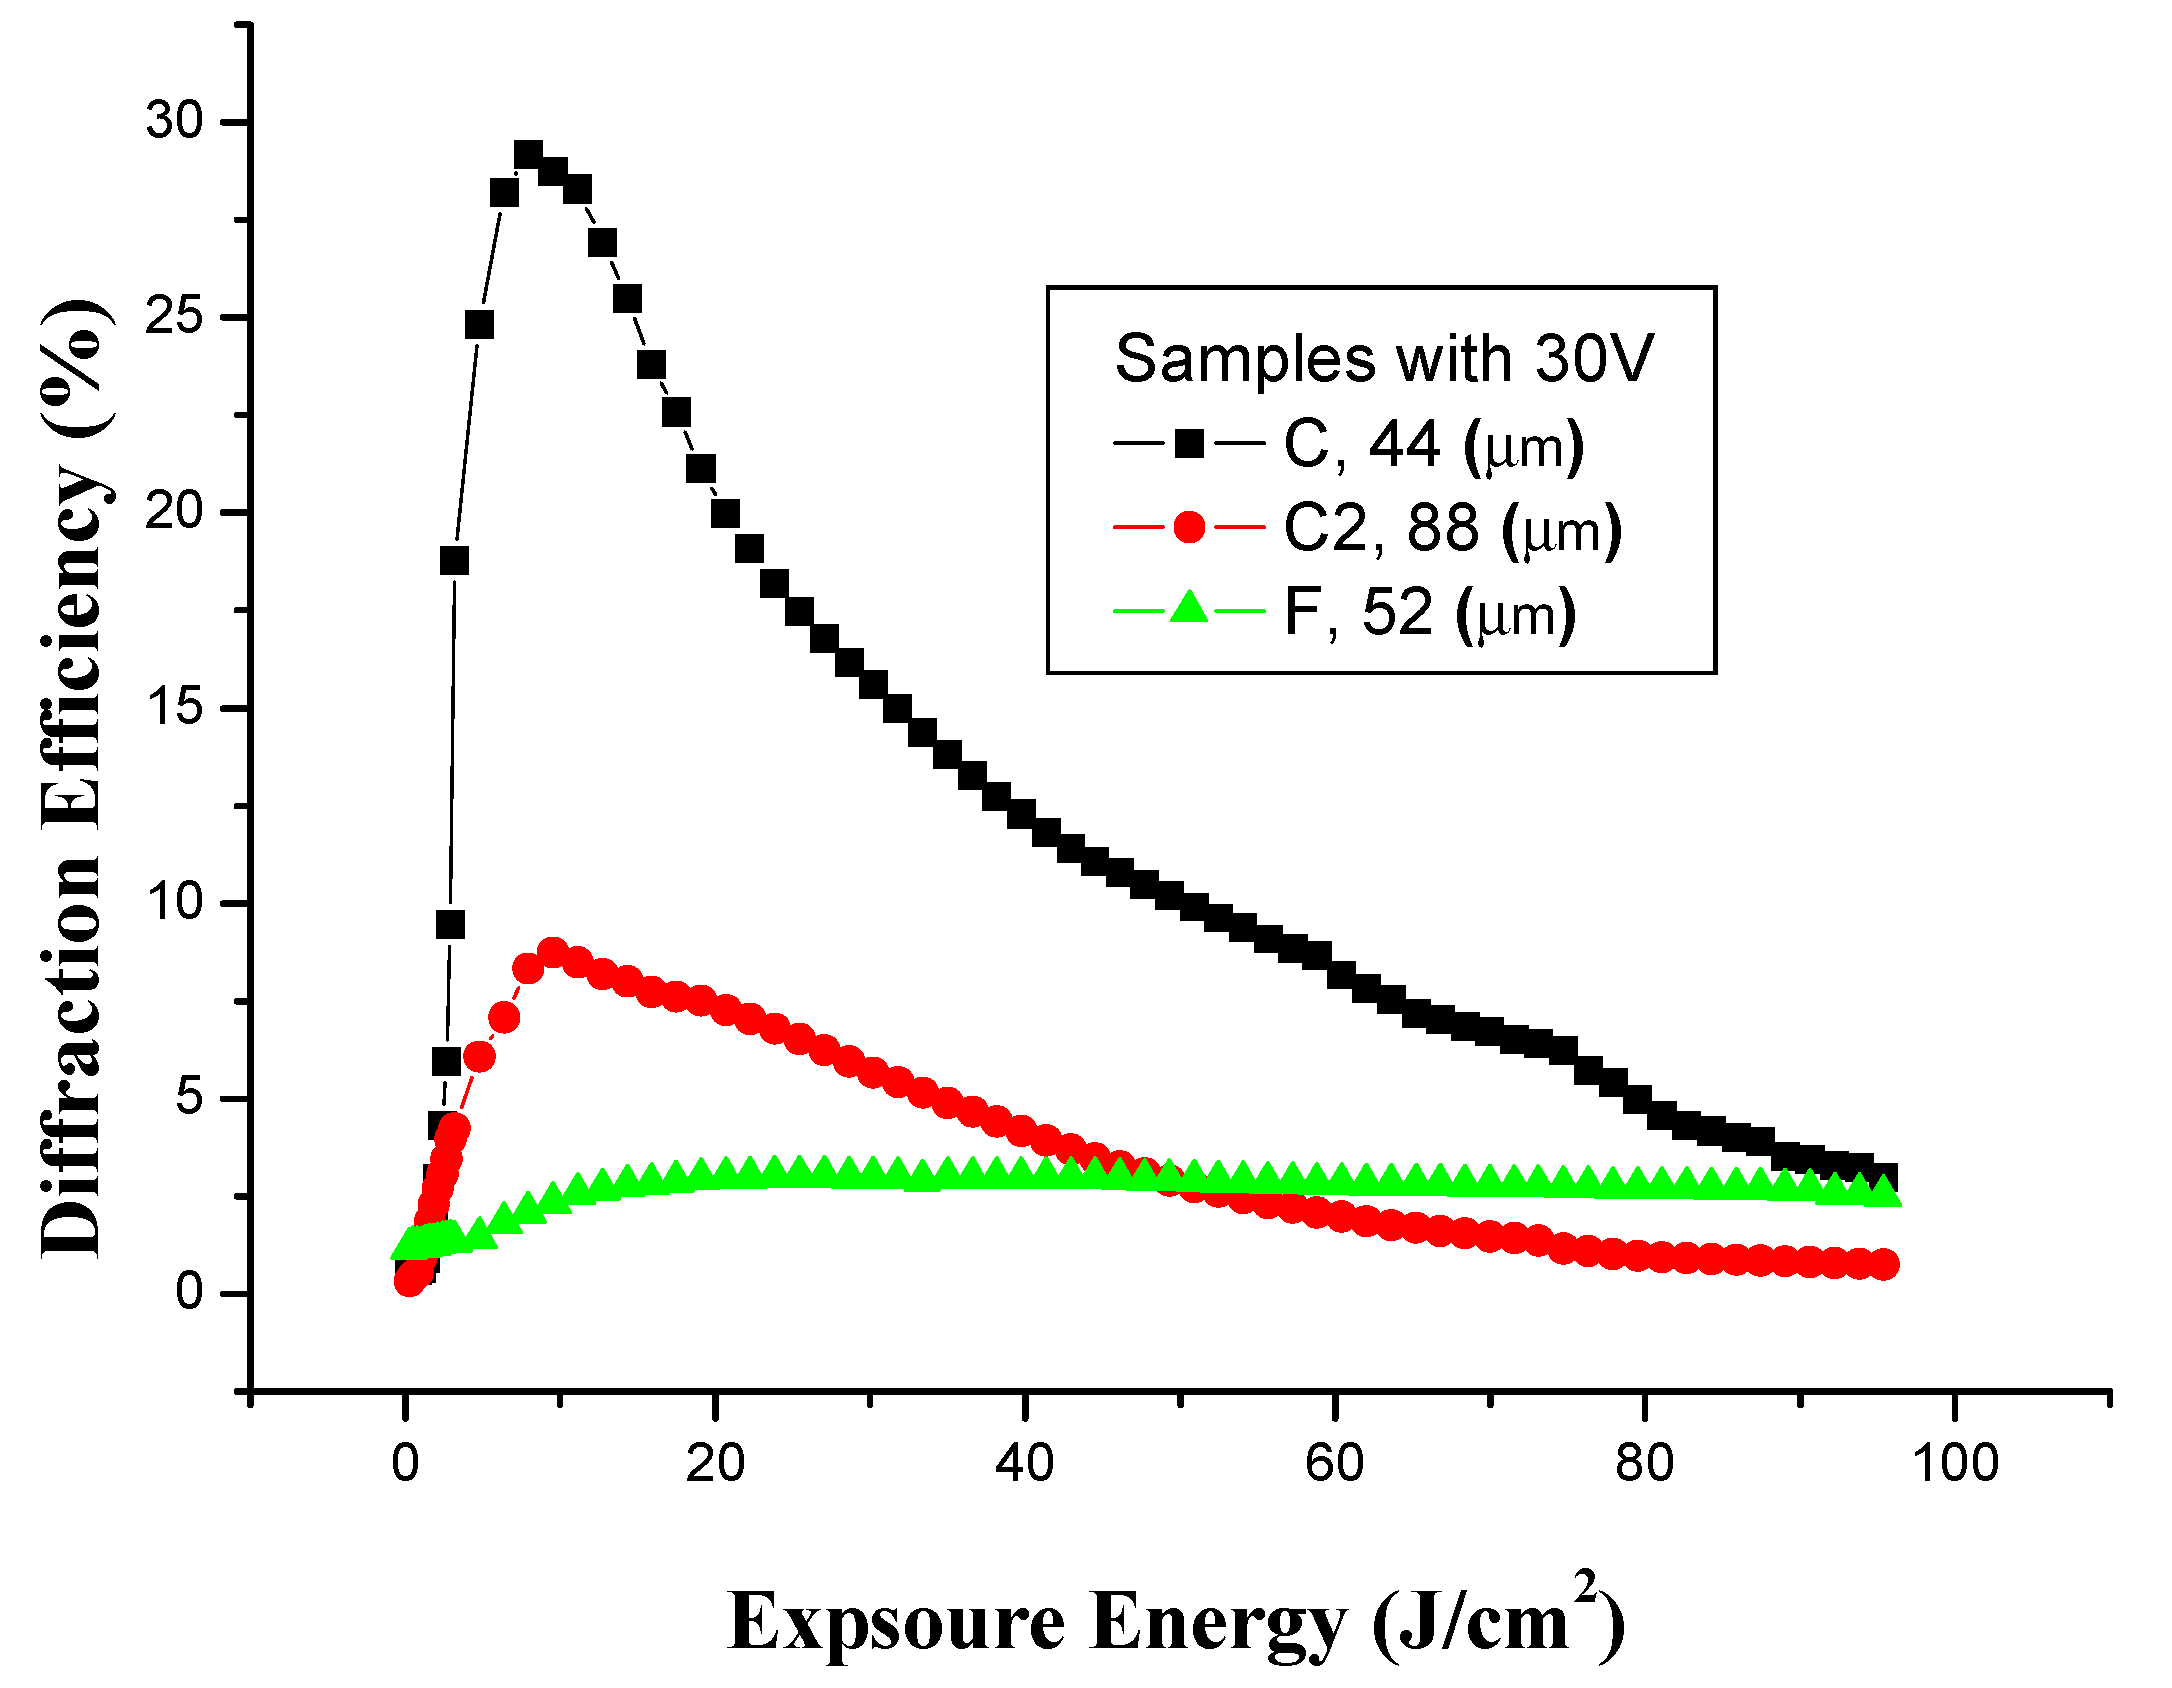
3.5.2. Effect of Voltage on Holographic Recording with Copper Electrodes

In the experimental development, the size, material, and distance between the electrodes has been important. In this section, the effect of voltage on holographic recording with copper electrodes was obtained. Experimentally, copper electrodes for anode (+) and cathode (−) were used in the experimental design (see Figure 4).
The experimental results (see Figure 14) show a slight increase in the diffraction efficiency over the exposed samples without voltage applied. However, the efficiencies with copper electrode pair (+) and (−) is lower than those obtained with the combination of copper electrodes (+) and ferrite (−), the same happens for the different thicknesses.
Figure 14. Diffraction efficiency with 30 V voltage, in the register process using copper electrodes (+) and (−) for different thicknesses, for grating with 454 lines/mm.
Polymers 06 00899 g014
The Table 5 shows details of experimental results of Figure 14, which shows that, with copper electrodes, the diffraction efficiency of gratings also increases, when 30 V is applied.
A point of interest is that the optimal time of exposure is lower than those used with the ferrite and copper electrodes for samples C. However, diffraction efficiencies are lower than those shown in Table 4.
Table 5. Shows some parameters of Figure 8.
Concentration Thickness (µm ± 1µm) Voltage in the registration process copper (−), copper (+) (V ± 0.1 V) Exposure time (min ± 1 s) Maximum diffraction efficiency to first order (% ± 0.5%)
C 10:24430 V2.529.2
C2 10:28830 V38.7
F 10:55230 V7.53

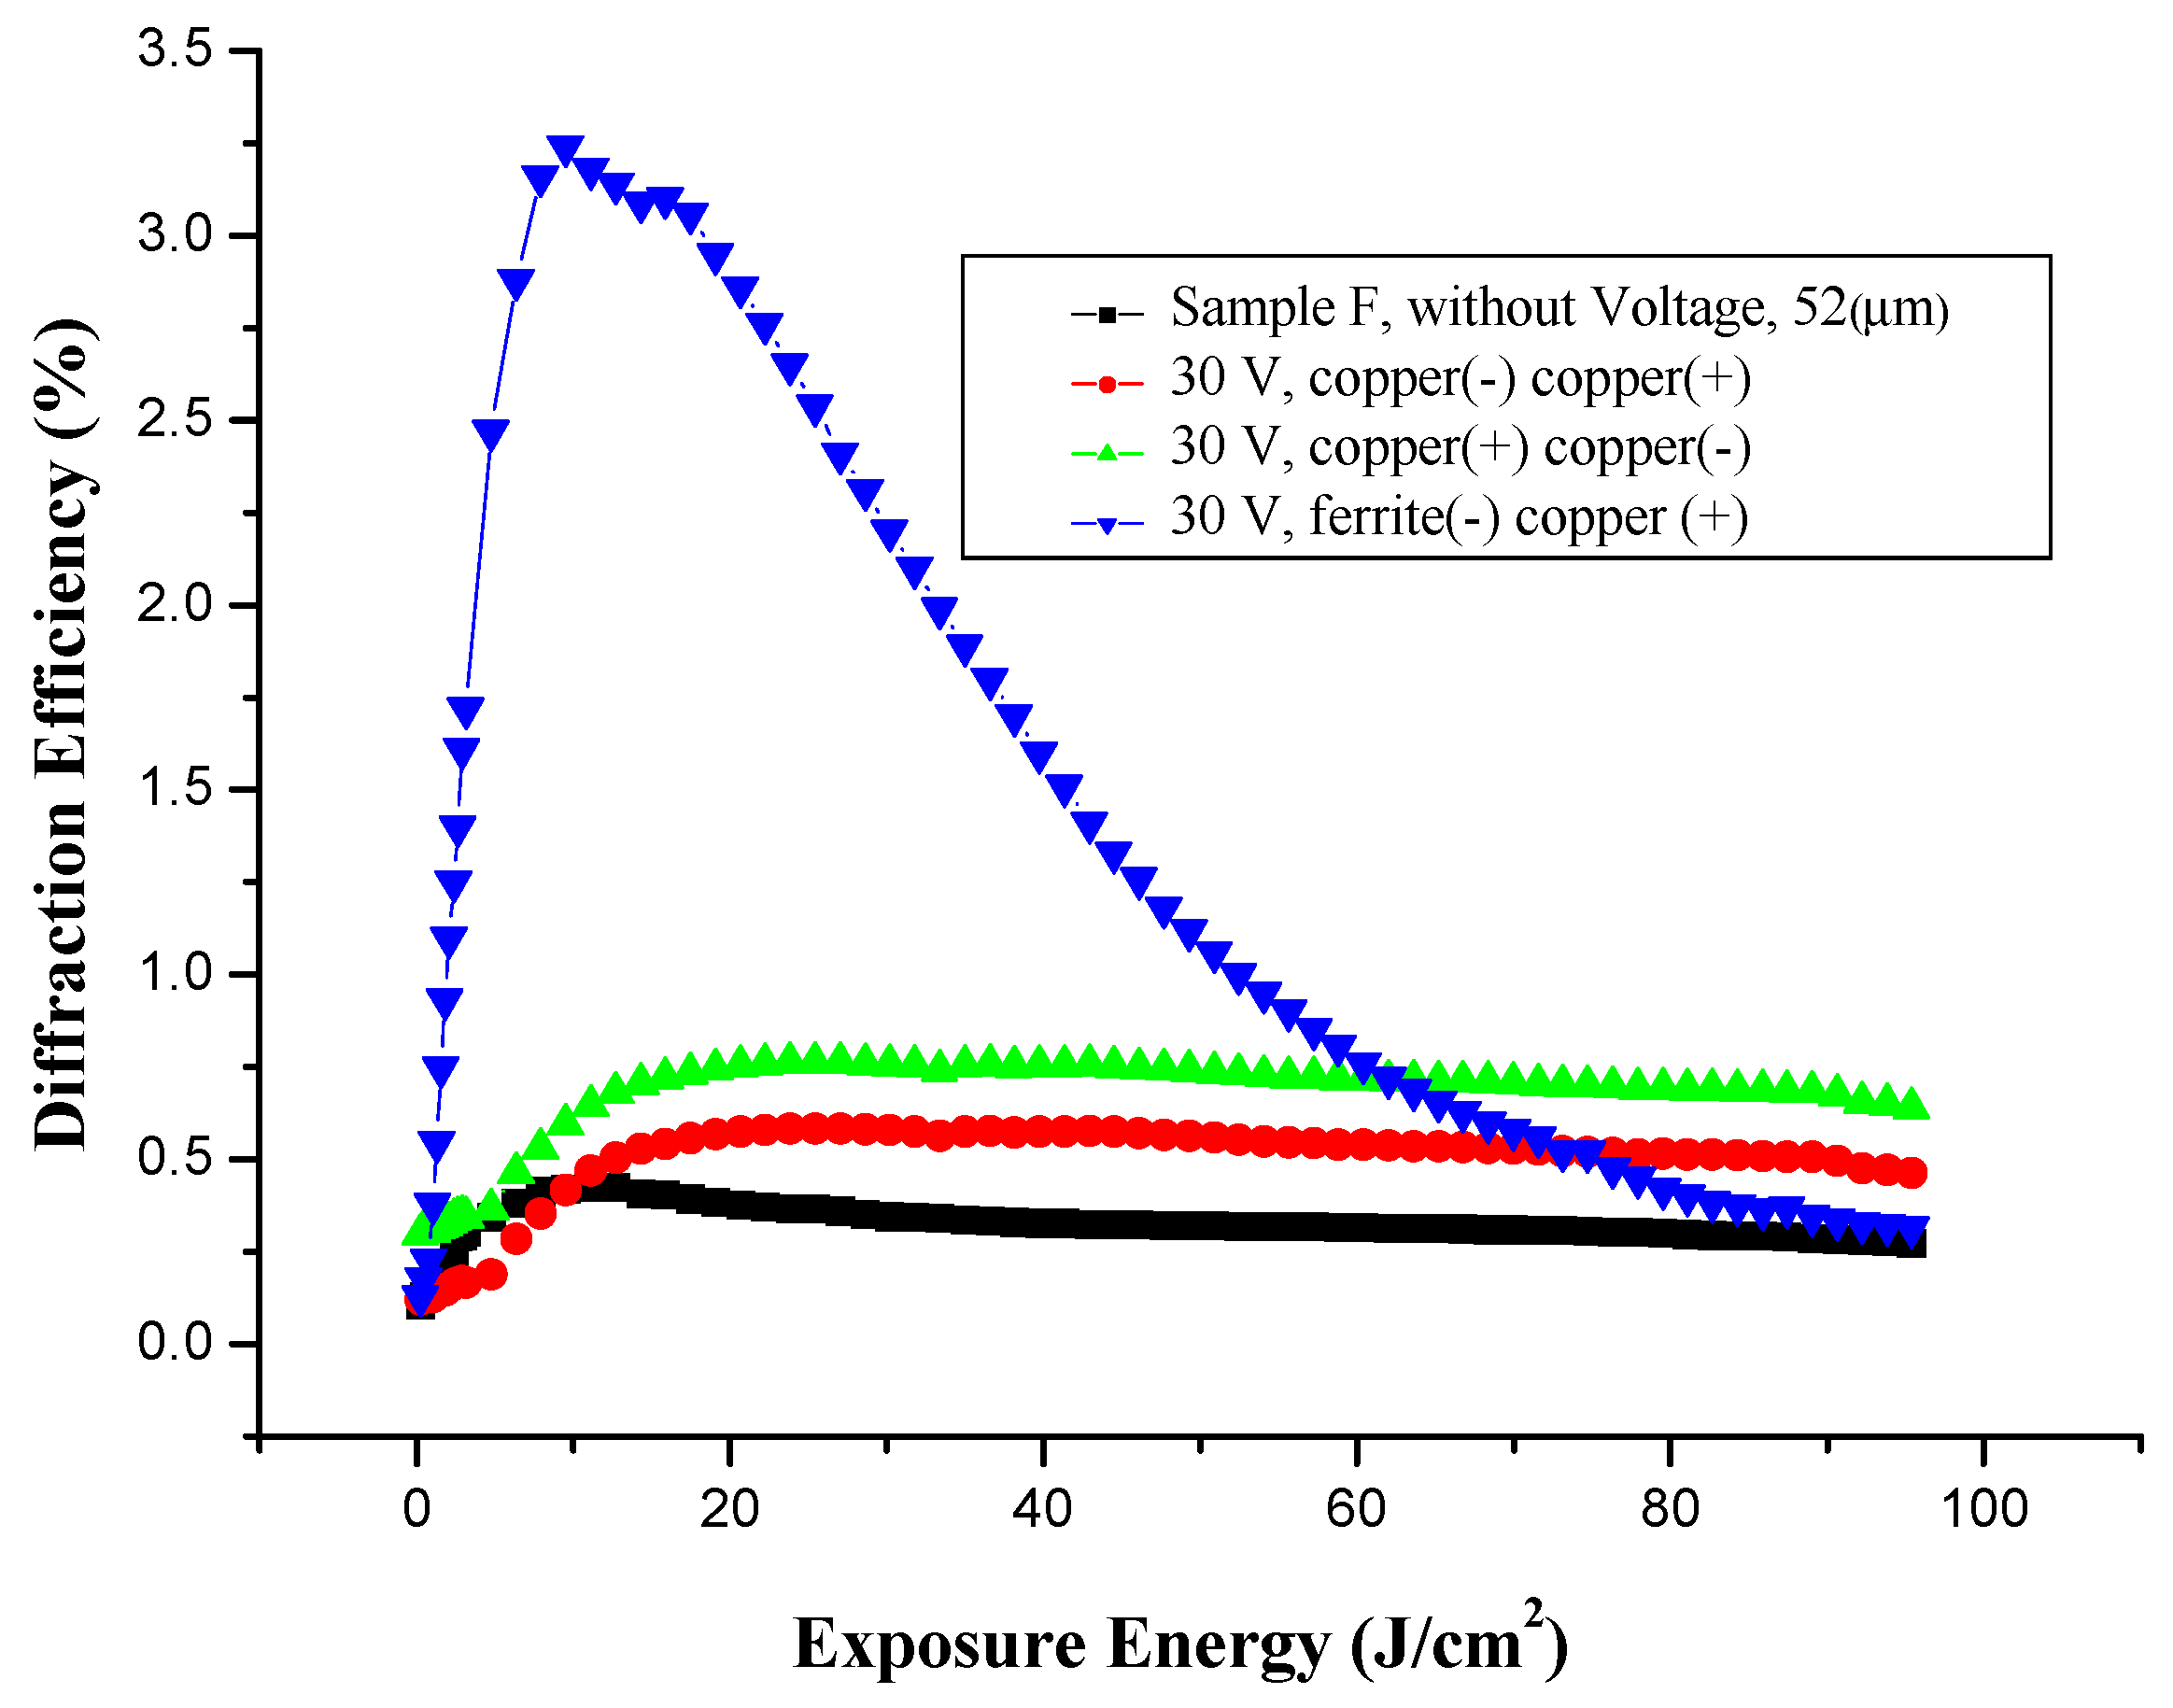
3.5.3. Effect of Voltage on Holographic Register for High Frequency, with Different Electrodes

Figure 15, Figure 16 and Figure 17 shows the behavior of this phenomenon for diffraction gratings with high frequency of the order of 1132 lines/mm. Noting, that in all cases, applying a voltage to the grating always shows greater diffraction efficiency than the gratings without voltage.
Figure 15. Diffraction efficiency of 30 V voltage with thickness of 44 µm of sample C with a frequency of 1132 lines/mm, using different electrodes.
Polymers 06 00899 g015
Figure 15 show that the electrodes also have an important role in increasing the efficiency of diffraction, by recording holographic gratings with a voltage of 30 V. In addition, observed, is that at frequencies of 1132 lines/mm, the pair of electrodes with better performance are ferrite electrodes (−) and copper (+). The diffraction efficiency obtained with ferrite electrodes (−) and copper (+) was approximately 5.6%, with the two copper electrodes was of the order of 5%, and without voltage 4.6% was obtained.
Figure 16 shows the diffraction efficiency of gratings constructed with double thick emulsion C2, with respect to what is shown in Figure 15. It can be seen that diffraction efficiencies are similar in both cases when a voltage is applied, using the ferrite electrodes (−) and copper (+). This behavior is important because the thickness at these frequencies does not greatly affect the gratings’ efficiency, in contrast with the Figure 10, where the thickness dramatically reduces the diffraction efficiency at low frequencies as 454 lines/mm.
Figure 16. Diffraction efficiency of 30 V voltage with thickness of 88 µm of sample C2 with a frequency of 1132 lines/mm, using different electrodes.
Polymers 06 00899 g016
In important, also, for the polarity of the electrodes, the ferrite changes polarity (−) to ferrite (+), thus, different results are obtained, as shown in the figure, this determines that the use of ferrite with the polarity (−) is the best option. The diffraction efficiency obtained with ferrite electrodes (−) and copper (+) was 5.2%, approximately, with the copper electrodes was of the order of 3.6%, with ferrite electrodes (+), copper (−) was 3.5% approximately, and without voltage was 3.4%.
Figure 17, is very interesting because it clearly shows a big difference when 30 V is applied to the electrodes of ferrite (−) and copper (+), and without voltage. Another interesting point is the polarity of the electrodes of copper, when changed from (+) to (−), one would expect it to be the same, but the nature of materials reserve some surprises, as shown in this graph. It suggests that the material preferably has a polarity determined by the salts comprising the photosensitive emulsion. The diffraction efficiency obtained with ferrite electrodes (−) and copper (+) was approximately 3.3%, with the copper (+) and copper (−) was of the order of 0.6%, with copper (−) and copper (+) was approximately 0.8%, and without voltage was 0.4%, although all measurements are within the error range, which corresponds to 0.5% in diffraction efficiency. Figure 15, Figure 16 and Figure 17 did not introduce the range of error in the graphs for the to reader have more clarity of the information.
Figure 17. Diffraction efficiency of 30 V voltage with thickness of 52 µm of sample F with a frequency of 1132 lines/mm, using different electrodes.
Polymers 06 00899 g017

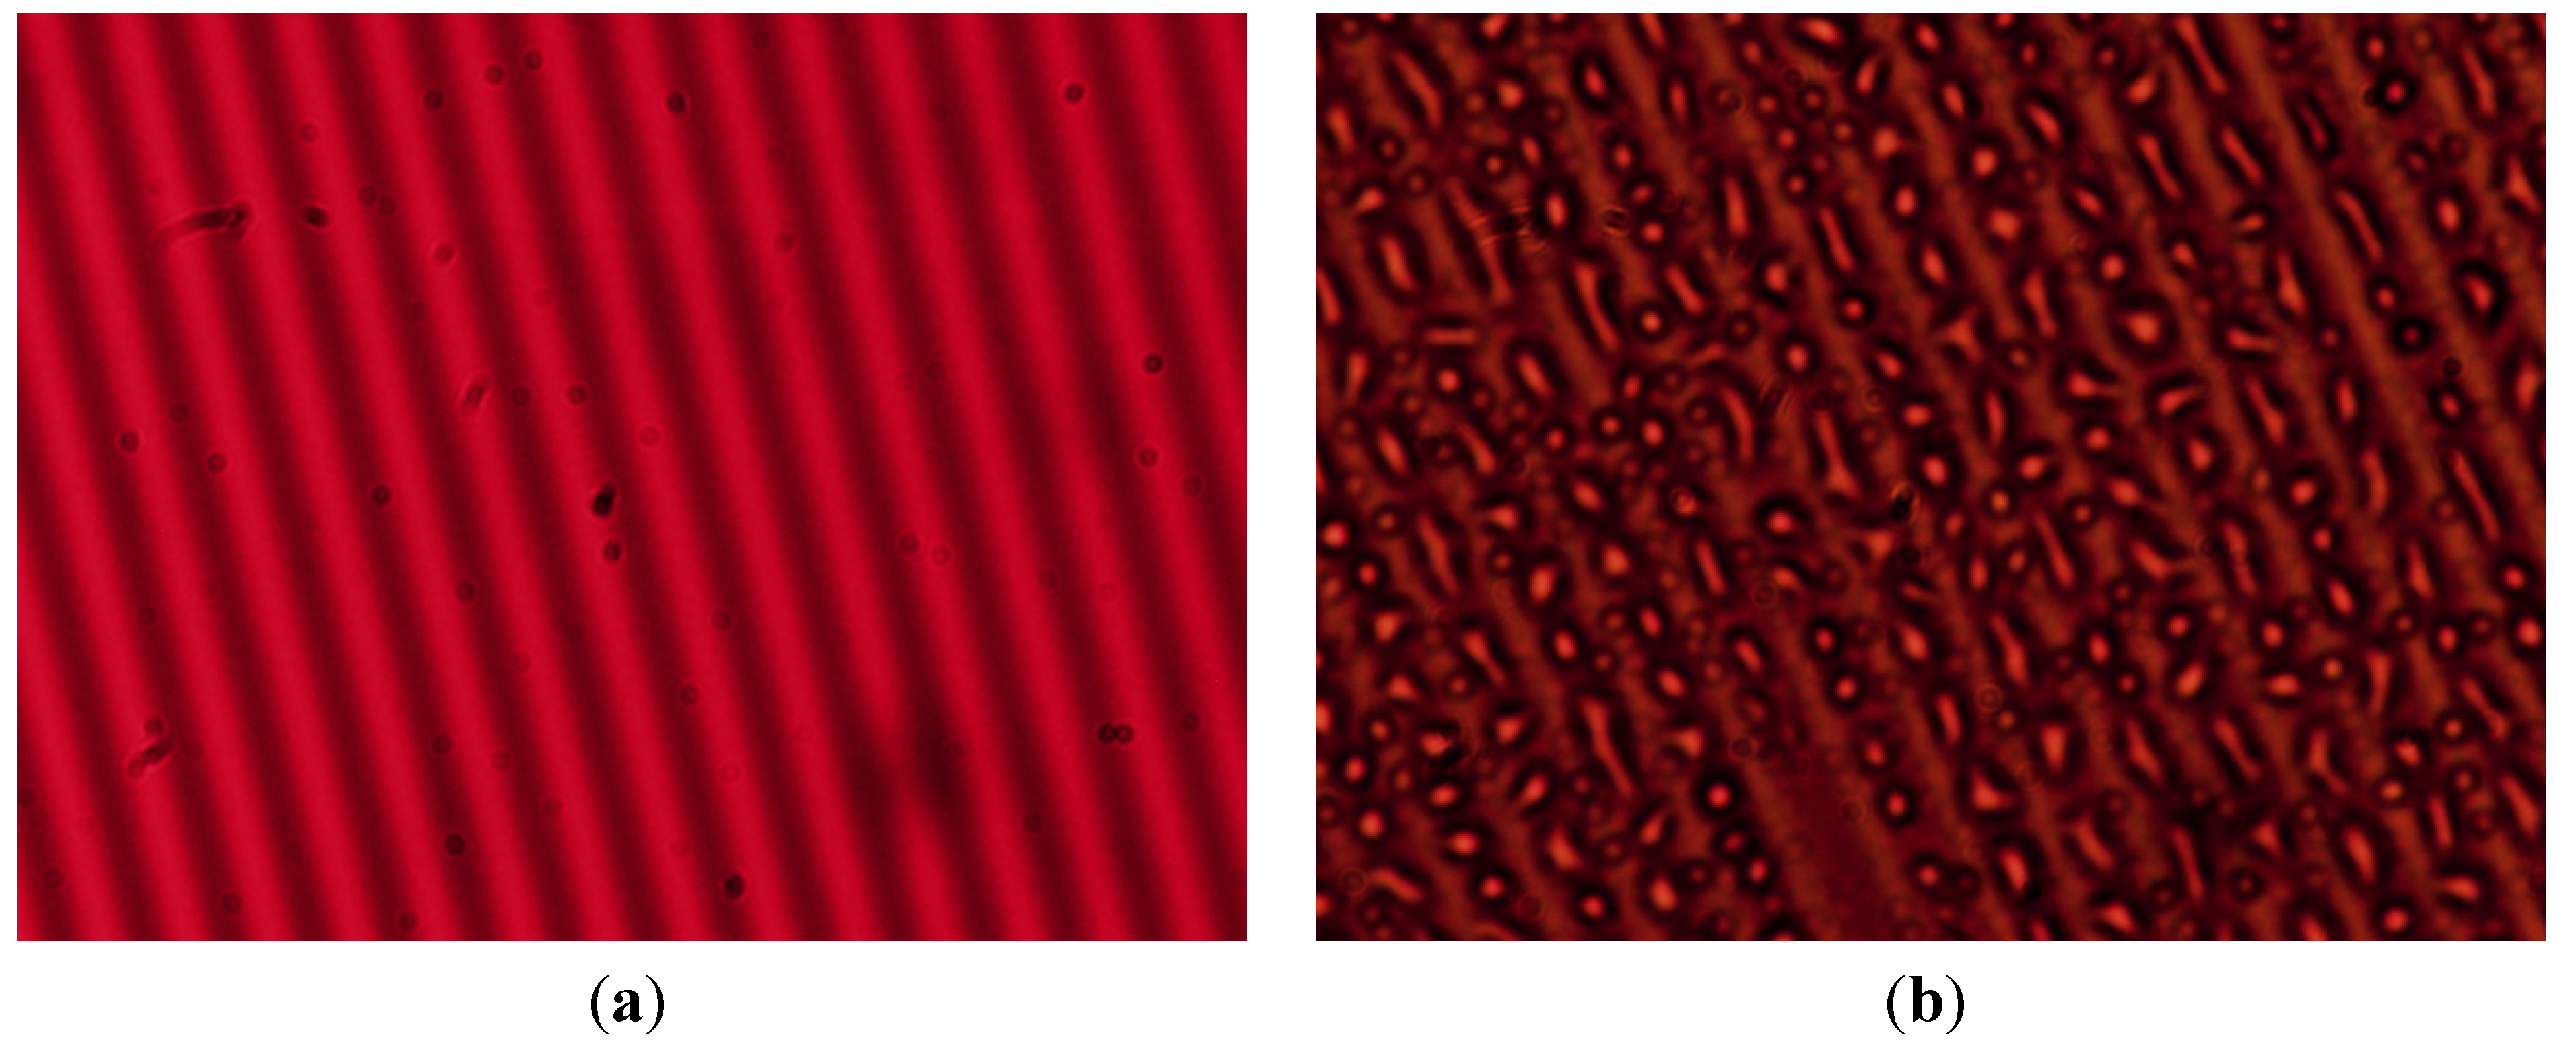
3.5.4. Microstructure of Gratings

The images of gratings with sample C were obtained with an Olympus BX51 Optical Microscope®, (Hicksville, NY, USA). The image (a) corresponds to a photomicrograph of the grating without voltage, clearly being observed from grooves forming in the grating. The red background is the filter used with the microscope. Image (b) is a photomicrograph of the grating with 30 V, with more diffraction efficiency, by a factor of 1.3 times, with respect to the grating (a).
The increase in diffraction efficiency is determined by the factors described in Section 3.6, by the process of crosslinking of iron with the photochemical reaction of the reduction of Fe3+ to Fe2+ ion, and condensation of water, see Figure 18b.
Figure 18. Photomicrograph of diffraction gratings with 454 lines/mm, sample C, (a) without voltage, (b) with voltage.
Polymers 06 00899 g018
An important point of the gratings, with 30 V, is the accumulation of micro-droplets (condensation of water) on microgrooves of orderly form. This contributes to increase the diffraction efficiency. The microdroplets on the grooves generate a small scattering on the diffracted orders, due to the shape and size variation of the microdroplets. This phenomenon is repeated for all frequencies from 454 to 1132 lines/mm, and for concentrations C and F.

3.6. Discussion

The hypothesis describes process of photo-crosslinking through electron transfer with formation and mobility of ion-radical active and non-active in system. With reorientation of electric charges and polarity between atoms and molecules the intramolecular crosslinks are formed in the hologram. This process is essentially through electron transfer from photochemical reduction reaction of Fe3+ to Fe2+ ion. Finally, electrochemical voltaic interaction contributes to a photo-redox process, increasing more the diffraction efficiency, and changing absorption in the film, taking a dark appearance.
An interesting result of Figure 18b is the condensation of water, which plays an important role in increasing the diffraction efficiency of gratings. This physical phenomenon is external to the electrochemical processes in the hypothesis posed. These are complementary phenomena.

3.6.1. Hypothesis Mechanism for Holographic Recording and Voltage Effect

The process describes possible chemical reactions for the preparation of PVA-FeCl3 hologram. Starting with preparation of the aqueous solution of polyvinyl alcohol (PVAaq) 7% and 80 °C, Equation (3) [37,38,39,40,41,42,43,44,45,46]. The aqueous solution of ferric chloride, FeCl3(aq), Equation (6) to 10% at 25°C, water ionization described in hydrogen ions (H+) and hydroxide ions (OH), Equation (4). These, interact with ferric chloride crystals generating the solution of ferric ions (Fe3+) and chloride ions (Cl), resulting a solution of ferric chloride with acidic properties, Equation (5). The reactions of ions (Fe3+ + 3OH) produce ferric hydroxide, Fe(OH)3. With removal of OH (hydroxyl) ions in aqueous solution causes a relative excess of hydrogen ions, H+, which makes an acid solution [47,48,49,50,51,52,53,54,55,56,57]. Equation (7) shows the preparation of polymer matrix with an oxidizing agent. PVA(aq) and FeCl3(aq) are combined in a ratio 10:2 and 10:5, at 25 °C, with conventional drying of samples C and F for 24 h at normal laboratory conditions. Starting here, the intramolecular interaction of components [18,19]: a film of yellow light brown [PVA:FeCl3xH2O is generated. The image (grating) is recorded, through of photo-crosslinking process with the photo-activity of ferric ions (Fe3+) with chloride ions (Cl) and hydroxide ions (OH) in acidic medium. Thus, Equations (8) and (9) represent the formation of photo-active intermediate species that coexist with [Fe3+.Cl] and [Fe3+OH], to pH = 2. With a photon absorption of λ = 445 nm, the process continues until reaching photo-reduction of iron with generation of ferrous ions (Fe2+) and free radicals, both chlorine (Cl) and hydroxyl (OH). With the process of photo-crosslinking there is the formation of three types of Fe, active and inactive Fe3+, and Fe2+ inactive [56,57,58,59,60,61,62,63,64,65,66,67]. Equation (10) represents the polymer matrix, [PVA:FeCl3xH2O, exposed to laser λ = 445 nm, a state transition is produced, [Fe3+Cl---PVA---Fe3+OH] + H+, by electronic excitation, where main photo-active species interact with PVA and generate hydrogen radical-cation. The species [Fe3+OH] is more active, and photo-chemically less active, known as iron (III) aqueous, Fe3+(aq), [18,19]. The photo-redox process continues for transfer of electrical charges being obtained the photo-crosslinked (recorded image), [PVA-OH-Fe2+], with the production of ferrous chloride (FeCl2), ferrous hydroxide, Fe(OH)2, ferric hydroxide, Fe(OH)3, hydrogen gas, H2, and chlorine gas, Cl2, [53,68,69,70,71,72,73,74,75] this process darkens the sample film. Lastly, the photo-electrochemical process is performed by a redox reaction. Equation (11) represents chemical reaction simulation, where film is recorded simultaneously with voltage application [76,77,78]. The photo-crosslinking process [PVA-OH-Fe2+] with humidity and 30 V, with copper electrode (anode) and ferrite electrode (cathode), separated by 5 mm. The electric field contributes to increase diffraction efficiency of the holographic grating recording process [PVA-OH-Fe2+]*. Substances obtained: hydroxides of Fe (II) and Fe (III), chlorides of Cu (II) and Fe (II), and H2 and Cl2 gas, [69,70,71]. By the electronegativity the copper, Cu, replaces the iron atom, Fe, in the system. Apart of the photochemical and electrochemical processes, we note that when the applied electric field the holographic grating recording. It produces a condensation of water located on the grooves of the gratings.

3.6.2. Diagram Chemical Reactions

Preparation of PVA-FeCl3 for holographic recording.
PVA aqueous solution:
Polymers 06 00899 i003
aq = solute disolved in water; s = solid; l = liquid; ↑ = gas.
Ionization of H2O and FeCl3:
Polymers 06 00899 i004
Polymers 06 00899 i005
Acid solution of ferric chloride:
Polymers 06 00899 i006
Polymer matrix with oxidizing agent:
Polymers 06 00899 i007
Photo-active of Fe3+ ions in acidic medium for holographic recording:
Polymers 06 00899 i008
Polymers 06 00899 i009
Photo-crosslinking in the film, image recording:
Polymers 06 00899 i010
Over all reaction, preparation of the holographic grating with voltage application:
Polymers 06 00899 i011
Figure 19, presents a 2D schematic of the vicinity of the copper electrode (anode) and ferrite (cathode) by applying a voltage of 30 V, showing the electrochemical redox process, based in the explaining of the Equation (11).
Figure 19. Scheme 2D, simplified representation of the electrochemical interactions as from photo-redox process the grating (image) [PVA-OH-Fe2+]*. The formation of the image (grating) without voltage is: [PVA-OH-Fe2+], when voltage is applied is: [PVA-OH-Fe2+]*. This * is, to differentiate both images.
Polymers 06 00899 g019

4. Conclusions

Holograms formed with PVA and FeCl3 have two components, phase and amplitude. Generally we know that the phase contributes more significantly to the diffraction efficiency than the amplitude. PVA is a hydrophilic material; the prepared emulsion always has a humidity component that promotes the electrical conduction of the material and gratings recording. If the sample is completely dry, without wetness, the material is not photosensitive. We investigated the diffraction efficiency of holographic gratings made with different concentrations of FeCl3 dopant. We describe the sample preparation and report the chemical characteristics of the solutions with respect to the FeCl3 concentration. The experimental results show, as well, the diffraction efficiency with respect to the chemical and physical characteristics of samples, exposure energy, and registration angle of the gratings. The diffraction efficiency of the samples under a voltage applied to the hologram was obtained. We experimentally observed that the dopant concentration affects the characteristics of the samples as: resistivity, pH, and absorbance. The principal chemical mechanism in the samples under an applied DC voltage is the oxide-reduction reaction and photocrosslinking of PVA bonds with the incident energy in holographic recording. The hypothesis on the formation of the grating and the effect of the applied voltage is shown. The values of some important parameters for holographic gratings can be changed in this material by varying the applied voltage. The phenomena involved here are complex as two interrelated behaviors are significant for holographic gratings recorded with and without an applied voltage, an increase in the diffraction efficiency by a factor of 1.3 times for sample C and 2 times for F when the voltage is applied, and a shift in the diffraction efficiency with time, these results are valid for low and high frequencies. An important point of the gratings with 30 V is the increase in diffraction efficiency that is determined by the factors described in Section 3.6, by the process of crosslinking of iron with the photochemical reaction of the reduction of Fe3+ to Fe2+ ion; forming the [PVA-OH-Fe2+]* image, together with condensation of water.
The condensation of water on microgrooves, contributes to an increase the diffraction efficiency and generate a small scattering on the diffracted orders, due to the shape and size variation of the microdroplets.
This phenomenon is repeated for all frequencies and concentrations.
These are preliminary results; in the future, the material will be characterized in greater depth to determine its nature and whether it is appropriate for use as a photorefractive material. Finally, the principal goal in this work is to use the metallic halides, which offer a good opportunity for obtaining photoconductive materials using metallic salts and these are inexpensive and easy to manipulate under room conditions.

Acknowledgments

Thank Institute National of Astrophysics Optical y Electronic (INAOE) for the support infrastructure and economic support.

Author Contributions

Arturo Olivares Pérez, directs, coordinates and funds the entire investigation. Mary Paz Hernández-Garay, cooperates in the investigation of the behavior of diffraction gratings with FeCl3 and applied voltage. Santa Toxqui-López, collaborated on the investigation of the behavior of diffraction gratings with FeCl3 for different electrodes and gratings with high frequency. Israel Fuentes-Tapia, assists in the preparation of photosensitive films for different concentrations and performed the experimental setup. Manuel Jorge Ordóñez-Padilla, assists in the analysis and discussion of the photoreduction and photochemical processes involved in the formation of the image.

Conflicts of Interest

The authors declare no conflict of interest.

References

  1. John, B.M.; Joseph, R.; Sreekumar, K.; Sudha-Kartha, C. Copper doped methylene blue sensitized poly(vinyl alcohol)-acrylamide films for stable diffraction efficiency. Jpn. J. Appl. Phys. 2006, 45, 8686–8690. [Google Scholar] [CrossRef]
  2. Pramitha, V. A New Metal Ion Doped Panchromatic Photopolymer for Holographic Applications. Ph.D. Thesis, Cochin University of Science and Technology, Cochin, India, November 2011. [Google Scholar]
  3. Pramitha, V.; Nimmi, K.P.; Subramanyan, N.V.; Joseph, R.; Sreekumar, K.; Sudha Kartha, C. Silver-doped photopolymer media for holographic recording. Appl. Opt. 2009, 48, 2255–2261. [Google Scholar] [CrossRef]
  4. Solymar, L.; Cooke, D.J. Volume Holography and Volume Gratings; Academic Press: London, UK, 1981. [Google Scholar]
  5. Finch, A. Polyvinyl Alcohol Developments; John Wiley and Sons: New York, NY, USA, 1992. [Google Scholar]
  6. Nachtrieb, N.H. Conduction in fused salts and salt-metal solutions. Ann. Rev. Phys. Chem. 1980, 31, 131–156. [Google Scholar] [CrossRef]
  7. Patachia, S.; Rinja, M.; Isac, L. Some methods for doping poly (vinyl alcohol) hydrogels [PVA-HG]. Rom. J. Phys. 2006, 51, 253–262. [Google Scholar]
  8. Gaafar, S.A.; Abd El-Kader, F.H.; Rizk, M.S. Changes in the structure of poly (vinyl alcohol)-CrCI composites irradiated by low level fast neutron doses. Phys. Scr. 1994, 49, 366–370. [Google Scholar] [CrossRef]
  9. MacDiarmid, A.G. Nobel Lecture: Synthetic metals: A novel role for organic polymers. Rev. Mod. Phys. 2001, 73, 701–712. [Google Scholar] [CrossRef]
  10. Valsangiacom, M.S.; Bulinski, M.; Iova, I.; Schinteie, G.; Kuncser, C.; Filoti, G.; Bejan, D. Optical and electronic proprieties of mixed Fe-Sn doped PVA. Rom. Rep. Phys. 2003, 55, 283–286. [Google Scholar]
  11. Sakhno, O.V.; Goldenberg, L.M.; Stumpe, J.; Smirnova, T.N. Surface modified ZrO2 and TiO2 nanoparticles embedded in organic photopolymers for highly effective and UV-stable volume holograms. Nanotechnology 2007, 18. [Google Scholar] [CrossRef]
  12. Jamil, M.; Ahmad, F.; Rhee, J.T.; Jeon, Y.J. Nanoparticle-doped polymer-dispersed liquid crystal display. Curr. Sci. 2011, 101, 1544–1552. [Google Scholar]
  13. Juhl, A.T.; Busbee, J.D.; Koval, J.J.; Natarajan, L.V.; Tondiglia, V.P.; Vaia, R.A.; Bunning, T.J.; Braun, P.V. Holographically directed assembly of polymer nanocomposites. Acsnano 2010, 4, 5953–5961. [Google Scholar]
  14. Ostrowski, A.M.; Naydenova, I.; Toal, V. Light-induced redistribution of Si-MFI zeolite nanoparticles in acrylamide-based photopolymer holographic gratings. J. Opt. A Pure Appl. Opt. 2009, 11. [Google Scholar] [CrossRef]
  15. Liu, X. Photopolymerizable Metal Nanoparticle-/Semiconductor Quantum Dot-Polymer Nanocomposite Materials for Nonlinear Optics. Ph.D. Thesis, The University of Electro-Communications Tokyo, Tokyo, Japan, March 2012. [Google Scholar]
  16. Yovcheva, T.; Naydenova, I.; Sainov, S.; Toal, V.; Mintova, S. Holographic recording in corona charged acrylamide-based MFI-zeolite photopolymer. J. Nonlinear Opt. Phys. Mater. 2011, 20, 271–279. [Google Scholar] [CrossRef]
  17. Li, C.; Cao, L.; Yi, Y.; He, Q.; Jin, G. Plasmon-active mixed gratings in volume holographic polymeric nanocomposites. In Proceedings of Photonic Fiber and Crystal Devices: Advances in Materials and Innovations in Device Applications VII, San Diego, CA, USA, 25 August 2013.
  18. Budkevich, B.A.; Polikanin, A.M.; Pilipovich, V.A.; Petrochenko, N.Ya. Amplitude-phase hologram recording on FeCl3–PVA films. J. Appl. Spectrosc. 1989, 50, 621–624. [Google Scholar] [CrossRef]
  19. Manivannan, G.; Changkakoti, R.; Lessard, R.A. Cr (VI)- and Fe (III)-doped polymer systems as real-time holographic recording materials. Opt. Eng. 1993, 32, 671–675. [Google Scholar] [CrossRef]
  20. Bulinski, M.; Kuncser, V.; Plapcianu, C.; Krautwald, S.; Franke, H.; Rotaru, P.; Filoti, G. Optical and electric properties of polyvinyl alcohol doped with pairs of mixed valence metal ions. Rom. Rep. Phys. 2003, 5, 283–286. [Google Scholar]
  21. Olivares-Pérez, A.; Hernández-Garay, M.P.; Fuentes-Tapia, I.; Ibarra-Torres, J.C. Holograms in polyvinyl alcohol photosensitized with CuCl2 (2H2O). Opt. Eng. 2011, 50, 065801:1–065801:6. [Google Scholar]
  22. Hernández-Garay, M.P.; Olivares-Pérez, A.; Fuentes-Tapia, I. Characterization and evolution of electro-optical properties from holograms replication on polymer (PVA) with salts (FeCl3). In Proceedings of 5th International Workshop on Information Optics (WIO’06), Toledo, Spain, 5–7 June 2006; pp. 446–454.
  23. Skoog, D.A.; West, D.M.; Holler, F.J.; Crouch, S.R. Fundamentals of Analytical Chemistry; Thomson-Brooks/Cole: London, UK, 2004; pp. 500–560. [Google Scholar]
  24. Basolo, F.; Johnson, R. Química de los Compuestos de Coordinación; (in Spanish). Reverté: Barcelona, Spain, 1978; pp. 81–100. [Google Scholar]
  25. Hamzah, H.M.; Saion, E.; Kassim, A.; Yousuf Hussain, M.; Shahrim Mustafa, I.; Ahmad Ali Omer, M. Temperature dependence of AC electrical conductivity of PVA-PPy-FeCl3 composite polymer films. Malays. Polym. J. 2008, 3, 24–31. [Google Scholar]
  26. Van Renesse, R.L. Photopolymers in holography. Opt. Laser Technol. 1972, 4, 24–27. [Google Scholar] [CrossRef]
  27. De Sio, L.; Veltri, A.; Tedesco, A.; Caputo, R.; Umeton, C.; Sukhov, A.V. Characterization of an active control system for holographic setup stabilization. Appl. Opt. 2008, 47, 1363–1367. [Google Scholar] [CrossRef]
  28. Frejlich, J.; Cescato, L.; Mendes, G.F. Analysis of an active stabilization system for a holographic setup. Appl. Opt. 1988, 10, 1967–1976. [Google Scholar] [CrossRef]
  29. American Society for Testing and Materials. Standard Test Methods for D-C Resistance or Conductance of Moderately Conductive Materials; ASTM D4496-04; American Society for Testing and Materials: West Conshohocken, PA, USA, 2008. [Google Scholar]
  30. Hariharan, P. Basics of Holography; Cambridge University Press: London, UK, 2002; pp. 15–24. [Google Scholar]
  31. Kogelnik, H. Coupled wave theory for thick hologram gratings. Bell Syst. Tech. J. 1969, 48, 2909–2947. [Google Scholar] [CrossRef]
  32. Tawansi, A.; El-Khodary, A.; Abdelnaby, M.M. A study of the physical properties of FeCl3 filled PVA. Curr. Appl. Phys. 2005, 5, 572–578. [Google Scholar] [CrossRef]
  33. Fontanilla-Urdaneta, R.C.; Olivares-Pérez, A.; Fuentes-Tapia, I.; Ríos-Velasco, M.A. Analysis of voltage effect on holographic gratings by modulation transfer function. Appl. Opt. 2011, 50, 1827–1831. [Google Scholar] [CrossRef]
  34. Korneev, N.; Flores Ramirez, O.; Bertram, R.P.; Benter, N.; Soergel, E.; Buse, K.; Hagen, R.; Kostromine, S.G. Pyroelectric properties of electrically poled photoaddressable polymers. J. Appl. Phys. 2002, 92, 1500–1503. [Google Scholar]
  35. Kyritsis, A.; Pissis, P.; Gómez, R.J.L.; Monleón, P.M. Dielectric relaxation spectroscopy in PHEA hydrogels. J. Non Cryst. Solids 1994, 2, 1041–1046. [Google Scholar]
  36. Ricciardi, R.; Auriemma, F.; de Rosa, C.; Lauprêtre, F. X ray diffacction analysis of poly(vinyl alcohol) hydrogels, obtained by freezing and thawing techniques. Macromolecules 2004, 37, 1921–1927. [Google Scholar] [CrossRef]
  37. Willcox, P.J. Microesturcture of poly(vinyl alcohol) hydrogels produced by freeze/thaw cycling. J. Polym. Sci. Part B Polym. Phys. 1999, 37, 3438–3454. [Google Scholar] [CrossRef]
  38. Valentín, J.L.; López, D.; Hernández, R.; Mijangos, C.; Saalwächter, K. Structure of poly(vinyl alcohol) cryo-hydrogels as studied by proton low-field NMR spectroscopy. Macromolecules 2009, 42, 263–272. [Google Scholar] [CrossRef]
  39. Hassan, C.M.; Peppas, N. Structure and morphology of freeze/thawed PVA hydrogels. Macromlecules 2000, 33, 2472–2479. [Google Scholar] [CrossRef]
  40. Mishra, R.; Rao, K.J. Electrical conductivity studies of poly (ethylene oxide) poly (vinylalcohol) blends. Solid State Ionics. 1998, 106, 113–127. [Google Scholar] [CrossRef]
  41. Awadhia, A.; Patel, S.K.; Agrawal, S.L. Dielectric investigation in PVA based gel electrolytes. Prog. Cryst. Growth Charact. Mater. 2006, 52, 61–68. [Google Scholar] [CrossRef]
  42. Trieu, H.H.; Qutubuddin, S. Polyvinyl alcohol hydrogels I. Microscopic structure by freeze-etching and critical point drying technique. Colloid Polym. Sci. 1994, 272, 301–309. [Google Scholar] [CrossRef]
  43. Singh, K.P.; Gupta, P.N. Study of dielectric relaxation in polymer electrolytes. Eur. Polym. J. 1998, 34, 1023–1029. [Google Scholar] [CrossRef]
  44. Londoño, M.E.; Jaramillo, J.M. Dielectric behavior of poly(vinyl alcohol) hydrogels preparing by freezing/thawing technique. Revista EIA 2011, 165, 132–137. [Google Scholar]
  45. The Chemistry of Ferric Chloride. Available online: http://www.artmondo.net/printworks/articles/ferric.htm (accessed on 7 March 2014).
  46. Sherman, D.M. Electronic structures of Fe3+ coordination sites in iron oxides: Applications to spectra, bonding and magnetism. Phys. Chem. Miner. 1985, 12, 161–175. [Google Scholar] [CrossRef]
  47. Sherman, D.M. Molecular orbital (SCF-X-SW) theory of Fe2+-Mn3+, Mn2+-Fe3+ and Fe3+-Mn3+ charge transfer and magnetic exchange interactions in oxides and silicates. Am. Mineral. 1990, 75, 256–261. [Google Scholar]
  48. Sherman, D.M.; Waite, T.D. Electronic spectra of Fe3+ oxides and oxide hydroxides in the near-IR to near-UV. Am. Mineral. 1985, 70, 1262–1269. [Google Scholar]
  49. Hudson, R.J.; Covault, D.T.; Morel, F.M. Investigations of iron coordination and redox reactions in seawater using 59Fe radiometry and ion-pair solvent extraction of amphiphilic iron complexes. Mar. Chem. 1992, 38, 209–235. [Google Scholar] [CrossRef]
  50. Richards, D.H.; Sykes, K.W. Ionic association and reaction rates. Part I. A spectrophotometric study of the hydrolysis of iron (III). J. Chem. Soc. 1960, 1960, 3626–3633. [Google Scholar] [CrossRef]
  51. Balt, S.; Verwey, A.M.A. Electronicspectra and ligandfieldparameters in chloroaquoiron (III) complexes. Spectrochim. Mol. Spectrosc. 1967, 23, 2069–2075. [Google Scholar] [CrossRef]
  52. Heistand, R.N.; Clearfield, A. The effect of specific swamping electrolyte supon the formation constant of the monochloro iron (III) complex. J. Am. Chem. Soc. 1963, 85, 2566–2570. [Google Scholar] [CrossRef]
  53. Knight, R.J.; Sylva, R.N. Spectrophotometric investigation of iron (III) hydrolysis in light and heavy water at 25 °C. J. lnorg. Nucl. Chem. 1975, 37, 779–783. [Google Scholar] [CrossRef]
  54. Silverman, J.; Dodson, R.W. The exchange reaction between the two oxidation states of iron in acid solution. J. Phys. Chem. 1952, 56, 846–852. [Google Scholar] [CrossRef]
  55. Schugar, H.J. The structure of iron (III) in aqueous solution. J. Am. Chem. Soc. 1967, 89, 3712–3720. [Google Scholar] [CrossRef]
  56. Faust, B.C.; Hoigne, J. Photolysis of Fe (III)-hydroxy complexes as sources of OH radicals in clouds, fog and rain. Atmos. Environ. Part A Gen. Top. 1990, 24, 79–89. [Google Scholar] [CrossRef]
  57. Sherman, D.M. Electronic structures of iron(III) and manganese(IV) (hydr)oxide minerals: Thermodynamics of photochemical reductive dissolution in aquatic environments. Geochim. et Cosmochim. Acta. 2005, 69, 3249–3255. [Google Scholar] [CrossRef]
  58. Collienne, R.J. Photoreduction of iron in the epilimn ion of acidic lakes. Limnol. Oceanogr. 1983, 28, 83–100. [Google Scholar] [CrossRef]
  59. Mc Knight, D.M.; Kimball, B.A.; Bencala, K.E. Iron photoreduction and oxidation in an acidic mountain stream. Science 1988, 240, 637–640. [Google Scholar]
  60. Turner, R.C.; Kathleen, E.M. The ultraviolet absorption spectra of the ferric ion and its first hydrolysis product in aqueous solutions. Can. J. Chem. 1957, 35, 1002–1009. [Google Scholar] [CrossRef]
  61. Evans, M.G.; Santappa, M.; Uri, N. Photoinitiated free radical polymerization of vinyl compounds in aqueous solution. J. Polym. Sci. 1951, 7, 243–260. [Google Scholar] [CrossRef]
  62. Feng, W.; Nansheng, D. Photochemistry of hydrolytic iron (III) species and photoinduced degradation of organic compounds. Chemosphere 2000, 41, 1137–1147. [Google Scholar] [CrossRef]
  63. Bates, H.G.; Uri, N. Oxidation of aromatic compounds in aqueous solution by free radicals produced by photo-excited electron transfer in iron complexes. J. Am. Chem. Soc. 1953, 75, 2754–2759. [Google Scholar] [CrossRef]
  64. Mukherjee, A.R.; Ghosh, P.; Chadha, S.C.; Palit, S.R. End group studies in poly (methyl methacrylate) initiated by redox systems containing reducing sulfoxy compounds in aqueous media. Die Makromol. Chem. 1966, 97, 202–208. [Google Scholar] [CrossRef]
  65. David, F.; David, P.G. Photoredox chemistry of iron(llI) chloride and iron(llI) perchlorate in aqueous media. A comparative study. J. Phys. Chem. 1976, 80, 579–583. [Google Scholar] [CrossRef]
  66. Nadtochenko, V.A.; Kiwi, J. Photolysis of FeOH2+ and FeCl2+ in aqueous solution. Photodissociation kinetics and quantum yields. Inorg. Chem. 1998, 37, 5233–5238. [Google Scholar] [CrossRef]
  67. Balzani, V.; Carassiti, V. Photochemistry of Coordination Compounds; Academic Press: London, UK, 1970. [Google Scholar]
  68. Horvath, O.; Stevenson, K. Charge-Transfer Photochemistry of Coordination Compounds; VCH: Weinheim, Germany, 1993. [Google Scholar]
  69. Hasinoff Brian, B. The kinetic activation volumes for the binding of chloride to iron(III), studied by means of a high pressure laser temperatura jump apparatus. Can. J. Chem. 1976, 54, 1820–1826. [Google Scholar] [CrossRef]
  70. Byrne, R.; Kester, D.J. Ultraviolet spectroscopic study of ferric hydroxide complexation. J. Solut. Chem. 1978, 7, 373–383. [Google Scholar] [CrossRef]
  71. Byrne, R.; Kester, D.J. Ultraviolet spectroscopic study of ferric equilibria at high chloride concentrations. J. Solut. Chem. 1981, 10, 51–67. [Google Scholar] [CrossRef]
  72. Polikanin, A.M.; Budkevich, B.A. Photochemical processes in the iron (III) chloride-dye-binder system. J. Appl. Spectrosc. 1993, 59, 699–704. [Google Scholar] [CrossRef]
  73. Oster, G.K.; Oster, G. Photoreduction of metal ions by visible light. J. Am. Chem. Soc. 1959, 81, 5543–5545. [Google Scholar] [CrossRef]
  74. Toshima, N.; Hara, S. Direct synthesis of conducting polymers from simple monomers. Prog. Polym. Sci. 1995, 20, 155–183. [Google Scholar] [CrossRef]
  75. Shirakawa, H.; Louis, E.J.; Diarmid, A.G.; Chiang, A.G.; Heeger, A.J. Synthesis of electrically conducting organic polymers: Halogen derivatives of polyacetylene, (CH)x. J. Chem. Soc. Chem. Commun. 1977, 474, 578–580. [Google Scholar]
  76. Dutta, P.; Biswas, S.; Ghosh, M.; De, S.K.; Chatterjee, S. The DC and AC conductivity of polyaniline–polyalcohol blends. Synth. Met. 2000, 122, 455–461. [Google Scholar]
  77. Kukhtarev, N.V.; Markov, V.B.; Odulov, S.G.; Soskin, M.S.; Vinetskii, V.L. Holographic storage in electrooptic crystals. Ferroelectrics 1978, 22, 949–960. [Google Scholar] [CrossRef]
  78. De Oliveira, H.P.; dos Santos, M.V.P.; dos Santos, C.G.; de Melo, C.P. Preparation and electrical and dielectric characterization of PVA/PPY blends. Mater. Charact. 2003, 50, 223–226. [Google Scholar] [CrossRef]

