Finite Element Analysis for Fatigue Damage Reduction in Metallic Riveted Bridges Using Pre-Stressed CFRP Plates

 ,
,
Abstract
:1. Introduction
2. Modeling Methods
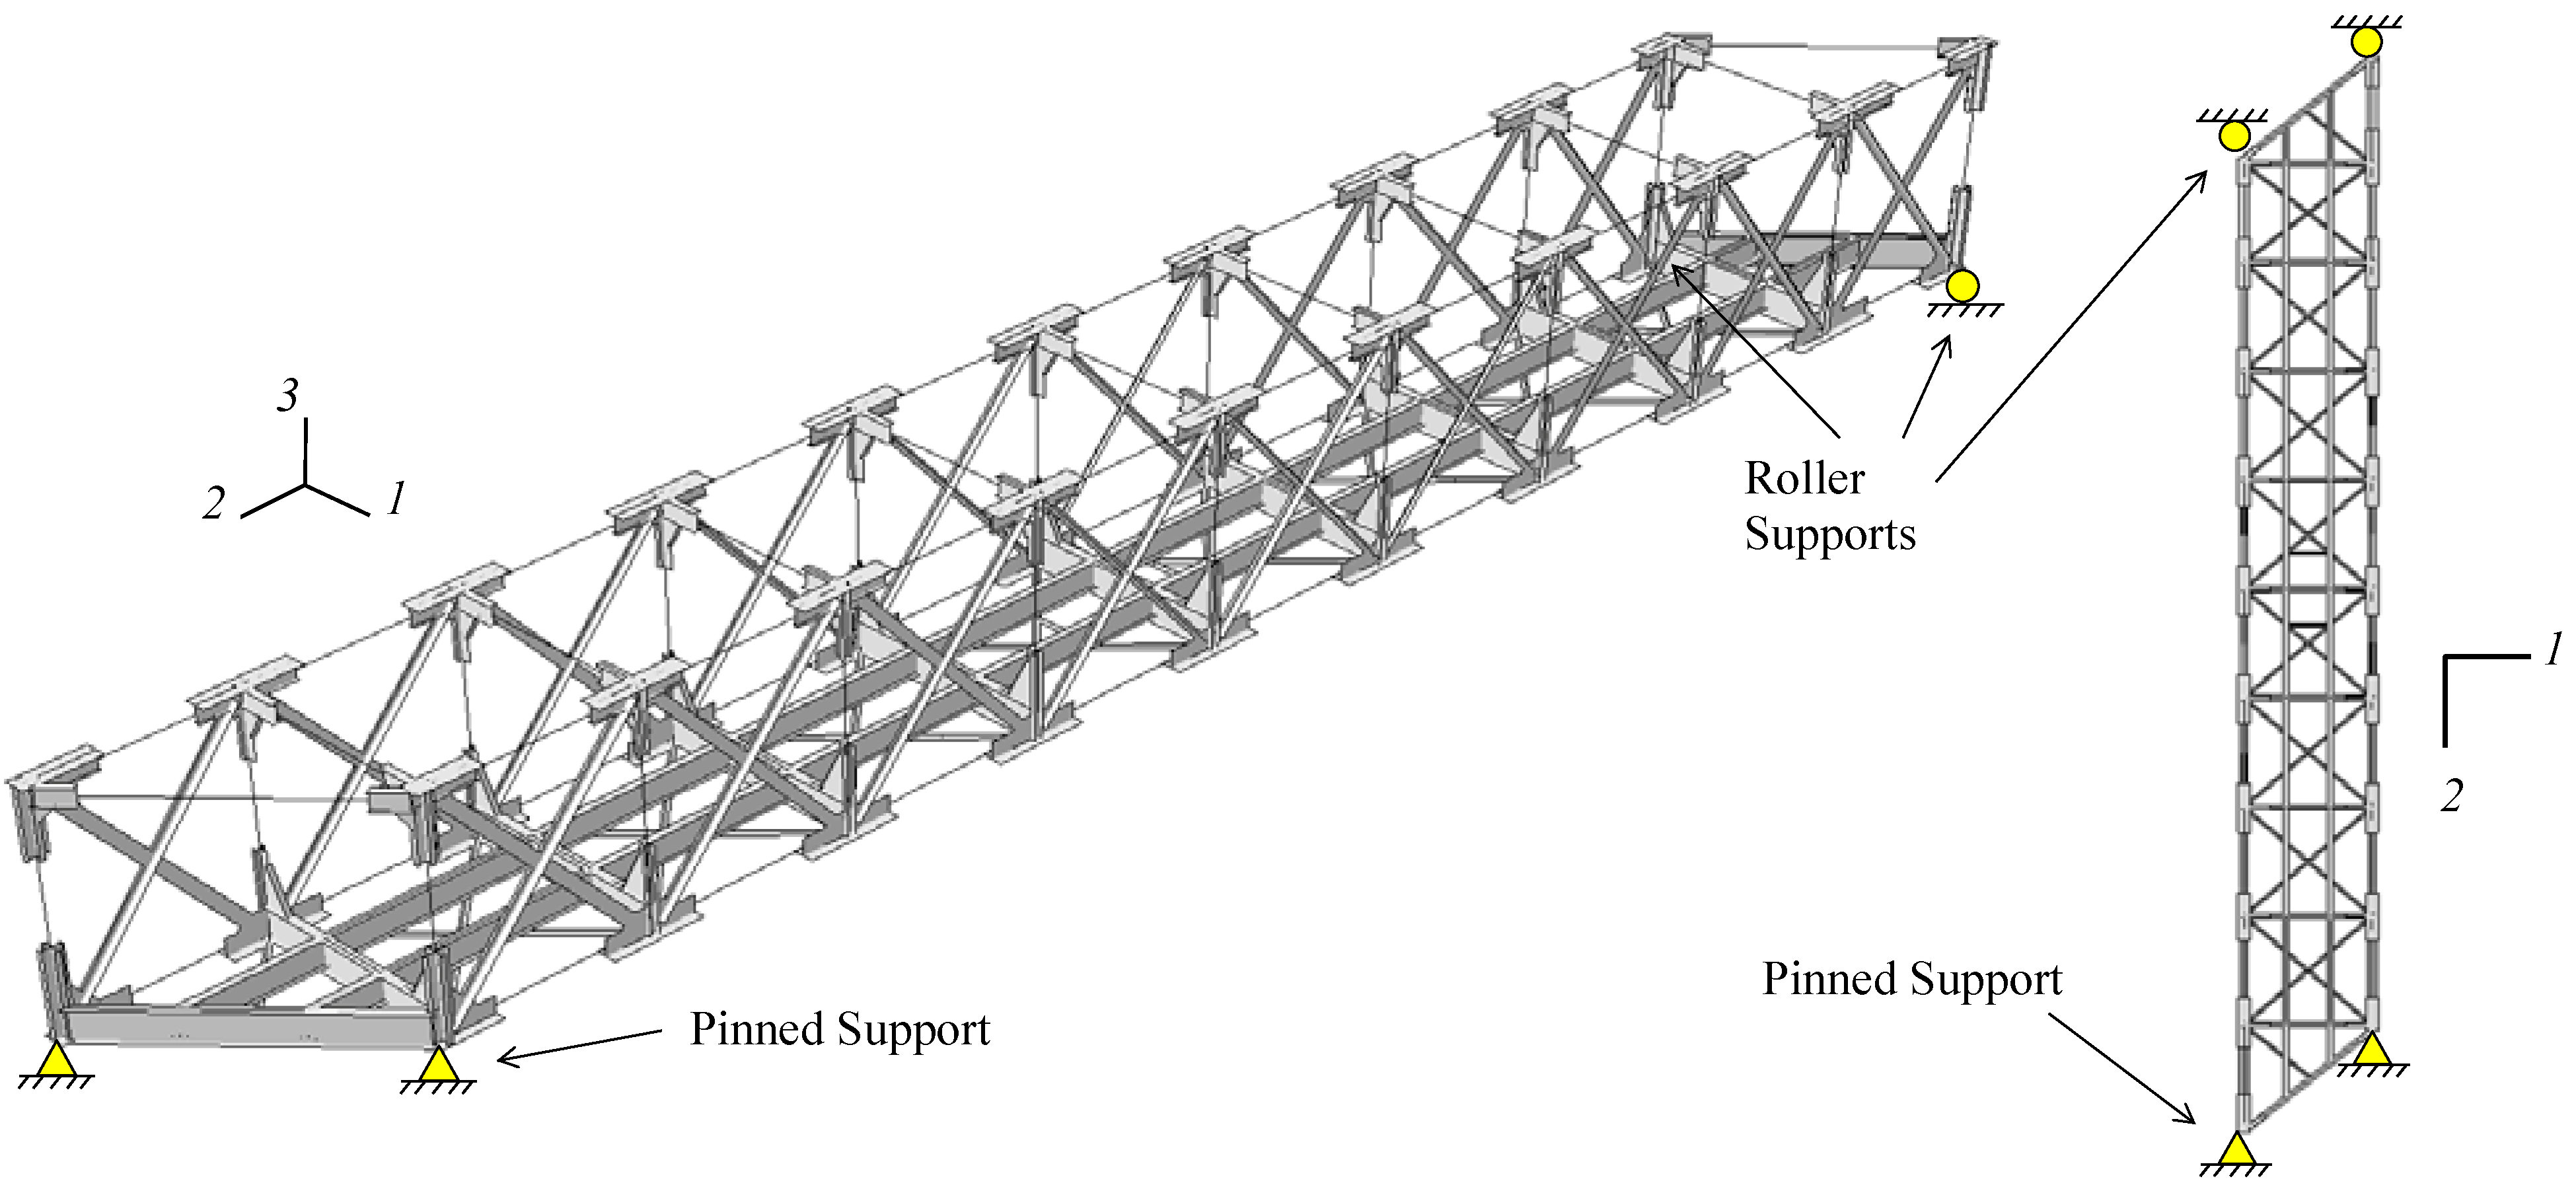
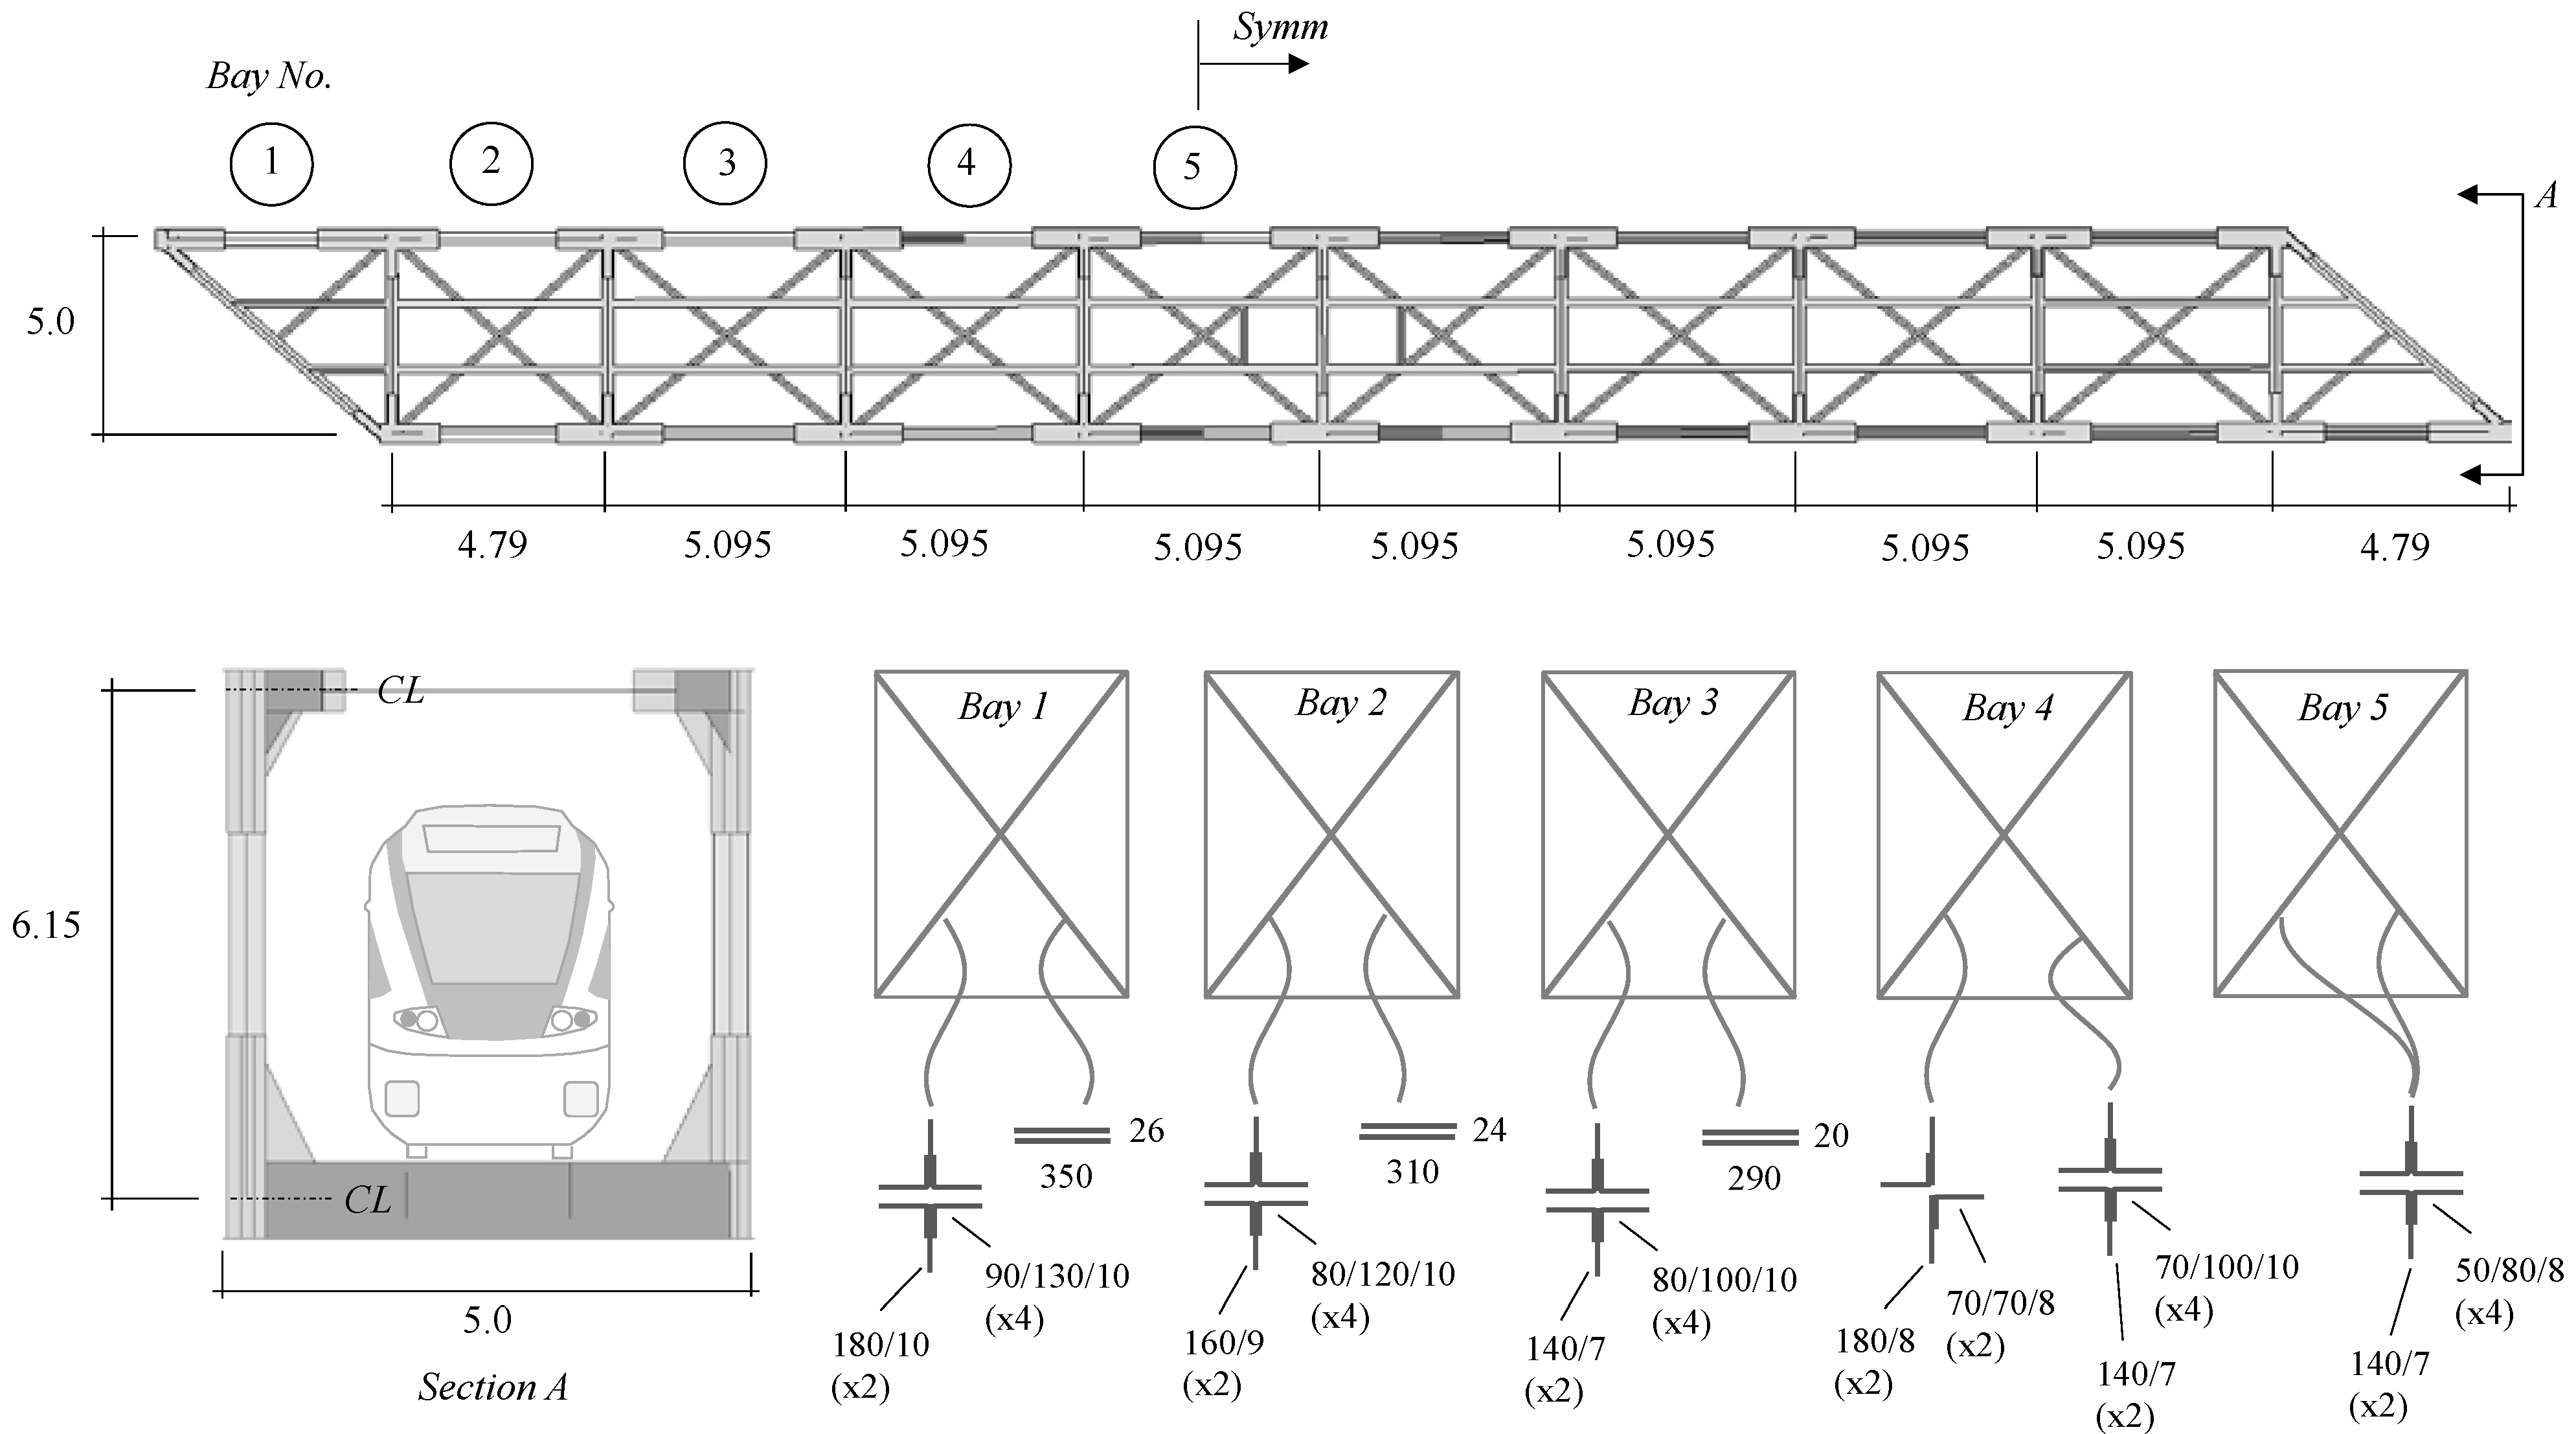
2.1. Global Model
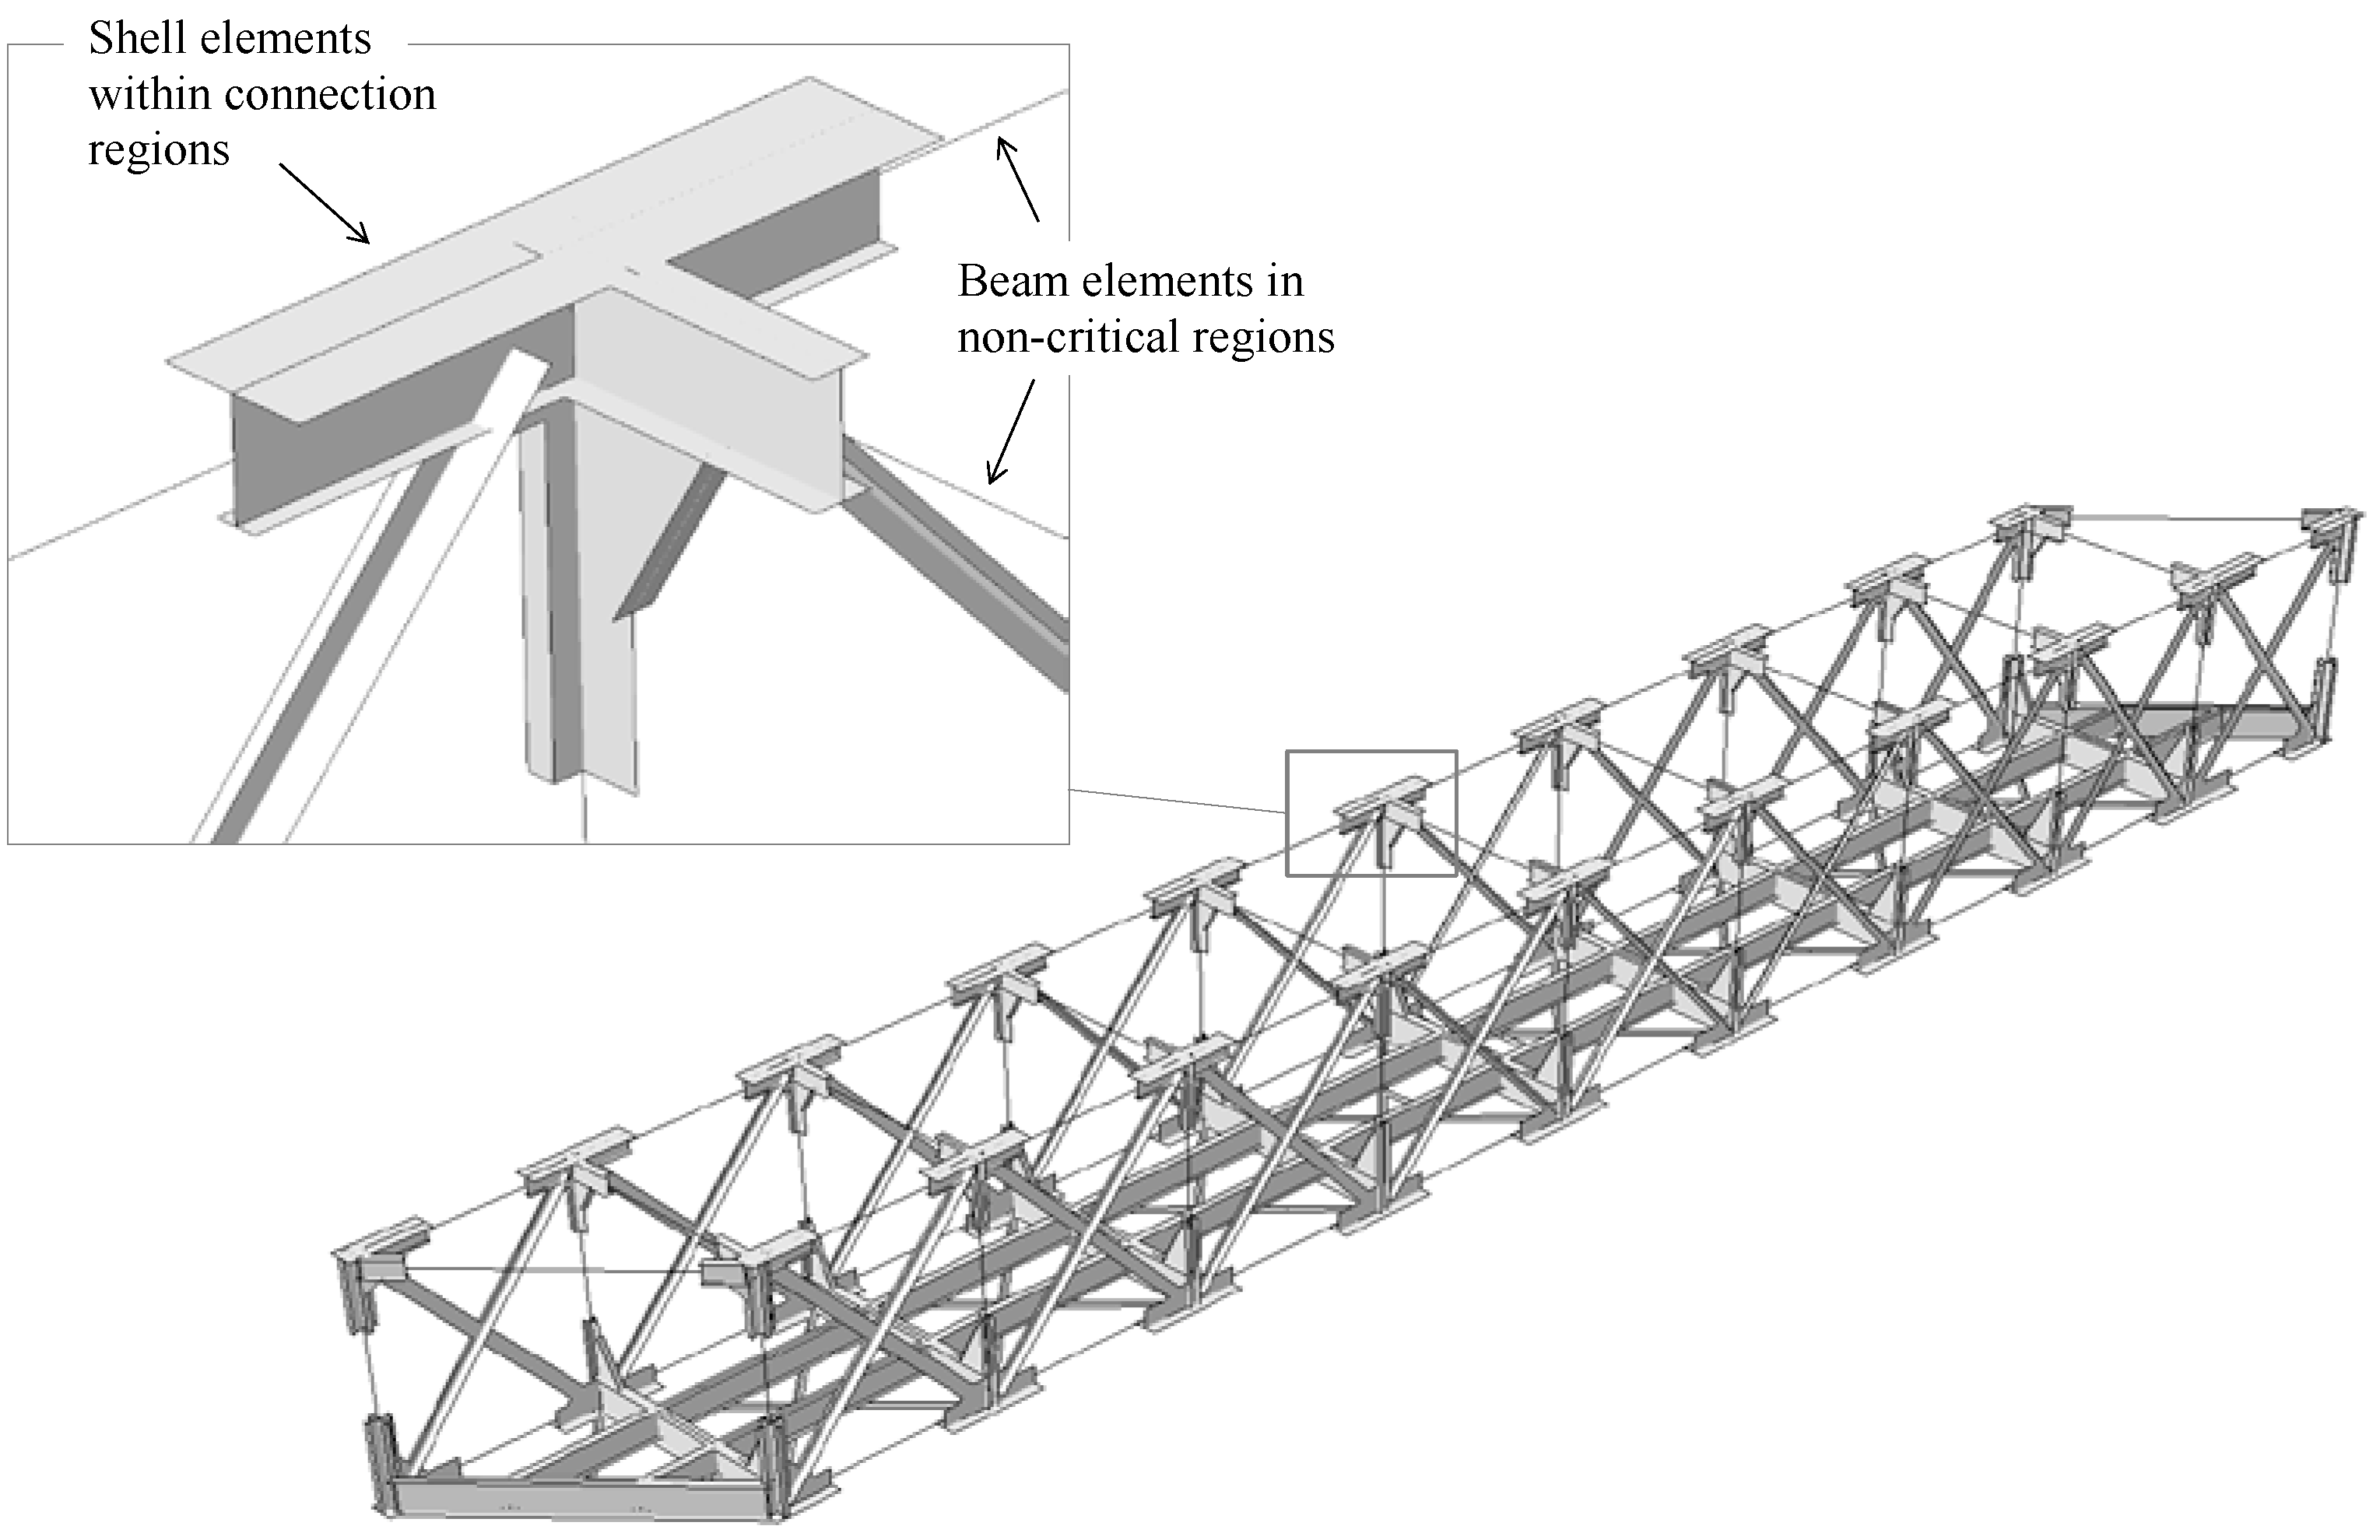
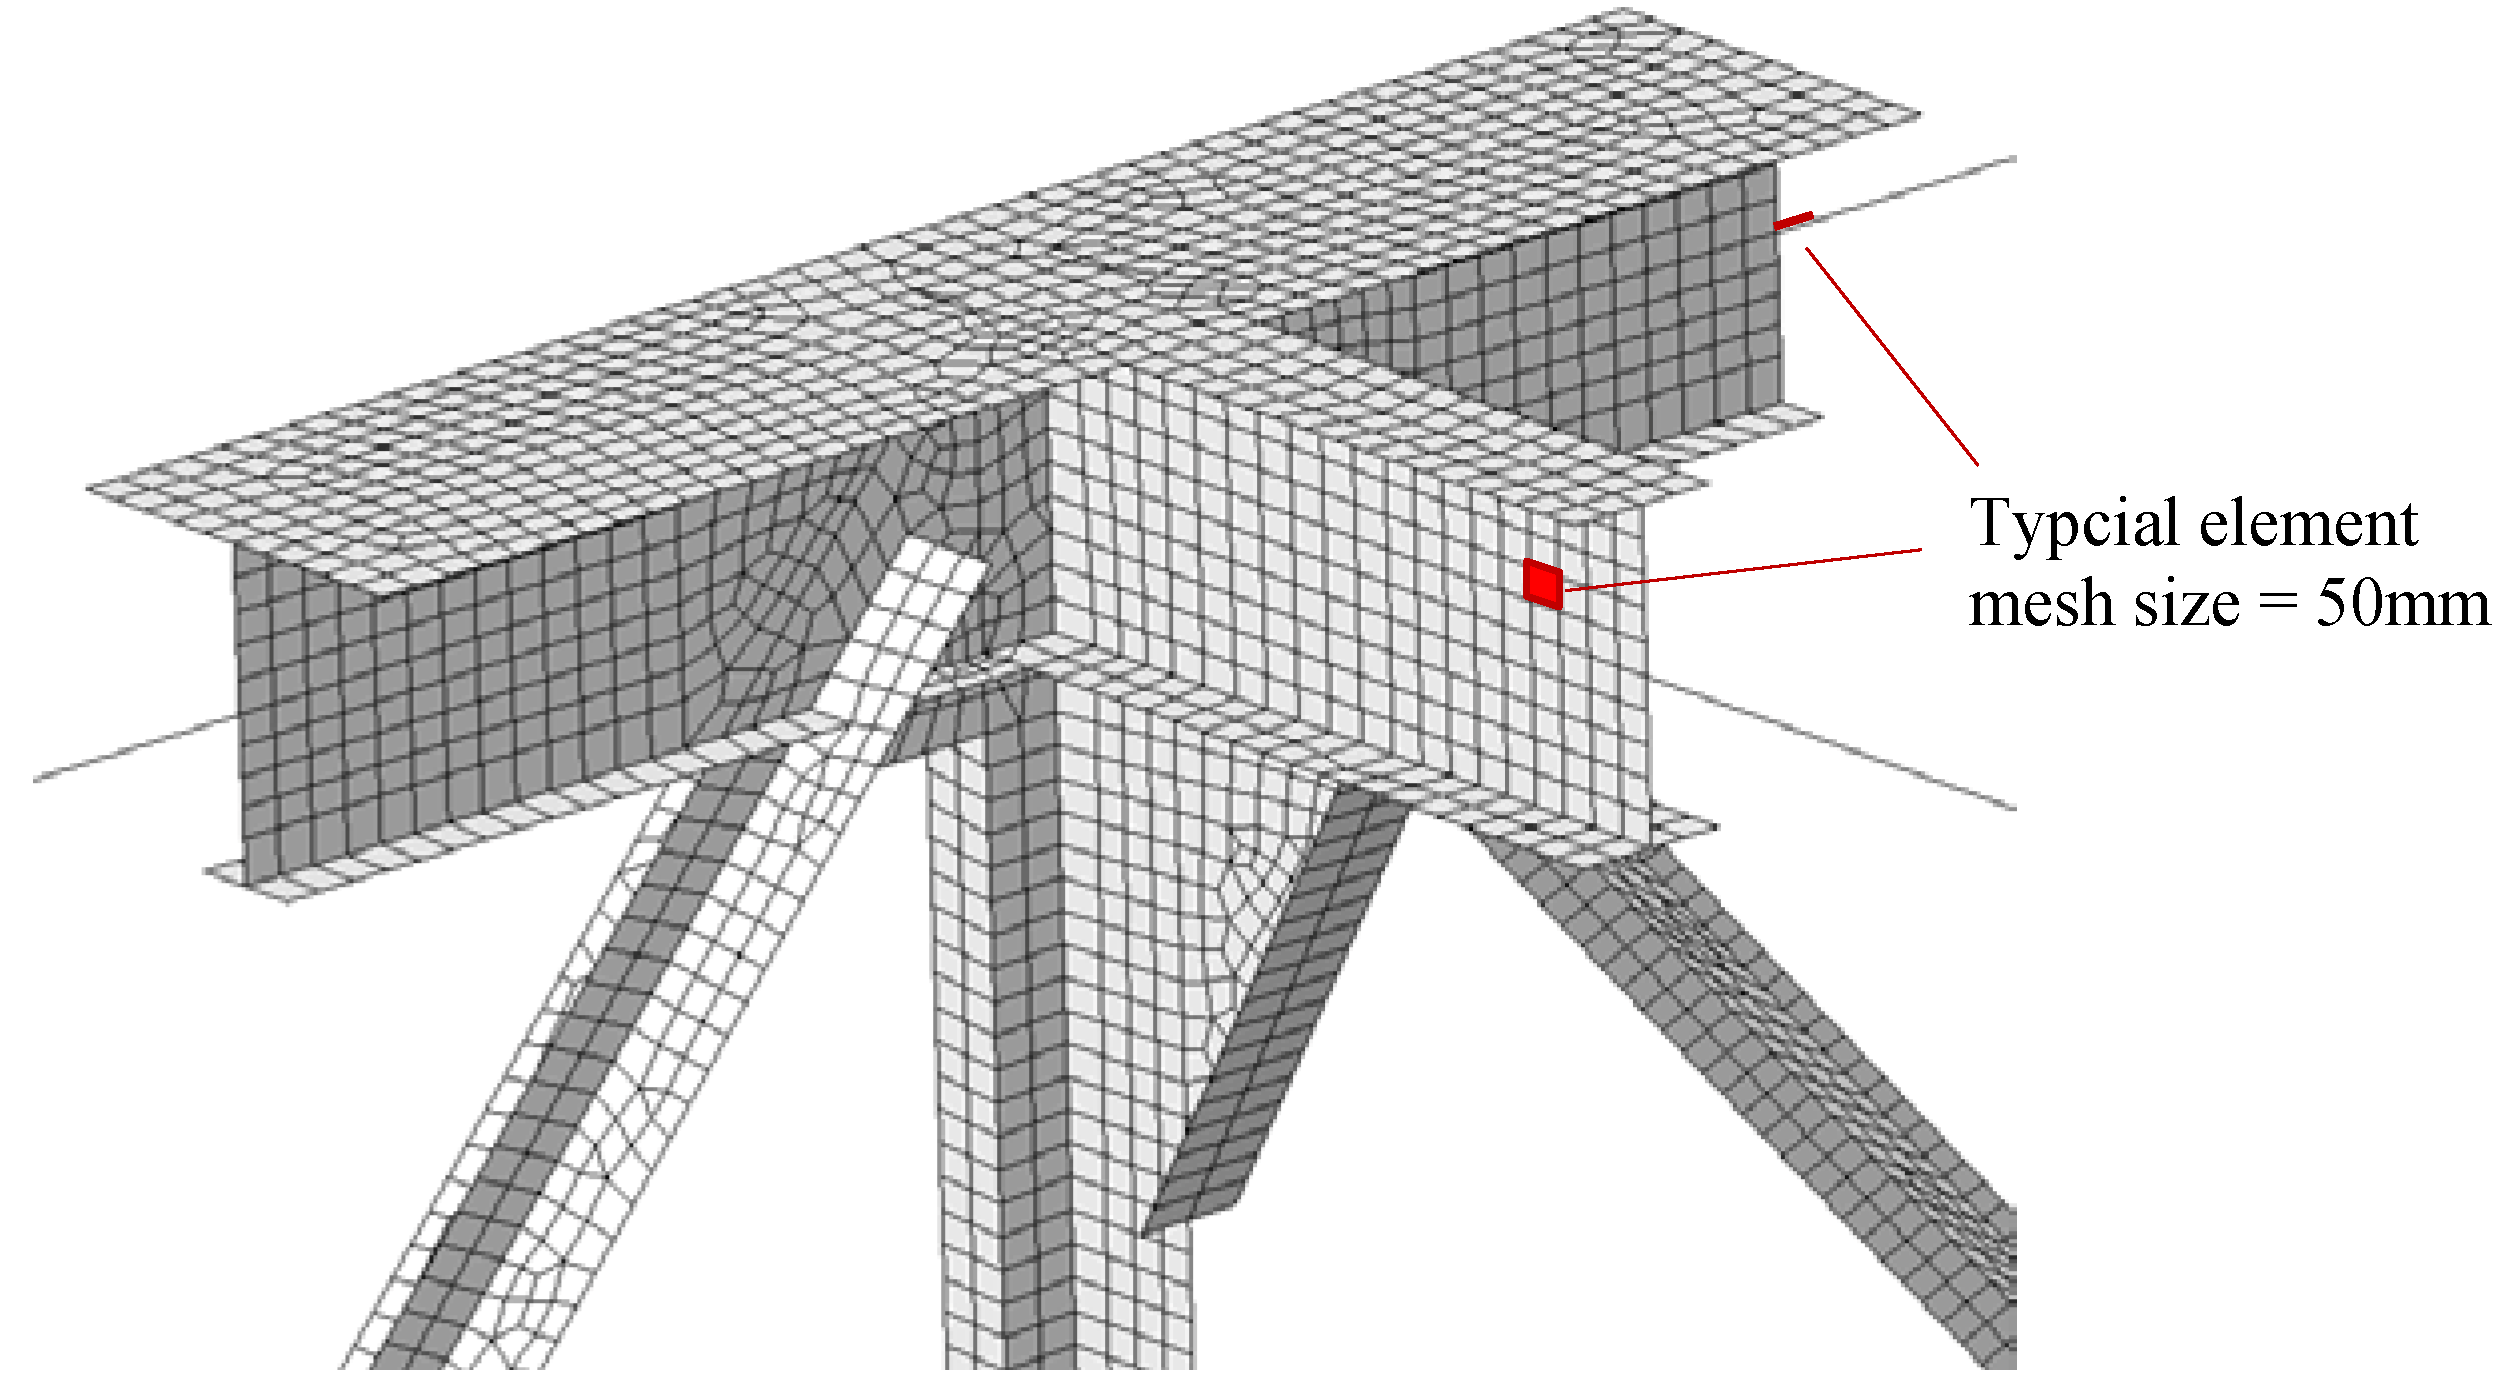
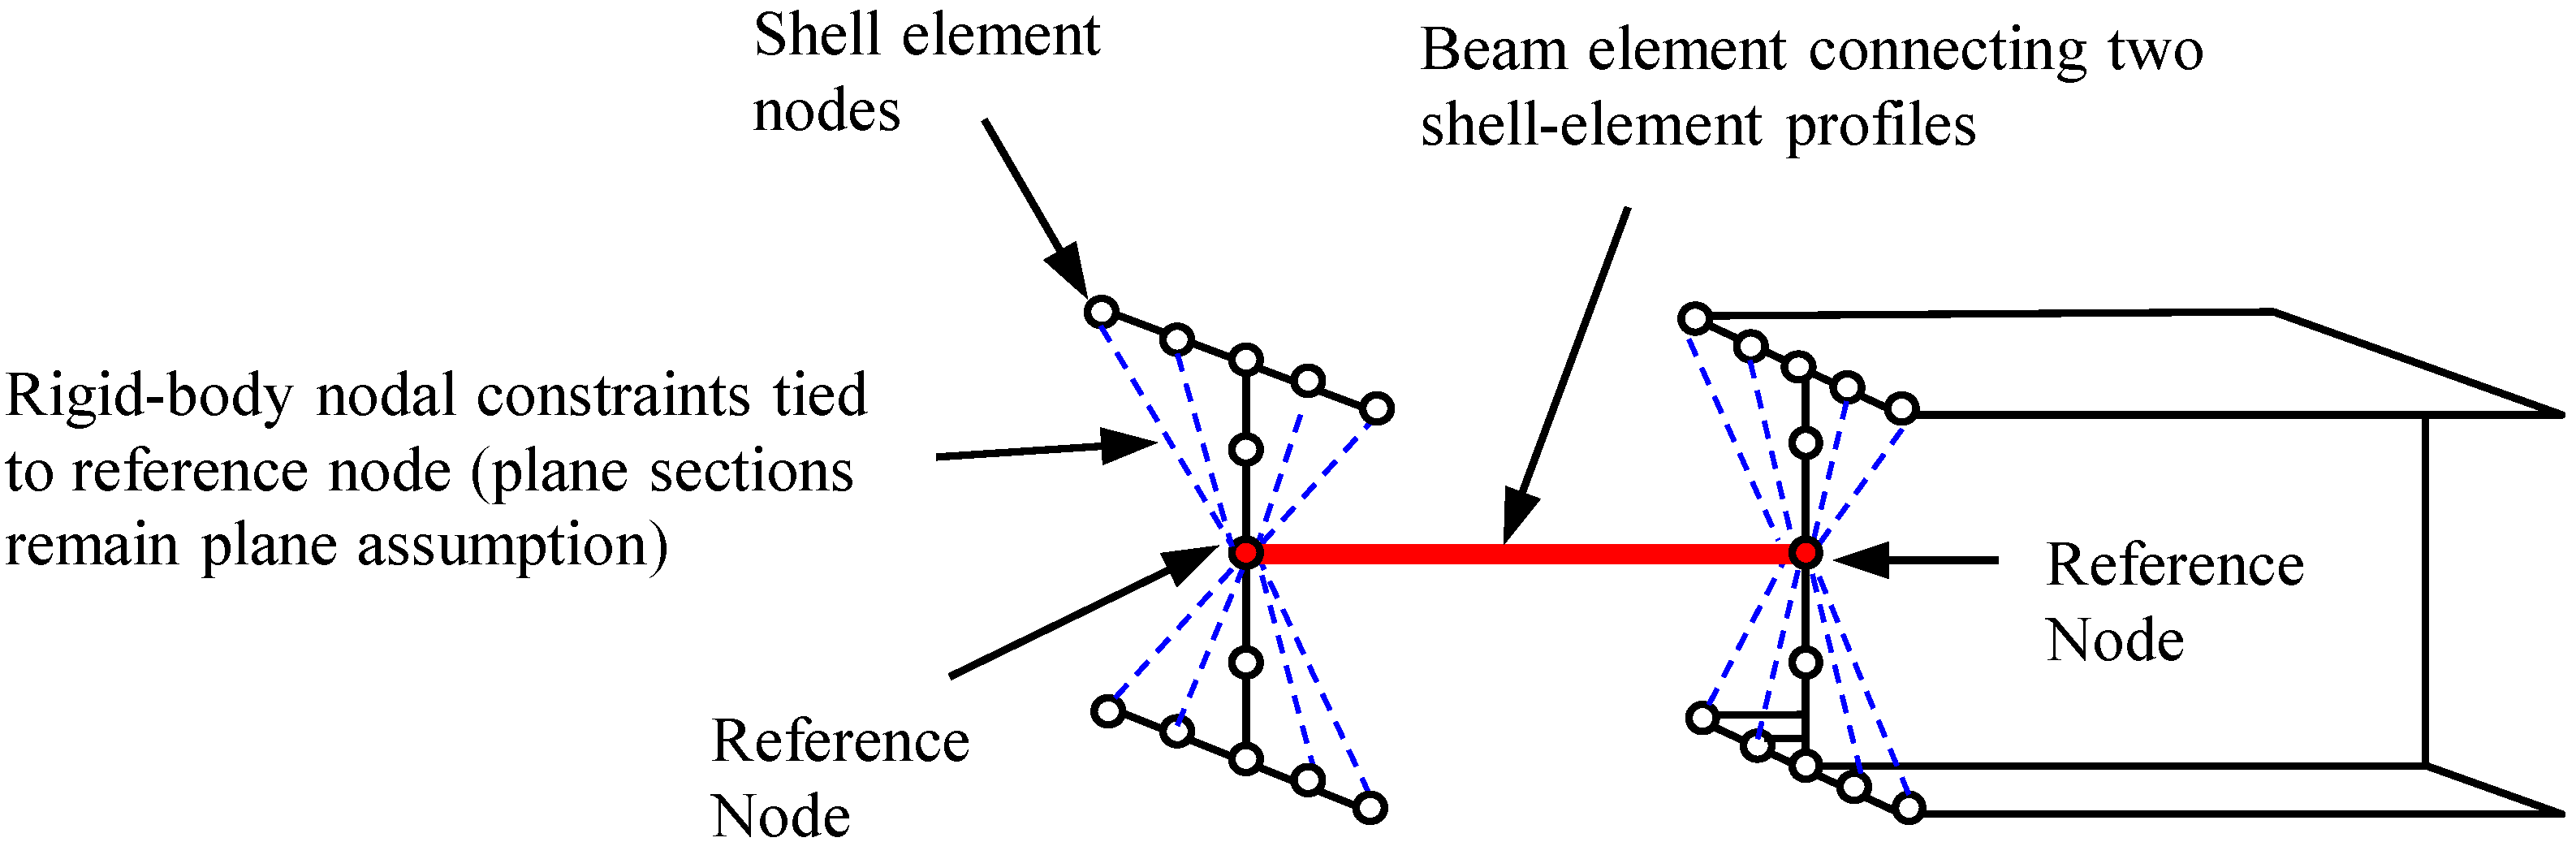
2.1.1. Geometry and Element Type


2.1.2. Mesh and Boundary Conditions


2.1.3. Material Properties
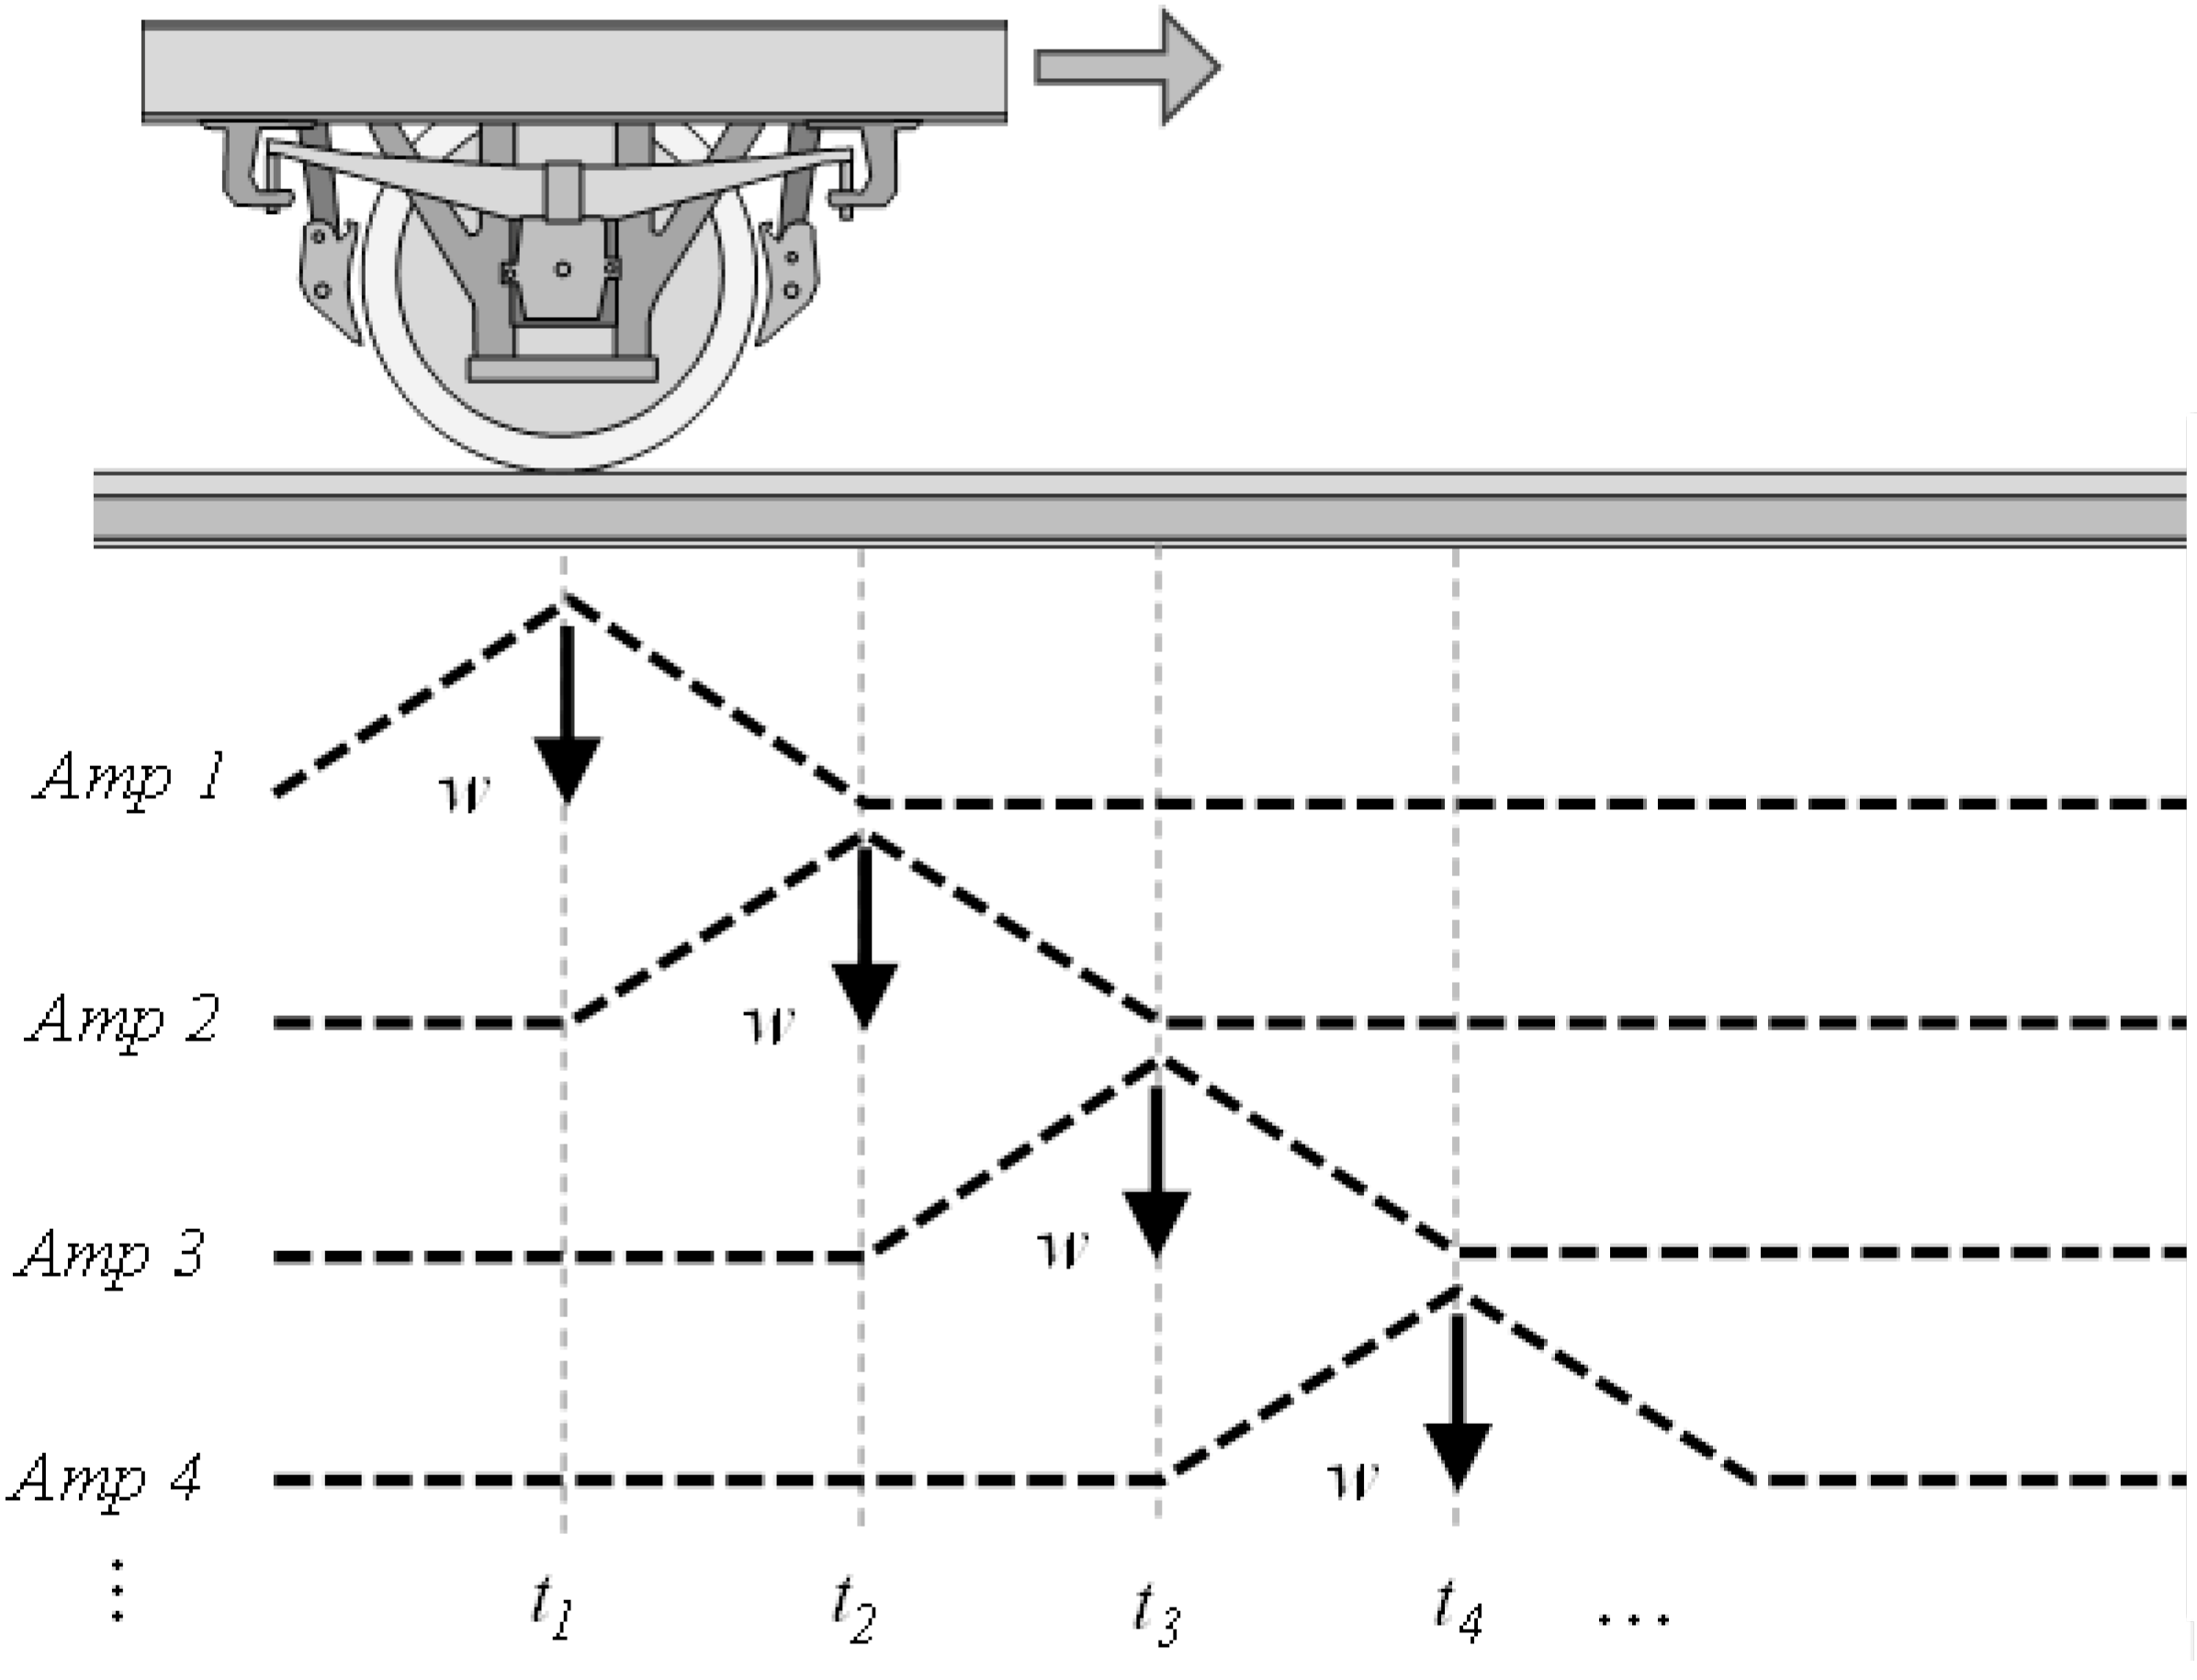
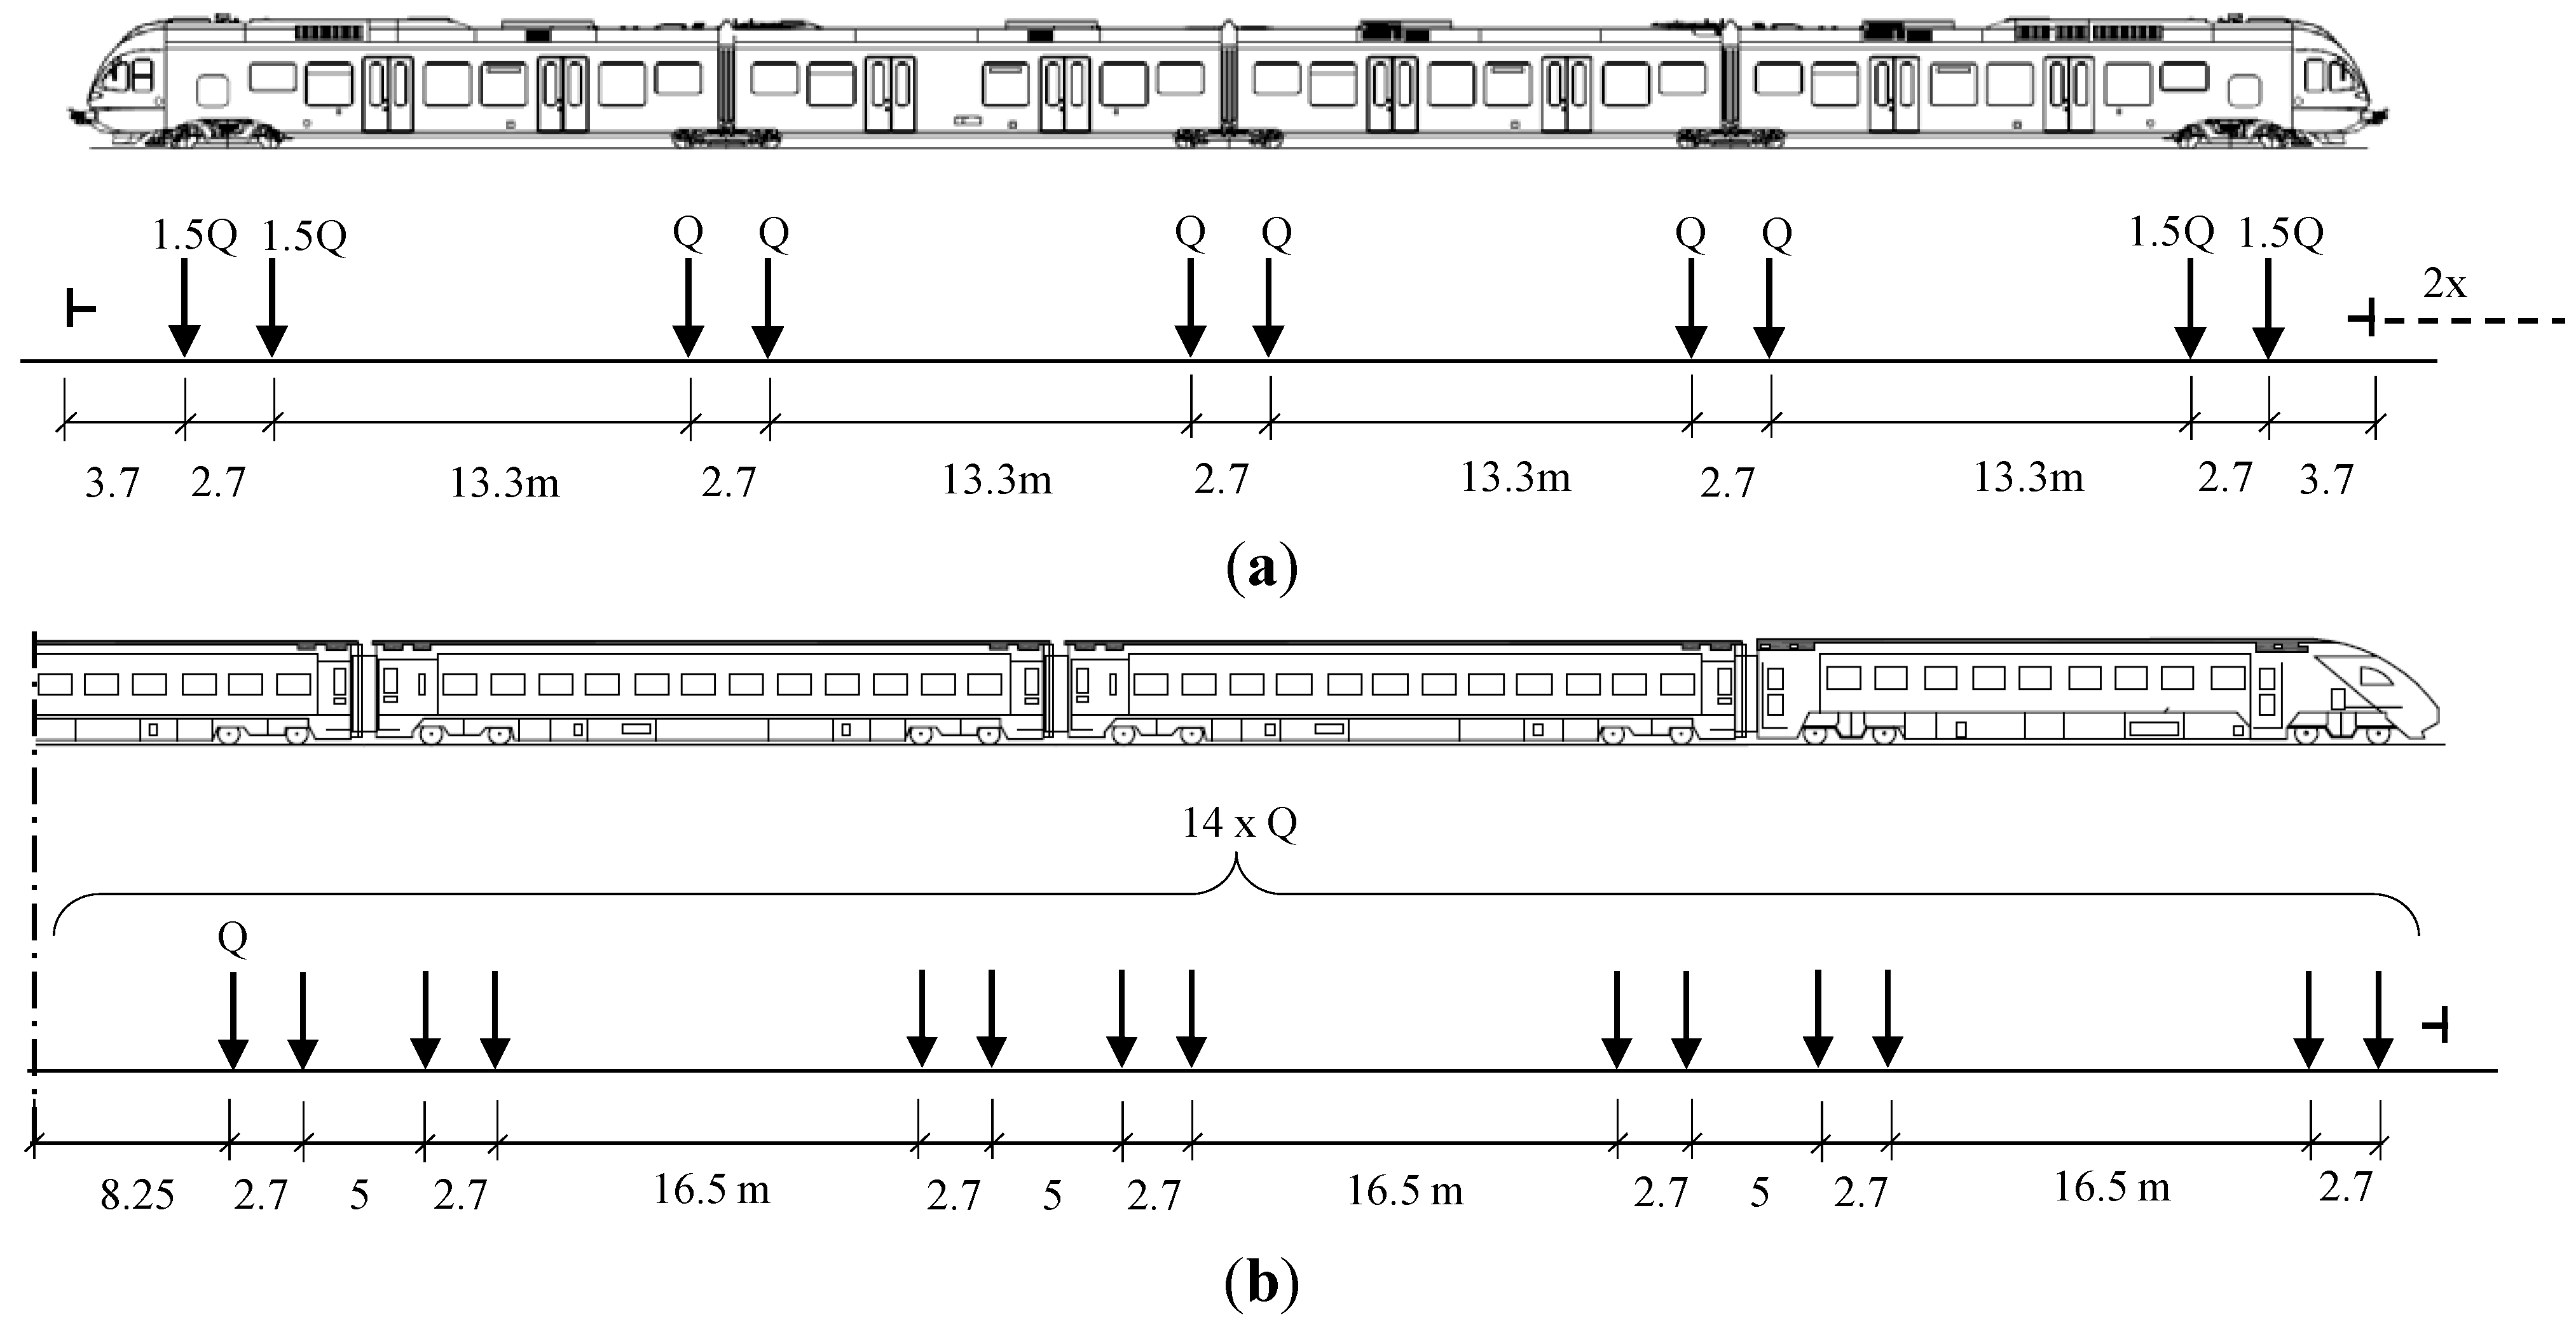
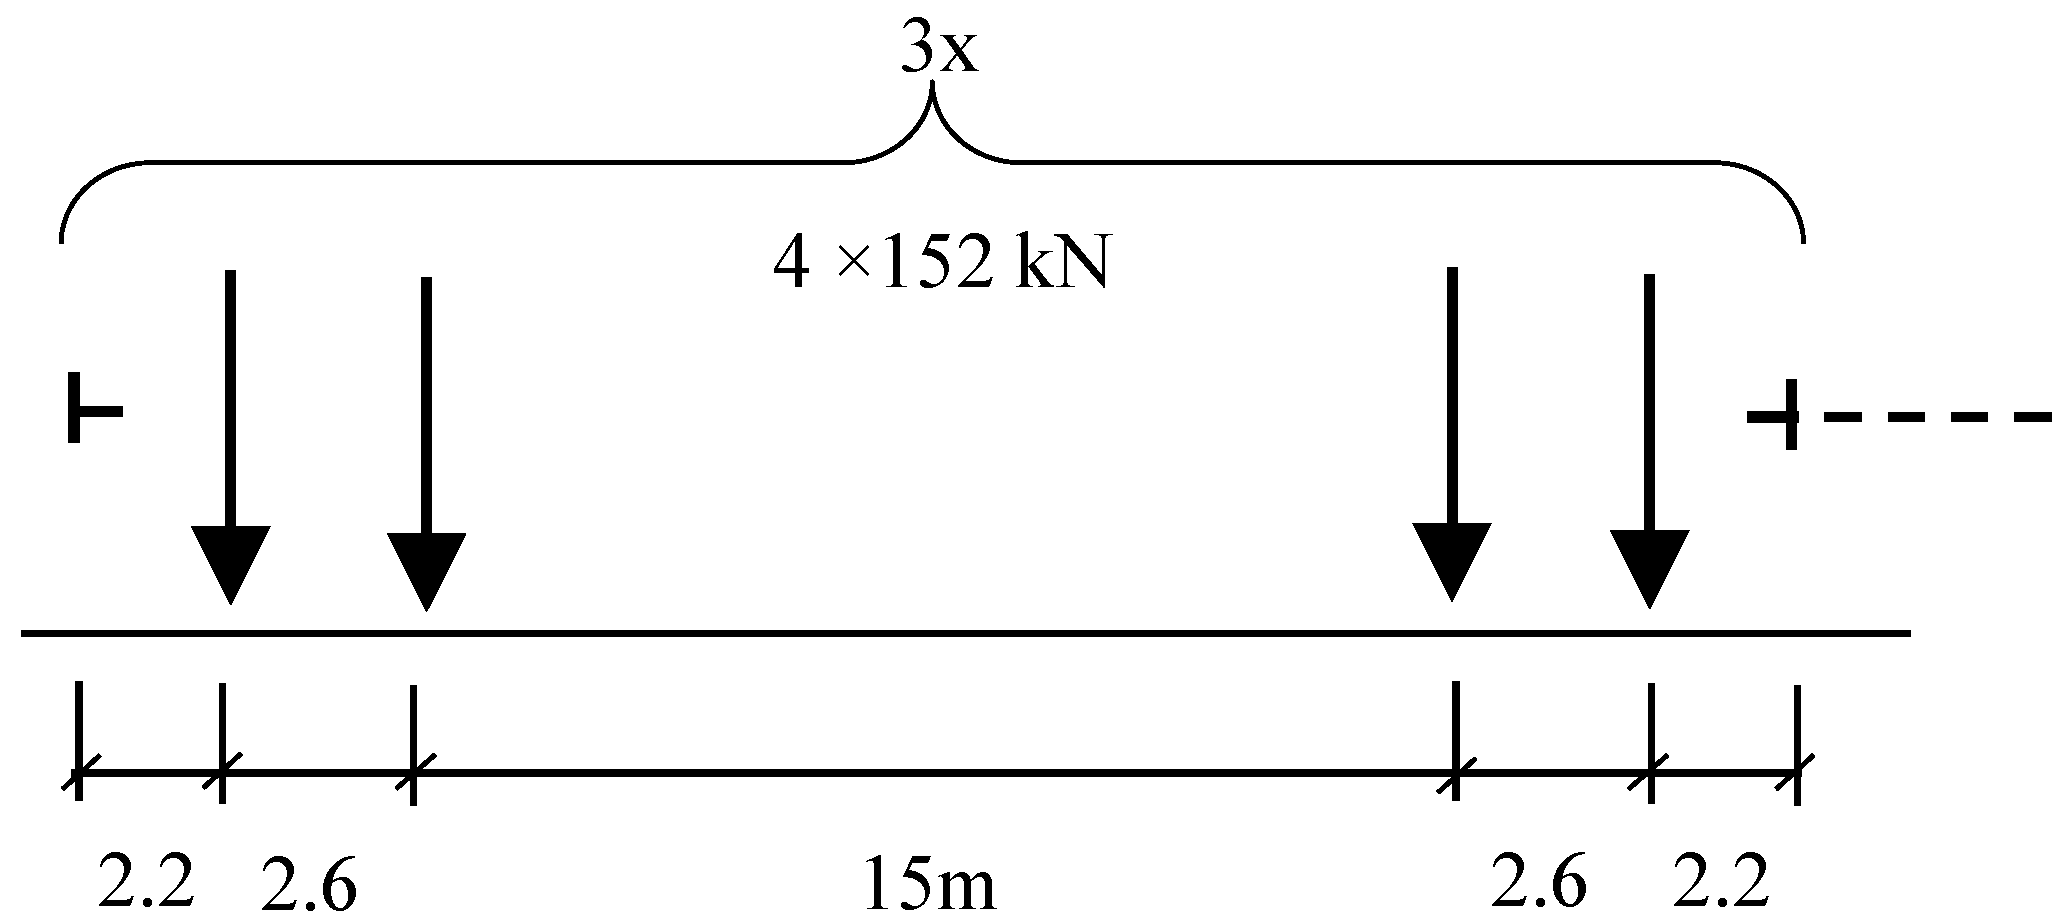
2.1.4. Loading


| S3 | Empty | Full | Unit |
|---|---|---|---|
| Front axle load (1.5 Q) | 150 | 195.8 | kN |
| Rear axle load (Q) | 100 | 130.5 | kN |
| ICN | Empty | Full | Unit |
| Total mass | 359 | 421 | Ton |
| Axle load (Q) | 128 | 150 | kN |
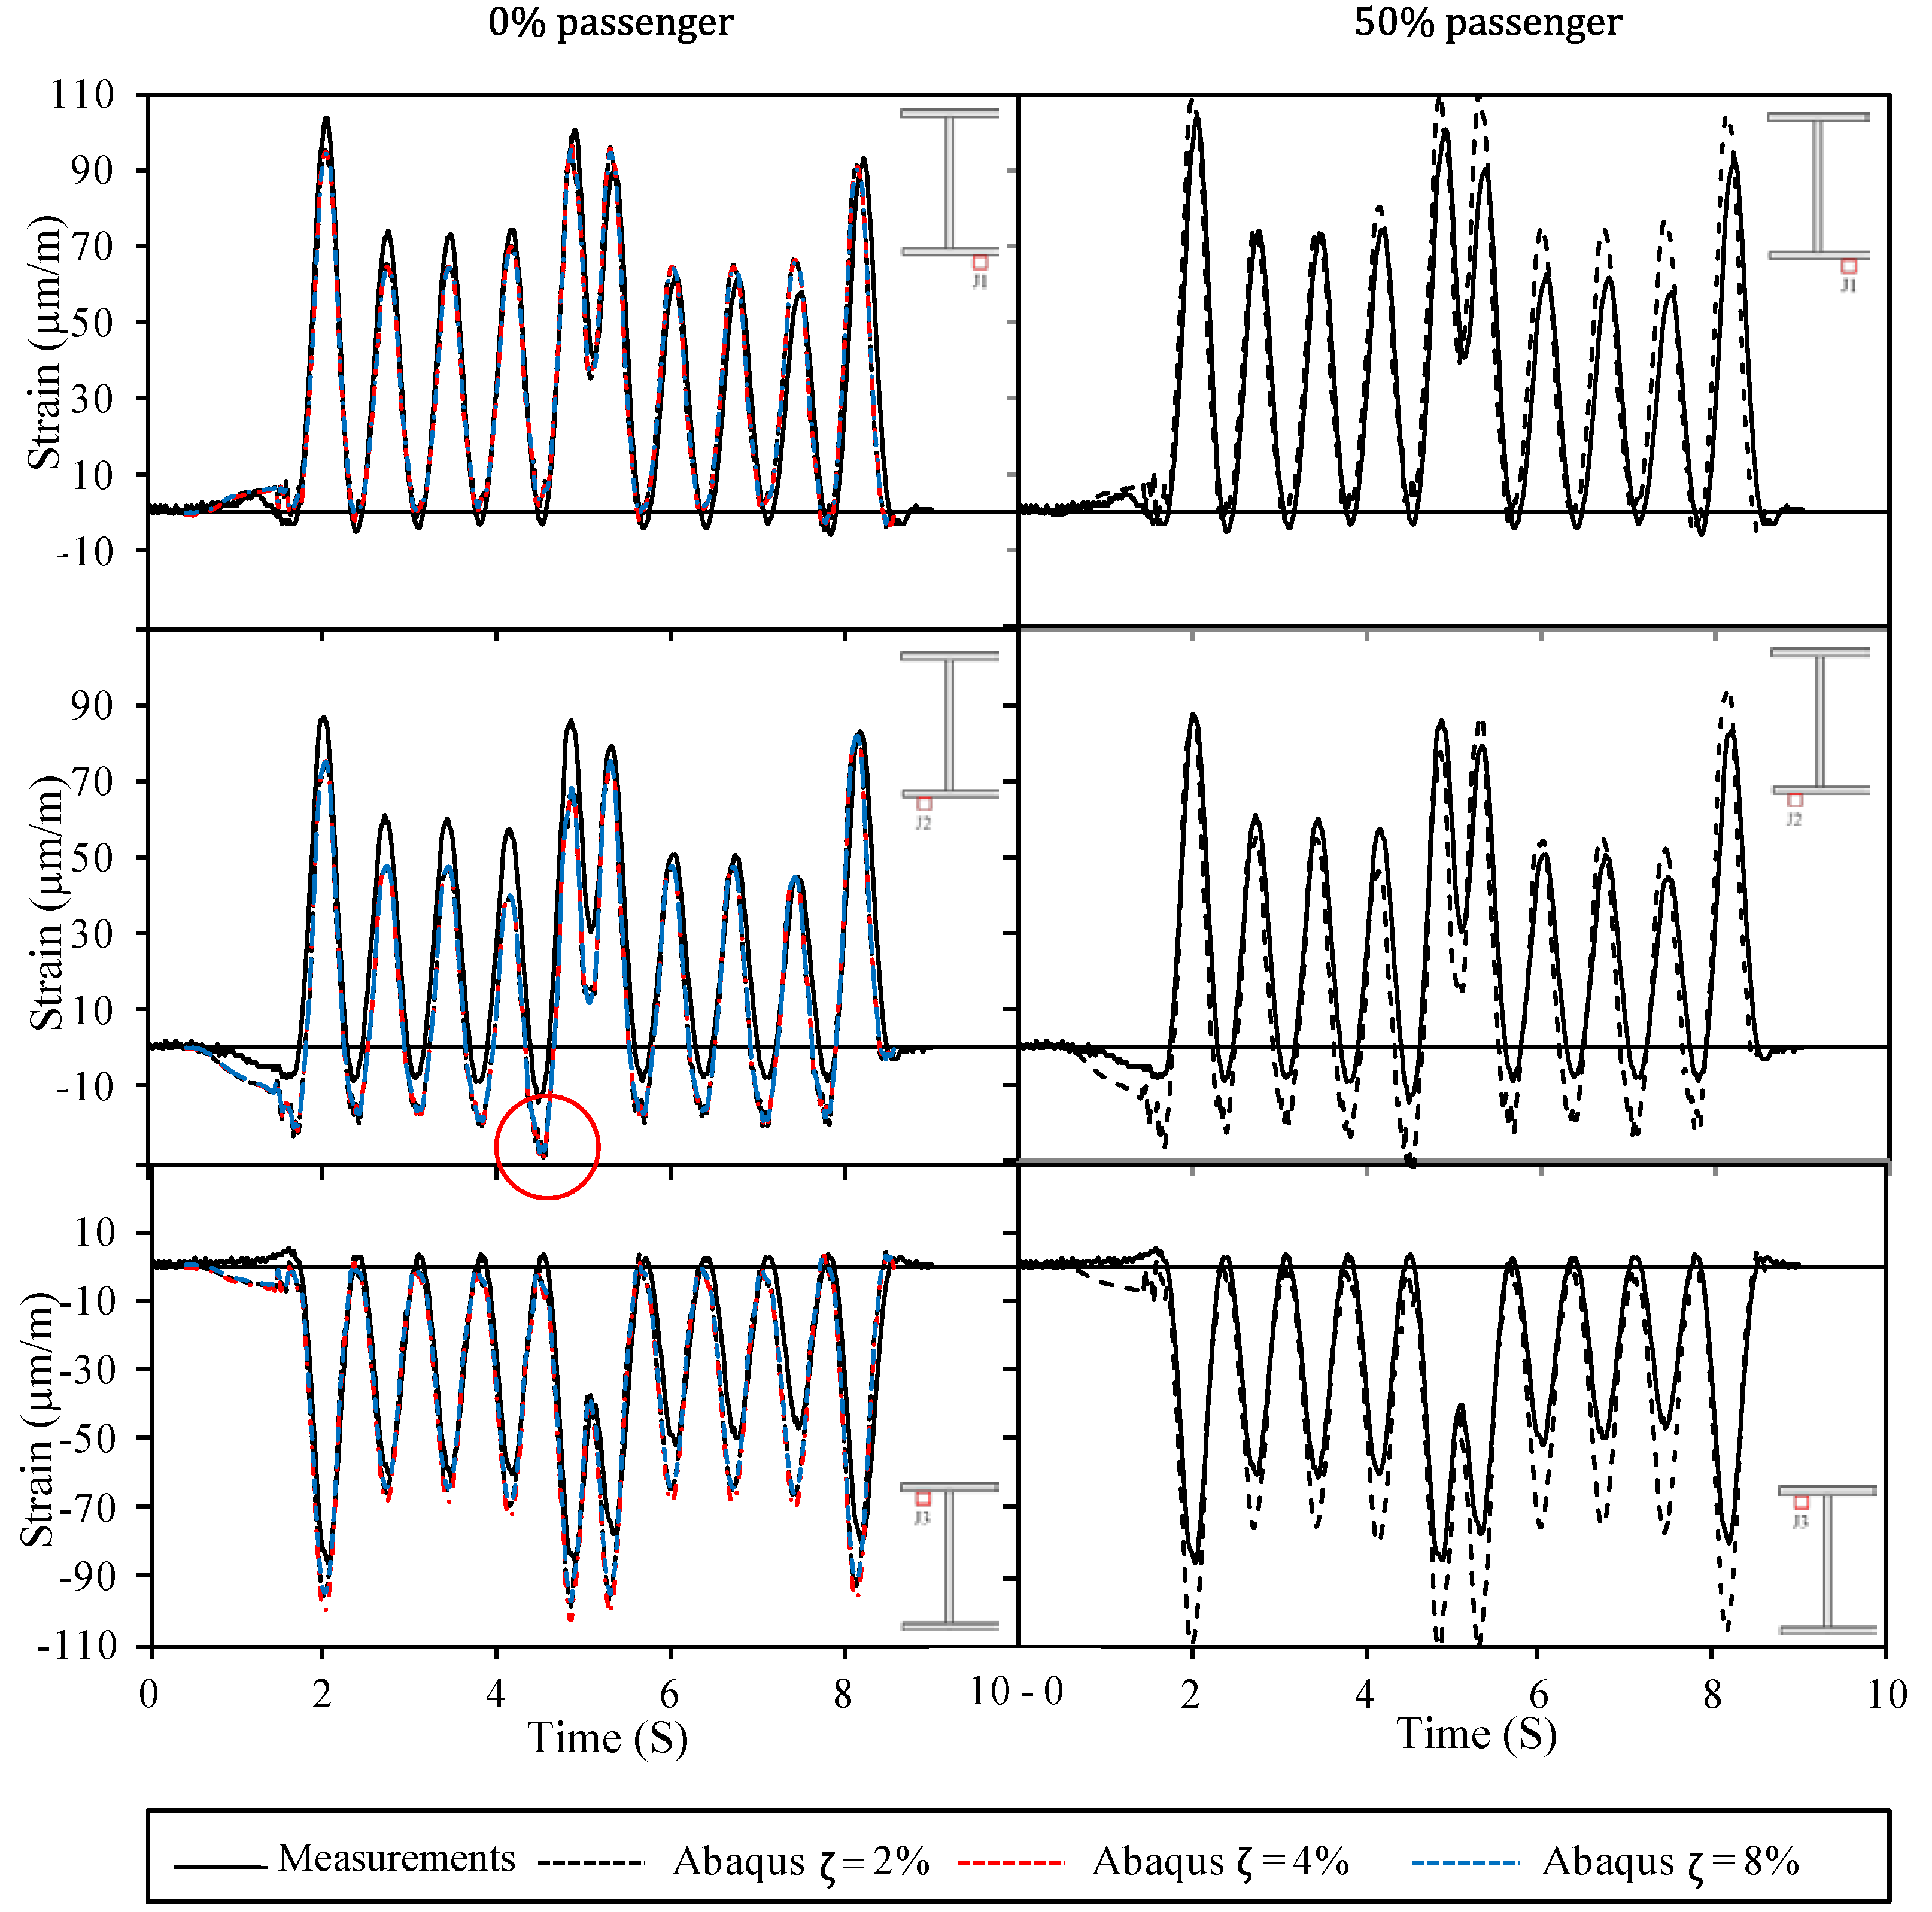
2.1.5. Dynamic Modeling
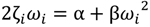
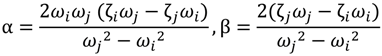
 i and j correspond to any two natural frequencies of the structure ωi and ωj, respectively. In this study, 2% damping is applied to the first and third bridge vibration modes [5,6]. Frequency analysis indicates the first and the second vibration frequencies as ω1 = 17.54 rad/s and ω3 = 31.37 rad/s resulting in α = 0.45 and β = 0.00082 from Equation (3).
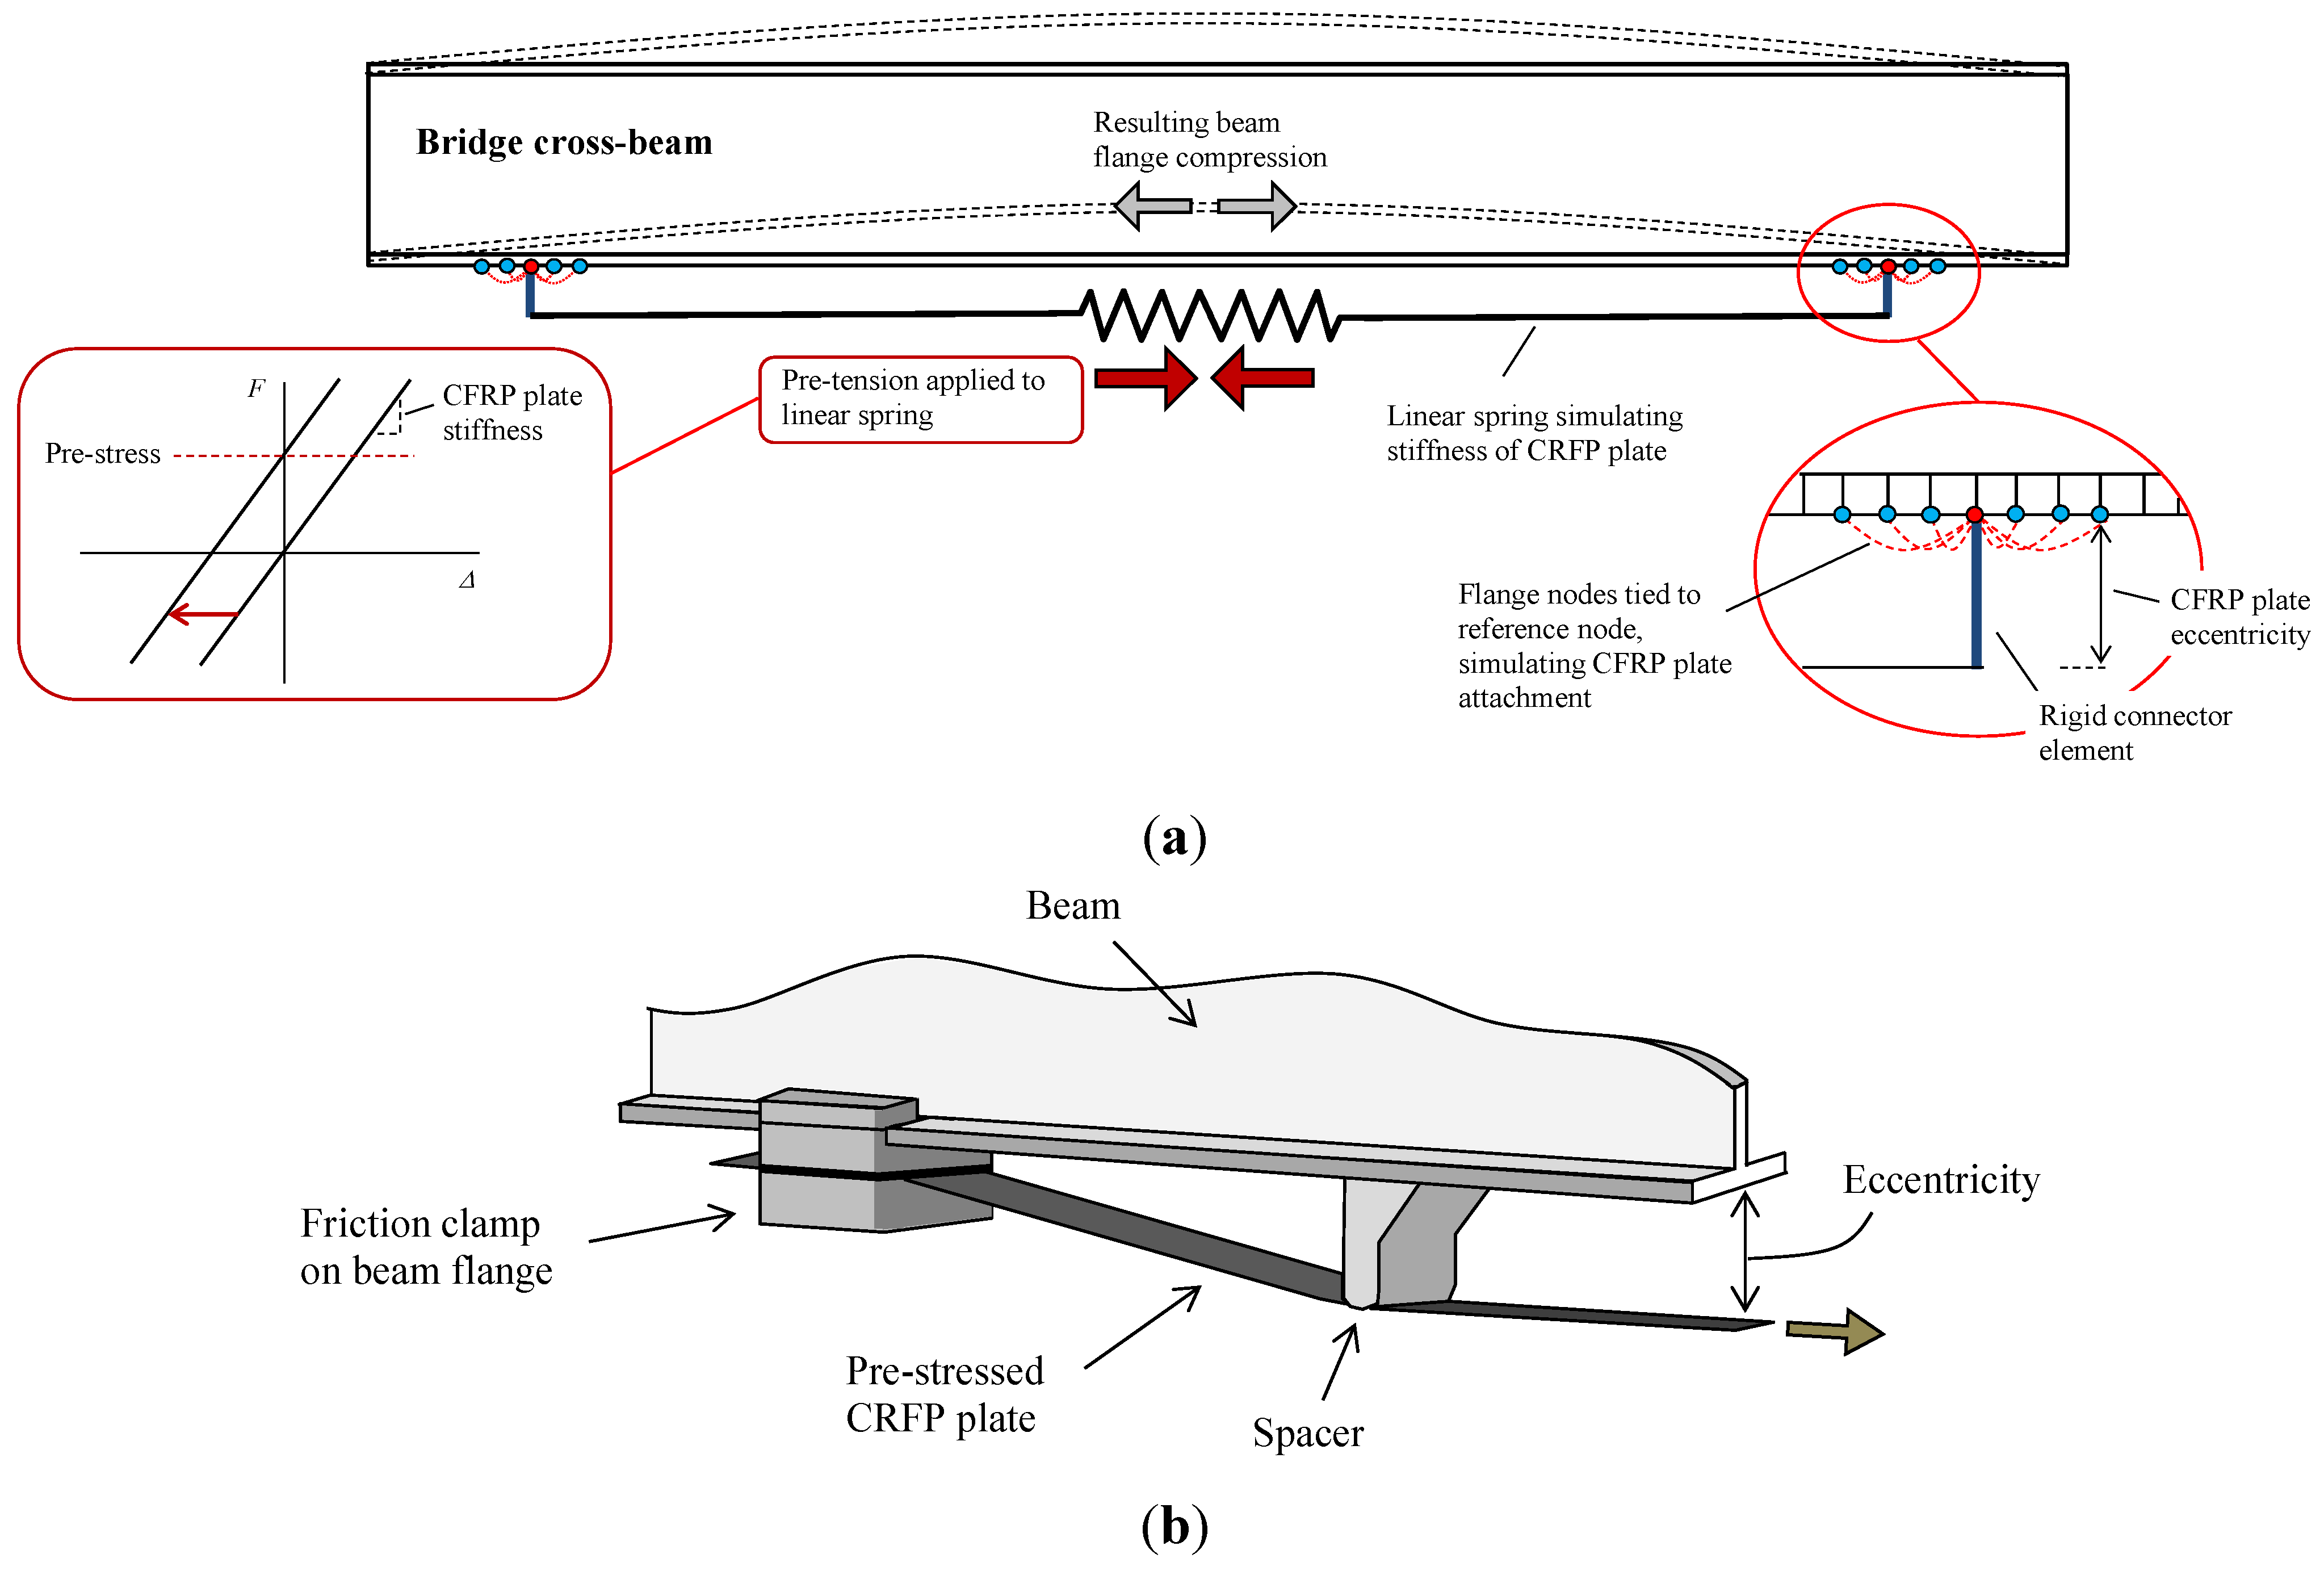
2.1.6. CFRP Post-Tensioning

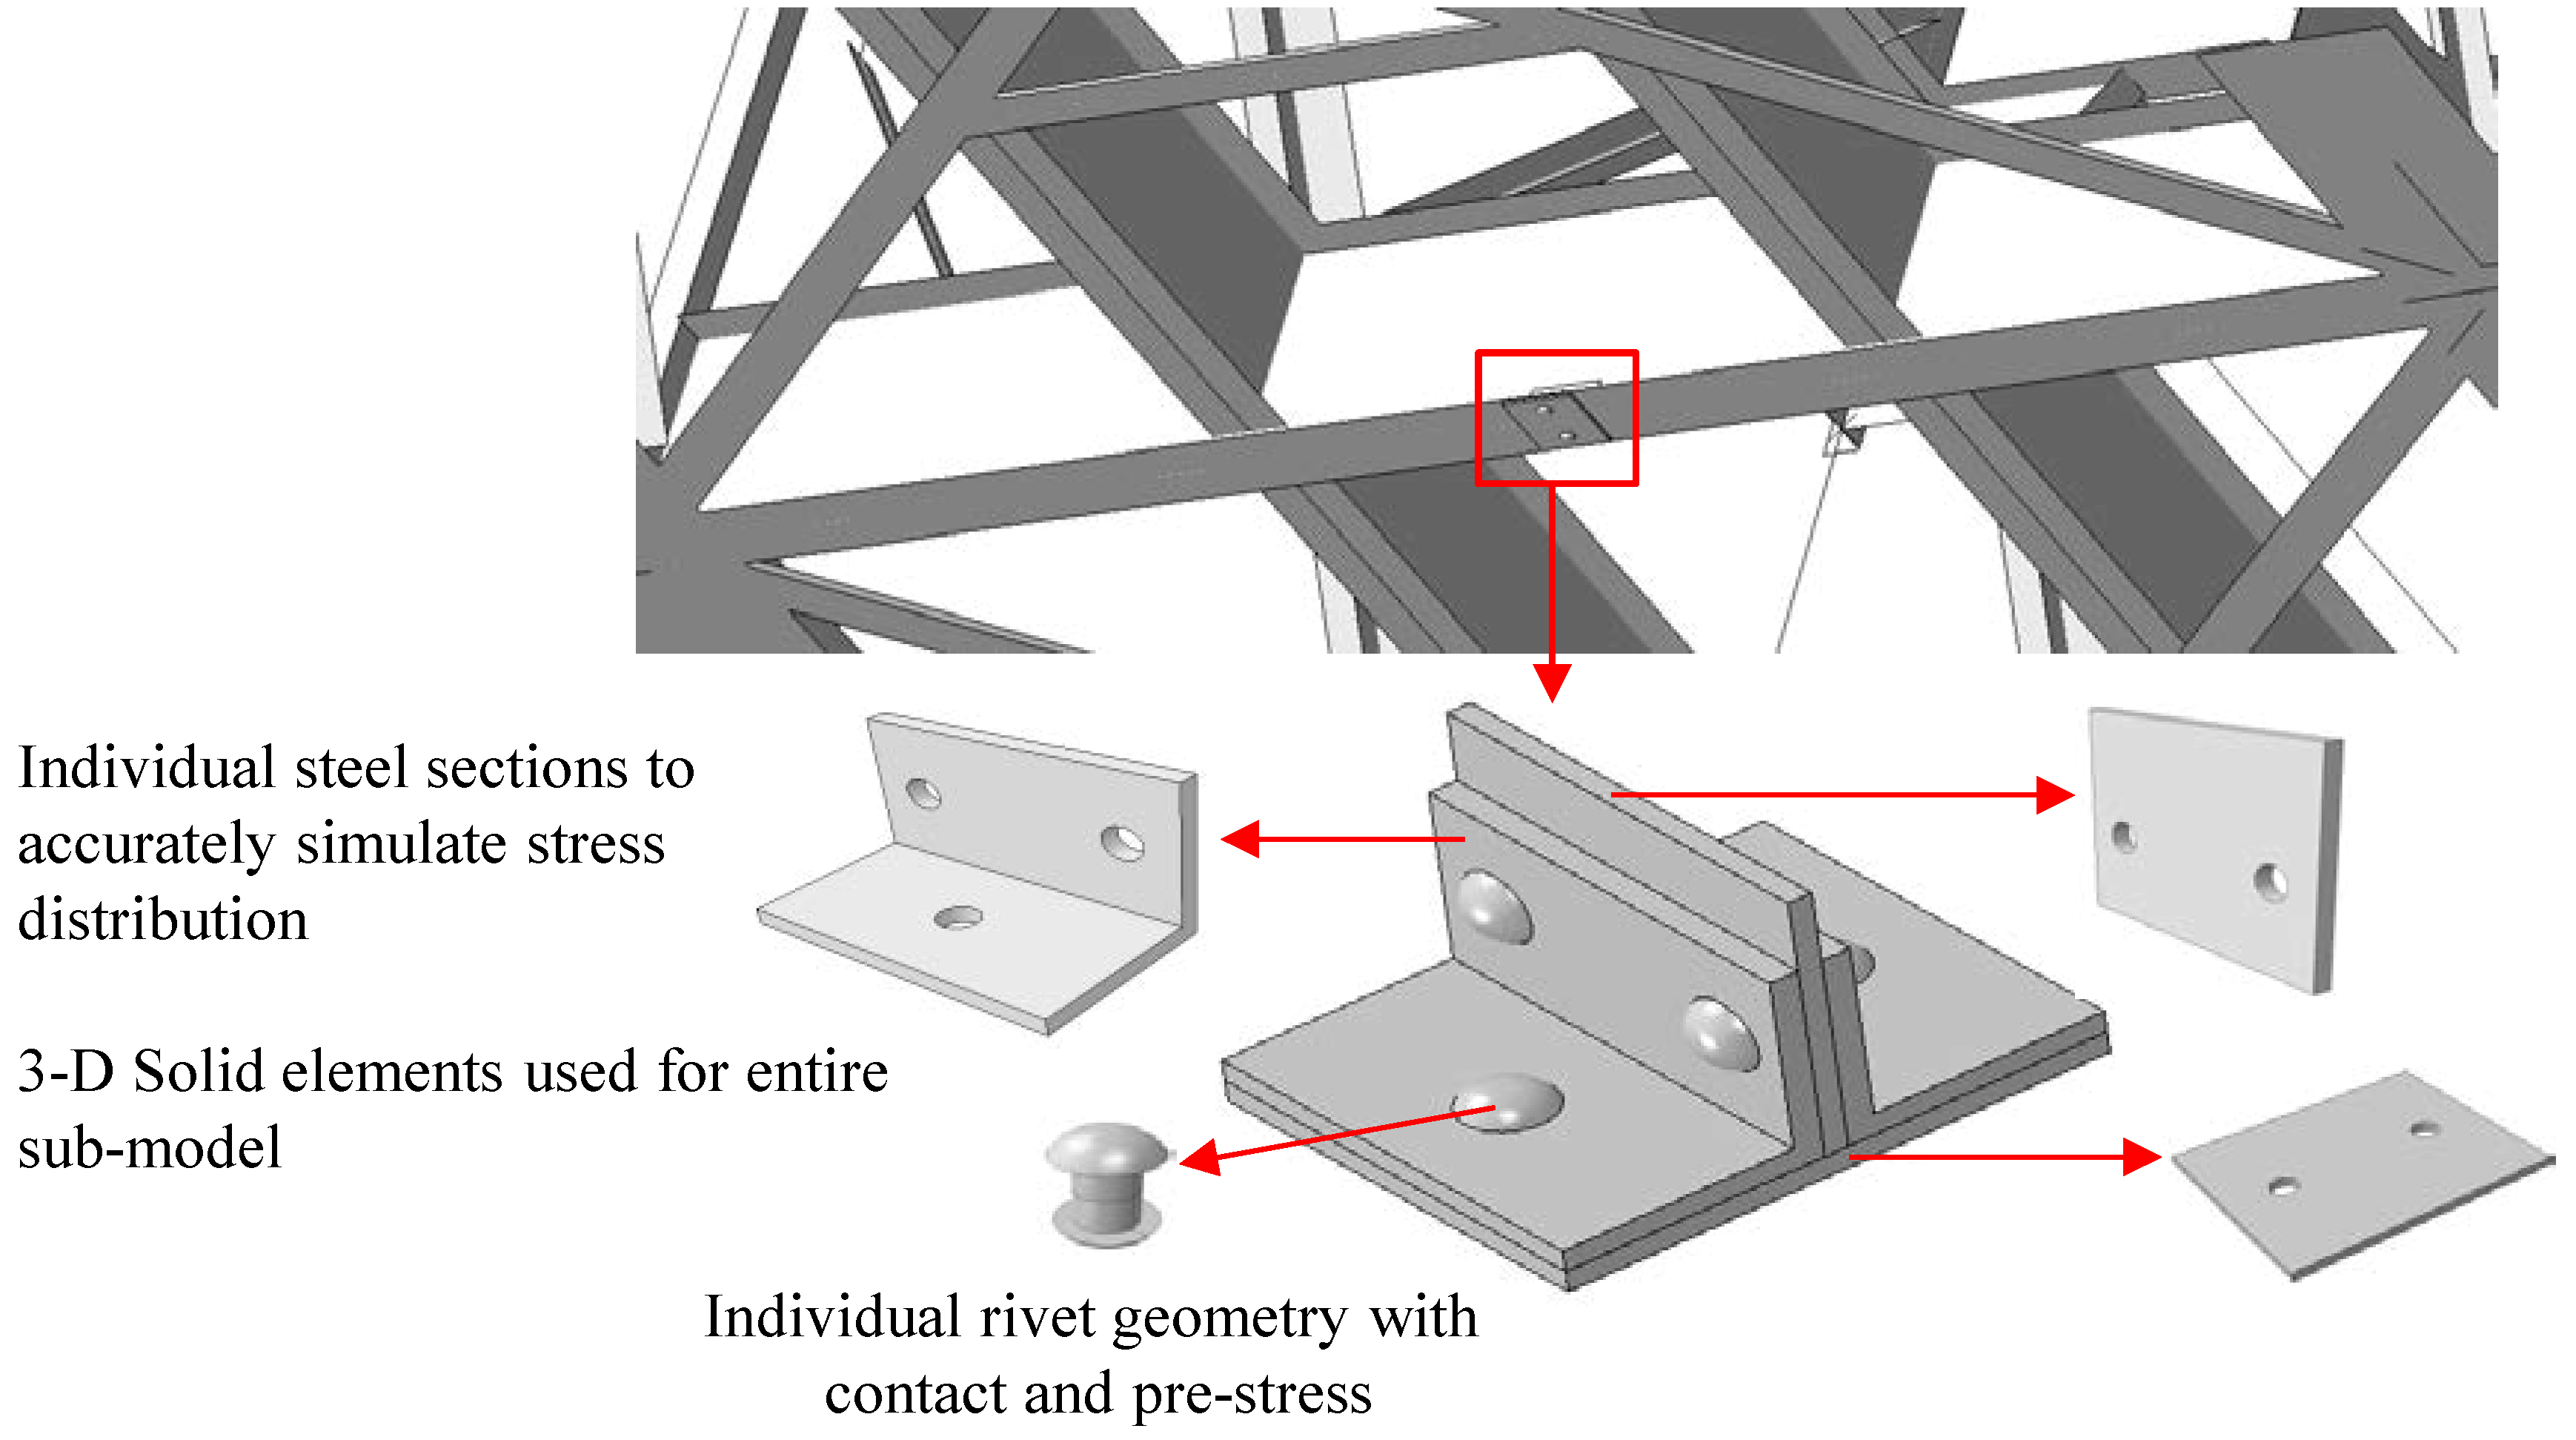
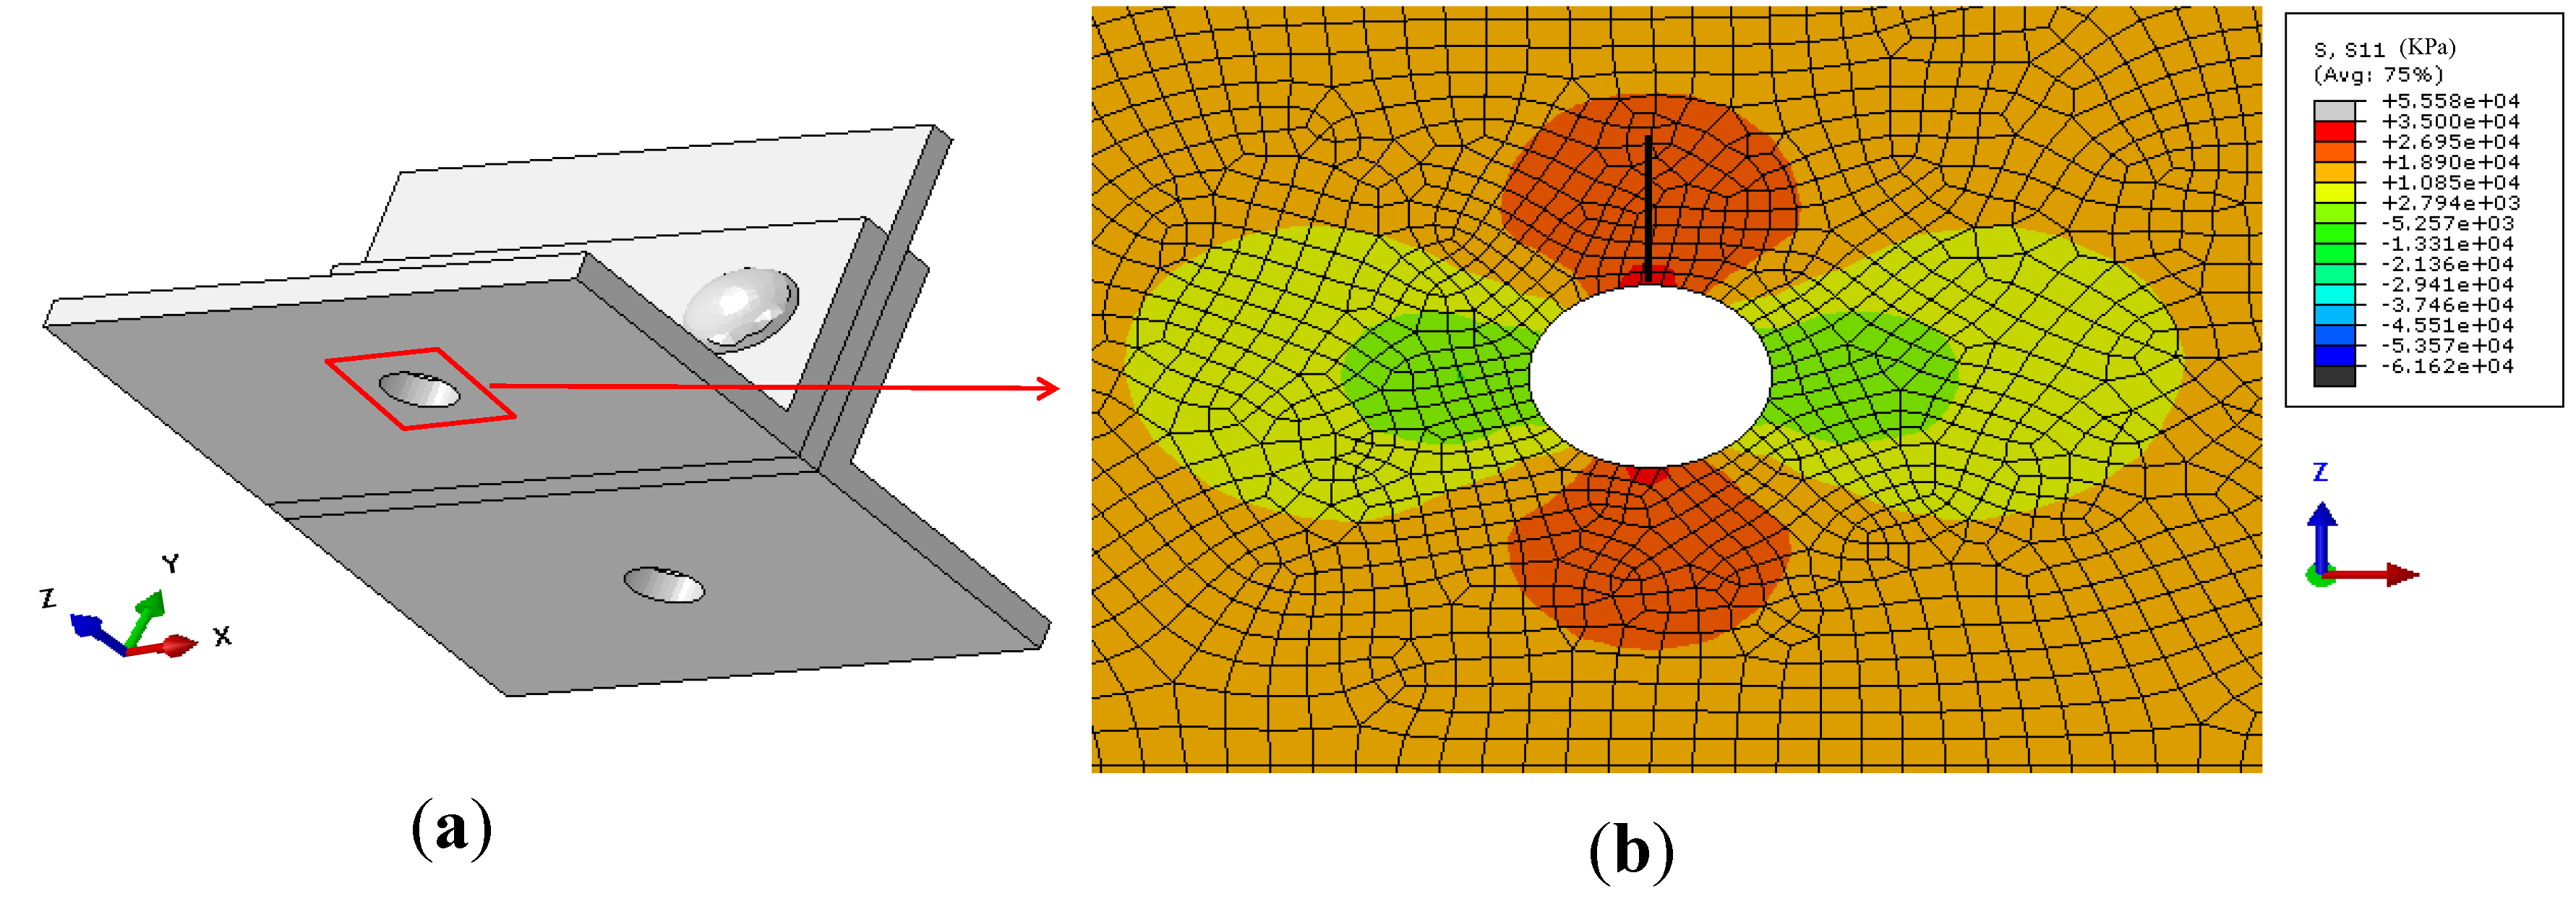
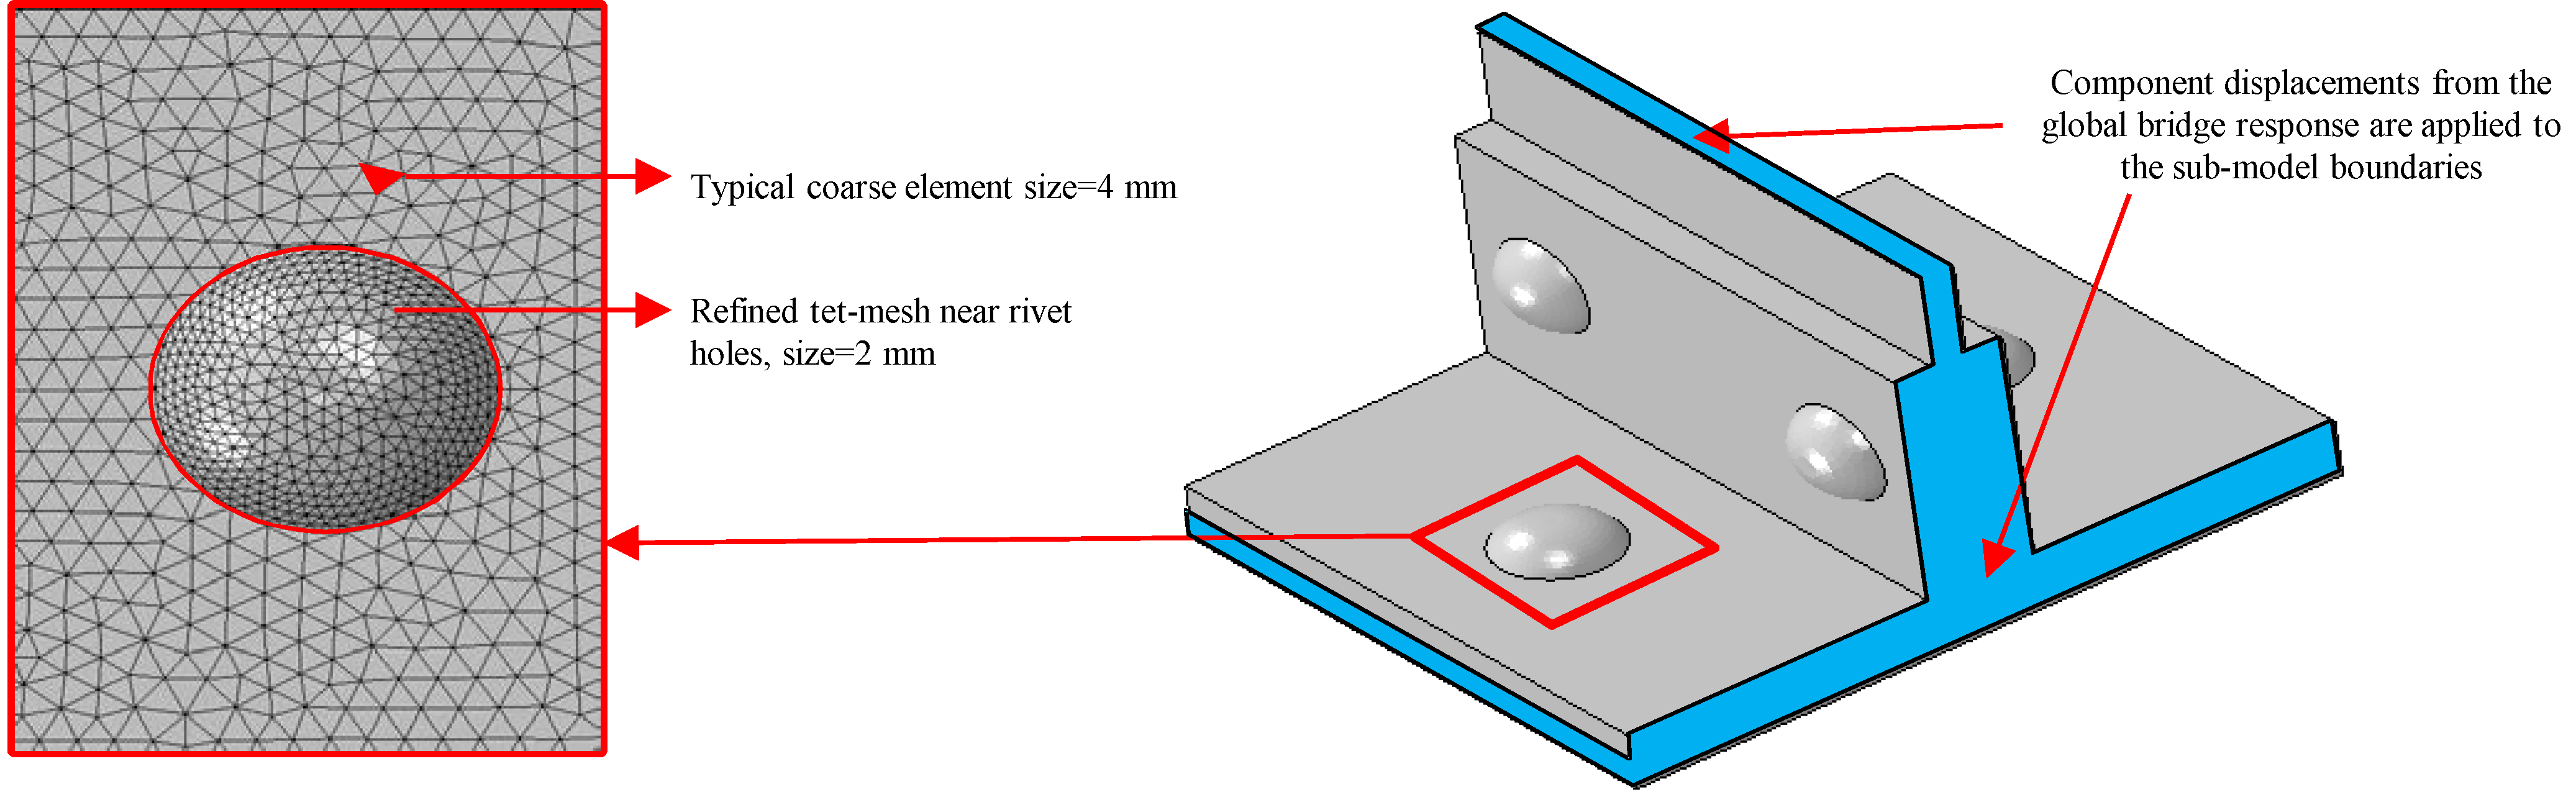
2.2. Riveted Joint Sub-Model
2.2.1. Geometry, Element Type, and Rivet Interaction

2.2.2. Mesh and Boundary Conditions
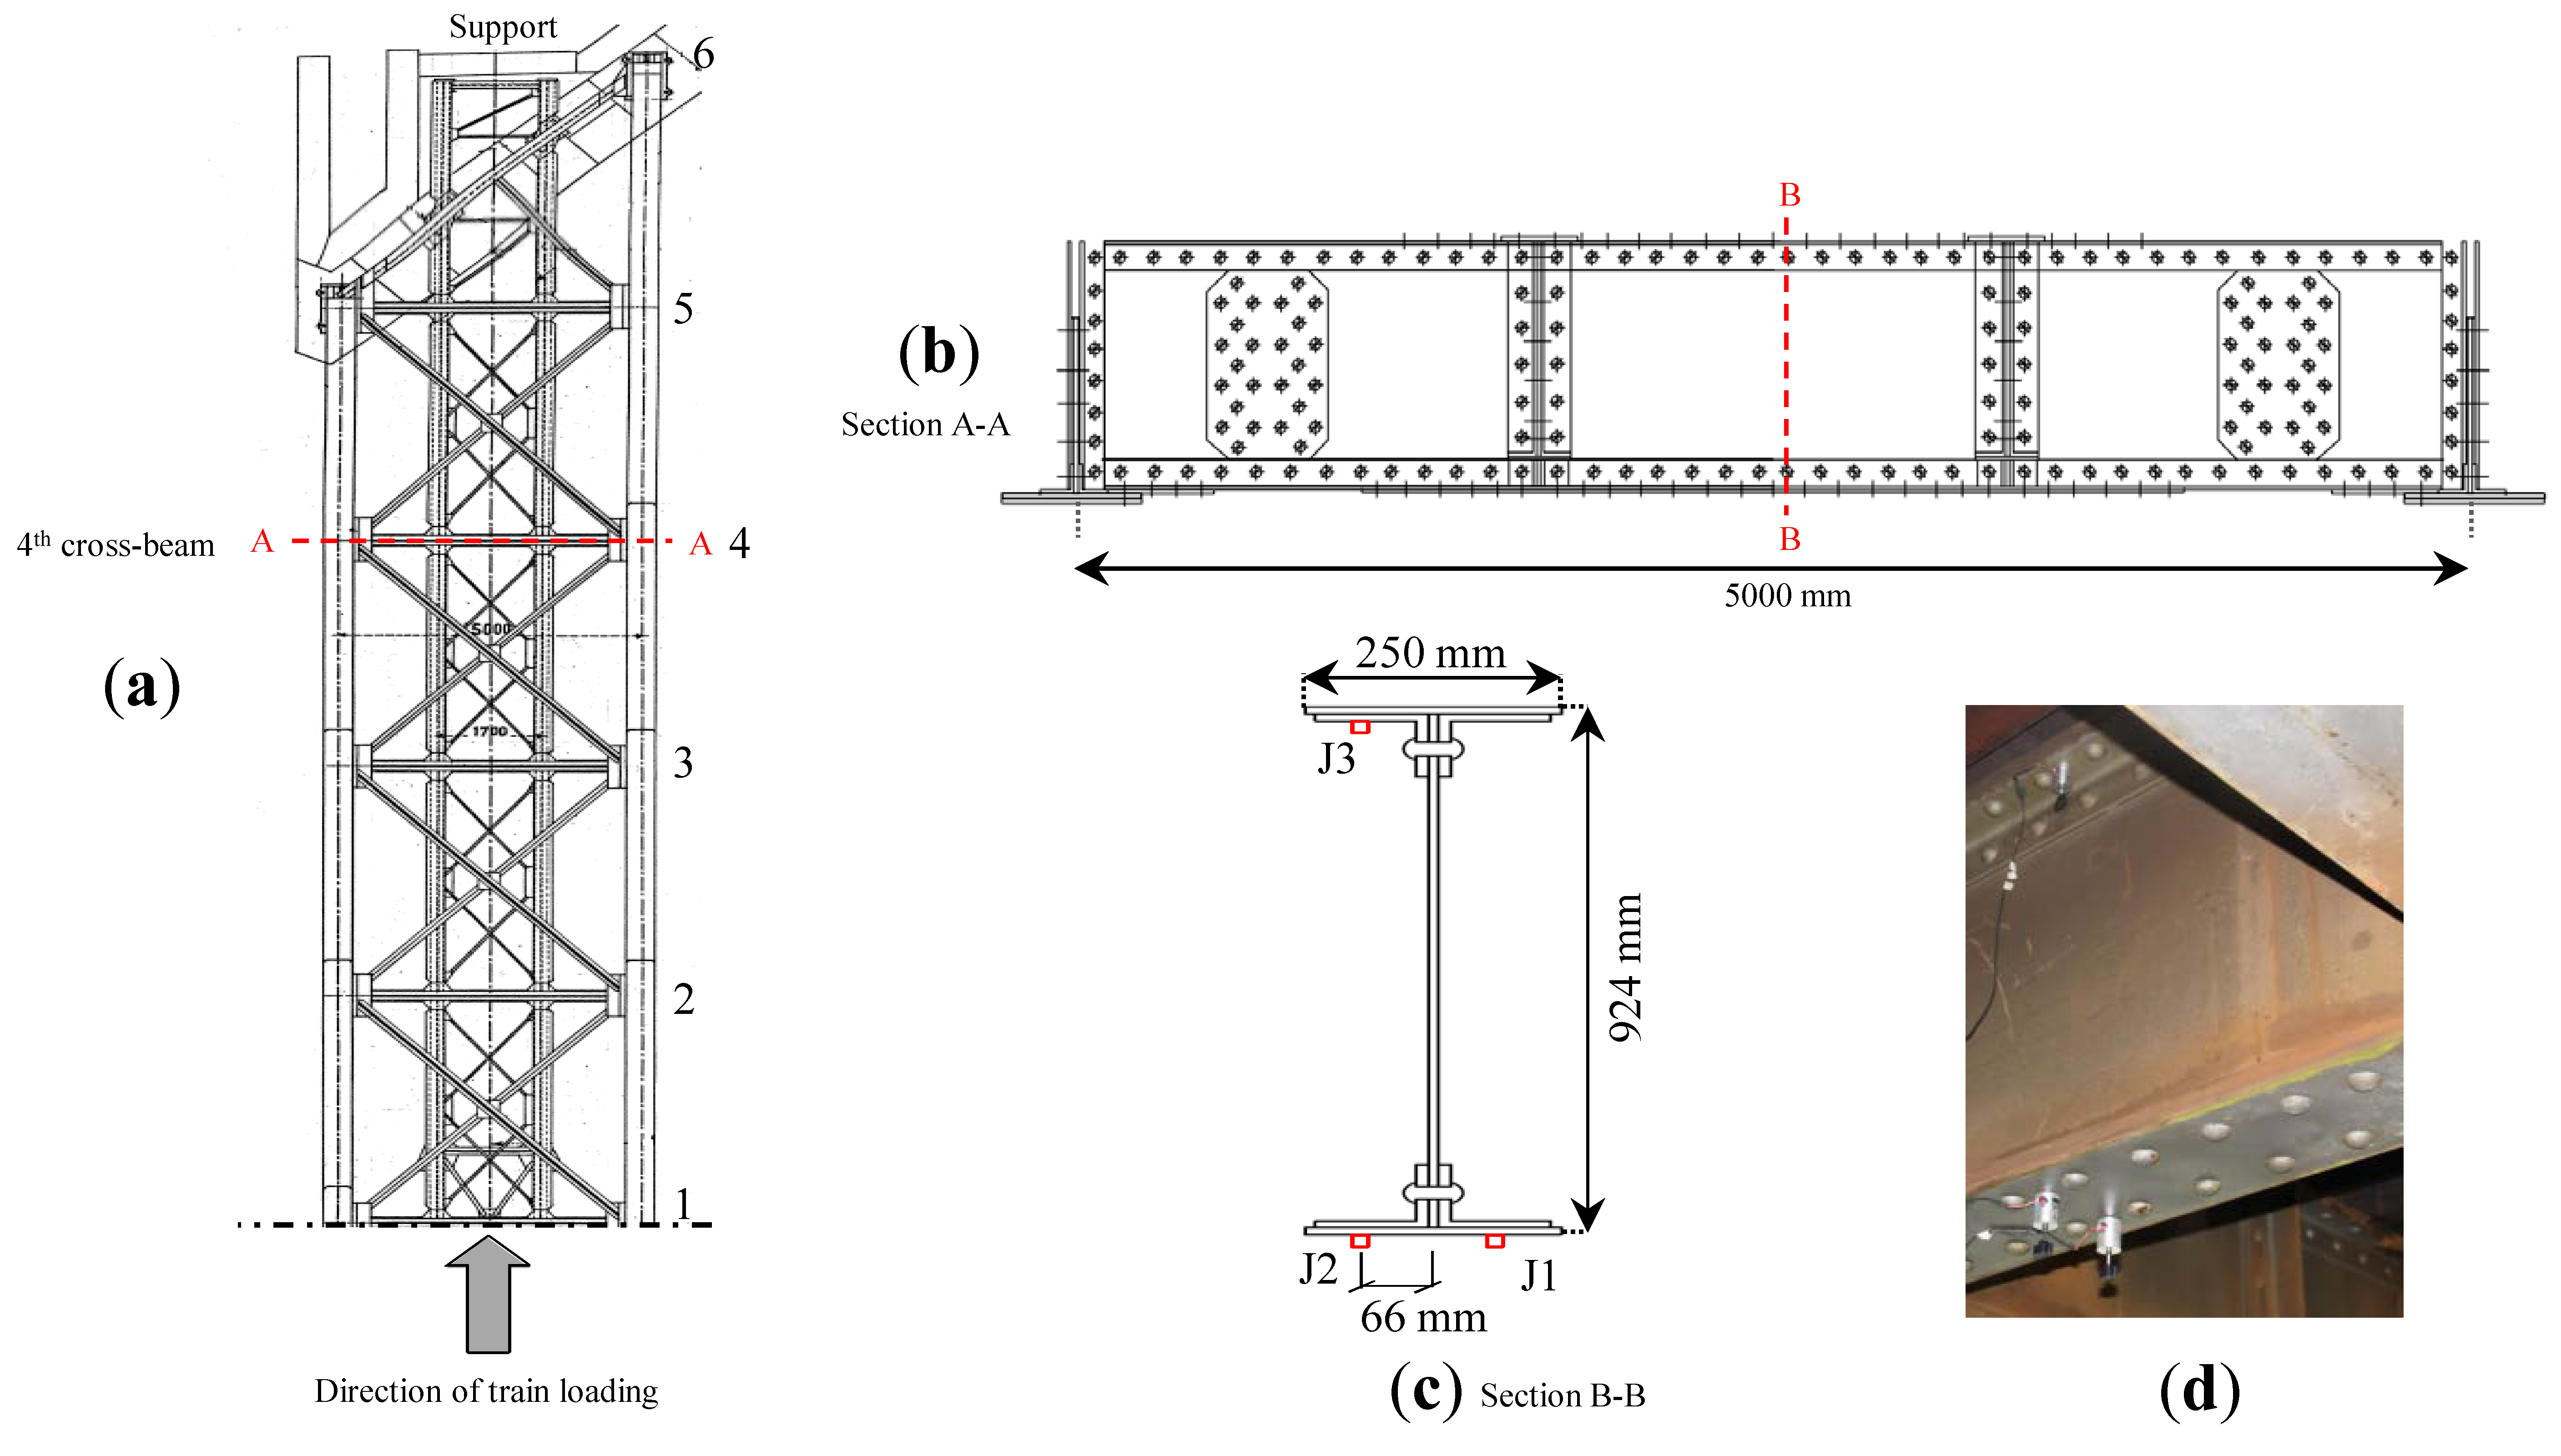
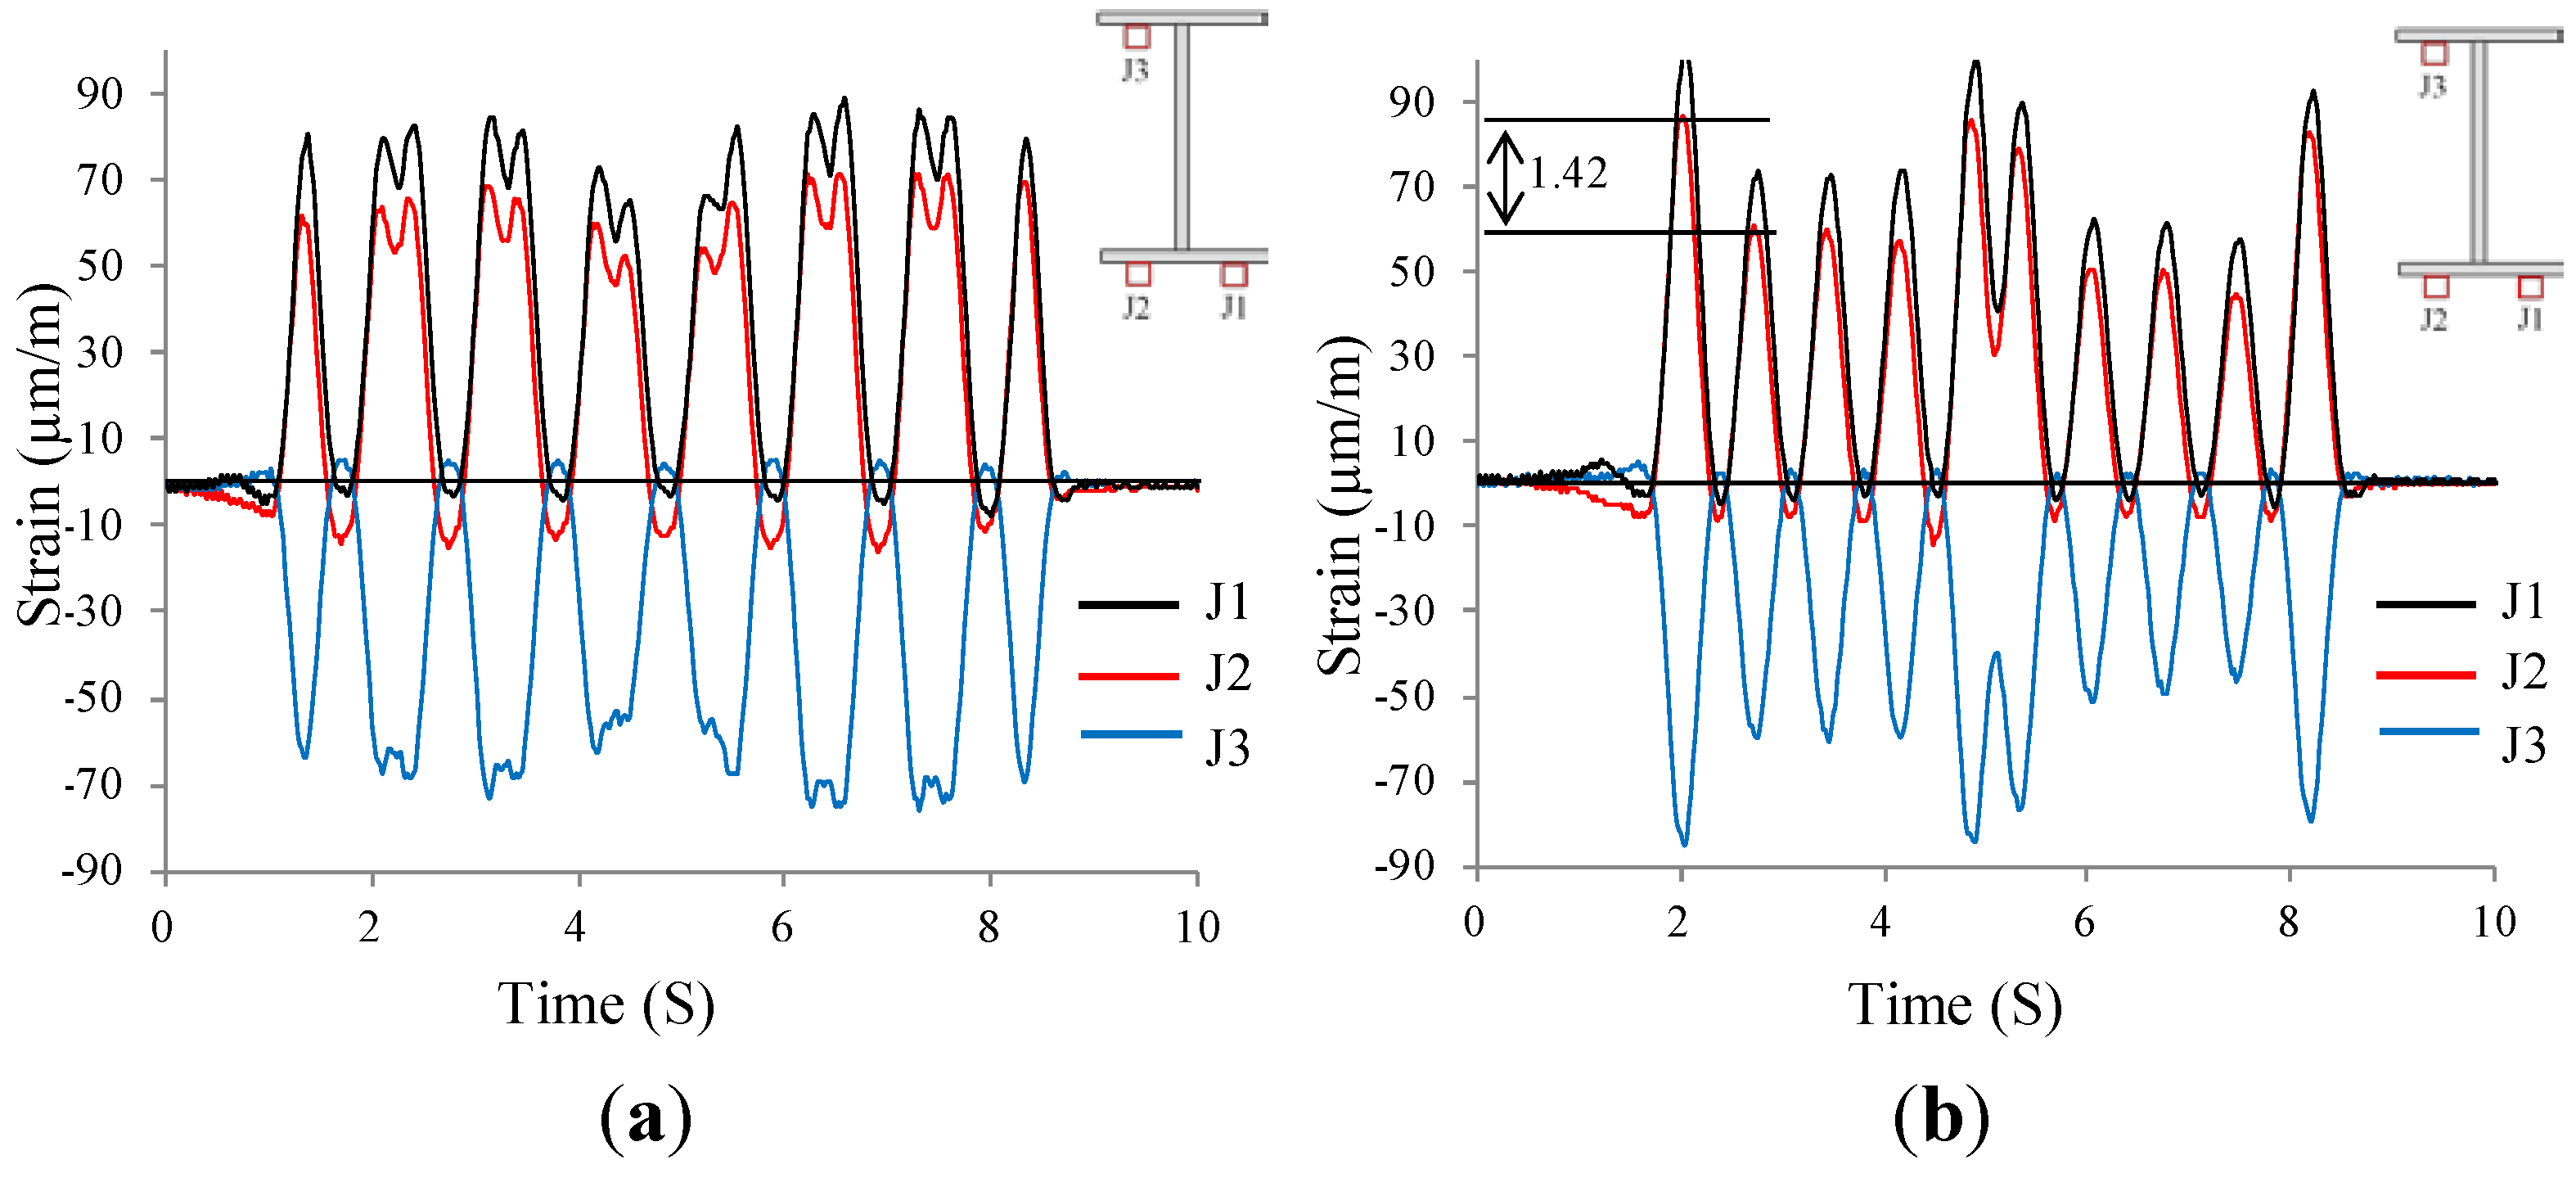
3. Verification of FE Model with Measurements


4. Fatigue Analysis Comparison
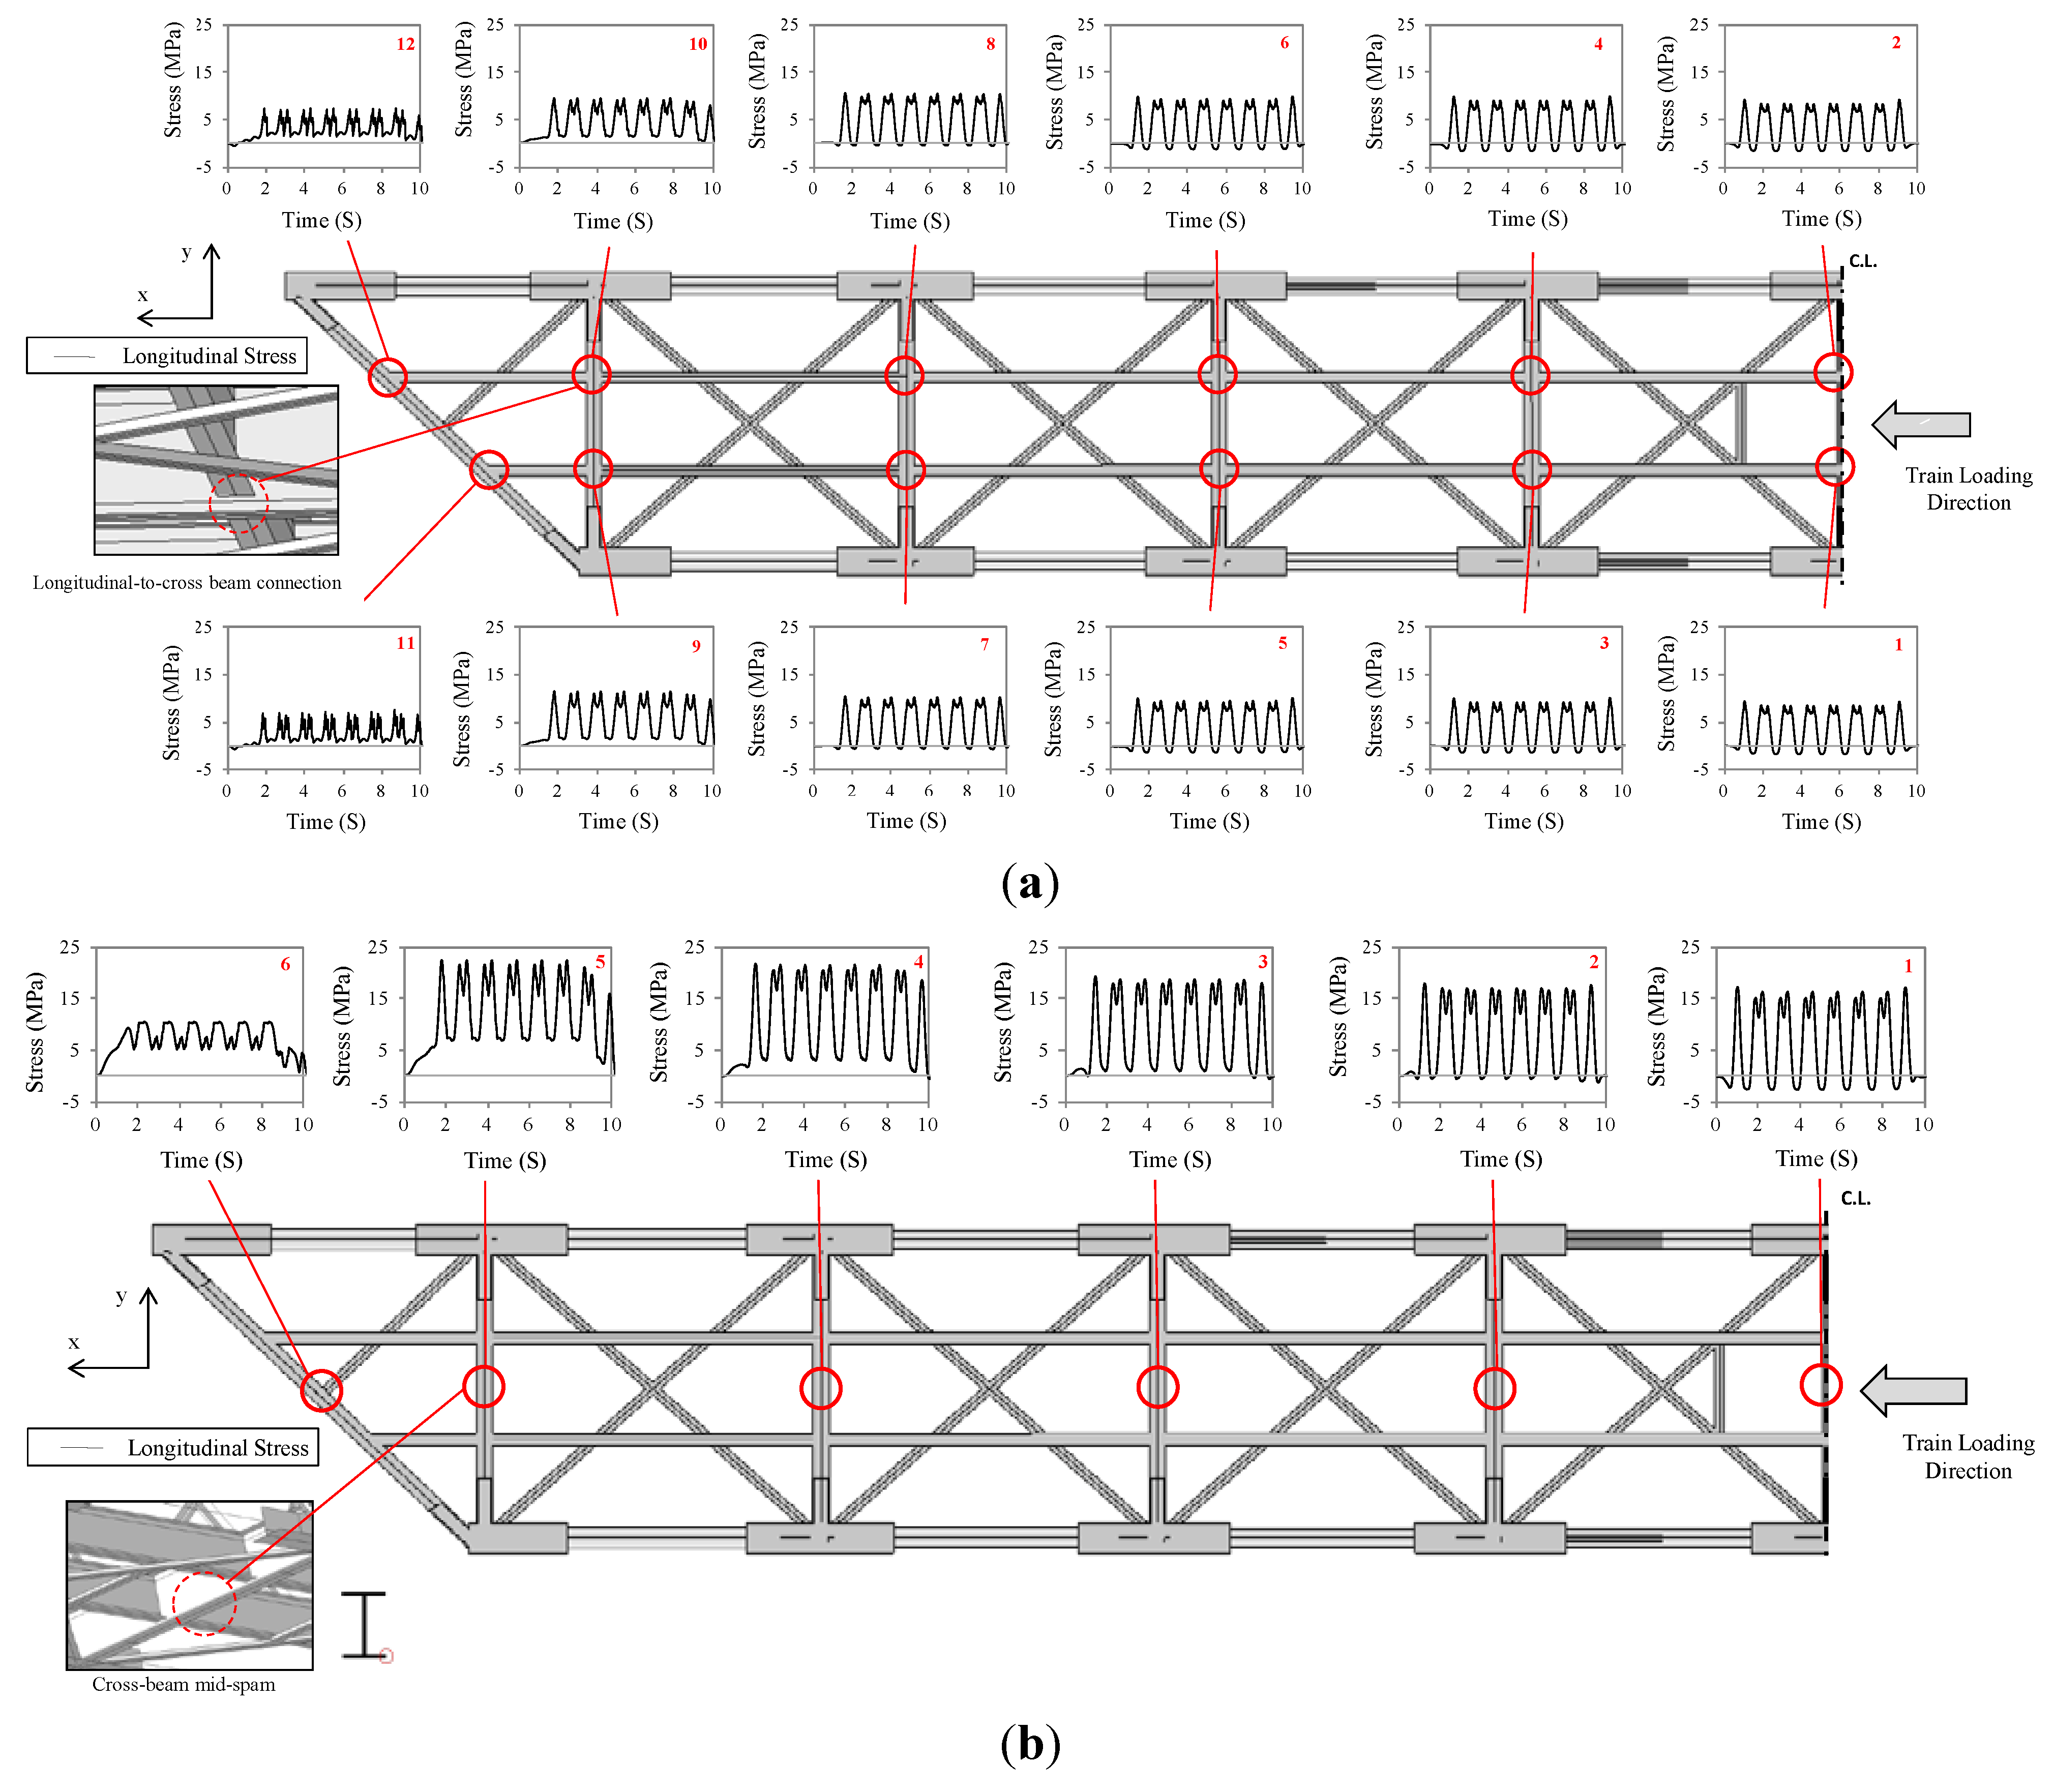
4.1. Global Model
4.1.1. Critical Regions and Stress Ranges on Existing Structure
| Position a | Δσ [Mpa] | Number of Cycles [ni] | Ni b | Damage [Di] | Total Damage [∑Di] |
|---|---|---|---|---|---|
| 1 | 18.6 | 1 | 2.91 × 10⁹ | 3.43 × 10⁻¹⁰ | 2.24 × 10⁻⁹ |
| 18.2 | 1 | 3.30 × 10⁹ | 3.03 × 10⁻¹⁰ | ||
| 17.7 | 5 | 3.73 × 10⁹ | 1.34 × 10⁻⁹ | ||
| 17.6 | 1 | 3.88 × 10⁹ | 2.58 × 10⁻¹⁰ | ||
| 2 | 3.7 | 6 | 9.45 × 10¹² | 6.35 × 10⁻¹³ | |
| 19.2 | 1 | 2.50 × 10⁹ | 4.00 × 10⁻¹⁰ | 2.27 × 10⁻⁹ | |
| 18.6 | 1 | 2.94 × 10⁹ | 3.41 × 10⁻¹⁰ | ||
| 17.6 | 2 | 3.93 × 10⁹ | 5.09 × 10⁻¹⁰ | ||
| 17.5 | 4 | 3.94 × 10⁹ | 1.02 × 10⁻⁹ | ||
| 4.5 | 6 | 3.40 × 10¹² | 1.77 × 10⁻¹² | ||
| 3 | 19.9 | 1 | 2.09 × 10⁹ | 4.78 × 10⁻¹⁰ | 2.43 × 10⁻⁹ |
| 18.4 | 1 | 3.10 × 10⁹ | 3.23 × 10⁻¹⁰ | ||
| 17.8 | 5 | 3.65 × 10⁹ | 1.37 × 10⁻⁹ | ||
| 17.7 | 1 | 3.80 × 10⁹ | 2.63 × 10⁻¹⁰ | ||
| 4.1 | 6 | 5.74 × 10¹² | 1.04 × 10⁻¹² | ||
| 4 | 22.4 | 1 | 1.17 × 10⁹ | 8.58 × 10⁻¹⁰ | 3.08 × 10⁻⁹ |
| 18.6 | 3 | 2.92 × 10⁹ | 1.03 × 10⁻⁹ | ||
| 18.5 | 2 | 2.99 × 10⁹ | 6.70 × 10⁻¹⁰ | ||
| 17.8 | 1 | 3.64 × 10⁹ | 2.74 × 10⁻¹⁰ | ||
| 17.5 | 1 | 3.99 × 10⁹ | 2.51 × 10⁻¹⁰ | ||
| 4.2 | 1 | 5.09 × 10¹² | 1.96 × 10⁻¹³ | ||
| 3.9 | 5 | 6.88 × 10¹² | 7.27 × 10⁻¹³ | ||
| 5 | 22.5 | 1 | 1.14 × 10⁹ | 8.75 × 10⁻¹⁰ | 1.76 × 10⁻⁹ |
| 15.6 | 5 | 7.00 × 10⁹ | 7.14 × 10⁻¹⁰ | ||
| 14.2 | 1 | 1.13 × 10¹⁰ | 8.86 × 10⁻¹¹ | ||
| 13.6 | 1 | 1.39 × 10¹⁰ | 7.21 × 10⁻¹¹ | ||
| 6.0 | 6 | 8.43 × 10¹¹ | 7.12 × 10⁻¹² | ||
| 6 | 10.5 | 1 | 5.18 × 10¹⁰ | 1.93 × 10⁻¹¹ | 2.34 × 10⁻¹¹ |
| 5.4 | 5 | 1.38 × 10¹² | 3.63 × 10⁻¹² | ||
| 4.2 | 1 | 4.85 × 10¹² | 2.06 × 10⁻¹³ | ||
| 3.8 | 2 | 8.53 × 10¹² | 2.34 × 10⁻¹³ | ||
| 2.4 | 5 | 8.23 × 10¹³ | 6.08 × 10⁻¹⁴ |
| Position a | Δσ [Mpa] | Number of Cycles [ni] | Ni b | Damage [Di] | Total Damage [∑Di] |
|---|---|---|---|---|---|
| 1 | 10.3 | 1 | 3.04 × 10¹⁰ | 3.29 × 10⁻¹¹ | 1.83 × 10⁻¹⁰ |
| 9.5 | 5 | 4.56 × 10¹⁰ | 1.10 × 10⁻¹⁰ | ||
| 9.4 | 2 | 5.00 × 10¹⁰ | 4.00 × 10⁻¹¹ | ||
| 2 | 10.3 | 1 | 3.05 × 10¹⁰ | 3.28 × 10⁻¹¹ | 1.85 × 10⁻¹⁰ |
| 9.6 | 1 | 4.37 × 10¹⁰ | 2.29 × 10⁻¹¹ | ||
| 9.5 | 6 | 4.65 × 10¹⁰ | 1.29 × 10⁻¹⁰ | ||
| 3 | 10.9 | 1 | 2.37 × 10¹⁰ | 4.21 × 10⁻¹¹ | 2.38 × 10⁻¹⁰ |
| 10.2 | 1 | 3.22 × 10¹⁰ | 3.11 × 10⁻¹¹ | ||
| 10.0 | 6 | 3.63 × 10¹⁰ | 1.65 × 10⁻¹⁰ | ||
| 4 | 10.8 | 1 | 2.46 × 10¹⁰ | 4.07 × 10⁻¹¹ | 2.34 × 10⁻¹⁰ |
| 10.2 | 1 | 3.22 × 10¹⁰ | 3.11 × 10⁻¹¹ | ||
| 9.9 | 6 | 3.70 × 10¹⁰ | 1.62 × 10⁻¹⁰ | ||
| 5 | 10.7 | 1 | 2.52 × 10¹⁰ | 3.96 × 10⁻¹¹ | 2.51 × 10⁻¹⁰ |
| 10.4 | 1 | 3.02 × 10¹⁰ | 3.32 × 10⁻¹¹ | ||
| 10.1 | 6 | 3.36 × 10¹⁰ | 1.78 × 10⁻¹⁰ | ||
| 6 | 10.8 | 1 | 2.50 × 10¹⁰ | 4.01 × 10⁻¹¹ | 2.61 × 10⁻¹⁰ |
| 10.4 | 1 | 2.90 × 10¹⁰ | 3.45 × 10⁻¹¹ | ||
| 10.2 | 6 | 3.21 × 10¹⁰ | 1.87 × 10⁻¹⁰ | ||
| 7 | 10.8 | 1 | 2.47 × 10¹⁰ | 4.04 × 10⁻¹¹ | 2.84 × 10⁻¹⁰ |
| 10.5 | 2 | 2.81 × 10¹⁰ | 7.12 × 10⁻¹¹ | ||
| 10.4 | 5 | 2.90 × 10¹⁰ | 1.72 × 10⁻¹⁰ | ||
| 8 | 10.9 | 1 | 2.37 × 10¹⁰ | 4.22 × 10⁻¹¹ | 3.03 × 10⁻¹⁰ |
| 10.7 | 1 | 2.63 × 10¹⁰ | 3.81 × 10⁻¹¹ | ||
| 10.6 | 4 | 2.65 × 10¹⁰ | 1.51 × 10⁻¹⁰ | ||
| 10.5 | 2 | 2.79 × 10¹⁰ | 7.16 × 10⁻¹¹ | ||
| 9 | 11.6 | 1 | 1.73 × 10¹⁰ | 5.78 × 10⁻¹¹ | 2.49 × 10⁻¹⁰ |
| 10.1 | 5 | 3.40 × 10¹⁰ | 1.47 × 10⁻¹⁰ | ||
| 9.6 | 2 | 4.49 × 10¹⁰ | 4.45 × 10⁻¹¹ | ||
| 3.1 | 1 | 1.34 × 10¹⁰ | 7.46 × 10⁻¹⁴ | ||
| 10 | 9.7 | 1 | 4.29 × 10¹⁰ | 2.33 × 10⁻¹¹ | 9.47 × 10⁻¹¹ |
| 8.3 | 5 | 9.00 × 10¹⁰ | 5.56 × 10⁻¹¹ | ||
| 7.7 | 2 | 1.30 × 10¹¹ | 1.53 × 10⁻¹¹ | ||
| 3.1 | 6 | 1.24 × 10¹³ | 4.82 × 10⁻¹³ | ||
| 11 | 8.2 | 1 | 9.73 × 10¹⁰ | 1.03 × 10⁻¹¹ | 3.00 × 10⁻¹¹ |
| 6.3 | 2 | 3.64 × 10¹¹ | 5.50 × 10⁻¹² | ||
| 6.1 | 2 | 4.27 × 10¹¹ | 4.68 × 10⁻¹² | ||
| 6.0 | 2 | 4.64 × 10¹¹ | 4.31 × 10⁻¹² | ||
| 5.1 | 4 | 1.05 × 10¹² | 3.82 × 10⁻¹² | ||
| 4.8 | 2 | 1.42 × 10¹² | 1.41 × 10⁻¹² | ||
| 12 | 8.0 | 1 | 1.10 × 10¹¹ | 9.08 × 10⁻¹² | 3.03 × 10⁻¹¹ |
| 6.0 | 3 | 4.64 × 10¹¹ | 6.46 × 10⁻¹² | ||
| 5.7 | 2 | 6.00 × 10¹¹ | 3.33 × 10⁻¹² | ||
| 5.6 | 2 | 6.55 × 10¹¹ | 3.05 × 10⁻¹² | ||
| 5.5 | 6 | 7.17 × 10¹¹ | 8.37 × 10⁻¹² |
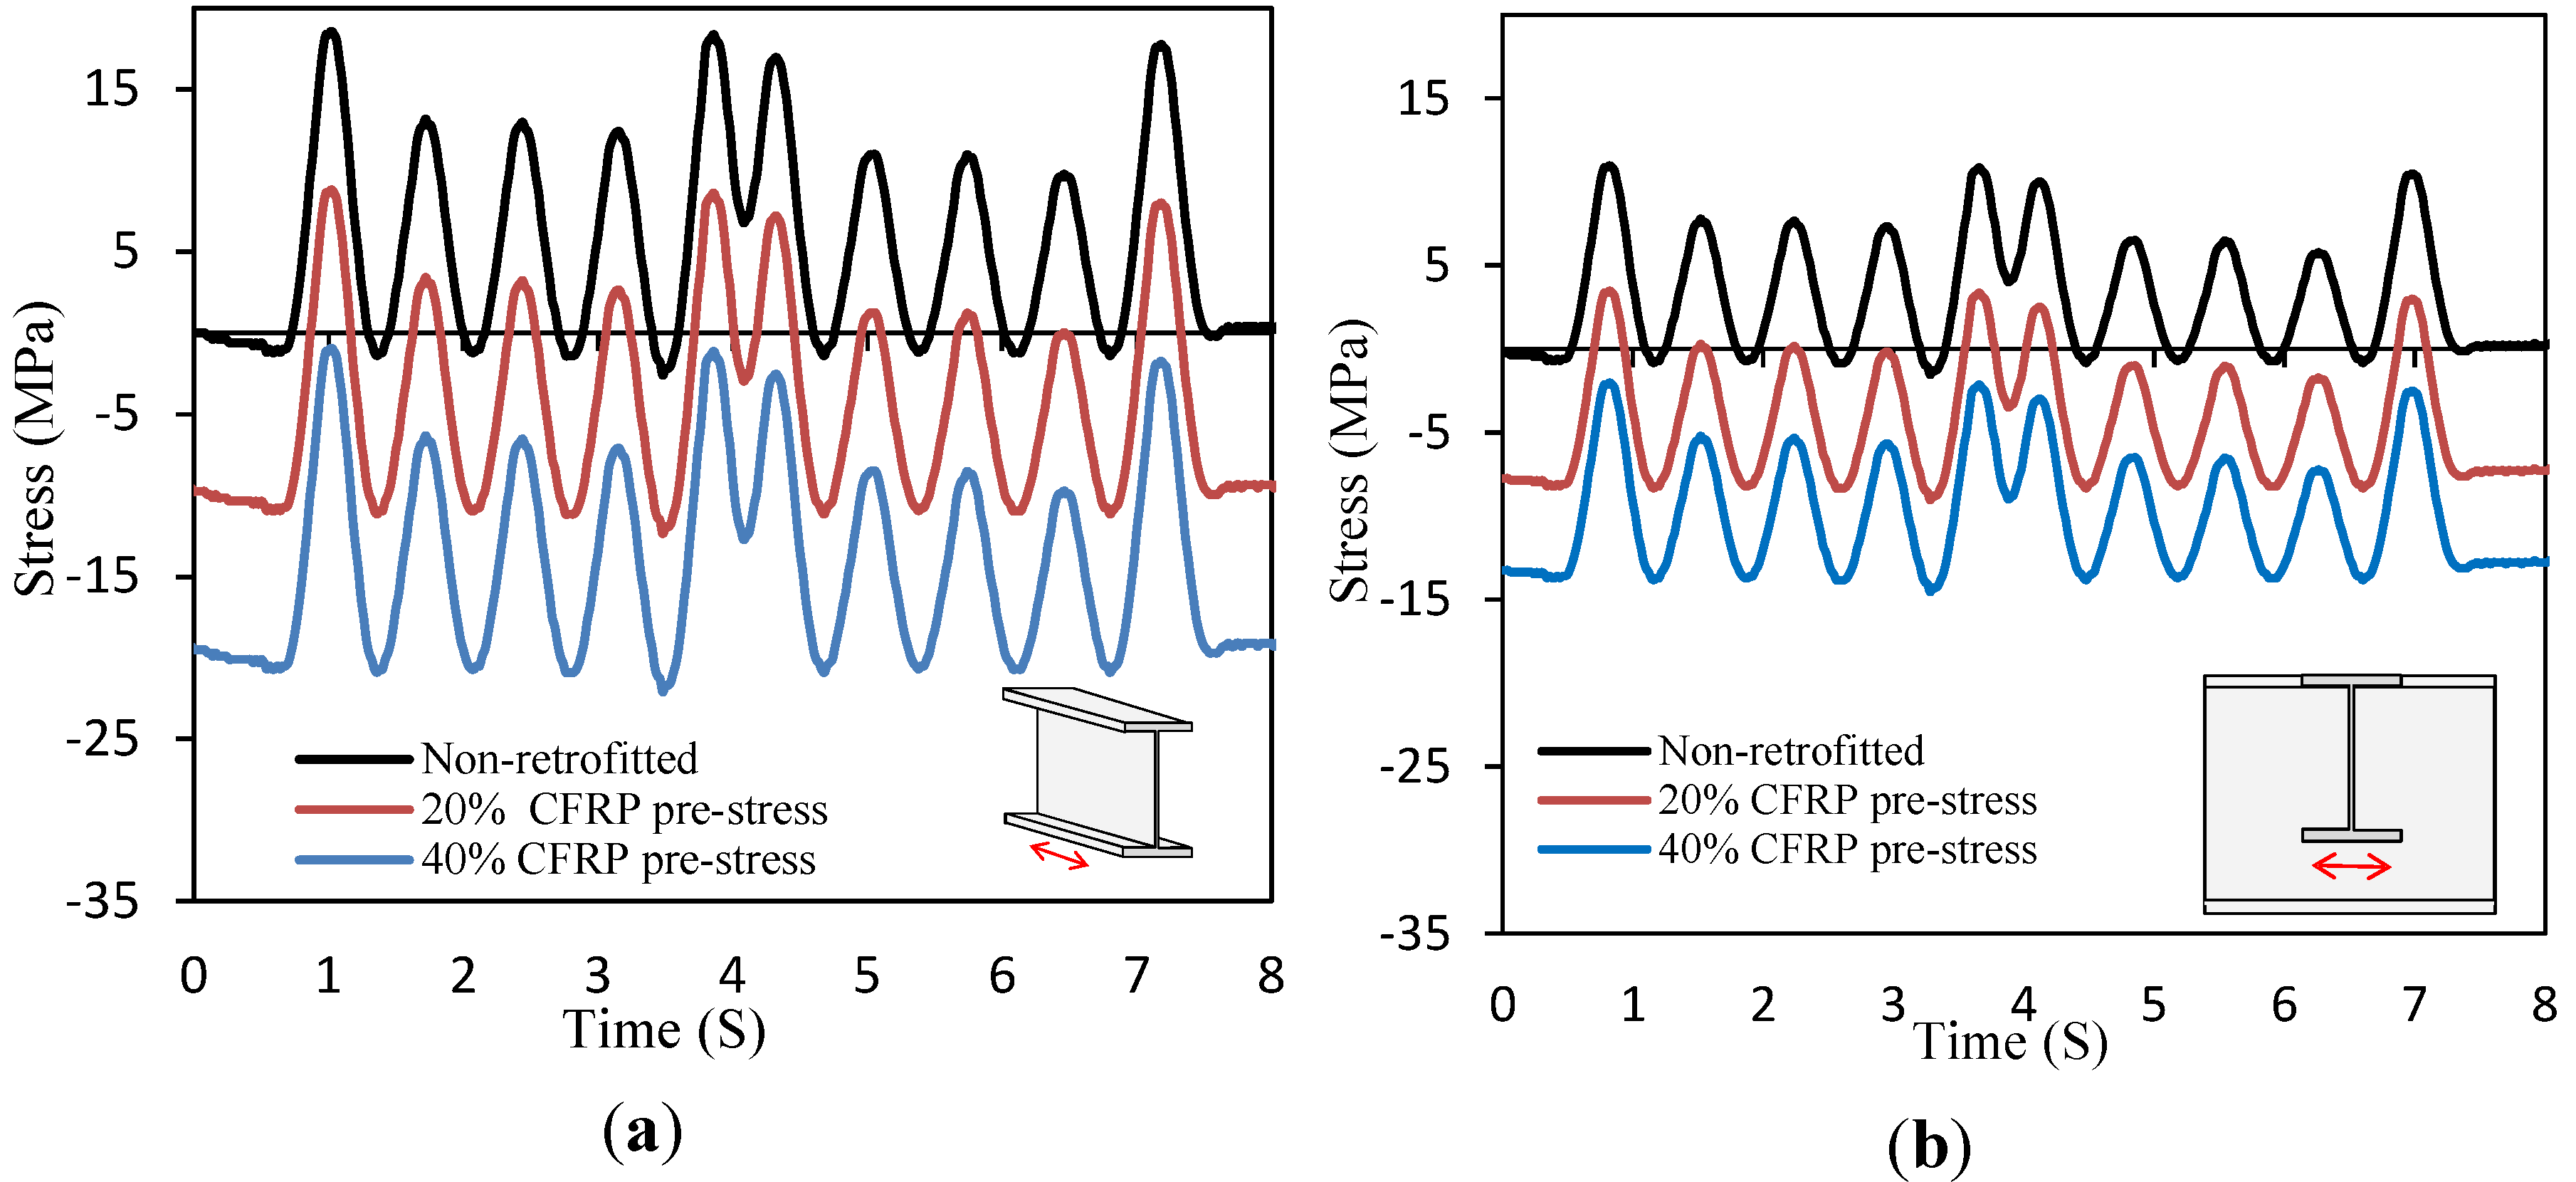
4.1.2. Effect of CFRP Post-Tensioning on Fatigue Susceptibility

| Location a | Non-Retrofitted b | Damage Reduction by 20% Pre-Stress c | Damage Reduction by 40% Pre-Stress c |
|---|---|---|---|
| 1 | 2.75 × 10⁻⁹ | 66.74% | 91.07% |
| 2 | 2.93 × 10⁻⁹ | 66.95% | 91.57% |
| 3 | 3.08 × 10⁻⁹ | 67.08% | 92.22% |
| 4 | 3.46 × 10⁻⁹ | 60.20% | 88.71% |
| 5 | 1.97 × 10⁻⁹ | 60.42% | 85.10% |
| 6 | 4.46 × 10⁻⁹ | 67.19% | 92.22% |
| Location a | Non-Retrofitted b | Damage Reduction by 20% Pre-Stress c | Damage Reduction by 40% Pre-Stress c |
|---|---|---|---|
| 1 | 2.88 × 10⁻¹⁰ | 50.44 | 87.09% |
| 2 | 2.93 × 10⁻¹⁰ | 50.37 | 87.15% |
| 3 | 3.92 × 10⁻¹⁰ | 48.96 | 88.22% |
| 4 | 3.89 × 10⁻¹⁰ | 48.87 | 88.27% |
| 5 | 3.80 × 10⁻¹⁰ | 47.93 | 90.08% |
| 6 | 3.78 × 10⁻¹⁰ | 48.03 | 90.11% |
| 7 | 3.39 × 10⁻¹⁰ | 47.09 | 92.04% |
| 8 | 3.57 × 10⁻¹⁰ | 47.45 | 92.03% |
| 9 | 2.45 × 10⁻¹⁰ | 46.78 | 92.2% |
| 10 | 9.39 × 10⁻¹¹ | 46.86 | 92.2% |
| 11 | 3.28 × 10⁻¹¹ | 45.45 | 92.2% |
| 12 | 3.54 × 10⁻¹¹ | 46.08 | 92.2% |
4.2. Results of Sub-Model
4.2.1. Effect of Rivet Clamping Force
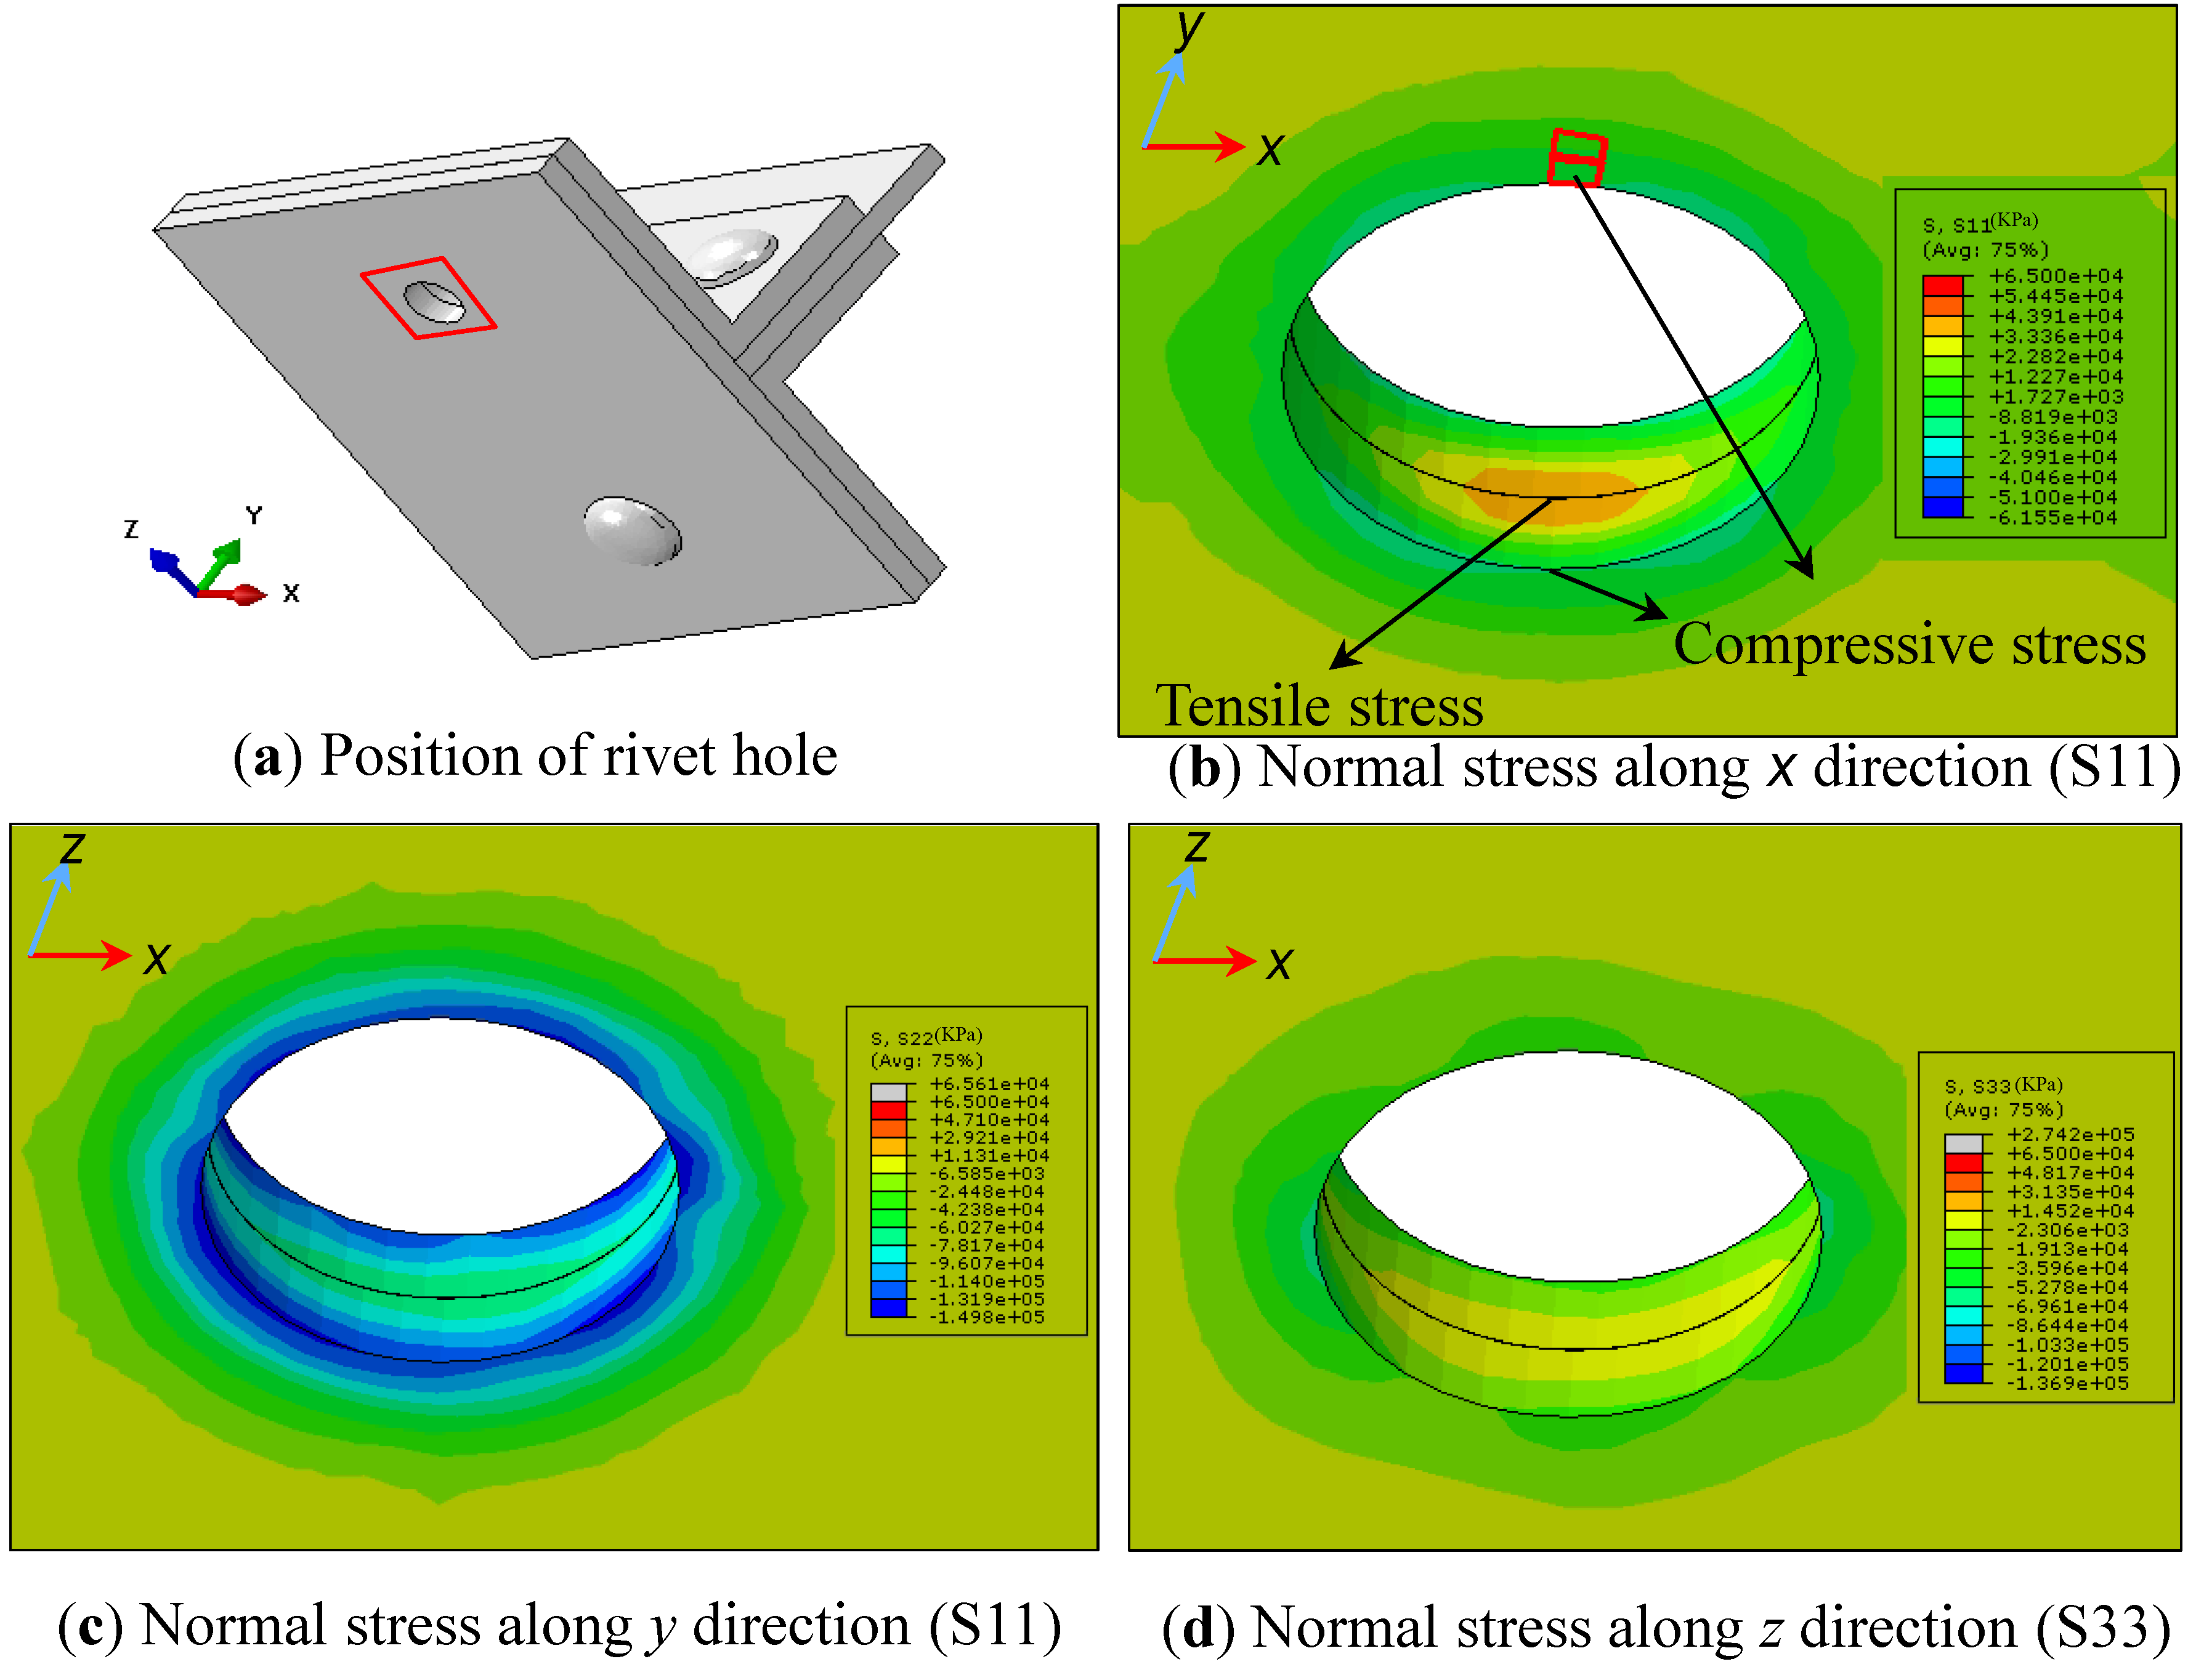
4.2.2. The Most Critical Location for Fatigue Cracking


5. Discussion on the Effect of Fully Compressive Cyclic Loads on Crack Initiation
6. Conclusions
- (1)
- The most fatigue critical locations among the longitudinal-to-cross beam connections and the cross-beam bottom flanges were determined, with the cross beam bottom flanges being relatively more critical.
- (2)
- Application of an initial compression in metal using pre-stressed CFRP plates has negligible effect on the stress range. The delay in crack initiation phase is achieved through the decrement of the stress ratio (mean stress).
- (3)
- As expected, increased amount of CFRP pre-stress resulted in decreased fatigue damage at all bridge locations.
- (4)
- With an applied 40% σu CFRP pre-stress, more than 87% and 85% reductions in fatigue damage are calculated at the longitudinal-to-cross beam connections and cross-beam bottom flanges, respectively.
- (5)
- The pre-stressed CFRP retrofit has a lower positive effect on fatigue damage reduction at the longitudinal-to-cross beam connection compared to the cross beam bottom flanges (45% reduction versus 60% reduction at a 20% σu,CFRP pre-stress level) due to deformation induced stresses from the longitudinal members.
- (6)
- The results from riveted joint sub-model showed the most fatigue prone location to be on the edge of the rivet hole at the interface of two steel plates.
Acknowledgments
Author Contributions
Conflicts of Interest
References
- Ghafoori, E.; Motavalli, M.; Botsis, J.; Herwig, A.; Galli, M. Fatigue strengthening of damaged metallic beams using prestressed unbonded and bonded CFRP plates. Int. J. Fatigue 2012, 44, 303–315. [Google Scholar] [CrossRef]
- ABAQUS Standard User’s Manual; Version 6.4; Hibbitt, Karlsson, and Sorensen Inc.: Pawtucket, RI, USA, 2004.
- Vassilopoulos, A.P.; Manshadi, B.D.; Keller, T. Piecewise non-linear constant life diagram formulation for FRP composite materials. Int. J. Fatigue 2010, 32, 1731–1738. [Google Scholar] [CrossRef]
- Ghafoori, E.; Asghari, M. Dynamic analysis of laminated composite plates traversed by a moving mass based on a first-order theory. Compos. Struct. 2010, 92, 1865–1876. [Google Scholar] [CrossRef]
- National Cooperative Highway Research Program (USA). Dynamic Impact Factors for Bridges, NCHRP Synthesis 266; National Academy Press: Washington, DC, USA, 1998. [Google Scholar]
- Smith, I.; Lestuzzi, P. Dynamique des Structures, Polycopié du Cours; EPFL: Lausanne, Switzerland, September 2011. [Google Scholar]
- Zhou, Y. Fatigue Strength Evaluation of Riveted Bridge Members. Ph.D. Thesis, Lehig University, Bethlehem, PA, USA, May 1994. [Google Scholar]
- Imam, B.M.; Righiniotis, T.D.; Chryssanthopoulos, M.K. Numerical modelling of riveted railway bridge connections for fatigue evaluation. Eng. Struct. 2007, 29, 3071–3081. [Google Scholar] [Green Version]
- Basseti, A. Lamelles Précontraintes en Fibres Carbone Pour le Renforcement de Ponts Rivetés Endommagés par Fatigue; Thèse N 2440, ICOM; EPFL: Lausanne, Switzerland, 2001. [Google Scholar]
- Zhou, Y.E.; Yen, B.T.; Fisher, J.W.; Sweeney, R.A.P. Examination of fatigue strength (Sr–N) curves for riveted bridge members. In Proceedings of the 12th Annual Bridge Conference, Montreal, Canada, 1995; pp. 102–109.
- European Community (EC). Guidline for Load and Resistance Assessment of Existing European Railway Bridges; European Commission Sixth Framework Programme, Sustainable Bridges: Malmö, Sweden, 2007. [Google Scholar]
- Strain Checker FGMH-1. Tokyo Sokki Kenkyujo Co., Ltd.: Tokyo, Japan, 2005.
- SIA 269/3—Existing Structures: Steel Structures; Swiss Society of Engineers and Architects (SIA): Zurich, Switzerland, 2011.
- Eurocode_3. In Design of Steel Structrues—Part 1–9: Fatigue; European Standard EN 1993–1-9: Brussels, Belgium, 1993.
- Budynas, R.G.; Nisbett, J.K. Shigley’s Mechanical Engineering Design, 8th ed.; McGraw-Hill: Singapore, 2008. [Google Scholar]
- Ghafoori, E.; Schumacher, A.; Motavalli, M. Fatigue behavior of notched steel beams reinforced with bonded CFRP plates: Determination of prestressing level for crack arrest. Eng. Struct. 2012, 45, 270–283. [Google Scholar] [CrossRef]
- Hermann, R. Fatigue crack growth in ductile materials under cyclic compressive loading. Fatigue Fract. Eng. Struct. 1994, 17, 93–103. [Google Scholar]
- Koichi, K.; Takahiro, S.; Souichi, K.; Tetsuo, S.; Kazumune, K.; Tadashi, S. Fatigue crack growth under compressive loading. J. Nucl. Mater. 1998, 258–263, 2059–2063. [Google Scholar] [CrossRef]
- Fleck, N.A.; Shin, C.S.; Smith, R.A. Fatigue crack growth under compressive loading. Eng. Fract. Mech. 1985, 21, 173–185. [Google Scholar] [CrossRef]
© 2014 by the authors; licensee MDPI, Basel, Switzerland. This article is an open access article distributed under the terms and conditions of the Creative Commons Attribution license (http://creativecommons.org/licenses/by/3.0/).
Share and Cite
Ghafoori, E.; Prinz, G.S.; Mayor, E.; Nussbaumer, A.; Motavalli, M.; Herwig, A.; Fontana, M. Finite Element Analysis for Fatigue Damage Reduction in Metallic Riveted Bridges Using Pre-Stressed CFRP Plates. Polymers 2014, 6, 1096-1118. https://doi.org/10.3390/polym6041096
Ghafoori E, Prinz GS, Mayor E, Nussbaumer A, Motavalli M, Herwig A, Fontana M. Finite Element Analysis for Fatigue Damage Reduction in Metallic Riveted Bridges Using Pre-Stressed CFRP Plates. Polymers. 2014; 6(4):1096-1118. https://doi.org/10.3390/polym6041096
Chicago/Turabian StyleGhafoori, Elyas, Gary S. Prinz, Emmanuel Mayor, Alain Nussbaumer, Masoud Motavalli, Andrin Herwig, and Mario Fontana. 2014. "Finite Element Analysis for Fatigue Damage Reduction in Metallic Riveted Bridges Using Pre-Stressed CFRP Plates" Polymers 6, no. 4: 1096-1118. https://doi.org/10.3390/polym6041096