Article

A Coarse-Grained DNA Model Parameterized from Atomistic Simulations by Inverse Monte Carlo

1
School of Biological Sciences, Nanyang Technological University, 639798, Singapore
2
Division of Physical Chemistry, Arrhenius Laboratory, Stockholm University, Stockholm, S 10691, Sweden
*
Authors to whom correspondence should be addressed.
Polymers 2014, 6(6), 1655-1675; https://doi.org/10.3390/polym6061655
Submission received: 15 April 2014 / Revised: 15 May 2014 / Accepted: 18 May 2014 / Published: 30 May 2014
(This article belongs to the Special Issue Polyelectrolytes 2014)

Abstract

:
Computer modeling of very large biomolecular systems, such as long DNA polyelectrolytes or protein-DNA complex-like chromatin cannot reach all-atom resolution in a foreseeable future and this necessitates the development of coarse-grained (CG) approximations. DNA is both highly charged and mechanically rigid semi-flexible polymer and adequate DNA modeling requires a correct description of both its structural stiffness and salt-dependent electrostatic forces. Here, we present a novel CG model of DNA that approximates the DNA polymer as a chain of 5-bead units. Each unit represents two DNA base pairs with one central bead for bases and pentose moieties and four others for phosphate groups. Charges, intra- and inter-molecular force field potentials for the CG DNA model were calculated using the inverse Monte Carlo method from all atom molecular dynamic (MD) simulations of 22 bp DNA oligonucleotides. The CG model was tested by performing dielectric continuum Langevin MD simulations of a 200 bp double helix DNA in solutions of monovalent salt with explicit ions. Excellent agreement with experimental data was obtained for the dependence of the DNA persistent length on salt concentration in the range 0.1–100 mM. The new CG DNA model is suitable for modeling various biomolecular systems with adequate description of electrostatic and mechanical properties.

Graphical Abstract

1. Introduction

During decades, the DNA molecule has been studied in a vast number of experimental, theoretical, and modeling research investigations. The study of polyelectrolyte properties of DNA takes an important place in these works since electrostatic interactions and salt effects have a profound influence on many other DNA properties and interactions of DNA with its surrounding. An important problem in this context is related to understanding the mechanism of DNA compaction and self-assembly. In the nucleus of eukaryotic cells, the DNA molecule exists as a hierarchically ordered structure formed by the nucleosome core particles consisting of complexes of DNA with histone proteins, and there are strong indications [1,2,3,4] that the stability of chromatin (and, thus, DNA transcription and replication) is modulated by electrostatic interactions. The problem of polyelectrolyte and DNA condensation in solution has a long history of experimental studies [5,6]. Like-charged polyelectrolytes would be expected to repel each other based on a treatment of the electrostatics using mean field theories (e.g., the Poisson-Boltzmann equation). However, dynamic ion-ion correlations give rise to attractive electrostatic force contributions that can explain experimental aggregation of DNA induced by multivalent cations [7,8,9,10,11,12]. In order to model and describe the folding and aggregation of chromatin, Poisson-Boltzmann based models, including the popular Debye-Hückel type approaches [13,14,15], have serious limitations which may be a source of artefacts in predictions of aggregation properties. The reason is that such models do not include effects due to the explicit presence of mobile ions and also do not take into account the molecular nature of the solvent.
An accurate description of molecular properties of condensed matter can in principle be reached by using atomistic molecular dynamics computer simulations. With computer simulations, we are able to follow every detail of the molecular motion and give, within some theoretical model, quantitative answers, directly comparable with experiments, thus, providing a link between the theory and the experiment. This is especially important in studies of macromolecular systems, such as biopolymers, which always have a certain degree of intrinsic disorder. At present, computer simulations have reached a state where simulation times and length scales allow a direct comparison with experiments in well-characterized systems. Molecular simulations are also becoming an intrinsic part of applied research, such as drug design, materials science, and nanotechnologies.
In order to model very large condensed matter systems such as DNA-nucleosome complexes, an atomistic description is not practical as the number of particles would be very large. Therefore, simplified coarse-grained (CG) models are necessary, allowing a coarser description of the molecules and interactions when moving towards description at larger length and time scales. Many of today’s coarse-grained models are constructed from empirical parameterization of effective interaction potentials and usually do not contain a rigorous description of the molecular water [16,17]. For example, in the primitive electrolyte model, ions are presented as charged hard spheres interacting in a media with dielectric permittivity of water. Within a multi-scale modeling scheme, the macromolecules can be reduced to a CG description with effective sites, representing many atoms. The interactions between the CG sites are represented by effective potentials that include the effects of the water solvent and which are deduced from the atomistic simulations. This enables the modeling of very large molecular assemblies, with a reduction of the number of particles of several orders of magnitudes, but still using effective forces that implicitly include a detailed description at the atomic level. Simulations of such large systems can then be performed over a range of time scales and hence it is a multi-scale approach. There are two basic approaches for constructing effective coarse-grained potentials from the results of atomistic simulations. One is based on fitting of structural properties, for which the radial distribution functions (RDFs) are typically used (the inverse Monte Carlo, also called the Newton inversion method) [18,19]. Another approach is based on reproduction of forces for specific snapshots of the system (the force matching approach) [20,21]. The former approach is also equivalent to the principle of relative entropy minimization [22], and, together with the force matching methodology, can be described within a general information function concept [23]. The statistical-mechanical equations expressing the canonical properties in terms of parameters of the potential functions can be inverted and solved numerically according to the iterative Newton scheme. In the Inverse Monte Carlo method, RDFs are inverted to reconstruct pair potentials, while in a more general approach the targets can be other canonical averages [18].
A number of theoretical coarse-graining models of DNA [24,25,26,27,28,29,30,31,32,33,34,35] and chromatin [13,14,15,36,37,38,39,40,41,42,43,44,45,46,47,48,49] have been reported recently. In recent works from the Papoian group, a CG model of a single DNA molecule was developed [24,25,26,50]. The model is based on underlying atomistic simulations, using an approach that is similar to the inverse MC method (called molecular renormalization group coarse-graining). DNA was coarse-grained into two chains of sites representing the phosphate groups with bond-only interactions in between them. A recent all-atom simulation of a single NCP applied Boltzmann inversion to obtain effective potentials that were used in a CG NCP simulation [40,51], but as it is based on the Boltzmann inversion, it is of limited value for treating long-range electrostatic interactions [52].
We have previously performed modeling of an NCP solution [38,47] and of a chromatin fiber (a nucleosome array) [53,54,55]. These simplified coarse-grained continuum electrostatic simulation models were successfully applied to qualitatively reproduce histone tail-mediated chromatin folding and nucleosome core particle aggregation [38,47,54] induced by multivalent cations. Long-range electrostatic interactions were included by the presence of explicit mobile ions (representing the salt), but using a simplified structural model of the NCP and of the charge distribution on the array. The effects of the molecular nature of water were not included as the description is based on a continuum dielectric approximation of the solvent.
An advanced coarse-grained DNA model was recently introduced by us [56] in order to model DNA in nucleosome complexes. It consists of two types of sites: DNA core (“D”) beads, each representing two base pairs and “P” beads, representing phosphate groups. The internal DNA structure was maintained by four bond potentials (D–D, D–P, P–P, and P–P across minor grove) and three angular potentials (D–D–D, P–P–P and P–D–P), see Figure 1A,B. All these potentials were of harmonic type with ad hoc selected parameters and to maintain the integrity of the NCP, the DNA was connected to the histone octamer by artificial bonds. Numerous observations have shown that in solution the NCP behaves as stable structure with rather fixed attachment of the DNA to the histone core [57,58,59,60,61], therefore the description of the mechanical properties of the DNA when modeling NCP-NCP interactions dominated by electrostatic forces is not critical. However, adequate modeling bending and torsional flexibility of the DNA becomes crucial in the description of chromatin structure and dynamics when a realistic model of the chromatin fiber as a linear array of NCPs connected by stretches of linker DNA is being developed.
Figure 1. Coarse-Grained DNA model and definition of sites and intramolecular interactions: (A) A 5-site two base pair elementary DNA unit. The central particle (green) approximates the pentose and base atoms of a two base pair DNA fragment. The orange beads represent the phosphate groups at the positions of an idealized B-form double helix; (B) The geometry of the CG model of double helical DNA with bonds and angles set to maintain B-form conformation. Equilibrium values of bond lengths and angles shown in the figure were calculated by the IMC method from data of all-atom MD simulations (see Table 1); (C). Superimposed all-atom and coarse-grained representation of the 22-bp fragment of DNA; All-atom DNA shown in stick representation (blue color); the CG model of DNA is a combination of particles placed at the centers of mass of the phosphate group (orange) and atoms of the pentose and bases from the 2-bp unit (green spheres). Data from all-atom MD simulations of the four 22-bp DNA fragments was used to determine the structure and force parameters for the CG DNA.
Polymers 06 01655 g001
In the present work we parameterize the coarse-grained DNA model introduced in [56] (Figure 1A,B) with the aim to reproduce the experimental salt dependence of DNA flexibility. The parameterization is based on atomistic simulations of DNA oligomers in water solution with K+ as counterions. The internal coarse-grained DNA potentials are then computed by the inverse Monte Carlo method using the MagiC software [62] to reproduce the internal DNA structure and dynamics obtained in atomistic simulations. The Inverse Monte Carlo method with this software has been shown to be robust and rigorous [63] and is implemented with 2-body interactions as well as 3-body angular potentials and the inclusion of these interactions can be done straightforwardly and with high efficiency in computational effort. Our model and parameters are then benchmarked in simulation of a 200 bp long DNA fragment in the presence of explicit salt at varying concentrations. Without any further adjustment of the obtained DNA internal structural parameters, remarkably good agreement with experimental persistent length (LP) data was obtained for the salt-dependent bending behavior of DNA over a wide range of salt from 0.0001 M to 0.1 M, while the torsional rigidity of the present CG-DNA model requires further optimization. Potentially the proposed CG model could be further developed to include sequence-specific dependence of DNA flexibility. However, this CG model does not include modeling separation of the DNA strands.

2. Methodology

2.1. Design of the Flexible CG DNA Model and Principles of Its Parameterization
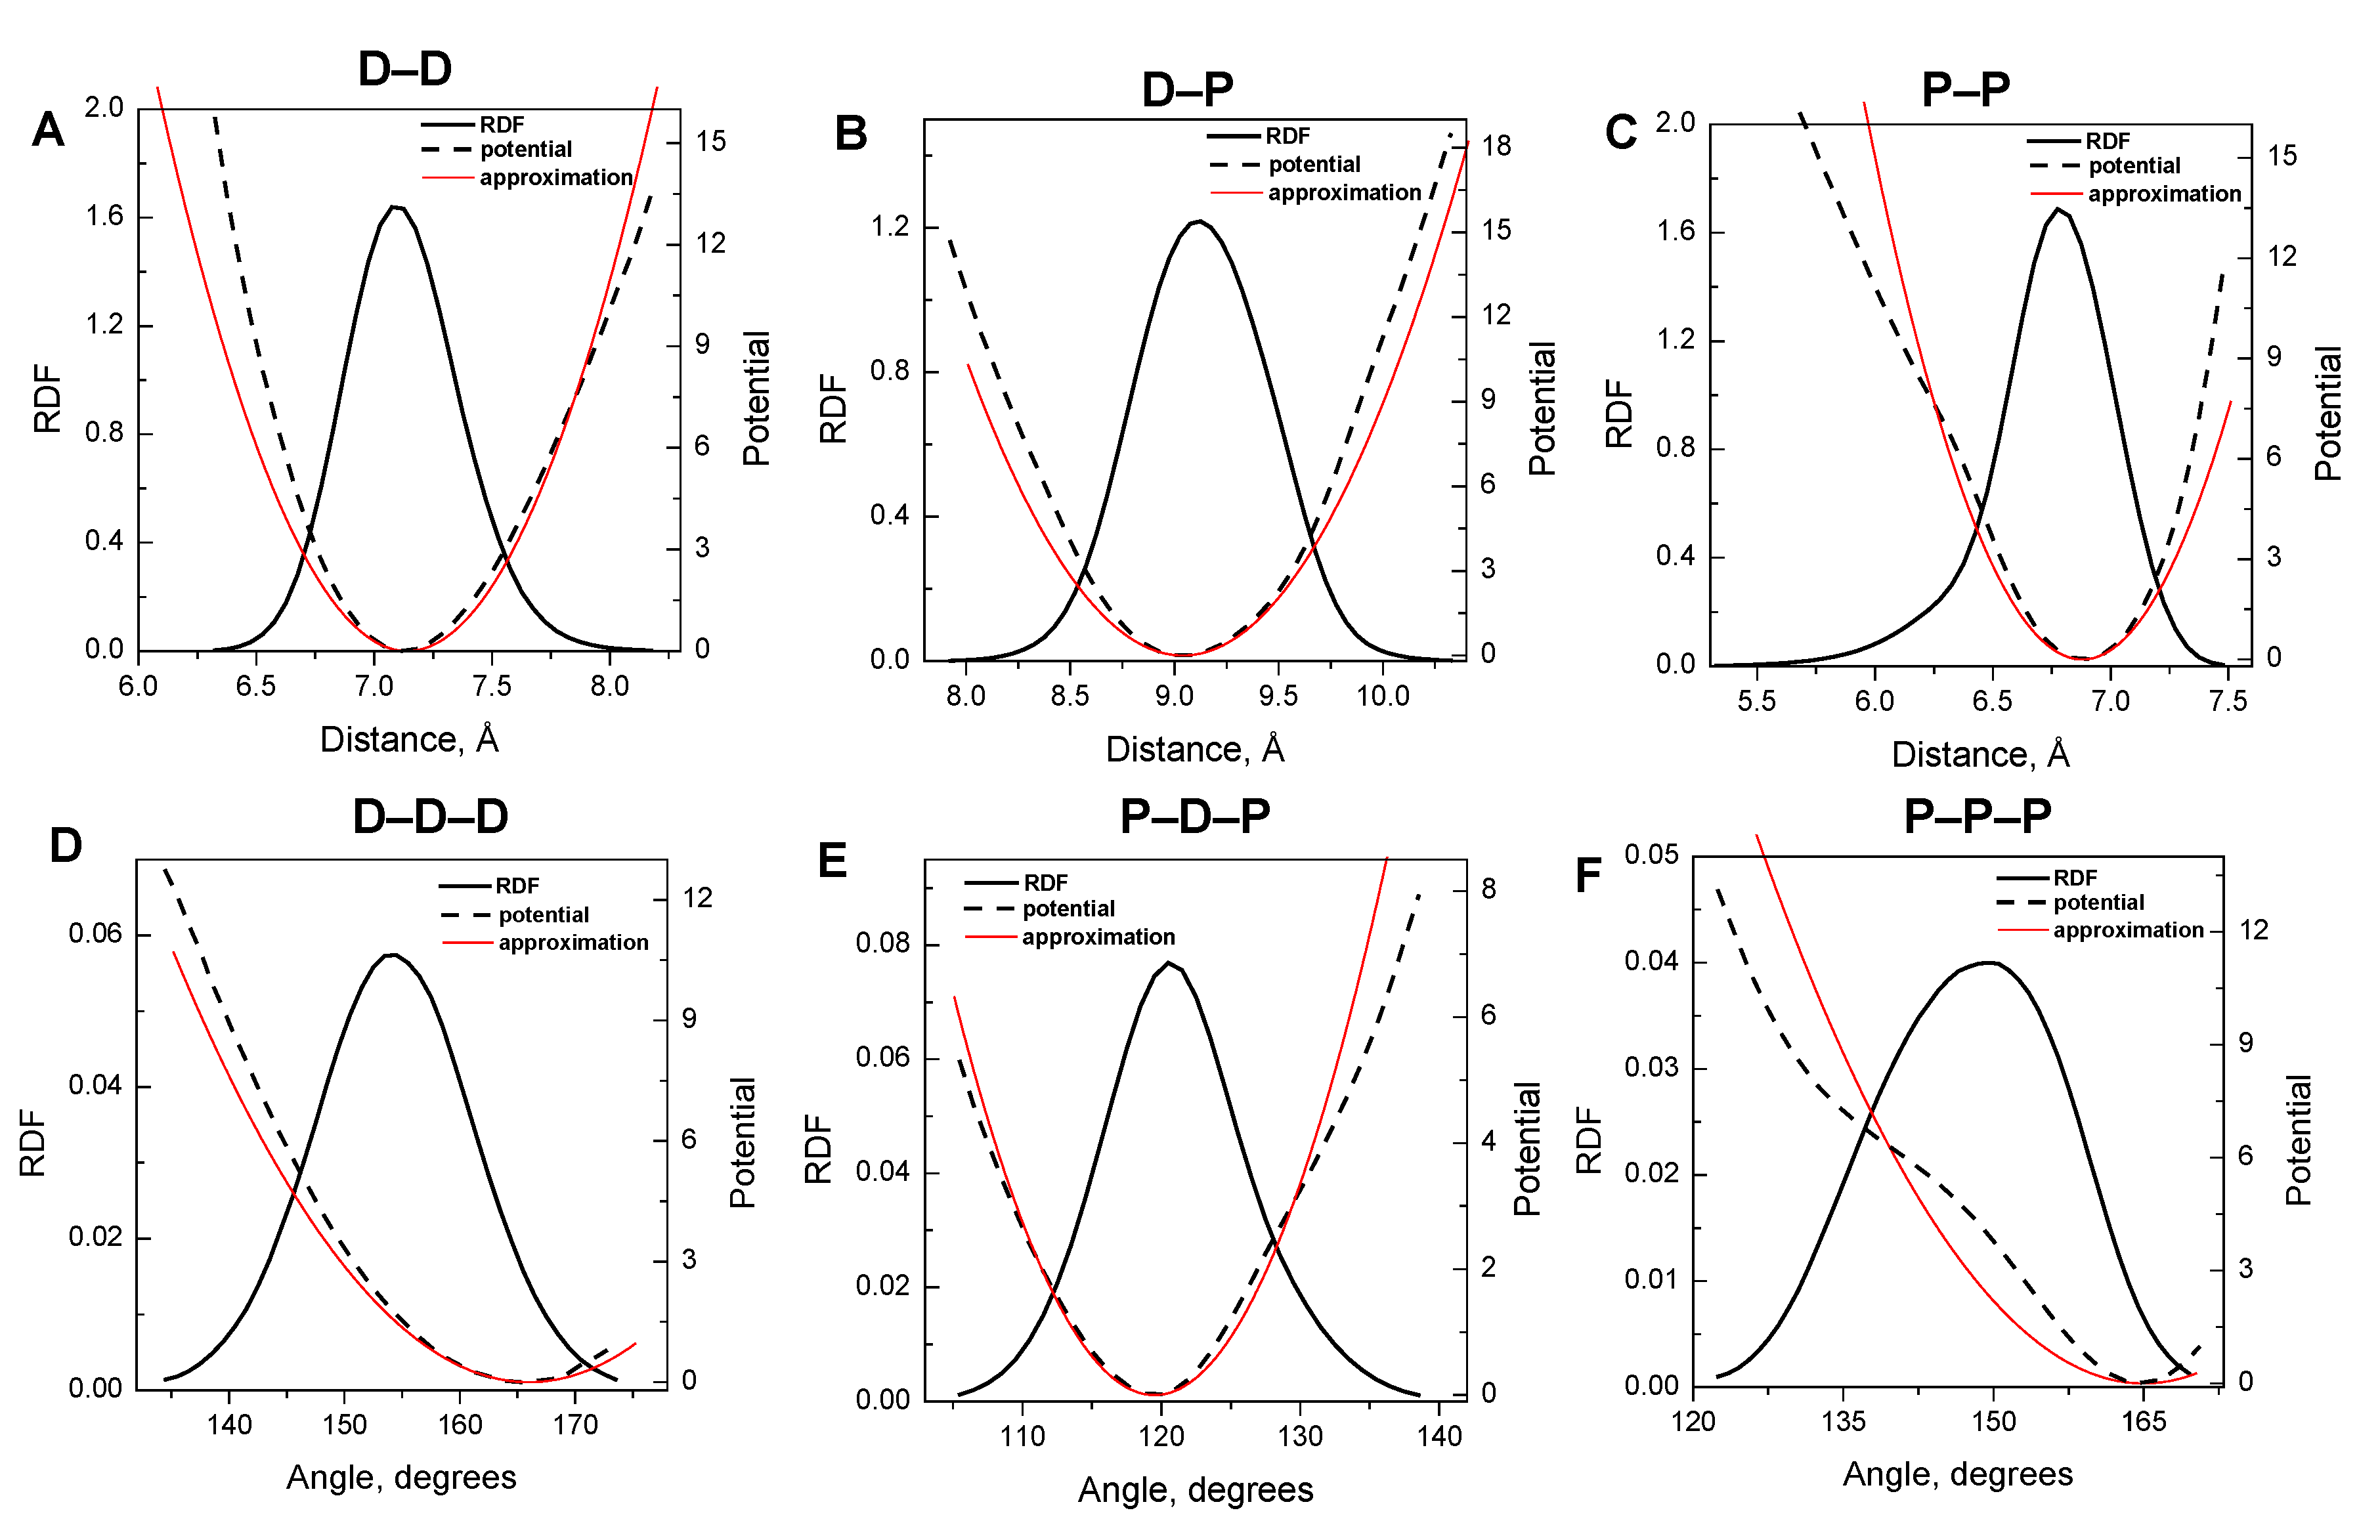
The aim of the present CG approach is to develop a model that is simple enough in its design and yet captures the structural form and properties of double helical B-form DNA, which is suitable for rigorous parameterization based on all atom MD simulations followed by the inverse Monte Carlo method to obtain relevant CG DNA structural and interaction potentials. The model should also pay particular emphasis to electrostatic interactions, which includes explicit mobile ions and explicit charges of DNA phosphate groups and it should also have the potential for refinements, such as inclusion of base sequence specificity (presently not considered).
To satisfy this level of precision, we have chosen to describe the system via a collection of coarse-grained beads representing different fragments of the DNA with intramolecular bonded potentials that maintains the DNA structural integrity while reproducing experimentally observed flexibility of the B-DNA double helix. DNA is modeled as a sequence of units each representing a two base pair fragment of DNA. Each unit consists of five beads, four P units that represent the phosphate groups and one D unit corresponding to the four pentoses with attached base fragments in between (Figure 1A). The double-helix DNA structure was maintained by three bond and three angular potentials between the beads listed in Table 1 (the P–P bond potential across minor groove introduced in [56] was found unnecessary to keep the helical structure and was not included into the current model). The equilibrium geometry of the beads corresponds closely to the B-form of DNA and the whole structure forms a helical DNA with two clearly distinguishable strands of phosphate groups and minor and major grooves between them (Figure 1B). The overall DNA structure thus resembles space-filling grooved DNA models used previously to model the ionic environment of DNA [12,64,65,66].
Table 1. Parameters of the coarse-grained (CG) DNA model developed from the inverse Monte Carlo analysis [62] using data of all atom molecular dynamic (MD) simulations. Force constants were derived from potential functions approximated by harmonic potential.
Type of bond/angleEquilibrium
distance/angle
IMC derived force constant
(kBT·Å−2 or kBT·rad−2)
D–D bond7.14 Å14.8
D–P bond9.04 Å9.7
P–P bond6.88 Å19.4
D–D–D angle166.00°37.0
P–D–P angle119.50°100.0
P–P–P angle165.00°32.0

2.2. Atomistic Molecular Dynamics Simulations

Atomistic MD simulations were run for four 22-bp DNA oligomers (sequence 5’-d(GATGCAGTCACCGCGAATTGGC) × 5’-d(GCCAATTCGCGGTGACTGCATC)) dissolved in 21,200 water molecules with 168 K+ counterions. The initial structure of the DNA double helix was built using the NAB package [67] with idealized B-DNA structure parameters. The simulation software was the Gromacs package [68,69] with the CHARMM27 force field [70,71] using the simple point charge model of water TIP3P [72,73,74]. The dimension of the cubic simulation cells was set to 90 Å. The system was equilibrated by energy minimization at 50 K keeping DNA fixed followed by release of the DNA constraints and running a series of 10 ps MD simulations under constant volume conditions (NVT) with stepwise heating (50 K, 40 ps) from 50 K to 298 K. Subsequently, the cell size was decreased by about 2 Å in order to reproduce a pressure fluctuating around 1 bar in the NVT ensemble. The temperature was controlled by the Nose-Hoover thermostat applied separately for DNA and solvent, with relaxation time 0.3 ps. All the bonds were constrained using LINKS algorithm allowing for time step 2 fs. The Lennard-Jones interactions were cutoff at 9 Å. The long-range electrostatic interactions were treated by the particle mesh Ewald method [75] of order 4 with Fourier grid spacing 0.8 Å and tolerance 10−5. Simulations were run for 40 ns collecting atom coordinates with 1 ps resolution. Detailed description of the simulations and major results are reported in our earlier work [76].

2.3. Coarse-Grained DNA and Computations of Effective Potentials

The trajectories of the atomistic simulations were mapped onto the CG DNA model producing a CG trajectory. The P sites were determined by the positions of the phosphates of the atomistic model and the D cites were computed as center-of-masses of the atoms belonging to the two base pairs involved. Superposition of the atomistic DNA structure on our 5-site CG-model is displayed in Figure 1C. In order to take into account possible end effects, special types “DT” and “PT” were defined for the terminal sites in addition to the two site types for description of all other (not terminal) CG DNA sites. The counterions were also included into CG trajectory. The CG trajectory generated from the atomistic simulations was used to extract effective coarse-grained potentials by the inverse Monte Carlo method [19,62]. For that, radial distribution functions between the sites of the CG model, as well as internal bond and angle distributions between the CG sites were determined from the CG trajectory and were used as input to the inverse Monte Carlo procedure. The CG sites connected by bonds or angles were excluded from the non-bonded interactions, as well as from intermolecular RDF calculations. Since the CG system consists of 5 different site types (four DNA particles: “D”, “P”, “DT” and “PT” plus DNA counterions, K+), totally 15 pairs of intermolecular distribution functions were computed from the CG trajectory. Additionally, distributions of bond distances and angles, corresponding to bond and angle internal DNA potentials (see Figure 1B) were computed. Taking into account that the end sites were assigned special types, the total number of bond potentials (and, hence, bond length distributions) became 8 and the total of number of angular potentials (and angular distribution) became 6. As a result of the inverse Monte Carlo computations, effective pair potentials between all CG sites, and internal bond and angle potentials were determined which reproduce the RDFs, as well as bond and angle distributions of the atomistic model. The computations were carried out using the software package MagiC [62].
We also performed inverse Monte Carlo calculations without distinguishing the oligomer terminal groups in order to check their effect. As expected, the effect of the terminal groups was non-negligible and we discuss this in the Results Section below.

2.4. Coarse-Grained DNA Model: Large-Scale Simulations

In the present work we have used the results of the inverse MC procedure to obtain the parameters that determines the internal structure and flexibility of the coarse-grained DNA model, the topology of which is illustrated in Figure 1 and that includes harmonic interactions for bonds and angles [56].
The bond and angle potentials for the bound sites were approximated by the equations:
Polymers 06 01655 i001
Polymers 06 01655 i002
where kb, ka, and r0, φ0 are respectively bond and angle force constants and equilibrium values for bond length and angle. The final parameters for the bonded interactions are given in Table 1 and a detailed discussion on this fitting is given below.
During this first test of the model, only internal DNA rigidity parameters were fitted to the results of the inverse Monte Carlo computations, while the standard Coulombic potential Equation (3), for charges (qi, qj) in a dielectric continuum with permittivity ϵ = 78, and short-range potential defined by Equation (4) were used to describe non-bonded interactions:
Polymers 06 01655 i003
Polymers 06 01655 i004
Here (i, j) are bead numbers. In Equation (4) the hard core particle contact distance Rij = Ri + Rj is determined by the values of the hard core radii of both beads. Parameters σij and Polymers 06 01655 i008 were set to σij = 4 Å and Polymers 06 01655 i008 = 1 (kBT units) for all interactions. Thus, the effective radius of each particle was determined by a sum of the soft radius of σij/2 = 2 Å and the hard radius Ri which was defined separately for each particle type. The hard radii Ri as well as charges qi are given in Table 2. The charges were obtained by summation of partial charges of the corresponding CG groups of the CHARMM27 force field. Thus, the total interaction potential (potential energy) of the system is:
Polymers 06 01655 i005
In the present CG application, which aims to parameterize the DNA internal parameters with the purpose of reproducing its salt dependent bending flexibility, we consider the solvent as a dielectric medium. These interaction potentials represent an approximation to the solvent-mediated effective potential between the charged particles in the solvent medium. Thus, ε is a parameter of the effective ion-ion potential. Many studies at an all atom level have shown that the effective potential of mean force of ions in water usually have one or two oscillations around the Coulomb potential with ϵ = 78 for small (within 8 Å) distances between the ions [77]). These oscillations reflect the molecular nature of the solvent. Since the global conformational DNA properties on the scale of a few tens of nm are determined mainly by the long-range electrostatic interactions, and the IMC-derived effective potentials essentially coincide with the Coulombic potential scaled by the appropriate dielectric constant for distances larger than about 8 Å, we do not expect major effects of neglecting the solvent-induced oscillations in the effective potentials on calculation of the monovalent salt dependence of the DNA persistence length (though this question is definitely worth discussing, which will be a subject of future work). For many applications, including strong polyelectrolytes and high (physiological) salt concentrations, continuum dielectric models with constant dielectric permittivity have been very successful [78,79].
In a dielectric continuum model the ion interactions play an important role. It is important to assign appropriate radii, reflecting the effective hydration of the ions. Here, the following values of the hard radii were used: R(K+) = R(Cl) = 0, which corresponds to effective radii of 2.0 Å for these monovalent ions. The phosphate group of DNA was approximated as a bead with radius R (P) = 1.0 Å, which gives an effective radius of 3.0 Å. The choice of sizes for K+ and Cl is justified by our previous extensive comparison of experimental as well as computer modeling results of ion-DNA, ion-NCP and ion-chromatin interactions and ion-ion competitions [4,12,53,64,65,80,81,82,83,84]. These values are typical for hydrated ion radii used in a number of models and well reproduce thermodynamic properties and the features of ion distributions compared to all-atom simulations [12,65,66,82,85]. They also fit well the radius of the repulsive core region of the effective potentials derived within the IMC procedure, which is reflected in the corresponding RDFs in Figure S2 of the Supporting Material.
Table 2. Non-bonded parameters of the coarse-grained DNA model.
SiteChargeRadius Ri (Å)
D (DNA)+0.84.0
P (DNA)−1.21.0
K+ (ion)+1.00.0
Cl (ion)−1.00.0
The CG DNA model defined by the parameters given in Table 1 and Table 2, was used in Langevin dynamics simulations of a 200 bp DNA fragment in presence of different concentration of monovalent salt. The box sizes as well as the number of ions in each simulation are given in Table 3. The friction coefficient and random forces, mimicking the effect of solvent, were set by the dimensionless parameter γ = 0.1. The time step was set to 0.01 in the chosen (reduced) units, and we made a total of 108 MD steps in each simulation run where the first 5 × 10⁷ steps were considered as equilibration. The Langevin dynamics simulations were performed by the ESPResSo package [58]. Convergence of the simulations was checked by comparing the analysis of various parts of the trajectories, which produced essentially the same persistence length values as for the full set of data (data not shown).
We also confirmed that the local structure of DNA remains preserved in comparison to the all-atom simulations from which its structural parameters were derived. The distribution of distances for some pairs of DNA beads were computed (data not shown). The D–D distance showed a somewhat extended average value (7.3 Å, compared to 7.14 Å in the all-atom simulations), corresponding to an increase of about 0.1 Å per base pair. On the other hand, the distribution of P–P bond distances is the same as in the all-atom simulations (with an average of 6.9 Å). These average distances show that the DNA model is robust, while still allowing for fluctuations and that the main features of the double helical DNA are maintained and close to that of the B form structure.
Table 3. Parameters of Langevin simulations (box size and the number of ions) of the coarse-grained DNA model. DNA length was 200 base pairs in all cases.
Ionic strengthBox size
(Å)
Number of cations
(K+)
Number of anions
(Cl)
Uncharged 1800300300
100.0 mM50079007500
30.0 mM50026502250
10.0 mM80034003000
3.0 mM8001300900
1.0 mM800700300
0.3 mM1400900500
0.1 mM1420580180
1 Note: charges of the D and P sites were set to zero.

3. Results and Discussion

3.1. Harmonic Approximation for Internal Potentials

The effective coarse-grained potentials were originally obtained in a tabulated form. In order to facilitate their use in general purpose molecular dynamics software, we approximated the internal bond and angle potentials of DNA by harmonic functions. The results of original potentials for non-terminal DNA sites (output from the inverse MC calculations), their harmonic approximation, as well as the distribution of the corresponding bond lengths and angles (calculated from the all atom MD simulations), are shown in Figure 2. Fitted harmonic parameters are also presented in Table 1.
Merging terminal “P” and “D” particles “contaminates” the statistics, which uses only the central 9 (18 base pairs) DNA units and some of the potential functions lose their parabolic shape. RDFs and potentials for this simplified coarse-graining are given in Figure S1 of the Supporting Material. The reason for these deviations is that the terminal base pairs are more flexible and in one case (of total eight base pairs at the DNA ends) the hydrogen bonds between bases were destroyed and these two nucleotides fluctuated considerably during the simulation run. These fluctuations were reflected by appearance of shoulders in the RDFs and with corresponding changes in the potential functions (see Figure S1).
Figure 2. Radial distribution (RDF, solid lines) and force potential (dashed curves) functions for the internal bonds (A–C) and angles (D–F) of the coarse-grained model of DNA. Types of bonds and angles are indicated at the top of the graphs (see Figure 1B). RDFs were calculated from the data of all-atom MD simulations; potential functions were determined using inverse Monte Carlo method [62]. In calculations of RDFs and potentials 22-bp DNA fragment was coarse-grained on two types (“D” and “P”) particles and particles in the middle of the DNA were treated separately from the particles at the DNA ends. Thin red lines are harmonic approximations of the potential curves. See text for details.
Polymers 06 01655 g002
In addition to the internal bond and angle distributions of the DNA molecules, the combination of the all-atom MD simulations and the inverse MC method generated a set of intermolecular distributions and potentials. This data is presented in Figure S2 of the Supporting Material. Here, we did not use these potentials in the calculations described below aiming at validation of the salt-dependent internal bending flexibility behavior of the CG DNA. Tabulated potentials of the intermolecular interactions might be used in further tests to compare approaches using the complete output from the IMC calculations (with all potentials expressed in tabulated form) with modeling based on analytical description of the intra- and inter-molecular interactions. It is worth mentioning that the intermolecular potentials (shown in Figure S2) are expected to be sensitive to the particular details of the all-atom simulation setup used for their generation while intramolecular potentials are expected to be “universal” and transferable since they are generated from all-atom MD data where only one DNA molecule is present in the simulation cell or when DNA molecules do not interact.

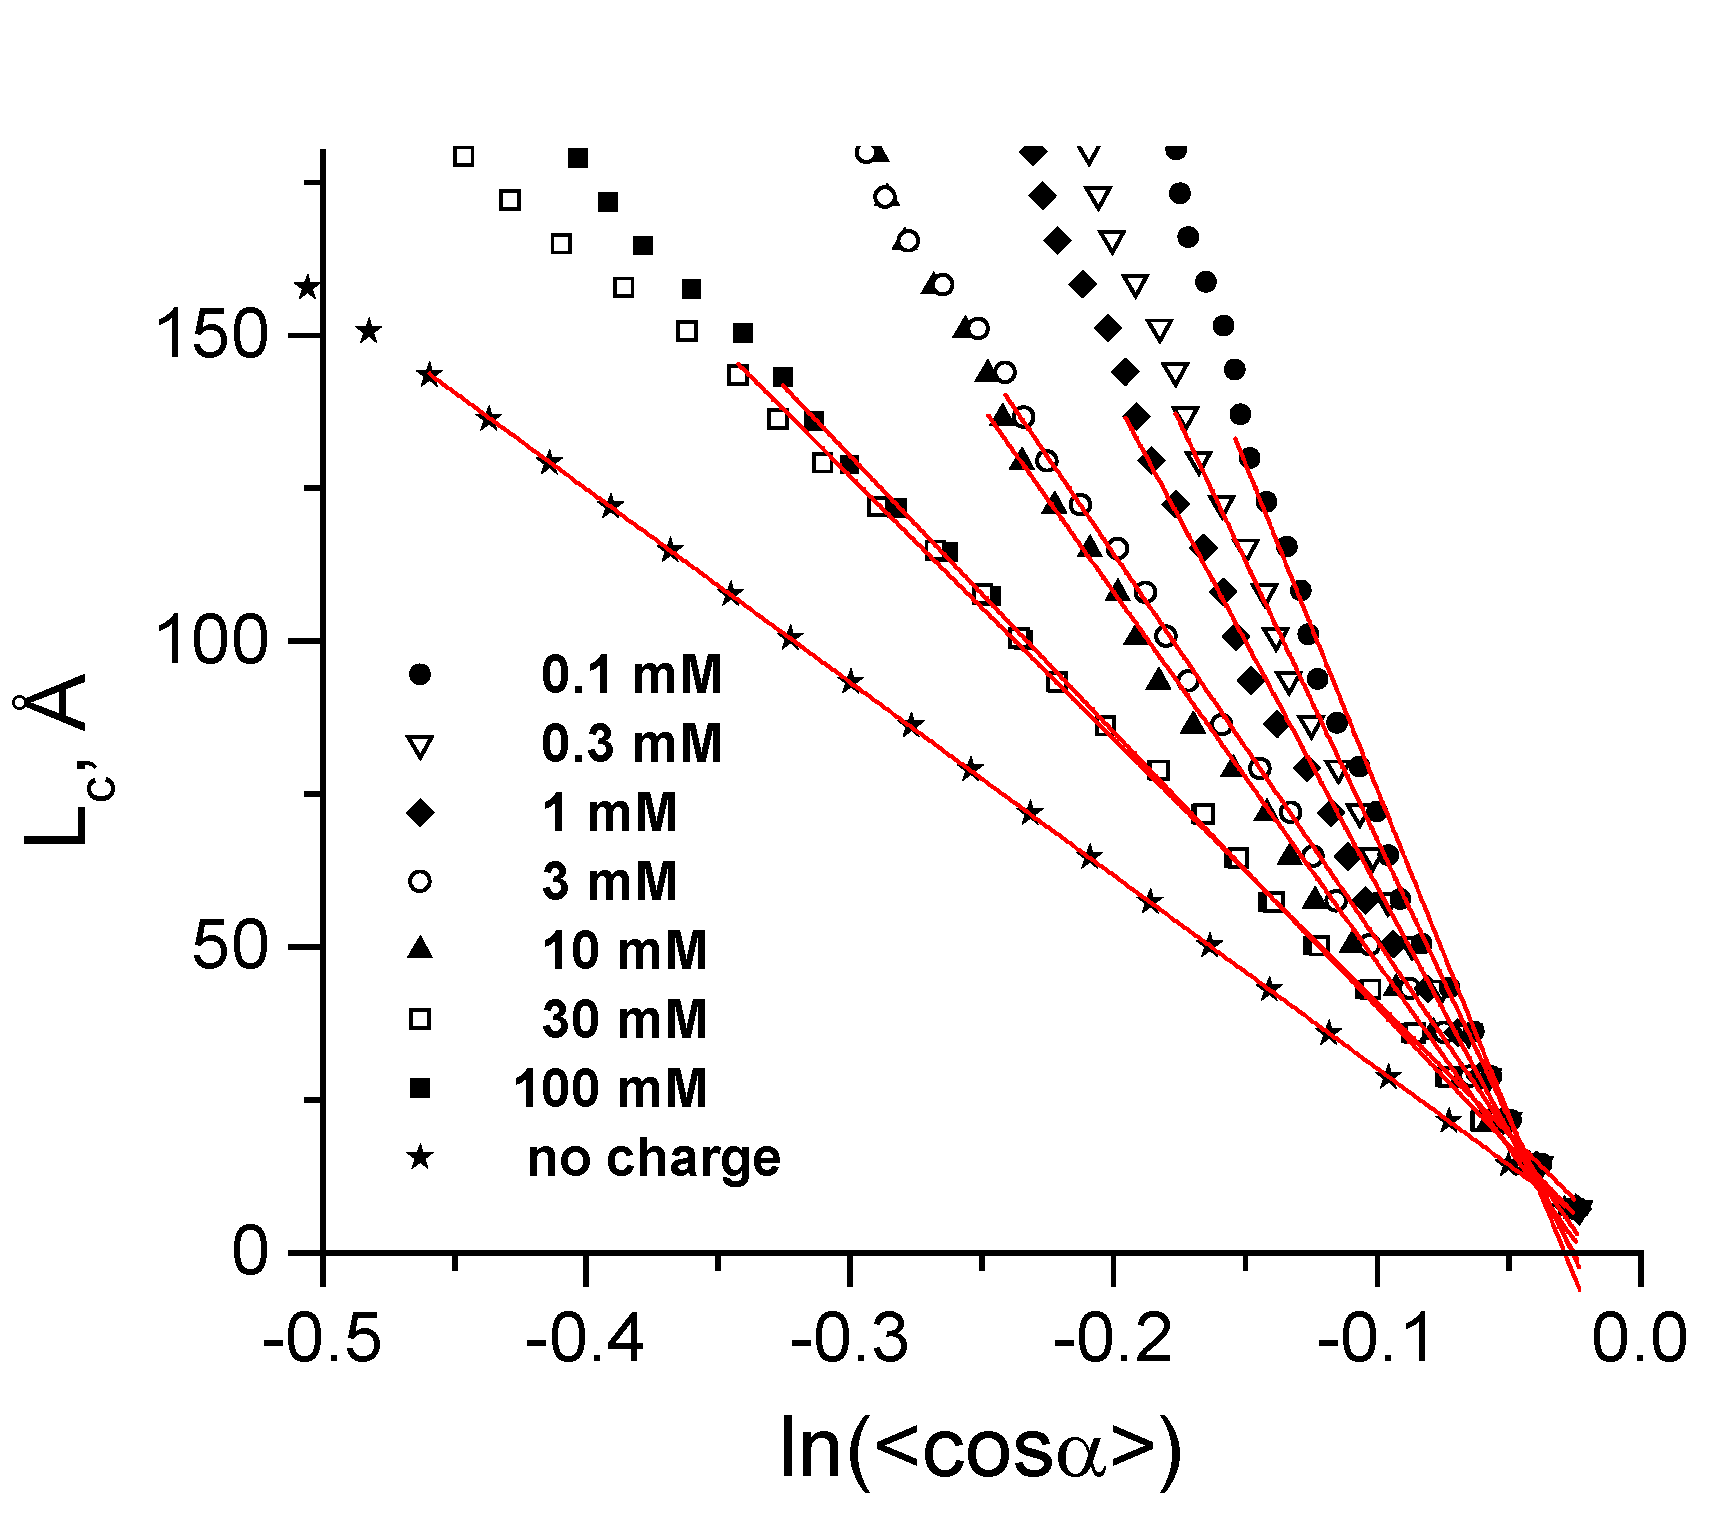
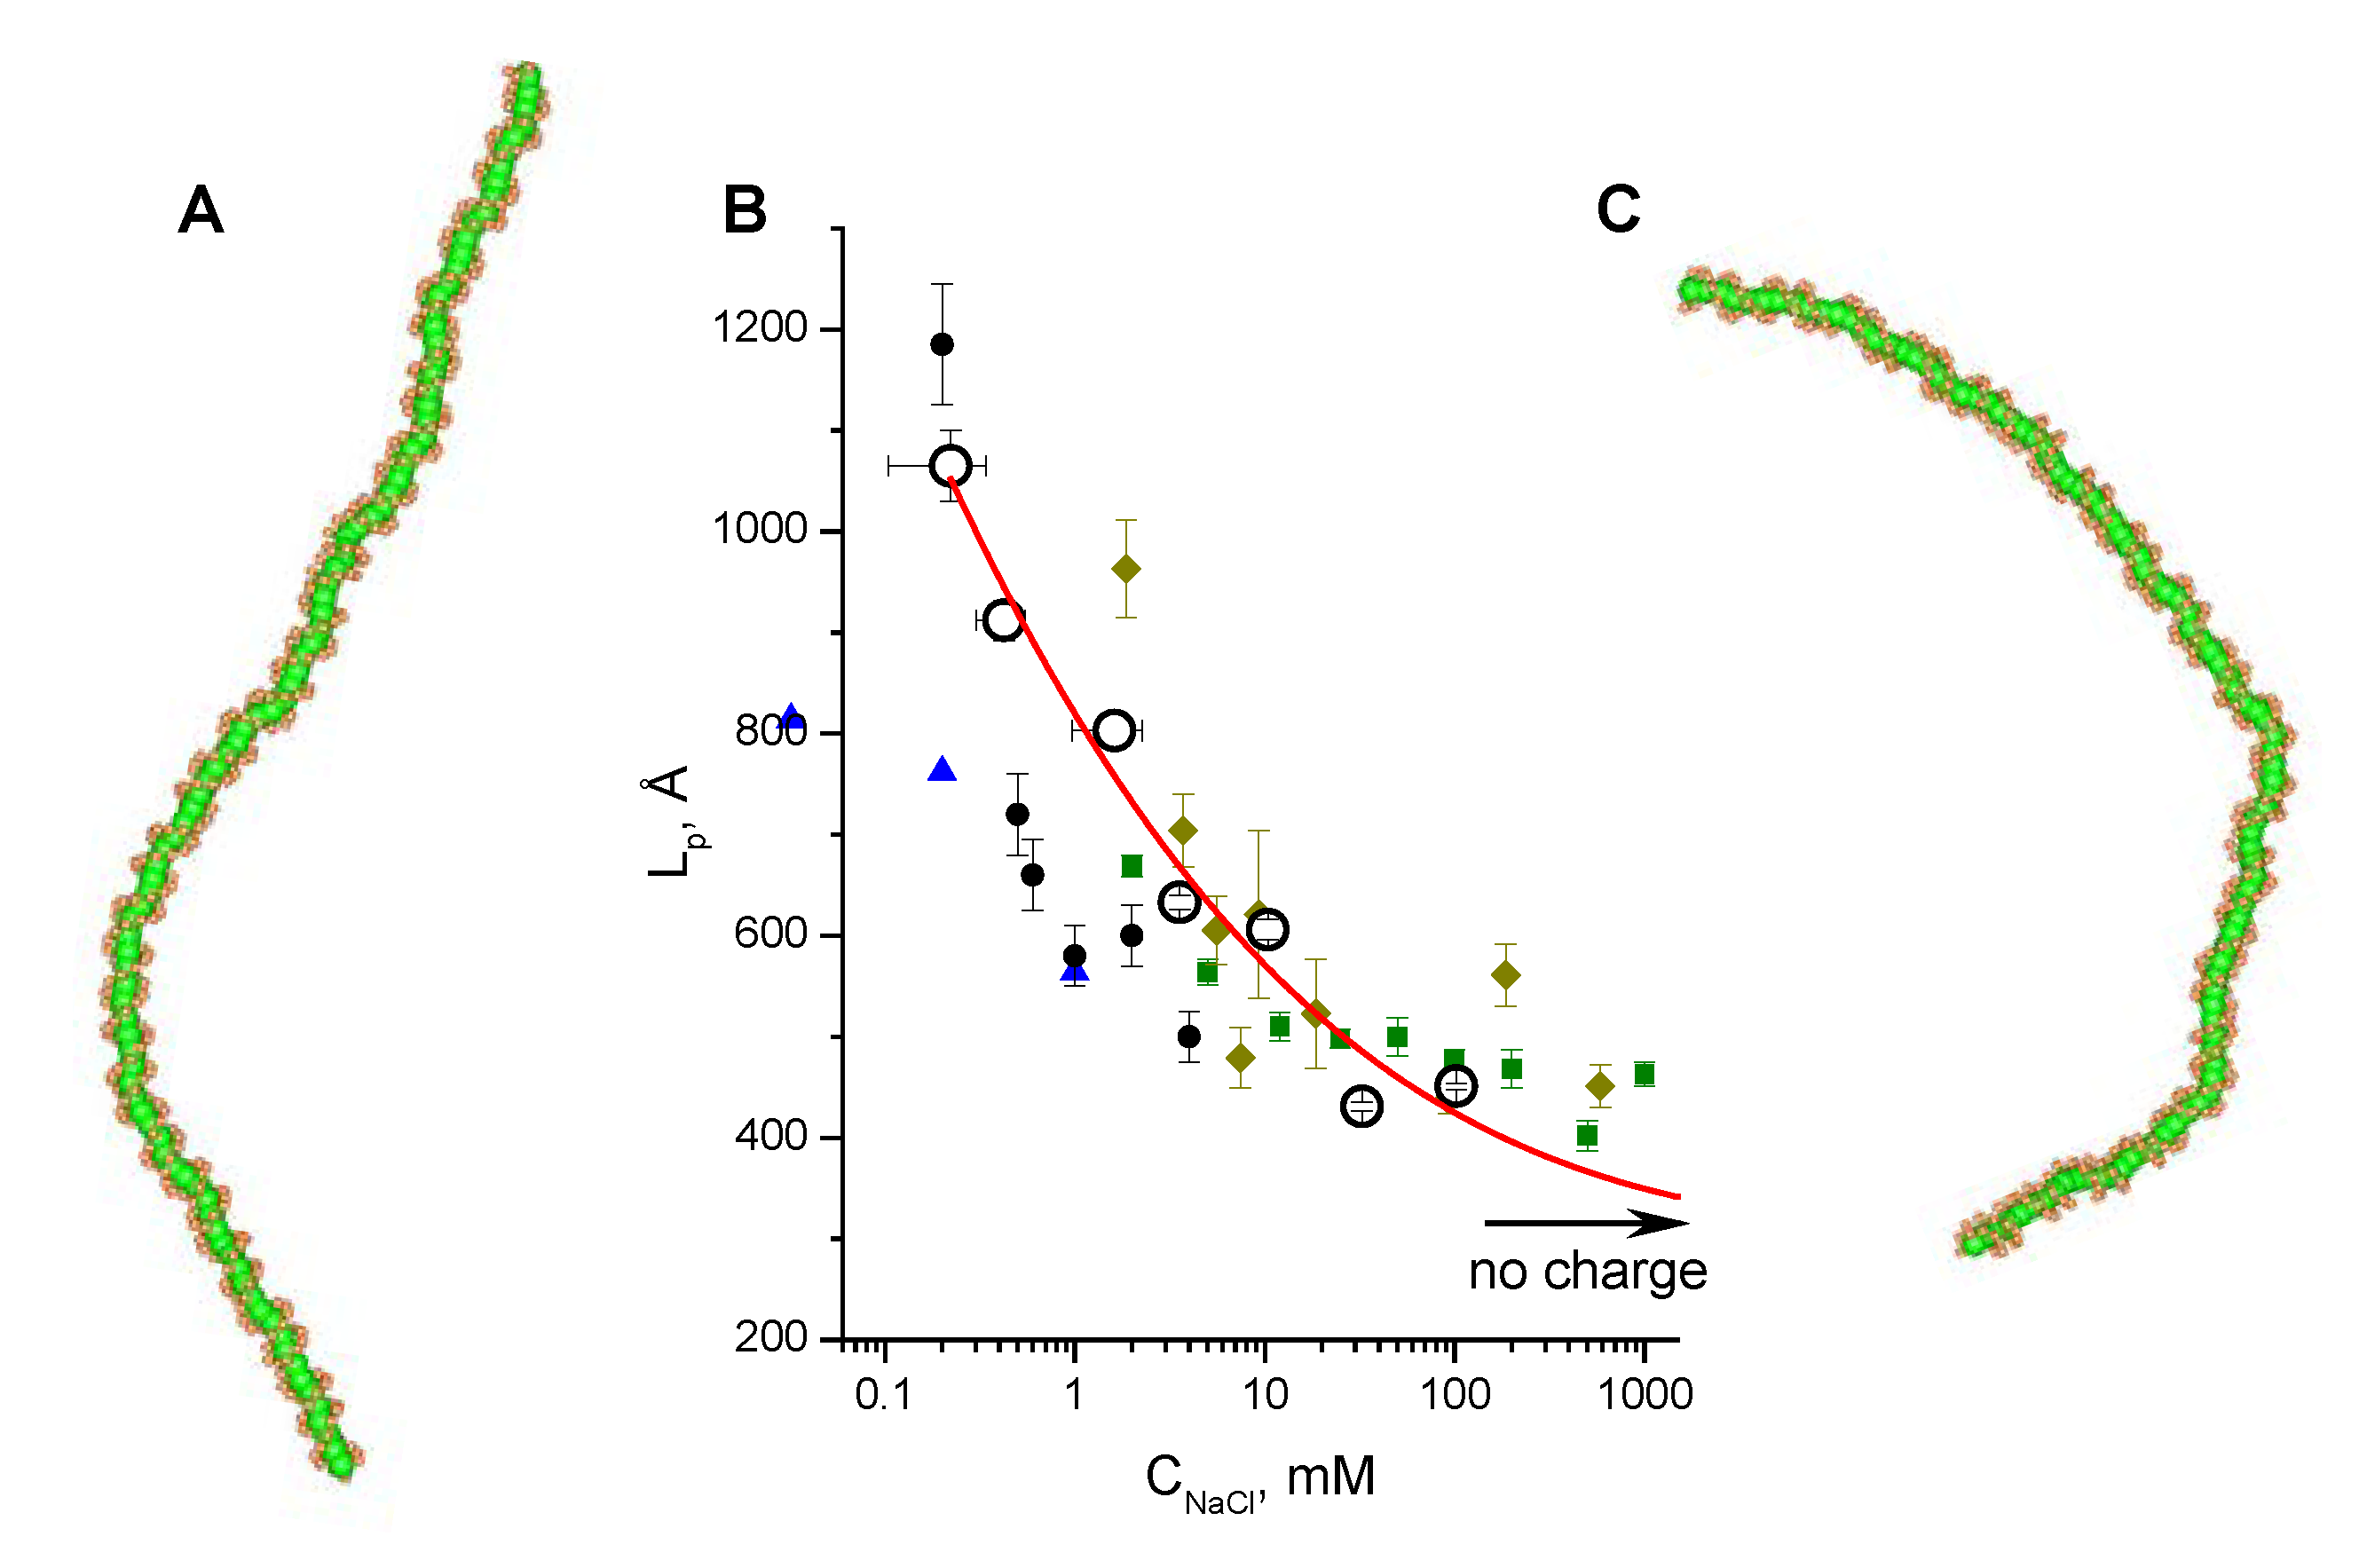
3.2. Validation of the CG-Model: Salt Dependence of DNA Persistence Length

To validate the CG-model of DNA we carried out a series of simulations for a 200 bp fragment of DNA in solution with varying concentration of monovalent salt. The purpose of the simulations was to determine the dependence of the mechanical properties of the CG-DNA, mainly bending on salt concentration and to compare these properties with experimental data. Details of the simulations are given above (Section 2.4 of Computational Methodology). This test of the CG-DNA model is interesting, not only for validation purpose, but also in the light of recent renewed discussion about the relative contributions of electrostatic and mechanical forces to the DNA flexibility [25,86,87]. The persistence length, LP, was determined from the well-known relationship [88] used for treatment of simulation or statistical data for polymers of limited length:
Polymers 06 01655 i006
where 〈cosα〉 is the average of the cosine of the angle between two neighbouring segments over the simulation and LC is the contour length between the segments. There is a technical problem preventing a straightforward calculation of the contour length and assignment of a vector to a DNA segment of the present CG-model of the DNA. The positions of the “D” beads (defined as the center of mass (COM) of the pentose and base atoms of the two DNA base pairs) are not aligned along the axis of the double stranded DNA and form a thin helical structure (see Figure 1C). Therefore, to calculate the contour length, the coordinates of the DNA axis should be determined from a limited number of beads. There are different approaches used to solve this sort of problem [89,90,91]. Here, we used the following algorithm: For each central bead (D) we consider 4 phosphates (P1–P4) attached to it. Then, the COM of the P1–P4 beads was defined. Next, a line connecting the phosphates COM with the central bead (D) was built. On the continuation of this line we put a point at distance “shift” from the D bead. This point will be considered as a point defining DNA axis. The value of “shift” can be obtained empirically and we found that shift value of 1.1 Å gives the best approximation for the DNA axis.
For an ideal worm-like chain Equation (6) is exact for a given value of LP, but for a real DNA model the LP determined by Equation (6) depends on the chosen contour length LC as well as on the precise definition of the segment. In practice, the LP value was calculated from the slope of the initial 20 points of the dependence LC versus In(〈cosα〉) as shown in Figure 3. An indication of convergence of the simulations was that analysis of only part of the trajectories (excluding 30%–50% of the data collected at the end of the trajectories) produced essentially the same LC values as for the full set of data (data not shown).
Inspection of snapshots showed that the DNA molecules had a visible difference in degree of bending when comparing the system with different influence of electrostatic forces. The DNA with charged P and D particles and in low 0.1 mM salt (Figure 4A) was considerably more rigid and stretched than the CG DNA with charges removed (Figure 4C); such an uncharged model contributes only the DNA internal mechanical properties to the persistence length. Figure 4B and Table 4 summarize the results of the LP calculations for a range of salt concentrations. Our simulation data showed a remarkably good agreement with experimental LP values (Figure 4B). This fact indicates that the CHARMM27 force field that was used in all-atom MD runs adequately reproduced the contributions of structural and electrostatic components of the DNA rigidity over a wide range of monovalent salt concentration. In addition to validation of our DNA CG-model, this result demonstrates that the contribution of electrostatic forces to the DNA flexibility is significant. It appears that screening effect of added salt makes an essential influence to the DNA bending at concentrations lower than 10 mM. In agreement with experiment, the persistent length of DNA shows little change at moderate (“physiological”) and high salt concentrations being quite close to the value determined for the CG model with electrostatic forces turned off by setting to zero charges of the P and D particles.
Figure 3. Determination of the persistence length, LP, from the slope of dependence of DNA contour length, LC, on In(〈cosα〉). Data calculated for different concentrations of monovalent salt and for the uncharged CG-DNA are displayed as points; thin red lines show linear fitting.
Polymers 06 01655 g003
Figure 4. Dependence of DNA persistence length, LP, on monovalent salt concentration. (A) and (C) show snapshots from the simulations at low (0.1 mM) salt concentration, (A), and for the uncharged DNA, (C). (B) Comparison of the simulation results with experimental data: circles with red line to guide the eye are the data from simulations using the CG model of DNA with force constants calculated by IMC software [64] from the data of all-atom MD simulations (CHARMM27 force field). Experimental data are also shown to illustrate the good agreement between theory and experiment. An arrow marked “no charge” indicates LP value calculated for the CG DNA model with charges on the phosphate group beads set to zero. Experimental data are taken from: black circles [92]; khaki rhombi [93]; green squares [94]; blue triangles [95].
Polymers 06 01655 g004
Table 4. Flexibility of the CG-DNA as a function of concentration of monovalent salt.
Cation concentration 1,
(mM)
Persistent length, LC
(Å)
Torsional persistence length, LT
(Å)
0.104–0.3401065 ± 351446
0.303–0.545912 ± 201461
0.970–2.270803 ± 171415
2.910–4.210633 ± 71463
9.730–11.030606 ± 101409
29.800–35.200431 ± 41424
99.600–105.000451 ± 31399
No charge316 ± 11349
1 Note: it is incorrect to define the NaCl concentration (CNaCl) alone as the parameter characterizing the ionic environment since the dissociated DNA counterions contribute to the ion concentration in the simulation cell. Therefore a range of concentrations are used where lower value is CNaCl and the higher one is CNaCl + CP (where CP is total concentration of DNA counterions).
Recently, the dependence of DNA elastic properties on ionic environment and analysis of the relative contributions of electrostatic (due to phosphate-phosphate repulsion) and structural (mostly due to base-base stacking) factors to the DNA stiffness has been investigated using all-atom MD simulations followed by so-called group renormalization calculation of effective potentials used in a CG model of DNA [25,86,87]. The CG model of DNA developed in the Papoian laboratory uses different coarse graining of the DNA (without central beads) and employs explicit modeling of the ionic environment but the method used for derivation of intramolecular potentials from all-atom MD simulations is similar to the approach used in the present work. It was found that agreement between the experimental and calculated dependence of the persistent length on concentration of monovalent salt could be achieved if the force constants derived from the all-atom DNA MD simulations, using the Amber10 force field were scaled by factor 0.7 [25]. Here, we obtained excellent agreement with experiment without adjustment of the potentials derived by the IMC procedure from all-atom DNA simulations using the CHARMM27 force field. This discrepancy might be due the different all-atom force fields used in our work (CHARM27) compared to the Amber10 force field used in the Papoian group work [25,86,87]. Another difference is the detailed coarse-graining of DNA, which employed somewhat different strategies including the use of explicit bending angle potentials in the present work. Additionally, in the present work the electrostatic interactions were described within a continuum model while Papoian and co-workers used ionic interaction potentials derived from the all-atom simulations. Despite these differences the results on the salt dependence of the persistence length from the approaches are similar. Specifically, in the present work we obtained the same estimation for the value of persistent length of the uncharged CG DNA as that obtained by Papoian and co-workers (about 300 Å) [86]). Correspondingly, our results support an analysis of the role of electrostatic forces on DNA stiffness with the conclusion that electrostatic and structural contributions are of similar scale at physiological salt concentrations [25,86,87] which is in contrast to predictions of both the Manning theory (supporting a major role of electrostatics) [96] and the Odjik, Skolnick, and Fixman model (suggesting a major contribution to structural stiffness) [97,98].

3.3. Calculation of Torsion Persistence Length of the DNA CG-Model

The torsion persistence length is determined from the following procedure. A torsion angle is defined between all neighboring monomers using vectors from the central bead position to COMs of adjacent phosphates. A torsion angle between more separated monomers (like n and n + j, j > 1 at a contour distance LC) is determined as the sum of torsion angles between all intermediate neighbors. Then the torsional persistence length is defined from [99]:
Polymers 06 01655 i007
where δφ2 = 〈φ2〉 ‒ 〈φ〉2 is variation of the torsion angle φ between monomers separated by LC distance.
In all MD simulations of the 22 bp CG DNA, the dependence LC versus δφ2 shows excellent linearity for full range of LC (Fig S3A of the Supporting Material) giving values of LT in the range 1350–1500 Å (Table 4, Figure S3B). The value obtained here for the torsional persistence length is larger than what is known from the limited available experimental data which give a value around 700 Å [41,100]. Our results with LT values around 1400 Å thus show that the torsional resistance in the CG model is exaggerated. However, the salt-dependence displays minor effect on the torsional rigidity of DNA (Figure S3B). To the best of our knowledge such data on the salt dependence of the torsional DNA rigidity has not been published but as the phosphate-phosphate repulsion is not expected to vary much with torsion, this is the expected result (that indeed has been confirmed, Jan Lipfert, personal communication). The optimization of this feature in the CG model would require fine tuning of the force constants in order to give a shorter torsional persistence length, while still preserving the excellent behavior of the bending persistence length as a function of salt concentration. This will pursued in future work, introducing further development of the CG model.

4. Conclusions

We present a CG DNA model that consist of two types of beads representing a set of two base pairs, one P bead for each phosphate group and one central D bead for the pentose and bases of a two-bp unit (Figure 1). The internal structural and dynamic properties of the DNA chain were defined by a set of harmonic bead-bead bond and angular force constants. Using all-atom MD simulations of DNA oligonucleotides in solution, we applied the inverse MC method to extract the force constant parameters defining the internal properties of the DNA polymer chain. By applying this model in large scale CG simulations of a 200 bp DNA molecule with explicit ions at varying salt conditions within a continuum description of the electrostatic interactions, the DNA flexibility as a function of monovalent salt was analyzed by calculation of the DNA bending persistence length, LP. The CG model combined with the parameters obtained directly from the all-atom simulation without further adjustment or optimization, resulted in excellent agreement for the dependence of LP on monovalent salt concentration when compared with available experimental data. The results are in agreement with a recently developed two-bead (per bp) CG DNA model [24,25,86,87] in which the internal force parameters of the DNA chain was extracted from all-atom simulations in a manner similar to that employed in the present work. However, one difference between the results of the present model and those obtained from the model developed by Papoian and co-workers, is that we obtained agreement with experiments without further optimization or scaling of the all-atom extracted internal DNA force parameters. This could be due to the different force field used in the all-atom simulations of DNA (CHARMM27 in our case versus Amber10 in the Papoian group case) and to the differences in the coarse-graining of DNA or may be related to different form of ionic potentials used.
We also made preliminary analysis of the torsional persistence length of our CG DNA model. While the model produce the expected independence of this parameter on salt, the absolute values for torsional persistence length seem too large and will require further optimization in future work.
The conclusions from our analysis regarding the relative contributions of the electrostatic and elastic forces that defines the bending properties of DNA under physiological conditions is also in agreement with the work of Papoian, Savelyev, and co-workers [25,86,87] and suggest that these two contributions are of equal importance in determining the stiffness of DNA. Our model should represent an important step towards modeling of DNA bending properties in CG multi-scale modeling of a chromatin fiber, for which the description of the stiffness of linker DNA is highly important in order to reproduce chromatin folding induced by multivalent cations [81]. It may also be noted that, although the present approach is based on a CG DNA model without base sequence identity, this can be introduced in a rather straightforward way by assigning different types of D beads for variable two-bp sequence units. The CG DNA internal force field parameters defining such sequence effects can be obtained from all-atom MD simulations of oligonucleotides of varying base sequences.

Acknowledgments

This work has been supported by the Singapore Agency for Science Technology and Research (A*STAR) through the Biomedical Research Council (LN), by the Singapore Ministry of Education Academic Research Fund (AcRF) through a Tier 1 grant (LN) and by the Swedish Research Council (to APL).

Author Contributions

N.K., A.P.L. and L.N. designed and planned simulations and analysis and wrote the paper; N.K., D.L. and A.L. performed simulations and analysis of data.

Conflicts of Interest

The authors declare no conflict of interest.

References

  1. Widom, J. Physicochemical studies of the folding of the 100 A nucleosome filament into the 300 A filament. Cation dependence. J. Mol. Biol. 1986, 190, 411–424. [Google Scholar] [CrossRef]
  2. Clark, D.J.; Kimura, T. Electrostatic mechanism of chromatin folding. J. Mol. Biol. 1990, 211, 883–896. [Google Scholar]
  3. Korolev, N.; Vorontsova, O.V.; Nordenskiöld, L. Physicochemical analysis of electrostatic foundation for DNA-protein interactions in chromatin transformations. Prog. Biophys. Mol. Biol. 2007, 95, 23–49. [Google Scholar] [CrossRef]
  4. Korolev, N.; Berezhnoy, N.V.; Eom, K.D.; Tam, J.P.; Nordenskiöld, L. A universal description for the experimental behavior of salt-(in)dependent oligocation-induced DNA condensation. Nucleic Acids Res. 2009, 37, 7137–7150. [Google Scholar] [CrossRef]
  5. Bloomfield, V.A. DNA condensation. Curr. Opin. Struct. Biol. 1996, 6, 334–341. [Google Scholar] [CrossRef]
  6. Iwaki, T.; Saito, T.; Yoshikawa, K. How are small ions involved in the compaction of DNA molecules? Surf. B Biointerf. 2007, 56, 126–133. [Google Scholar] [CrossRef] [Green Version]
  7. Ray, J.; Manning, G.S. Effect of counterion valence and polymer charge density on the pair potential of two polyions. Macromol. 1997, 30, 5739–5744. [Google Scholar] [CrossRef]
  8. Lyubartsev, A.P.; Nordenskiöld, L. Monte Carlo simulation study of ion distribution and osmotic pressure in hexagonally oriented DNA. J. Phys. Chem. 1995, 99, 10373–10382. [Google Scholar] [CrossRef]
  9. Gronbech-Jensen, N.; Mashl, R.J.; Bruinsma, R.F.; Gelbart, W.M. Counterion-induced attraction between rigid polyelectrolytes. Phys. Rev. Lett. 1997, 78, 2477–2480. [Google Scholar] [CrossRef]
  10. Guldbrand, L.; Nilsson, L.G.; Nordenskiöld, L. A Monte Carlo simulation study of electrostatic forces between hexagonally packed DNA double helices. J. Chem. Phys. 1986, 85, 6686–6698. [Google Scholar] [CrossRef]
  11. Nilsson, L.G.; Guldbrand, L.; Nordenskiöld, L. Evaluation of the electrostatic osmotic pressure in an infinite system of hexagonally oriented DNA molecules. A Monte Carlo simulation study. Mol. Phys. 1991, 72, 177–192. [Google Scholar] [CrossRef]
  12. Lyubartsev, A.P.; Nordenskiöld, L. Monte Carlo simulation study of DNA polyelectrolyte properties in the presence of multivalent polyamine ions. J. Phys. Chem. B 1997, 101, 4335–4342. [Google Scholar] [CrossRef]
  13. Arya, G.; Schlick, T. Role of histone tails in chromatin folding revealed by a mesoscopic oligonucleosome model. Proc. Natl. Acad. Sci. USA. 2006, 103, 16236–16241. [Google Scholar] [CrossRef]
  14. Arya, G.; Schlick, T. A tale of tails: How histone tails mediate chromatin compaction in different salt and linker histone environments. J. Phys. Chem. A 2009, 113, 4045–4059. [Google Scholar] [CrossRef]
  15. Muhlbacher, F.; Schiessel, H.; Holm, C. Tail-induced attraction between nucleosome core particles. Phys. Rev. E 2006, 74. [Google Scholar] [CrossRef]
  16. Saunders, M.G.; Voth, G.A. Coarse-graining of multiprotein assemblies. Curr. Opin. Struct. Biol. 2012, 22, 144–150. [Google Scholar] [CrossRef]
  17. Takada, S. Coarse-grained molecular simulations of large biomolecules. Curr. Opin. Struct. Biol. 2012, 22, 130–137. [Google Scholar] [CrossRef]
  18. Lyubartsev, A.P.; Laaksonen, A. Calculation of effective interaction potentials from radial distribution functions: A reverse Monte Carlo approach. Phys. Rev. E 1995, 52, 3730–3737. [Google Scholar] [CrossRef]
  19. Lyubartsev, A.P.; Mirzoev, A.; Chen, L.J.; Laaksonen, A. Systematic coarse-graining of molecular models by the Newton inversion method. Faraday Discuss. 2010, 144, 43–56. [Google Scholar] [CrossRef]
  20. Izvekov, S.; Voth, G.A. Multiscale coarse-graining method for biomolecular systems. J. Phys. Chem. B 2005, 109, 2469–2473. [Google Scholar] [CrossRef]
  21. Ayton, G.S.; Noid, W.G.; Voth, G.A. Multiscale modeling of biomolecular systems: In serial and in parallel. Curr. Opin. Struct. Biol. 2007, 17, 192–198. [Google Scholar] [CrossRef]
  22. Chaimovich, A.; Shell, M.S. Coarse-graining errors and numerical optimization using a relative entropy framework. J. Chem. Phys. 2011, 134. [Google Scholar] [CrossRef]
  23. Rudzinski, J.F.; Noid, W.G. Coarse-graining entropy, forces, and structures. J. Chem. Phys. 2011, 135. [Google Scholar] [CrossRef]
  24. Savelyev, A.; Papoian, G.A. Molecular renormalization group coarse-graining of polymer chains: application to double-stranded DNA. Biophys. J. 2009, 96, 4044–4052. [Google Scholar] [CrossRef]
  25. Savelyev, A.; Papoian, G.A. Chemically accurate coarse graining of double-stranded DNA. Proc. Natl. Acad. Sci. USA 2010, 107, 20340–20345. [Google Scholar] [CrossRef]
  26. Potoyan, D.A.; Savelyev, A.; Papoian, G.A. Recent successes in coarse-grained modeling of DNA. WIREs Comput. Mol. Sci. 2013, 3, 69–83. [Google Scholar] [CrossRef]
  27. Dans, P.D.; Zeida, A.; MacHado, M.R.; Pantano, S. A coarse grained model for atomic-detailed DNA simulations with explicit electrostatics. J. Chem. Theory Comput. 2010, 6, 1711–1725. [Google Scholar]
  28. Demille, R.C.; Cheatham, T.E.; Molinero, V. A coarse-grained model of DNA with explicit solvation by water and ions. J. Phys. Chem. B 2011, 115, 132–142. [Google Scholar] [CrossRef]
  29. Cao, Q.; Zuo, C.; Ma, Y.; Li, L.; Zhang, Z. Interaction of double-stranded DNA with a nanosphere: A coarse-grained molecular dynamics simulation study. Soft Matter 2011, 7, 506–514. [Google Scholar]
  30. Freeman, G.S.; Hinckley, D.M.; de Pablo, J.J. A coarse-grain three-site-per-nucleotide model for DNA with explicit ions. J. Chem. Phys. 2011, 135. [Google Scholar] [CrossRef]
  31. Hinckley, D.M.; Freeman, G.S.; Whitmer, J.K.; de Pablo, J.J. An experimentally-informed coarse-grained 3-site-per-nucleotide model of DNA: Structure, thermodynamics, and dynamics of hybridization. J. Chem. Phys. 2013, 139. [Google Scholar] [CrossRef]
  32. Cragnolini, T.; Derreumaux, P.; Pasquali, S. Coarse-grained simulations RNA and DNA duplexes. J. Phys. Chem. B 2013, 117, 8047–8060. [Google Scholar] [CrossRef]
  33. Doye, J.P.; Ouldridge, T.E.; Louis, A.A.; Romano, F.; Šulc, P.; Matek, C.; Snodin, B.E.; Rovigatti, L.; Schreck, J.S.; Harrison, R.M.; et al. Coarse-graining DNA for simulations of DNA nanotechnology. Phys. Chem. Chem. Phys. 2013, 15, 20395–20414. [Google Scholar] [CrossRef]
  34. Ouldridge, T.E.; Louis, A.A.; Doye, J.P.K. DNA nanotweezers studied with a coarse-grained model of DNA. Phys. Rev. Lett. 2010, 104. [Google Scholar] [CrossRef]
  35. Ouldridge, T.E.; Louis, A.A.; Doye, J.P.K. Structural, mechanical, and thermodynamic properties of a coarse-grained DNA model. J. Chem. Phys. 2011, 134. [Google Scholar] [CrossRef]
  36. Muhlbacher, F.; Holm, C.; Schiessel, H. Controlled DNA compaction within chromatin: the tail-bridging effect. Europhys. Lett. 2006, 73, 135–141. [Google Scholar] [CrossRef]
  37. Wedemann, G.; Langowski, J. Computer simulation of the 30-nanometer chromatin fiber. Biophys. J. 2002, 82, 2847–2859. [Google Scholar] [CrossRef]
  38. Korolev, N.; Lyubartsev, A.P.; Nordenskiöld, L. Computer modeling demonstrates that electrostatic attraction of nucleosomal DNA is mediated by histone tails. Biophys. J. 2006, 90, 4305–4316. [Google Scholar] [CrossRef]
  39. Langowski, J. Polymer chain models of DNA and chromatin. Eur. Phys. J. E 2006, 19, 241–249. [Google Scholar] [CrossRef]
  40. Voltz, K.; Trylska, J.; Tozzini, V.; Kurkal-Siebert, V.; Langowski, J.; Smith, J. Coarse-grained force field for the nucleosome from self-consistent multiscaling. J. Comp. Chem. 2008, 29, 1429–1439. [Google Scholar] [CrossRef]
  41. Langowski, J.; Schiessel, H. Chromatin Simulations. from DNA to Chromatin Fibers. In Computational Studies of RNA and DNA; Šponer, J., Lankaš, F., Eds.; Springer: Dordrecht, the Netherlands, 2006; pp. 605–634. [Google Scholar]
  42. Arya, G.; Schlick, T. Efficient global biopolymer sampling with end-transfer configurational bias Monte Carlo. J. Chem. Phys. 2007, 126, 044107. [Google Scholar] [CrossRef]
  43. Langowski, J.; Heermann, D.W. Computational modeling of the chromatin fiber. Semin. Cell Dev. Biol. 2007, 18, 659–667. [Google Scholar] [CrossRef]
  44. Kepper, N.; Foethke, D.; Stehr, R.; Wedemann, G.; Rippe, K. Nucleosome geometry and internucleosomal interactions control the chromatin fiber conformation. Biophys. J. 2008, 95, 3692–3705. [Google Scholar] [CrossRef]
  45. Stehr, R.; Kepper, N.; Rippe, K.; Wedemann, G. The effect of internucleosomal interaction on folding of the chromatin fiber. Biophys. J. 2008, 95, 3677–3691. [Google Scholar] [CrossRef]
  46. Grigoryev, S.A.; Arya, G.; Correll, S.; Woodcock, C.L.; Schlick, T. Evidence for heteromorphic chromatin fibers from analysis of nucleosome interactions. Proc. Natl. Acad. Sci. USA 2009, 106, 13317–13322. [Google Scholar]
  47. Yang, Y.; Lyubartsev, A.P.; Korolev, N.; Nordenskiöld, L. Computer modeling reveals that modifications of the histone tail charges define salt-dependent interaction of the nucleosome core particles. Biophys. J. 2009, 96, 2082–2094. [Google Scholar] [CrossRef]
  48. Stehr, R.; Schöpflin, R.; Ettig, R.; Kepper, N.; Rippe, K.; Wedemann, G. Exploring the conformational space of chromatin fibers and their stability by numerical dynamic phase diagrams. Biophys. J. 2010, 98, 1028–1037. [Google Scholar] [CrossRef]
  49. Kepper, N.; Ettig, R.; Stehr, R.; Marnach, S.; Wedemann, G.; Rippe, K. Force spectroscopy of chromatin fibers: Extracting energetics and structural information from Monte Carlo simulations. Biopolymers 2011, 95, 435–447. [Google Scholar] [CrossRef]
  50. Materese, C.K.; Savelyev, A.; Papoian, G.A. Counterion atmosphere and hydration patterns near a nucleosome core particle. J. Am. Chem. Soc. 2009, 131, 15005–15013. [Google Scholar] [CrossRef]
  51. Voltz, K.; Trylska, J.; Calimet, N.; Smith, J.C.; Langowski, J. Unwrapping of nucleosomal DNA ends: A multiscale molecular dynamics study. Biophys. J. 2012, 102, 849–858. [Google Scholar] [CrossRef]
  52. Hess, B.; Holm, C.; van der Vegt, N. Modeling multibody effects in ionic solutions with a concentration dependent dielectric permittivity. Phys. Rev. Lett. 2006, 96. [Google Scholar] [CrossRef]
  53. Korolev, N.; Lyubartsev, A.P.; Nordenskiöld, L. Cation-induced polyelectrolyte-polyelectrolyte attraction in solutions of DNA and nucleosome core particles. Adv. Coll. Interf. Sci. 2010, 158, 32–47. [Google Scholar] [CrossRef]
  54. Korolev, N.; Allahverdi, A.; Yang, Y.; Fan, Y.; Lyubartsev, A.P.; Nordenskiöld, L. Electrostatic origin of salt-induced nucleosome array compaction. Biophys. J. 2010, 99, 1896–1905. [Google Scholar] [CrossRef]
  55. Allahverdi, A.; Yang, R.; Korolev, N.; Fan, Y.; Davey, C.A.; Liu, C.F.; Nordenskiöld, L. The effects of histone H4 tail acetylations on cation-induced chromatin folding and self-association. Nucleic Acids Res. 2011, 39, 1680–1691. [Google Scholar] [CrossRef]
  56. Fan, Y.; Korolev, N.; Lyubartsev, A.P.; Nordenskiöld, L. An advanced coarse-grained nucleosome core particle model for computer simulations of nucleosome-nucleosome interactions under varying ionic conditions. PLoS One 2013, 8, e54228. [Google Scholar]
  57. Bertin, A.; Mangenot, S.; Renouard, M.; Durand, D.; Livolant, F. Structure and phase diagram of nucleosome core particles aggregated by multivalent cations. Biophys. J. 2007, 93, 3652–3663. [Google Scholar] [CrossRef]
  58. Leforestier, A.; Dubochet, J.; Livolant, F. Bilayers of nucleosome core particles. Biophys. J. 2001, 81, 2114–2421. [Google Scholar]
  59. Mangenot, S.; Leforestier, A.; Durand, D.; Livolant, F. Phase diagram of nucleosome core particles. J. Mol. Biol. 2003, 333, 907–916. [Google Scholar] [CrossRef]
  60. Li, G.; Levitus, M.; Bustamante, C.; Widom, J. Rapid spontaneous accessibility of nucleosomal DNA. Nat. Struct. Mol. Biol. 2005, 12, 46–53. [Google Scholar] [CrossRef]
  61. Böhm, V.; Hieb, A.R.; Andrews, A.J.; Gansen, A.; Rocker, A.; Tóth, K.; Luger, K.; Langowski, J. Nucleosome accessibility governed by the dimer/tetramer interface. Nucleic Acids Res. 2011, 39, 3093–3102. [Google Scholar] [CrossRef]
  62. Mirzoev, A.; Lyubartsev, A.P. MagiC: Software package for multiscale modeling. J. Chem. Theory Comput. 2013, 9, 1512–1520. [Google Scholar] [CrossRef]
  63. Mirzoev, A.; Lyubartsev, A.P. Systematic implicit solvent coarse graining of DMPC lipids. J. Comput. Chem. 2014, in press. [Google Scholar]
  64. Korolev, N.; Lyubartsev, A.P.; Rupprecht, A.; Nordenskiöld, L. Experimental and Monte Carlo simulation studies on the competitive binding of Li+, Na+, and K+ ions to DNA in oriented DNA fibers. J. Phys. Chem. B 1999, 103, 9008–9019. [Google Scholar] [CrossRef]
  65. Korolev, N.; Lyubartsev, A.P.; Rupprecht, A.; Nordenskiöld, L. Competitive binding of Mg2+, Ca2+, Na+, and K+ to DNA in oriented DNA fibers: Experimental and Monte Carlo simulation results. Biophys. J. 1999, 77, 2736–2749. [Google Scholar] [CrossRef]
  66. Montoro, J.C.G.; Abascal, J.L.F. Ionic distribution around simple DNA models. I. Cylindrically averaged properties. J. Chem. Phys. 1995, 103, 8273–8284. [Google Scholar] [CrossRef]
  67. Macke, T.; Case, D.A. Modeling unusual nucleic acid structures. In Molecular Modeling of Nucleic Acids; Leontes, N.B., SantaLucia, J., Eds.; ACS Publications: Washington, DC, USA, 1998; pp. 379–393. [Google Scholar]
  68. van der Spoel, D.; Lindahl, E.; Hess, B.; Groenhof, G.; Mark, A.E.; Berendsen, H.J.C. GROMACS: Fast, flexible and free. J. Comp. Chem. 2005, 26, 1701–1718. [Google Scholar] [CrossRef]
  69. Lindahl, E.; Hess, B.; van der Spoel, D. Gromacs 3.0: A package for molecular simulations and trajectory analysis. J. Mol. Mod. 2001, 7, 306–317. [Google Scholar]
  70. Foloppe, N.; MacKerell, A.D., Jr. All-atom empirical force field for nucleic acids: I. Parameter optimization based on small molecule and condensed phase macromolecular target data. J. Comp. Chem. 2000, 21, 86–104. [Google Scholar] [CrossRef]
  71. MacKerell, A.D., Jr.; Banavali, N. All-atom empirical force field for nucleic acids: II. Application to molecular dynamics simulations of DNA and RNA in solution. J. Comp. Chem. 2000, 21, 105–120. [Google Scholar]
  72. Hart, K.; Foloppe, N.; Baker, C.M.; Denning, E.J.; Nilsson, L.; MacKerell, A.D., Jr. Optimization of the CHARMM additive force field for DNA: Improved treatment of the BI/BII conformational equilibrium. J. Chem. Theory Comput. 2012, 8, 348–362. [Google Scholar]
  73. Mark, P.; Nilsson, L. Structure and dynamics of liquid water with different long range interaction truncation and temperature control methods in molecular dynamics simulations. J. Comp. Chem. 2002, 23, 1211–1219. [Google Scholar] [CrossRef]
  74. Mark, P.; Nilsson, L. Structure and dynamics of the TIP3P, SPC, and SPC/E water models at 298 K. J. Phys. Chem. A 2001, 105, 9954–9960. [Google Scholar] [CrossRef]
  75. Darden, T.; York, D.M.; Pedersen, L.G. Particle mesh Ewald: An N-log(N) method for Ewald sums in large systems. J. Chem. Phys. 1993, 98, 10089–10092. [Google Scholar] [CrossRef]
  76. Korolev, N.; Yu, H.; Lyubartsev, A.P.; Nordenskiöld, L. Molecular dynamics simulations demonstrate the regulation of DNA-DNA attraction by H4 histone tail acetylations and mutations. Biopolymers 2014, in press. [Google Scholar] [CrossRef]
  77. Lyubartsev, A.P.; Laaksonen, A. Osmotic and activity coefficient from effective potentials for hydrated ions. Phys. Rev. E 1997, 55, 5689–5696. [Google Scholar]
  78. Rashin, A.A.; Bukatin, M.A. A view of thermodynamics of hydration emerging from continuum studies. Biophys. Chem. 1994, 51, 167–190. [Google Scholar] [CrossRef]
  79. Koehl, P. Electrostatics calculations: Latest methodological advance. Curr. Opin. Struct. Biol. 2006, 16, 142–151. [Google Scholar] [CrossRef]
  80. Korolev, N.; Allahverdi, A.; Lyubartsev, A.P.; Nordenskiöld, L. The polyelectrolyte properties of chromatin. Soft Matter 2012, 8, 9322–9333. [Google Scholar] [CrossRef]
  81. Korolev, N.; Fan, Y.; Lyubartsev, A.P.; Nordenskiöld, L. Modelling chromatin structure and dynamics: status and prospects. Curr. Opin. Struct. Biol. 2012, 22, 151–159. [Google Scholar] [CrossRef]
  82. Korolev, N.; Lyubartsev, A.P.; Rupprecht, A.; Nordenskiöld, L. Competitive substitution of hexammine cobalt(III) for Na+ and K+ ions in oriented DNA fibers. Biopolymers 2001, 58, 268–278. [Google Scholar] [CrossRef]
  83. Korolev, N.; Lyubartsev, A.P.; Nordenskiöld, L.; Laaksonen, A. Spermine: an “invisible” component in the crystals of B-DNA. A grand canonical Monte Carlo and molecular dynamics simulation study. J. Mol. Biol. 2001, 308, 907–917. [Google Scholar] [CrossRef]
  84. Nordenskiöld, L.; Lyubartsev, A.P.; Korolev, N. DNA-DNA interaction. In DNA Interactions with Polymers and Surfactants; Dias, R.S., Lindman, B., Eds.; John Wiley & Sons, Inc.: London, UK, 2008; pp. 209–237. [Google Scholar]
  85. Montoro, J.C.G.; Abascal, J.L.F. Ionic distribution around simple B-DNA models. II. Deviations from cylindrical symmetry. J. Chem. Phys. 1998, 109, 6200–6210. [Google Scholar] [CrossRef]
  86. Savelyev, A.; Materese, C.K.; Papoian, G.A. Is DNA’s rigidity dominated by electrostatic or nonelectrostatic interactions? J. Am. Chem. Soc. 2011, 133, 19290–19293. [Google Scholar] [CrossRef]
  87. Savelyev, A. Do monovalent mobile ions affect DNA’s flexibility at high salt content? Phys. Chem. Chem. Phys. 2012, 14, 2250–2254. [Google Scholar] [CrossRef]
  88. Grosberg, A.Y.; Khokhlov, A.R. Statistical Physics of Macromolecules; AIP Press: New York, NY, USA, 1994; p. 350. [Google Scholar]
  89. Åqvist, J. A simple way to calculate the axis of an α-helix. Comput. Chem. (Oxford) 1986, 10, 97–99. [Google Scholar] [CrossRef]
  90. Christopher, J.A.; Swanson, R.; Baldwin, T.O. Algorithms for finding the axis of a helix: Fast rotational and parametric least-squares methods. Comput. Chem. 1996, 20, 339–345. [Google Scholar] [CrossRef]
  91. Enkhbayar, P.; Damdinsuren, S.; Osaki, M.; Matsushima, N. HELFIT: Helix fitting by a total least squares method. Comput. Biol. Chem. 2008, 32, 307–310. [Google Scholar] [CrossRef]
  92. Hagerman, P.J. Investigation of the flexibility of DNA using transient electric birefringence. Biopolymers 1981, 20, 1503–1535. [Google Scholar] [CrossRef]
  93. Baumann, C.G.; Smith, S.B.; Bloomfield, V.A.; Bustamante, C. Ionic effects on the elasticity of single DNA molecules. Proc. Natl. Acad. Sci. USA 1997, 94, 6185–6190. [Google Scholar] [CrossRef]
  94. Rizzo, V.; Schellman, J. Flow dichroism of T7 DNA as a function of salt concentration. Biopolym. 1981, 20, 2143–2163. [Google Scholar] [CrossRef]
  95. Lu, Y.; Weers, B.; Stellwagen, N.C. DNA persistence length revisited. Biopolym. 2002, 61, 261–275. [Google Scholar] [CrossRef]
  96. Manning, G.S. The persistence length of DNA is reached from the persistence length of its null isomer through an internal electrostatic stretching force. Biophys. J. 2006, 91, 3607–3616. [Google Scholar]
  97. Odijk, T. Polyelectrolytes near the rod limit. J. Polym. Sci.: Polym. Phys. Ed. 1977, 15, 477–483. [Google Scholar] [CrossRef]
  98. Skolnick, J.; Fixman, M. Electrostatic persistence length of a wormlike polyelectrolyte. Macromol. 1977, 10, 944–948. [Google Scholar] [CrossRef]
  99. Lipfert, J.; Wiggin, M.; Kerssemakers, J.W.; Pedaci, F.; Dekker, N.H. Freely orbiting magnetic tweezers to directly monitor changes in the twist of nucleic acids. Nat. Commun. 2011, 2, 439. [Google Scholar] [CrossRef]
  100. Hagerman, P.J. Flexibility of DNA. Annu. Rev. Biophys. Biophys. Chem. 1988, 17, 265–286. [Google Scholar] [CrossRef]

Supplementary Files

  • Supplementary File 1:

    Supporting Material (PDF, 176 KB)

  • Share and Cite

    MDPI and ACS Style

    Korolev, N.; Luo, D.; Lyubartsev, A.P.; Nordenskiöld, L. A Coarse-Grained DNA Model Parameterized from Atomistic Simulations by Inverse Monte Carlo. Polymers 2014, 6, 1655-1675. https://doi.org/10.3390/polym6061655

    AMA Style

    Korolev N, Luo D, Lyubartsev AP, Nordenskiöld L. A Coarse-Grained DNA Model Parameterized from Atomistic Simulations by Inverse Monte Carlo. Polymers. 2014; 6(6):1655-1675. https://doi.org/10.3390/polym6061655

    Chicago/Turabian Style

    Korolev, Nikolay, Di Luo, Alexander P. Lyubartsev, and Lars Nordenskiöld. 2014. "A Coarse-Grained DNA Model Parameterized from Atomistic Simulations by Inverse Monte Carlo" Polymers 6, no. 6: 1655-1675. https://doi.org/10.3390/polym6061655

    Article Metrics

    Back to TopTop