Article

Optical Characterization of the Hole Polaron in a Series of Diketopyrrolopyrrole Polymers Used for Organic Photovoltaics

1
Agency for Science, Technology and Research, Institute of Materials Research and Engineering, 3 Research Link, Singapore 117602, Singapore
2
National Junior College, 37 Hillcrest Road, Singapore 288913, Singapore
3
School of Chemistry, Physics and Mechanical Engineering, Queensland University of Technology (QUT), GPO Box 2434, Brisbane QLD 4001, Australia
4
Graduate School for Integrative Sciences and Engineering, National University of Singapore, 28 Medical Drive, Singapore 117456, Singapore
5
Department of Chemistry, Faculty of Science, Universiti Brunei Darussalam, Jalan Tungku Link, Gadong, BE 1410, Brunei
*
Author to whom correspondence should be addressed.
Polymers 2015, 7(1), 69-90; https://doi.org/10.3390/polym7010069
Submission received: 22 August 2014 / Accepted: 12 December 2014 / Published: 31 December 2014
(This article belongs to the Special Issue Organic Solar Cells)

Abstract

:
A strategy that is often used for designing low band gap polymers involves the incorporation of electron-rich (donor) and electron-deficient (acceptor) conjugated segments within the polymer backbone. In this paper we investigate such a series of Diketopyrrolopyrrole (DPP)-based co-polymers. The co-polymers consisted of a DPP unit attached to a phenylene, naphthalene, or anthracene unit. Additionally, polymers utilizing either the thiophene-flanked DPP or the furan-flanked DPP units paired with the naphthalene comonomer were compared. As these polymers have been used as donor materials and subsequent hole transporting materials in organic solar cells, we are specifically interested in characterizing the optical absorption of the hole polaron of these DPP based copolymers. We employ chemical doping, electrochemical doping, and photoinduced absorption (PIA) studies to probe the hole polaron absorption spectra. While some donor-acceptor polymers have shown an appreciable capacity to generate free charge carriers upon photoexcitation, no polaron signal was observed in the PIA spectrum of the polymers in this study. The relations between molecular structure and optical properties are discussed.

Graphical Abstract

1. Introduction

Organic solar cells have gained significant attention over the past several years due to the potential for low-cost, large-area, roll-to-roll fabrication. Power conversion efficiencies have surpassed 10% [1]. The primary processes in a working organic solar cell include: light absorption, charge generation, and charge transport. The extent to which solar light is absorbed is determined by the band gap of the organic semiconductor and the thickness of the active layer in the device [2,3]. The relatively low dielectric constant of organic semiconductors and the relatively weak electronic interactions between organic molecules characteristically result in a tightly bound exciton being created upon absorption of a photon [4]. For this reason organic solar cells typically employ a donor and acceptor pair of materials which allows for the dissociation of such an exciton via ultrafast charge transfer across a donor-acceptor interface [5]. The dissociation of an exciton via charge transfer allows for the creation of free charge carriers. The nature of the charge generation process is a topic of great interest [6,7,8,9,10]. The efficiency of exciton dissociation is dependent upon the efficiency of the charge transfer process as well as the exciton diffusion length and distance between the exciton generation point and donor-acceptor interface [11]. Excitons which energetically relax or recombine before successfully completing the charge transfer process do not contribute to the generation of free charge carriers. Charge carriers are then transported to the electrodes resulting in the generated photocurrent. The mobility, lifetime, and transit length of the charge carriers determine the transport efficiency [12]. Material properties, thin film structure and device engineering all greatly influence device performance [13].
Material design and synthesis have played a significant role in the development of organic solar cells. Low band gap polymers have been actively sought in order to better tune the absorption spectra of organic semiconductors to the solar spectrum [14]. Additionally, the control of the ionization potential and electron affinity of donor and acceptor materials has been used to modify the open circuit voltage of devices [15,16,17]. Indeed, an attractive attribute of organic semiconductors is the ability to tune the optical band gap through molecular design. Several factors are known to influence the size of the optical band gap: bond length alternation, resonance energy (often associated with switching between aromatic and quinoid structures), the energy associated with the dihedral angle, the influence of electron withdrawing or electron releasing groups, and intermolecular interactions [18]. Thus, several approaches have been used for band gap engineering, including: control of planarity and rigidity, control of the quinoid character [19], introduction of electron-rich or electron-poor species, and the use of alternating donor–acceptor (D–A) groups [20,21,22] (note, the D–A used here refers to electron-rich and electron-poor groups within the polymer backbone and this should be distinguished from the donor and acceptor nomenclature used to describe the two materials traditionally used for hole and electron transport in the solar cell).
Diketopyrrolopyrrole (DPP)-based polymers utilizing the strong electron-accepting DPP group in conjunction with an electron-donating group and have achieved significant interest for use in solar cells [23,24,25,26] and organic thin film transistors (OTFTs) [27,28,29]. In this paper we investigate the optical properties of a series of furan substituted diketopyrrolopyrrole co-polymers with phenylene, naphthalene and anthracene co-monomer blocks: poly(3,6-difuran-2-yl-2,5-di(2-octyldodecyl)-pyrrolo[3,4-c]pyrrole-1,4-dione-alt-phenylene) (PDPP-FPF), poly(3,6-difuran-2-yl-2,5-di(2-octyldodecyl)-pyrrolo[3,4,]pyrrole-1,4-dione-alt-naphthalene) (PDPP-FNF) and poly(3,6-difuran-2-yl-2,5-di(2-octyldodecyl)-pyrrolo[3,4-c]pyrrole-1,4-dione-alt-anthracene) (PDPP-FAF) [30]. We also investigate a thipohene analogue to PDPP-FNF, Poly(3,6-dithiophene-2-yl-2,5-di(2-octyldodecyl)-pyrrolo[3,4-c]pyrrole-1,4-dione-alt-naphthalene) (PDPP-TNT) [31,32]. The molecular structure for all polymers is shown in Scheme 1. These polymers have been previously used in organic solar cell and OTFT devices; the reported performance is summarized in Table 1.
Scheme 1. The chemical structures of the investigated polymers: PDPP-FPF, PDPP-FNF, PDPP-FAF, PDPP-TNT.
Polymers 07 00069 g013
Of particular interest in this study are the spectral characteristics of the positively charged polymer species. This is because, as they are utilized as donor polymers and hole transporters in organic solar cells, the polymers typically carry a positive charge when operating in the device. Identifying a spectral signature of the hole polaron can thus be useful in studies related to charge generation and charge recombination processes. A recent study used the spectral information obtained from chemical doping in conjunction with transient absorption studies to determine the photogeneration yield of polaron pairs in polymers [33]. The charge generation process, the mechanisms for exciton dissociation, and the presence of charge transfer states have drawn great attention. In particular, charge generation processes in D–A polymers have earned considerable interest. The influence of the charge localization on the D and A blocks can promote intra-molecular charge separation, which could benefit charge generation in organic solar cells [20,33,34].
Table 1. Table of previously reported device performance for solar cells and thin film transistors employing the polymers studied in this work.
PolymerJsc (mA/cm2)Voc (V)Fill Factor (FF)PCE (%)μsat (cm2·V−1·s−1) *Ref.
PDPP-FPF3.60.56370.780.04[30]
PDPP-FNF8.60.71422.60.11[30]
PDPP-FAF7.80.69452.50.07[30]
PDPP-TNT130.73474.50.65[31,32]
Note: all bulk heterojunction solar cells were made with 1:2 ratio with [70]PCBM (phenyl-C71-butyric-acid-methyl ester) and spincoated from a 4:1 (by vol.) chloroform:ortho-dichlorobenzene solvent system. The device structure was ITO (Indium Tin Oxides)/poly(3,4-ethylenedioxythiophene)(PEDOT)/active layer/Al. * hole mobilities were measured for thin film transistors made with a top contact, bottom gate geometry on octyltrichlorosilane treated Si/SiO2 substrates.
Chemical doping [33,35], electrochemical doping [36], and photoinduced absorption [37] have all proven useful in the investigation and characterization of the nature of charged species and photoexcited states in organic semiconductors. In this work we present results of chemical doping, electrochemical doping and photoinduced absorption studies on PDPP-FPF, PDPP-FNF, PDPP-FAF, and PDPP-TNT.

2. Experimental Section

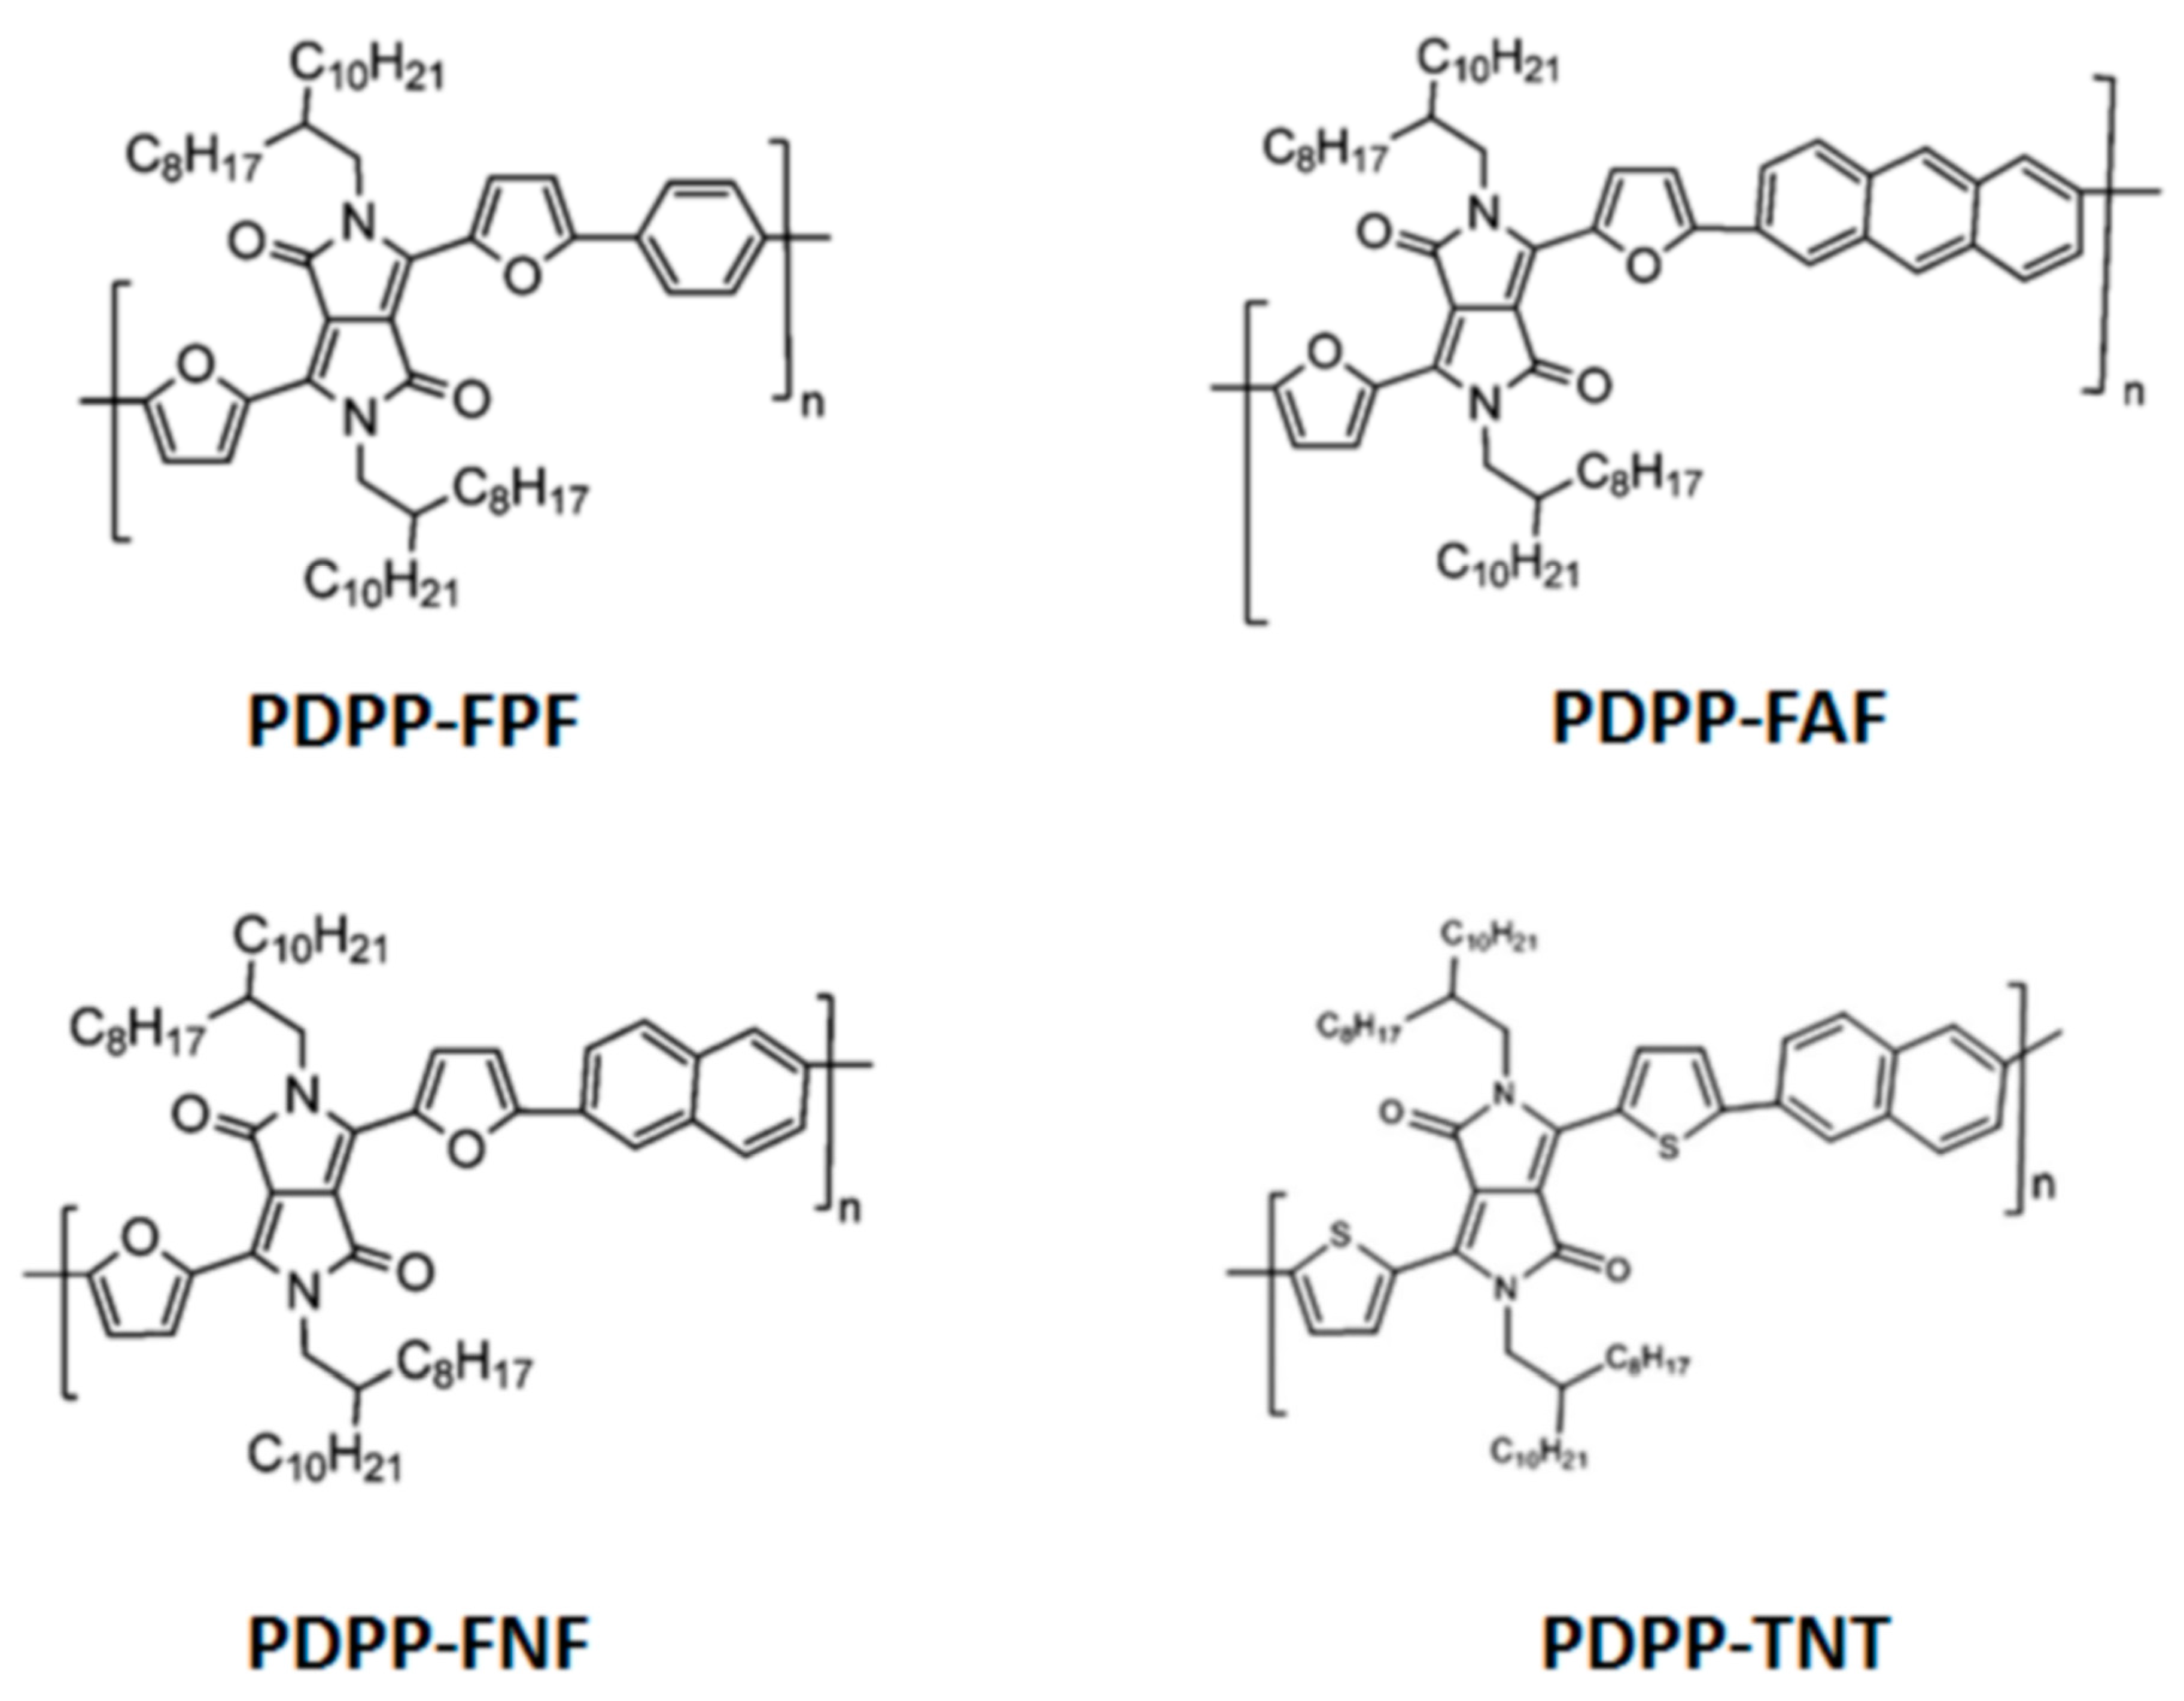
2.1. Polymer Synthesis

The polymers were synthesized as previously described [30,31].

2.2. UV-Vis Spectroscopy and Chemical Doping

Polymer solutions were made by dissolving polymer in anhydrous chloroform inside a nitrogen-filled glovebox. Chloroform was chosen as the solvent due to limited solubility in other solvents [30,32]. The solutions were diluted to achieve a final concentration around 10 μg/mL. The solutions were sealed in a quartz cuvette and spectra were measured on a bench top UV-Vis spectrophotometer (Shimadzu UV-3101PC, Kyoto, Japan). The solution was moved back into the glovebox where dilute SbCl5 (Sigma-Aldrich, St. Louis, MO, USA, 1.0 M in methylene chloride, further diluted in anhydrous chloroform) was added to oxidatively dope the polymer. The cuvette was resealed and the UV-Vis spectrum was then measured again. This process was repeated in order to achieve absorption spectra over a range of doping concentrations.

2.3. Spectroelectrochemical Measurements

Polymer solutions (~3 mg/mL) in chloroform were spincoated onto ITO (Indium tin oxide)-coated glass substrates yielding films ~30–40 nm thick. The optical changes upon doping were examined through in situ spectral measurements (Shimadzu UV-3600) while increasing the applied potential (Autolab PGSTAT128N potentiostat/galvanostat, Utrecht, The Netherlands). The electrochemical oxidation was carried out using a three-electrode cell assembly, where the working electrode was the ITO coated glass substrate (Xinyan Technology Ltd., Hong Kong, China), the counter electrode was a platinum wire and Ag wire was the pseudo-reference electrode. A 0.1 M LiClO4/ACN (Acetonitrile) electrolyte/solvent couple was used.

2.4. Photoinduced Absorption Measurements

Polymer solutions in chloroform and bulk heterojunction blends of polymer and [70]PCBM (Phenyl-C71-butyric-acid-methyl ester, Solenne BV, Groningen, The Netherlands) (1:2 by wt.) in chloroform:ortho-dichlorobenzene (4:1 by vol.) were spincoated onto glass substrates inside a nitro, gen-filled glovebox. The films were encapsulated with a glass cover and UV-curable epoxy (DELO-KATIOBOND LP655, Windach, Germany) inside the glovebox. The photoinduced absorption setup utilized a quartz tungsten halogen lamp (Newport, Irvine, CA, USA), a pulsed high power LED (230 Hz, 470 nm or 660 nm) (Thorlabs, M470L3 or M660L3, Newton, NJ, USA), a monochromator (Princeton instruments Acton SpectraPro 300i, Trenton, NJ, USA), an amplified InGaAs detector (Thorlabs PDA 20CS-EC), and a lock-in amplifier (Stanford Research Systems 830, Sunnyvale, CA, USA).

2.5. Photoluminescence Measurements

Photoluminescence spectra were recorded with a spectrometer (Princeton Instruments Acton SpectraPro 2150i and Pixis 100). The encapsulated polymer samples used for PIA (photoinduced absorption) were excited by the same high power LED (Thorlabs, M660L3).

2.6. Density Functional Theory (DFT) Calculations

Dimer models of the four polymers were built using Gaussian 09 (revision a.02) (Gaussian, Inc.: Wallingford, CT, USA). The models were optimized by using DFT (Density functional theory) at the level of theory: B3LYP/6-31G(d) with Gaussian 09. Highest occupied molecular orbital (HOMO), the lowest unoccupied molecular orbit (LUMO), dipole moment, total energy, geometric parameters (the dihedral angles) were obtained at the DFT optimized geometries. The excited states (the first 60 states) were calculated at the optimized ground state geometry using TD-DFT (Time-dependent density functional theory) and at the same level of theory as ground state geometry optimization.

3. Results and Discussion

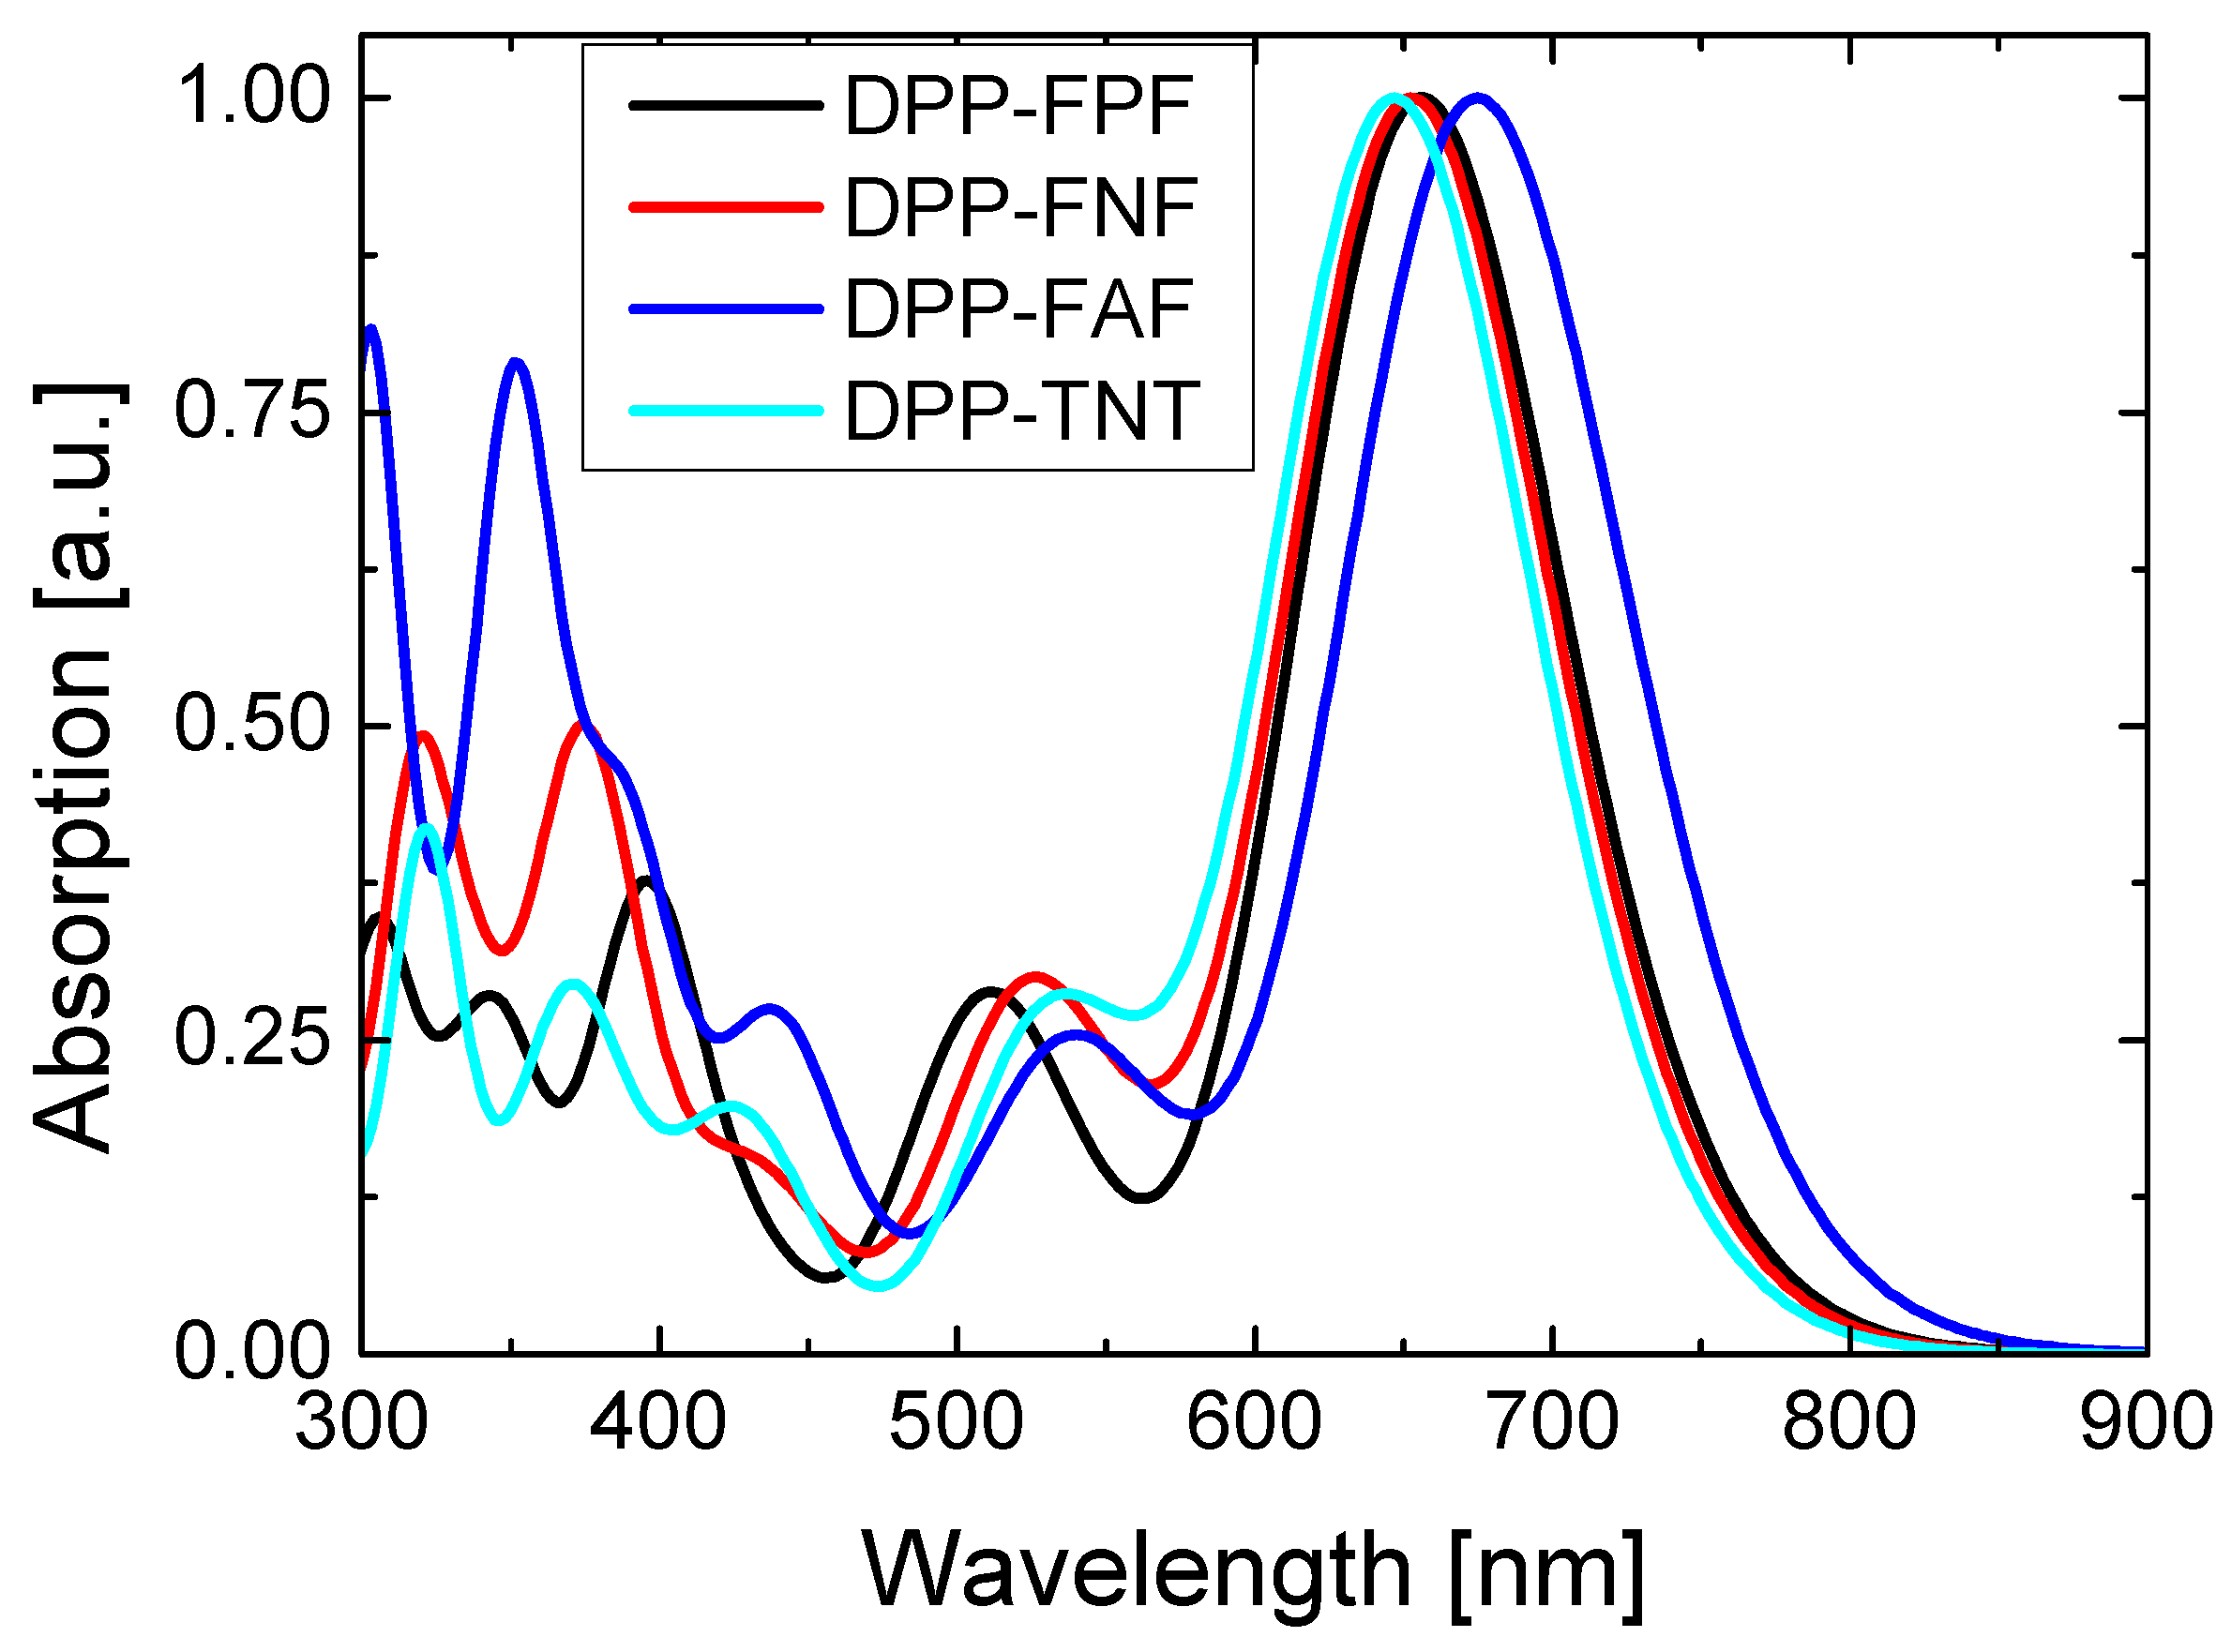
3.1. UV-Vis Absorption
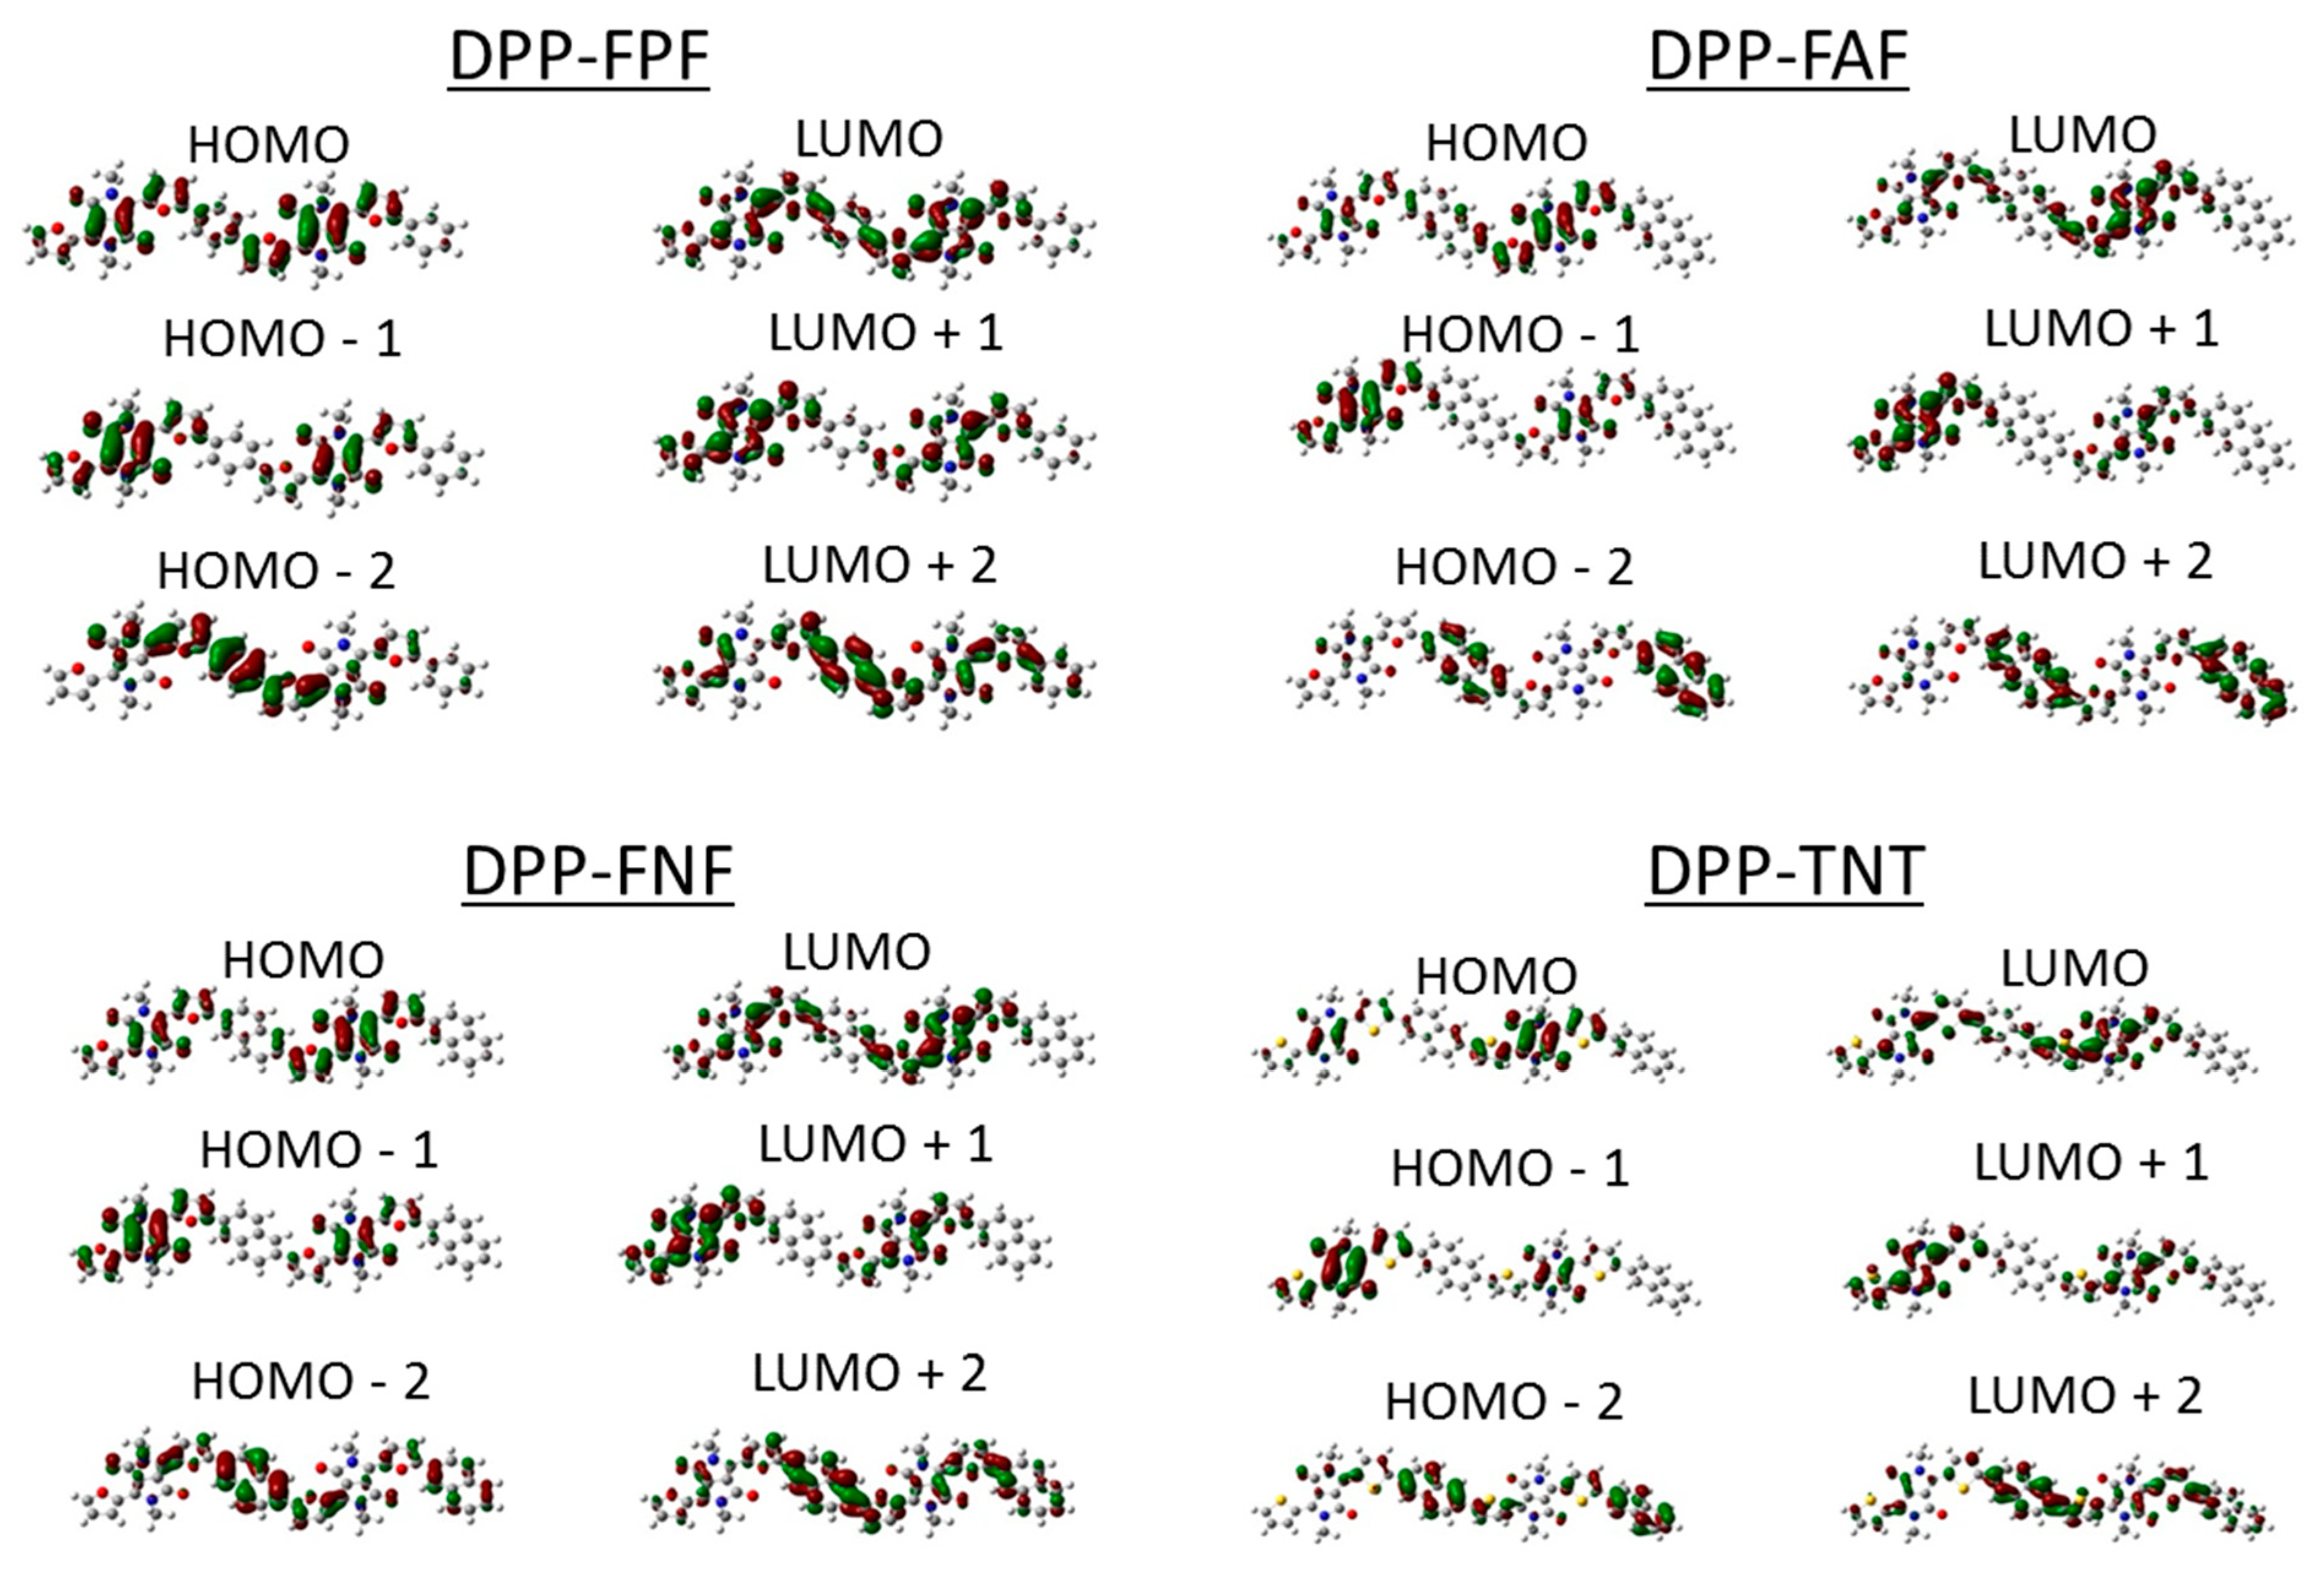
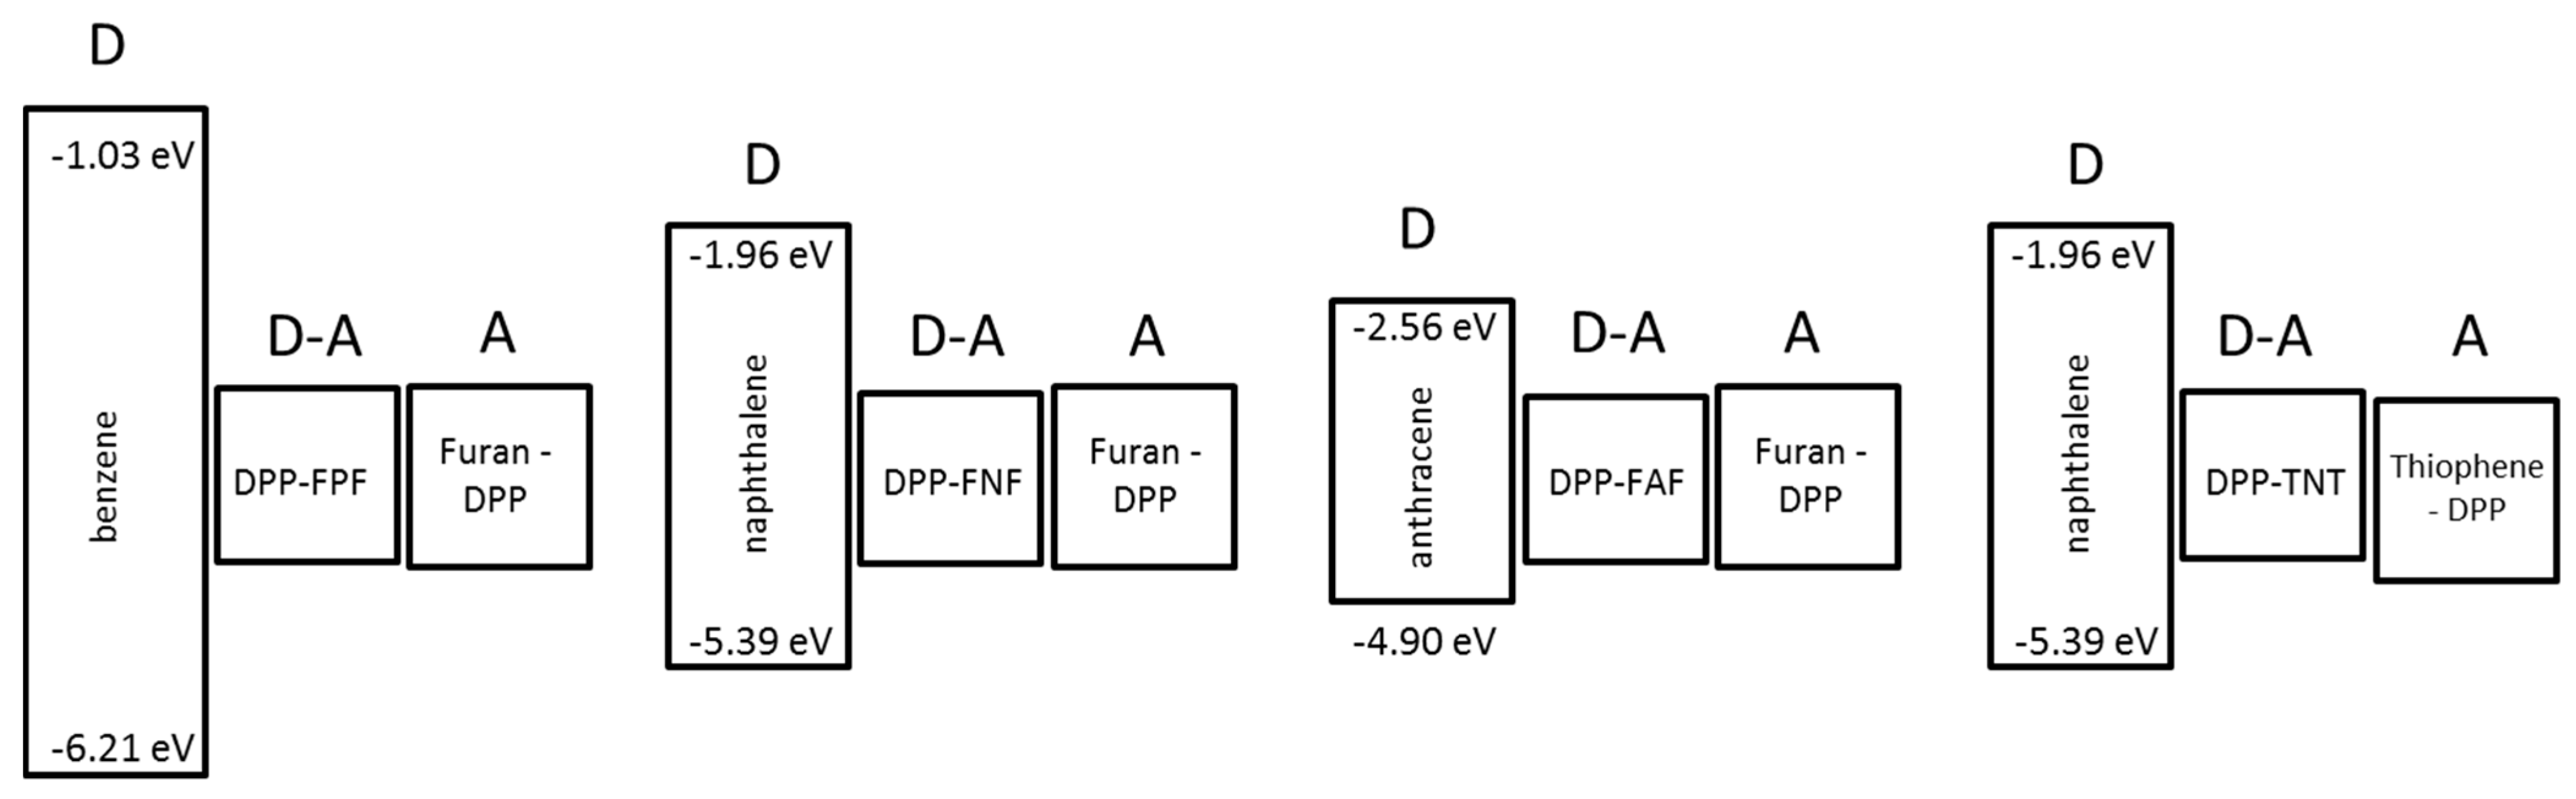
The optical densities of both thin film samples and solution samples were measured. The spectra shown in Figure 1 are for samples without any chemical or electrochemical doping. All of the spectra have two prominent peaks between 600 and 750 nm as well as some less prominent features below 450 nm; such multiple absorption bands across the near infra-red and visible are often observed for donor-acceptor based conjugated systems [38].
Figure 1. (a) Absorption spectra for polymers in solution; (b) Normalized absorption spectra for thin film polymer samples, expressed as 1-transmittance with contributions from reflection not accounted for.
Polymers 07 00069 g001
Looking at the spectra of the solution samples, PDPP-FNF and PDPP-FAF have very similar features with absorption maxima at 712 and 708 nm, respectively and secondary peaks at 646 and 640 nm, respectively. The corresponding twin-peaks of PDPP-FPF are red-shifted compared to this and centered around 744 and 672 nm. As the effective conjugation length of a π-conjugated monomer or repeating unit extends, the band gap should decrease, so if this were the only factor at play then one may expect the opposite trend. However, two other factors should be taken into account. The first of these is the planarity of the system. If the extended π-system yields a less planar structure then the overlap of the donor and acceptor π-systems will be poor and the reduction in the bandgap will be less. The second factor is the resulting charge separation from the donation and acceptance of the electronic charge. In general one would expect that the system would not favor long distance charge separation as this takes more stabilization energy from the surroundings (the solvent or matrix) to support. Hence, inserting a more conjugated yet physically longer acene group may not result in charge delocalization to the extremities of the system. To some extent this statement is backed up in the current work by DFT-calculations vide infra.
In the present case, for the homologous series PDPP-FNF, PDPP-FAF and PDPP-FPF, the similarities in the absorption spectra of PDPP-FNF and PDPP-FAF suggest the naphthalene and anthracene groups have a similar influence on the overall intramolecular electron delocalization. The longer wavelength absorption onset seen for PDPP-FPF suggests that it is actually the phenyl group, which allows for greater electron delocalization and an increase in the effective conjugation length, despite having fewer π electrons than the larger acenes. Therefore we can conclude that the overall effect of the size of the acene group is a complex combination of steric, coulombic and conjugation effects, as described above.
The primary absorption peak in the thiophene based PDPP-TNT appears broader than for the furan-based polymers, and the absorption band has less clearly defined structure with peaks centered around 722 and 662 nm. The peaks are red-shifted with respect to furan analogue, PDPP-FNF. Both sulfur and oxygen are more electronegative than carbon and the electron density is higher around the sulfur and oxygen than neighboring carbons in thiophene and furan, respectively. The resonance energy of thiophene is greater than for furan, which may allow for a different electron localization and resultant difference in band gap observed between PDPP-FNF and PDPP-TNT. DFT calculations were used to investigate electron densities and are discussed later.
It is interesting that there is very little difference between the absorption peaks of solution and thin film samples. In thin film samples, the absorption peaks for DPP-FPF, PDPP-FNF, PDPP-FAF, and PDPP-TNT are 748, 715, 710, and 733 nm, respectively. For polymer semiconductors in which significant crystallinity and π–π stacking occurs in the solid form, a significant red-shift in the peak absorption or the presence of strong absorption shoulder in the long wavelength part of the spectrum is often observed; this is the case for the well-studied poly(3-hexylthiophene) (P3HT) [39]. The absence of a shift that can be assigned to π–π stacking-induced effects suggests that there is little change in the packing between molecules (or portions of the polymer chain) between the solution form and thin film form. This may be the result of poor organization and stacking in the thin film, or poor solubility and the presence of some degree of intermolecular organization in solution. Several high mobility DPP-based polymers were observed to have only a minor red-shift in peak absorption upon going from solution to thin film; it was thought that the small (<20 nm) shift was due to the polymers already possessing a highly coplanar rigid chain conformation in solution [28]. However, a similar small shift observed in DPP-TNT was previously attributed to losses in optical transmission of the film due to reflection losses owing to the change in the index of refraction near the absorption maximum [32]. In this case there is no need to invoke any chemical change in the polymer packing upon removal of the solvent and the shift is fully accounted for by optical effects alone. In the current work we will show that there is also a slight case against a totally rigid structure for the HOMOs of these molecules from DFT calculations.

3.2. DFT Modeling

DFT calculations were used to investigate the relationship between molecular structure and electron density in these polymers with two primary objectives in mind: (i) to assess the influence of the acene co-block in regard to its role as a donor within the framework of a D–A copolymer, and (ii) to better understand the relationship between the molecular structure and the absorption spectrum.
Figure 2 shows the electron densities for the highest occupied molecular orbital (HOMO) and the lowest unoccupied molecular orbit (LUMO) levels, as well as orbitals further below and above the band gap edge. In D–A molecules, DFT calculations frequently reveal a HOMO with electron density localized on the donor unit and a LUMO with electron density localized on the acceptor unit [40]. The side chains were shortened to simple methyl group to simplify calculations and the system was limited to a dimer. Although this fact limits the exact interpretation of energy levels from DFT, it does not prevent us from a qualitative discussion regarding these models. We find the significant electron density on the acene groups for orbitals further from the band gap edge interesting; additional orbital calculations can be found in supporting information (Tables S1 and S2).
Figure 2. The electron density isocontours of highest occupied molecular orbital (HOMO) and the lowest unoccupied molecular orbit (LUMO) of representative dimers of the repeat unit for PDPP-FPF, PDPP-FNF, PDPP-FAF, and PDPP-TNT. Additionally, electron density isocontours of the first two energy levels below the HOMO and above the LUMO are shown.
Polymers 07 00069 g002
In the current case, in Figure 2, we can see that electron distribution between the HOMO and LUMO are quite similar in the broadest sense, with the major difference being in the alternation of double and single bonds within the system. The equilibrated (non-Franck–Condon) [41] LUMO state appears to want to adopt a more planar quinoidal structure with the bond bridging between the donor and acceptor units being more double bonded than in the HOMO. This is evident for all four molecules in the series. Note that this expected increase in the planarity is for the equilibrated state and the Franck–Condon state does not undergo molecular motion during the transition from HOMO to LUMO during absorption. To examine this in more depth we should then compare the emission of these molecules. Comparing the emission maximum to the absorption maximum for each molecule we can assess the Stokes shift in each case. If the Stokes shift is large then we can assume that there is significant intramolecular movement between the Franck–Condon state and the equilibrated state (corresponding to the LUMO from the DFT calculation). For the 4 molecules in this series the Stokes shift is 20–30 nm. This can be compared to a completely rigid system such as anthracene, for which the Stokes shift is around 10 nm [42]. Hence we can suggest that there is a small molecular reorientation between the initially excited LUMO and the equilibrated state. This supports that there can be a change in the planarity between the states and that the bridging bond between the donor and acceptor units may have more flexibility in the ground state (HOMO) than it does in the LUMO. The rearrangement however is not suggested to be excessive.
Havinga et al. suggested that donor-acceptor interaction in a D–A copolymer would result in a small band gap if the HOMO levels of the donor were close to the LUMO levels of the acceptor [21]. Pandey et al. used DFT calculations to systematically investigate the band gap and electron localization of a series of D–A copolymers, utilizing different donor and acceptor group pairings. The overlap of the individual donor and acceptor monomer energy levels and torsion angles were used to describe the resultant band gap and electron localization of constructed D–A tetramers. Acceptor groups with lower lying (farther from vacuum) LUMO levels resulted in D–A polymers with a significantly smaller band gap in comparison to the individual donor and acceptor blocks. Paired with the same acceptor, donor groups with smaller HOMO values (closer to vacuum) resulted in smaller band gap polymers. Tetramers with smaller band gaps also had smaller torsional angles [20].
DFT calculations were used to estimate the HOMO and (non-Franck–Condon equilibrate) LUMO levels of the furan- and thipohene-based DPP monomer blocks (furan-DPP and thipohene-DPP) as well as benzene, naphthalene, and anthracene blocks. The results are shown in Table 2 and Figure 3. For benzene, naphthalene, and anthracene, the band gaps are all larger than those of the DPP units, and HOMO and LUMO levels of the acenes are outside the HOMO and LUMO levels of both furan-based DPP and thipohene-based DPP monomers. The HOMO and LUMO levels are only slightly shifted (~0.1 eV) when comparing the values of the DPP monomer blocks with monomer units of the investigated polymers (DPP-acene); the band gaps are also different by a modest ~0.1 eV. The anthracene HOMO level is the closest of the acenes to the DPP LUMO level; however, PDPP-FPF has a lower band gap than PDPP-FAF. The lack of orbital level alignment of the monomer blocks and the little difference in calculated band gap of the furan- and thipohene-based DPP monomers as compared to the DPP-acene monomers suggest that the acene blocks do not function as a donor group to a DPP acceptor group when applying the principles of Pandey and Havinga. Many factors can influence the overall overlap between the donor and acceptor moieties and the extent of delocalization in the resulting molecular orbitals.
Time dependent DFT calculations were further used to calculate the optical absorption spectra of the dimers, as shown in Figure 4. The general shape is similar to that of the measured UV-Vis spectra, with two strong absorption peaks at longer wavelengths and additional absorption peaks at shorter wavelengths. In general, the calculated absorption spectra are blue-shifted as compared to the measured spectra, as is typical for time-dependent DFT calculations and this can be seen for the benzene, naphthalene and anthracene DFT models, for which the real absorption maxima are 270 nm (4.6 eV) 310 nm (4 eV) and 380 nm (3.3 eV), respectively [42].
Table 2. HOMO, LUMO and band gap values for monomers of the individual blocks used in the co-block polymers (benzene, naphthalene, anthracene, furan-DPP, and thiophene-DPP) as well as monomers of the DPP-acenes (DPP-FPF, DPP-FNF, DPP-FAF), as calculated with DFT. HOMO values for the polymers have been measured using cyclic voltammetry (CV) and photoelectron yield spectroscopy in air (PESA), and the bandgap of thin film samples was determined from the onset of optical absorption.
Monomer unitHOMO (eV)LUMO (eV)Band gap (eV)HOMO (eV) CV [ref]HOMO (eV) PESA [ref]Optical band gap (eV) [ref]
benzene−6.21−1.035.18---
naphthalene−5.39−1.963.43---
anthracene−4.90−2.562.35---
furan-DPP−4.59−3.181.41---
thiophene-DPP−4.70−3.301.40---
DPP-FPF−4.48−3.111.375.40 [30]5.48 [30]1.55 [30]
DPP-FNF−4.48−3.131.355.34 [30]5.50 [30]1.63 [30]
DPP-FAF−4.45−3.171.285.33 [30]5.52 [30]1.64 [30]
DPP-TNT−4.60−3.281.325.29 [31]5.401.60
Figure 3. The relative HOMO and LUMO levels are shown for each of the individual acene blocks, DPP blocks, and DPP-acene co-block monomers. While the acene blocks have been labeled as donor (D) units, and the DPP blocks have been labeled as acceptor (A) units, the fact that the HOMO and LUMO of the acenes all lie significantly outside of the HOMO and LUMO of the DPP blocks suggests there would be little D–A interaction. The HOMO and LUMO levels of the DPP blocks are similar to all of the co-block monomer units.
Polymers 07 00069 g003
Looking at the absorption peaks of the DFT calculated spectra, from longest to shortest, the order is: DPP-FAF, DPP-FNF, DPP-FPF, DPP-TNT. Calculated bond angles (shown in supporting information Scheme S1) suggest that the furan structures are more planar than the thiophene structure. Additionally, there is a slight trend of increasing planarity with increasing acene group size. It is interesting that the absorption peaks of the measured polymers are, from longest to shortest PDPP-FPF, PDPP-TNT, PDPP-FNF, PDPP-FAF. We speculate that in reality the polymers are not as planar as the calculations for the dimers suggest, and this may be the result of entropy considerations. Intuitively, for a dimmer to adopt a planar conformation is entropically much more favorable than for an oligomer to adopt a fully planar structure. Furthermore, the ability of entropy effects to dominate will have strong steric factors, which can be strongly influenced by the packing factors allowed by the different sizes of acene group in the molecular conformations adopted in solution or in a solid matrix. In fact, from the current experimental results, it would seem that the shorter acene group would allow for a greater planarity and conjugation as PDPP-FPF had the longest wavelength absorption peak.
Figure 4. The absorption spectra of the four dimers representative of the four investigated polymers, as determined by DFT calculations.
Polymers 07 00069 g004

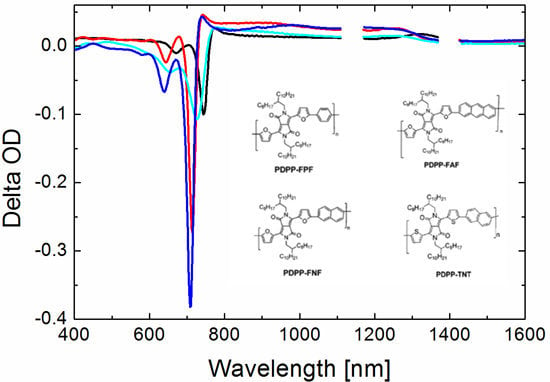
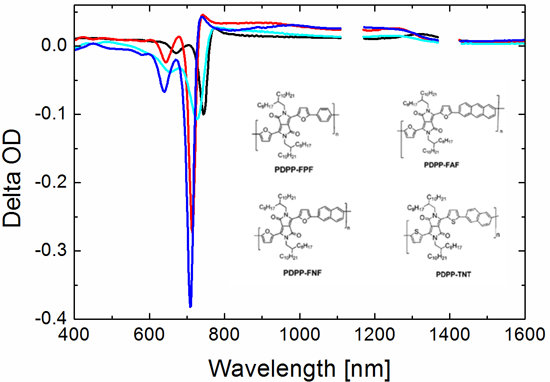
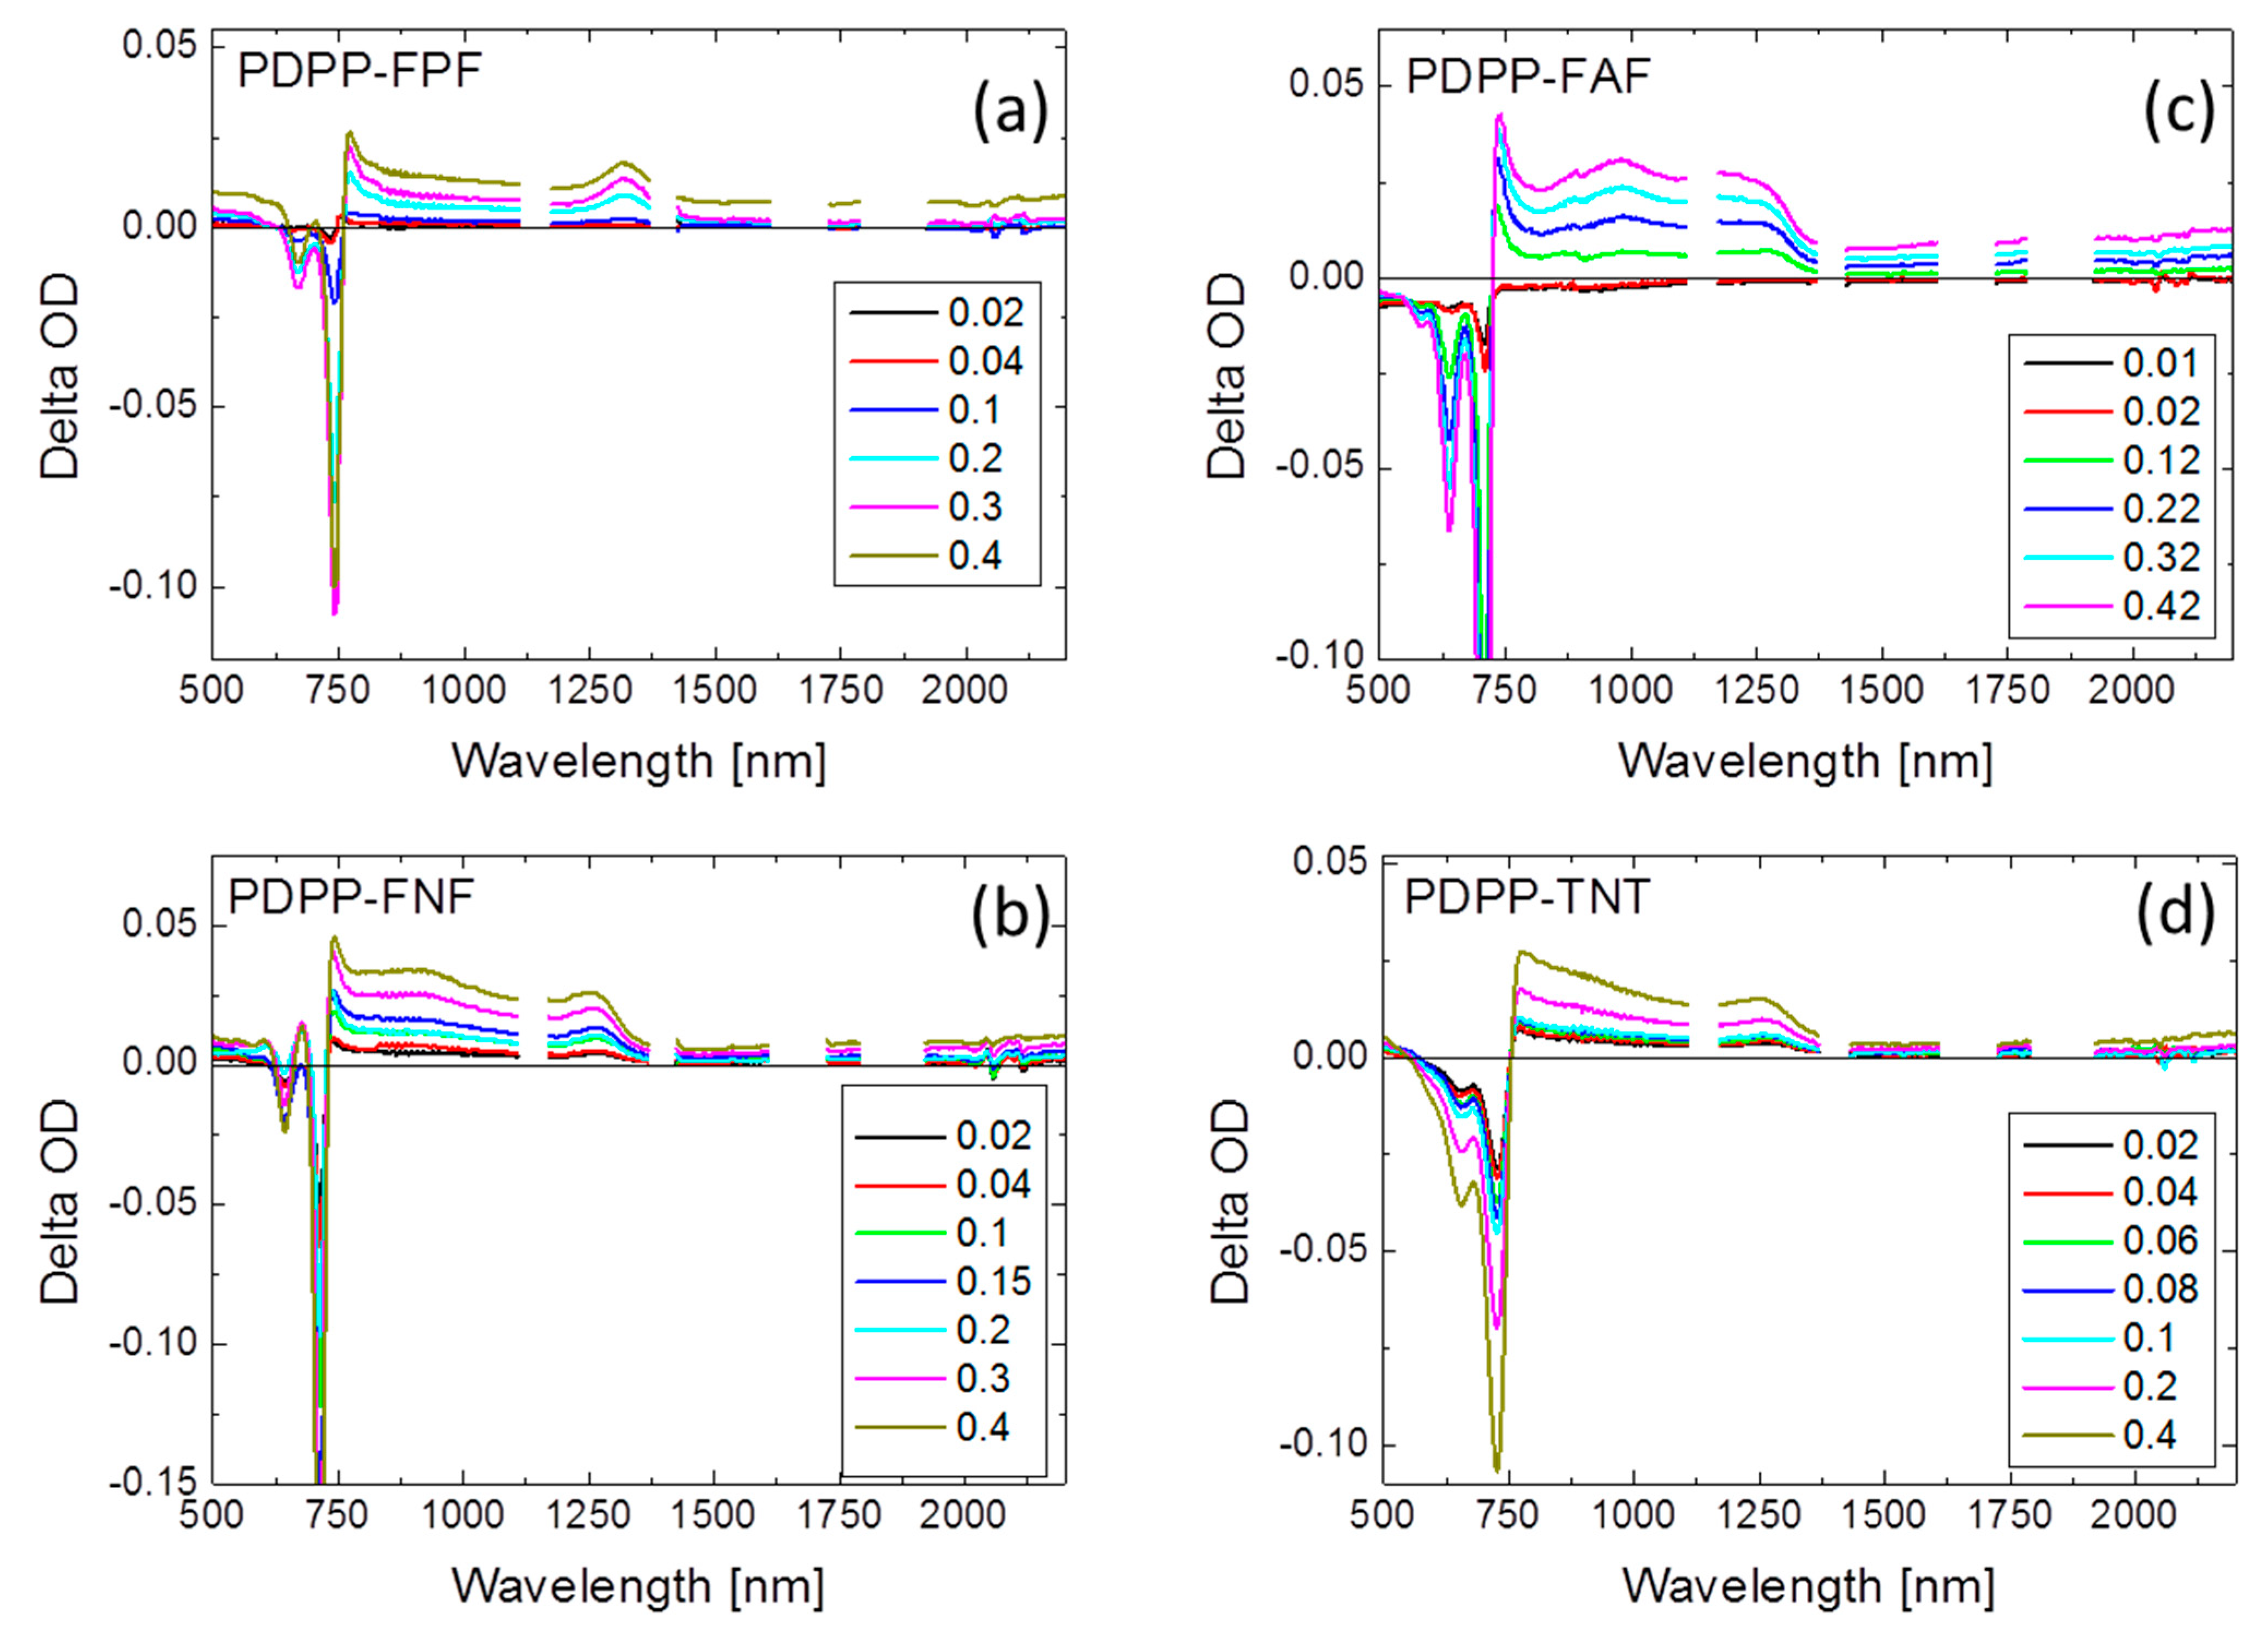
3.3. Chemical Doping

The addition of a strong oxidizing (or reducing) agent to semiconducting polymers in solution has been used to investigate the optical spectra and character of the doped polymer [33,35]. As these DPP-based polymers are employed as donor materials and hole transporters in organic solar cells, we are most interested in the spectral signal of the hole polaron (positive free charge carrier). Small amounts (~2%–10% by mass) of SbCl5 (1.0 M in methylene chloride, further diluted in chloroform) were added to dilute polymer solutions in sequential doping steps. The UV-Vis absorption spectrum was measured after each doping step. The spectrum of the neutral polymer solution was subtracted from the doped spectrum to determine the change in the spectrum.
Figure 5 shows the change in optical density (OD) with doping for the four polymers being investigated. (Portions of the spectra have been removed where the solvent absorption was very strong and the signal became uninterpretable.) The spectra show significant bleaching of the ground state absorption and the formation of new absorption bands at longer wavelengths. The new absorption features typically include a sharp peak at a wavelength just longer than the onset of ground state absorption, a second peak around 1250 nm, and a slowly rising tail around 2000 nm. This general shape has been observed in other chemically doped D–A polymers; features below 1500 nm are assigned to one polaron absorption band and features above 2000 nm are thought to belong to a second polaron absorption band [33].
Figure 5. Change in optical density (Delta OD) with chemical doping of (a) PDPP-FPF; (b) PDPP-FNF; (c) PDPP-FAF; (d) PDPP-TNT.
Polymers 07 00069 g005
A comparison of the absorption spectra of the first polaron band for all four investigated polymers is shown in Figure 6. Apart from the sharp peak near the edge of ground state absorption, a second peak is observed at longer wavelengths. This peak is located at 1312 nm, 1252 nm, and 982 nm for PDPP-FPF, PDPP-FNF, and PDPP-FAF, respectively. PDPP-TNT has a peak at 1258 nm, very similar to PDPP-FNF.
Figure 7a shows the change in OD of the polaron absorption with dopant concentration, and Figure 7b shows the change in absorption of the ground state species with dopant concentration. In general, the change in polaron absorption can be reasonably well described with a linear dependence on dopant concentration. The change in ground state absorption typically shows a sublinear relationship with dopant concentration, indicative of a change in oxidation efficacy. To calculate a molar absorption coefficient (ε) of the polaron species, the polymer concentration in solution and the change in ground state absorption were used to determine the concentration of oxidized polymer. The molar absorption coefficient was given as:
ε ( λ ) = OD polaron ( λ ) c oxidized · x
where ODpolaron is the optical density of the polaron signal, coxidized is the concentration of oxidized polymer and x is the path length of the cuvette. The polaron cross section was then calculated as:
σ p o l a r o n ( λ ) = ln ( 10 ) · ε ( λ ) N A
where NA is Avogadro’s number. The results are shown in Table 3. The polaron extinction coefficients and cross sections are in the range of those reported for other donor-acceptor polymers and P3HT [33]. We note that much higher dopant concentrations were used in this study to achieve similar changes in OD as in other studies [33]; the polymers were not as easily oxidized. This may be the nature of the polymers themselves or a lessened efficacy of the SbCl5; the nature of the experiments with extensive dilution of the oxidizing agent and repeated contact with syringe needles and pipette tips may reduce the SbCl5 and make it a less effective oxidizing agent.
Figure 6. The absorption spectra of the hole polaron shown as a change in the optical density (OD) with chemical doping for PDPP-FPF, PDPP-FNF, PDPP-FAF, and PDPP-TNT; the dopant percentages were 40%, 40%, 42%, and 40%, respectively. The positions of peaks in the spectra at wavelengths longer than 900 nm are identified.
Polymers 07 00069 g006
Figure 7. (a) Change in optical density with chemical doping at the long wavelength peak of polaron absorption spectra of the investigated polymers. The trend is, in general, well described with a linear fit; (b) Change in absorption of ground state peak with chemical doping of the investigated polymers.
Polymers 07 00069 g007
Table 3. Molar absorption coefficients and polaron cross-sections.
Polymer (wavelength)Molar absorption coefficient (cm2/mol)Polaron cross section (cm2)
PDPP-FPF (1312 nm)2.06 × 1077.87 × 10−17
PDPP-FNF (1252 nm)7.08 × 1062.71 × 10−17
PDPP-FAF (982 nm)6.80 × 1062.60 × 10−17
PDPP-TNT (1258 nm)1.68 × 1076.44 × 10−17

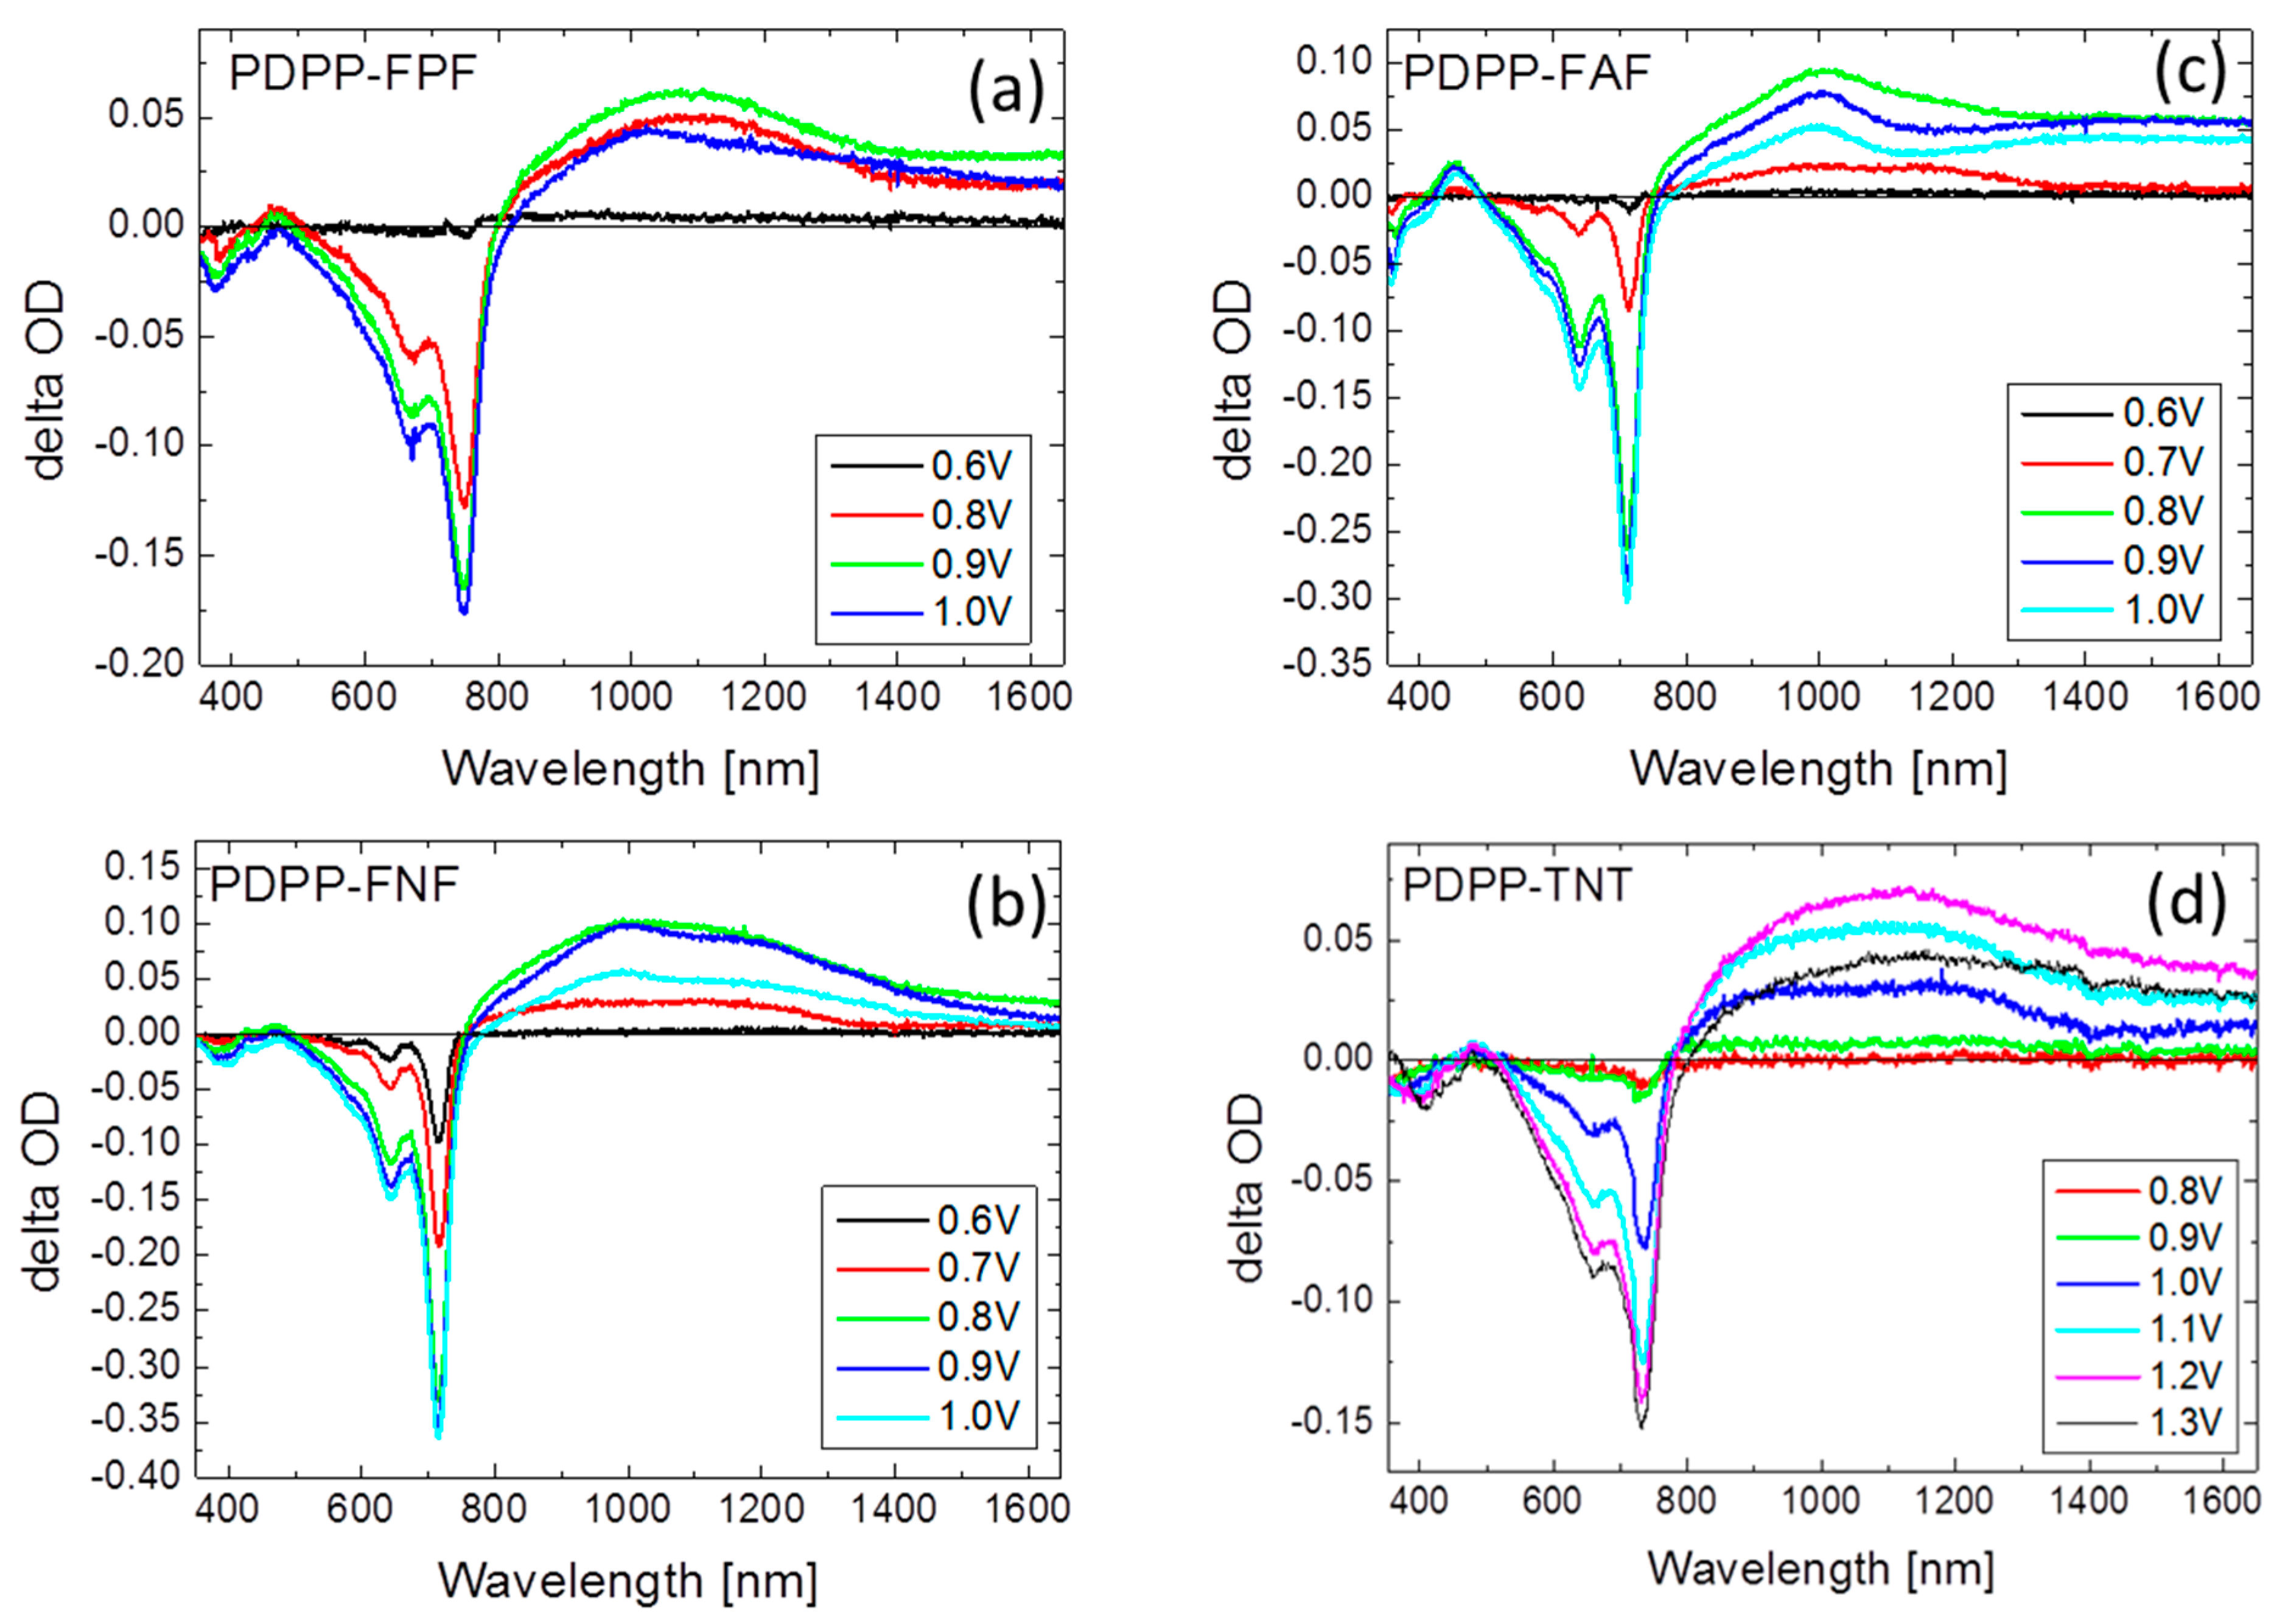
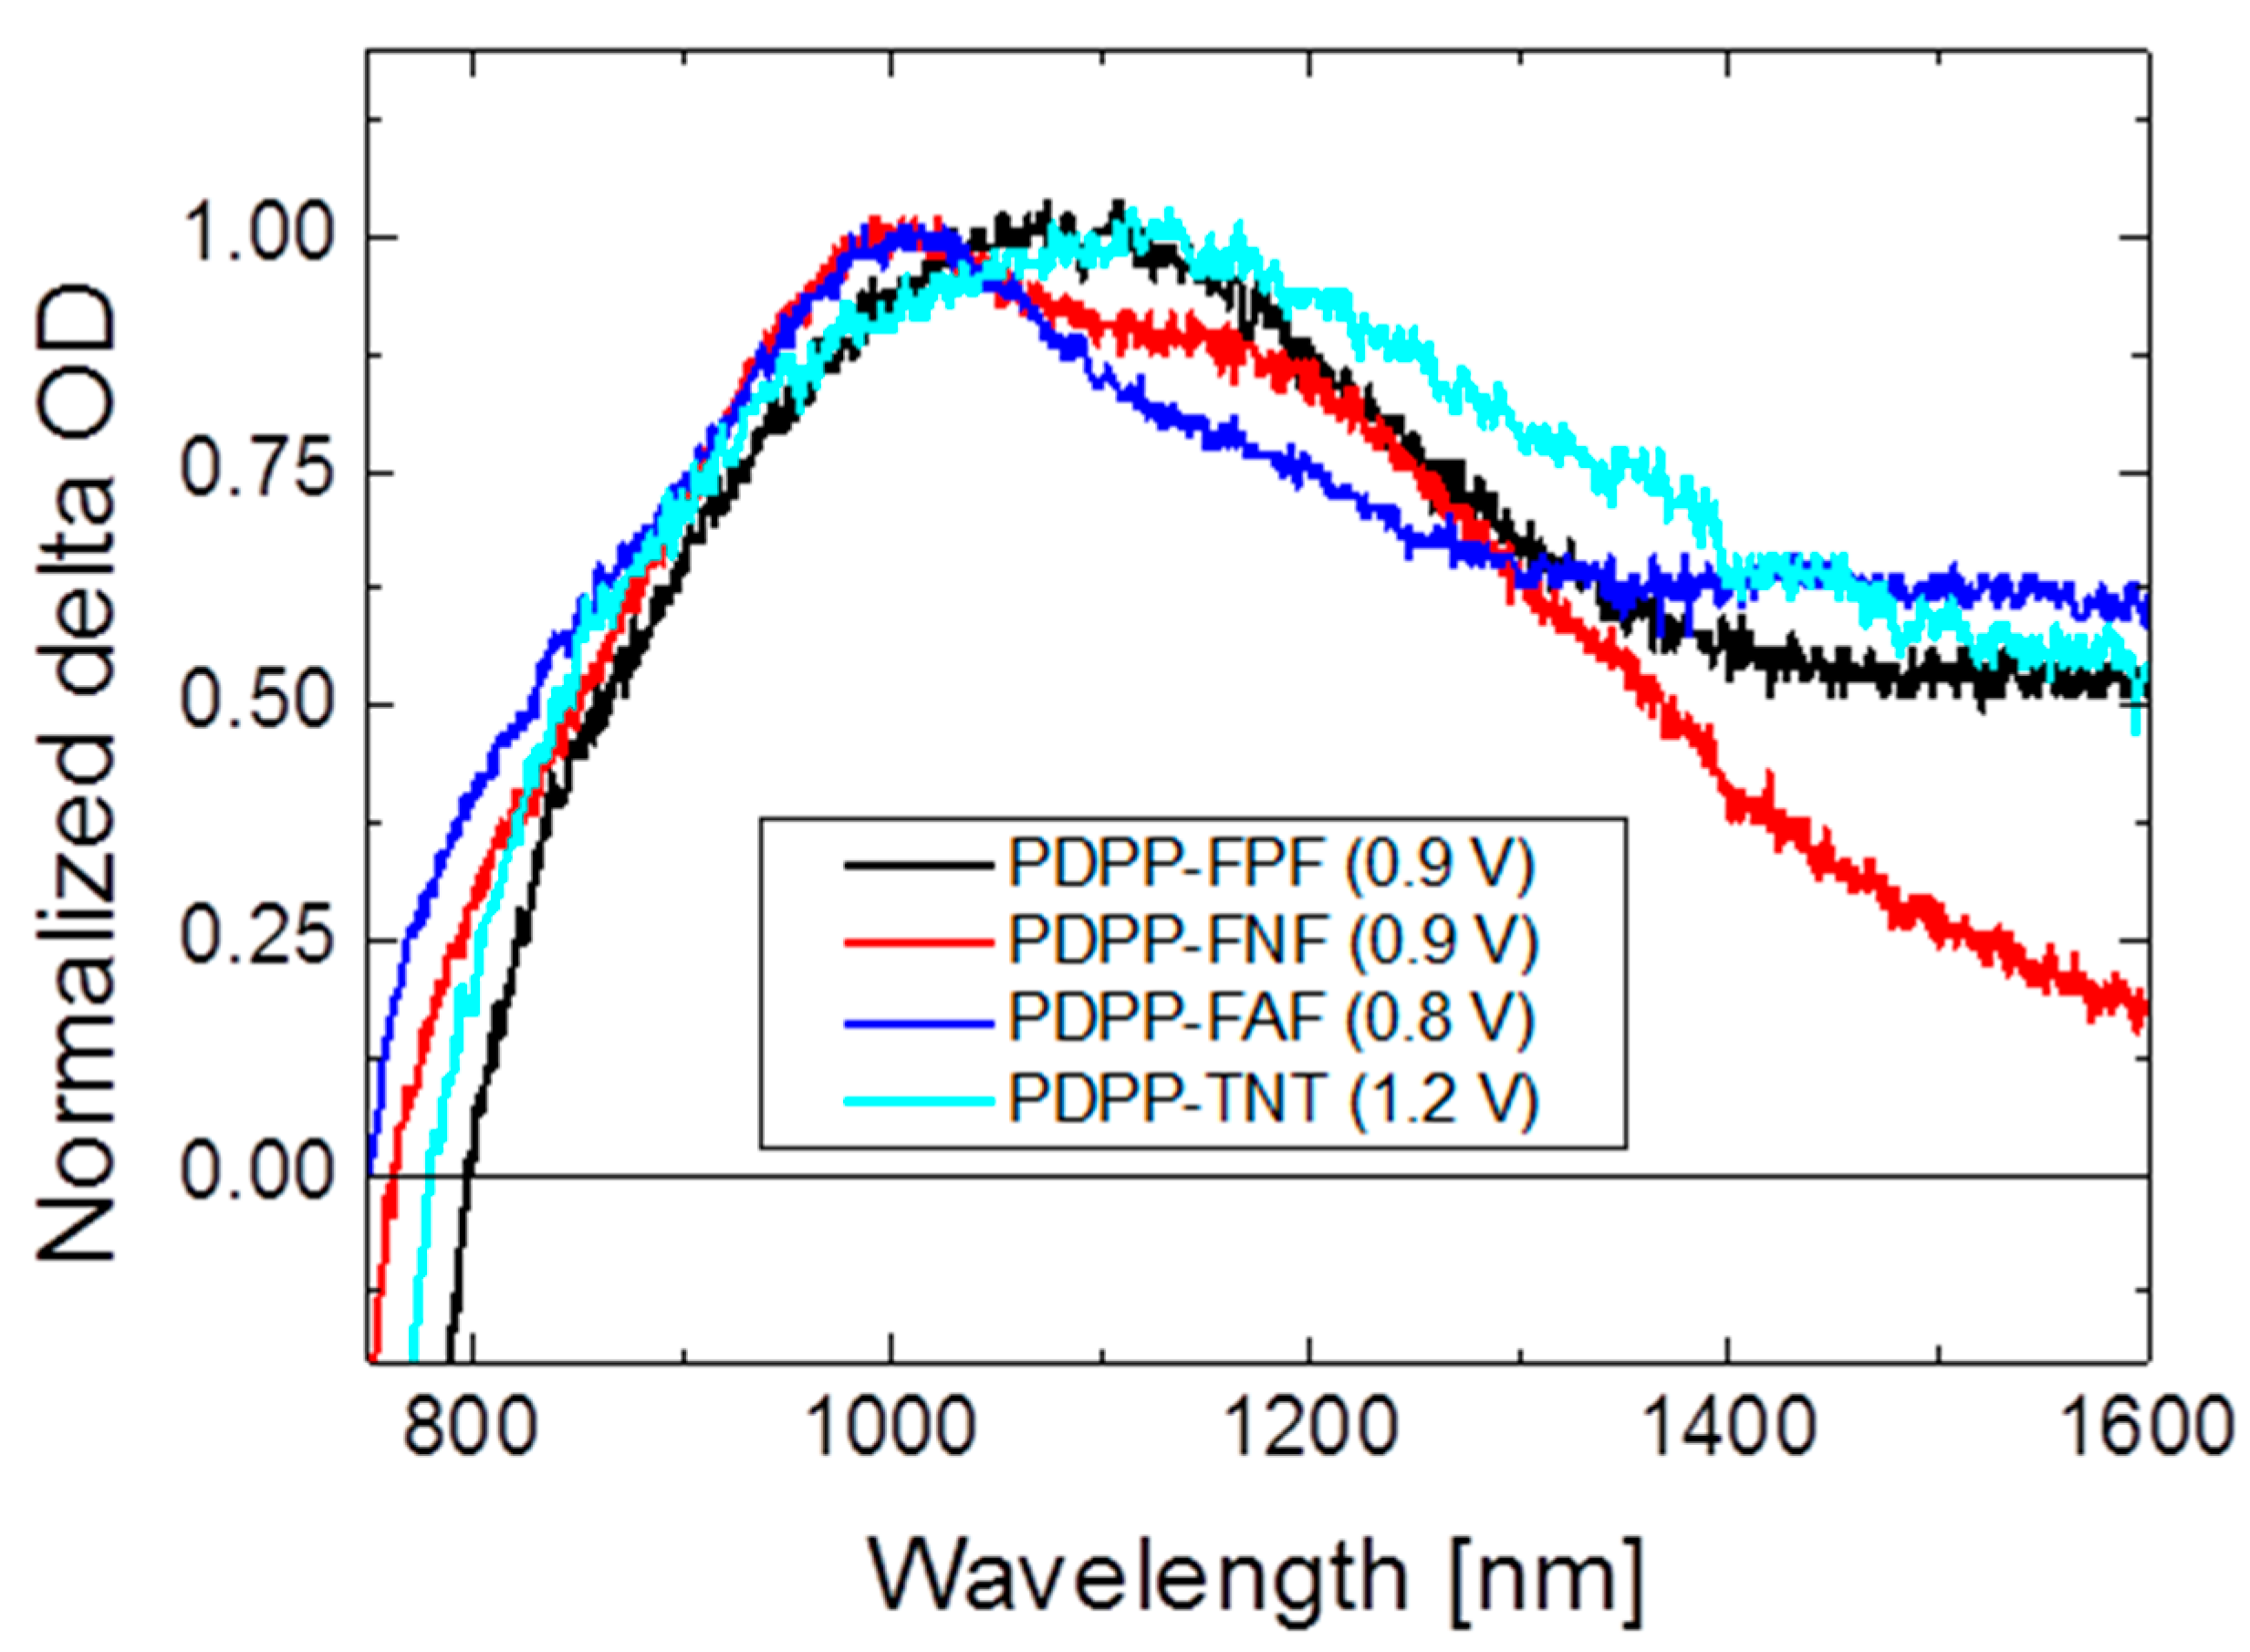
3.4. Spectroeclectrochemistry

Thin film samples of the four studied polymers were prepared on ITO coated glass substrates. The UV-Vis absorption spectra were measured as the polymers were subjected to progressive electrochemical oxidation. The starting, neutral, spectrum was subtracted from the spectrum at each applied voltage. Figure 8 shows the change in optical density with applied voltage. The change in the color of the films was attributed to the electrochemical generation of polarons, as supported by the concomitant bleaching of the ground state in addition to the formation of new, broad bands in the IR region, 800–1600 nm.
Figure 8. Change in optical density with applied bias for electro chemical doping of PDPP-FPF (a), PDPP-FNF (b), PDPP-FAF (c), and PDPP-TNT (d).
Polymers 07 00069 g008
Of particular interest is the sensitivity of the polaron generation and decay with respect to the applied voltage. For all polymers, the voltage at which ground state bleaching and weak polaron absorption was first observed was 0.6 V. The HOMO values for PDPP-FPF, PDPP-FNF, PDPP-FAF, and PDPP-TNT were reported [30,31] to be very close to one another at 5.40, 5.34, 5.33, and 5.30 eV, respectively. At larger applied voltages, while additional bleaching of ground-state absorption was observed, the polaron signal started to decay, as illustrated by the drop in their corresponding absorption. The maximum polaron signal for PDPP-FPF, PDPP-FAF, PDPP-FNF and PDPP-TNT was observed at voltages of 0.9, 0.9, 0.8 and 1.2 V, respectively. The decay in the polaron absorption may be attributed to the formation of bipolaronic states in the polymers, which would typically show absorptions further into the near-IR wavelength, which is beyond the spectral range examined here.
The molar absorption coefficient (ε) of the polaron species was calculated assuming a polymer density of 1g/cm3, the film thickness, and by using the change in absorption of the ground state to calculate the molar concentration of oxidized polymer. The values of ε for PDPP-FPF, PDPP-FAF, PDPP-FNF and PDPP-TNT are 1.69 × 10⁷, 2.60 × 10⁷, 5.59 × 10⁷, and 1.74 × 10⁸, respectively. The values were calculated for the voltage at which the polaron absorption was a maximum and at the same wavelengths as used in the absorption coefficient calculations in solution. The values are in reasonable agreement with those calculated for the polymers in solution.
Figure 9 shows a comparison of the polaron absorption spectra for all four polymers. Strong absorption between 800 and 1400 nm is in agreement with the chemical doping spectra. The peaks for PDPP-FPF, PDPP-FAF, PDPP-FNF and PDPP-TNT are located at approximately 1080, 1000, 1000 and 1100 nm, respectively. The strong absorption at wavelengths longer than 1400 nm may be attributed to bipolaronic states.
Figure 9. (a) Comparison of polaron spectra for electrochemically doped PDPP-FPF, PDPP-FNF, PDPP-FAF, and PDPP-TNT.
Polymers 07 00069 g009

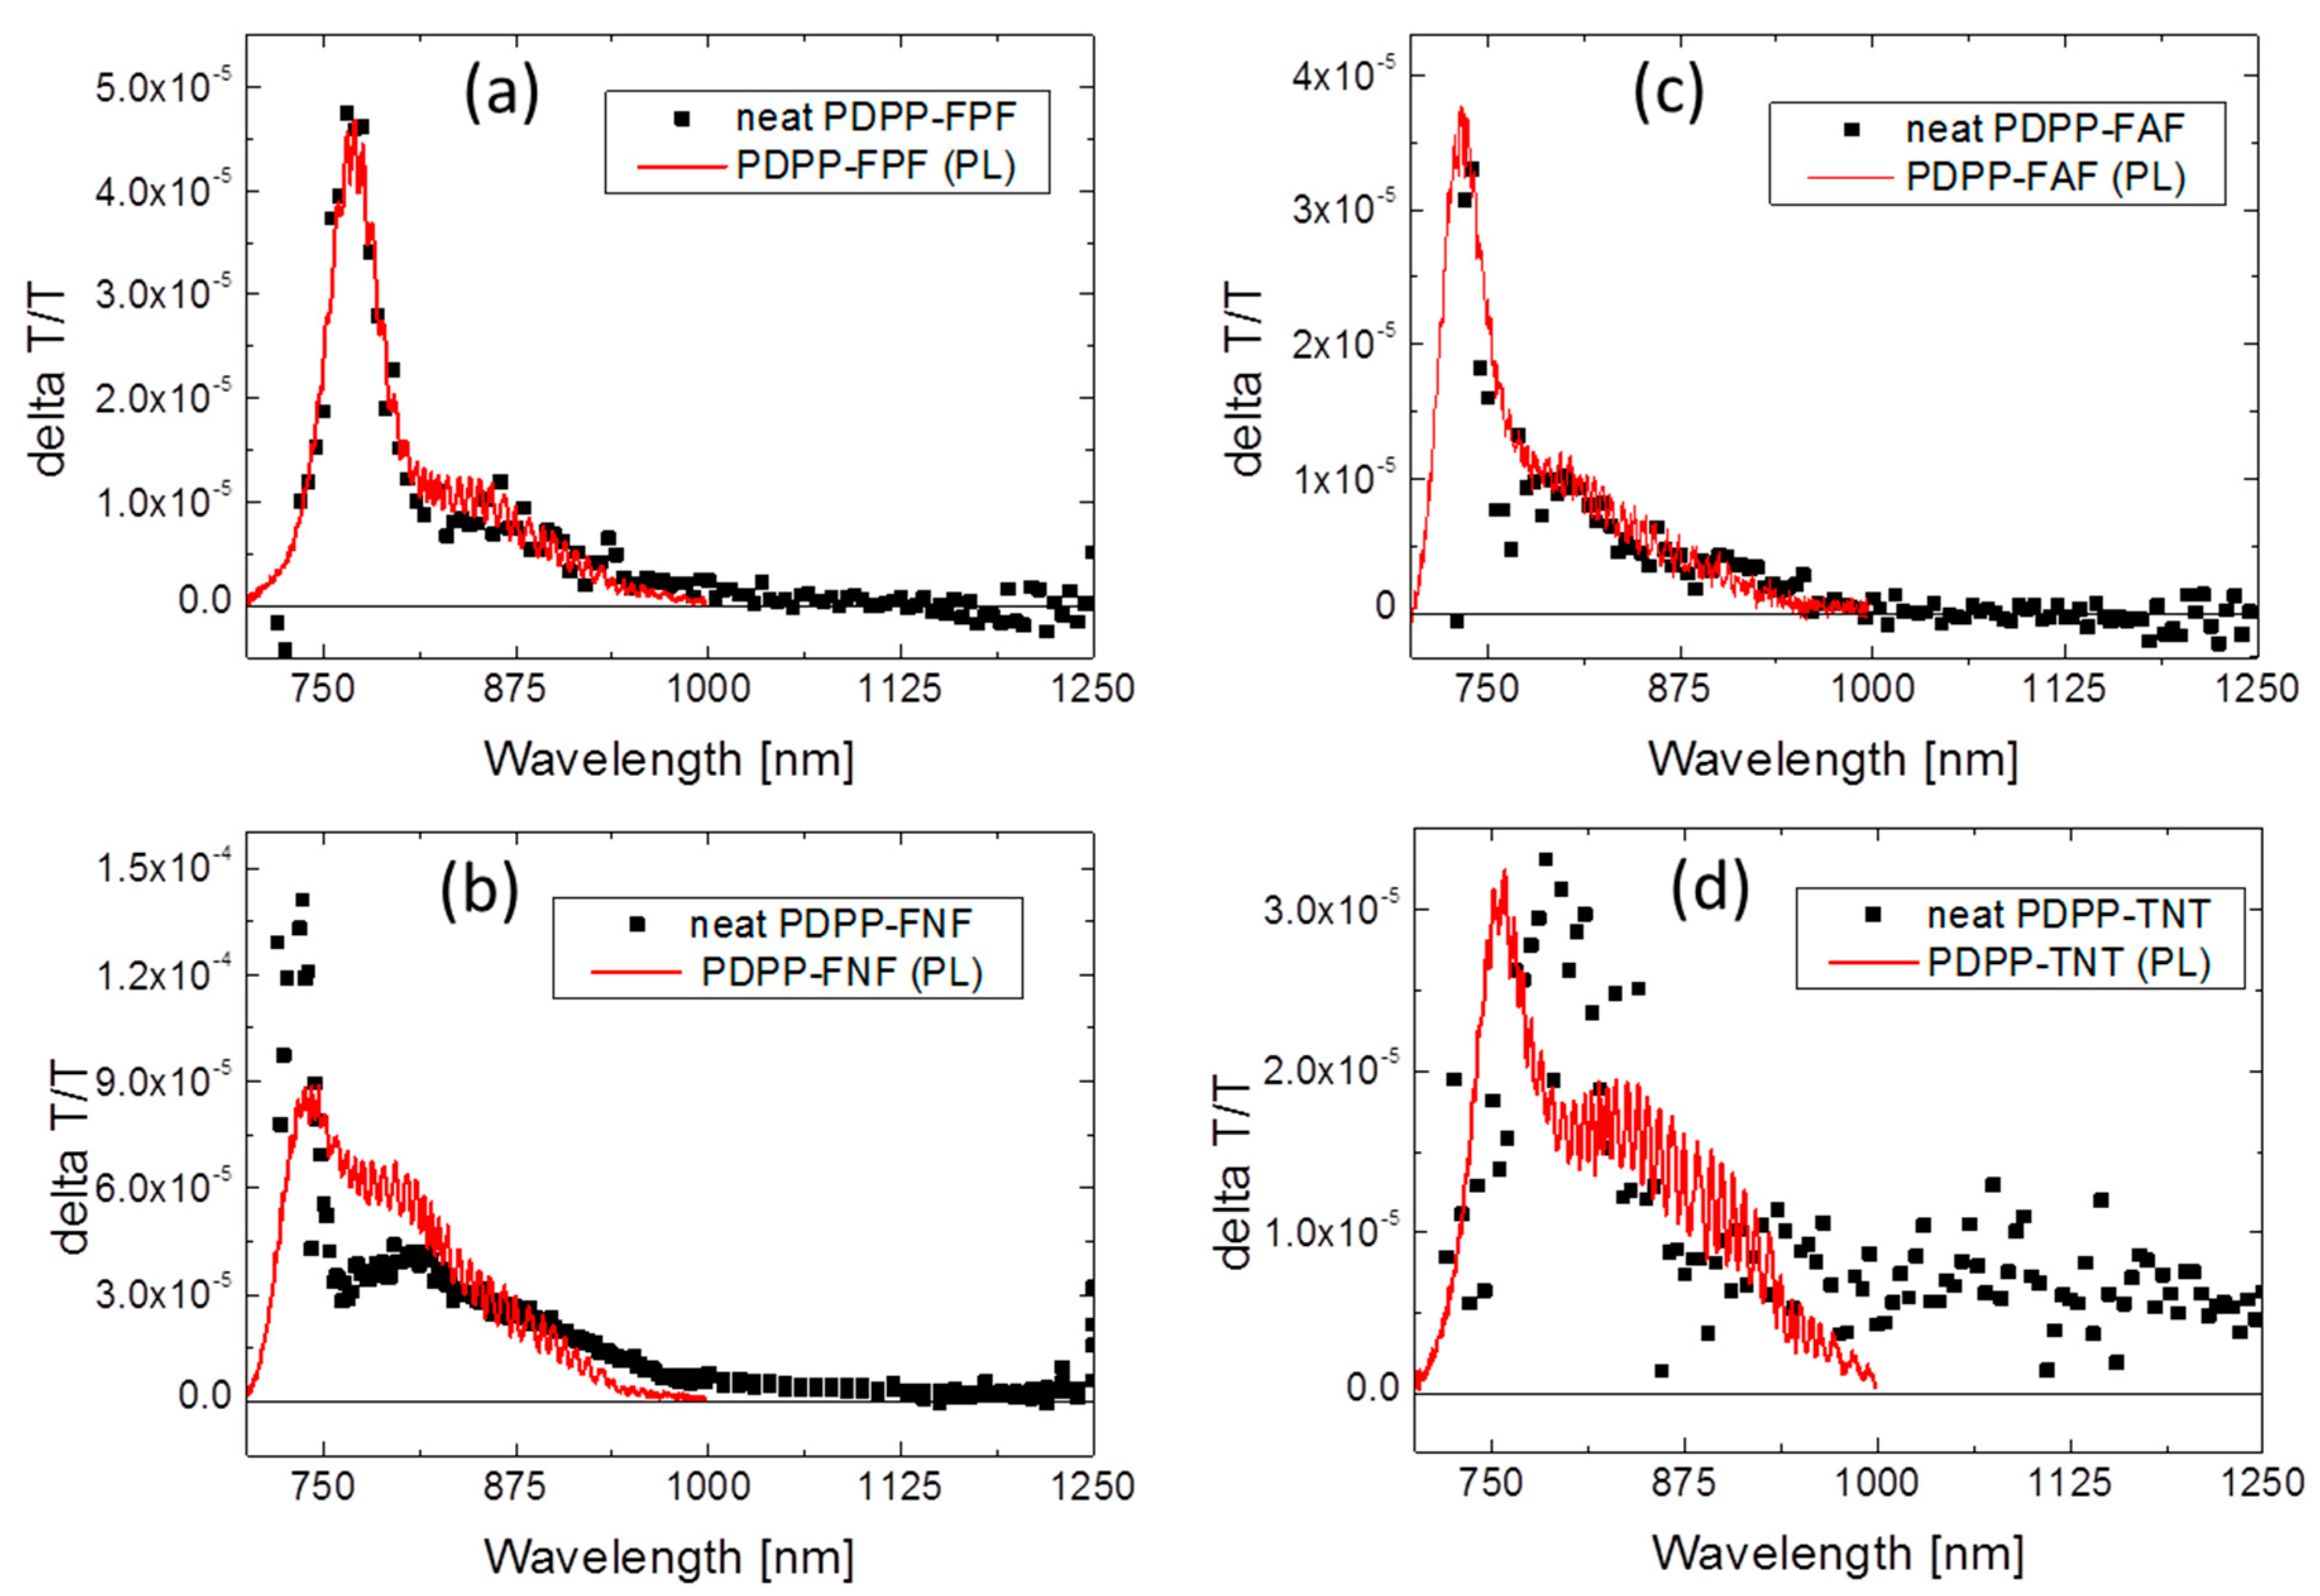
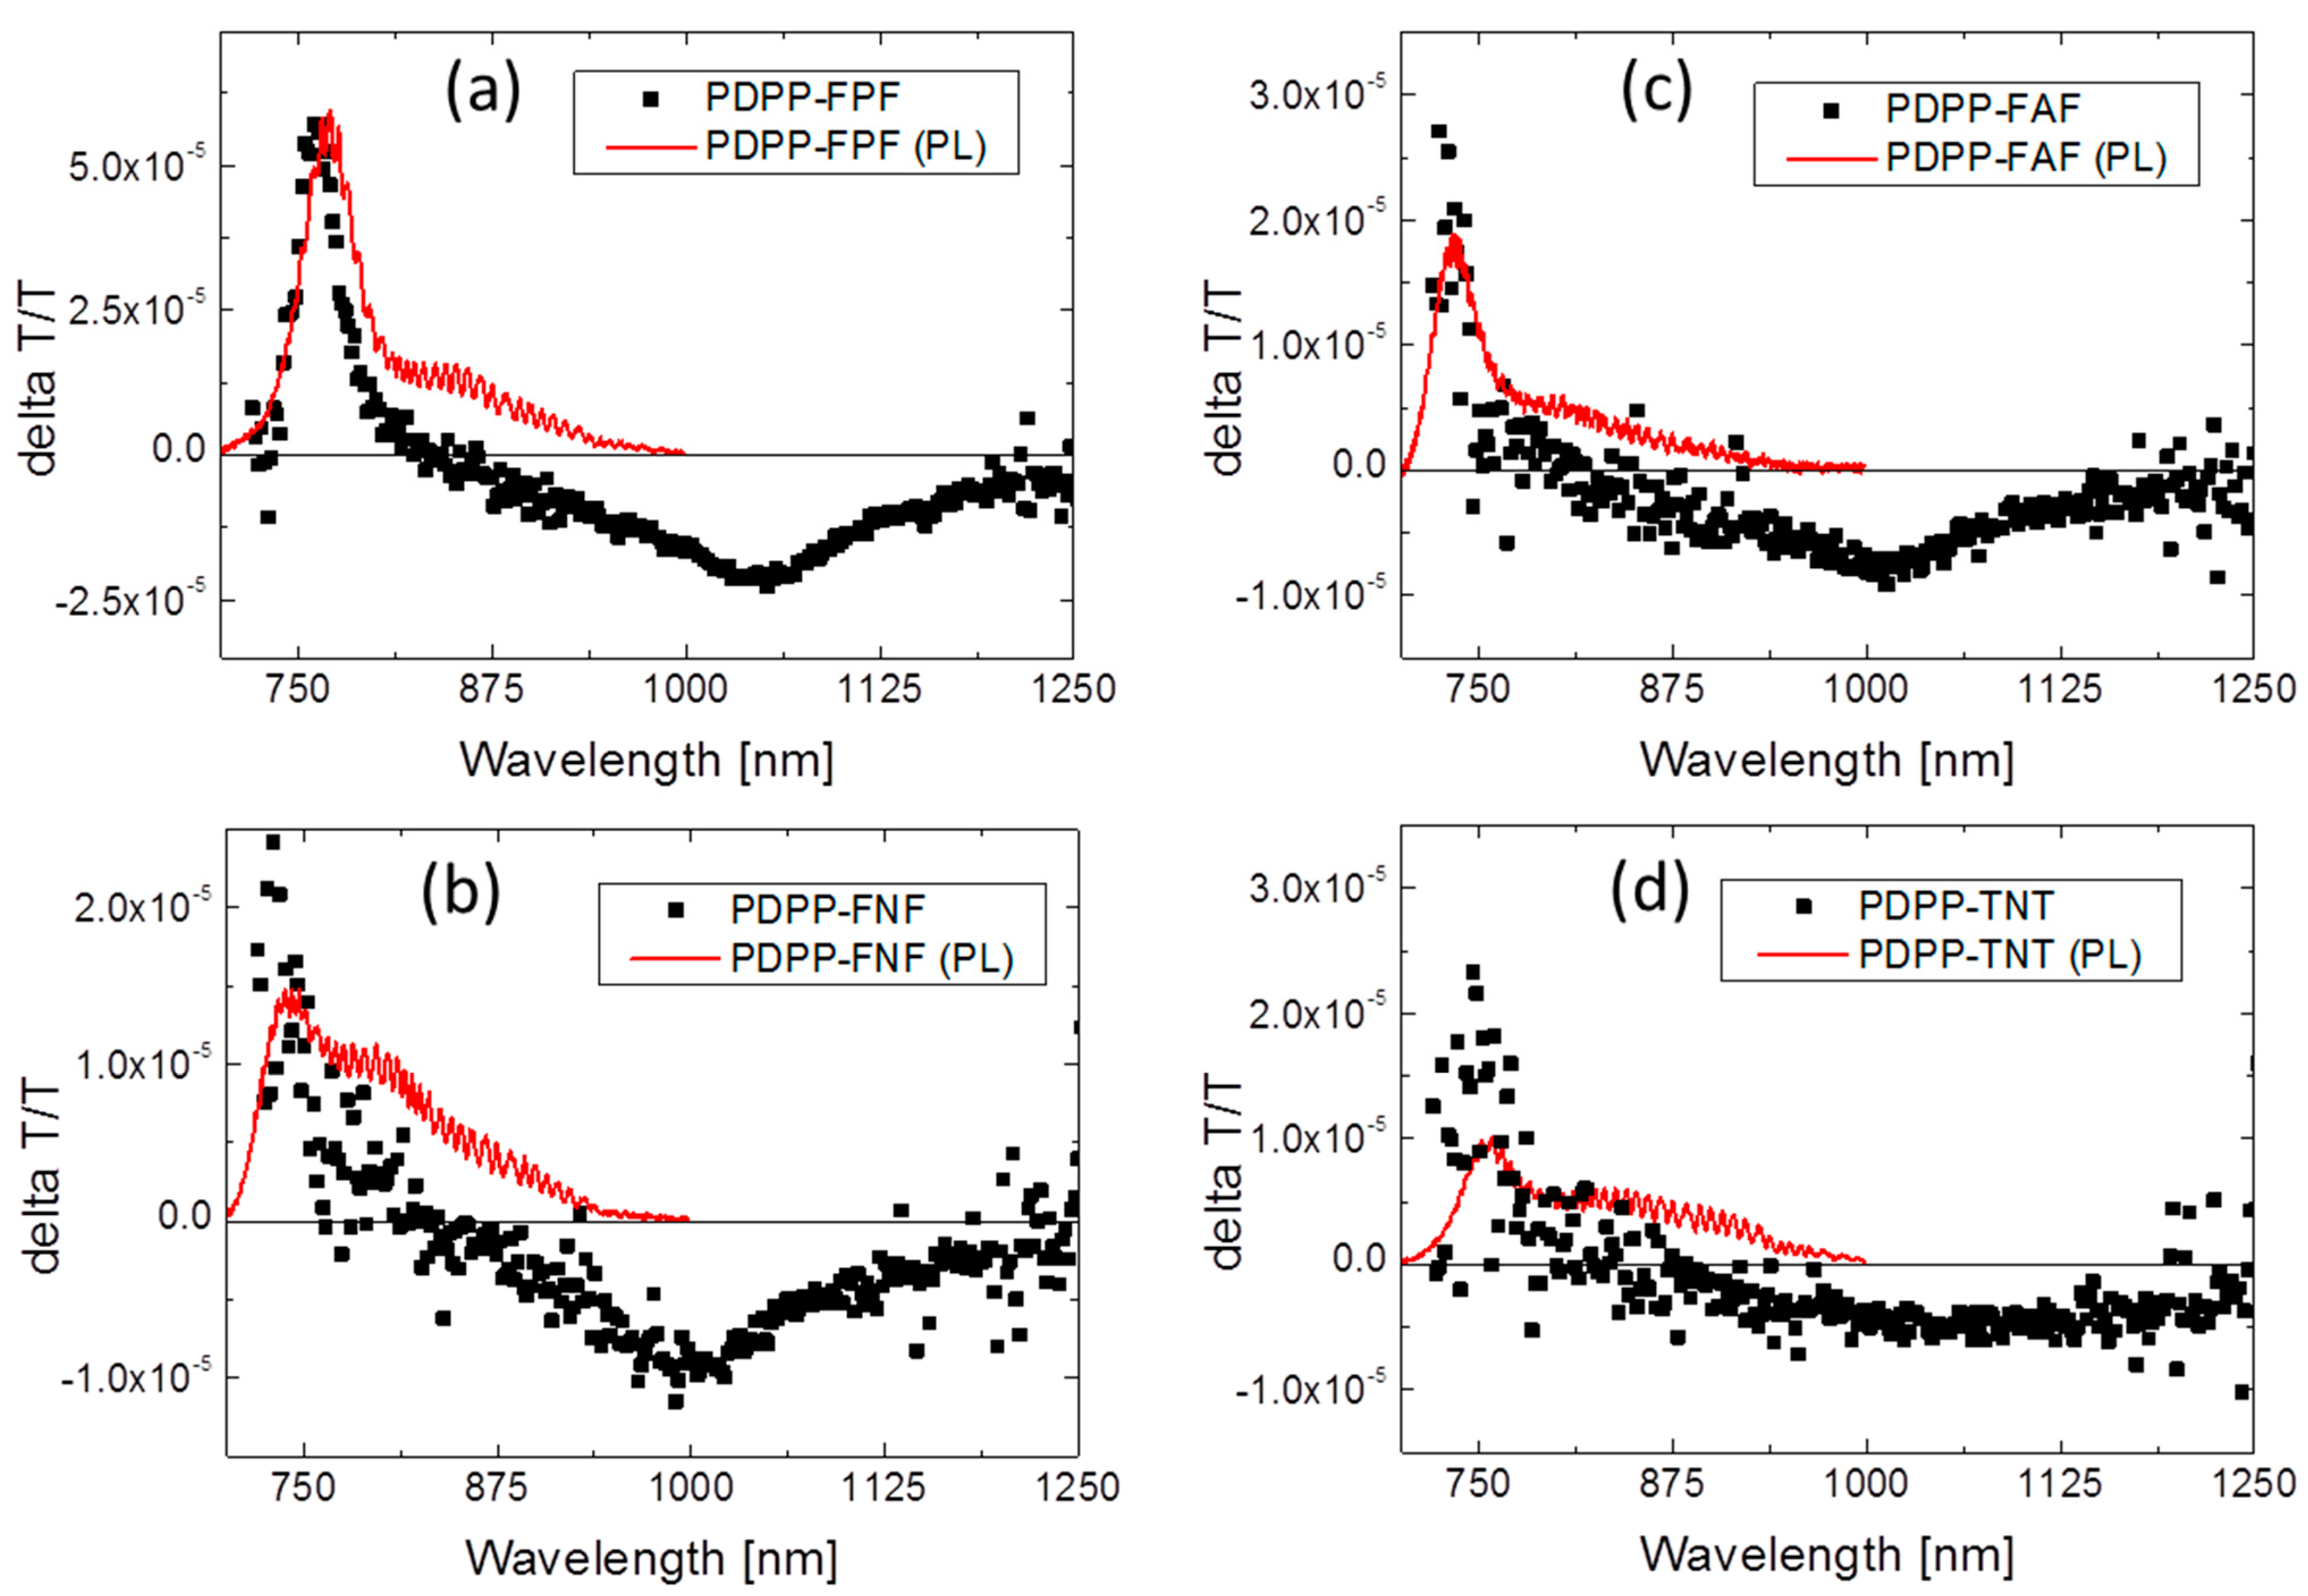
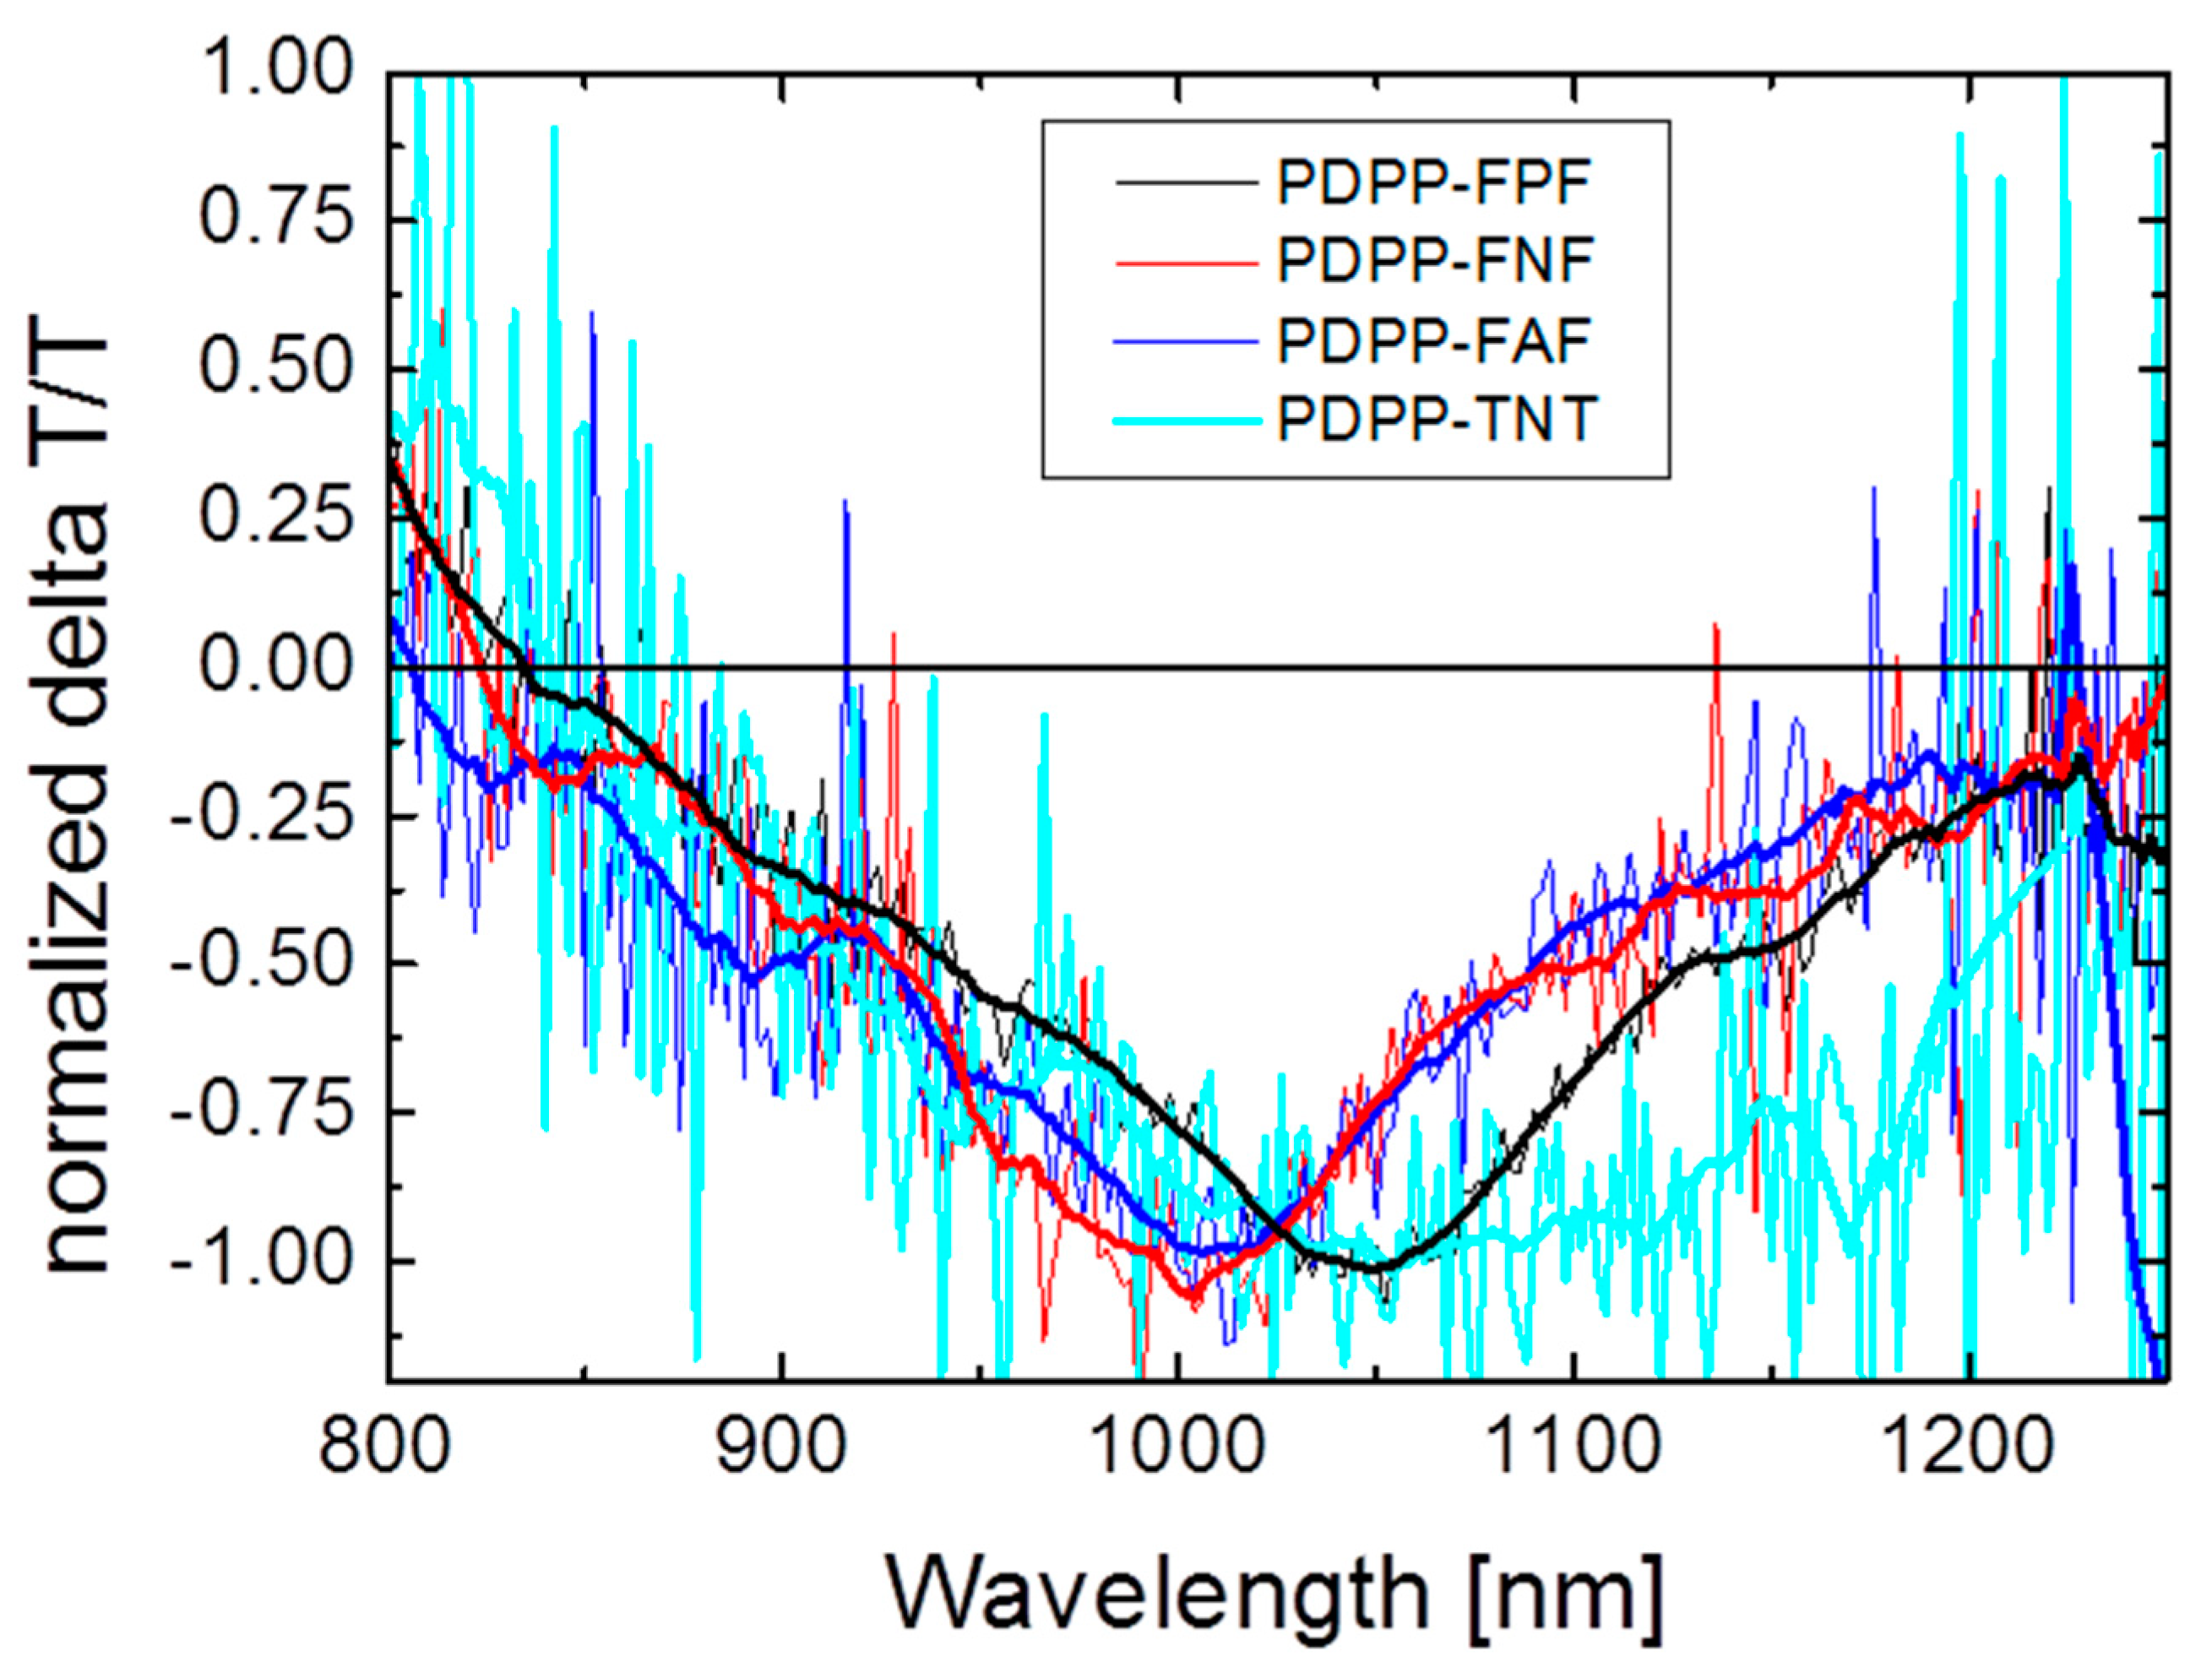
3.5. Photoinduced Absorption Spectroscopy

3.5.1. Neat Polymer Films

Thin film samples of the four studied polymers were prepared for photoinduced absorption (PIA) spectroscopy studies. The samples were excited with a 660 nm high power LED pulsed at 230 Hz. The spectra are shown in Figure 10. The spectra are shown in Figure 10. All the spectra show a relatively strong positive change in transmission (delta T/T) signal with a peak near 750 nm and a tail extending to near 1000 nm. The positive signal is attributed to photoluminescence (PL) and corresponds with measured thin film photoluminescence spectra. The absence of a negative delta T/T signal indicates no new absorption bands related to photogenerated species have been formed. Transient absorption studies involving a series of D–A co-polymers have shown polaron photogeneration yields of up to 24% [33]. The same study measured a polaron yield of ~8% in P3HT; we have measured a delta T/T signal associated with the polarons in P3HT of approximately 5 ppm on our PIA setup [43]. In cases where D–A polymers do show significant photogeneration of polarons, the yield was related to the difference in the electron affinity between the donor and acceptor groups; a larger difference (stronger acceptor) led to a higher yield. The spatial separation of the HOMO and LUMO influenced the lifetime of the polaron pair; more separated HOMO and LUMO allowed for longer lifetimes [33]. For the polymers studied here, it does not appear that the acene group plays the role of a strong donor, and the HOMO and LUMO seem localized in a similar space around the DPP moiety. For these reasons it is perhaps not surprising that a long-lived polaron signal was not detected in during PIA measurement. There may be insignificant driving force to generate polarons, and the polaron lifetime might be expected to be very short.
Figure 10. Photoinduced absorption spectra of neat polymer films. The positive delta T/T signal is in agreement with the measured photoluminescence spectra, thin red line. There is no detected signal corresponding to the generation of polarons (negative delta T/T signal). (a) PDPP-FPF, (b) PDPP-FNF, (c) PDPP-FAF and (d) PDPP-TNT.
Polymers 07 00069 g010

3.5.2. Bulk Heterojunction Films

Thin film bulk heterojunction samples in which each polymer was blended with [70]PCBM were prepared for PIA studies. The samples were excited with a 470 nm high power pulsed LED. A decision was made to use 470 nm excitation light as the PIA signal was stronger than when using 660 nm excitation. While well-optimized OPV (Organic photovoltaics) devices employing PDPP-TNT and [70]PCBM showed a relatively flat incident photon-to-electron conversion efficiency (IPCE) spectrum throughout the absorption range, thinner active layers yielded a larger IPCE (Incident photon-to-electron conversion efficiency) value at shorter wavelengths [32]. Furan-based DPP OPV devices showed larger IPCE values at 470 nm than 660 nm [30]. The PIA spectra are shown in Figure 11.
Figure 11. Photoinduced absorption spectra of bulk heterojunction, polymer: [70]PCM, films. The positive delta T/T signal is in agreement with the measured photoluminescence spectra, thin red line. The negative delta T/T signal provides evidence of exciton dissociation and polaron generation at the polymer/fullerene heterojunction; (a) PDPP-FPF, (b) PDPP-FNF, (c) PDPP-FAF, and (d) PDPP-TNT.
Polymers 07 00069 g011
Again a strong positive delta T/T peak can be seen which corresponds to the polymer PL spectra. In contrast to the PIA spectra of the neat polymer films, a prominent negative delta T/T signal is also observed. The negative delta T/T signal is generally centered around 1000 nm and extends from roughly 800 to 1250 nm. The generation and presence of free charge carriers is expected as the polymer-fullerene interface allows for exciton dissociation. The dissociation process results in a positive polaron residing on the polymer and a negative polaron on the fullerene. The PIA spectra therefore contain contributions from both species. The absorption spectrum of the [6,6]-phenyl C61 butyric acid methyl ester (PCBM) anion has been observed between 800 and 1100 nm, centered near 1000 nm [44]. Several other fullerene derivatives have shown a radical anion absorption peak between 1000 and 1100 nm [45]. Additionally, the shapes of the negative delta T/T spectra are influenced around 800 nm where there is significant overlap between the negative PIA signal and the observed polymer PL spectra.
Figure 12 shows normalized PIA spectra of all the investigated bulk heterojunction blends. The shape and peak location are very similar for the spectra of PDPP-FNF and PDPP-FAF. The peak is shifted to longer wavelengths by roughly 50 nm for the PDPP-FPF spectrum. The peak for the PDPP-TNT spectrum is similar to that for PDPP-FPF and is around 1050 nm.
Figure 12. A comparison of the polaron spectra measured in bulk heterojunction polymer: [70]PCBM films. Absorption by both the hole polaron on the polymer and the electron polaron on the fullerene contribute to the spectra.
Polymers 07 00069 g012

4. Conclusions

We have investigated a series of four DPP-based alternating co-polymers; the comonomer was phenylene, naphthalene, or anthracene. While DPP is known to be a strong acceptor, and often utilized in low bandgap donor-acceptor polymers, the acene groups do not behave as strong donors when paired with DPP. Chemical doping of the polymers in solution with the strong oxidizing agent, SbCl5 generated hole polarons with broad absorption signals between 750 and 1400 nm. The molar absorption coefficients were calculated and ranged between 6 × 10⁶ and 2 × 107 cm2/mol and the polaron cross section ranged between 2 × 10⁻¹⁷ and 9 × 10⁻¹⁷cm. Electrochemical doping was employed to investigate the polaron absorption spectra in thin film samples. All polymers displayed ground state bleaching and the formation of a broad polaron absorption band between 800 and 1600 nm and voltages above 0.6 V. Photoinduced absorption studies did not detect a polaron signal in any neat polymer films; bulk heterojunction films in which the polymer was blended with [70]PCBM did generate free charge carries upon photoexcitation. It is believed that there is insufficient donor-acceptor interaction between the DPP and acene blocks to allow for extensive exciton delocalization and efficient, long-lived charge separation in the neat polymer.

Supplementary Materials

Supplementary materials can be accessed at: https://www.mdpi.com/2073-4360/7/01/69/s1.

Acknowledgments

This work was supported by funding from the Visiting InvestigatorshipProgramme (VIP), project number 0721100037, of the Agency for Science, Technology and Research (A*STAR), Republic of Singapore, and the A*STAR-JST Strategic International Cooperative Programme (1st Joint Grant Call project number 1021630071). The DFT work was supported by the A*STAR Computational Resource Centre through the use of its high performance computing facilities.

Author Contributions

Evan L. Williams conceived of the study and supervised student, Ter Shien Ang. Ter Shien Ang prepared samples and measured UV-Vis spectra and PIA spectra. Zien Ooi constructed the PIA setup and supervised measurements. Prashant Sonar synthesized all polymers. Ting Ting Lin carried out DFT simulations. Wei Teng Neo performed spectoelectrochemistry measurements. Jing Song supervised student Wei Teng Neo. Jonathan Hobley assisted with data analysis.

Conflicts of Interest

The authors declare no conflict of interest.

References

  1. Green, M.A.; Emery, K.; Hishikawa, Y.; Warta, W.; Dunlop, E.D. Solar cell efficiency tables (version 43). Prog. Photovolt. Res. Appl. 2014, 22, 1–9. [Google Scholar] [CrossRef]
  2. Dennler, G.; Scharber, M.C.; Brabec, C.J. Polymer-fullerene bulk-heterojunction solar cells. Adv. Mater. 2009, 21, 1323–1338. [Google Scholar] [CrossRef]
  3. Peet, J.; Wen, L.; Byrne, P.; Rodman, S.; Forberich, K.; Shao, Y.; Drolet, N.; Gaudiana, R.; Dennler, G.; Waller, D. Bulk heterojunction solar cells with thick active layers and high fill factors enabled by a bithiophene-co-thiazolothiazole push-pull copolymer. Appl. Phys. Lett. 2011, 98. [Google Scholar] [CrossRef]
  4. Gregg, B.A. Excitonic solar cells. J. Phys. Chem. B 2003, 107, 4688–4698. [Google Scholar] [CrossRef]
  5. Brabec, C.J.; Zerza, G.; Cerullo, G.; De Silvestri, S.; Luzzati, S.; Hummelen, J.C.; Sariciftci, S. Tracing photoinduced electron transfer process in conjugated polymer/fullerene bulk heterojunctions in real time. Chem. Phys. Lett. 2001, 340, 232–236. [Google Scholar] [CrossRef]
  6. Bredas, J.-L.; Norton, J.E.; Cornil, J.; Coropceanu, V. Molecular understanding of organic solar cells: The challenges. Acc. Chem. Res. 2009, 42, 1691–1699. [Google Scholar] [CrossRef] [PubMed]
  7. Beljonne, D.; Cornil, J.; Muccioli, L.; Zannoni, C.; Brédas, J.L.; Castet, F. Electronic processes at organic−organic interfaces: Insight from modeling and implications for opto-electronic devices. Chem. Mater. 2011, 23, 591–609. [Google Scholar] [CrossRef]
  8. Gelinas, S.; Rao, A.; Kumar, A.; Smith, S.L.; Chin, A.W.; Clark, J.; van der Poll, T.S.; Bazan, G.C.; Friend, R.H. Ultrafast long-range charge separation in organic semiconductor photovoltaic diodes. Science 2014, 343, 512–516. [Google Scholar] [CrossRef] [PubMed]
  9. Grancini, G.; Maiuri, M.; Fazzi, D.; Petrozza, A.; Egelhaaf, H.J.; Brida, D.; Cerullo, G.; Lanzani, G. Hot exciton dissociation in polymer solar cells. Nat. Mater. 2013, 12, 29–33. [Google Scholar] [CrossRef] [PubMed]
  10. Hwang, I.W.; Soci, C.; Moses, D.; Zhu, Z.; Waller, D.; Gaudiana, R.; Brabec, C.J.; Heeger, A.J. Ultrafast electron transfer and decay dynamics in a small band gap bulk heterojunction material. Adv. Mater. 2007, 19, 2307–2312. [Google Scholar] [CrossRef]
  11. Heremans, P.; Cheyns, D.; Rand, B.P. Strategies for increasing the efficiency of heterojunction organic solar cells: Material selection and device architecture. Acc. Chem. Res. 2009, 42, 1740–1747. [Google Scholar] [CrossRef] [PubMed]
  12. Riedel, I.; Dyakonov, V. Influence of electronic transport properties of polymer-fullerene blends on the performance of bulk heterojunction photovoltaic devices. Phys. Status Solidi A 2004, 201, 1332–1341. [Google Scholar] [CrossRef]
  13. Su, Y.W.; Lan, S.C.; Wei, K.H. Organic photovoltaics. Mater. Today 2012, 15, 554–562. [Google Scholar] [CrossRef]
  14. Scharber, M.C.; Mühlbacher, D.; Koppe, M.; Denk, P.; Waldauf, C.; Heeger, A.J.; Brabec, C.J. Design rules for donors in bulk-heterojunction solar cells—Towards 10 % energy-conversion efficiency. Adv. Mater. 2006, 18, 789–794. [Google Scholar] [CrossRef]
  15. Brabec, C.J.; Cravino, A.; Meissner, D.; Sariciftci, N.S.; Fromherz, T.; Rispens, M.T.; Sanchez, L.; Hummelen, J.C. Origin of the open circuit voltage of plastic solar cells. Adv. Funct. Mater. 2001, 11, 374–380. [Google Scholar] [CrossRef]
  16. Chen, H.Y.; Hou, J.; Zhang, S.; Liang, Y.; Yang, G.; Yang, Y.; Yu, L.; Wu, Y.; Li, G. Polymer solar cells with enhanced open-circuit voltage and efficiency. Nat. Photon. 2009, 3, 649–653. [Google Scholar] [CrossRef]
  17. Gadisa, A.; Svensson, M.; Andersson, M.R.; Inganas, O. Correlation between oxidation potential and open-circuit voltage of composite solar cells based on blends of polythiophenes/fullerene derivative. Appl. Phys. Lett. 2004, 84, 1609–1611. [Google Scholar] [CrossRef]
  18. Roncali, J. Molecular engineering of the band gap of π-conjugated systems: Facing technological applications. Macromol. Rapid Commun. 2007, 28, 1761–1775. [Google Scholar] [CrossRef]
  19. Bérubé, N.; Gaudreau, J.; Côté, M. Low band gap polymers design approach based on a mix of aromatic and quinoid structures. Macromolecules 2013, 46, 6873–6880. [Google Scholar] [CrossRef]
  20. Pandey, L.; Risko, C.; Norton, J.E.; Brédas, J.L. Donor–acceptor copolymers of relevance for organic photovoltaics: A theoretical investigation of the impact of chemical structure modifications on the electronic and optical properties. Macromolecules 2012, 45, 6405–6414. [Google Scholar] [CrossRef]
  21. Havinga, E.E.; Tenhoeve, W.; Wynberg, H. A new class of small band-gap organic polymer conductors. Polym. Bull. 1992, 29, 119–126. [Google Scholar] [CrossRef]
  22. Park, S.H.; Roy, A.; Beaupré, S.; Cho, S.; Coates, N.; Moon, J.S.; Moses, D.; Leclerc, M.; Lee, K.; Heeger, A.J. Bulk heterojunction solar cells with internal quantum efficiency approaching 100%. Nat. Photon. 2009, 3, 297–302. [Google Scholar] [CrossRef]
  23. Li, W.; Hendriks, K.H.; Furlan, A.; Roelofs, W.S.C.; Wienk, M.M.; Janssen, R.A.J. Universal correlation between fibril width and quantum efficiency in diketopyrrolopyrrole-based polymer solar cells. J. Am. Chem. Soc. 2013, 135, 18942–18948. [Google Scholar] [CrossRef] [PubMed]
  24. Wienk, M.M.; Turbiez, M.; Gilot, J.; Janssen, R.A.J. Narrow-bandgap diketo-pyrrolo-pyrrole polymer solar cells: The effect of processing on the performance. Adv. Mater. 2008, 20, 2556–2560. [Google Scholar] [CrossRef]
  25. Tamayo, A.B.; Walker, B.; Nguyen, T.Q. A low band gap, solution processable oligothiophene with a diketopyrrolopyrrole core for use in organic solar cells. J. Phys. Chem. C 2008, 112, 11545–11551. [Google Scholar] [CrossRef]
  26. Chen, G.Y.; Chiang, C.M.; Kekuda, D.; Lan, S.C.; Chu, C.W.; Wei, K.H. Synthesis and characterization of a narrow-bandgap polymer containing alternating cyclopentadithiophene and diketo-pyrrolo-pyrrole units for solar cell applications. J. Polym. Sci. A Polym. Chem. 2010, 48, 1669–1675. [Google Scholar] [CrossRef]
  27. Biniek, L.; Schroeder, B.C.; Nielsen, C.B.; McCulloch, I. Recent advances in high mobility donor–acceptor semiconducting polymers. J. Mater. Chem. 2012, 22, 14803–14813. [Google Scholar] [CrossRef]
  28. Zhang, X.; Richter, L.J.; DeLongchamp, D.M.; Kline, R.J.; Hammond, M.R.; McCulloch, I.; Heeney, M.; Ashraf, R.S.; Smith, J.N.; Anthopoulos, T.D.; et al. Molecular packing of high-mobility diketo pyrrolo-pyrrole polymer semiconductors with branched alkyl side chains. J. Am. Chem. Soc. 2011, 133, 15073–15084. [Google Scholar] [CrossRef] [PubMed]
  29. Li, Y.; Sonar, P.; Murphy, L.; Hong, W. High mobility diketopyrrolopyrrole (dpp)-based organic semiconductor materials for organic thin film transistors and photovoltaics. Energy Environ. Sci. 2013, 6, 1684–1710. [Google Scholar] [CrossRef]
  30. Sonar, P.; Singh, S.P.; Williams, E.L.; Li, Y.; Soh, M.S.; Dodabalapur, A. Furan containing diketopyrrolopyrrole copolymers: Synthesis, characterization, organic field effect transistor performance and photovoltaic properties. J. Mater. Chem. 2012, 22, 4425–4435. [Google Scholar] [CrossRef]
  31. Sonar, P.; Singh, S.P.; Li, Y.; Ooi, Z.E.; Ha, T.J.; Wong, I.; Soh, M.S.; Dodabalapur, A. High mobility organic thin film transistor and efficient photovoltaic devices using versatile donor–acceptor polymer semiconductor by molecular design. Energy Environ. Sci. 2011, 4, 2288–2296. [Google Scholar] [CrossRef]
  32. Williams, E.L.; Gorelik, S.; Phang, I.; Bosman, M.; Vijila, C.; Subramanian, G.S.; Sonar, P.; Hobley, J.; Singh, S.P.; Matsuzaki, H.; et al. Nanoscale phase domain structure and associated device performance of organic solar cells based on a diketopyrrolopyrrole polymer. RSC Adv. 2013, 3, 20113–20124. [Google Scholar] [CrossRef]
  33. Tautz, R.; da Como, E.; Limmer, T.; Feldmann, J.; Egelhaaf, H.J.; von Hauff, E.; Lemaur, V.; Beljonne, D.; Yilmaz, S.; Dumsch, I.; et al. Structural correlations in the generation of polaron pairs in low-bandgap polymers for photovoltaics. Nat. Commun. 2012, 3. [Google Scholar] [CrossRef]
  34. Guo, J.; Liang, Y.; Xiao, S.; Szarko, J.M.; Sprung, M.; Mukhopadhyay, M.K.; Wang, J.; Yu, L.; Chen, L.X. Structure and dynamics correlations of photoinduced charge separation in rigid conjugated linear donor–acceptor dyads towards photovoltaic applications. New J. Chem. 2009, 33, 1497–1507. [Google Scholar] [CrossRef]
  35. Deussen, M.; Bassler, H. Anion and cation absorption-spectra of conjugated oligomers and polymers. Chem. Phys. 1992, 164, 247–257. [Google Scholar] [CrossRef]
  36. Çelikbilek, Ö.; İçli-Özkut, M.; Algi, F.; Önal, A.M.; Cihaner, A. Donor–acceptor polymer electrochromes with cyan color: Effect of alkyl chain length on doping processes. Org. Electron. 2012, 13, 206–213. [Google Scholar] [CrossRef]
  37. Comoretto, D.; Moggio, I.; Cuniberti, C.; Musso, G.F.; Dellepiane, G.; Borghesi, A.; Kajzar, F.; Lorin, A. Long-lived photoexcited states in polydiacetylenes: The photoinduceda-absorption spectra of PDA-4BCMU. Phys. Rev. B 1998, 57, 7071–7078. [Google Scholar] [CrossRef]
  38. Roncali, J. Synthetic principles for bandgap control in linear pi-conjugated systems. Chem. Rev. 1997, 97, 173–205. [Google Scholar] [CrossRef] [PubMed]
  39. Berson, S.; de Bettignies, R.; Bailly, S.; Guillerez, S. Poly(3-hexylthiophene) fibers for photovoltaic applications. Adv. Funct. Mater. 2007, 17, 1377–1384. [Google Scholar] [CrossRef]
  40. Peng, Q.; Park, K.; Lin, T.; Durstock, M.; Dai, L. Donor–π–acceptor conjugated copolymers for photovoltaic applications: Tuning the open-circuit voltage by adjusting the donor/acceptor ratio. J. Phys. Chem. B 2008, 112, 2801–2808. [Google Scholar] [CrossRef] [PubMed]
  41. Atkins, P.W. Physical Chemistry; Oxford University Press: Oxford, UK, 1998. [Google Scholar]
  42. Berlman, I.B. Handbook of Fluorescence Spectra of Aromatic Molecules; Academic Press: New York, NY, USA, 1971. [Google Scholar]
  43. Goh, W.P.; Ooi, Z.E.; Williams, E.L.; Yang, R.B.; Koh, W.S.; Mhaisalkar, S.; Institute of Materials Research and Engineering, 3 Research Link, Singapore. Unpublished work. 2014.
  44. Ohkita, H.; Ito, S. Transient absorption spectroscopy of polymer-based thin-film solar cells. Polymer 2011, 52, 4397–4417. [Google Scholar] [CrossRef]
  45. Guldi, D.M.; Prato, M. Excited-state properties of C-60 fullerene derivatives. Acc. Chem. Res. 2000, 33, 695–703. [Google Scholar] [CrossRef] [PubMed]

