Article

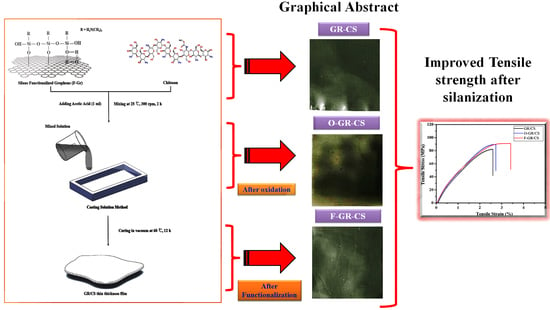
Study on the Effect of Silanization and Improvement in the Tensile Behavior of Graphene-Chitosan-Composite

1
Department of Mechanical Engineering, College of Engineering, Kyung Hee University, Yongin 446-701, Korea
2
Department of Chemistry, Inha University, Incheon 402-751, Korea
*
Author to whom correspondence should be addressed.
Polymers 2015, 7(3), 527-551; https://doi.org/10.3390/polym7030527
Submission received: 14 November 2014 / Revised: 23 February 2015 / Accepted: 5 March 2015 / Published: 13 March 2015
(This article belongs to the Collection Polysaccharides)

Abstract

:
In the present study, silane-functionalized graphene (f-graphene)-reinforced chitosan nanocomposite films exhibiting enhanced mechanical properties have been prepared by the solution casting method. These nanocomposite films were characterized by X-ray diffraction, Raman spectroscopy and thermogravimetric analysis. In order to investigate the effect of silane functionalization, tensile tests were performed on original, oxidized and silane-functionalized graphene-reinforced chitosan nanocomposite films. Tensile results show that silane functionalization groups offer a substantial increase in the interfacial adhesion between filler and host matrix. This result is also confirmed by the surface morphology of the fracture surface in scanning electron microscope analysis. Qualitative analysis using Raman and Fourier transform infrared spectroscopy revealed the existence of Si–O–Si and Si–O–C bonds in the silanized composite. Thermal analysis of the samples shows that the material is stable up till 250 °C and maintains its thermal stability all throughout the process until it starts degrading after 510 °C. Atomic force microscopy reveals that the material is well exfoliated after the oxidation of graphene and also displays the existence of 3–6 layers of exfoliated graphene sheets. X-ray photoelectron spectroscopy studies also reveal the existence of silicon in the single state and quantify the sample to be approximately around 4% (±0.5%) of the total atomic weight.

Graphical Abstract

1. Introduction

Petrochemical-based polymers are used in many applications in industrial fields due to their various advantages [1,2,3]. However, when they are disposed of after long-term use, there can be serious environmental problems due to their non-biodegradable, toxic effects and activity. Therefore, many studies have been carried out to develop an ecofriendly, natural polymer, which is highly biodegradable and possesses nontoxic characteristics [4,5,6]. As part of the present study, the existing petrochemical polymers should be replaceable in the near future by the use of natural polymers, such as starch, cellulose and chitosan, which show promising results based on their chemical reactivity, stability, degradability, zero toxicity and ecofriendly qualities, which in the future, may provide a potential solution and applications for various petro-chemical and biomedical industries. Henceforth, based on the above properties, biopolymers in the near future may act as replacements for toxic petro-polymers.
Chitosan is a linear polysaccharide composed of randomly-distributed β-(1-4)-linked d-glucosamine and N-acetyl-d-glucosamine units. It is obtained from chitin, the second most abundant natural polymer on Earth [7]. Since its discovery, it has been investigated extensively over several decades for its use and application in separation membranes, coating materials, hemostatic agents, water treatment and others. It possesses a number of interesting properties, including biocompatibility, biodegradability and solubility in aqueous media [8,9,10,11]. In recent years, chitosan has been considered an ideal candidate for use as a matrix material for solid ion-conducting composites [12]. In addition, this natural polymer is one of the most environmentally-compatible, biodegradable material available, which also helps in mitigating several environmental problems. However, its mechanical and electrical properties are inferior to those of commercial polymers, and it requires mixing with reinforcing materials to enhance its material properties. For these reasons, several recent studies have been reported by researchers for effectively improving the physical and mechanical properties of chitosan by using a blend of organic-inorganic composites through the incorporation of fillers, such as clays, hydroxyapatite and metal nanoparticles [13,14,15,16,17,18].
On the other hand, carbon nanotubes (CNTs) are considered to be an ideal reinforcing agent for polymer matrices, because of their unique structure and properties [19,20,21]. However, a portion of the metal catalyst used during the CNT fabrication process may be included within the nanotubes. As a result, the residual metal catalyst in the nanotubes makes it difficult to improve the properties of the composite and its behavior as an effective natural filler or as a resourceful bio-compatible material used for various biomedical applications [22,23,24,25]. On the contrary, a metal-free material, such as graphene, is considered a promising reinforcing candidate for the fabrication of polymer composites.
Graphene, a single layer of carbon atoms in a closely-packed honeycomb, two-dimensional lattice, has the potential to be a resourceful filler to improve the physical and mechanical properties of the polymer matrices [26,27,28,29,30,31,32,33]. In addition, graphene has shown better performance as a reinforcing material than carbon nanotubes due to its characteristic layer structure and good dispersion within the polymer matrices compared to carbon nanotubes. However, graphene has two major problems as a reinforcing material within the polymer matrices. The first problem is the dispersion of graphene within the polymer matrices. The second is the poor interfacial adhesion between graphene and the matrices. Recently, several studies have been made to overcome these problems. For example, Lee et al. [34] proposed a physical method, which is a cryogenic milling process of graphene powder, as a preferred method for enhancing the dispersion in polymer matrices. This result shows that the cryogenic milling process is an effective way to increase the dispersion of graphene in polymer matrices. In spite of this, the long runs of the cryogenic milling process cause the destruction of the graphitic structures of graphene. Moreover, cryogenic milling does not provide nor improve any interfacial reactivity between the graphene and polymer matrices. For these reasons, the use of chemical reduction or oxidation processes, like Hummer’s method [35], is employed for not only increasing the surface interfacial reactivity, but also helping in the isolation of nanoscale layers of graphene without damaging it. Kathi and Rhee [36] and Ma et al. [37] proposed several advantages of the silanization of carbon nanotubes. The functionalization of carbon nanotubes using organo-silane is an effective way to increase the interfacial reactivity between carbon nanotubes and polymer matrices without any damage. Consequently, we consider applying a similar approach of silane functionalization for graphene that is expected to enhance the interfacial reactivity between graphene and the host matrix.
Henceforth, in the present study, we used 3-aminopropyltriethoxysilane (3-APTES) as a silane coupling agent to functionalize graphene. The main objective was to investigate the effect of the silane functionalization of graphene on the tensile behavior of graphene-chitosan nanocomposite films. In order to confirm the effect of the silane functionalization of graphene, we compared the mechanical behavior and fracture surface morphology of graphene/chitosan nanocomposite films by using a universal testing machine (UTM) and scanning electron microscopy (SEM), respectively.

2. Experimental Section

2.1. Reagents

Raw commercial graphene powder (Grade AO-3) was used in this study, which was purchased from Graphene Supermarket (Calverton, NY, USA) and was synthesized using a catalytic chemical vapor deposition (CVD) process. The plates have an average thickness of 12 nm and a purity above 99%. Chitosan (average molecular weight = 350,000 g·mol−1, degree of de-acetylation 75%–85% and viscosity > 20 cp, 1 wt% in 1% acetic acid at 20 °C) was purchased from Sigma-Aldrich (Yongin-si, Korea). 3-aminopropyltriethoxysilane (3-APTES) with 99% purity (Sigma-Aldrich) was used as the silane functionalization agent. The chemical oxidation of the graphene was done by using reagents, like nitric acid, sulfuric acid and distilled water. Acetic acid was used to dissolve chitosan in distilled water.

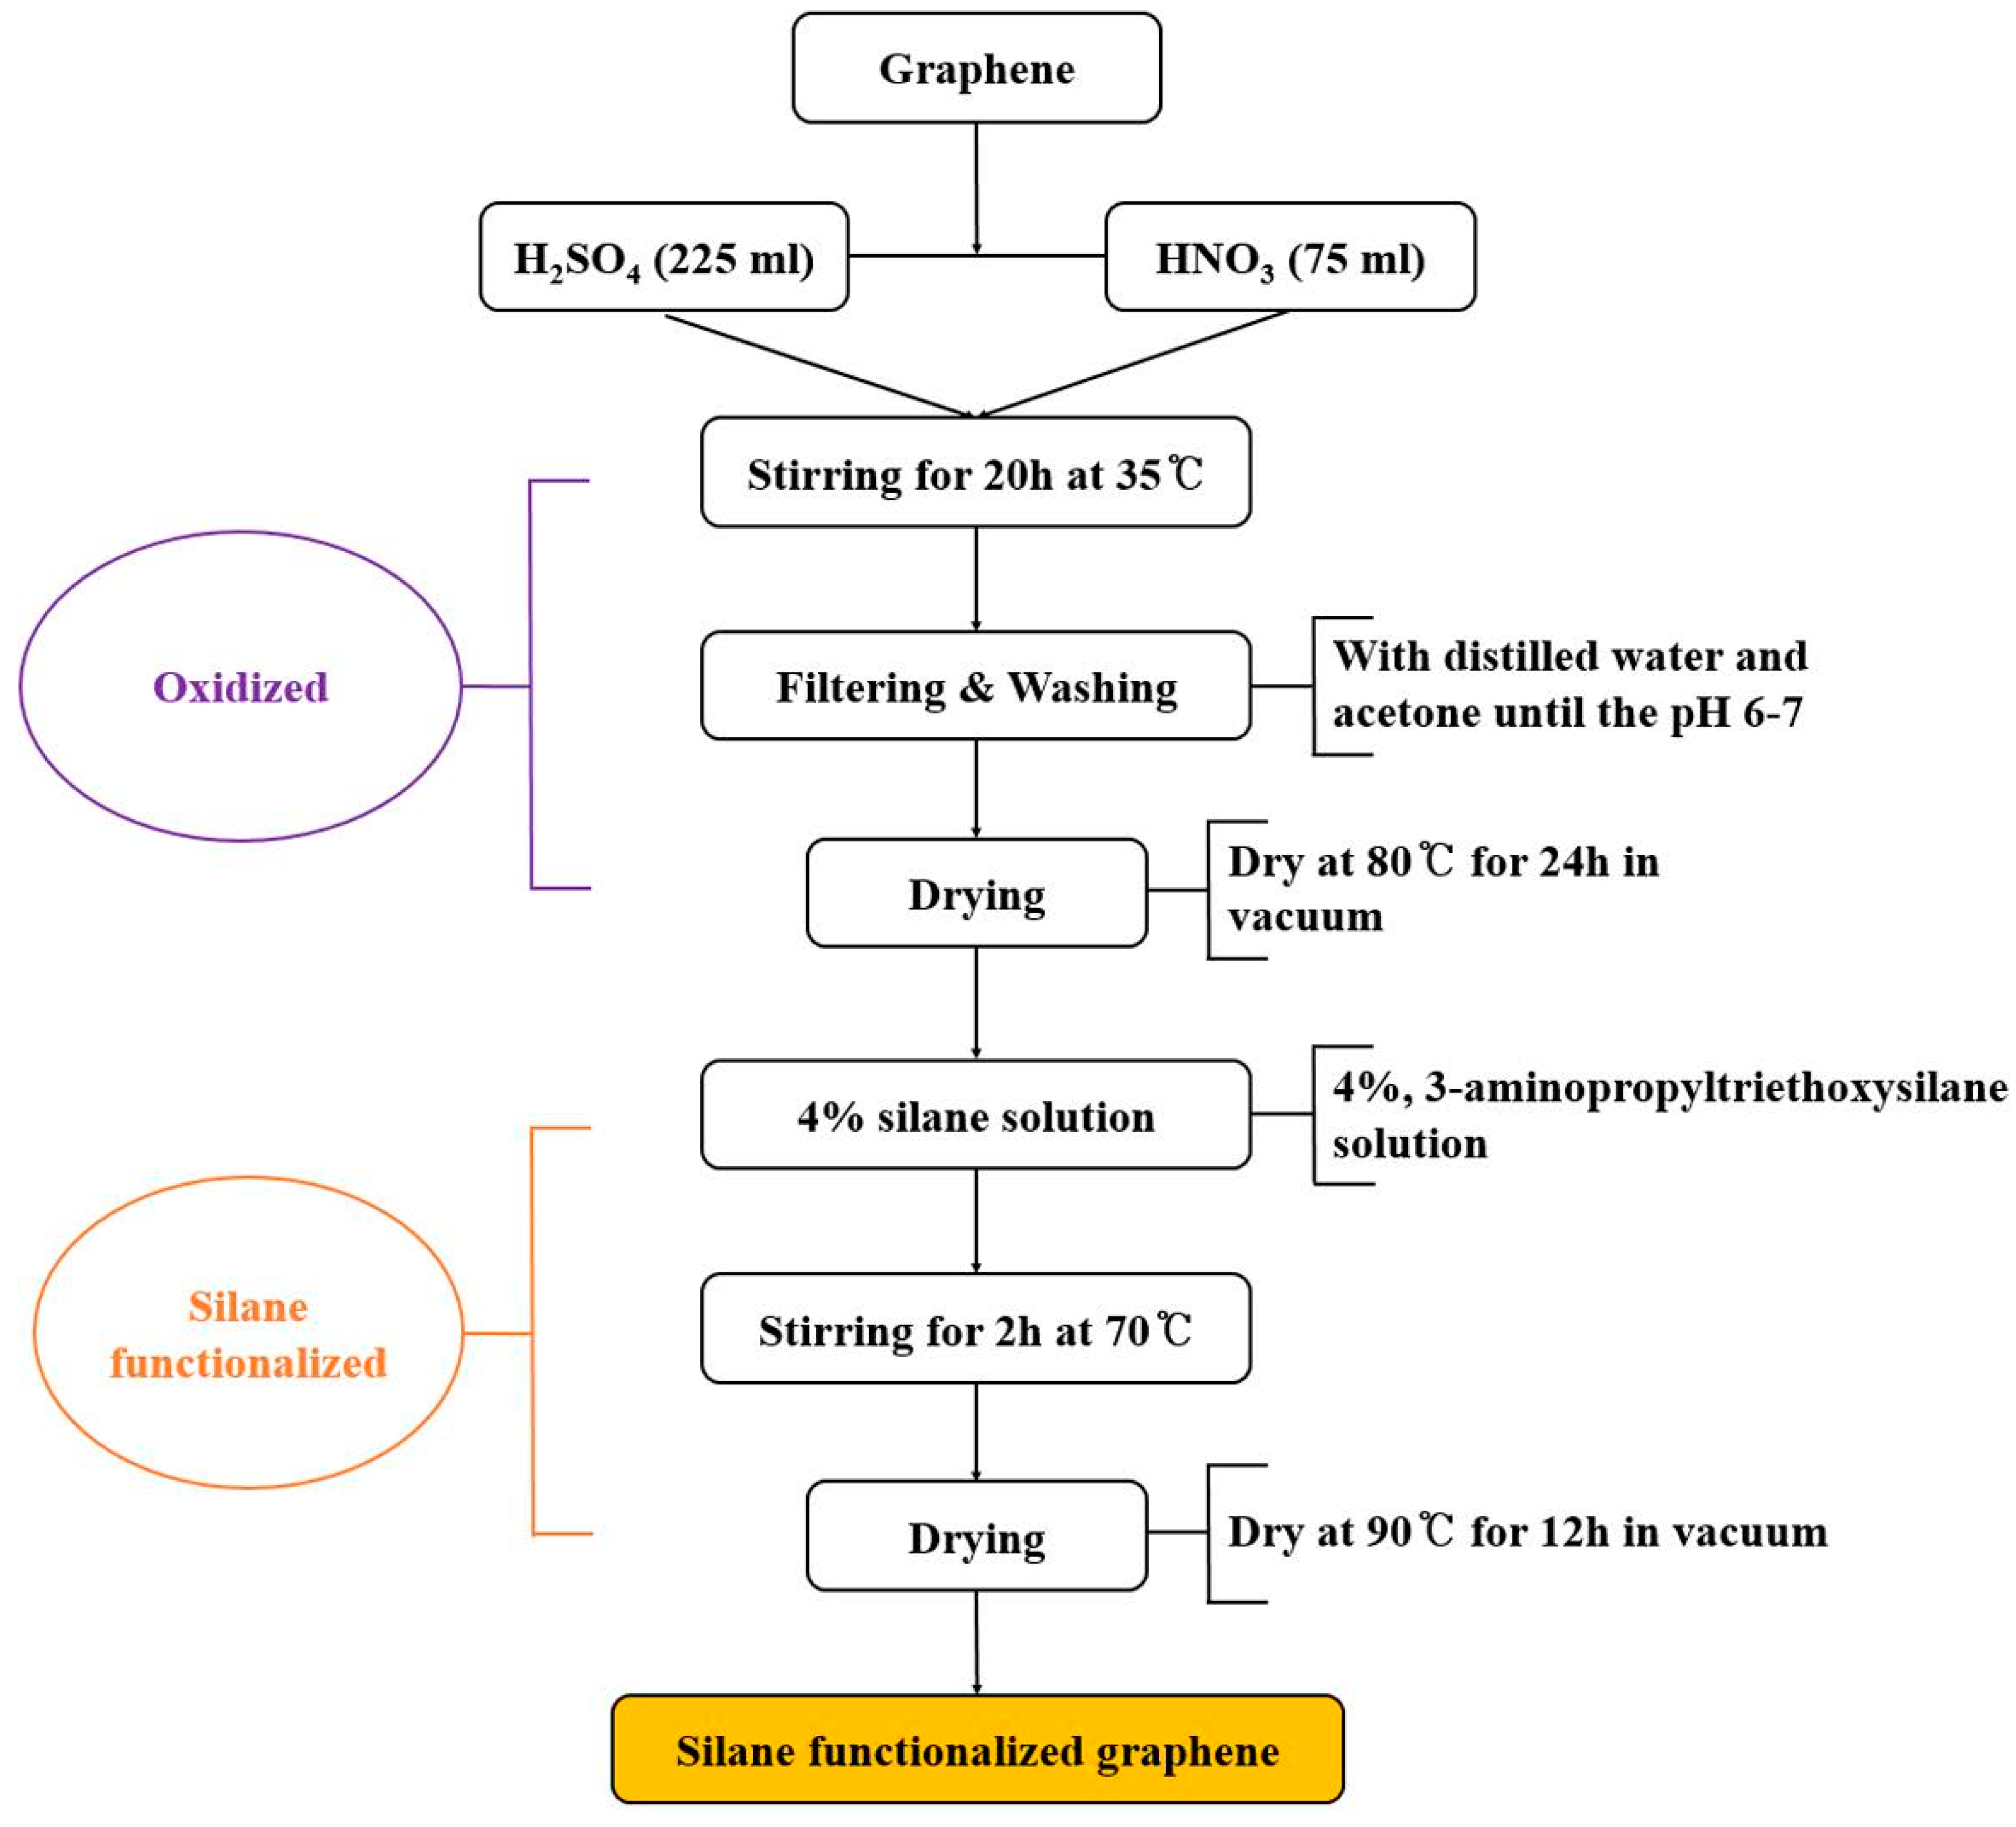
2.2. Oxidation of Graphene

Three grams of graphene were dispersed in the mixture of 225 mL of sulfuric acid and 75 mL of nitric acid in a 50-mL beaker. The mixture was stirred for twelve hours at 35 °C and sonicated for 1 h. The mixture was then washed with distilled water and acetone until the pH reached 6–7. After washing, the resultant mixture was filtered through a 0.2-μm cellulose acetate filter paper. This resulted in the formation of oxidized graphene (o-graphene), which was then dried at 80 °C overnight in an oven.

2.3. Silanization of Graphene with 3-Aminopropyltriethoxysilane (3-APTES)

One gram of the o-graphene was dispersed in a 4% silane solution consisting of 3-APTES in distilled water, which was then added to 300 mL of an ethanol:water (95:5 vol/vol) solution. The mixture was continuously stirred at 70 °C for 2 h. The resulting functionalized graphene (f-graphene) was obtained by filtration using distilled water and acetone followed by drying at 90 °C for 12 h. A corresponding flow chart depicts the stepwise synthesis of the silane-functionalized graphene in Figure 1.
Figure 1. Process flow chart of silane functionalization.
Polymers 07 00527 g001

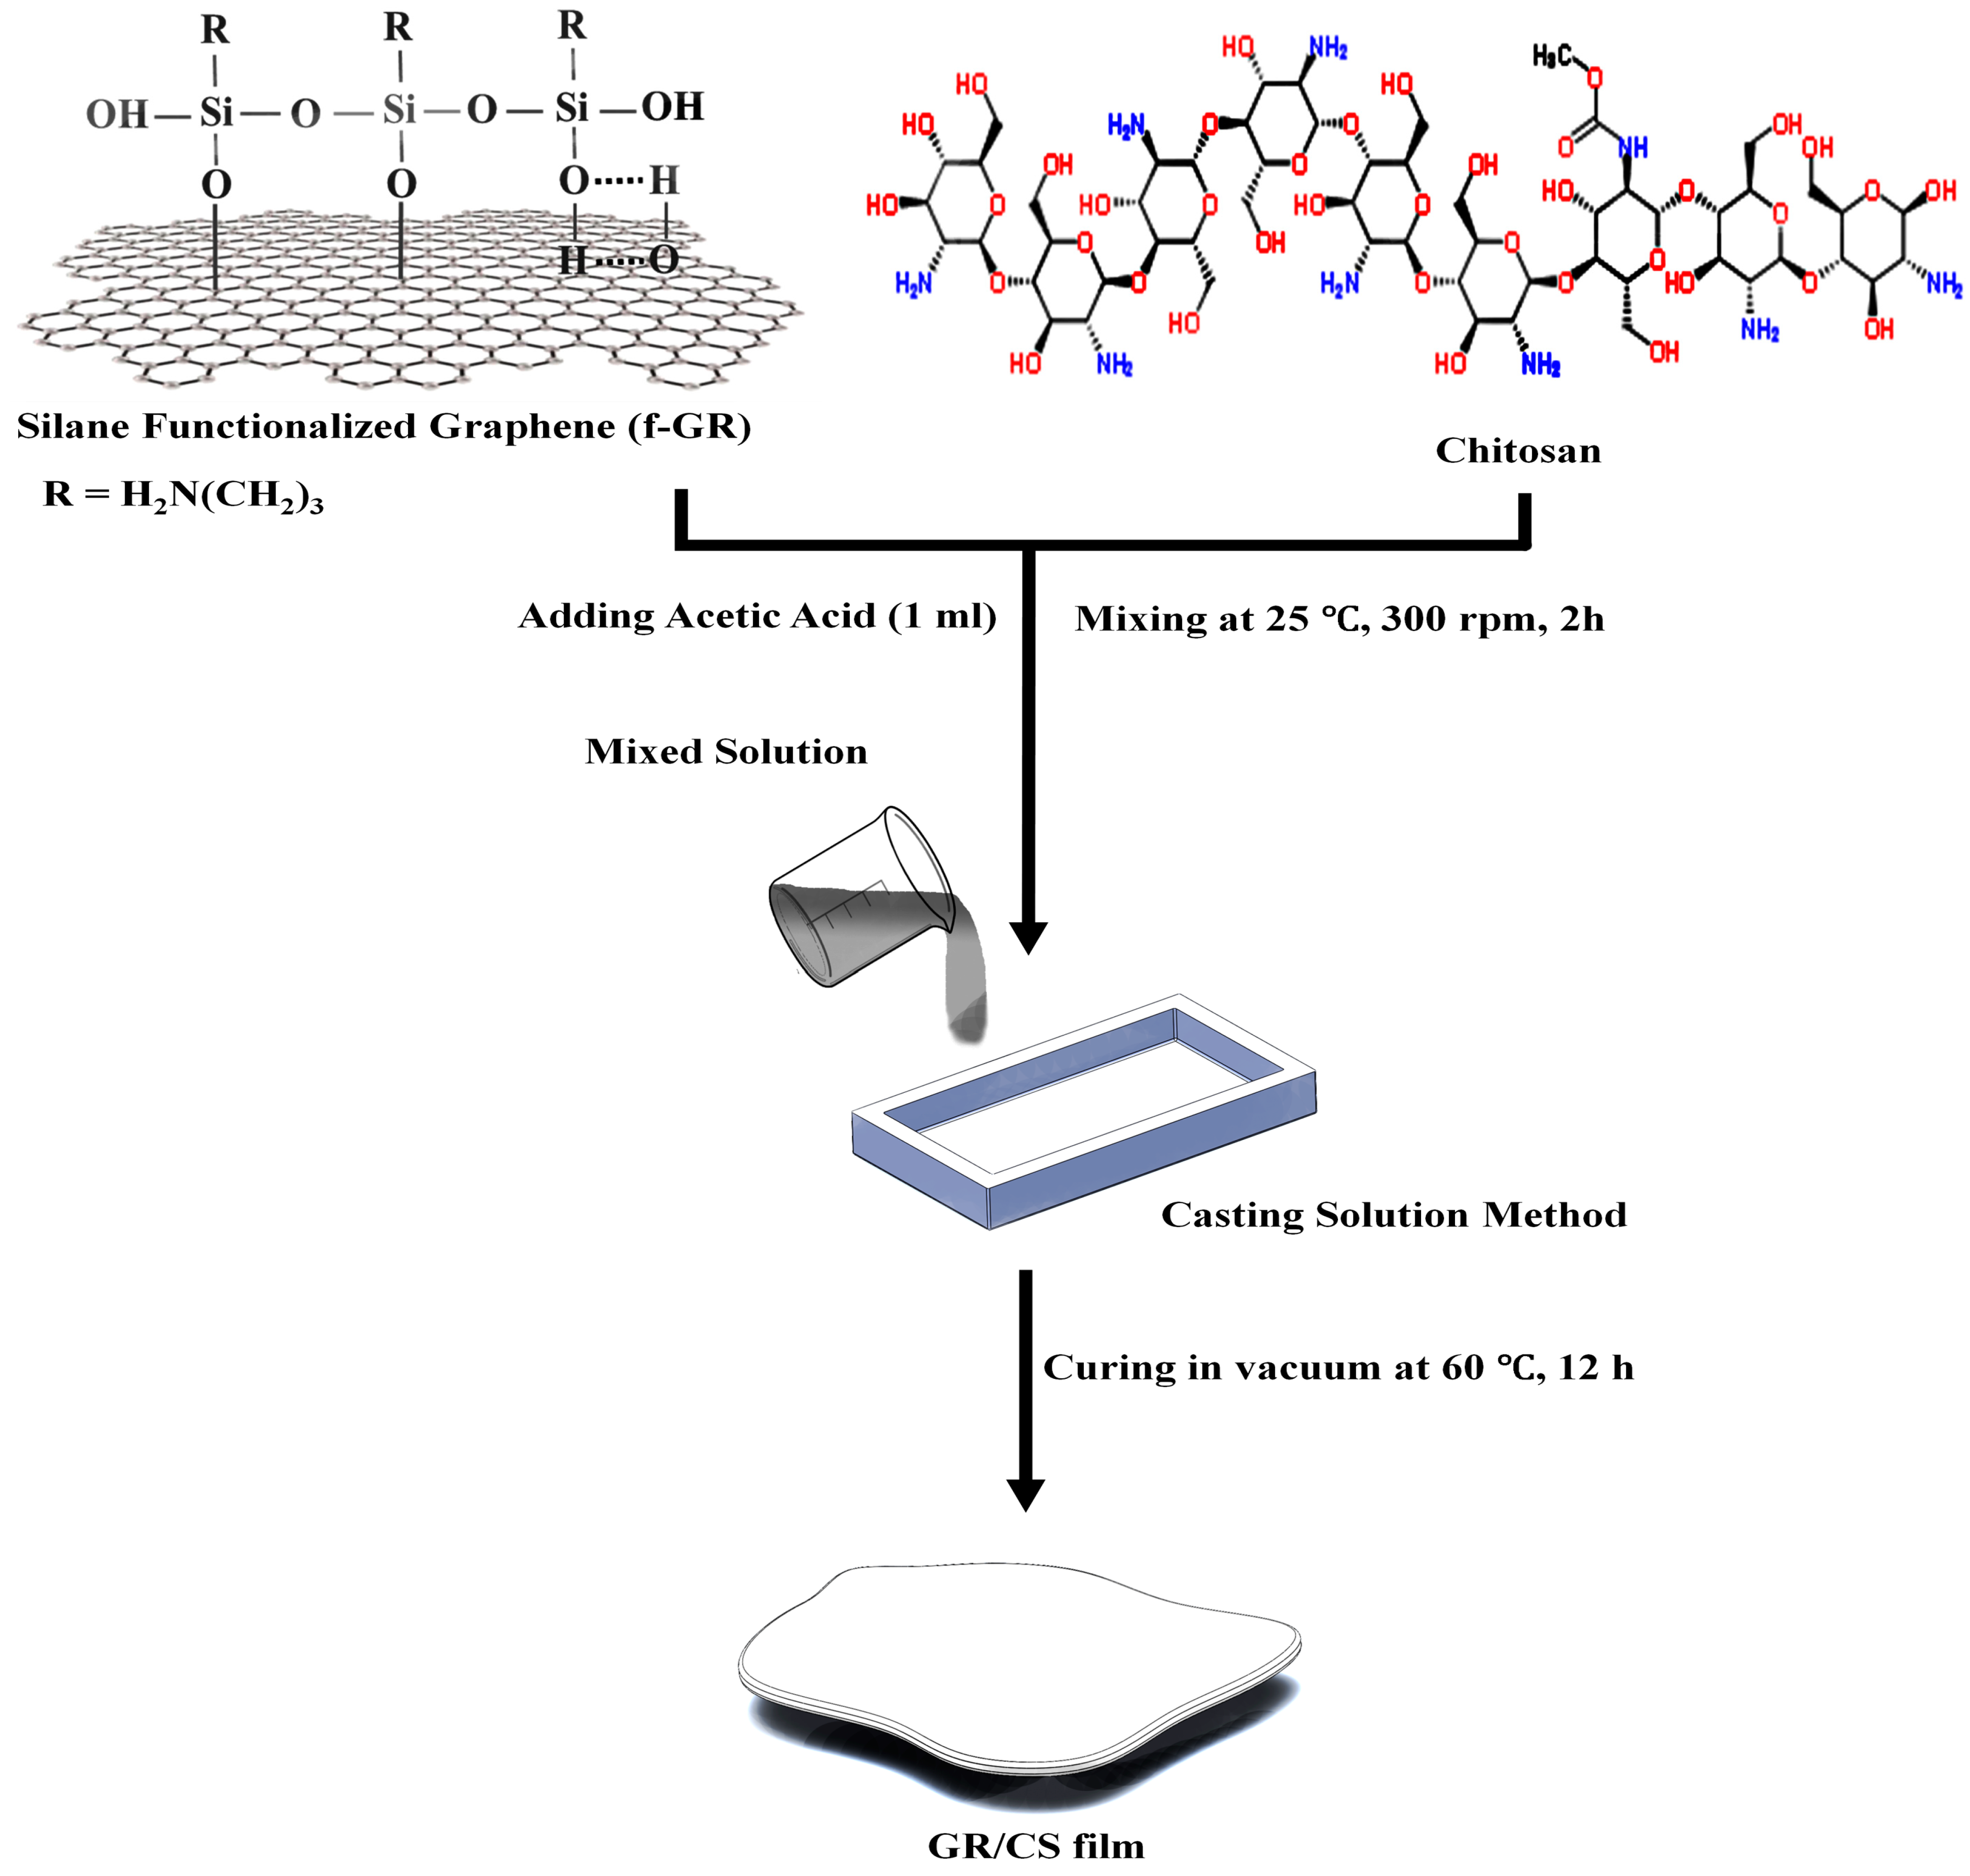
2.4. Preparation of Chitosan/Graphene Nanocomposite Films

Zero-point-zero one grams of graphene (raw graphene, o-graphene, f-graphene) were dispersed individually in 100 mL of distilled water by ultrasonication for 1 h in an ultrasonic bath. After sonication, 0.99 g of chitosan and 1 mL of acetic acid were added, and the individual mixtures were stirred for 2 h in a magnetic stirrer to dissolve chitosan, followed by 30 min of ultrasonication. The mixtures were then degassed for 5 min to remove bubbles, and the solutions were poured onto a Teflon glass plate mold and kept at 60 °C under vacuum for 12 h. The dried chitosan-1 wt% graphene nanocomposite thin films of an average thickness of 0.05 mm were carefully removed from the Teflon mold. The schematic representation of the fabrication process of chitosan/graphene nanocomposite films is given in Figure 2.
Figure 2. Schematic illustration depicting fabrication process of graphene/chitosan nanocomposite film.
Polymers 07 00527 g002

3. Characterization

Tensile tests of raw and modified graphene/chitosan nanocomposite films were performed according to ASTM D882 using a universal testing machine (UTM) (Instron 8841, Norwood, MA, USA). At least five specimens were tested for each case to ensure the reliability of the test results. The tensile strength, modulus and elongation at break of each film sample were measured. Specimens of 10 mm in width were prepared for the test. The initial gauge length and cross-head speed were set at 50 mm and 0.5 mm/min, respectively. XRD (X-ray diffraction) patterns of raw and modified graphene samples were recorded with a Rigaku Rotaflex, Tokyo, Japan (RU-200B) X-ray diffractometer using Cu Kα radiation (λ = 1.540 Å) with a Ni filter. Raman analyses of the raw and modified graphene were carried out using a Jasco Raman spectrometer, Tokyo, Japan equipped with a charge-coupled device CCD detector at a wavelength of 100 to 3200 cm−1. The thermal stability of the sample was carried out using a thermogravimetric analyzer (Q5000 IR/SDT Q600-TA-Instrument, Seoul, Korea) programmed at a heating rate of 5 °C/min in the presence of air. The surface morphology and failure surfaces of the chitosan/graphene nanocomposite films were studied by a scanning electron microscope (SEM) (Stereoscan 440, Leica Cambridge, Wetzlar, Germany). Fourier transform infrared spectroscopy (FTIR) was carried out using a PerkinElmer Frontier and Spectrum Two FTIR spectrophotometer (Waltham, MA, USA) between the ranges of 4000–400 cm−1. Atomic force microscopy was carried out using a Veeco (D3100) (Plainview, NY, USA) AFM Instrument. A very small amount of sample was crushed, and just a minute speck of particle was added into 5 mL of ethanol solution and sonicated for 6 h. The sonicated solution was further diluted; later, a pre-cleaned strip of silicon wafer was immersed into the dilute solution for a fraction of a second and was removed for further drying. The AFM images were obtained in non-contact mode. X-ray photoelectron spectroscopy (XPS: K-alpha Thermo Electron, Waltham, MA, USA) was utilized to further quantify and detect the elemental composition of the sample in detail. The characterization using XPS was carried out by making a concentrated slurry of the sample in ethanol. The slurry was then deposited on clean Si-wafer (ultrasonicated) using a sterile Pasteur pipette. The coating was then allowed to dry at 80 °C in a vacuum oven for 2 h.

4. Results and Discussions

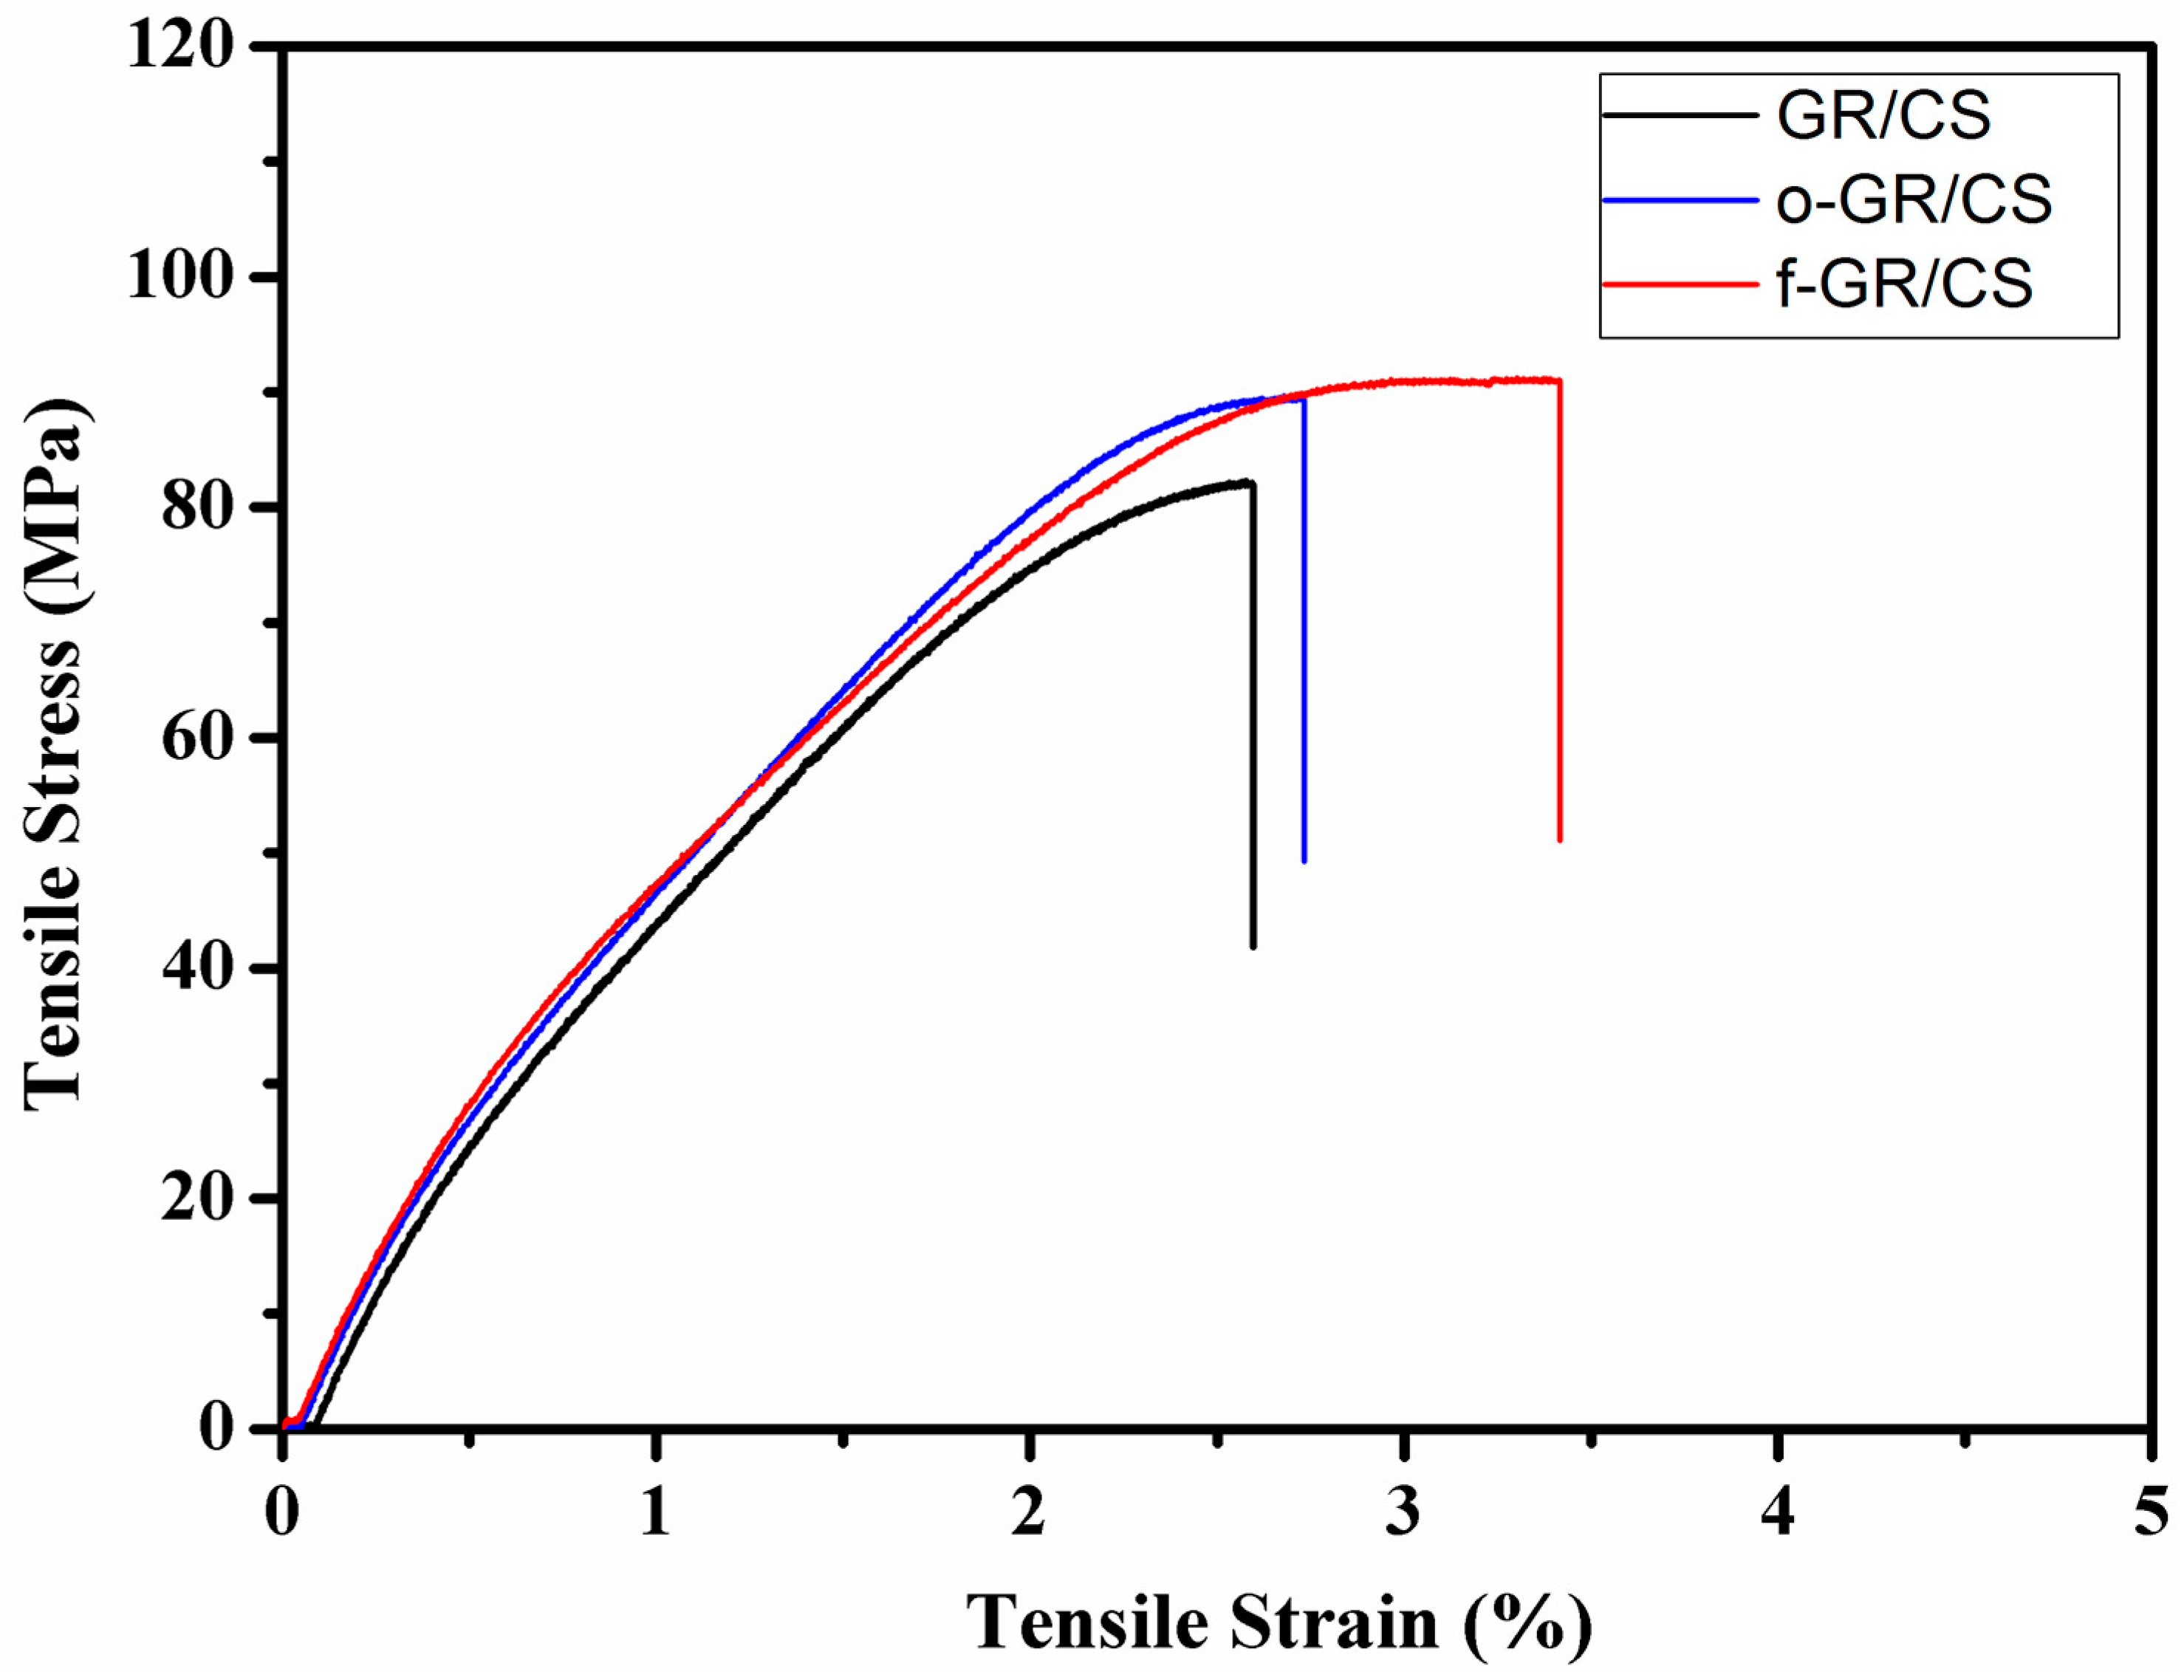
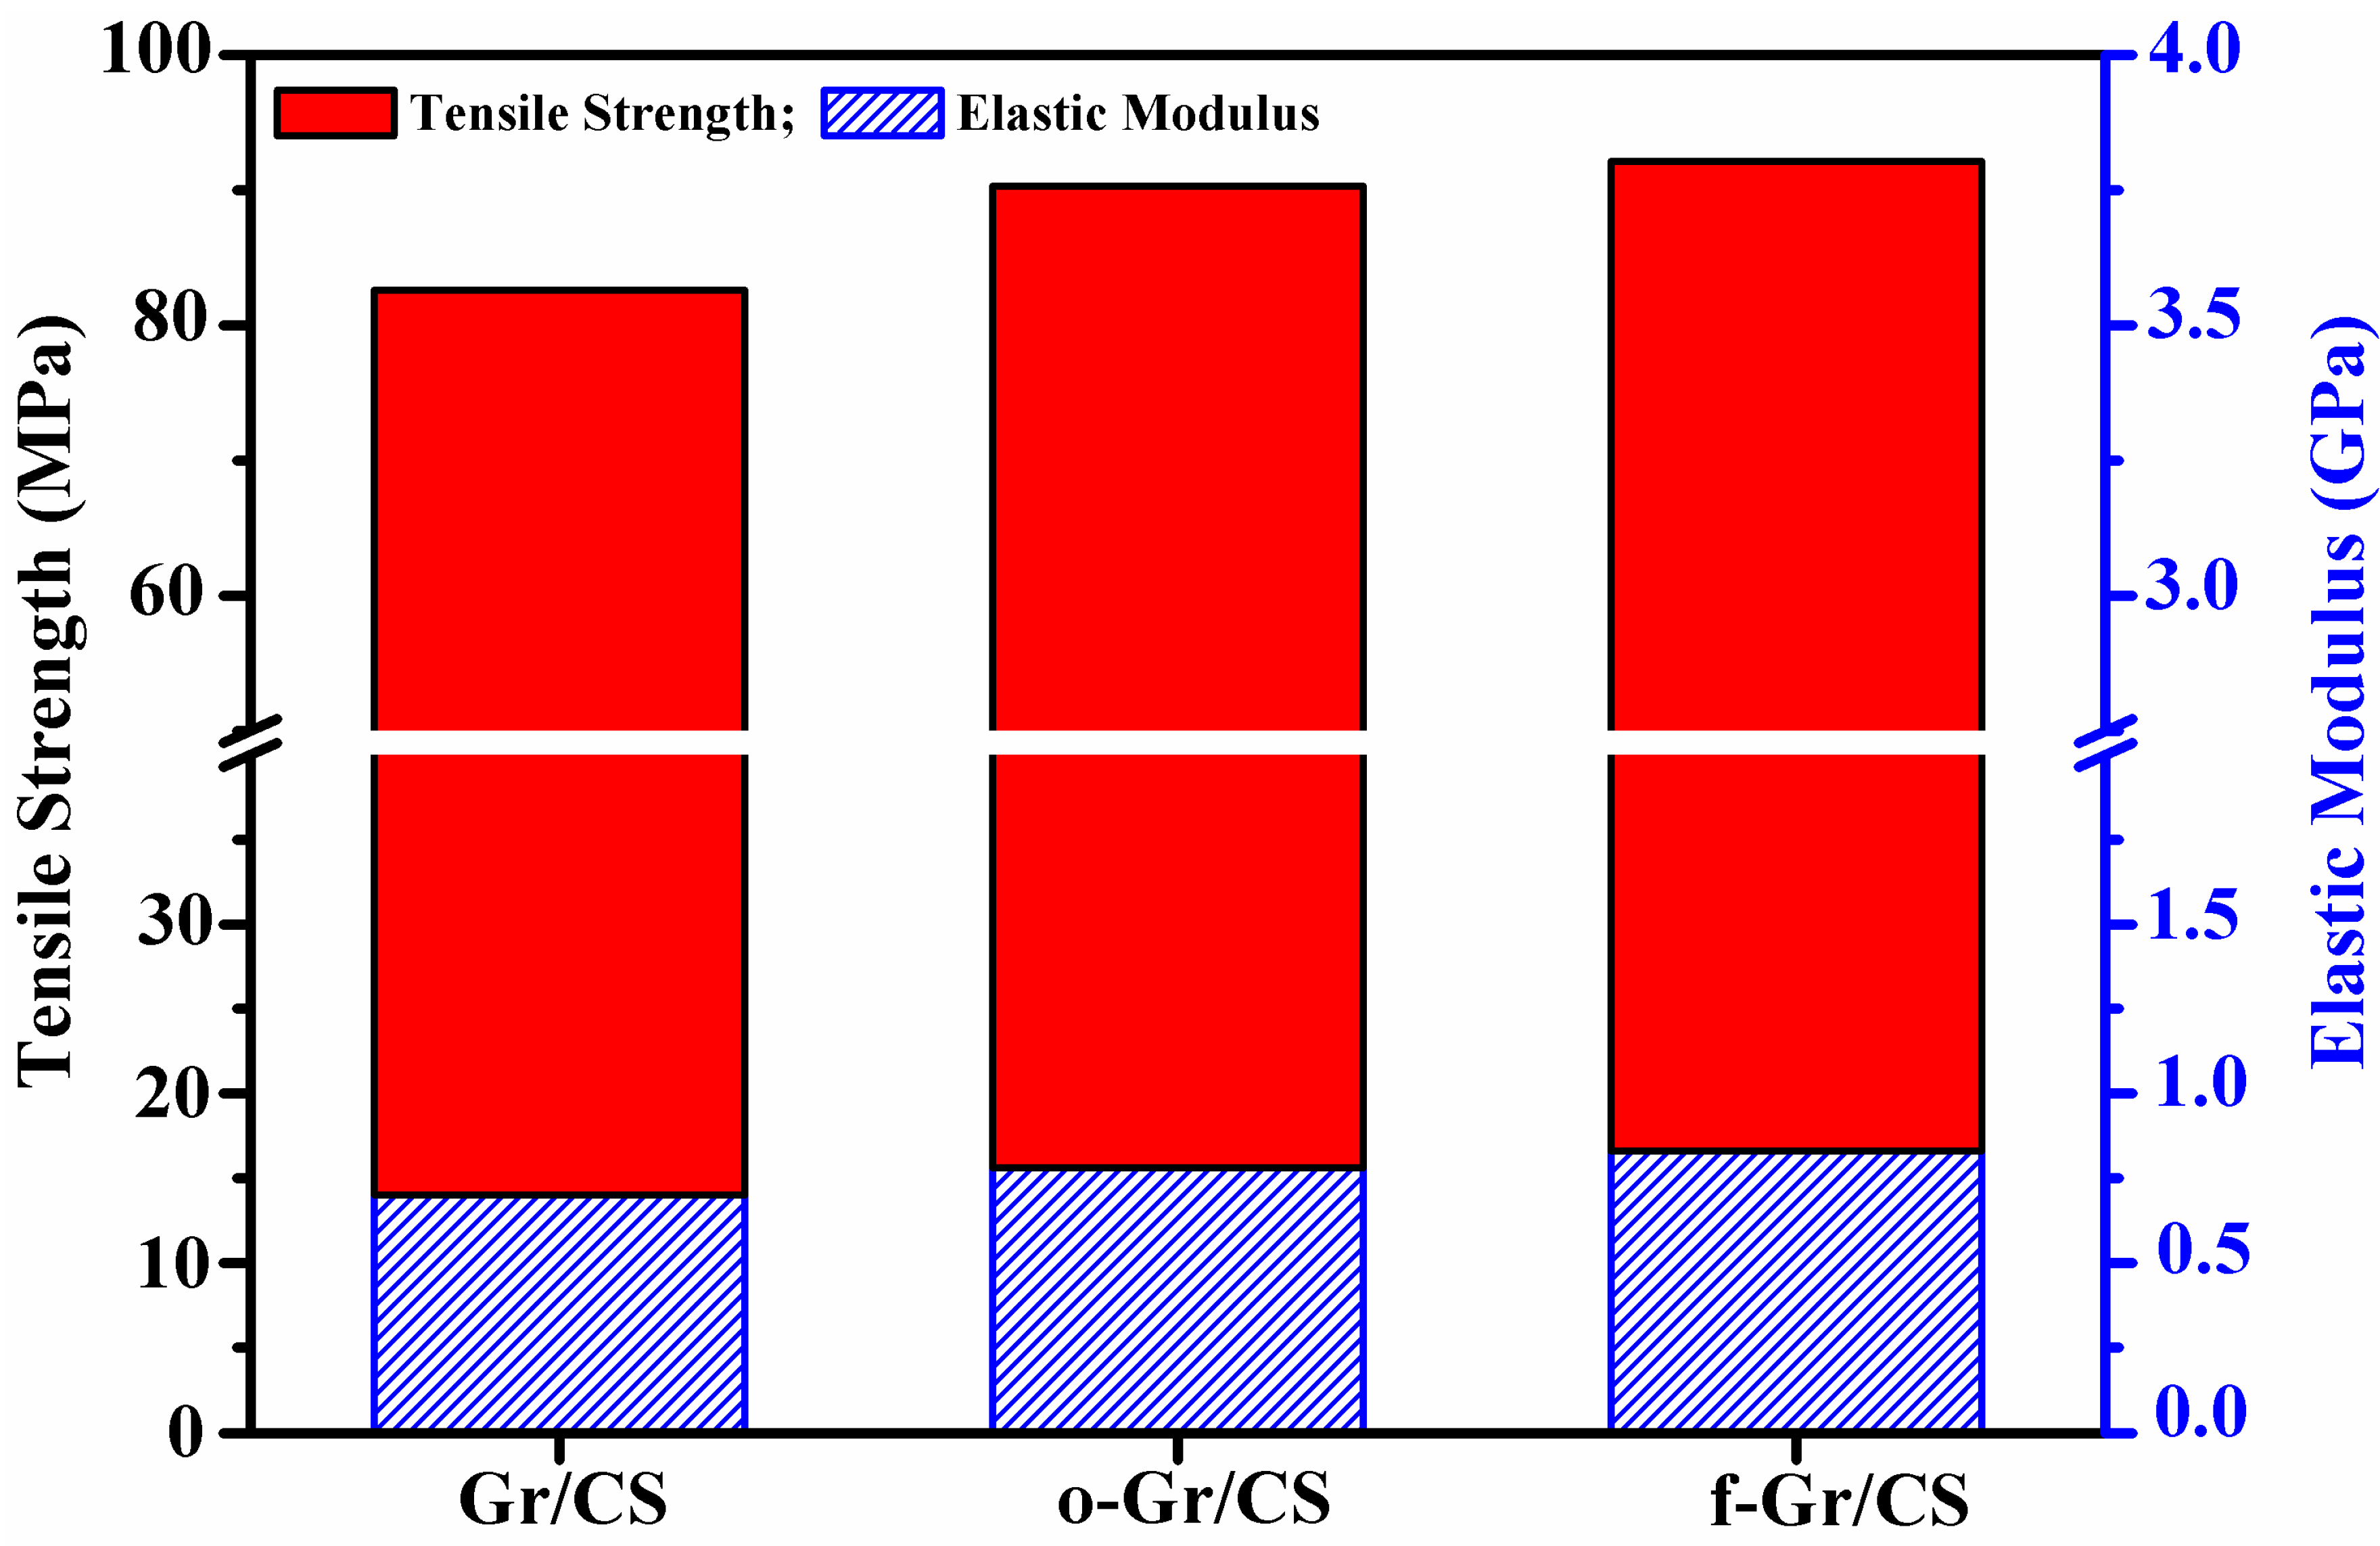
4.1. Tensile Characteristics of Graphene/Chitosan Nanocomposite Films

Figure 3 shows typical tensile stress-strain curves of graphene (GR/CS), o-graphene (o-GR/CS) and f-graphene/chitosan (f-GR/CS) nanocomposite films, in which the stress linearly increases with increasing strain before reaching the maximum stress for all composite films. The tensile strength and elastic modulus of the silane-functionalized composite film were compared to those of the unmodified and oxidized composite films to investigate the effect of silane functionalization of graphene on the tensile properties of graphene/chitosan nanocomposite film. The elastic modulus was determined by measuring the slope at the linear region of the stress-strain curves [34].
Figure 3. Comparison of stress-strain curves in tensile tests among graphene (GR/CS), o-graphene (o-GR/CS) and f-graphene/chitosan (f-GR/CS) composite films. GR = Graphene; CS = chitosan; o = oxidized; f = functionalized.
Polymers 07 00527 g003
Figure 4 represents the change in tensile strength and elastic modulus of graphene, o-graphene and f-graphene/chitosan nanocomposite films. The tensile strength and elastic modulus of the silane-functionalized composite film are 11.4% and 16.6%, 2.0% and 5.7% greater than those of the unmodified graphene and oxidized graphene composites, respectively. The elongation at break of the silane-functionalized composite film was found to be 34.8% and 32.2% greater than those of unmodified graphene and oxidized graphene composites, respectively. These results were obtained by calculating the “mean of the sum” values. Standard errors were calculated using the uncorrected sample’s standard deviation. The details of the mechanical strengths calculated for the samples with their standard errors are listed out in Table 1. The area, calculated from the region under the stress-strain curves in Figure 3, of silane-functionalized composite film is around 1.7-times higher than that of the unmodified composite film. This result means that silane functionalization of graphene has an effect on increasing the toughness of graphene/chitosan nanocomposite film. Synergistically, silane functionalization of graphene increases the resistance to fracture when receiving external forces, because silane as a coupling agent provides higher and close interfacial reactivity between chitosan and chitosan or chitosan and graphene moieties/particles.
Table 2 lists out the statistical analysis carried out on the mechanical properties of the composite samples. As observed from the data, it is clear that the samples are almost uniform with respect to the dispersion of graphene within the chitosan matrix. The change/error in the data is less than 5% (4.2% approximately), which is a standard and acceptable parameter in the mechanical studies. This also helps in understanding the mechanical dynamics as observed in the slight increase in the tensile and elastic modulus of the composites, namely GR/CS; o-GR/CS and f-GR/CS, respectively.
Figure 4. Comparison of the tensile strength and elastic modulus among GR/CS, o-GR/CS and f-GR/CS composite films.
Polymers 07 00527 g004
Table 1. Comparison of the tensile properties among graphene, o-graphene and f-graphene/chitosan composite films with averaged best value results.
Sample typeYoung’s modulus (GPa)Ultimate tensile strength (MPa)Elongation at break (%)
GR/CS0.70 (±0.021)81.73 (±1.43)2.50 (±0.32)
o-GR/CS0.78 (±0.017)89.43 (±1.22)2.55 (±0.29)
f-GR/CS0.83 (±0.016)91.01 (±1.19)3.37 (±0.31)
Note: Standard error is denoted within the brackets.
Table 2. Statistical analysis of the composite mechanical property.
Sample: GR/CSTensile Stress (Mpa)Young’s Modulus (Gpa)Strain%
No. 184.32120.75211.6675
No. 281.11470.68173.3212
No. 376.00590.66323.3342
No. 482.0610.63352.4225
No. 585.14720.76951.7751
MEAN81.730.72.5041
SD3.2138776950.0522609610.720377337
SE1.4372897990.0233718120.322162539
Sample o-GR/CSTensile Stress (Mpa)Young’s Modulus (Gpa)Strain%
No. 186.11450.77211.9871
No. 287.11520.78792.6664
No. 392.07750.84411.8891
No. 488.71380.76752.5484
No. 593.11450.73453.6875
MEAN89.42710.781222.5557
SD2.7367329490.0359240530.642018775
SE1.2239041820.0160657250.287119525
Sample f-GR/CSTensile Stress (Mpa)Young’s Modulus (Gpa)Strain%
No. 189.14750.87232.7784
No. 291.050.86152.9785
No. 395.77850.78244.2978
No. 487.96120.83512.6958
No. 591.11580.79724.0975
MEAN91.01060.82973.3696
SD2.6651631010.0350676490.685255681
SE1.1918971730.0156827290.306455657
Notes: Mean = arithmetic average of a set of values, or distribution; SD = standard deviation; SE = standard error.

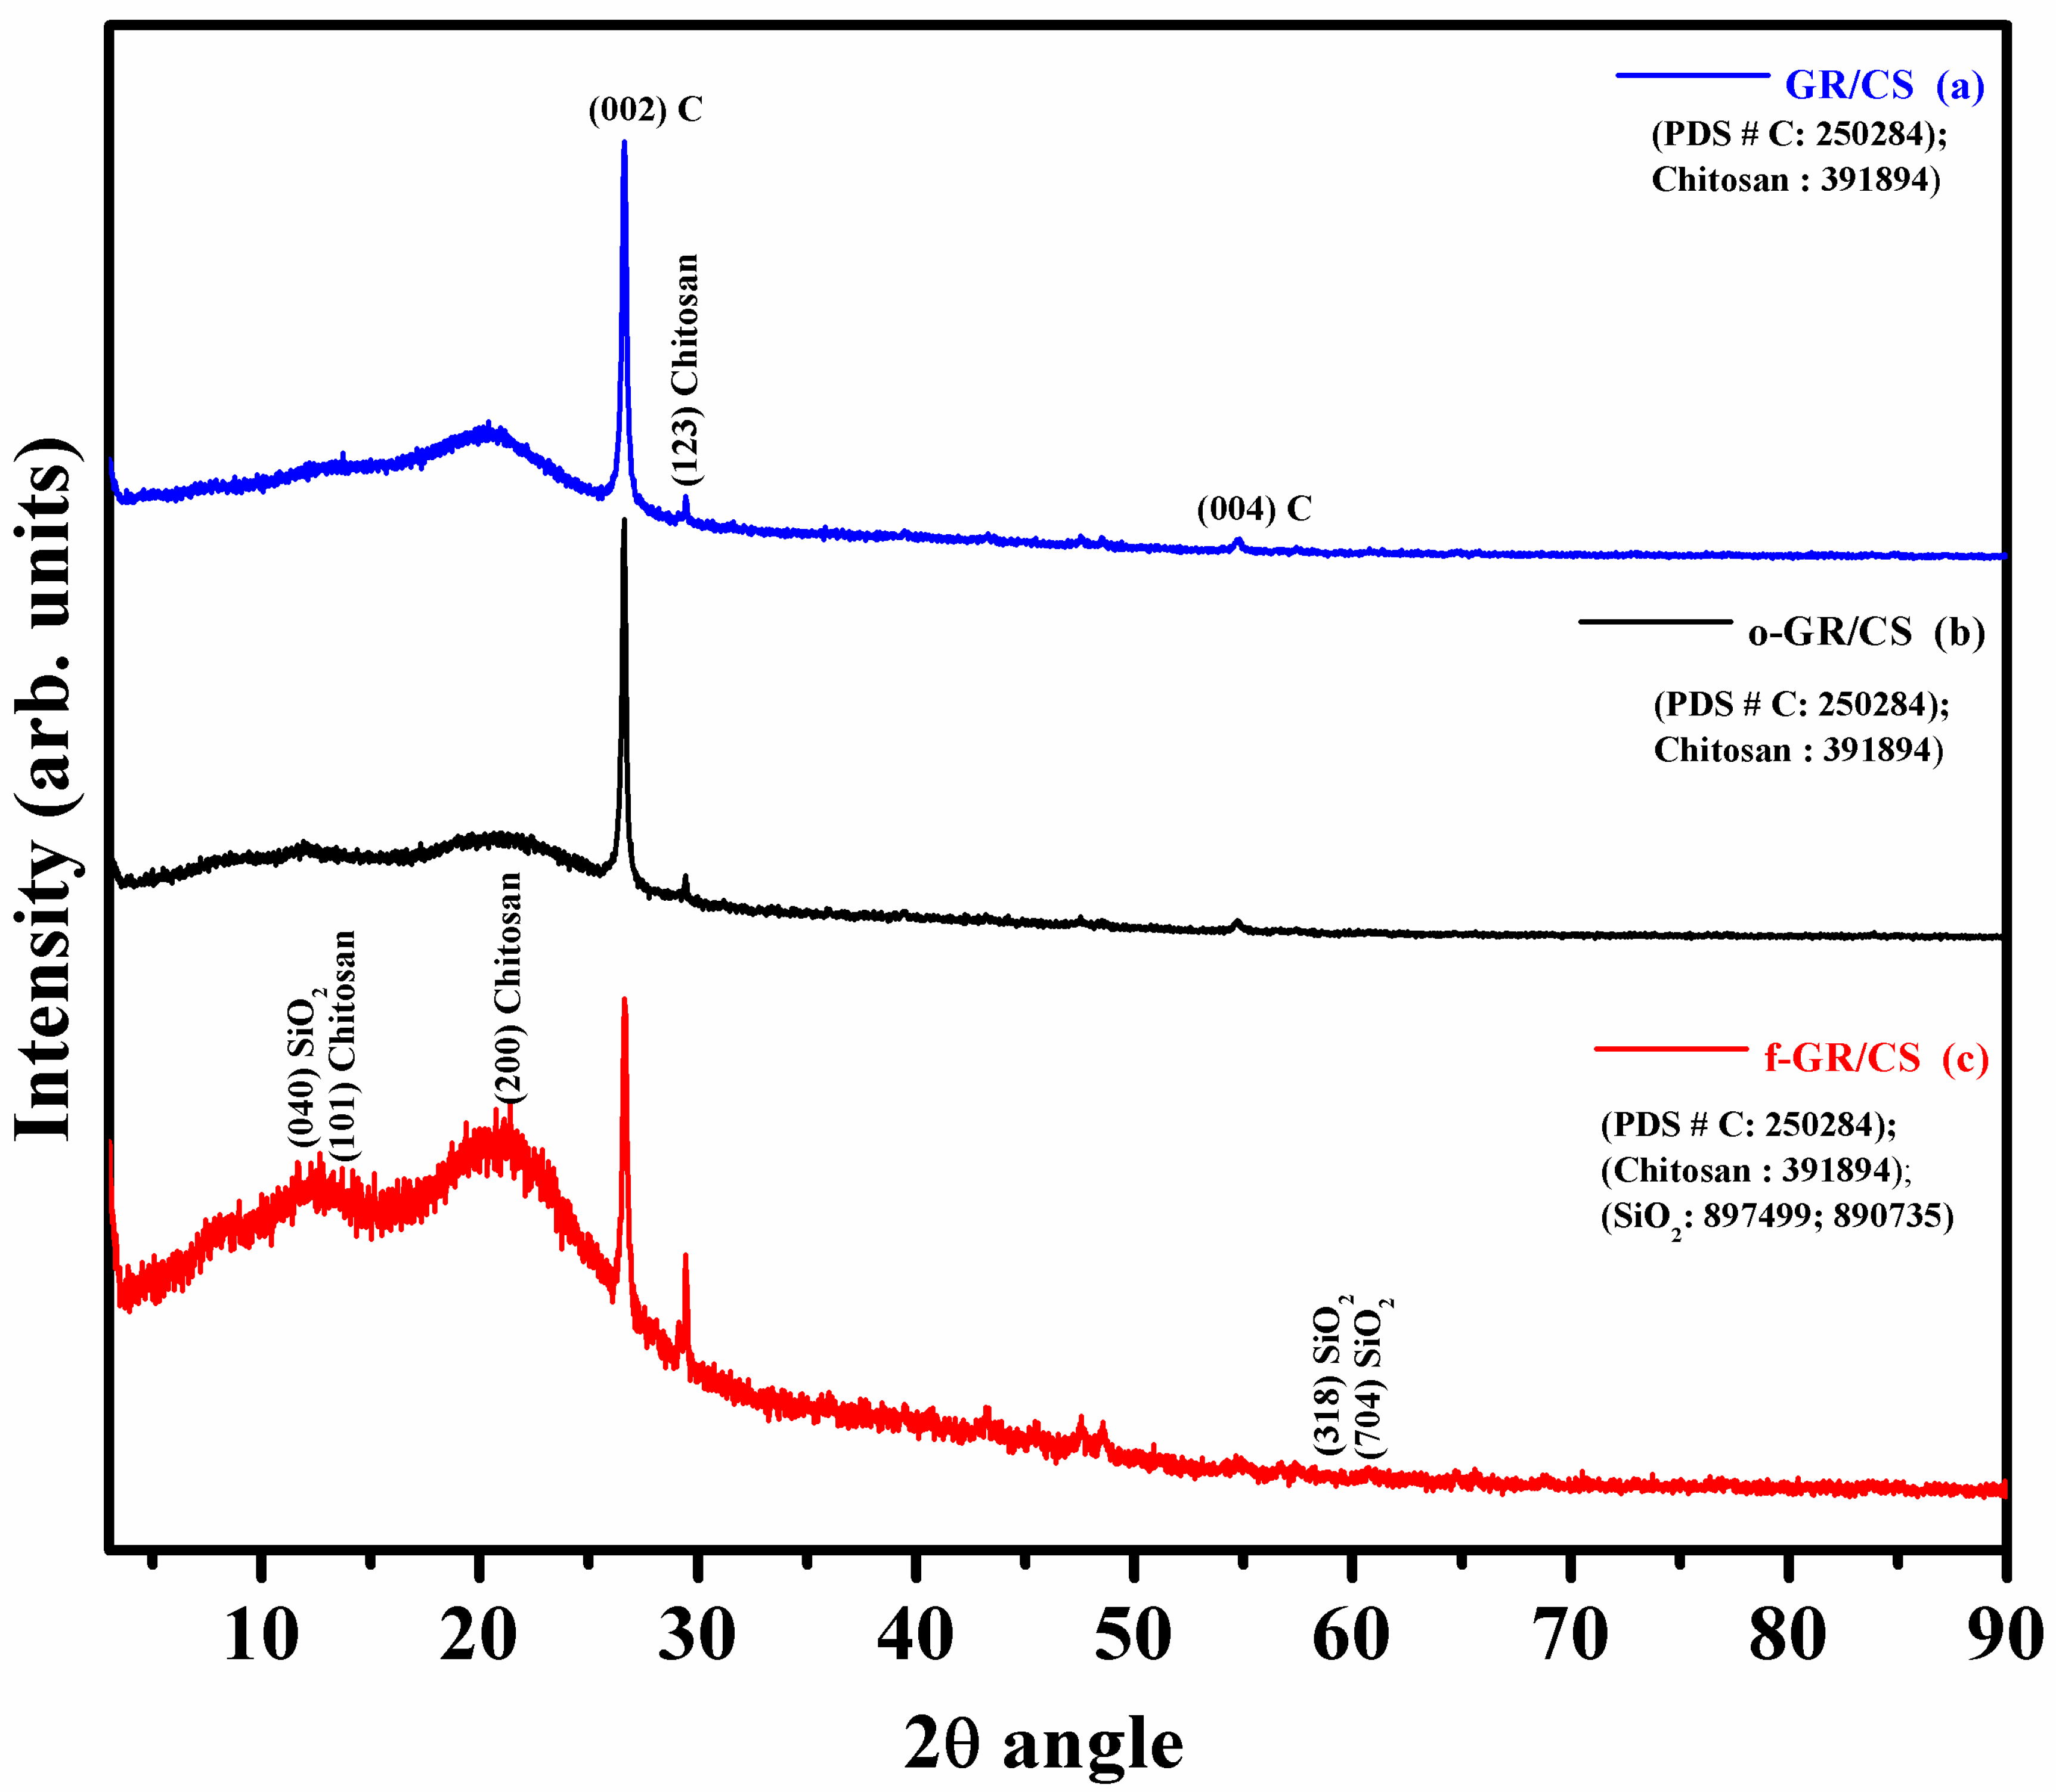
4.2. X-ray Diffraction

Figure 5 shows the diffractogram obtained from the composite samples. From the figure, it is evident that the crystalline structure of the graphene is still intact with shifts in the intensity and its position. The sample (a) also shows the presence of small amorphous bump before 25° (2θ angle). This phase is attributed to the presence of chitosan particles with possible masked dispersion along with the graphene particles. Similarly, the sample (b) also shows a low intensity amorphous bump before 25°; the position shift and low height of the intensity shows the effect of oxidation in the sample where much of the amorphous phase carbon is contributed from the oxidation of the chitosan during the acid and thermal treatment of the sample. Further, after oxidation and functionalization, we can observe a more pronounced amorphous phase between the 2θ angles of 10°–25°. These mixed phased high intensity peaks are attributed to the presence of amorphous silica and carbon present within the composite sample (c), which is contributed by chitosan and 3-APTES, respectively. The presence of silica crystals within the sample confirms the successful functionalization of the oxidized sample with APTES. Table 3 shows the details of the hkl values as identified using the International Centre for Diffraction Data (ICDD) database of the samples.
Figure 5. XRD patterns of GR/CS, o-GR/CS and f-GR/CS composite films. PDS #C represents the ICDD Powder Diffraction Standards (PDS) card numbers in the form of Powder Diffraction File (PDF) for the presence of carbon.
Polymers 07 00527 g005
Table 3. XRD details of sample peaks as indexed in ICDD JCPDF cards.
Sample Name2θ ValuehklSystemLatticeJCPDF No.Mineral Phase
(a) GR/-CS26.618002HexagonalPrimitive25-0284Graphite
29.500123OrthorhombicNA39-1894Chitosan
54.73004HexagonalPrimitive25-0284Graphite
(b) o-GR/CS26.609002HexagonalPrimitive25-0284Graphite
29.414123OrthorhombicNA39-1894Chitosan
54.721004HexagonalPrimitive25-0284Graphite
(c) f-GR/CS11.667040MonoclinicEnd centered89-7499SiO2
13.602101OrthorhombicNA39-1894Chitosan
21.100200OrthorhombicNA39-1894Chitosan
26.637002Hexagonal Primitive25-0284Graphite
29.453123OrthorhombicNA39-1894Chitosan
57.403318RhombohedralRhombo-central89-0735SiO2
60.700704RhombohedralRhombo-central89-0735SiO2

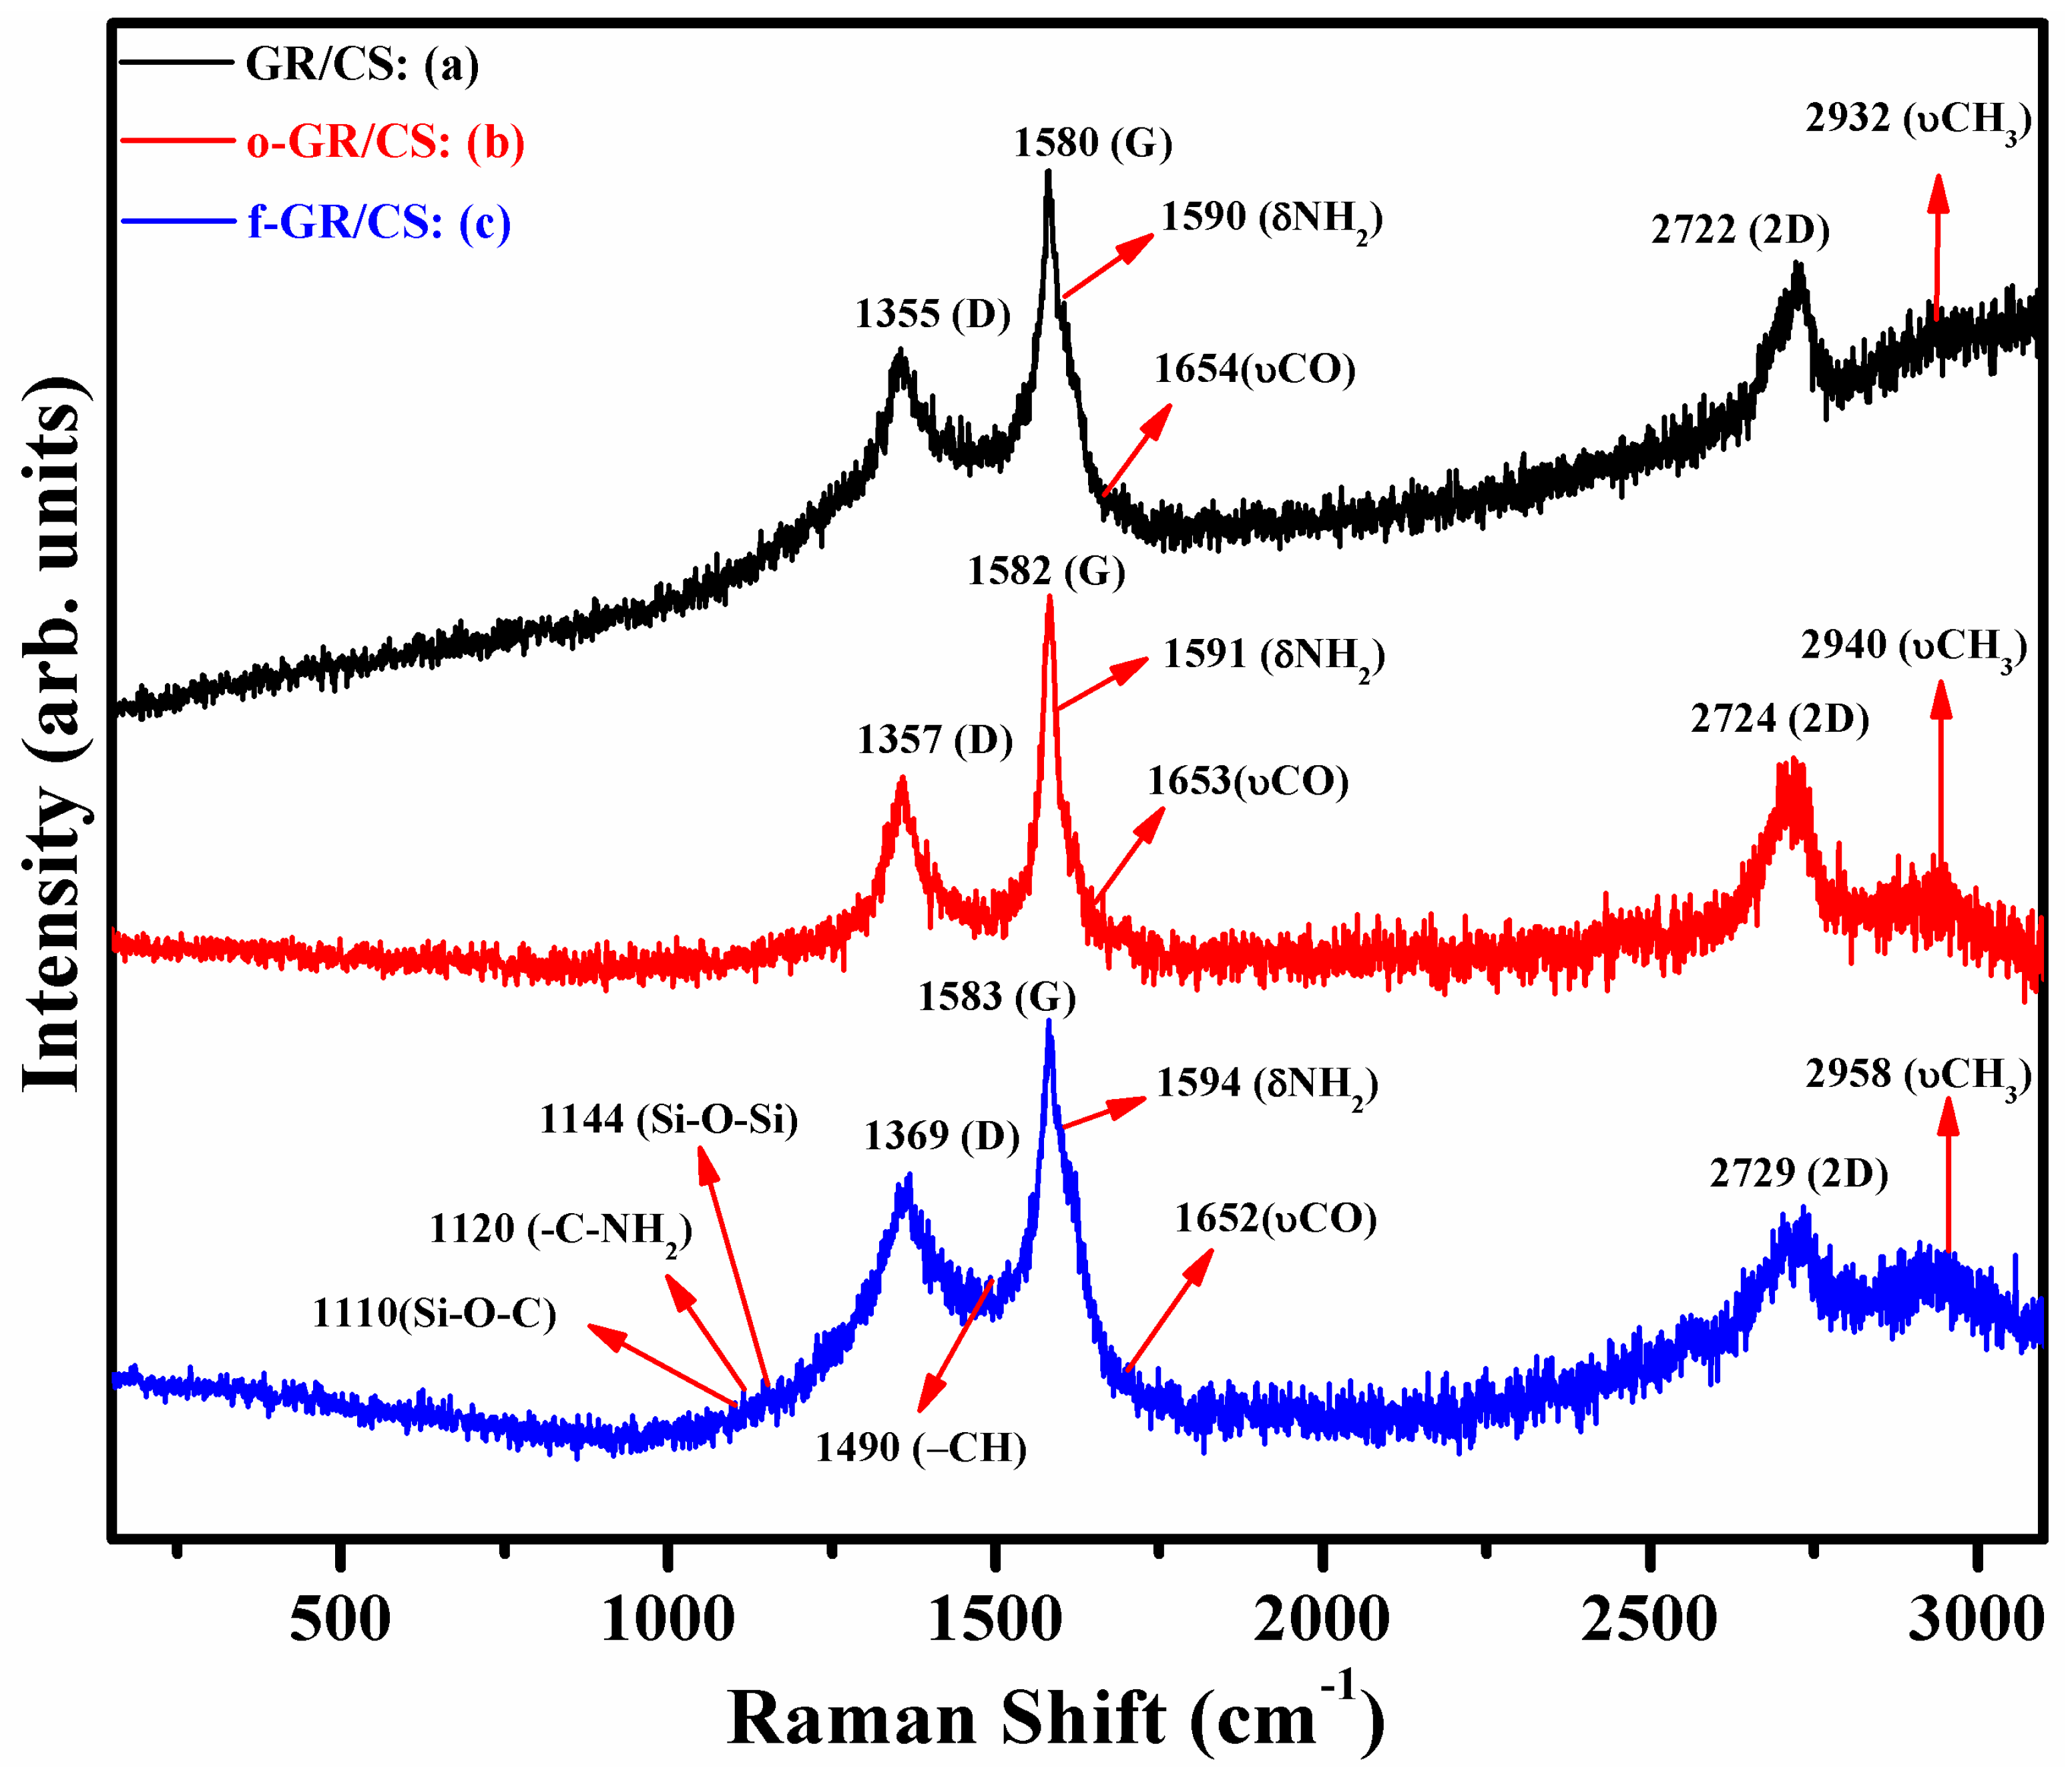
4.3. Raman Spectroscopy

Raman spectrums of the composite samples are depicted in Figure 6. The spectrums show the characteristic 2D’ graphene peak at 2722 cm−1. The shape and intensity implies that the graphene is multilayered, with defects arising due to the introduction of chitosan and APTES (for the functionalized graphene-chitosan composite). The characteristic D-band and G-band peaks of graphene in the composite are visible between the Raman wavenumbers of 1355–1370 and 1580–1585 cm−1, respectively. Furthermore, the shift in the position and the intensity of the peaks also provides insight into the effect of functionalization. The spectrum also shows several instances of decreased intensities in each band upon the oxidation and functionalization process [38,39,40]. These changes can also be observed within the D and G bands of the graphene. Secondly, all of the samples have also shown the fingerprint zones of chitosan and APTES at several positions on the spectrum. The presence of Si–O–Si and Si–O–C bands at 1144 and 1110 cm−1 confirms the presence of APTES and also demonstrates the inter-linkages occurring between the Si–O and C moieties of both graphene and chitosan, respectively [41,42,43,44,45].
Figure 6. Raman spectrums of GR/CS, o-GR/CS and f-GR/CS composite films.
Polymers 07 00527 g006

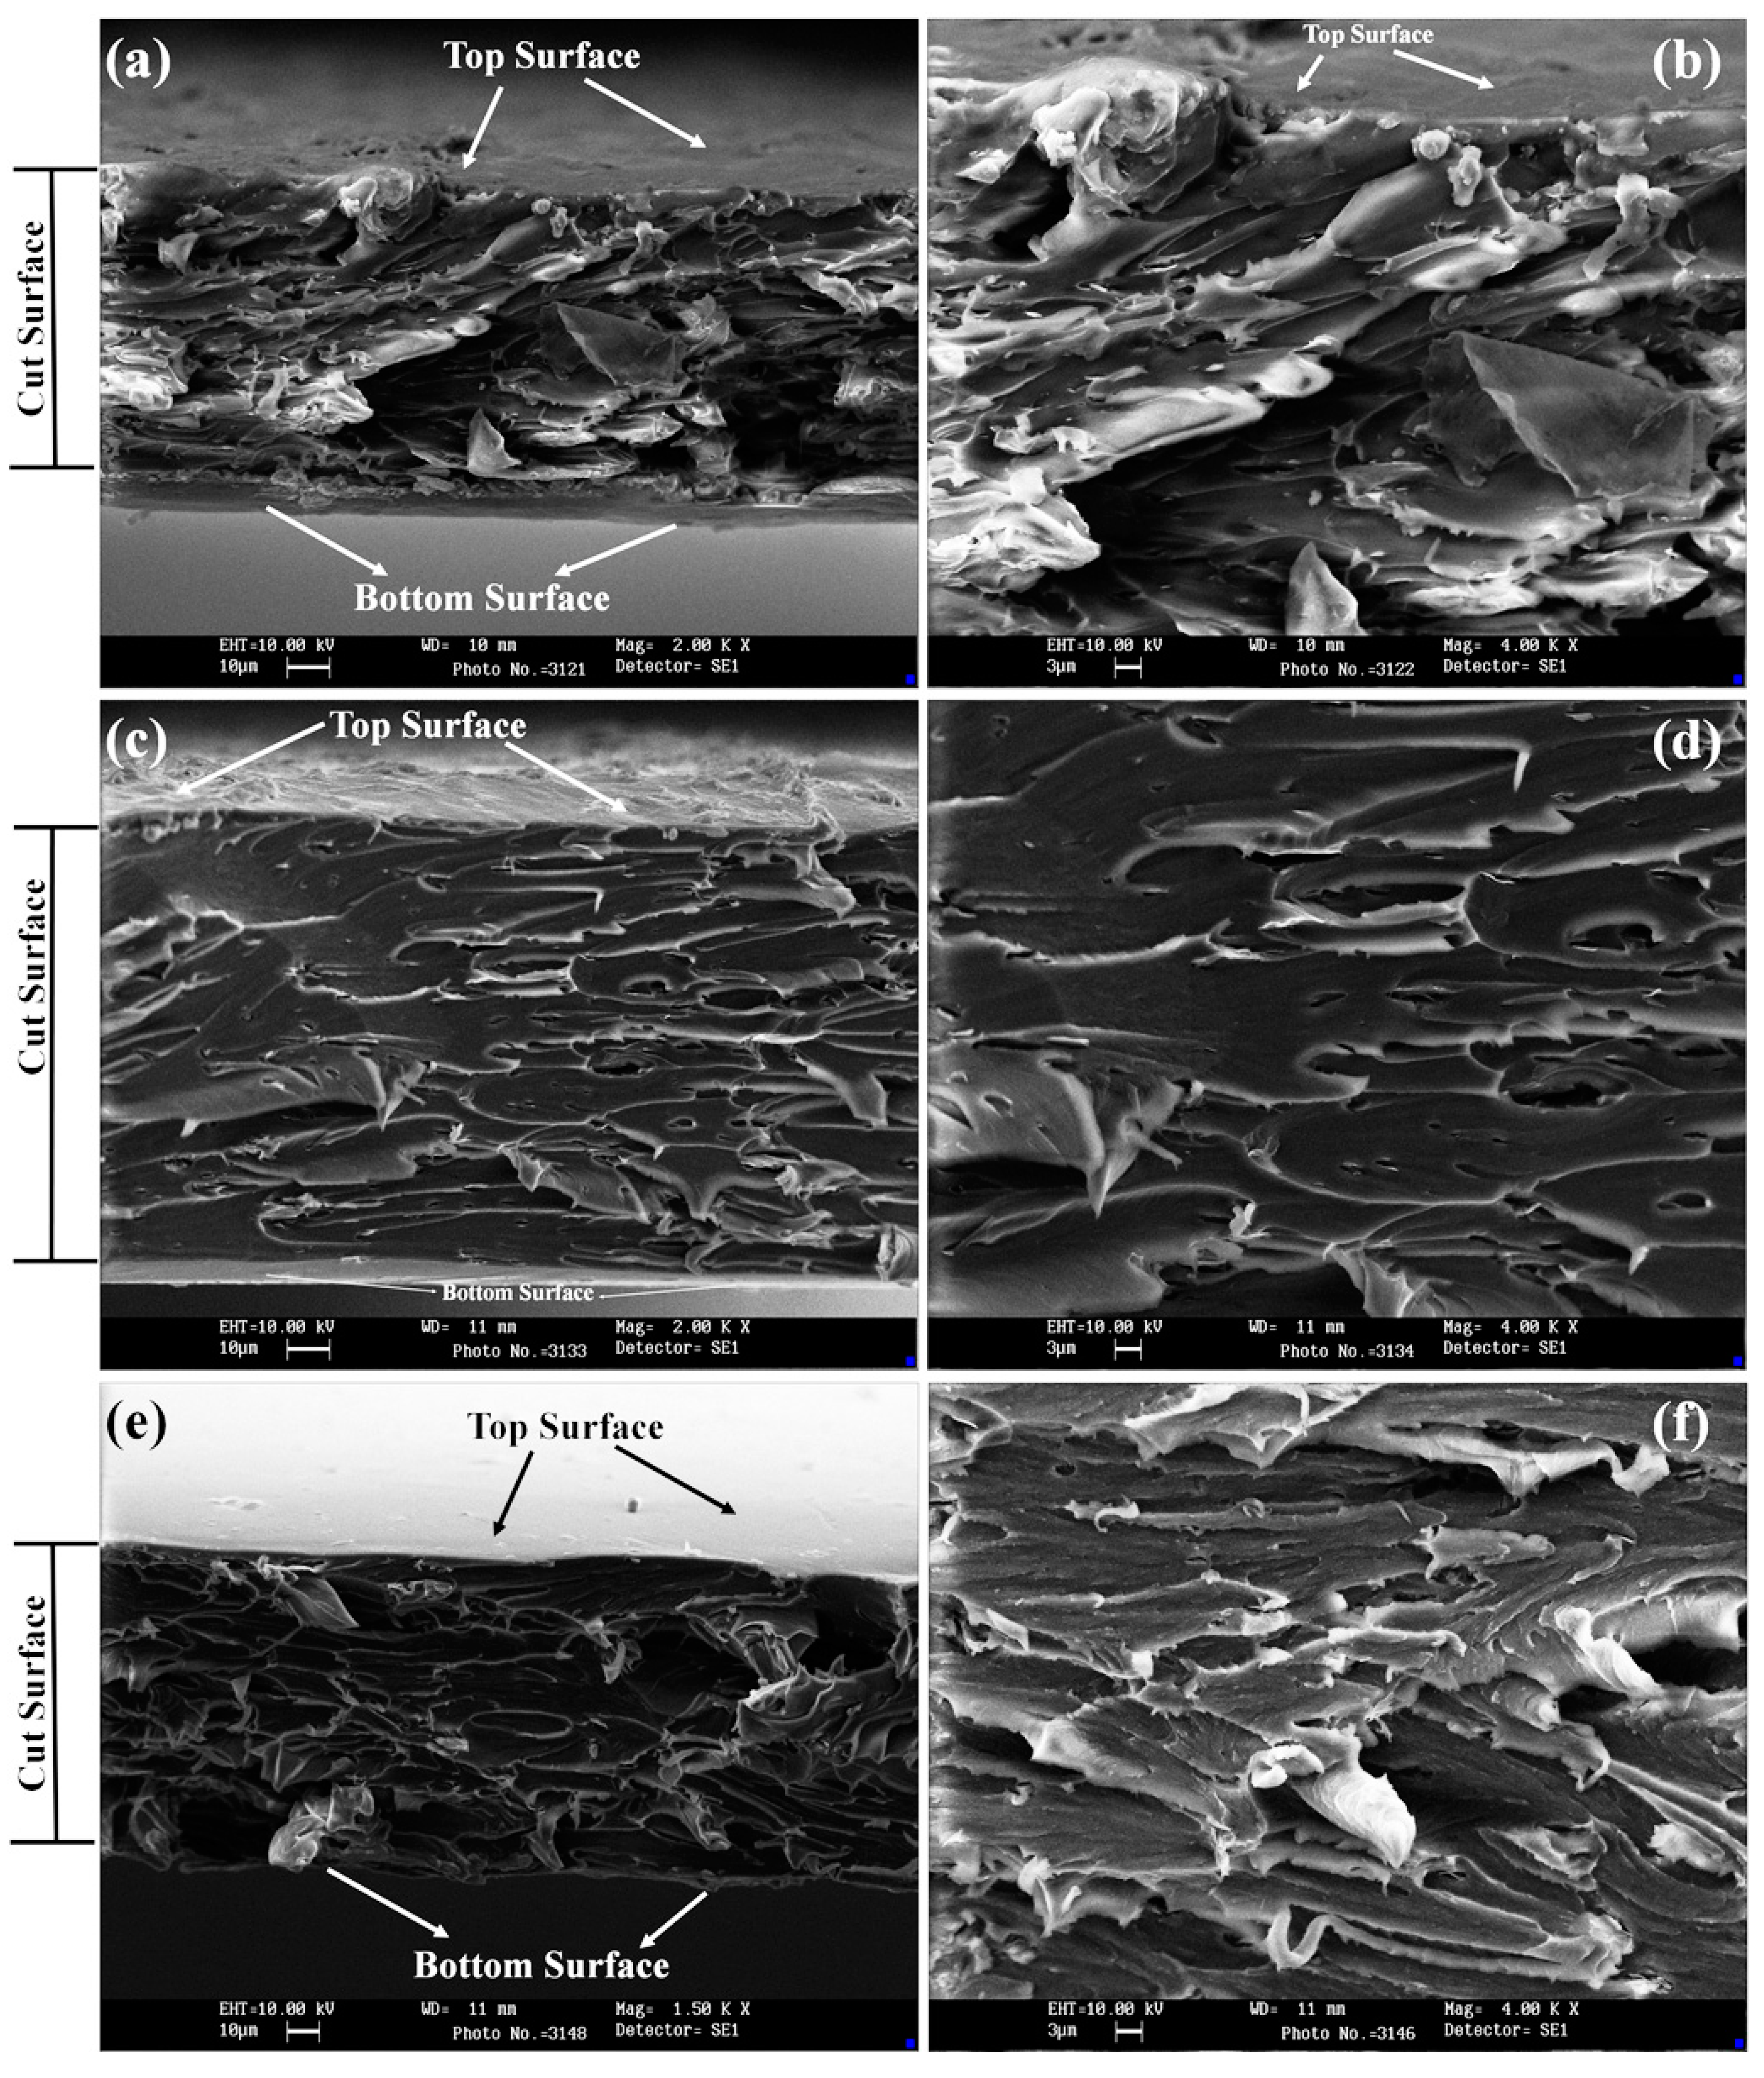
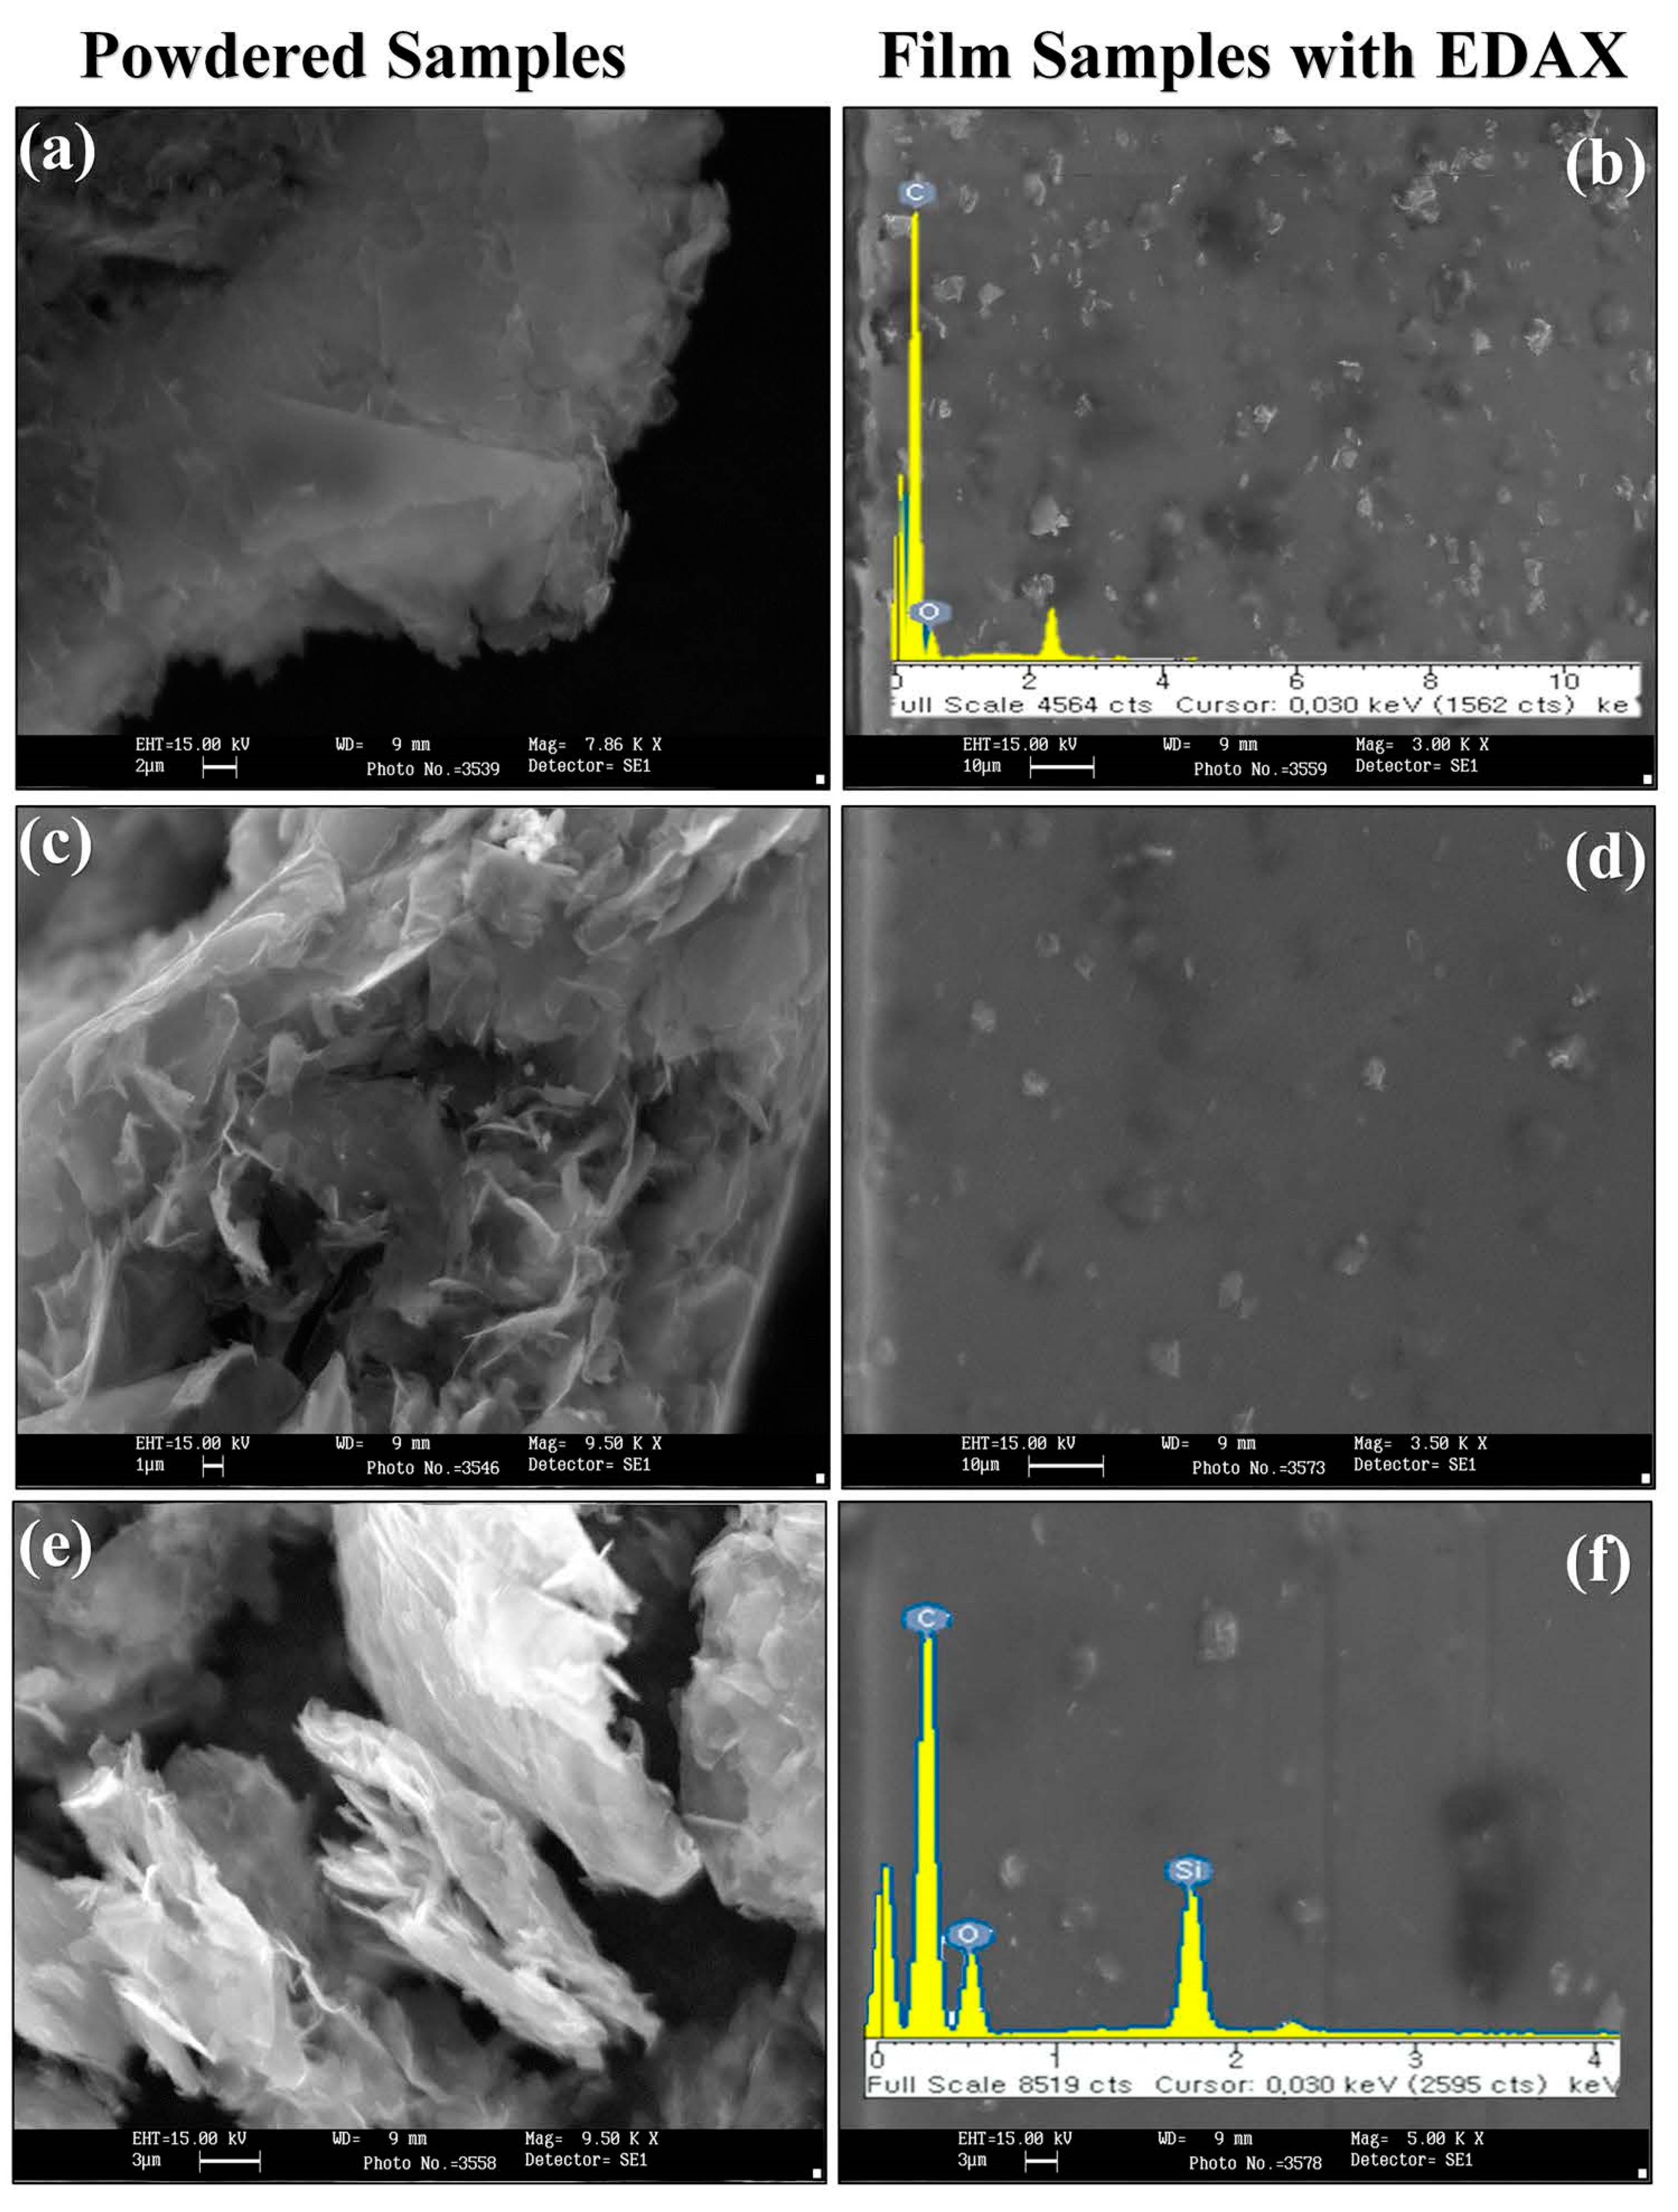
4.4. Scanning Electron Microscope (SEM) Analysis

The SEM images of the composite are shown in Figure 7 with their respective low and higher magnifications. The image is taken using a Z-axis tilt mode within the SEM. This process enables the viewer to visualize a top sectional view along with the internal morphology of the specimen. The images are labeled accordingly to create a visualization of the top, middle and lower surfaces of the sample. The focus in view is the cut surface (fractured surface) obtained during the stress analysis. Figure 7a,b represents high and low magnification of the graphene-chitosan sample. Figure 7c,d represents the oxidized graphene–chitosan sample, and Figure 7e,f represent the 3-APTES-functionalized graphene-chitosan sample. From Figure 7a,b, we can observe that the surface of the composite is quite rough and uneven, with outgrowths of graphene-chitosan particles. The middle section shows the cut surface of the composite as analyzed for its tensile property. We can observe that the internal flaky structures of the composite are facing a single direction due to the effect of tearing. Furthermore, one can observe the presence of sheets of graphene embedded within the waxy-looking chitosan. The arrangement of the graphene flakes and the chitosan matrix mimics the brick wall structure similar to that found in nacre shell. Due to the unidirectional stress, the formation of cracks develops in a straight axis and propagates through the weaker sections of this layered structure, causing the tear. Since graphene is a layered material, which is adhered to the chitosan moieties through weak van der Waals forces, it loses its integrity during enormous stress, thereby causing the rupture within the layers and initiation of delamination and tearing. The presence of a large torn-up graphene sheet in Figure 7b is an indication of delamination and tearing, causing the rupture within the sample.
Similarly, Figure 7c,d represent high and low magnifications of the oxidized composite of graphene-chitosan, respectively. One can observe the presence of a highly rugged top surface of composite caused by the effect of acid/thermal oxidation. The presence of small voids (holes/patches) within the sample is an important finding, which also helps in understanding the behavior of the sample during mechanical testing. These holes are presumed to be caused due to the acid and thermal activity on the composite and also may be attributed to the escape of the internal and loosely-bound gaseous material. These holes may also help with the increase in the cohesive attraction forces and also strengthen the adhesion properties of the foreign material into its periphery due to the presence of dangling bonds. This will also help improve the prospective mechanical properties of the composite.
Figure 7e,f represent the high and low magnification images of the 3-APTES-functionalized graphene-chitosan sample. The image shows the clean, even and a smooth surface of the composite. This may arise due to the precise uniform mixing of 3-APTES with chitosan and graphene, thus stabilizing and uniformly dispersing the particles along with the texture. It should be noted that the amount of 3-APTES determines the texture co-efficient of the sample. As observed, the functionalization of the graphene-chitosan composite is successfully achieved. From the image, one can also observe that the holes produced during the oxidation process have been almost covered completely by the addition of APTES within the matrix. The appearance of the wavy pattern is a clear indication of the continuous uniform mixing. The highest value (in comparison with previous samples) in the tensile strength for this sample showed that, due to effective mixing, the silica within the APTES is contributing as a bridging agent, thus interlinking and interacting with the free surface bonds between the graphene–chitosan linkages. This interaction also increases the adhesion between the interlinking layers of graphene-chitosan with APTES, thus making the composite highly stronger, thereby improving its overall mechanical capabilities, as observed in our case.
Figure 7. SEM images of the fractured zone of (a,b) GR/CS; (c,d) o-GR/CS and (e,f) f-GR/CS composite films.
Polymers 07 00527 g007
Based on the SEM–EDXA (energy dispersive X-ray analysis) investigations of both powder and film samples (Figure 8), we can infer that the oxidation process has successfully exfoliated the graphene layers and has exposed their surface for chemical functionalization. The image shows the respective powder and film samples with their EDAX. Figure 8a represents only the powdered graphene structure; Figure 8b represents film samples made from both graphene and chitosan along with the EDAX of the sample. Figure 8c represents only oxidized graphene (o-graphene); Figure 8d represents the film fabricated using chitosan and O-graphene; Figure 8e represents only 3-APTES-functionalized graphene (f-graphene) flakes. Figure 8f depicts the composite film fabricated using chitosan and the f-graphene with EDAX. The elemental analysis as shown on Figure 8b,f confirms the presence of silicon (Si) and oxygen (O) for the f-graphene case. The scan detected approximately 2.5 atm% of Si, which is very much in close agreement with the amount reported from our TGA results. The images also show the different morphology of the film surface as discussed in the earlier SEM Figure 7.
Figure 8. SEM–EDAX of powdered composite and the film. (a,b) GR/CS; (c,d) o-GR/CS and (e,f) f-GR/CS composite films.
Polymers 07 00527 g008

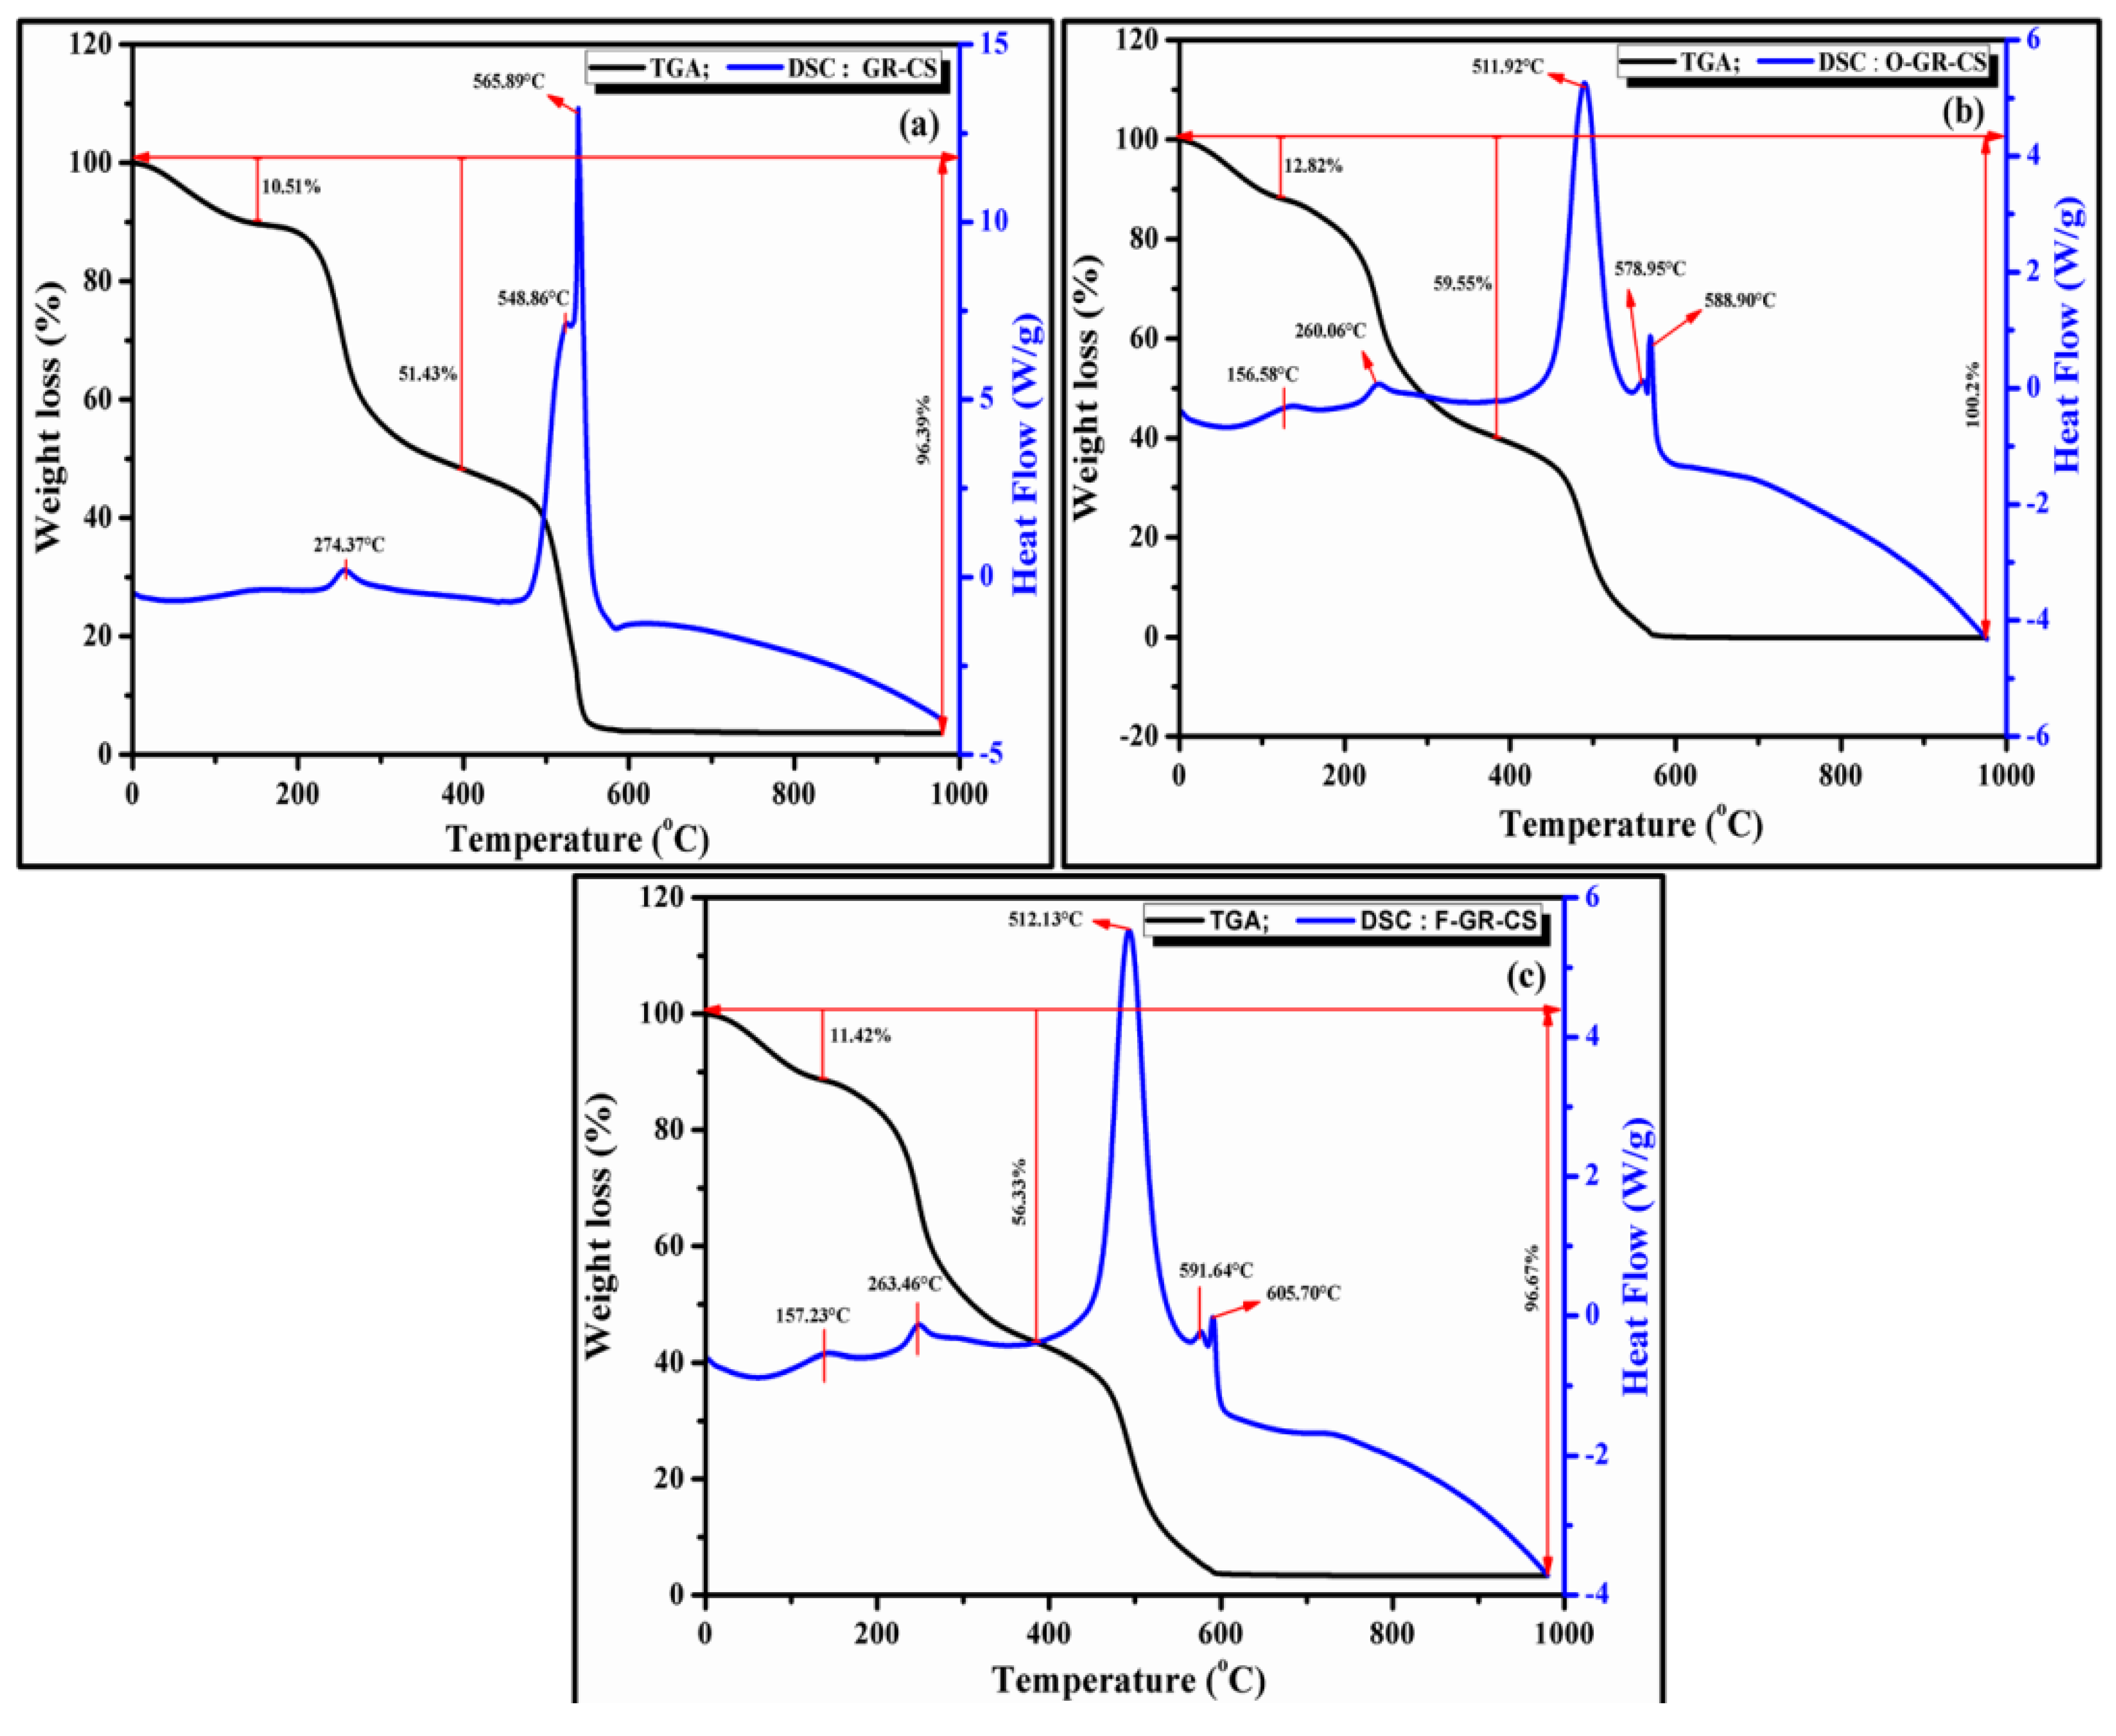
4.5. Thermal Analysis

Thermal analysis of the sample was carried out to assess the stability of the material at higher temperatures and to understand its degradation behavior during extreme physical conditions in a thermal application if used in any form. The thermographs are shown in Figure 9. From the figure, it is evident that the material is extremely stable until 250 °C, which is later followed by step-wise weight loss of the sample owing to the degradation of chitosan at the initial stages. The initial drop in weight before 150 °C is majorly attributed to the removal of moisture, carboxylic and hydroxyl groups from chitosan; from there onwards, the complete degradation starts, owing to 50% of the weight loss of the sample. On further heating to ~260 °C, the organic moieties of the saccharide rings get completely denatured [17,18]. The presence of strong exothermic peaks arising around 500–600 °C for all of the samples is attributed to the degradation of pyranose rings to form lower fatty acids. On further heating above 700 °C, the weight loss of almost 97% reflects the degeneration of the graphene structure [17,18]. The 3% ash residue for the functionalized sample is attributed to the presence of SiO2 formed due to the degradation of existing APTES molecule. On comparing the Thermo Gravimetric (TG) results of composites, one can observe a steady shift in the position of the exothermic peaks. This thermal shift is generally due to the existence of several cross-linkages occurring within the composite, which also includes the functionalized sample. As is observed from the functionalized composite thermogram, these cross-linkages have increased the thermal capacity and elasticity of the material, additionally, due to the presence of Si–O–Si and Si–O–C linkages, thereby enhancing the tensile strength and modulus, as observed from the tensile results, respectively. In summary, we infer that the graphene-chitosan material was successfully functionalized using an organo silane as a coupling agent.
Figure 9. Thermographs of GR/CS, o-GR/CS and f-GR/CS composite films.
Polymers 07 00527 g009

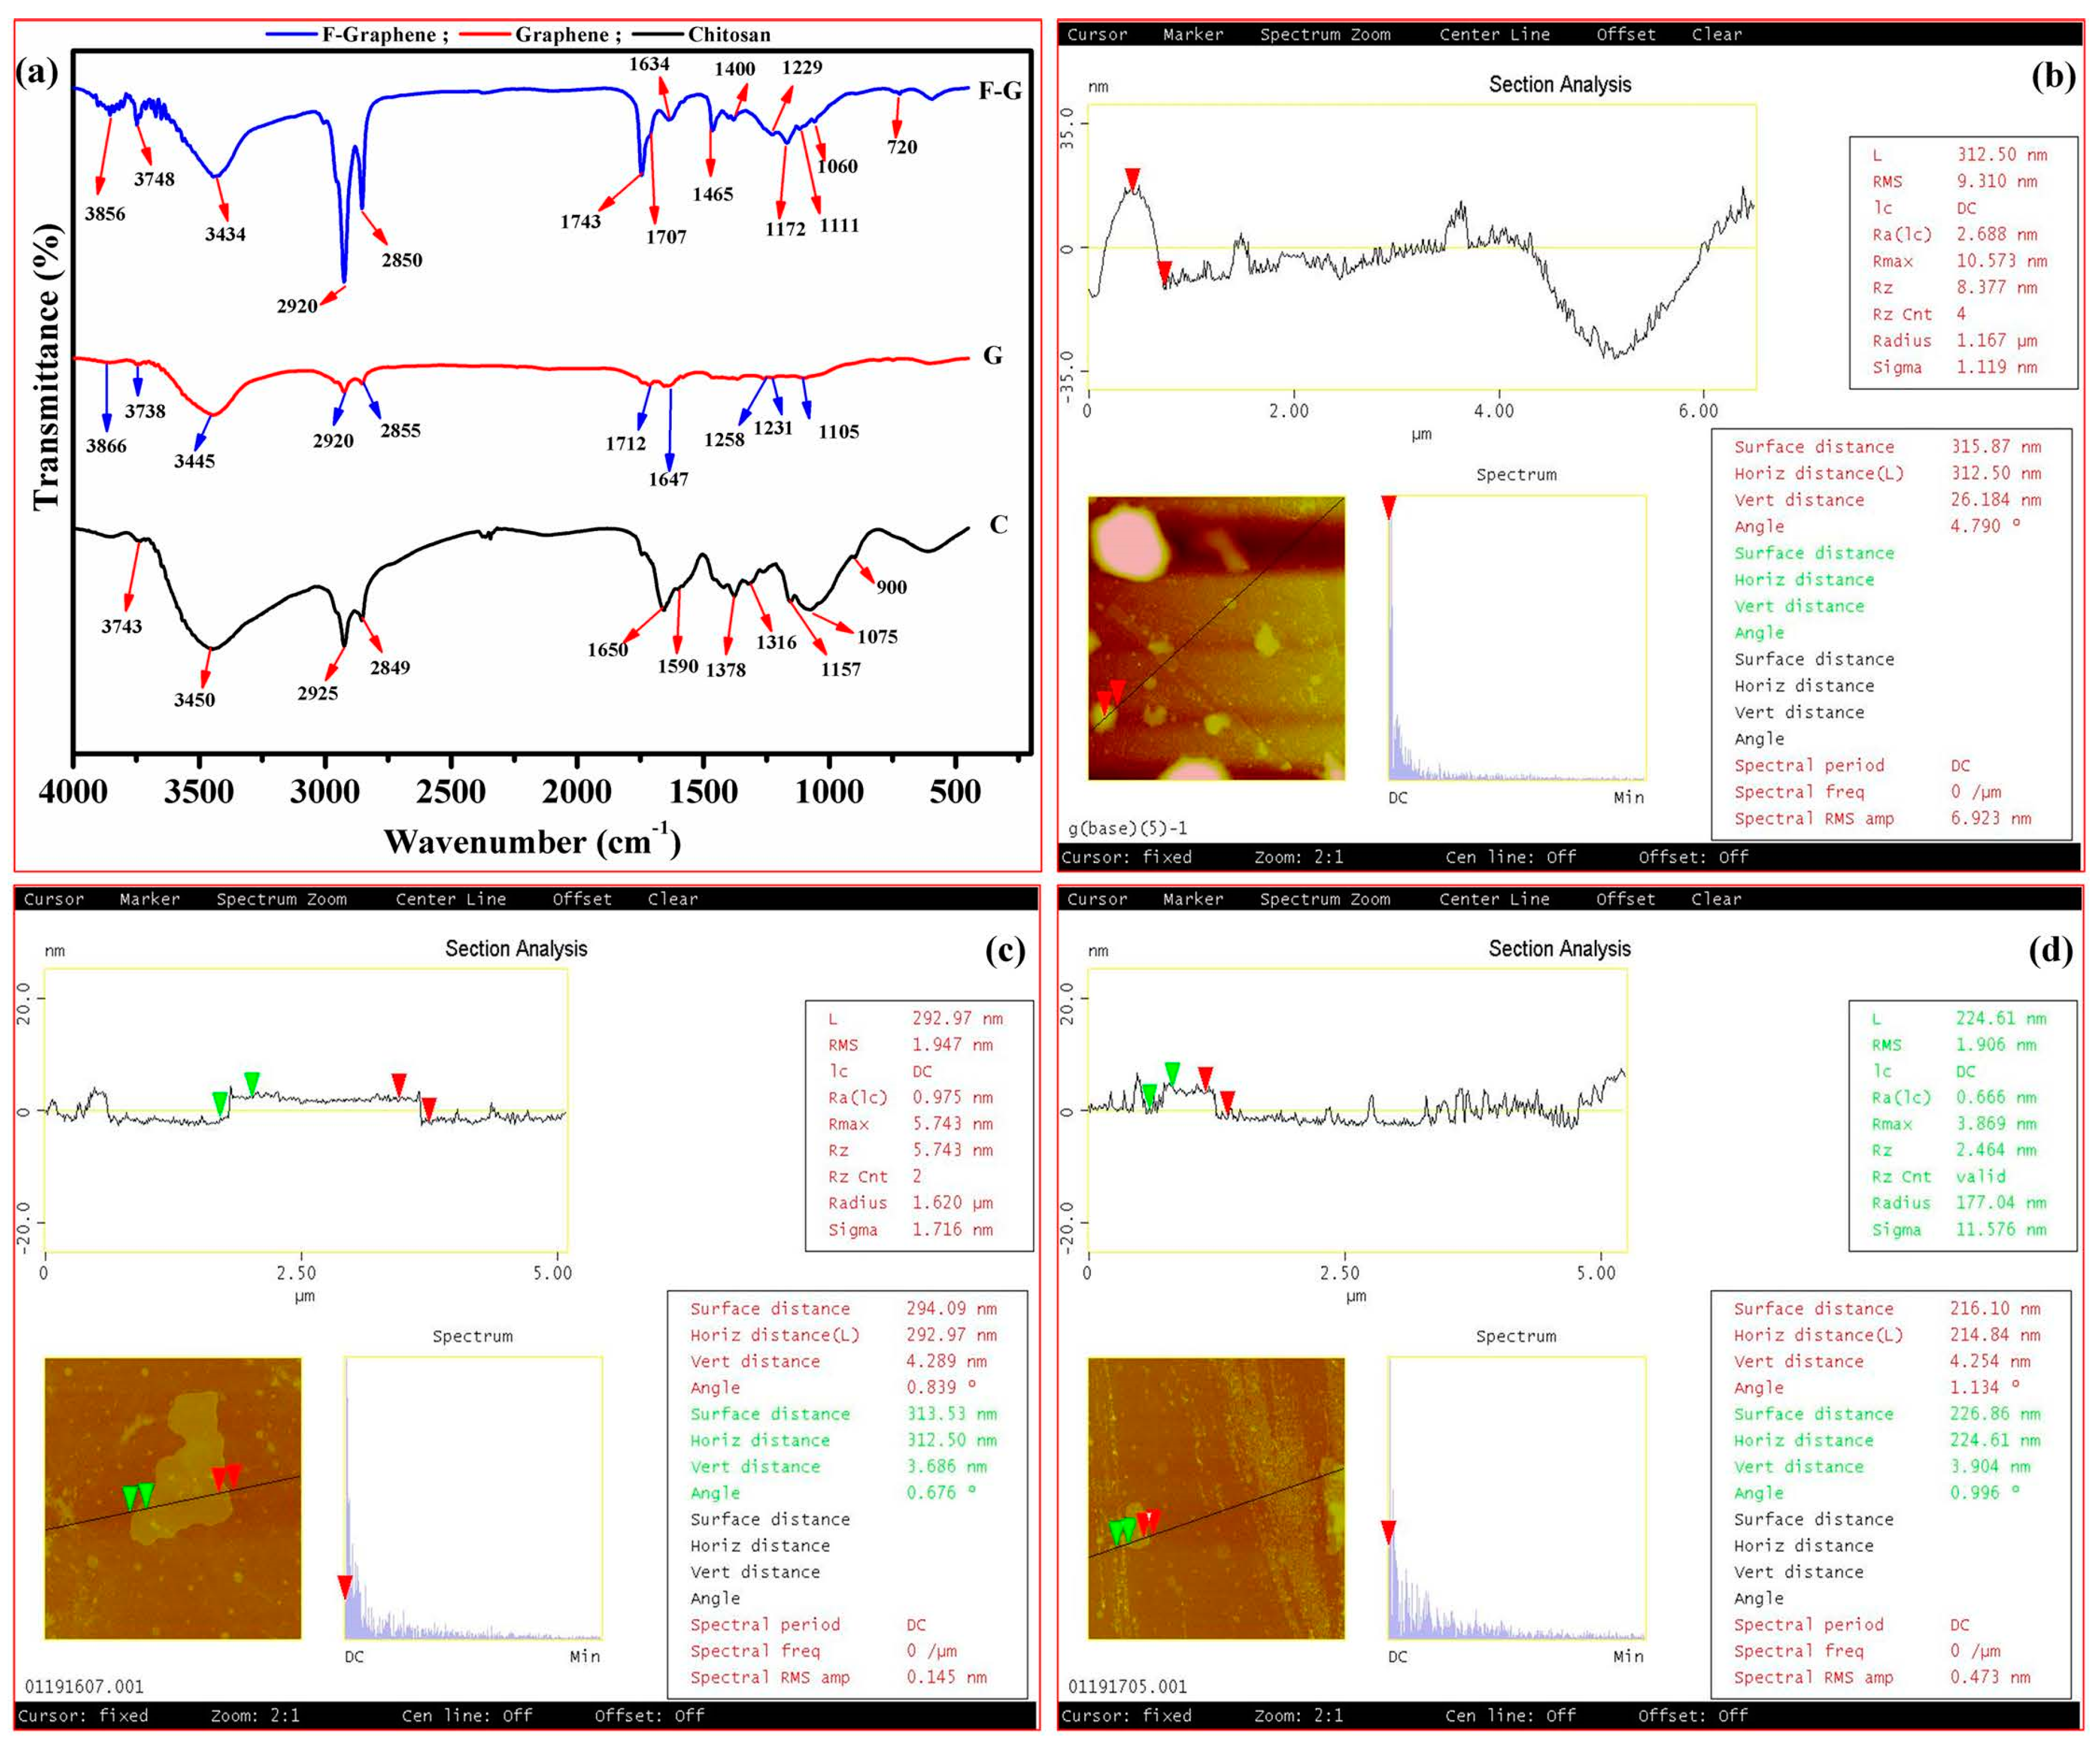
4.6. FTIR Spectroscopy

FTIR analysis was carried out using a PerkinElmer Frontier and Spectrum Two FTIR spectrophotometer. Very small amounts of the precursor nanomaterials were mixed and powdered with KBr to a very fine consistency. The powdered mixture was then transferred for making pellets and later analyzed between the wavelength ranges of 4000–400 cm−1. Figure 10a shows the spectrums of chitosan, graphene and the silane-functionalized graphene, respectively labelled with their prominent peaks, as identified using the corresponding literature. From the spectrum, it is clear that the graphene surface was completely oxidized and modified after functionalization. The emergence of peaks from 700 to 1200 cm−1 shows the presence of the vibration of silane moieties arising due to Si–O–Si and Si–O–C stretching vibrations. Apart from these, the changes in the peak position and the increase in the intensity of the carbon basal plane arising due to the stretching of the carbonyl and phenolic attachments in the form of (C=O), (C=C), (O–H), (C–O) and the methyl (–CH2) backbone imply that the surface treatment and functionalization of graphene was successful. Table 4 lists out the assignment of peaks along with their peak position of the respective spectrums in detail for a much more clear understanding.
Figure 10. (a) FTIR spectrum of chitosan, graphene and functionalized graphene along with their peak data; (b) AFM images and sectional analysis of graphene, (c) oxidized graphene and (d) functionalized graphene.
Polymers 07 00527 g010
Table 4. FTIR assignments of chitosan, graphene and functionalized graphene.
ChemicalPeak position (cm−1)AssignmentReference
Chitosan900Stretching of C–O from: C–O–H; symmetric and asymmetric stretch from C–O–C bridge[46]
1075Saccharide structure of chitosan and C–O stretching[47,48]
1157Saccharide structure of chitosan and anti-symmetric stretching from C–O–C bridge[47,48]
1316Acetyl Groups[49]
1378Amide III/C–H bending and stretching[50]
1590Amine (NH2) band bending vibration[51]
1650Carboxamide O=C–NHR[51]
2849(CH3) anti-symmetric and symmetric stretching vibrations[48]
2925(CH3) anti-symmetric and symmetric stretching vibrations[48]
3450–OH/––NH2 stretching[51]
3743–OH/–NH2 stretching[51]
Graphene1105C–O stretching[52]
1231C–OH stretching[52]
1258C–O asymmetric stretching[53]
1647C=C ring stretching[54]
1712C=O stretching arising from carbonyl and carboxylic groups[52]
2855–CH2[54]
2920–CH2[54]
3445–OH stretching[52]
3738–OH stretching[52]
3866–OH stretching[52]
f-Graphene720Si–O–Si[55]
1060Si–O–Si [52]
1111Si–O–C[52]
1172Si–O–Si[55]
1229C–OH stretching[52]
1400δ(O–H) basal plane CO–H[53]
1465υ(C=C), δ(O–H), υ(C–O)[53]
1634C=C ring stretching[54]
1707C=O stretching from carbonyl and carboxylic groups[52]
1743υ(C=O)[53]
2850–CH2[54]
2920–CH2[54]
3434–OH stretching[52]
3748–OH stretching[52]
3856–OH stretching[52]

4.7. Atomic Force Microscopy

The AFM image of the precursor materials are shown in Figure 10b–d, which represents graphene, o-graphene and f-graphene, respectively. All of these samples are devoid of chitosan. From the image (Figure 10b), we can observe the large layered mass of spherical particles, which are composed of several layers of graphene. The cross-sectional analysis of the smallest sample based on the contour shows an overall diameter of 315 nm with a vertical height of 26 nm. This implies that the material is composed of several graphene layers (~20–25). Upon oxidative treatment of the same sample, one can observe exfoliated graphene structures (Figure 10c) with a vertical height of 3–4 nm, which implies that the particle in focus is composed of the minimum layers of exfoliated and oxidized graphene (3–6 layers approximately). As one can also observe, the flat layered structure is clear and in the unwrapped (folding) state. Similarly, the f-graphene image (Figure 10d) shows a much smaller structure with a similar dimension surrounded by several other bright spherical particles, assumed to be the exfoliated f-graphene islands. The sectional analysis of the f-graphene particle shows that the material is well exfoliated with few contour readings, being just lower than the oxidized particle. Furthermore, this implies that the silane must have been incorporated on the surface of these open layers, thereby functionalizing the graphene. This surface activity between APTES and graphene can also be observed in the FTIR spectrums, which show the emergence of Si–O–Si peaks at 720, 1060 and 1172 cm−1.

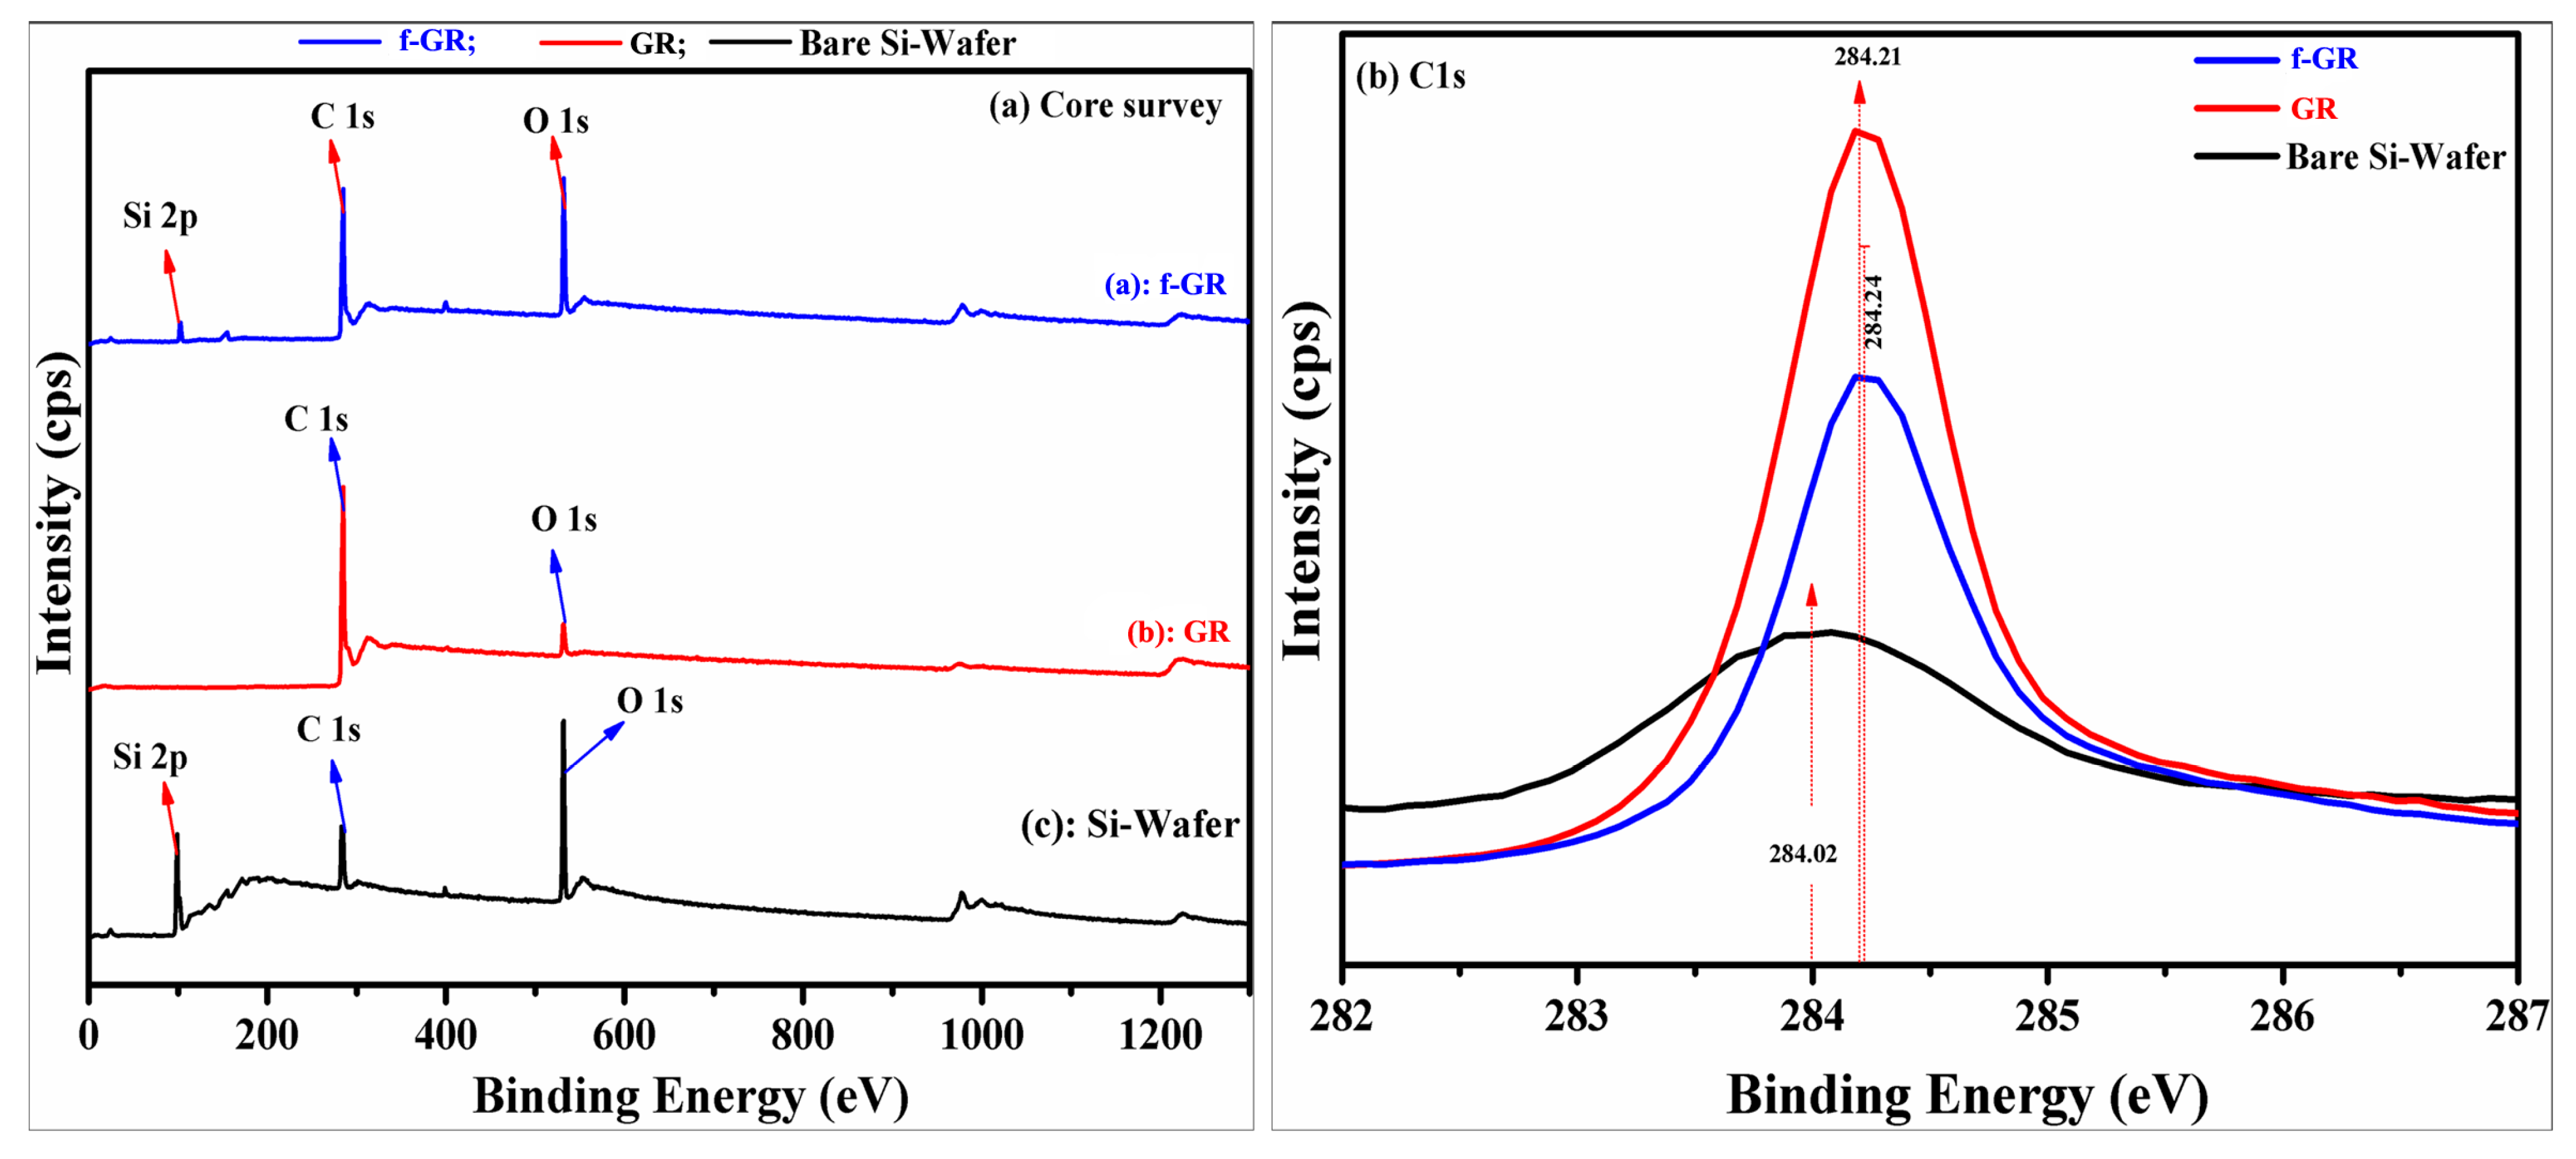
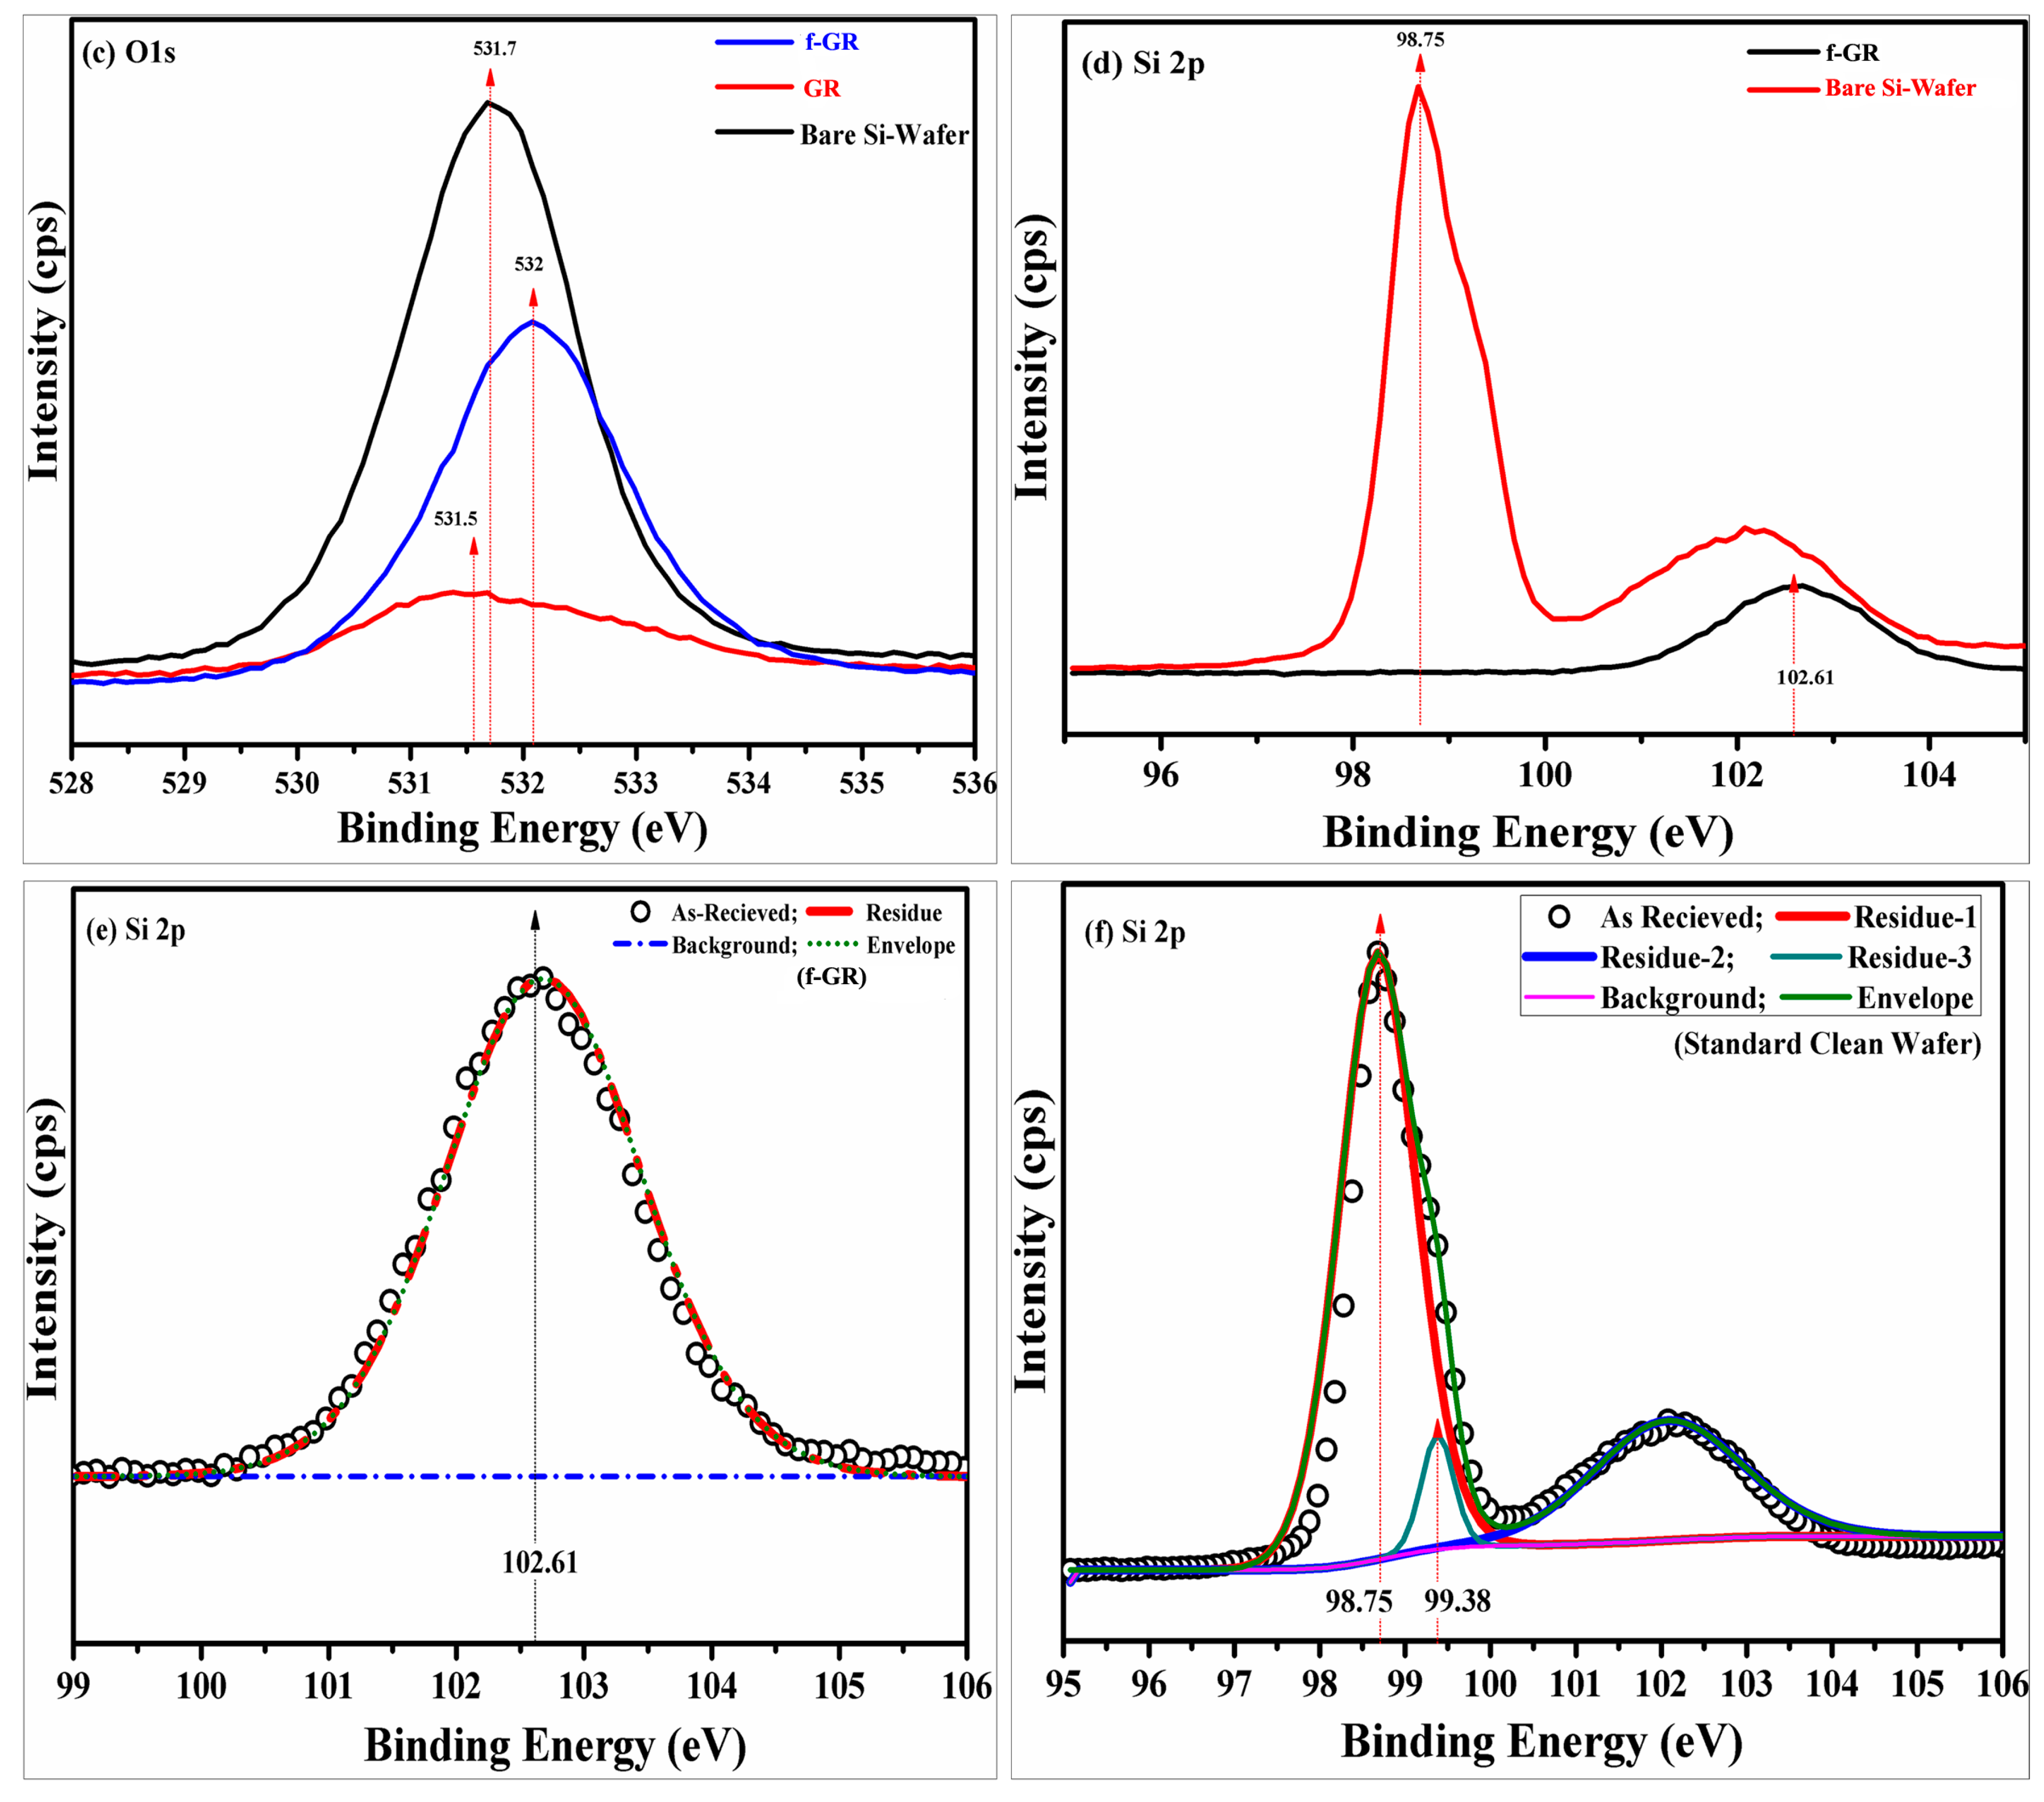
4.8. X-ray Photoelectron Spectroscopy

The elemental compositions of the samples were carried out using a K-Alpha XPS unit (Thermo Electron). The obtained results of all of the samples’ core survey and individual peak analysis are displayed in Figure 11. As observed from the graph, the peaks display their respective compositions with variable intensities of the elements in the core-level survey (Figure 11a). As for the case of f-graphene, the existence of Si-2p, C-1s and O-1s implies that the graphene surface was successfully oxidized and silanized using 3-APTES as a coupling agent. Moreover, the presence of C-1s and O-1s in the graphene sample shows that the surface oxidation using strong acids not only clears the surface of the loosely-bound gaseous moieties, but also removes the other impurities from the surface. Acid treatment to some extent also allows the graphene layers to get exfoliated due to the depreciation of ionic attraction and dehydration of hydroxyl and hydrogen atoms between the layers, which later, due to the effect of energetic waves (during ultra-sonication), are cleaved to 2–5 layers [56]. The separation of layers is also initiated by the acid molecules occupying the inter-lamellar space; this process is also observed in our SEM and Raman results and is in good agreement with [56]. As a standard measure, a pure, cleaned, ultrasonicated silicon wafer was analyzed as a blank in order to evaluate the type of oxidation of silicon present within the sample; this may also help us with evaluating the weight percentage of “Si” in our sample. On further analysis, the individual elemental analyses for C-1s, O-1s and Si-2p for all of the samples are displayed in Figure 11b–f, along with the spectral resolution of Si-2p, respectively. The existence of C-1s binding energy (BE) values of 284.21, 284.24 and 284.02 eV for graphene, f-graphene and bare Si-wafer denotes the presence of sp2 hybridized C=C/C–C bonds. This type of bond is highly prevalent in several nano carbons, including graphene and reduced graphene [57]. The presence of a carbon peak in Si-wafer is attributed to the impurities obtained during the cleaning of the wafer in ethanol and also the adsorption of organic moieties within the XPS instrument during the scanning procedure. A relatively higher intensity of the O-1s peak is observed (Figure 11c) for bare Si-wafer at 531.7eV, attributed to the formation of the Si–O bond resulting due to the oxidation of the wafer caused during the cleaning procedure. The formation of the Si–O and C=O bond for the case of F-graphene is also observed at the binding energy of 532 eV [57,58]. This combination of bonds also supports the formation of the Si–O–C and Si–O–Si interface within our sample, as reported earlier in the Raman section. The peak at 531.5 eV is attributed to the C=O moieties of graphene or graphene oxide in general [59]. The scan (Figure 11d) also reveals the distinct Si-2p peaks for F-graphene and Si-wafer. The wafer peak displays the standard representation of the Si-2p peak, which is attributed to the presence of elemental silicon (Si0) at 98.75 eV along with the characteristic of Si–O bonds [60,61] within the same binding energy. Similarly, a small bump between 101 and 104 eV is generally attributed to the formation of SiO2 during the oxidative treatment on the wafer. The existence of these two peaks in the wafer has often been found and reported by several researchers [61]. Similarly, the absence of a strong elemental peak position in f-graphene shows that the silicon within the sample exists in its oxidized state of SiOx (SiO or SiO2). The only dominant peak in F-graphene is found at a binding energy level of 102.61 eV, which is attributed to the Si–O bond [61], thus confirming the successful functionalization of the oxidized graphene using silane. The atomic percentage of the Si-2p is around 4% (±0.5%), which is found to be very close to the amount calculated during thermogravimetric analysis. A further analysis of the Si-2p using Gaussian peak fitting has revealed that the peak of f-graphene (Figure 11e) is a single derivative with all of the background and residue converging at a single peak point of 102.61 eV, which corresponds to the SiOx peak system; whereas the peak fitting results of wafer (Figure 11f) show the presence of a composite peak system with a small satellite peak observed at 99.38 eV. This peak corresponds to the presence of the pure elemental silicon (Si0) layer. However, it has been reported that more often, the Si0 with the SiO2 layer significantly gives such a splitting at this BE value [62], which is a signature characteristic of wafer oxidation.
Figure 11. X-ray photoelectron spectroscopy results of graphene, f-graphene and bare Si-wafer (cleaned): (a) complete core survey of samples; (b) C-1s spectra of raw graphene, f-graphene and bare Si-wafer samples; (c) O-1s spectra; (d) Si-2p spectra; (e) peak fitting of the Si-2p spectra of f-graphene; (f) peak fitting of the Si-2p spectra of standard, cleaned, bare Si-wafer. cps = counts per second.
Polymers 07 00527 g011aPolymers 07 00527 g011b

5. Conclusions

A successful silanization process was demonstrated, which showed improved the tensile and modulus properties over the raw and oxidized graphene-chitosan samples. Tensile tests were carried out on raw, oxidized and silane-functionalized graphene-reinforced chitosan nanocomposite films to infer the strength and modulus of the silane-functionalized composite film, which steadily increased by 11.4% and 16.6% respectively, which is far greater than the unmodified cases. Furthermore, the toughness of the silane-functionalized composite film was increased 1.7-times that of the unmodified case, as reported. These results show that silane functionalization groups offer increased interfacial reactivity between fillers and matrix. The same is also confirmed by SEM analysis. XRD analysis shows that the chitosan and graphene crystals are intermingled, resulting in a mixed pattern of peaks and Miller indices. The peaks are heterogeneous in nature, which depicts the presence of both crystalline phases of graphene and the amorphous phase of chitosan in the composite. Apart from these, the presence of amorphous silica (from silane) crystals confirms its contribution within the composite as a functionalization moiety, thus resulting in successful functionalization of particles within the host-matrix layers. The Raman spectrum also provided much deeper insights into the quality of the sample. The presence of chitosan and silica moieties along with graphene showed that, due to the effective oxidation, the presence of dangling bonds resulted in the capture/attraction of silane particles, thereby resulting in the formation of continuous linkages. These linkages additionally provide higher adhesion between the layers, making the composite even stronger. Similarly, the morphological analysis using SEM shows that the material surface changes after functionalization and also exhibits a typical brick wall structure (nacre like), thus implying the existence of cross-linkages within chitosan-graphene and also silane particles. Moreover the composite also shows clear and good dispersion between all of the particles of chitosan-graphene and silane; in a few images, one can also understand that the material is well coated with the chitosan, making the bonds even stronger, which directly helps with improving the physico-mechanical properties of the composites. Samples also exhibit excellent thermal stability and demonstrate that the nature of the composite is highly stable under extreme conditions, even up to 500 °C. Infrared spectroscopy revealed that surface of the f-graphene material is treated successfully with the presence of moieties/bonds of Si–O–Si and Si–O–C. As confirmed earlier with Raman analysis, this explains the formation of linkages within the composite. Furthermore, the topographical analysis carried out by AFM reveals that the graphene surface is successfully oxidized, and the presence of exfoliated sheets with a vertical height of 3–4 nm depicts that the oxidized graphene may be a stack of just 3–6 layers, whereas the f-graphene shows several small, contoured graphene particles along with the dispersed, oxidized silane particles across the background. Much insight was provided by XPS for the chemical quantification, which showed that the material is composed of nearly 4% (±0.5%) atomic weight of silicon, which shows that a very small amount of silane was washed away during the washing process and the remainder was successfully incorporated onto the surface, due to the activity of the open bonds available within the oxidized surface, thereby creating strong adhesion between the silane, graphene and chitosan particles when the composite was fabricated. Thus, in this work, an easy method has been developed to functionalize graphene with a silane agent and to study the effect in the improvement of the composite’s tensile behavior.

Acknowledgments

This work was financially supported by the National R&D project of “Development of Energy Utilization Technology of Deep Sea Water Resource” supported by the Ministry of Oceans and Fisheries of the Republic of Korea.

Author Contributions

Authors Dae Sung Kim planned out and executed the research work, Vivek Dhand helped in analysis and interpretation of the research work. Kyong Yop Rhee and Soo-Jin Park motivated and suggested the strategy and feasibility to carry out the experiment.

Conflicts of Interest

The authors declare no conflict of interest.

References

  1. Maksimov, R.D.; Ivanova, T.; Kalnins, M.; Zicans, J. Mechanical properties of high-density polyethylene/chlorinated polyethylene blends. Mech. Compos. Mater. 2004, 40, 331–340. [Google Scholar] [CrossRef]
  2. Stevanovic, D.; Lowe, A.; Kalyanasundaram, S.; Jar, P.Y.B.; Alego, V.O. Chemical and mechanical properties of vinyl-ester/ABS blends. Polymer 2002, 43, 4503–4514. [Google Scholar] [CrossRef]
  3. Guzmán de Villoria, R.; Miravete, A.; Cuartero, J.; Chiminelli, A.; Tolosana, N. Mechanical properties of SWNT/epoxy composites using two different curing cycles. Compos. B Eng. 2006, 37, 273–277. [Google Scholar]
  4. Kinoshita, H.; Kaizu, K.; Fukuda, M.; Tokunaga, H.; Koga, K.; Ikeda, K. Development of green composite consist of woodchip, bamboo fibers and biodegradable adhesive. Compos. B Eng. 2009, 40, 607–612. [Google Scholar] [CrossRef]
  5. Zhang, X.; Do, M.D.; Bilyk, A. Chemical modification of wheat-protein-based natural polymers: Formation of polymer networks with alkoxysilanes to modify molecular motions and enhance the material performance. Biomacromolecules 2007, 8, 1881–1889. [Google Scholar] [CrossRef] [PubMed]
  6. Kumar, G.; Bristow, J.F.; Smith, P.J.; Payne, G.F. Enzymatic gelation of the natural polymer chitosan. Polymer 2000, 41, 2157–2168. [Google Scholar] [CrossRef]
  7. Muzzarelli, R.A.A.; Boudrant, J.; Meyer, D.; Manno, N.; DeMarchis, M.; Paoletti, M.G. Current views of fungal chitin/chitosan, human chitinases, food preservation, glucans, pectins and inulin: A tribute to Henri Braconnot, precursor of the carbohydrate polymers science, on the chitin bicentennial. Carbohydr. Polym. 2012, 87, 995–1012. [Google Scholar] [CrossRef]
  8. Fernandes, S.C.M.; Freire, C.S.R.; Silvestre, A.J.D.; Neto, C.P.; Gandini, A.; Berglund, L.A.; Salmén, L. Transparent chitosan films reinforced with a high content of nanofibrillated cellulose. Carbohydr. Polym. 2010, 81, 394–401. [Google Scholar] [CrossRef]
  9. Muzazarelli, R.A.A.; Greco, F.; Busilacchi, A.; Sollazzo, V.; Gigante, A. Chitosan, hyaluronan and chondroitin sulfate in tissue engineering for cartilage regeneration: A review. Carbohydr. Polym. 2012, 89, 723–739. [Google Scholar] [CrossRef] [PubMed]
  10. Tang, C.; Chen, N.; Zhang, Q.; Wang, K.; Fu, Q.; Zhang, X. Preparation and properties of chitosan nanocomposites with nanofillers of different dimensions. Polym. Degrad. Stabil. 2009, 94, 124–131. [Google Scholar] [CrossRef]
  11. Venkatesan, J.; Kim, S.K. Chitosan composites for bone tissue engineering-an overview. Mar. Drugs 2010, 8, 2252–2266. [Google Scholar] [CrossRef] [PubMed]
  12. Chang, P.R.; Jian, R.; Zheng, P.; Yu, J.; Ma, X. Preparation and properties of glycerol plasticized-starch (GPS)/cellulose nanoparticle (CN) composites. Carbohydr. Polym. 2010, 79, 301–305. [Google Scholar] [CrossRef]
  13. Cai, X.; Tong, H.; Shen, X.; Chen, W.; Yan, J.; Hu, J. Preparation and characterization of homogeneous chitosan–polylactic acid/hydroxyapatite nanocomposite for bone tissue engineering and evaluation of its mechanical properties. Acta Biomater. 2009, 5, 2693–2703. [Google Scholar] [CrossRef] [PubMed]
  14. Darder, M.; Colilla, M.; Ruiz-Hitzky, E. Biopolymer−clay nanocomposites based on chitosan intercalated in montmorillonite. Chem. Mater. 2003, 15, 3774–3780. [Google Scholar] [CrossRef]
  15. Li, G.; Jiang, Y.; Huang, K.; Ding, P.; Chen, J. Preparation and properties of magnetic Fe3O4–chitosan nanoparticles. J. Alloy Compd. 2008, 466, 451–456. [Google Scholar] [CrossRef]
  16. Wang, S.; Shen, L.; Zhang, W.; Tong, Y. Preparation and mechanical pproperties of chitosan/carbon nanotubes composites. Biomacromolecules 2005, 6, 3067–3072. [Google Scholar] [CrossRef] [PubMed]
  17. Azeez, A.A.; Rhee, K.Y.; Park, S.J.; Kim, H.J.; Jung, D.H. Application of cryomilling to enhance material properties of carbon nanotube reinforced chitosan nanocomposites. Compos. B Eng. 2013, 50, 127–134. [Google Scholar] [CrossRef]
  18. Marroquin, J.B.; Rhee, K.Y.; Park, S.J. Chitosan nanocomposite films: Enhanced electrical conductivity, thermal stability, and mechanical properties. Carbohydr. Polym. 2013, 92, 1783–1791. [Google Scholar] [CrossRef] [PubMed]
  19. Sahoo, N.G.; Rana, S.; Cho, J.W.; Li, L.; Chan, S.H. Polymer nanocomposites based on functionalized carbon nanotubes. Prog. Poylm. Sci. 2010, 35, 837–867. [Google Scholar] [CrossRef]
  20. Kim, M.T.; Rhee, K.Y.; Lee, J.H.; Hui, D.; Lau, A.K.T. Property enhancement of a carbon fiber/epoxy composite by using carbon nanotubes. Compos. B Eng. 2011, 42, 1257–1261. [Google Scholar] [CrossRef]
  21. Liu, X.; He, X.Q.; Yang, Q.S.; Mai, Y.W. Overall behavior and microstructural deformation of R-CNT/polymer composites. Compos. B Eng. 2011, 42, 2123–2129. [Google Scholar] [CrossRef]
  22. Nayak, T.R.; Jian, L.; Phua, L.C.; Ho, H.K.; Ren, Y.; Pastorin, G. Thin films of functionalized multiwalled carbon nanotubes as suitable scaffold materials for stem cells proliferation and bone formation. ACS Nano 2010, 4, 7717–7725. [Google Scholar] [CrossRef] [PubMed]
  23. Malarkey, E.B.; Fisher, K.A.; Bekyarova, E.; Liu, W.; Haddon, R.C.; Parpura, V. Conductive single-walled carbon nanotube substrates modulate neuronal growth. Nano Lett. 2009, 9, 264–268. [Google Scholar] [CrossRef] [PubMed]
  24. Murphy, R.; Coleman, J.N.; Cadek, M.; McCarthy, B.; Bent, M.; Drury, A.; Barklie, R.C.; Blau, W.J. High-yield, nondestructive purification and quantification method for multiwalled carbon nanotubes. J. Phys. Chem. B 2002, 106, 3087–3091. [Google Scholar] [CrossRef]
  25. Lau, C.; Cooney, M.J. Conductive macroporous composite chitosan−carbon nanotube scaffolds. Langmuir 2008, 24, 7004–7010. [Google Scholar] [CrossRef] [PubMed]
  26. Geim, A.K.; Novoselov, K.S. The rise of graphene. Nat. Mater. 2007, 6, 183–191. [Google Scholar] [CrossRef] [PubMed]
  27. Rao, C.N.R.; Sood, A.K.; Subrahmanyam, K.S.; Govindaraj, A. Graphene: The new two-dimensional nanomaterial. Angew. Chem. Ed. 2009, 48, 7752–7777. [Google Scholar] [CrossRef]
  28. Stankovich, S.; Dikin, D.A.; Dommett, G.H.B.; Kohlhaas, K.M.; Zimney, E.J.; Stach, E.A.; Piner, R.D.; Nguyen, S.T.; Ruoff, R.S. Graphene-based composite materials. Nature 2006, 442, 282–286. [Google Scholar] [CrossRef] [PubMed]
  29. Potts, J.R.; Dreyer, D.R.; Bielawski, C.W.; Ruoff, R.S. Graphene-based polymer nanocomposites. Polymer 2011, 52, 5–25. [Google Scholar] [CrossRef]
  30. Eda, G.; Chhowalla, M. Graphene-based composite thin films for electronics. Nano Lett. 2009, 9, 814–818. [Google Scholar] [CrossRef] [PubMed]
  31. Das, B.; Prasad, K.E.; Ramamurty, U.; Rao, C.N.R. Nano-indentation studies on polymer matrix composites reinforced by few-layer graphene. Nanotechnology 2009, 20. [Google Scholar] [CrossRef] [PubMed]
  32. Prasad, K.E.; Das, B.; Maitra, U.; Ramamurty, U.; Rao, C.N.R. Extraordinary synergy in the mechanical properties of polymer matrix composites reinforced with 2 nanocarbons. Proc. Natl. Acad. Sci. USA 2009, 106, 13186–13189. [Google Scholar] [CrossRef] [PubMed]
  33. Guo, J.; Ren, L.; Wang, R.; Zhang, C.; Yang, Y.; Liu, T. Water dispersible graphene noncovalently functionalized with tryptophan and its poly(vinyl alcohol) nanocomposite. Compos. B Eng. 2011, 42, 2130–2135. [Google Scholar] [CrossRef]
  34. Lee, J.H.; Marroquin, J.; Rhee, K.Y.; Park, S.J.; Hui, D. Cryomilling application of graphene to improve material properties of graphene/chitosan nanocomposites. Compos. B Eng. 2013, 45, 682–687. [Google Scholar] [CrossRef]
  35. Hummers, W.S., Jr.; Offeman, R.E. Preparation of graphitic oxide. J. Am. Chem. Soc. 1958, 80. [Google Scholar] [CrossRef]
  36. Kathi, J.; Rhee, K.Y. Surface modification of multi-walled carbon nanotubes using 3-aminopropyltriethoxysilane. J. Mater. Sci. 2008, 43, 33–37. [Google Scholar] [CrossRef]
  37. Ma, P.C.; Kim, J.K.; Tang, B.Z. Functionalization of carbon nanotubes using a silane. Carbon 2006, 44, 3232–3238. [Google Scholar] [CrossRef]
  38. Nebogatikova, N.A.; Antonova, I.V.; Volodin, V.A.; Prinz, V.Y. Functionalization of graphene and few-layer graphene with aqueous solution of hydrofluoric acid. Phys. E 2013, 52, 106–111. [Google Scholar] [CrossRef]
  39. Okpalugo, T.I.T.; Papakonstantinou, P.; Murphy, H.; Mclaughlin, J.; Brown, N.M.D. Oxidative functionalization of carbon nanotubes in atmospheric pressure filamentary dielectric barrier discharge (APDBD). Carbon 2005, 43, 2951–2959. [Google Scholar] [CrossRef]
  40. Saidi, W.A.; Norman, P. Probing single-walled carbon nanotube defect chemistry using resonance Raman spectroscopy. Carbon 2014, 67, 17–26. [Google Scholar] [CrossRef]
  41. Zając, A.; Hanuza, J.; Wandas, M.; Dymińska, L. Determination of N-acetylation degree in chitosan using Raman spectroscopy. Spectrochim. Acta Mol. Biomol. Spectros. 2015, 134, 114–120. [Google Scholar] [CrossRef]
  42. Sundar, S.; Mariappan, R.; Piraman, S. Synthesis and characterization of amine modified magnetite nanoparticles as carriers of curcumin-anticancer drug. Powder Technol. 2014, 266, 321–328. [Google Scholar] [CrossRef]
  43. Gui, M.M.; Yap, Y.X.; Chai, S.P.; Mohamed, A.R. Multi-walled carbon nanotubes modified with (3-aminopropyl)triethoxysilane for effective carbon dioxide adsorption. Int. J. Greenh. Gas Control 2013, 14, 65–73. [Google Scholar] [CrossRef]
  44. Hiraoui, M.; Guendouz, M.; Lorrain, N.; Moadhen, A.; Haji, L.; Oueslati, M. Spectroscopy studies of functionalized oxidized porous silicon surface for biosensing applications. Mater. Chem. Phys. 2011, 128, 151–156. [Google Scholar] [CrossRef]
  45. Gunda, N.S.K.; Singh, M.; Norman, L.; Kaur, K.; Mitra, S.K. Optimization and characterization of biomolecule immobilization on silicon substrates using (3-aminopropyl)triethoxysilane (APTES) and glutaraldehyde linker. Appl. Surf. Sci. 2014, 305, 522–530. [Google Scholar] [CrossRef]
  46. John, A.; Liu, F.; Majeed, H.; Zhong, F. Characterization of tara gum edible films incorporated with bulk chitosan and chitosan nanoparticles: A comparative study. Food Hydrocoll. 2015, 44, 309–319. [Google Scholar] [CrossRef]
  47. Boonsongrit, Y.; Mueller, B.W.; Mitrevej, A. Characterization of drug–chitosan interaction by 1H NMR, FTIR and isothermal titration calorimetry. Eur. J. Pharm. Biopharm. 2008, 69, 388–395. [Google Scholar] [CrossRef] [PubMed]
  48. Rubentheren, V.; Ward, T.A.; Chee, C.Y.; Tang, C.K. Processing and analysis of chitosan nanocomposites reinforced with chitin whiskers and tannic acid as a crosslinker. Carbohydr. Polym. 2015, 115, 379–387. [Google Scholar] [CrossRef] [PubMed]
  49. Kumar, A.B.V.; Varadaraj, M.C.; Gowda, L.R.; Tharanathan, R.N. Characterization of chito-oligosaccharides prepared by chitosanolysis with the aid of papain and Pronase, and their bactericidal action against Bacillus cereus and Escherichia coli. Biochem. J. 2005, 391, 167–175. [Google Scholar] [CrossRef] [PubMed]
  50. Luo, W.B.; Han, Z.; Zeng, X.; Yu, S.J.; Kennedy, J.F. Study on the degradation of chitosan by pulsed electric fields treatment. Innov. Food Sci. Emerg. 2010, 11, 587–591. [Google Scholar] [CrossRef]
  51. Kadir, M.F.Z.; Aspanut, Z.; Majid, S.R.; Arof, A.K. FTIR studies of plasticized poly(vinyl alcohol)–chitosan blend doped with NH4NO3 polymer electrolyte membrane. Spectrochim. Acta Mol. Biomol. Spectros. 2011, 78, 1068–1074. [Google Scholar] [CrossRef]
  52. Wan, Y.J.; Gong, L.X.; Tang, L.C.; Wu, L.B.; Jiang, J.X. Mechanical properties of epoxy composites filled with silane-functionalized graphene oxide. Compos. A Appl. Sci. Manuf. 2014, 64, 79–89. [Google Scholar] [CrossRef]
  53. Frogley, M.D.; Wang, C.; Cinque, G.; Barber, A.H. Polarised infrared microspectroscopy of edge-oriented graphene oxide papers. Vib. Spectrosc. 2014, 75, 178–183. [Google Scholar] [CrossRef] [Green Version]
  54. Dato, A.; Lee, Z.; Jeon, K.J.; Erni, R.; Radmilovic, V.; Richardsonc, T.J.; Frenklach, M. Clean and highly ordered graphene synthesized in the gas phase. Chem. Commun. 2009, 40, 6095–6097. [Google Scholar] [CrossRef]
  55. Zhou, Z.; Wang, S.; Lu, L.; Zhang, Y.; Zhang, Y. Functionalization of multi-wall carbon nanotubes with silane and its reinforcement on polypropylene composites. Compos. Sci. Technol. 2008, 68, 1727–1733. [Google Scholar] [CrossRef]
  56. Hong, Y.; Wang, Z.; Jin, X. Sulfuric acid intercalated graphite oxide for graphene preparation. Sci. Rep. 2013, 3. [Google Scholar] [CrossRef] [PubMed]
  57. Szwarckopf, H.E. XPS photoemission in carbonaceous materials: A “defect” peak beside the graphitic asymmetric peak. Carbon 2004, 42, 1713–1721. [Google Scholar] [CrossRef]
  58. Lesiak, B.; Stobinski, L.; Malolepszy, A.; Mazurkiewicz, M.; Kövér, L.; Tóth, J. Preparation of graphene oxide and characterisation using electron spectroscopy. J. Electron. Spectrosc. Relat. Phenom. 2014, 193, 92–99. [Google Scholar] [CrossRef]
  59. Hong, W.G.; Kim, B.H.; Lee, S.M.; Yu, H.Y.; Yun, Y.J.; Jun, Y.; Lee, J.B.; Kim, H.J. Agent-free synthesis of graphene oxide/transition metaloxide composites and its application for hydrogen storage. Int. J. Hydrog. Energy 2012, 37, 7594–7599. [Google Scholar] [CrossRef]
  60. Vitale, A.; Pollicino, A.; Bernardi, E.; Bongiovanni, R. Ultrathin perfluoropolyether coatings for silicon wafers: A XPS study. Prog. Org. Coat. 2015, 78, 480–487. [Google Scholar] [CrossRef]
  61. Sun, Y.N.; Feldman, A.; Farabaugh, E.N. X-ray photoelectron spectroscopy of O 1s and Si 2p lines in films of SiOx formed by electron beam evaporation. Thin Solid Films 1988, 157, 351–360. [Google Scholar] [CrossRef]
  62. Barr, T.L. An XPS study of Si as it occurs in adsorbents, catalysts, and thin films. Appl. Surf. Sci. 1983, 15, 1–35. [Google Scholar] [CrossRef]

