Article

Thermal, Mechanical and UV-Shielding Properties of Poly(Methyl Methacrylate)/Cerium Dioxide Hybrid Systems Obtained by Melt Compounding

by
María A. Reyes-Acosta
1,
Aidé M. Torres-Huerta
1,*,
Miguel A. Domínguez-Crespo
1,
Abelardo I. Flores-Vela
2,
Héctor J. Dorantes-Rosales
3 and
José A. Andraca-Adame
4
1
Instituto Politécnico Nacional, CICATA-Altamira, Km 14.5 Carretera Tampico-Puerto Industrial Altamira, C.P. 89600 Altamira, Tamps. Mexico
2
Instituto Politécnico Nacional, CMP+L, Av. Acueducto s/n, Barrio La Laguna, Col. Ticomán, C.P. 07340, México D.F., Mexico
3
Instituto Politécnico Nacional, ESIQIE, Departamento de Metalurgia, C.P. 07738 México D.F., Mexico
4
Instituto Politécnico Nacional, CNMN, Av. Luis Enrique Erro S/N, Unidad Profesional Adolfo López Mateos, Zacatenco, C.P. 07738, México D.F., Mexico
*
Author to whom correspondence should be addressed.
Polymers 2015, 7(9), 1638-1659; https://doi.org/10.3390/polym7091474
Submission received: 30 June 2015 / Revised: 14 August 2015 / Accepted: 29 August 2015 / Published: 7 September 2015

Abstract

:
Thick and homogeneous hybrid film systems based on poly(methyl methacrylate) (PMMA) and CeO2 nanoparticles were synthesized using the melt compounding method to improve thermal stability, mechanical and UV-shielding properties, as well as to propose them for use in the multifunctional materials industry. The effect of the inorganic phase on these properties was assessed by using two different weight percentages of synthesized CeO2 nanoparticles (0.5 and 1.0 wt %) with the sol–gel method and thermal treatment at different temperatures (120, 235, 400, 600 and 800 °C). Thereafter, the nanoceria powders were added to the polymer matrix by single screw extrusion. The absorption in the UV region was increased with the crystallite size of the CeO2 nanoparticles and the PMMA/CeO2 weight ratio. Due to the crystallinity of CeO2 nanoparticles, the thermal, mechanical and UV-shielding properties of the PMMA matrix were improved. The presence of CeO2 nanostructures exerts an influence on the mobility of PMMA chain segments, leading to a different glass transition temperature.

Graphical Abstract

1. Introduction

In the last years, there has been an increased tendency to use thermoplastic polymers such as polycarbonate (PC), polymethylmethacrylate (PMMA) and polyethylene-tetrafluoroethylene (PTFE) in diverse industrial applications due to their low weight and high transparency [1,2]. PMMA is one of the most commonly used thermoplastic polymers in the construction industry because of its excellent optical properties (it transmits light in the 360–1000 nm range almost without loss [3]), impact and shatter properties (compared to inorganic glass), and relatively high weathering resistances. In addition, PMMA polymer has very low thermal conductivity (~0.0012 cal/s cm K), which makes it a candidate to be used as a thermal-control interface material [4,5]. Unfortunately, PMMA and other polymers decompose or degrade under solar UV radiation (200–400 nm) [6]. The most damaging natural UV radiation is between 290 and 350 nm where the highest energy of the solar spectrum occurs [7]. The usage of inorganic UV absorbers can be a good alternative for the stability of thermoplastic polymers under weather conditions. Wide band-gap oxides such as titanium dioxide (TiO2) and zinc oxide (ZnO) have been added as inorganic fillers into the PMMA matrix in order to modify its optical properties in the UV region [8,9,10,11,12]. As one of the most versatile semiconductors, cerium dioxide (CeO2) can be used as a solar absorber. CeO2 has shown good thermal and chemical stabilities, a high refractive index in the visible region (2.1–2.2), good transmittance in the visible spectrum and low cost due to the fact that it is one of the most abundant rare earth elements [13,14,15]. It has also potential applications such as in fuel and solar cells, catalysts, oxygen sensors, polishing agents, gate oxides, optical devices and coating materials [16,17,18]. Moreover, due to its broad band gap (BG) of 2.7–3.4 eV, depending on the preparation method, effective absorption in the ultraviolet range can be ensured by this material (λ < 400 nm) [7,19]. The incorporation of UV-shielding-nano CeO2 into the PMMA polymer matrix can produce functional nanocomposites, which can be a better way of making effective solar-thermal-control-interface structures for delaying polymer degradation. Different techniques have been used for the preparation of CeO2, including coprecipitation, microemulsion, microwave-assisted thermal decomposition, combustion synthesis, and mechanochemical, sol–gel, hydrothermal, solvothermal and electrochemical methods [20,21,22]. Among them, the sol–gel method has been widely used because it allows the synthesis of ultrafine powders with well-controlled properties such as homogeneity, purity, microstructure, particle size, and morphology, at relatively low cost [7,23,24,25,26].
Based on the above, it is clear that the development of an interface displaying superior UV-NIR shielding for degradation control without losing its mechanical properties is in high demand. Recently, the use of PMMA/CeO2 nanocomposites in the synthesis of a core/shell structure via the electrostatic interaction and polysiloxane@CeO2 microspheres with multifunctional properties has been reported [13,27], but until now the effects of the crystallinity and amount of CeO2 nanoparticles on the thermal stability, mechanical and UV-NIR-shielding properties of these structures have not been reported. In this paper, the preparation and characterization of UV-protective coatings composed of sol–gel-derived CeO2 nanoparticles and dispersed in a PMMA polymer matrix by single screw extrusion are reported. The effect of different thermal treatments (120, 235, 400, 600 and 800 °C), crystallite sizes and nanoceria contents (0.5 and 1.0 wt %) on the optical, thermal and mechanical properties of PMMA are studied in detail.

2. Experimental Section

2.1. Materials and Synthesis of CeO2 Nanoparticles

CeO2 nanoparticles were synthesized using the sol–gel method starting from cerium nitrate hexahydrate (Ce(NO3)3·6H2O, Aldrich, ≥98%, St. Louis, MS, USA) as precursor and ethanol (CH3CH2OH, Aldrich 99.5%, St. Louis, MS, USA) as solvent, using the following procedure: cerium nitrate was mixed with ethanol (0.3 M) at room temperature while it was vigorously stirred by means of a magnetic stirrer for 2 h to yield a stable and transparent sol without precipitation or turbidity. The pH was fairly constant during the synthesis process (pH ≈ 6). The CeO2 powders were obtained by gelification of the solutions and the gels drying at 120 °C for 24 h to remove organic matter; afterwards, the xerogel samples were ground in an agate mortar and then thermally treated in air at 235, 400, 600 and 800 °C for 2 h to study the structure and particle size effects. Finally, the powders were crushed by a horizontal ball mill at 350 rpm for 10 h. As is well known, the particle size distribution depends on various factors such as synthesis method, process parameters and in this case thermal treatment. Thus, the milling process was only used to uniform the particle size in each experiment before to obtain nanocomposites.

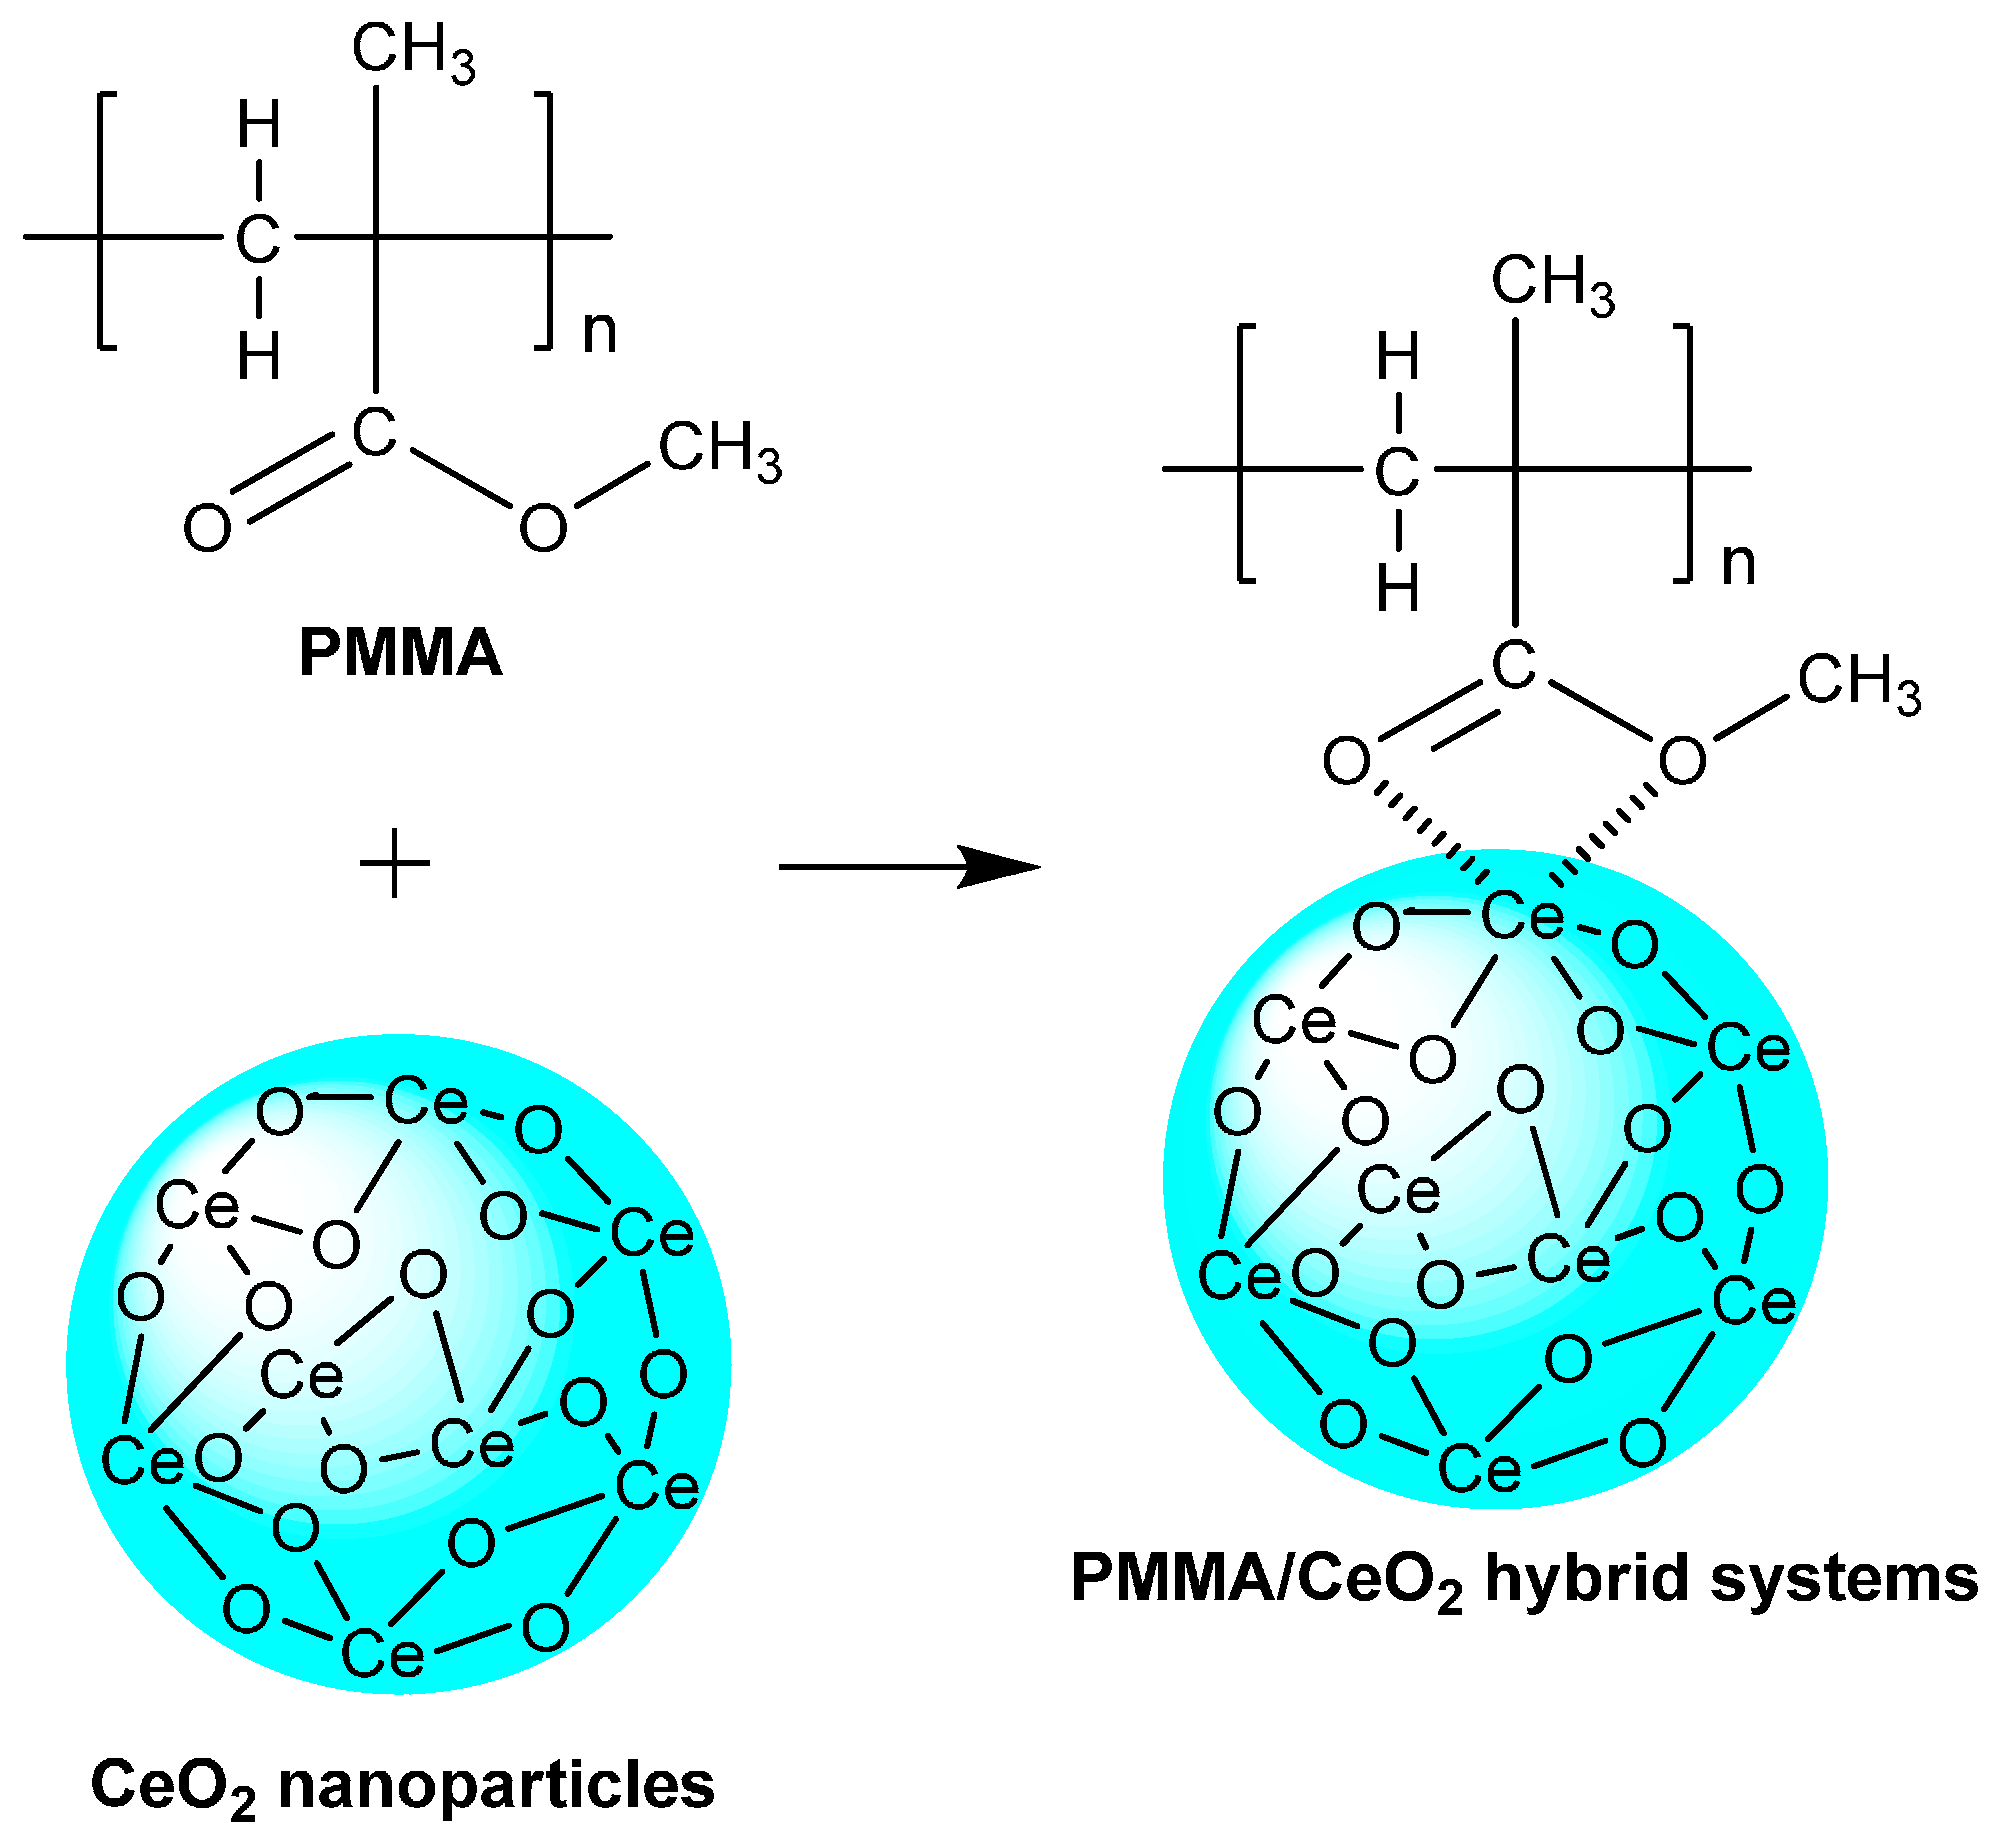
2.2. Preparation of Hybrid Systems

Commercial grade PMMA pellets (Plexiglas V825, Altuglas International, Arkema, Philadelphia, PA, USA) were used as raw material in this study. As first step, PMMA pellets were ground in a Thomas Wiley laboratory mill (Arthur H. Thomas Co., Philadelphia, PA, USA) using a 2 mm sieve to obtain fine particles. Thereafter, the polymeric particles were dried at 80 °C for 1 h before being processed. PMMA/CeO2 hybrid systems were prepared by using a laboratory single-screw extruder (D = 19 mm, L/D = 30 mm) with three heating zones. Two different amounts of CeO2 nanostructures (0.5 and 1.0 wt %) were added to the polymer matrix. The extruder blending temperature profiles were 235 and 240 °C from hopper to die zone, and the screw rotating speed was 80 rpm; finally, nanocomposite films extrudates were cooled in a water bath at room temperature. For comparison during the characterizations and performance of nanocomposites, pure PMMA were ground and extruded under the same process conditions.

2.3. Characterization and Measurements

The IR spectra of the CeO2 nanoparticles and PMMA/CeO2 hybrid systems were obtained within wavenumbers ranging from 4000 to 450 cm−1 using a Spectrum One Perkin-Elmer spectrometer (Perkin-Elmer Life and Analytical Sciences, Bridgeport, CT, USA). Transmission IR experiments were carried out under environmental conditions with 10 scans at a resolution of 4 cm−1. To determinate the interaction between the organic and inorganic phases, 1H NMR and 13C NMR spectra were carried out using a Bruker Ascend 750 (750 MHz) NMR spectrometer for liquids (Bruker Instruments, Inc., Billerica, MA, USA) at room temperature with deuterated chloroform (CDCl3, 1H: δ = 7.26 ppm, 13C: δ = 77.0 ppm, Sigma-Aldrich, 99.96%, St. Louis, MS, USA) as solvent and tetramethylsilane (TMS, δ = 0.00 ppm, Sigma-Aldrich, NMR grade, ≥99.9%, St. Louis, MS, USA) as the internal reference. Crystalline phase identification of the CeO2 powders and nanocomposites was performed using a D8 Advance Bruker X-ray diffractometer (Bruker AXS GmbH, Berlin, Germany) with Cu-Kα monochromatic radiation (Bruker AXS GmbH, Berlin, Germany). The XRD patterns were collected in the 2θ range from 10 to 90° at room temperature. CeO2 nanoparticles were examined by TEM using a JEOL-2000 FX-II microscope (JEOL Ltd., Akishima, Japan) coupled with an energy dispersive X-ray spectrometer (EDS, JEOL Ltd., Akishima, Japan) operating at 200 kV. Particle size distributions (PSD) were determined with a Malvern Zetasizer Nano ZSP (model ZEN5600, Malvern Instruments Ltd., Malvern Worcs, UK) by the dynamic light scattering (DLS) technique. A 12-mm round-aperture-glass cell (PCS8501, Malvern Instruments Ltd., Malvern Worcs, UK) was used for the DLS measurements. One milliliter of methanol dispersion sonicated for 5 min was added to the cell. The suitable refractive index was chosen for the CeO2 samples and dispersant: 2.2 and 1.33, respectively. The distribution of nanoparticles within the polymer was observed by confocal laser scanning microscopy (CLSM) using a Carl ZEISS microscope (Carl Zeiss, Jena, Germany), LSM 700 model and high resolution scanning electron microscope (HRSEM) using a JEOL JSM-6701-F microscope (JEOL Ltd., Akishima, Japan). The fluorescence intensity measurements were performed using the built-in software ZEN of the LSM 710. The intensity peaks, characteristic of a fluorescence emission signal, were 461 nm for PMMA and 539 nm for the CeO2 nanoparticles. The optical properties of the CeO2 nanoparticles were analyzed by diffuse reflectance UV-vis spectroscopy using a Cary 5000 spectrophotometer (Agilent Technologies Inc., Santa Clara, CA, USA) with an Internal Diffuse Reflectance accessory (DR) consisting of a 110-mm-diameter-integrating sphere. Data were collected at a 600 nm/min scan rate with a data interval of 1.0 nm and signal-averaging time of 0.1 s in the 700–200 nm range. The optical transmission of the PMMA/CeO2 hybrid systems was measured in the 200–1100 nm wavelength range using the same spectrometer. The thickness of the analyzed samples was about 0.5 mm. TGA studies were carried out using a Simultaneous Thermal Analyser Labsys Evo 1600 (SETARAM Instrumentation, Caluire, France). Samples were placed in aluminum crucibles. An empty aluminum crucible was used as reference. The heating ramp applied to the samples was from 25 to 450 °C at a constant heating rate of 5 °C/min under argon atmosphere. The nanoindentation data were analyzed with the CSM Instruments Nanoindentation Tester (TTX-NHT) with a Berkovich triangular diamond pyramid indenter (CSM Instruments SA, Peseux, Switzerland). Five indents were made in each sample. A loading rate of 15 mN/min was maintained until reaching a maximum load of 5 mN. The load was held at maximum value for 10 s. The hardness (HIT), Vickers hardness (HVIT), elastic modulus (EIT) and creep (CIT) were estimated from the initial gradient of the unloading curves using the Oliver and Pharr method [28].

3. Results and Discussion

3.1. Characterization of CeO2 Nanopowders

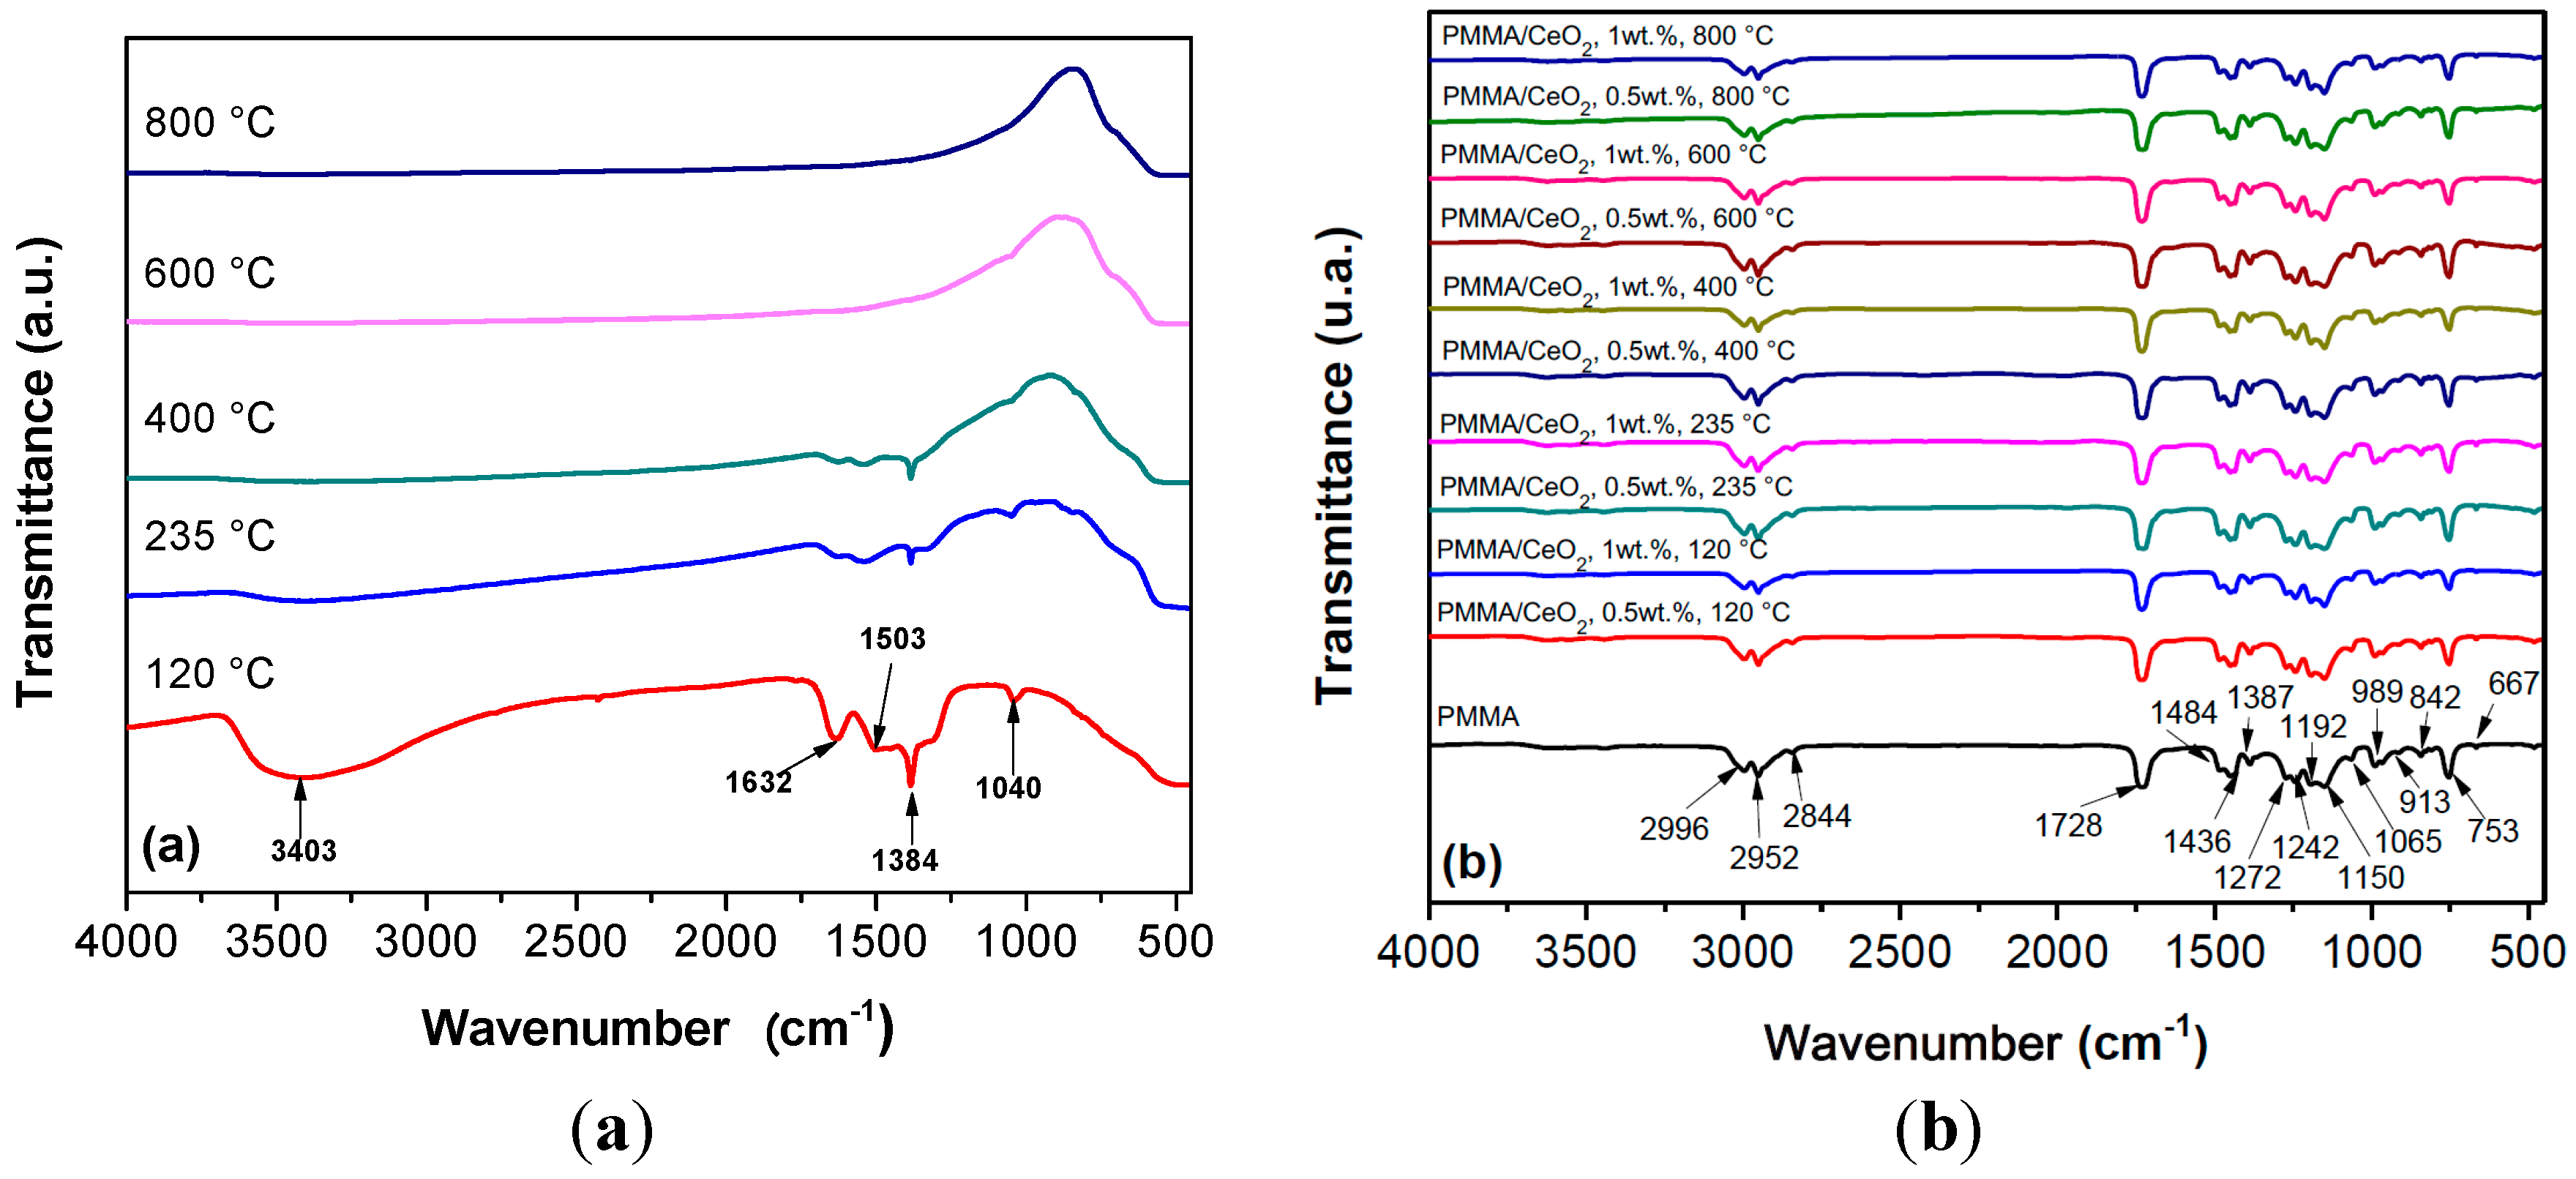
3.1.1. FT-IR Analysis

The FT-IR spectra of CeO2 nanoparticles thermally treated at different temperatures (400, 600 and 800 °C) are shown in Figure 1a. As a reference, FT-IR results for CeO2 particles dried at 120 °C and thermally-treated at 235 °C were included in the figure. The spectrum of the CeO2 xerogel (120 °C) shows a broad absorption band located in the region from 3600 to 3000 cm−1 approximately, which corresponds to the –OH stretching vibration (water or ethanol), while the bands around 1632 and 1503 cm−1 are associated with the H2O bending vibration [29], confirming the presence of residual physisorbed water. Moreover, the narrow and sharp band near 1384 cm−1 is attributed to the presence of NO3 groups [30]. As it is evident, the absorption bands mentioned above decrease gradually until disappear with the increasing of treatment temperature. It is also seen that all the CeO2 powders treated at different temperatures show a band in the 750–400 cm−1 region, which is assigned to the Ce–O stretching vibration [31,32]. Figure 1b shows the FT-IR spectra of the pure PMMA and PMMA/CeO2 hybrid systems. For pure PMMA, the bands around 2996, 2952 (asymmetric) and 2844 cm−1 (symmetric) are assigned to C–H stretching vibrations. The bending vibration bands of the methyl (–CH3) group appeared at 1484 and 1436 cm−1 in the FTIR spectra, whereas the deformation mode of the methylene (–CH2–) group appeared at 1387 cm−1. In addition, the sharp and intense bands at 1728 and 753 cm−1 are attributed to the stretching and out-of-plane-bending vibrations of the carbonyl (C=O) group, respectively [33]. The PMMA/CeO2 hybrid systems show absorption bands that matched well with pure PMMA, indicating a weak interaction between PMMA and CeO2 nanoparticles. Furthermore, bands corresponding to the vibration absorption of CeO2 nanoparticles are not observed owing to the incorporation of a low percentage of nanoparticles. It is worth to notice that to avoid altering the full transparency low percentages of CeO2 were introduced (0.5 and 1.0 wt %).
Figure 1. FT-IR spectra of (a) CeO2 thermally treated at different temperatures and (b) pure PMMA and PMMA/CeO2 hybrid systems.
Polymers 07 01474 g001

3.1.2. NMR Studies

Figure 2a shows the 1H NMR spectra of pure PMMA and PMMA/CeO2 (0.5 and 1.0 wt %, 800 °C) hybrid systems. The peak at 3.60 ppm is related to the methoxy protons, and peaks at the 2.2–1.5 ppm range correspond to the methylene protons of PMMA. The α-methyl protons show peaks at 1.22, 1.01 and 0.83 ppm, which are attributed to the presence of triads of several tacticities: isotactic (mm), heterotactic (mr) and syndiotactic (rr). On the other hand, it can be observed that the addition of a small amount of CeO2 nanoparticles (0.5 and 1.0 wt %) to PMMA resulted in a low-field chemical shift of the peak at 1.59 ppm (–CH2– protons). This small chemical shift suggests the existence of electrostatic interactions in the interfacial region between PMMA and CeO2 nanoparticles, which is proposed in Figure 3. 13C NMR spectra of PMMA and the hybrid systems with 0.5 and 1.0 wt % of CeO2 thermally treated at 800 °C are reported in Figure 2b. The resonance peaks between 22 and 16 ppm are assigned to the methyl group; peaks between 46 and 44 ppm are related to the backbone quaternary carbon; the peak at 51.86 ppm is due to the methoxy group; the peak at 54.47 ppm is associated with the backbone methylene group; and the peaks between 179 and 176 ppm are correlated to the PMMA carbonyl carbon. No modification in the chemical shift is observed with the addition of CeO2 nanoparticles, indicating that no primary chemical bond occurred with the polymer.
Figure 2. NMR spectra of pure PMMA and PMMA/CeO2 hybrid systems by (a) 1H NMR and (b) 13C NMR.
Polymers 07 01474 g002
Figure 3. Proposed interaction between the PMMA matrix and CeO2 nanoparticles.
Polymers 07 01474 g003

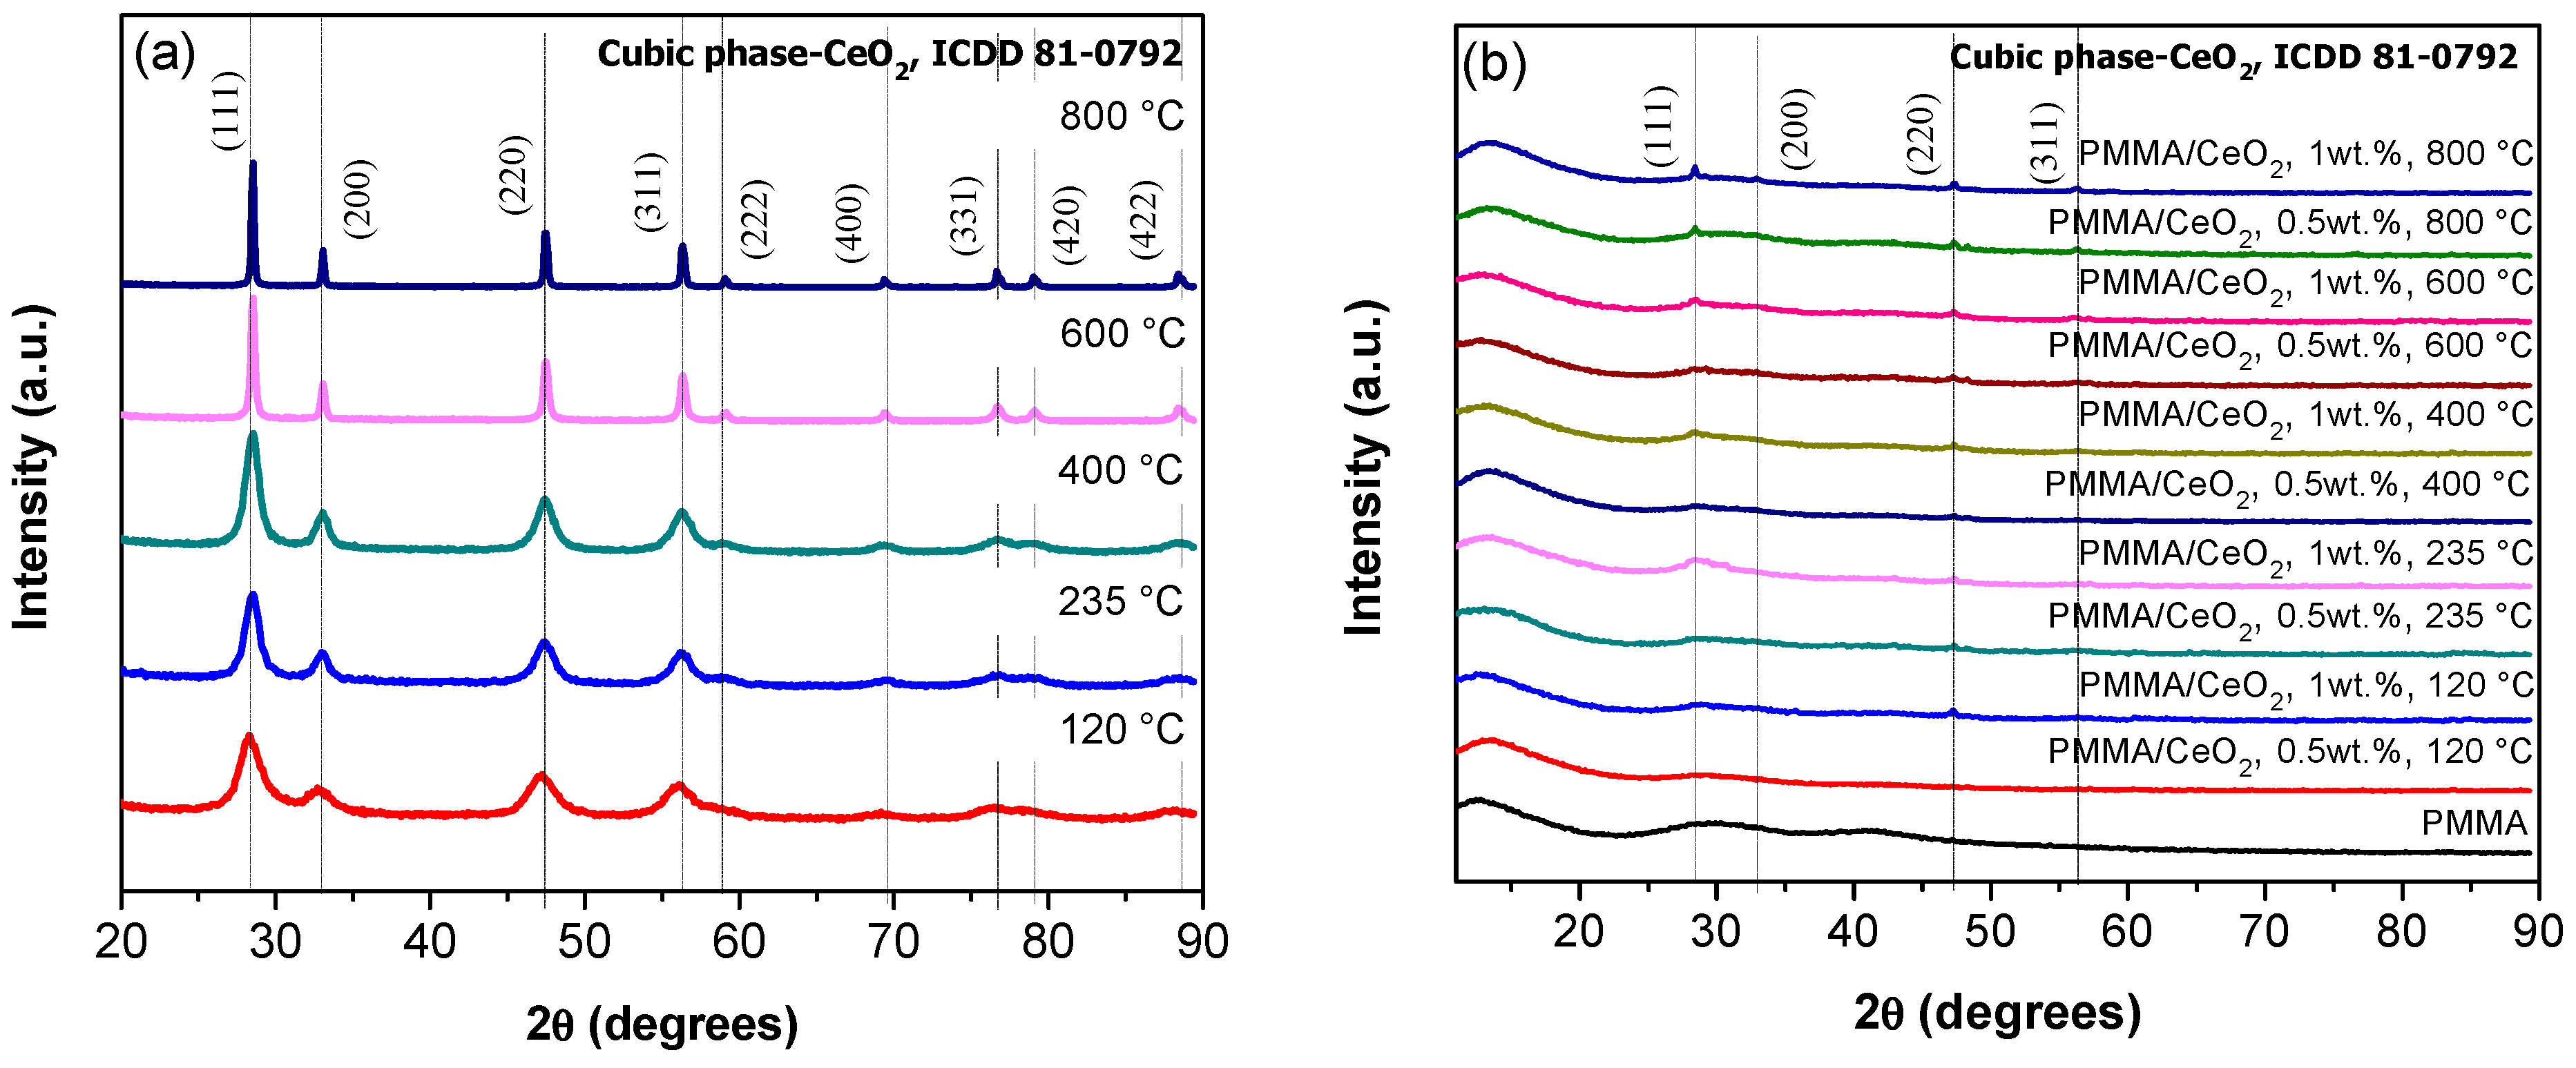
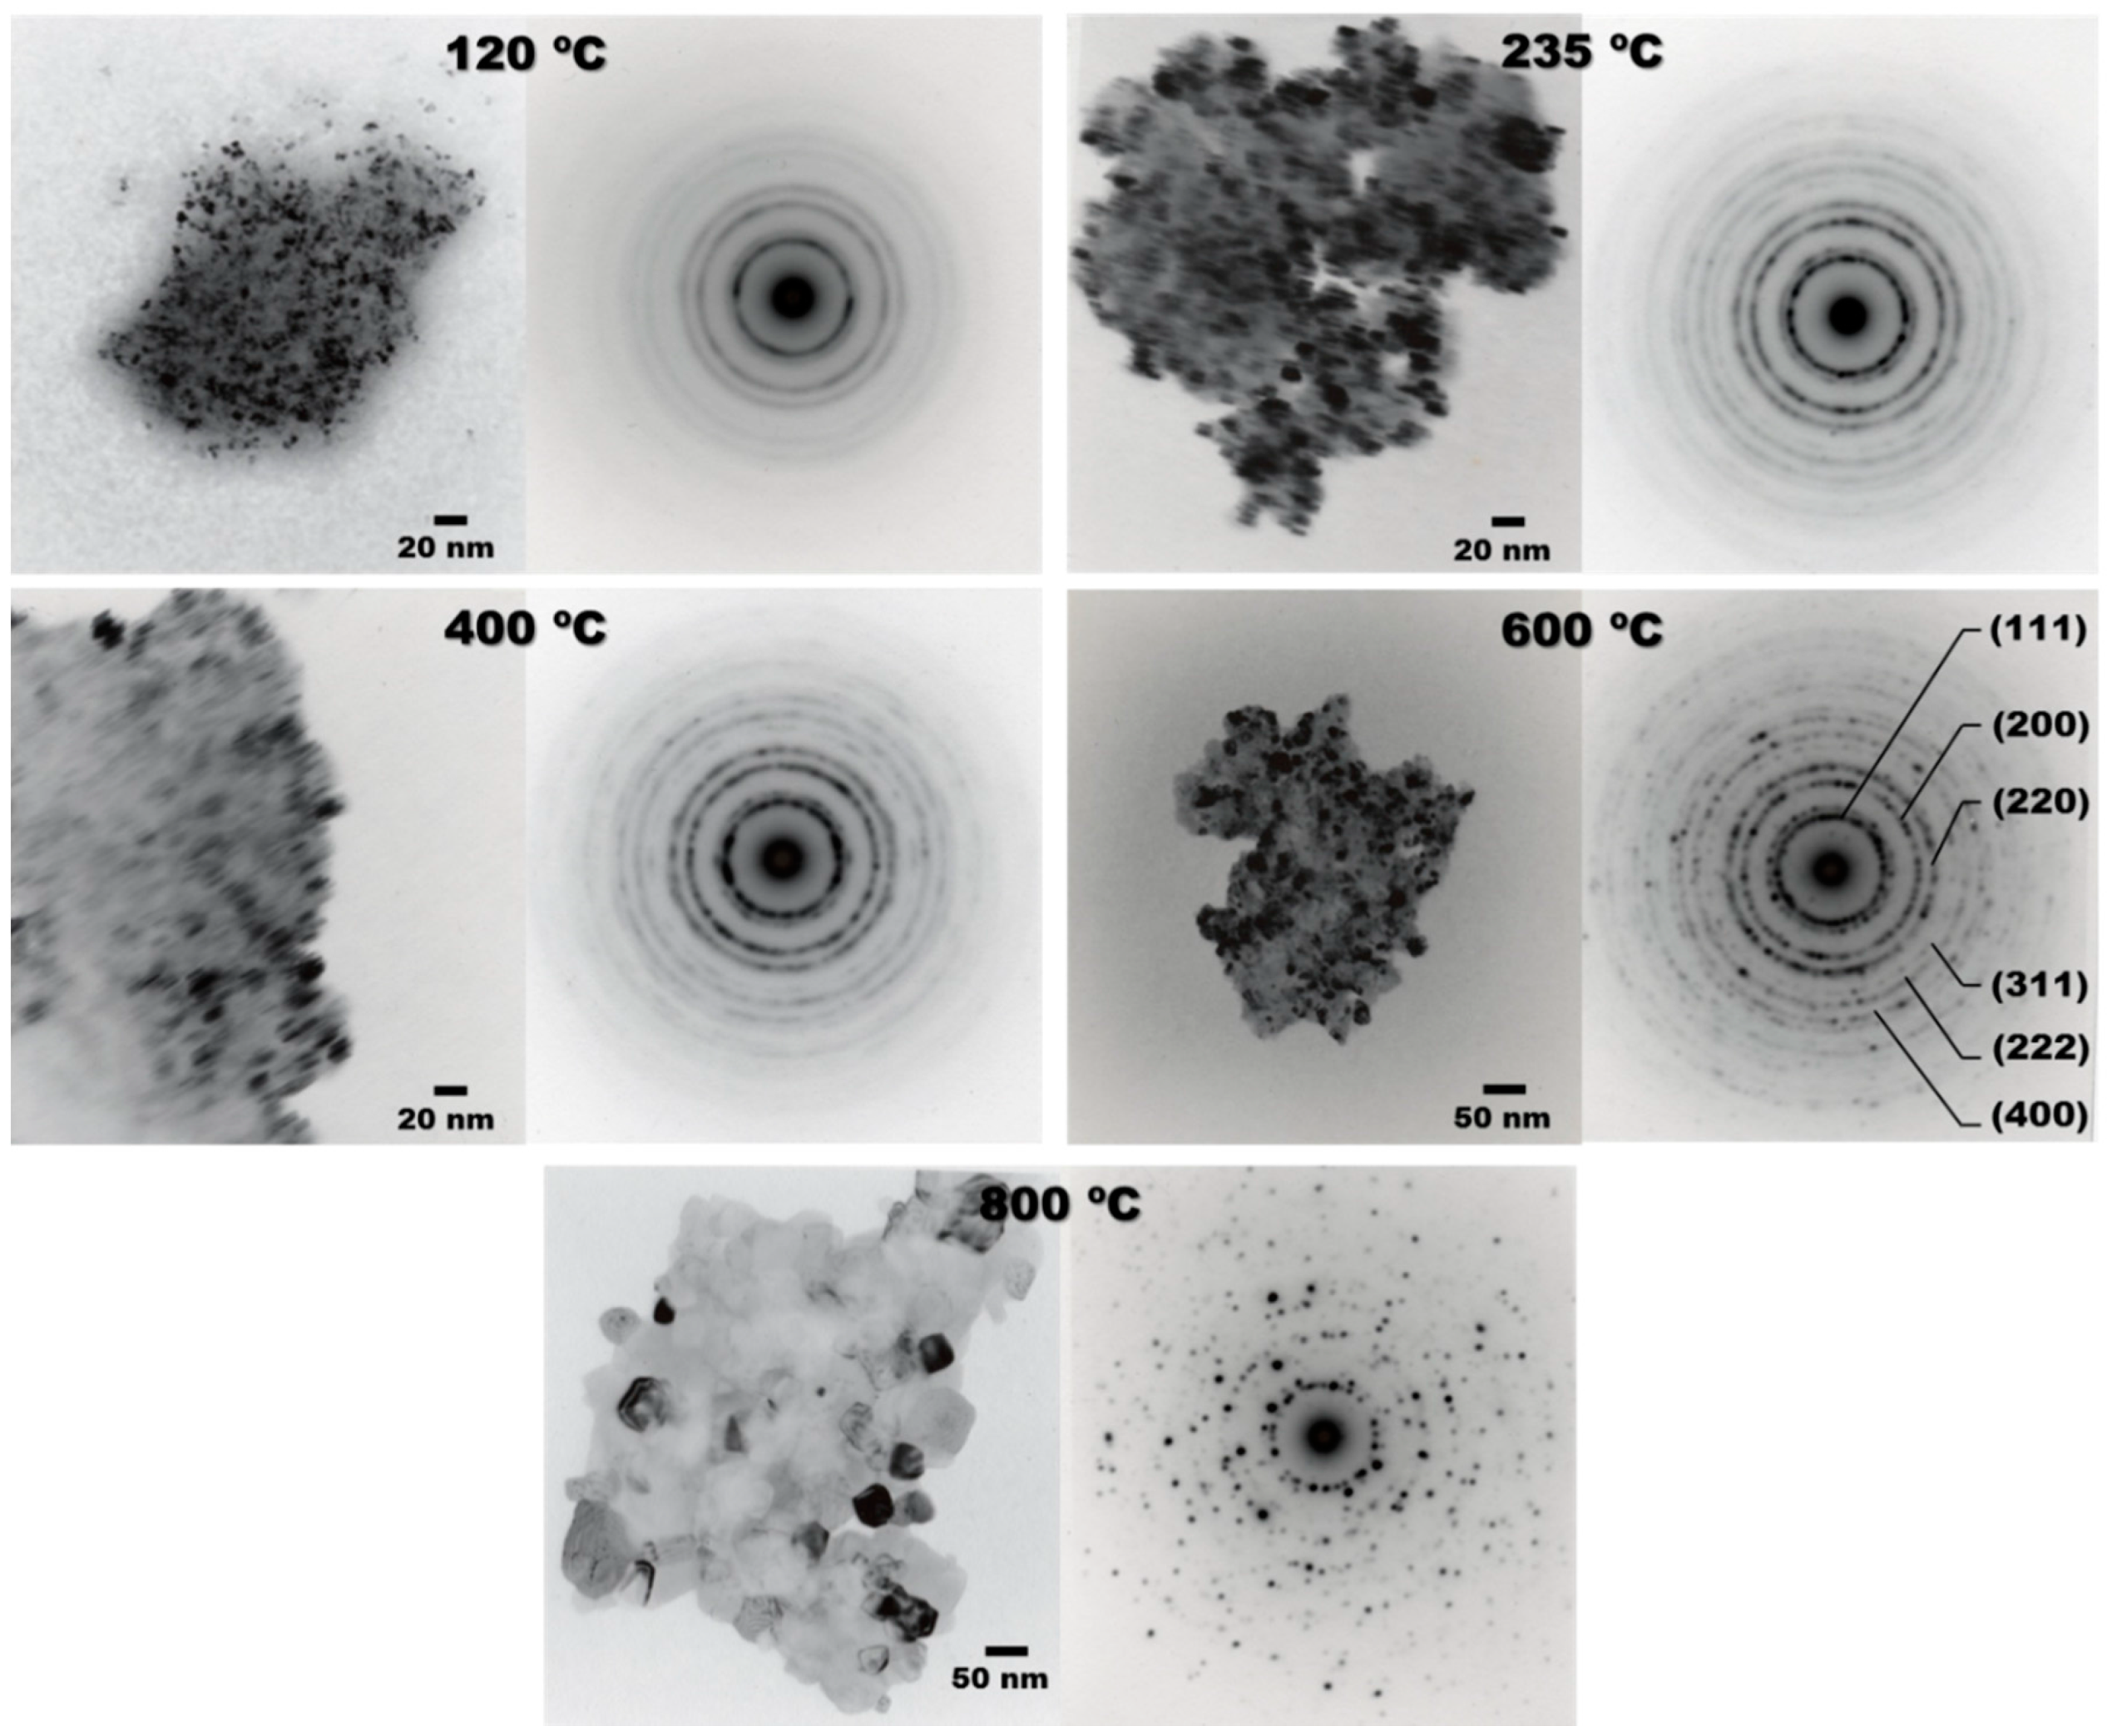
3.1.3. Structural and Morphological Characterization

Figure 4a shows XRD patterns of the CeO2 nanoparticles thermally treated at different temperatures. It can be observed that the CeO2 powders treated at 120 °C exhibited low intensity broad peaks about 2θ = 28.5, 33.0, 47.5 and 56.3°, which were assigned to the (111), (200), (220) and (311) planes, respectively, and correspond to the cubic fluorite crystal structure (ICDD 81-0792). It is clear that these reflection peaks become sharper and narrower with the increasing temperature up to 800 °C, indicating an increase in the average crystallite size and crystallinity of nanoceria powders. The peaks at 59.0° (222), 69.3° (400), 76.6° (331), 79.0° (420) and 88.4° (422) also confirms the presence of the cubic phase.
Figure 4. XRD patterns of (a) nanocrystalline CeO2 powders thermally treated at different temperatures and (b) pure PMMA and PMMA/CeO2 hybrid systems.
Polymers 07 01474 g004
The crystallite size (t) of CeO2 was estimated from XRD patterns by applying the full-width at half-maximum (β) of the characteristic (111) peak in the Scherrer Equation [34]:
t = 0.9 λ β c o s θ β
where λ is the incident X-ray wavelength (1.54056 Å) and θβ is the diffraction angle for the (111) plane. The average CeO2 crystallite diameters determined with the Scherrer Equation were about 5.5 ± 0.1, 8.6 ± 0.2, 8.8 ± 0.1, 29.3 ± 0.7 and 47.5 ± 1.1 nm for CeO2 powders at 120, 235, 400, 600 and 800 °C, respectively. The crystallite size increased along with the increasing-thermal-treatment temperature due to a typical diffusion effect. Figure 4b shows the XRD patterns of the PMMA/CeO2 hybrid systems. The diffraction pattern of pure PMMA shows a broad diffraction peak at 2θ = 14.5° with other two lower intensity signals centered at 2θ = 30.7 and 42.1°, as a result of the diffuse scattering of amorphous PMMA [35]. The shape of the first main signal indicates the ordered packing of the polymer chains. The intensity and shape of the second signal are attributed to the effect inside the main chains [36]. The diffraction patterns of all PMMA/CeO2 hybrid systems show the first two signals observed in the pure PMMA, indicating that neither the presence of the nanoparticles nor the preparation process changes the orientation of the PMMA chains. The PMMA systems with CeO2 thermally treated at 600 °C (1.0 wt %) and 800 °C (0.5 and 1.0 wt %) display a strong tendency toward an amorphous structure with low-intensity peaks at 2θ = 28.5, 33.0, 47.5 and 56.3°, which corresponds to the fcc structure of CeO2.
The lattice parameter was calculated from XRD patterns and the results confirmed that except for 120 °C, where a value of 5.4448 Å was obtained, a quite small change in the lattice parameter was observed with the thermal treatment: 5.4192 Å (235 °C), 5.4187 Å (400 °C), 5.4107 Å (600 °C) and 5.4127 Å (800 °C). It was determined that the lattice parameter showed a trend of expansion with the annealing temperature but the changing extent is moderately limited. The lattice distortion rate (Δa/a) was estimated to be between 0.60% and 0.013%. The highest distortion was obtained at 120 °C and is undoubtedly due to this temperature that some organic compounds or water or both can be still partially bonded with cerium powders. The formation of nanoceria powders by sol–gel contains complicated reactions; in the first instance, they began to nucleate into Ce(OH)3 form, so the supplied energy during the sol–gel process and subsequent heat treatment must be enough for the complete conversion to Ce(OH)4 nuclei and thereafter into CeO2 nuclei via dehydration and subsequent growth of highly crystallized nanoceria.
TEM images of CeO2 in bright field mode with their corresponding selected area electron diffraction pattern (SAEDP) are shown in Figure 5. The CeO2 nanopowders exhibit a heterogeneous size and non-uniform shape with a high agglomeration degree. Indeed, a higher treatment temperature seems to increase the particle size. The images show that the CeO2 powders thermally treated at 120 °C are constituted of aggregates with sizes between 0.1 and 0.2 µm and composed by crystals of about 1–5 nm in diameter. CeO2 thermally treated at 235 °C shows aggregates between 0.2 and 0.3 µm with irregular smaller crystals of about 4–12 nm, while CeO2 thermally treated at 400 °C consists of aggregates formed of nanocrystals with an average size of 5–13 nm. When the heat treatment of CeO2 is increased to 600 °C, the resulting samples are 0.45–0.35 µm aggregates with semispherical nanocrystal sizes around 4–22 nm. Likewise, CeO2 thermally treated at 800 °C shows aggregates between 0.52–0.75 µm constituted by nanocrystals of about 20–80 nm. The SAEDPs of CeO2 thermally treated at different temperatures (120, 235, 400, 600 and 800 °C) show concentric rings, which also indicate the polycrystalline nature of the powder and that the crystallite size is on the nanoscale. The SAEDPs were indexed according to the ICDD card of face-centered cubic phase of CeO2. The mean crystal size values and the diffraction rings of SAED obtained in TEM images for CeO2 matched well with XRD results.
From measurements of dynamic light scattering, different particle diameter moments (number-average diameter Dn; weight-average diameter Dw and z-average diameter Dz) were calculated using Equations (2–4), and the polydispersity index (PDI) was determined using Equation (5):
D n = n i D i n i
D w = n i D i 4 n i D i 3
D z = n i D i 6 n i D i 5
P D I = D w D n
where ni is the number of CeO2 nanoparticles with diameter Di.
Figure 5. TEM images and SAEDPs of nanocrystalline CeO2 powders thermally treated at different temperatures.
Polymers 07 01474 g005
The particle size distributions (PSDs) for the samples are shown in Figure 6, whereas the obtained average particle size and calculated polydispersity index (PDI) are shown in Table 1. From these data, the CeO2 particle size was increased as the temperature varied from 120 to 400 °C. After this temperature, a decrease in the particle size was observed (600 and 800 °C). It is noteworthy to mention that the particle size distribution can be influenced by sonification and dispersant agent [37]. Furthermore, the CeO2 powders have different particle sizes and therefore they can be considered as polydispersed systems (PDI > 1). In general, these results confirm the presence of agglomerated nanoparticles due to Van der Waals forces and their high surface energy.
Figure 6. Size distribution of CeO2 thermally treated at different temperatures.
Polymers 07 01474 g006
Table 1. Particle size distribution of the as-prepared CeO2 powders.
CeO2 120 °CCeO2 235 °CCeO2 400 °CCeO2 600 °CCeO2 800 °C
Size d, nmMean number %Size d, nmMean number %Size d, nmMean number %Size d, nmMean number %Size d, nmMean number %
68.060.4190.13.9220.24.7190.15.5141.814.9
78.823.7220.210.2255.014.0220.217.8164.229.9
91.2811.1255.017.1295.318.9255.024.8190.120.0
105.719.0295.325.9342.019.2295.322.0220.215.0
122.422.4342.025.3396.113.8342.015.6255.015.1
141.821.3396.113.9458.76.6396.19.1295.35.1
164.215.1458.73.7531.27.4458.74--
190.15.6--615.19.2531.21.1--
220.20.7--712.45.1615.10.1--
255.00.3--825.01.1----
295.30.2--------
342.00.1--------
396.10.1--------
Dz = 212 nm Polydispersity index = 1.2483Dz = 368.6 nm Polydispersity index = 1.1234Dz = 635.1 nm Polydispersity index = 1.4051Dz = 392.7 nm Polydispersity index = 1.1964Dz = 242.7nm Polydispersity index = 1.1523

3.2. Characterization of PMMA/CeO2 Hybrid Materials

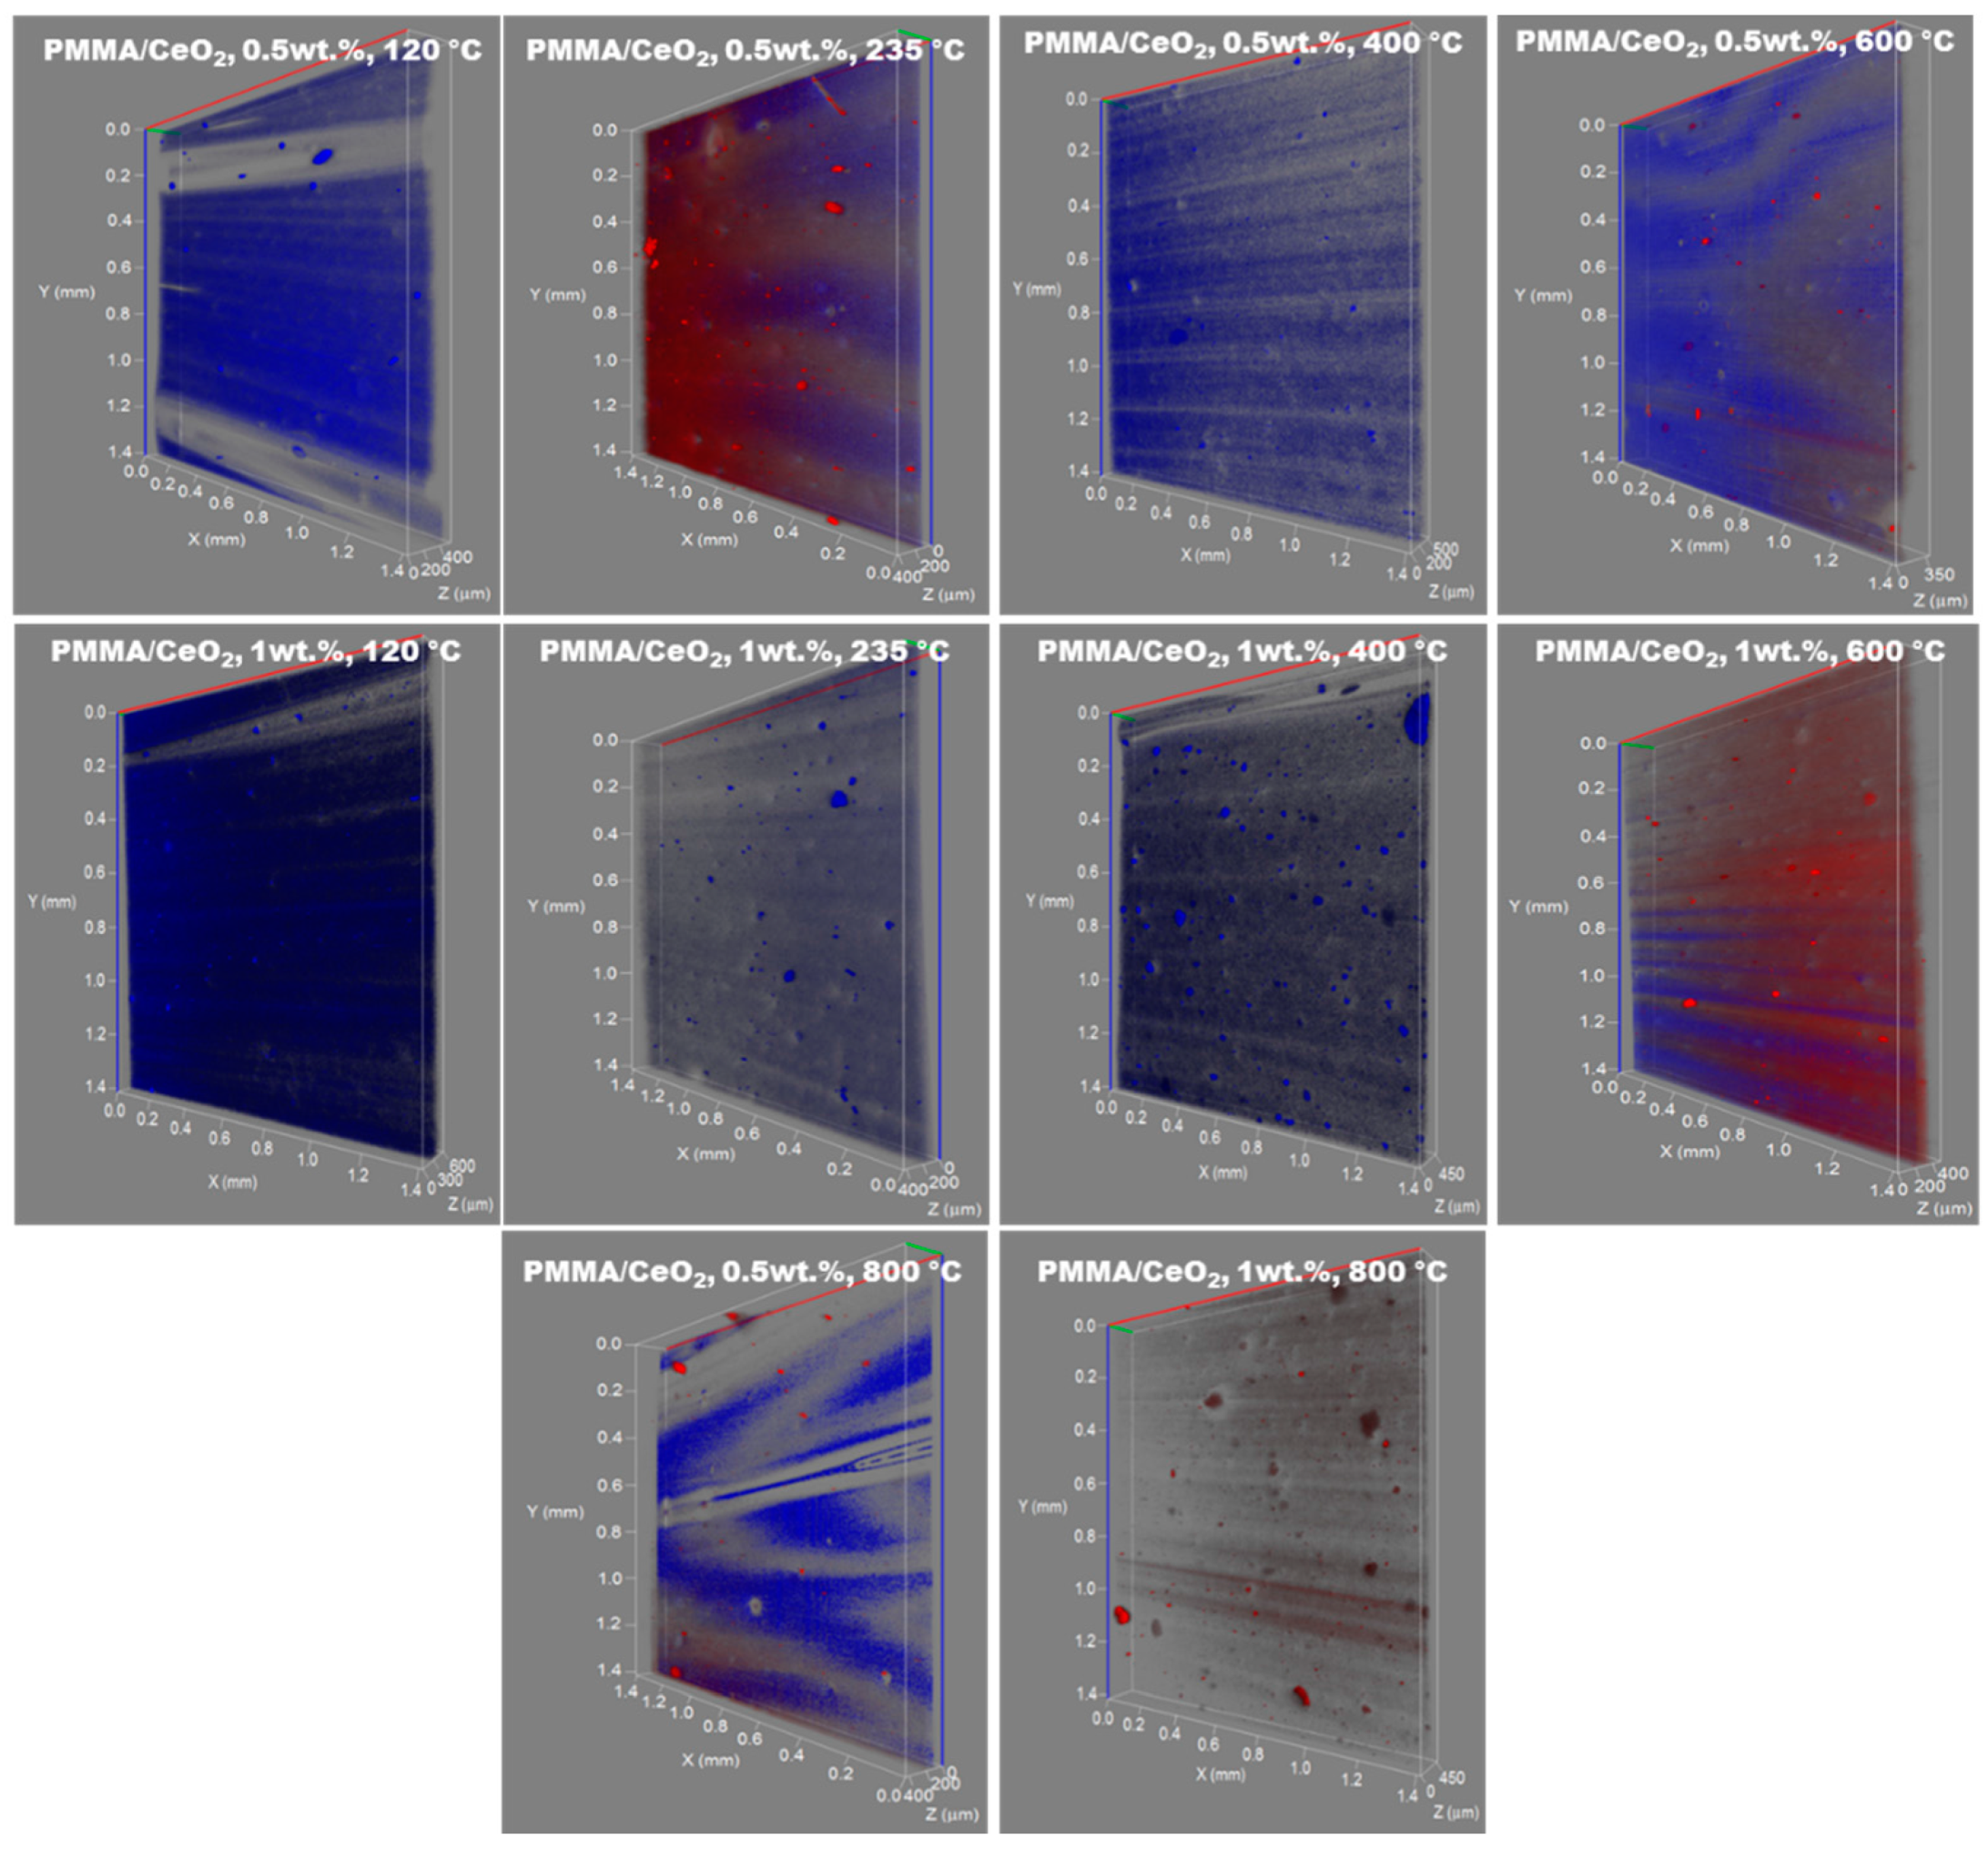
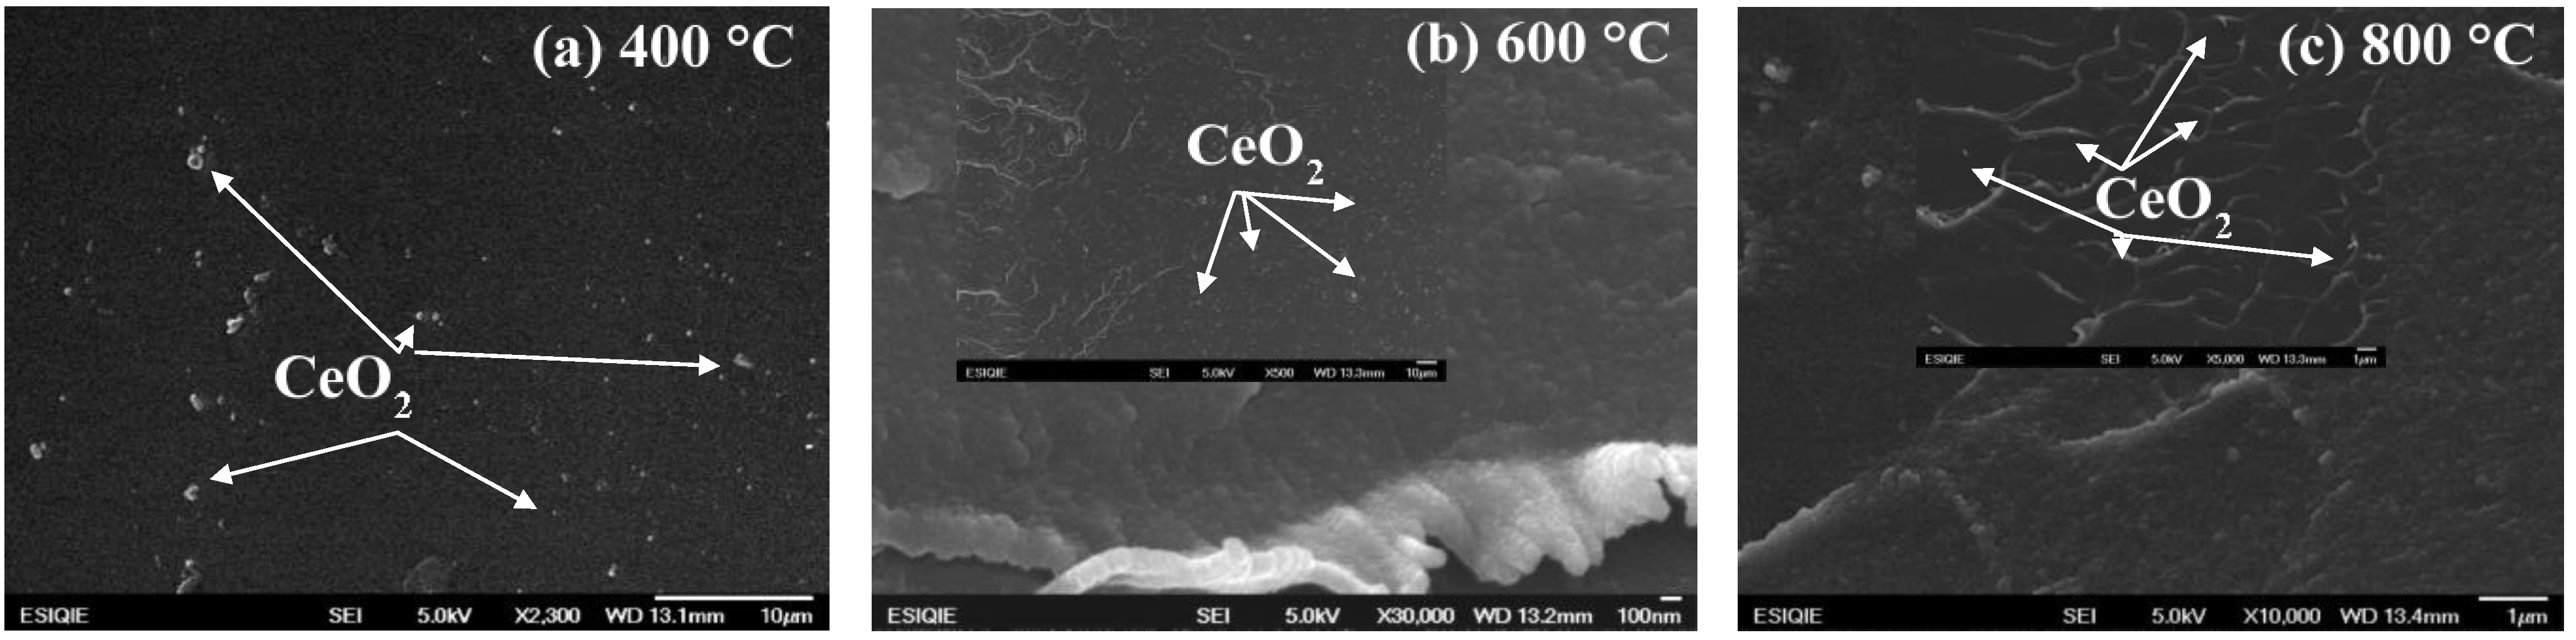
3.2.1. Dispersion Analysis

Dispersion is the key factor that determines quality and properties of hybrid compounds [38]. During the dispersion process two kinds of interaction can occur: (i) polymer filler interaction, adhesion of the polymer to the surface of the particles; and (ii) filler-filler interaction, where the particles interact to form aggregates. Figure 7 shows the 3D images revealing the CeO2 nanoparticles’ location within the PMMA. In these images, it can be observed that in all the PMMA/CeO2 hybrid systems the nanoparticles tend to form agglomerates of different sizes and semispherical morphologies. According to Yang et al., the nanoparticles tend to form aggregates to reduce the surface energy due to their high surface energy and small size [39]. It can also be observed that the CeO2 nanoparticles thermally treated at 120, 235 and 400 °C show a uniform distribution within the PMMA matrix. In the PMMA/CeO2 hybrid systems with nanoparticles thermally treated at 600 and 800 °C, a small quantity of nanoparticles can be seen because the fluorescence intensity decreases with the increasing crystal size. However, these last systems also show a uniform dispersion, which is a relevant aspect for increasing the thermal stability of the PMMA/CeO2 hybrid systems.
Figure 7. 3D CLSM representations of PMMA/CeO2 hybrid systems.
Polymers 07 01474 g007
To confirm the homogeneous distribution of CeO2 nanoparticles into the polymer matrix, SEM observations of PMMA/CeO2 cross sections were analyzed for CeO2 powders sintered at 400, 600 and 800 °C (Figure 8a–c). The samples were analyzed at different magnifications using both secondary electrons (SE) and backscattered electrons (BSE). The present morphology confirms that even with the tendency to form some aggregates with a very variable size, the shear stress during melt mixing separate the CeO2 nanoparticles to obtain a good dispersion with an interaction type (i) throughout hydrodynamic forces; in such a case, the effectiveness is also distributed in the entire sample. SEM micrographs reveal that PMMA incorporates semispherical CeO2 domains, which are an ideal physical form to improve polymer properties.
Figure 8. Cross-section SEM micrographs of PMMA with 1.0 wt % of CeO2 nanoparticles sintered at (a) 400 °C; (b) 600 °C and (c) 800 °C.
Polymers 07 01474 g008

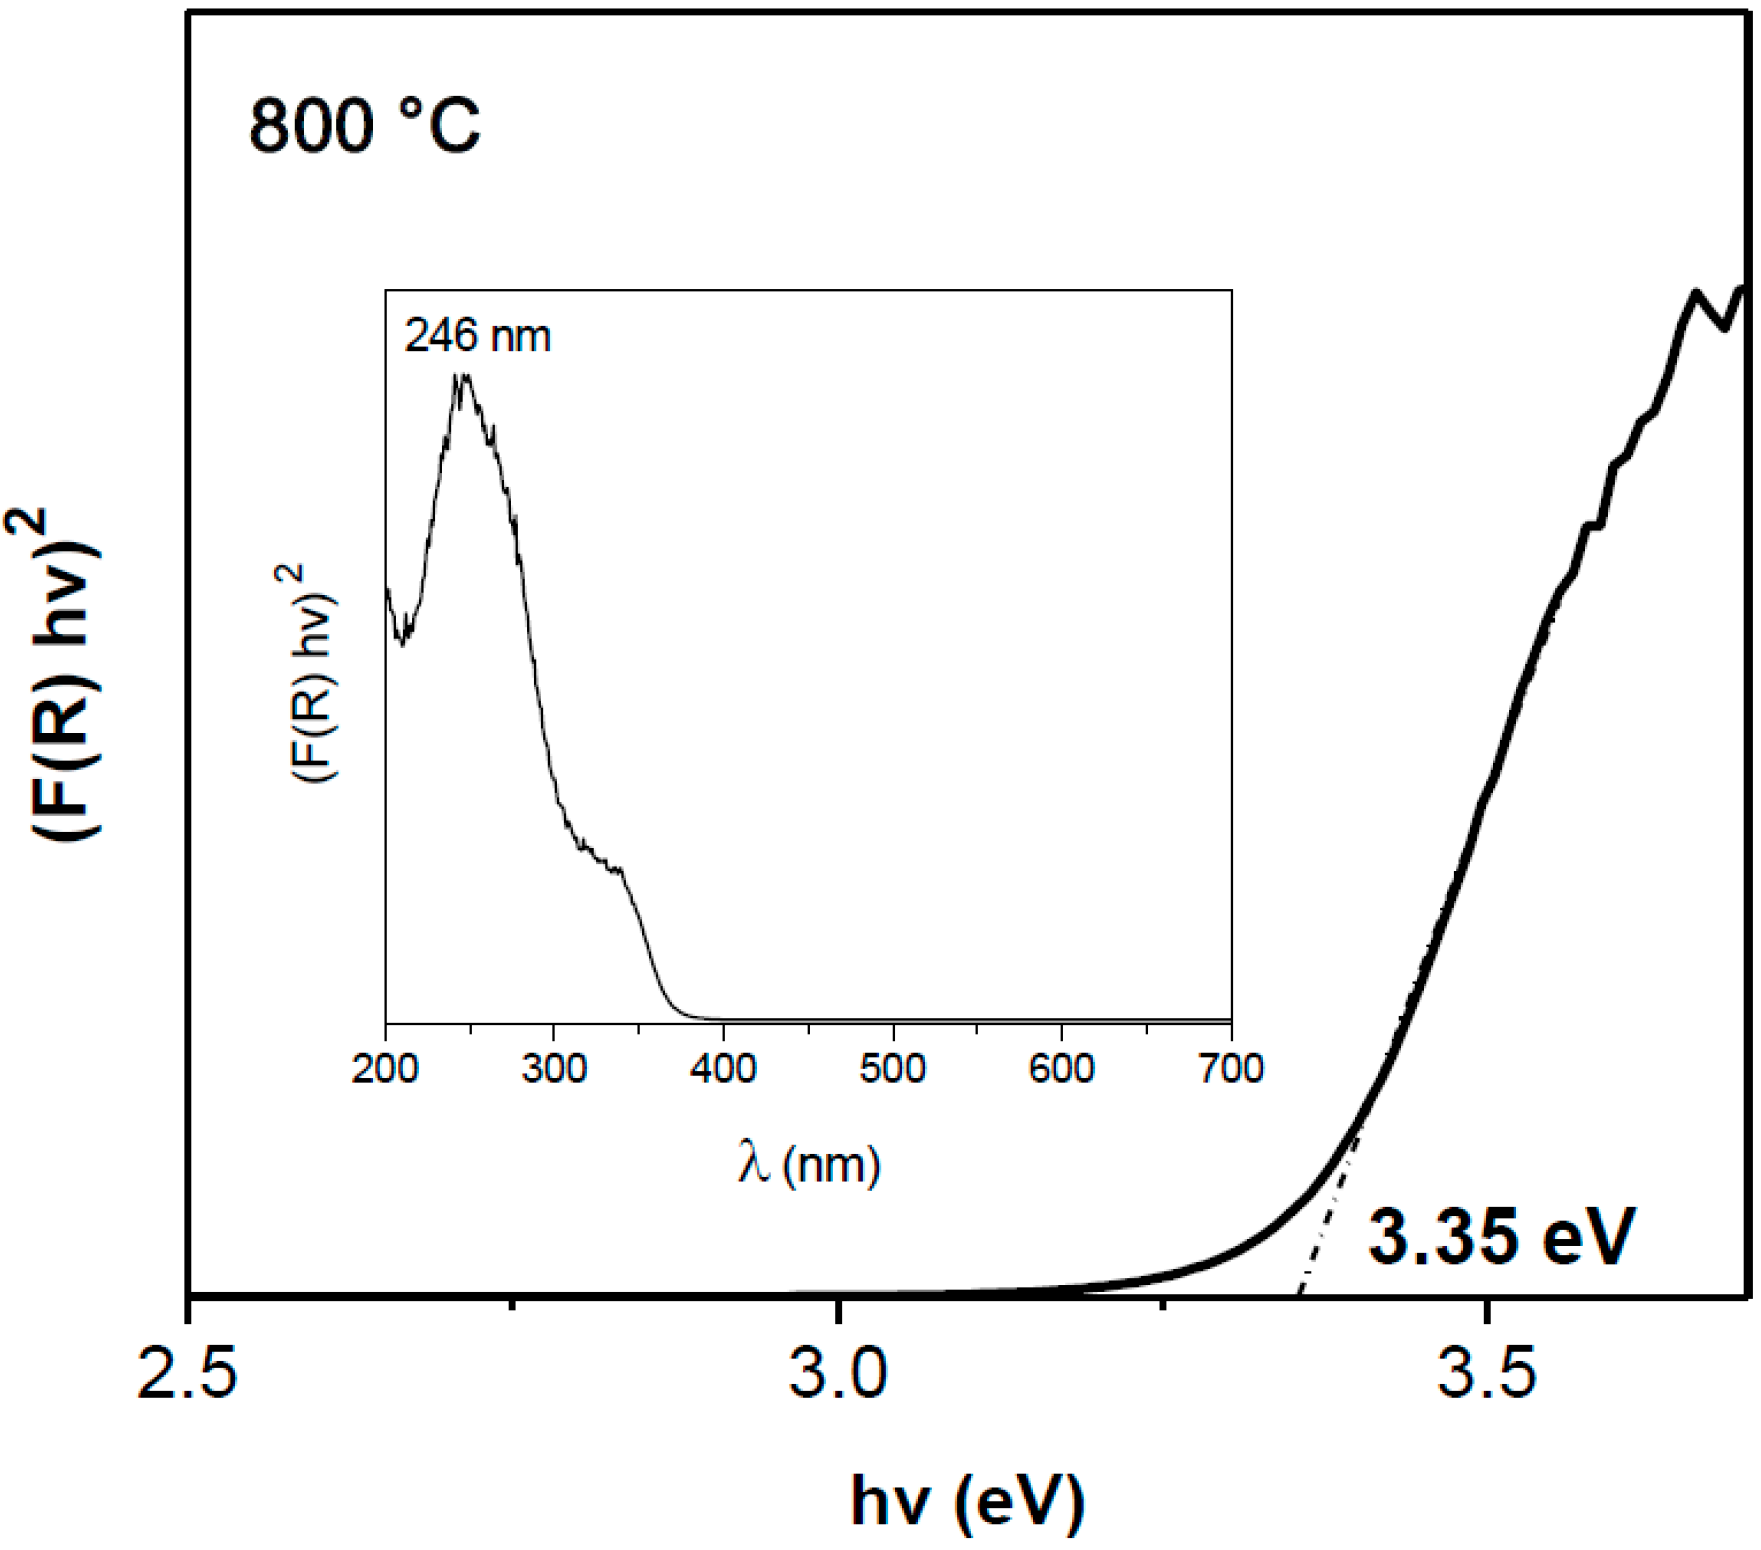
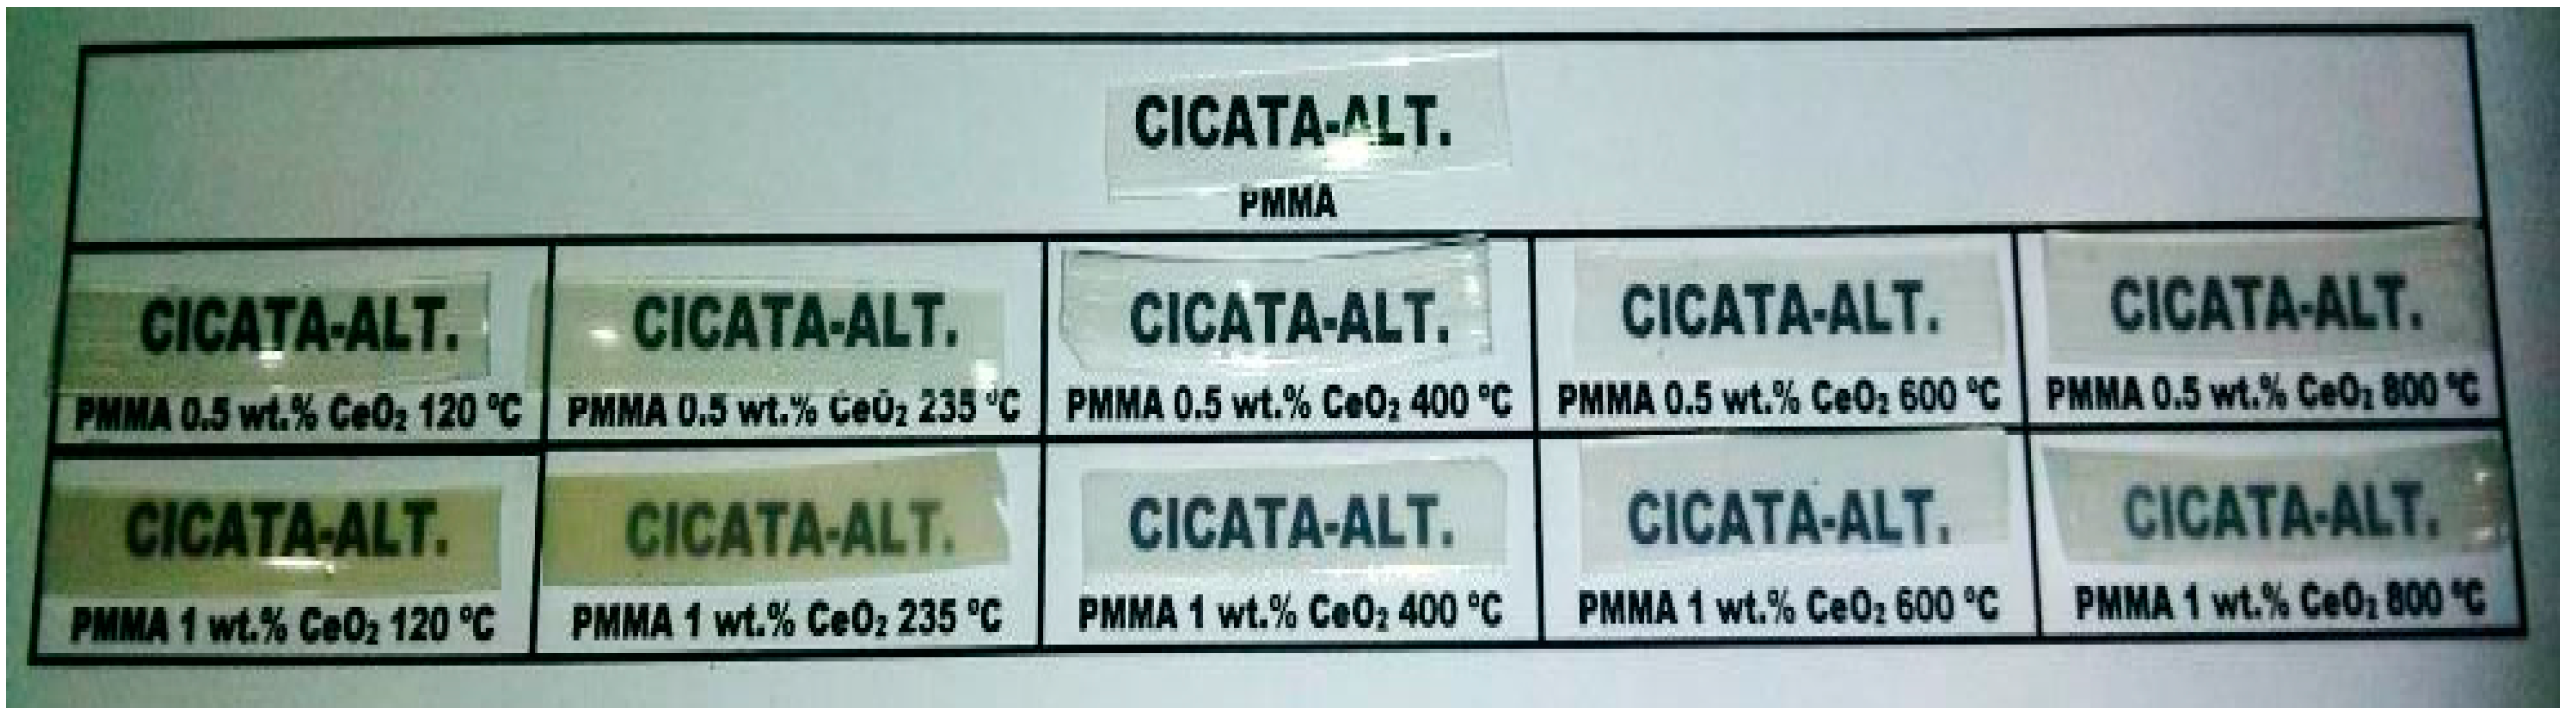
3.2.2. Optical Properties

The Kulbeka–Munk Equation was used to obtain the accurate band gap energy of CeO2 nanoparticles (Eg). The reflectance data were converted to the absorption coefficient F(R) values using the following equation:
F ( R ) = ( 1 R ) 2 2 R
where R is the diffused reflectance at a given wavelength of an infinitely thick sample and
E ( e V ) = h C λ
where h is Planck’s constant (6.626 × 10⁻³⁴ J s), C is the light speed (3.0 × 10⁸ ms−1) and λ is the wavelength (nm) [40]. The relationship between (F(R)hv)2 and the photon energy of CeO2 nanoparticles thermally treated at different temperatures are shown in Figure 9. The indirect band gap energy (Eg) was obtained from the intersection of the extrapolated linear portion. The Eg values of the CeO2 powders thermally treated at 120, 235, 400, 600 and 800 °C were 3.40 ± 0.01, 3.34 ± 0.02, 3.33 ± 0.03, 3.40 ± 0.02 and 3.44 ± 0.01, respectively. It reveals that the Eg decreases with increasing the treatment temperature up to 400 °C and then a slight increase is observed with the powders treated at 600 and 800 °C. In addition, in the inset, (F(R)hv)2 vs λ curves, it was found that all the CeO2 powders show a strong absorption band at 210–350 nm in the UV range originated from the charge-transfer between the O 2p and Ce 4f states in O2− and Ce4+ [41]. UV shielding materials are generally expected to absorb UV light at less than 400 nm wavelengths, as obtained for the CeO2 nanoparticles thermally treated at different temperatures.
Transmission spectra in the UV-Vis region for pure PMMA and PMMA samples with 0.5 and 1.0 wt % CeO2 at different thermal-treatment temperatures are shown in Figure 10. It can be seen that the UV-Vis absorption of the PMMA/CeO2 nanocomposites increased with the CeO2 nanoparticle content in the nanocomposite. The PMMA/CeO2 hybrid system with nanoparticles thermally treated at 120 and 235 °C shows similar behavior with a transmittance decrease of about 22 and 40 percent (0.5 and 1.0 wt %) in comparison with pure PMMA. This strong decrease is primarily attributed to the organic matter present in CeO2 as it was observed by FTIR, as a result of the low thermal-treatment temperatures. On the other hand, the PMMA/CeO2 hybrid systems with 0.5 and 1.0 wt % CeO2 thermally treated at 400 °C display a transmittance reduction of approximately 7–15 percent in comparison with pure PMMA, which are the most transparent systems. It can be noticed that of all the hybrid systems, nanocomposites with 0.5 wt % of CeO2 at 400 °C showed the highest percentage of transmittance, whereas the PMMA with 1.0 wt % of CeO2 treated at high temperatures (600 and 800 °C) showed lower values in comparison with systems formed by CeO2 at 400 °C. The aforesaid is related to the formations of small crystalline domains embedded in the amorphous PMMA as well as crystal size growth with sintered temperature. Figure 11 shows photographs of these films, where it is evident that even the presence of a small percentage of CeO2 leads opacity or turbidity due to the fact that the agglomerated CeO2 nanoparticles act as a strong scattering center. This point also suggests that the UV shielding properties of the hybrid films are mainly due to the scattering of these agglomerates in the film. As it was mentioned, the particles agglomeration enhanced with the thermal treatment and crystallite size; however, the aggregates are homogeneously distributed within the polymeric matrix.
Figure 9. Kubelka–Munk modified spectra and their equivalence in hν vs λ (insert) of CeO2 powders thermally treated at different temperatures.
Polymers 07 01474 g009aPolymers 07 01474 g009b
Likewise, spectra of pure PMMA and PMMA/CeO2 nanocomposites show an absorption band at about 272 nm, which is attributed to the n-π* transition of the C=O group in the PMMA [42]. This band is attenuated with the incorporation of CeO2 treated at different temperatures causing a significant decrease in transmittance in the 250–360 nm range, which can be associated with the band-gap absorption of CeO2. In general, the synthetic polymers are susceptible to degradation by UV and visible light; specifically, the photodegradation of PMMA took place by irradiation between 260 and 300 nm [43]. The transmitting efficiency of the PMMA/CeO2 hybrid systems in the UV band up to 350 nm is approximately zero, demonstrating that such hybrid systems are a good option for exterior applications.
Figure 10. UV-Vis spectra of pure PMMA and PMMA/CeO2 hybrid systems.
Polymers 07 01474 g010
Figure 11. Photographs of the pure PMMA and PMMA/CeO2 hybrid systems.
Polymers 07 01474 g011

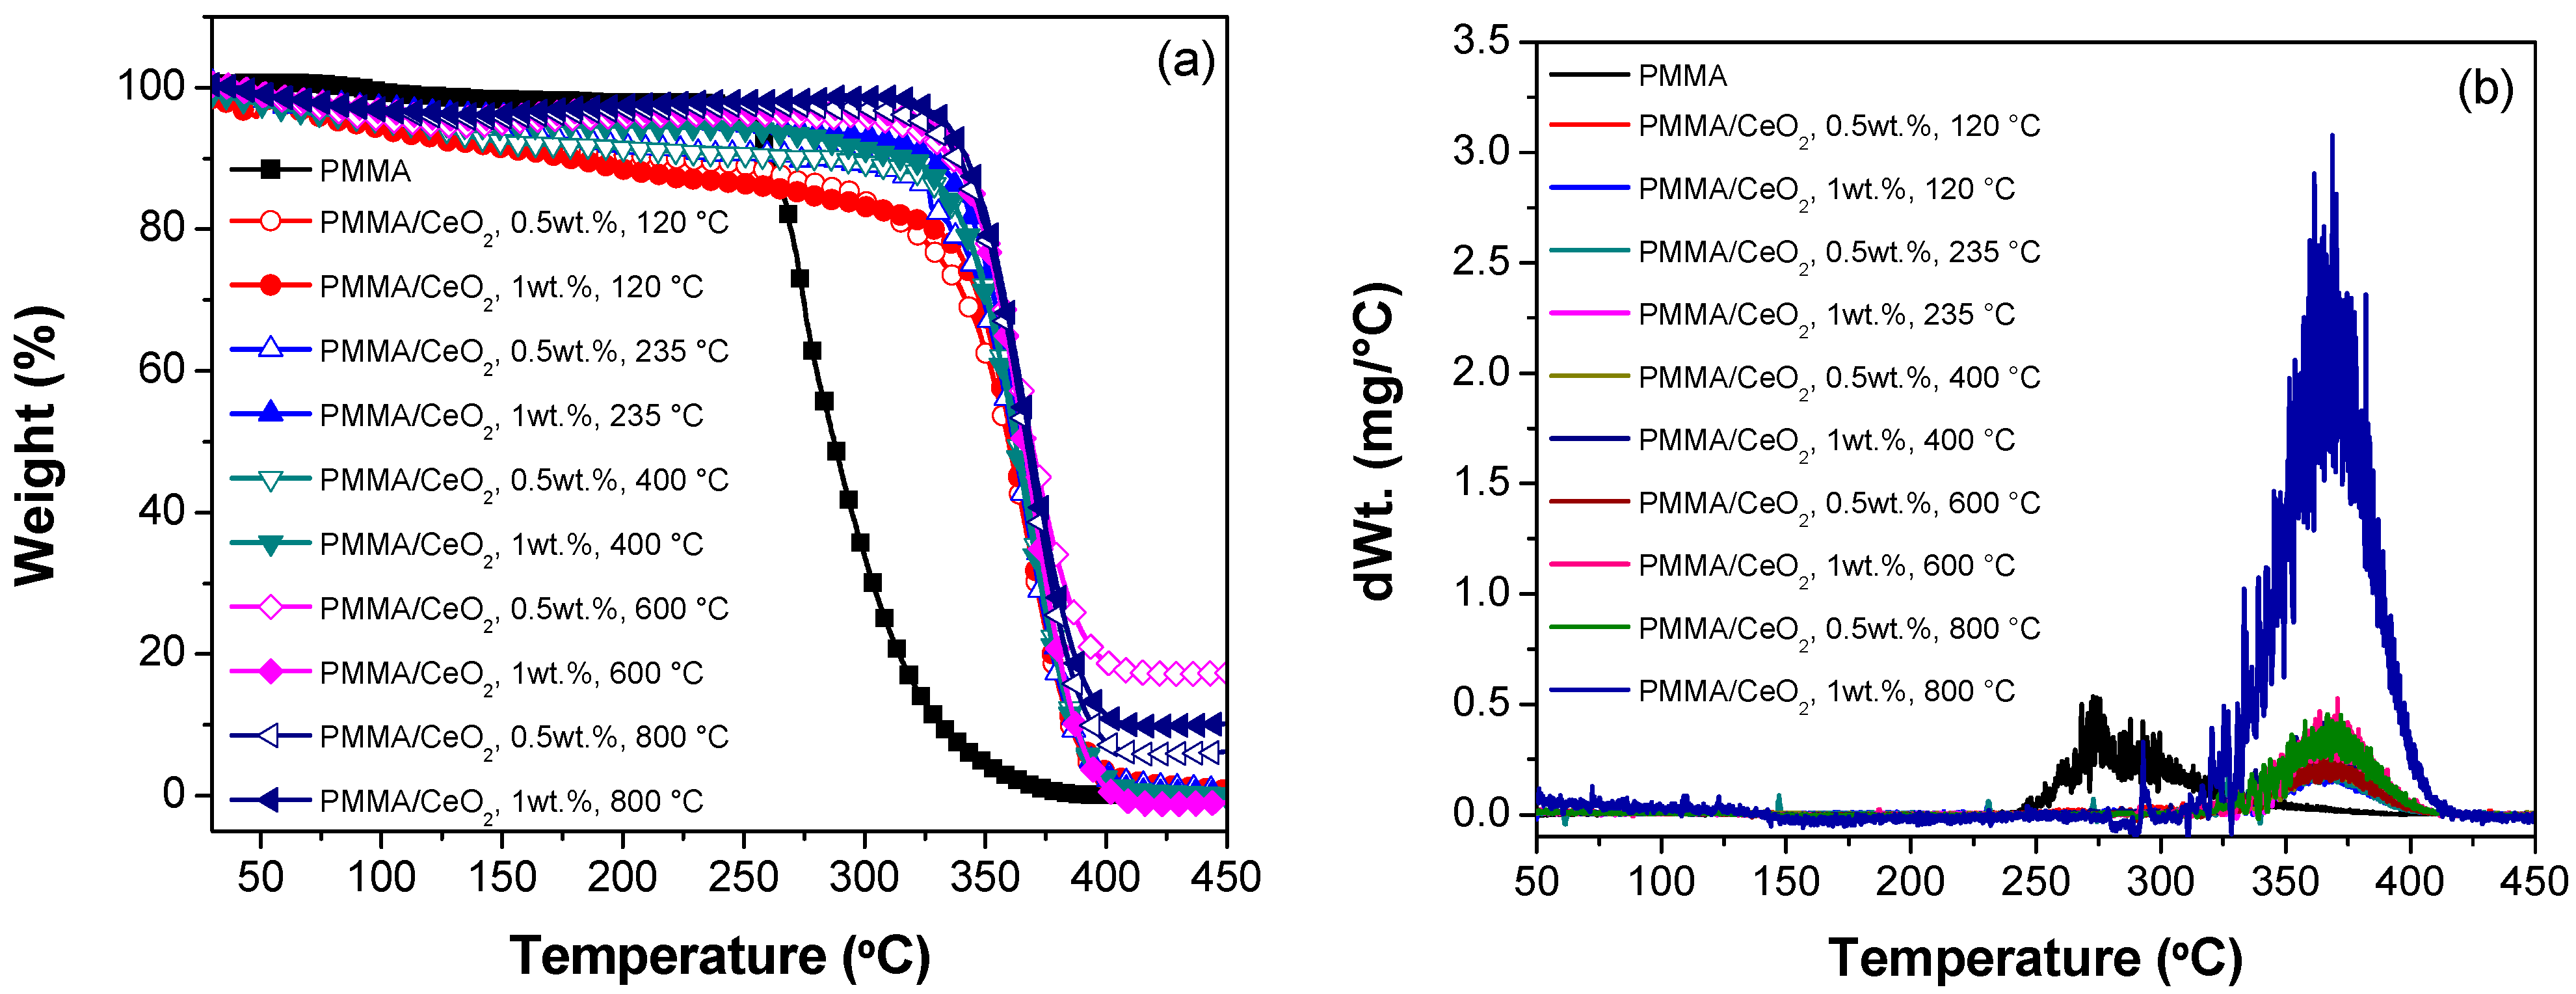
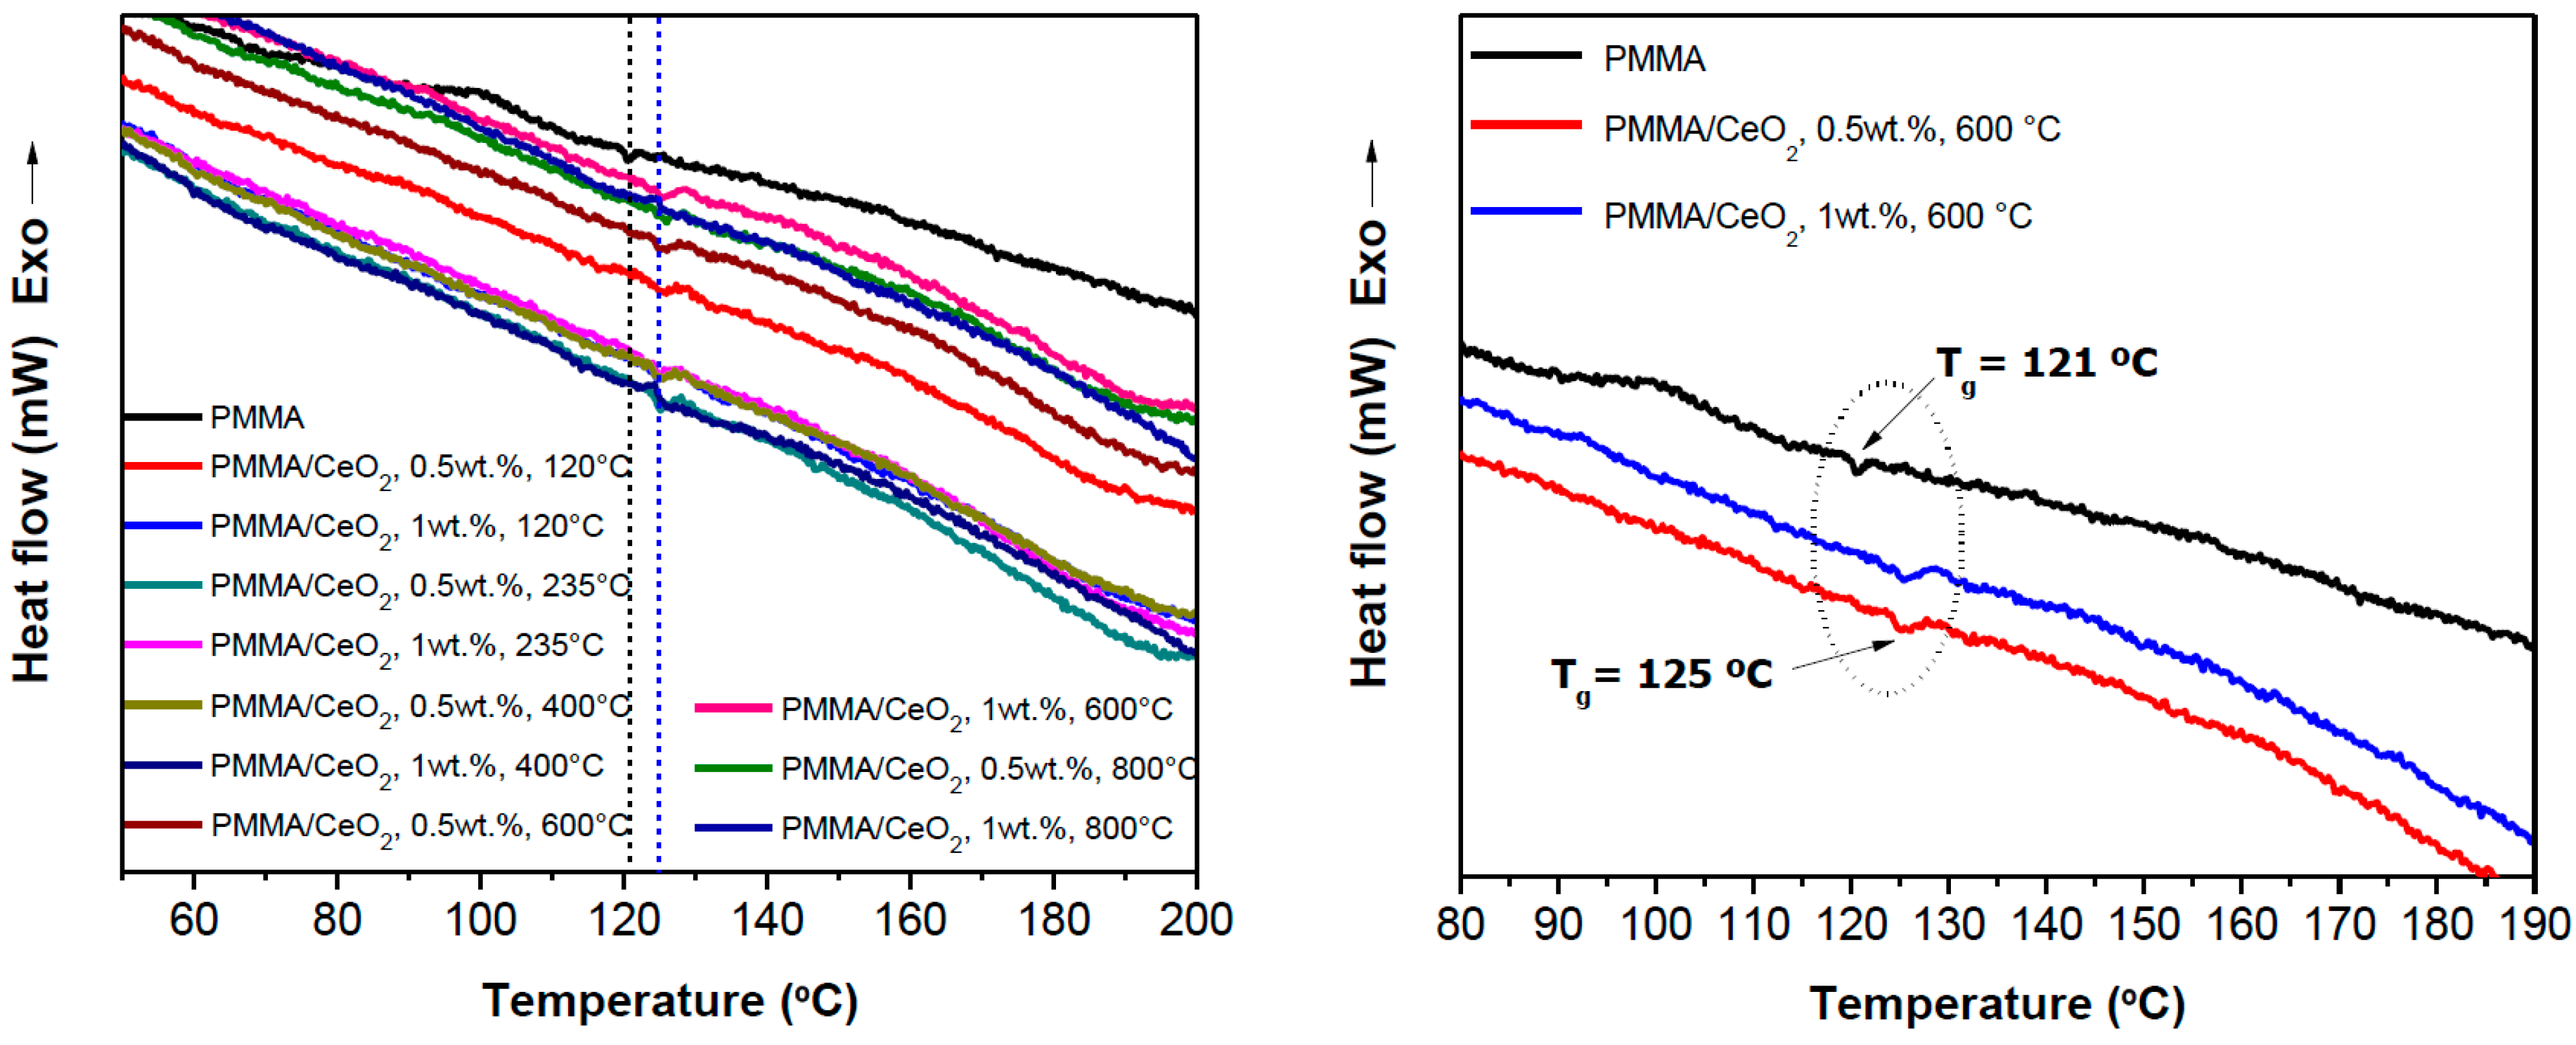
3.2.3. Thermal Studies

Different studies have been performed on the different steps involved in the thermal degradation of PMMA. According to Kashiwagi et al. [44], the bond dissociation energy of H–H linkages is estimated to be less than that of the C–C backbone bond due to the large steric hindrance and inductive effect of vicinal ester groups. The first degradation step (155–220 °C) is initiated by scissions of head-to-head linkages (H–H). Likewise, PMMA chains having unsaturated end group are less thermally stable than those with saturated end groups. Therefore, the second step (230–300 °C) is initiated by scissions at unsaturated ends involving a hemolytic scission β to the vinyl group and the last step (>300 °C) is initiated by random scission within the main polymer chain. Typical TGA and derivative thermogravimetry (DTG) results on PMMA and PMMA/CeO2 hybrid materials degraded under argon atmosphere are shown in Figure 12. In Figure 12a, it can be observed that the pure PMMA shows appreciable weight loss at around 240 °C, while the PMMA/CeO2 nanocomposites show detectable weight loss at 320 °C. It is also evident that the stability of the nanocomposites is enhanced with the thermal treatment applied to CeO2 nanopowders. Particularly, PMMA/CeO2 hybrid systems with 0.5–1.0 wt % CeO2 thermally treated at 120 °C began to show a weight loss below 250 °C. Underneath to 200 °C the weight loss is commonly referred to removal of water and organic components from the structure, whereas between 200 and 300 °C corresponds to nitrates decomposition and carbonization of organic parts of the precursor [45]. Furthermore, a single broad loss, extending from 320 to about 450 °C, is observed for all nanocomposites. From Figure 12a, data were taken for the onset temperature at which 10% (T0.1) and 50% (T0.5) degradation occurs and the corresponding temperature difference (ΔT) between the onset temperatures of hybrid systems and PMMA (Table 2). Evidently, the onset degradation temperatures of PMMA/CeO2 hybrid systems shift to higher temperatures in comparison with that of pure PMMA, independently of the CeO2 thermal-treatment temperature and content, indicating that the CeO2 nanocrystals can significantly improve the thermal stability of the polymer. As seen in Figure 12b, it is confirmed that the temperature at maximum degradation rate increases largely from 273 °C for pure PMMA to 365 °C for all the PMMA/CeO2 nanocomposites. Although the CeO2 nanoparticles are agglomerated within the PMMA, their homogeneous presence play an important role enhancing the thermal stability of PMMA as a result of the mobility restriction of polymer chains near their interfaces due to the steric hindrance, hindering the out-diffusion of the volatile decomposition products [46,47].
Figure 12. (a) TGA and (b) DTG curves of pure PMMA and PMMA/CeO2 hybrid systems.
Polymers 07 01474 g012
Table 2. Onset and difference temperatures (°C) at 10 and 50 wt % loss of pure PMMA and PMMA/CeO2 hybrid systems.
SampleT0.1ΔT0.1T0.5ΔT0.5
PMMA261-287-
PMMA/CeO2, 0.5 wt %, 120 °C222−3936073
PMMA/CeO2, 1.0 wt %, 120 °C178−8336174
PMMA/CeO2, 0.5 wt %, 235 °C2771636275
PMMA/CeO2, 1.0 wt %, 235 °C3286736578
PMMA/CeO2, 0.5 wt %, 400 °C2913036477
PMMA/CeO2, 1.0 wt %, 400 °C3165536275
PMMA/CeO2, 0.5 wt %, 600 °C3377636982
PMMA/CeO2, 1.0 wt %, 600 °C3397836679
PMMA/CeO2, 0.5 wt %, 800 °C3387736780
PMMA/CeO2, 1.0 wt %, 800 °C3428136982
The glass transition temperature is generally taken as the inflection point of the specific heat increment at the glass-rubber transition in DSC experiments. Figure 13 shows the effect of CeO2 nanoparticles on the Tg of the PMMA/CeO2 hybrid systems measured by DSC. It can be seen that the incorporation of low contents of CeO2 nanocrystals (0.5 and 1.0 wt %) thermally treated at different temperatures slightly increased the glass transition temperature up to ~125 °C in comparison with pure PMMA ~121 °C. In agreement with previous reports with other composites [33,48], the trend of the glass transition shifting to a slightly higher temperature is attributed to the electrostatic interactions between the PMMA matrix side chain and CeO2, which hinder the rotation of polymeric chains, leading to increased Tg.
Figure 13. DSC thermograms of the pure PMMA and PMMA/CeO2 hybrid systems.
Polymers 07 01474 g013

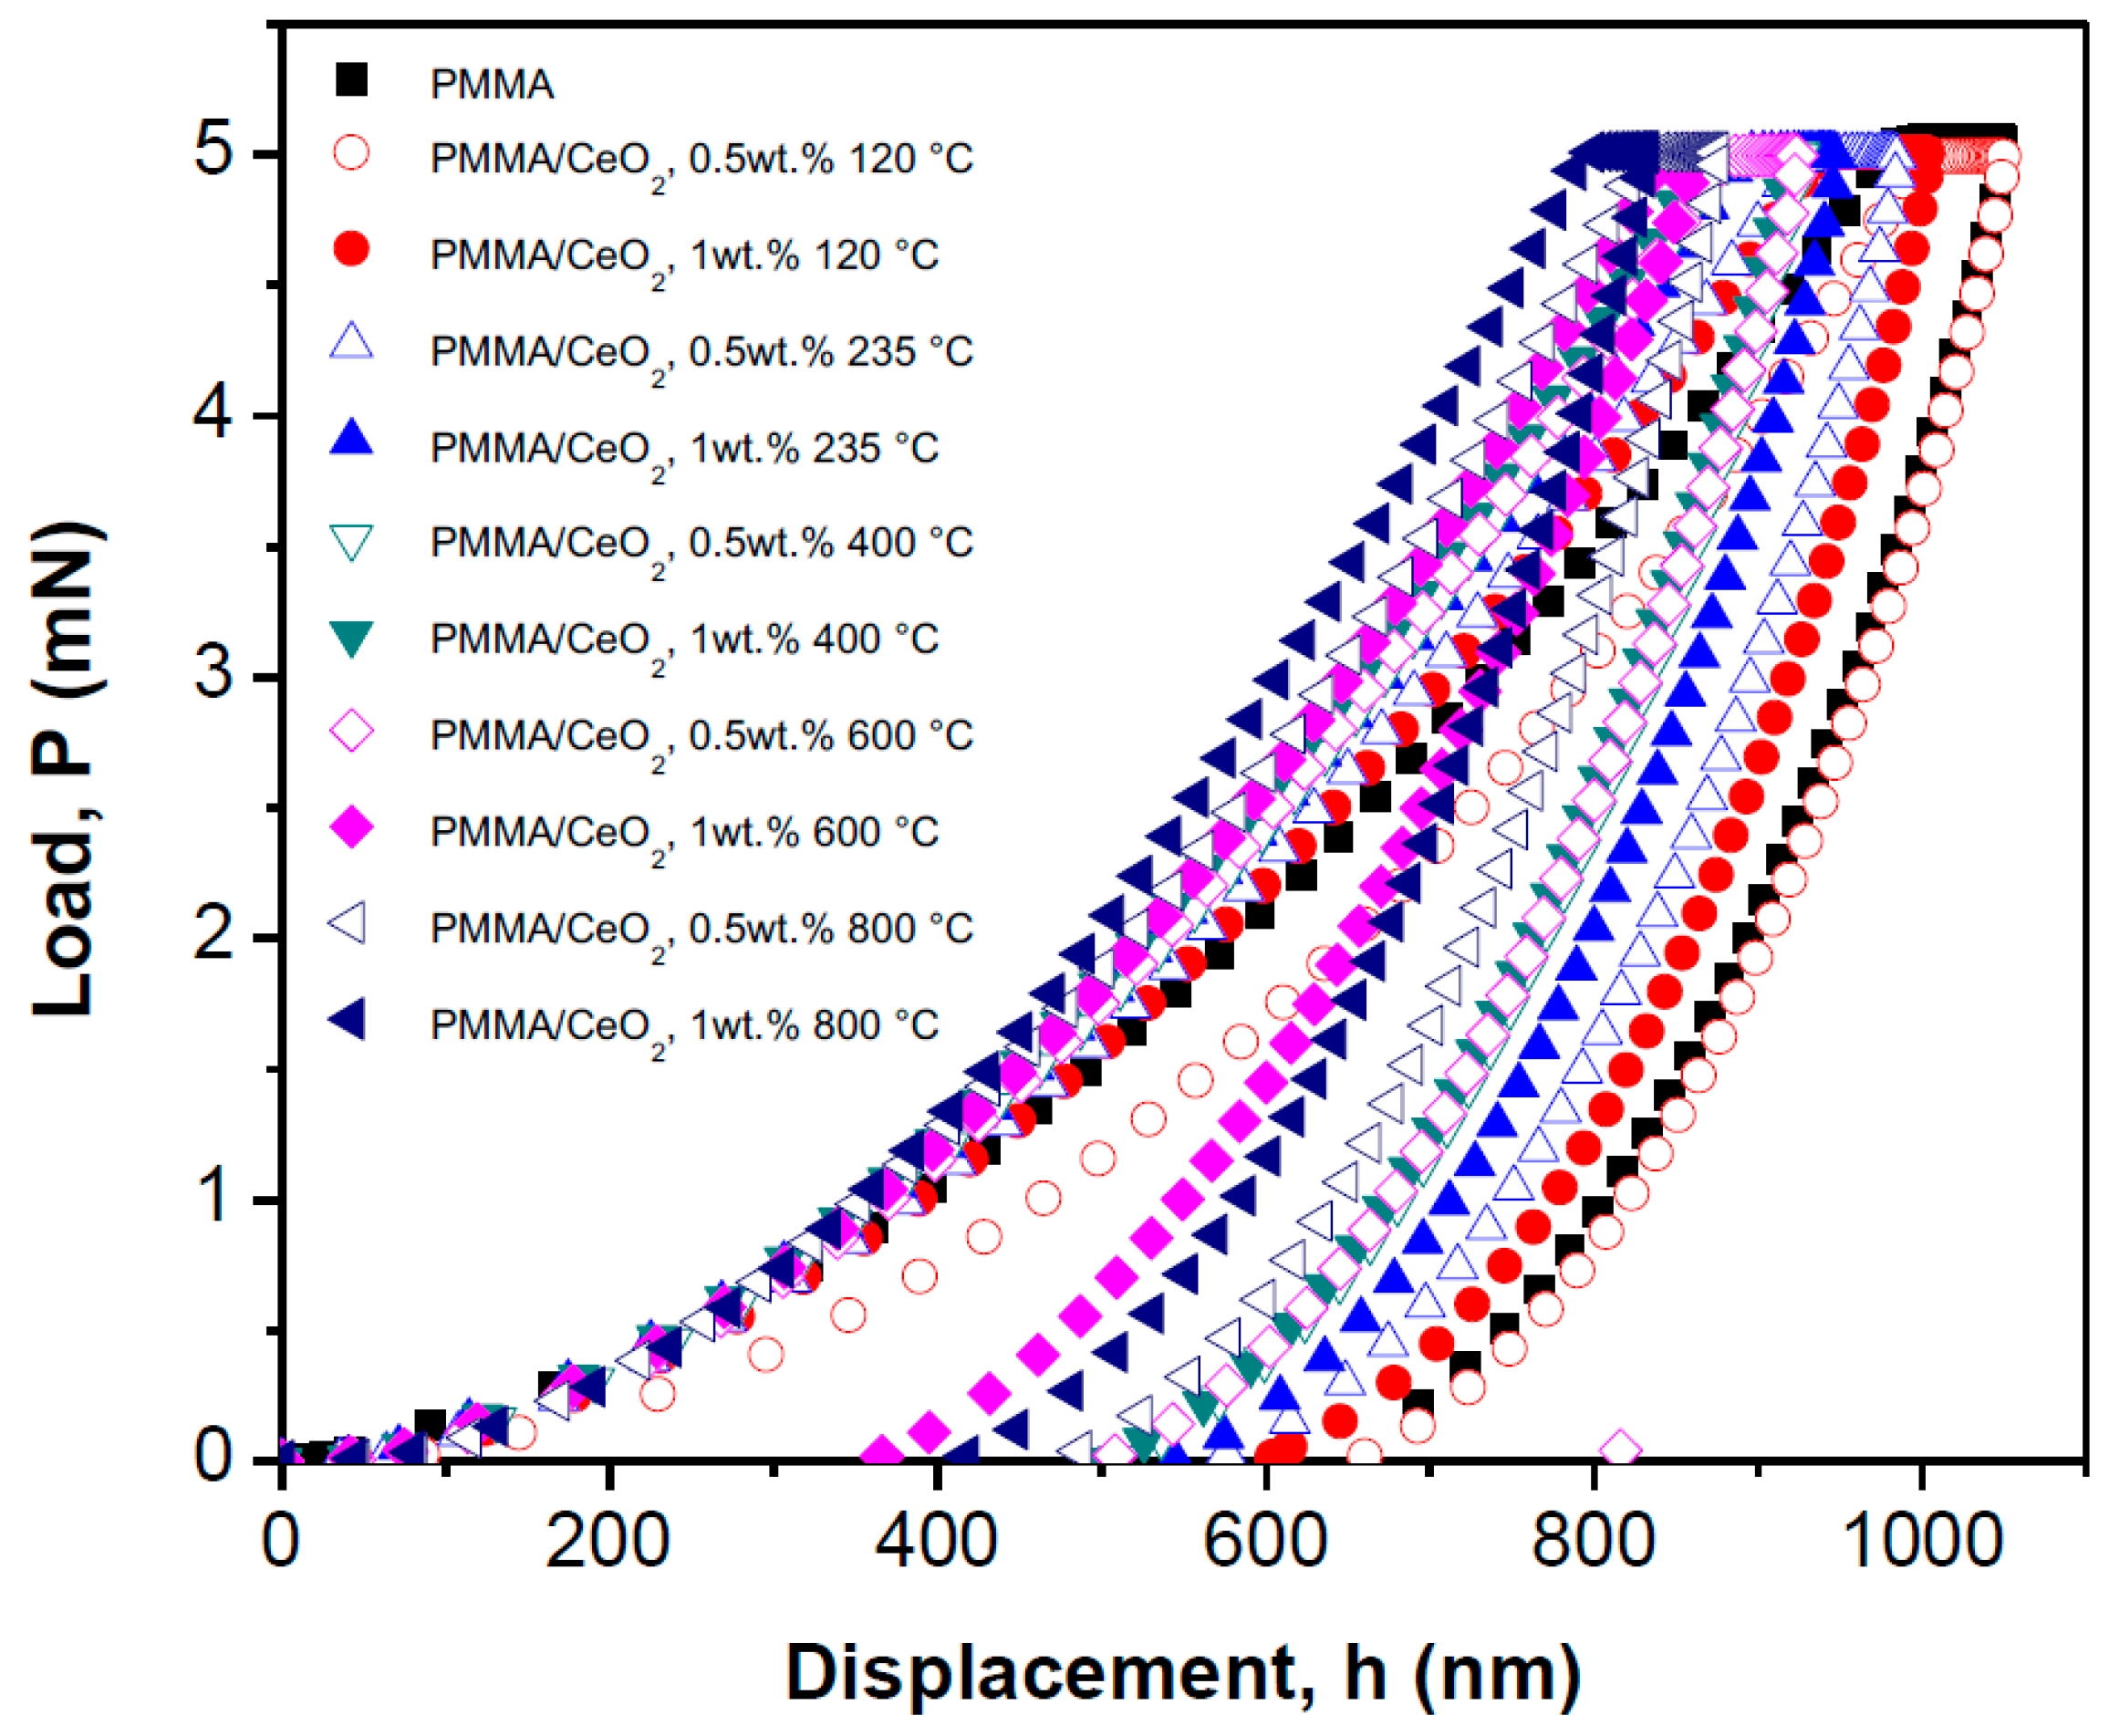
3.2.4. Hardness Tests

Figure 14 shows typical load-displacement curves obtained in the nanoindentation tests for pure PMMA and PMMA/CeO2 hybrid systems. It is clear that the addition of CeO2 nanoparticles within PMMA increases the mechanical properties with decreasing penetration depths. For example, for pure PMMA, the maximum indentation depth at maximum load (5 mN) was 1049 nm, whereas with 0.5 and 1.0 wt % CeO2 thermally treated at 800 °C, the maximum depth was about 874 and 832 nm, respectively.
The hardness (HIT), Vickers hardness (HVIT), elastic modulus (EIT) and creep (CIT) results for pure polymer and PMMA/CeO2 hybrid systems are presented in Table 3. As expected, the HIT and HVIT values were increased with nanoceria powders content from 0.5 to 1.0 wt % as well as with thermal treatment temperature, due to average crystal size and crystallinity of CeO2 nanoparticles. Elastic modulus in the best case (treated samples at 235 and 400 °C) enhanced up to 24%, although no clear trend was observed. In general, a decrease in creep displacement has been observed in PMMA/CeO2 hybrid systems with increasing CeO2 content, showing that the incorporation of rigid CeO2 nanocrystals improves the creep resistance. Finally, the time-dependent deformation of the composites under the applied load was in the range of 2.46%–7.48%. In a previous study, similar HIT and EIT increments were observed in PMMA nanocomposites with ZrO2 nanoparticles prepared by melt blending and ZnO nanoparticles synthesized by spin coating [49,50]. This mechanical enhancement is a result of a homogenous dispersion of aggregates combined with an increase in crystallinity of the nanoparticles. Thus, the overall hardness results of as-prepared samples indicate that the PMMA/CeO2 hybrid systems provide greater stiffness than pure PMMA and therefore are less ductile.
Figure 14. Load-displacement curves of PMMA and PMMA/CeO2 hybrid systems.
Polymers 07 01474 g014
Table 3. Hardness (HIT), Vickers hardness (HVIT), elastic modulus (EIT) and creep (CIT) values for pure PMMA and PMMA/CeO2 hybrid systems.
SampleHIT (MPa)HVIT (Vickers)EIT (GPa)CIT (%)
PMMA254 ± 423.5 ± 0.44.10 ± 0.046.97 ± 0.06
PMMA/CeO2, 0.5 wt %, 120 °C246 ± 422.8 ± 0.64.70 ± 0.055.46 ± 0.08
PMMA/CeO2, 1.0 wt %, 120 °C277 ± 525.7 ± 0.35.02 ± 0.037.48 ± 0.09
PMMA/CeO2, 0.5 wt %, 235 °C288 ± 326.7 ± 0.54.87 ± 0.066.65 ± 0.06
PMMA/CeO2, 1.0 wt %, 235 °C307 ± 628.4 ± 0.85.09 ± 0.066.78 ± 0.05
PMMA/CeO2, 0.5 wt %, 400 °C332 ± 530.7 ± 0.65.08 ± 0.045.64 ± 0.08
PMMA/CeO2, 1.0 wt %, 400 °C334 ± 730.9 ± 0.95.04 ± 0.086.31 ± 0.07
PMMA/CeO2, 0.5 wt %, 600 °C350 ± 332.4 ± 0.74.99 ± 0.095.92 ± 0.04
PMMA/CeO2, 1.0 wt %, 600 °C439 ± 940.7 ± 0.65.44 ± 0.054.97 ± 0.09
PMMA/CeO2, 0.5 wt %, 800 °C395 ± 336.6 ± 0.35.73 ± 0.095.82 ± 0.05
PMMA/CeO2, 1.0 wt %, 800 °C466 ± 843.2 ± 0.44.21 ± 0.072.46 ± 0.09

4. Conclusions

Fluorite phase CeO2 nanoparticles were successfully synthesized by the sol–gel method and their structure and nanocrystallite size were confirmed by XRD and TEM measurements. Similarly, the PMMA/CeO2 hybrid systems were prepared using conventional single-screw melt compounding and were systematically investigated as a function of the amount and thermal treatment temperature of inorganic nanoparticles. 1H NMR spectra revealed only the presence of electrostatic interactions between the PMMA and CeO2 nanoparticles. The XRD analysis showed that the incorporation of CeO2 into the polymer did not change the amorphous structure of the PMMA. The PMMA/CeO2 hybrid systems showed substantially lower UV transmission than pure PMMA. Transparency of the hybrid systems decreased with the amount of nanoceria loading in the PMMA because of the structural phase and agglomeration of CeO2 nanoparticles. UV transmission in PMMA/CeO2 hybrid systems with 0.5 wt % of nanoparticles varies from 10% to 19% in the 250–350 nm region, whereas it was close to zero with 1.0 wt %. Thus, only samples PMMA/CeO2 with 0.5 wt % of nanoparticles sintered at 400 °C showed a balance between UV absorption, color of the material and transparency, which is a necessary condition for building applications. Nevertheless, the other systems that displayed excellent UV-shielding properties are expected to be applied in multifunctional materials industry.
The addition of nanoceria powders increases the degradation and glass transition temperatures of PMMA, independently of the thermal treatment temperature and CeO2 content, which was the result of a homogeneous dispersion of the aggregates and the restriction of mobility of polymer chains. Nanoindentation revealed that the hardness and elastic modulus increase with raising the particle contents and thermal treatment temperature. Finally, these results demonstrate that the crystalline CeO2 particles are useful fillers to increase the mechanical properties of PMMA.

Acknowledgments

María A. Reyes-Acosta is grateful for her postgraduate scholarship from SIP-IPN. The authors are also grateful for the financial support provided by CONACYT through the CB2009-132660 and CB2009-133618 projects and to IPN through the SIP 2015-0227 and 2015-0202 projects and SNI-CONACYT. Thanks to Adela E. Rodríguez-Salazar for her technical support during the revision of the manuscript.

Author Contributions

María A. Reyes-Acosta, Aidé M. Torres-Huerta and Aberlardo I. Flores-Vela designed the experiments. Maria A. Reyes-Acosta performed the experiments and analyzed the data. Héctor J. Dorantes-Rosales and José A. Andraca-Adame performed the morphological characterization. María A. Reyes-Acosta and Miguel A. Domínguez-Crespo wrote the manuscript. Aidé M. Torres-Huerta directed the research, provided the funds and revised the manuscript.

Conflicts of Interest

The authors declare no conflict of interest.

References

  1. Gutierrez, M.P.; Zohdi, T.I. Effective reflectivity and heat generation in sucrose and PMMA mixtures. Energy Build. 2014, 71, 95–103. [Google Scholar] [CrossRef]
  2. Demir, M.M.; Memesa, M.; Castignolles, P.; Wegner, G. PMMA/zinc oxide nanocomposites prepared by in-situ bulk polymerization. Macromol. Rapid Commun. 2006, 27, 763–770. [Google Scholar] [CrossRef]
  3. Gross, S.; Camozzo, D.; Noto, V.D.; Armelao, L.; Tondello, E. PMMA: A key macromolecular component for dielectric low-ĸ hybrid inorganic-organic polymer films. Eur. Polym. J. 2007, 43, 673–696. [Google Scholar] [CrossRef]
  4. Soumya, S.; Mohamed, A.P.; Paul, L.; Mohan, K.; Ananthakumar, S. Near IR reflectance characteristics of PMMA/ZnO nanocomposites for solar thermal control interface films. Sol. Energy Mater. Sol. Cells 2014, 125, 102–112. [Google Scholar] [CrossRef]
  5. Weon, J.I.; Creasy, T.S.; Sue, H.J.; Hsieh, A.J. Mechanical behavior of polymethylmethacrylate with molecules oriented via simple shear. Polym. Eng. Sci. 2005, 45, 314–324. [Google Scholar] [CrossRef]
  6. Saadat-Monfared, A.; Mohseni, M.; Tabatabaei, M.H. Polyurethane nanocomposite films containing nano-cerium oxide as UV absorber. Part 1. Static and dynamic light scattering, small angle neutron scattering and optical studies. Colloids Surf. A Physicochem. Eng. Asp. 2012, 408, 64–70. [Google Scholar] [CrossRef]
  7. Cui, H.; Zayat, M.; Parejo García, P.; Levy, D. Highly eficcient inorganic transparent UV-Protective thion-film coating by low temperature sol–gel procedure for application on heat sensitive substrates. Adv. Mater. 2008, 20, 65–68. [Google Scholar] [CrossRef]
  8. Sugumaran, S.; Bellan, C.S. Transparent nanocomposite PVA-TiO2 and PMMA-TiO2 thin films: Optical and dielectric properties. Opt. Int. J. Light Electron Opt. 2014, 125, 5128–5133. [Google Scholar] [CrossRef]
  9. Laachachi, A.; Ferriol, M.; Cochez, M.; Ruch, D.; Lopez-Cuesta, J.M. The catalytic role of oxide in the thermooxidative degradation of poly(methyl methacrylate)-TiO2 nanocomposites. Polym. Degrad. Stab. 2008, 93, 1131–1137. [Google Scholar] [CrossRef]
  10. Soumya, S.; Mohamed, A.P.; Mohan, K.; Ananthakumar, S. Enhanced near-infrared reflectance and functional characteristics of Al-doped ZnO nano-pigments embedded PMMA coatings. Sol. Energy Mater. Sol. Cells 2015, 143, 335–346. [Google Scholar] [CrossRef]
  11. Zhang, L.; Li, F.; Chen, Y.; Wang, X. Synthesis of transparent ZnO/PMMA nanocomposite films through free-radical copolymerization of asymmetric zinc methacrylate acetate and in-situ thermal decomposition. J. Lumin. 2011, 131, 1701–1706. [Google Scholar] [CrossRef]
  12. Zhang, Y.; Zhuang, S.; Xu, X.; Hu, J. Transparent and UV-shielding ZnO@PMMA nanocomposite films. Opt. Mater. 2013, 36, 169–172. [Google Scholar] [CrossRef]
  13. Hu, J.; Zhou, Y.; He, M.; Yang, X. Novel polysiloxane@CeO2-PMMA hybrid materials for mechanical application. Mater. Lett. 2014, 116, 150–153. [Google Scholar] [CrossRef]
  14. Lima, J.F.; Martins, R.F.; Neri, C.R.; Serra, O.A. ZnO:CeO2-based nanopowders with low catalytic activity as UV absorbers. Appl. Surf. Sci. 2009, 255, 9006–9009. [Google Scholar] [CrossRef]
  15. Aklalouch, M.; Calleja, A.; Granados, X.; Ricart, S.; Boffa, V.; Ricci, F.; Puing, T.; Obradors, X. Hybrid sol–gel layers containing CeO2 nanoparticles as UV-protection of plastic lenses for concentrated photovoltaics. Sol. Energy Mater. Sol. Cells 2014, 120, 175–182. [Google Scholar] [CrossRef]
  16. Panahi-Kalamuei, M.; Alizadeh, S.; Mousavi-Kamazani, M. Synthesis and characterization of CeO2 nanoparticles via hydrothermal route. J. Ind. Eng. Chem. 2015, 21, 1301–1305. [Google Scholar] [CrossRef]
  17. Khan, S.B.; Faisal, M.; Rahman, M.M.; Jamal, A. Exploration of CeO2 nanoparticles as a chemi-sensor and photo-catalyst for environmental applications. Sci. Total Environ. 2011, 409, 2987–2992. [Google Scholar] [CrossRef] [PubMed]
  18. Taguchi, M.; Takami, S.; Adschiri, T.; Nakane, T.; Sato, K.; Naka, T. Supercritical hydrothermal synthesis of hydrophilic polymer-modified water-dispersible CeO2 nanoparticles. Cryst. Eng. Comm. 2011, 13, 2841–2848. [Google Scholar] [CrossRef]
  19. Ivanov, V.K.; Shaporev, A.S.; Kiryukhin, D.P.; Bol´shakov, A.I.; Gil, D.O.; Kichigina, G.A.; Kozik, V.V.; Buznik, V.M.; Tretyakov, Y.D. Synthesis of polymer composites based on nanocrystalline ZnO and CeO2. Dokl. Chem. 2010, 431, 109–112. [Google Scholar] [CrossRef]
  20. Pati, R.K.; Lee, I.C.; Chu, D.; Hou, S.; Ehrman, S.H. Nanosized ceria based water-gas shift (WGS) catalyst for fuel cell applications. Prepr. Pap. Am. Chem. Soc. Div. Fuel Chem. 2004, 49, 953–954. [Google Scholar]
  21. Ansari, A.A. Optical and structural properties of sol–gel derived nanostructured CeO2 film. J. Semicond. 2010, 31, 053001. [Google Scholar] [CrossRef]
  22. Liu, B.; Liu, B.; Li, Q.; Li, Z.; Liu, R.; Zou, X.; Wu, W.; Cui, W.; Liu, Z.; Li, D.; et al. Solvothermal synthesis of monodisperse self-assembly CeO2 nanospheres and their enhanced blue-shifting in ultraviolet absorption. J. Alloys Compd. 2010, 503, 519–524. [Google Scholar] [CrossRef]
  23. Phonthammachai, N.; Rumruangwong, M.; Gulari, E.; Jamieson, A.M.; Jitkarnka, S. Synthesis and rheological properties of mesoporous nanocrystalline CeO2 via sol–gel process. Colloids Surf. A Physicochem. Eng. Asp. 2004, 247, 61–68. [Google Scholar] [CrossRef]
  24. Podzorova, L.I.; Il’icheva, A.A.; Mikhailina, N.A.; Shevchenko, V.Y.; Bashlykov, D.S.; Rodicheva, G.V.; Shvorneva, L.I. Effect of synthesis conditions on the phase composition of ZrO2-CeO2-AlO3 sol–gel powders. Inorg. Mater. 2001, 37, 51–57. [Google Scholar] [CrossRef]
  25. Mamana, N.; Díaz-Parralejo, A.; Ortiz, A.L.; Sánchez-Bajo, F.; Caruso, R. Influence of the synthesis process on the features of Y2O3-stabilized ZrO2 powders obtained by the sol–gel method. Ceram. Int. 2014, 40, 6421–6426. [Google Scholar] [CrossRef]
  26. Dos Santos, V.; da Silveira, N.P.; Bergmann, C.P. In-situ evaluation of particle size distribution of ZrO2-nanoparticles obtained by sol–gel. Powder Technol. 2014, 267, 392–397. [Google Scholar] [CrossRef]
  27. Chen, Y.; Li, Z.; Miao, N. Polymethylmethacrylate (PMMA)/CeO2 hybrid particles for enhanced chemical mechanical polishing performance. Tribol. Int. 2015, 82, 211–217. [Google Scholar] [CrossRef]
  28. Oliver, W.C.; Pharr, G.M. Measurement of hardness and elastic modulus by instrumented indentation: Advances in understanding and refinements to methodology. J. Mater. Res. 2004, 19, 3–20. [Google Scholar] [CrossRef]
  29. Andreescu, D.; Matijevć, E.; Goia, D.V. Formation of uniform colloidal ceria in polyol. Colloids Surf. A Physicochem. Eng. Asp. 2006, 291, 93–100. [Google Scholar] [CrossRef]
  30. Truffault, L.; Andrezza, C.; Santilli, C.V.; Pulcinelli, S.H. Synthesis of PTSH-modified CeO2nanoparticles: Effect of the modifier on structure, optical properties, and dispersibility. Colloids Surf. A Physicochem. Eng. Asp. 2013, 426, 63–69. [Google Scholar] [CrossRef]
  31. Lee, J.-S.; Choi, S.C. Crystallization behavior of nano-ceria powders by hydrothermal synthesis using a mixture of H2O2 and NH4OH. Mater. Lett. 2004, 58, 390–393. [Google Scholar] [CrossRef]
  32. Liu, J.; Zhao, Z.; Wang, J.; Xu, C.; Duan, A.; Jiang, G.; Yang, Q. The highly active catalysts of nanometric CeO2-supported cobalt oxides for soot combustion. Appl. Catal. B 2008, 84, 185–195. [Google Scholar] [CrossRef]
  33. Padalia, D.; Bisht, G.; Johri, U.C.; Asokan, K. Fabrication and characterization of cerium doped barium titanate/PMMA nanocomposites. Solid State Sci. 2013, 19, 122–129. [Google Scholar] [CrossRef]
  34. Cullity, B.D.; Stock, S.R. Elements of X-ray Diffraction, 3rd ed.; Prentice Hall: Upper Saddle River, NJ, USA, 2001; pp. 167–170. [Google Scholar]
  35. Su, W.; Wang, S.; Wang, X.; Fu, X.; Weng, J. Plasma pre-treatment and TiO2 coating of PMMA for the improvement of antibacterial properties. Surf. Coat. Technol. 2010, 205, 465–469. [Google Scholar] [CrossRef]
  36. Sathish, S.; Shekar, B.C. Preparation and characterization of nano scale PMMA thin films. Indian J. Pure Appl. Phys. 2014, 52, 64–67. [Google Scholar]
  37. Marsalek, R. Particle size and zeta potential of ZnO. APCBEE Proced. 2014, 9, 13–17. [Google Scholar] [CrossRef]
  38. Díez-Pascual, A.M.; Gómez-Fatou, M.A.; Ania, F.; Flores, A. Nanoindentation in polymer nanocomposites. Prog. Mater. Sci. 2015, 67, 1–94. [Google Scholar] [CrossRef]
  39. Yang, Y.; Mao, P.; Wang, Z.-P.; Zhang, J.-H. Distribution of nanoparticle number concentrations at a nano-TiO2 plant. Aerosol Air Qual. Res. 2012, 12, 934–940. [Google Scholar] [CrossRef]
  40. Leong, K.H.; Monash, P.; Ibrahim, S.; Saravanan, P. Solar photocatalytic activity of anatase TiO2 nanocrystals synthesized by non-hydrolitic sol–gel method. Sol. Energy 2014, 101, 321–332. [Google Scholar] [CrossRef]
  41. Huang, Y.; Cai, Y.; Qiao, D.; Liu, H. Morphology-controllable synthesis and characterization of CeO2 nanocrystals. Particuology 2011, 9, 170–173. [Google Scholar] [CrossRef]
  42. Wu, X.; Wang, Y.; Zhu, P.; Sun, R.; Yu, S.; Du, R. Using UV-Vis spectrum to investigate the phase transition process of PMMA-SiO2@paraffin microcapsules with copper-chelating as the ion probe. Mater. Lett. 2011, 65, 705–707. [Google Scholar] [CrossRef]
  43. Shirai, M.; Yamamoto, T.; Tsunooka, M. Ablative photodegradation of poly(methyl methacrylate) and its homologues by 185-nm light. Polym. Degrad. Stab. 1999, 63, 481–487. [Google Scholar] [CrossRef]
  44. Kashiwagi, T.; Inaba, A.; Brown, J.E.; Hatada, K.; Kitayama, T.; Masuda, E. Effects of weak linkages on the thermal and oxidative degradation of poly(methyl methacrylate). Macromolecules 1986, 19, 2160–2168. [Google Scholar] [CrossRef]
  45. Zhu, L.Y.; Wang, X.Q.; Ren, Q.; Zhang, G.H.; Xu, D. Morphology and crystal structure of CeO2-modified mesoporous ZrO2 powders prepared by sol–gel method. Mater. Chem. Phys. 2012, 133, 445–451. [Google Scholar] [CrossRef]
  46. Dzunuzovic, E.S.; Dzunuzovic, J.V.; Marinkovic, A.D.; Marinovic-Cincovic, M.T.; Jeremic, K.B.; Nedeljkovic, J.M. Influence of surface modified TiO2 nanoparticles by gallates on the properties of PMMA/TiO2 nanocomposites. Eur. Polym. J. 2012, 48, 1385–1393. [Google Scholar] [CrossRef]
  47. Zhao, Q.; Samulski, E.T. A comparative study of poly(methyl methacrylate) and polystyrene/clay nanocomposites prepared in supercritical carbon dioxide. Polymer 2006, 47, 663–671. [Google Scholar] [CrossRef]
  48. Parker, K.; Schneider, R.T.; Siegel, R.W.; Ozisik, R.; Cabanelas, J.C.; Serrano, B.; Antonelli, C.; Baselga, J. Molecular probe technique for determining local thermal transitions: The glass transition at silica/PMMA nanocomposite interfaces. Polymer 2010, 51, 4891–4898. [Google Scholar] [CrossRef]
  49. Chakraborty, H.; Sinha, A.; Mukherjee, N.; Ray, D.; Chattopadhyay, P.P. A study on nanoindentation and tribological behavior of multifunctional ZnO/PMMA nanocomposite. Mater. Lett. 2013, 93, 137–140. [Google Scholar] [CrossRef]
  50. Reyes-Acosta, M.A.; Torres-Huerta, A.M.; Domínguez-Crespo, M.A.; Flores-Vela, A.I.; Dorantes-Rosales, H.J.; Ramírez-Meneses, E. Influence of ZrO2 nanoparticles and termal treatmentontheproperties of PMMA/ZrO2 hybridcoatings. J. Alloy. Compd. 2015, 643, S150–S158. [Google Scholar] [CrossRef]

