
Phase Behavior and Its Effects on Crystallization in a Poly(trimethylene terephthalate)/Phenoxy Resin Blend

Abstract
:
1. Introduction
2. Experimental
2.1. Materials
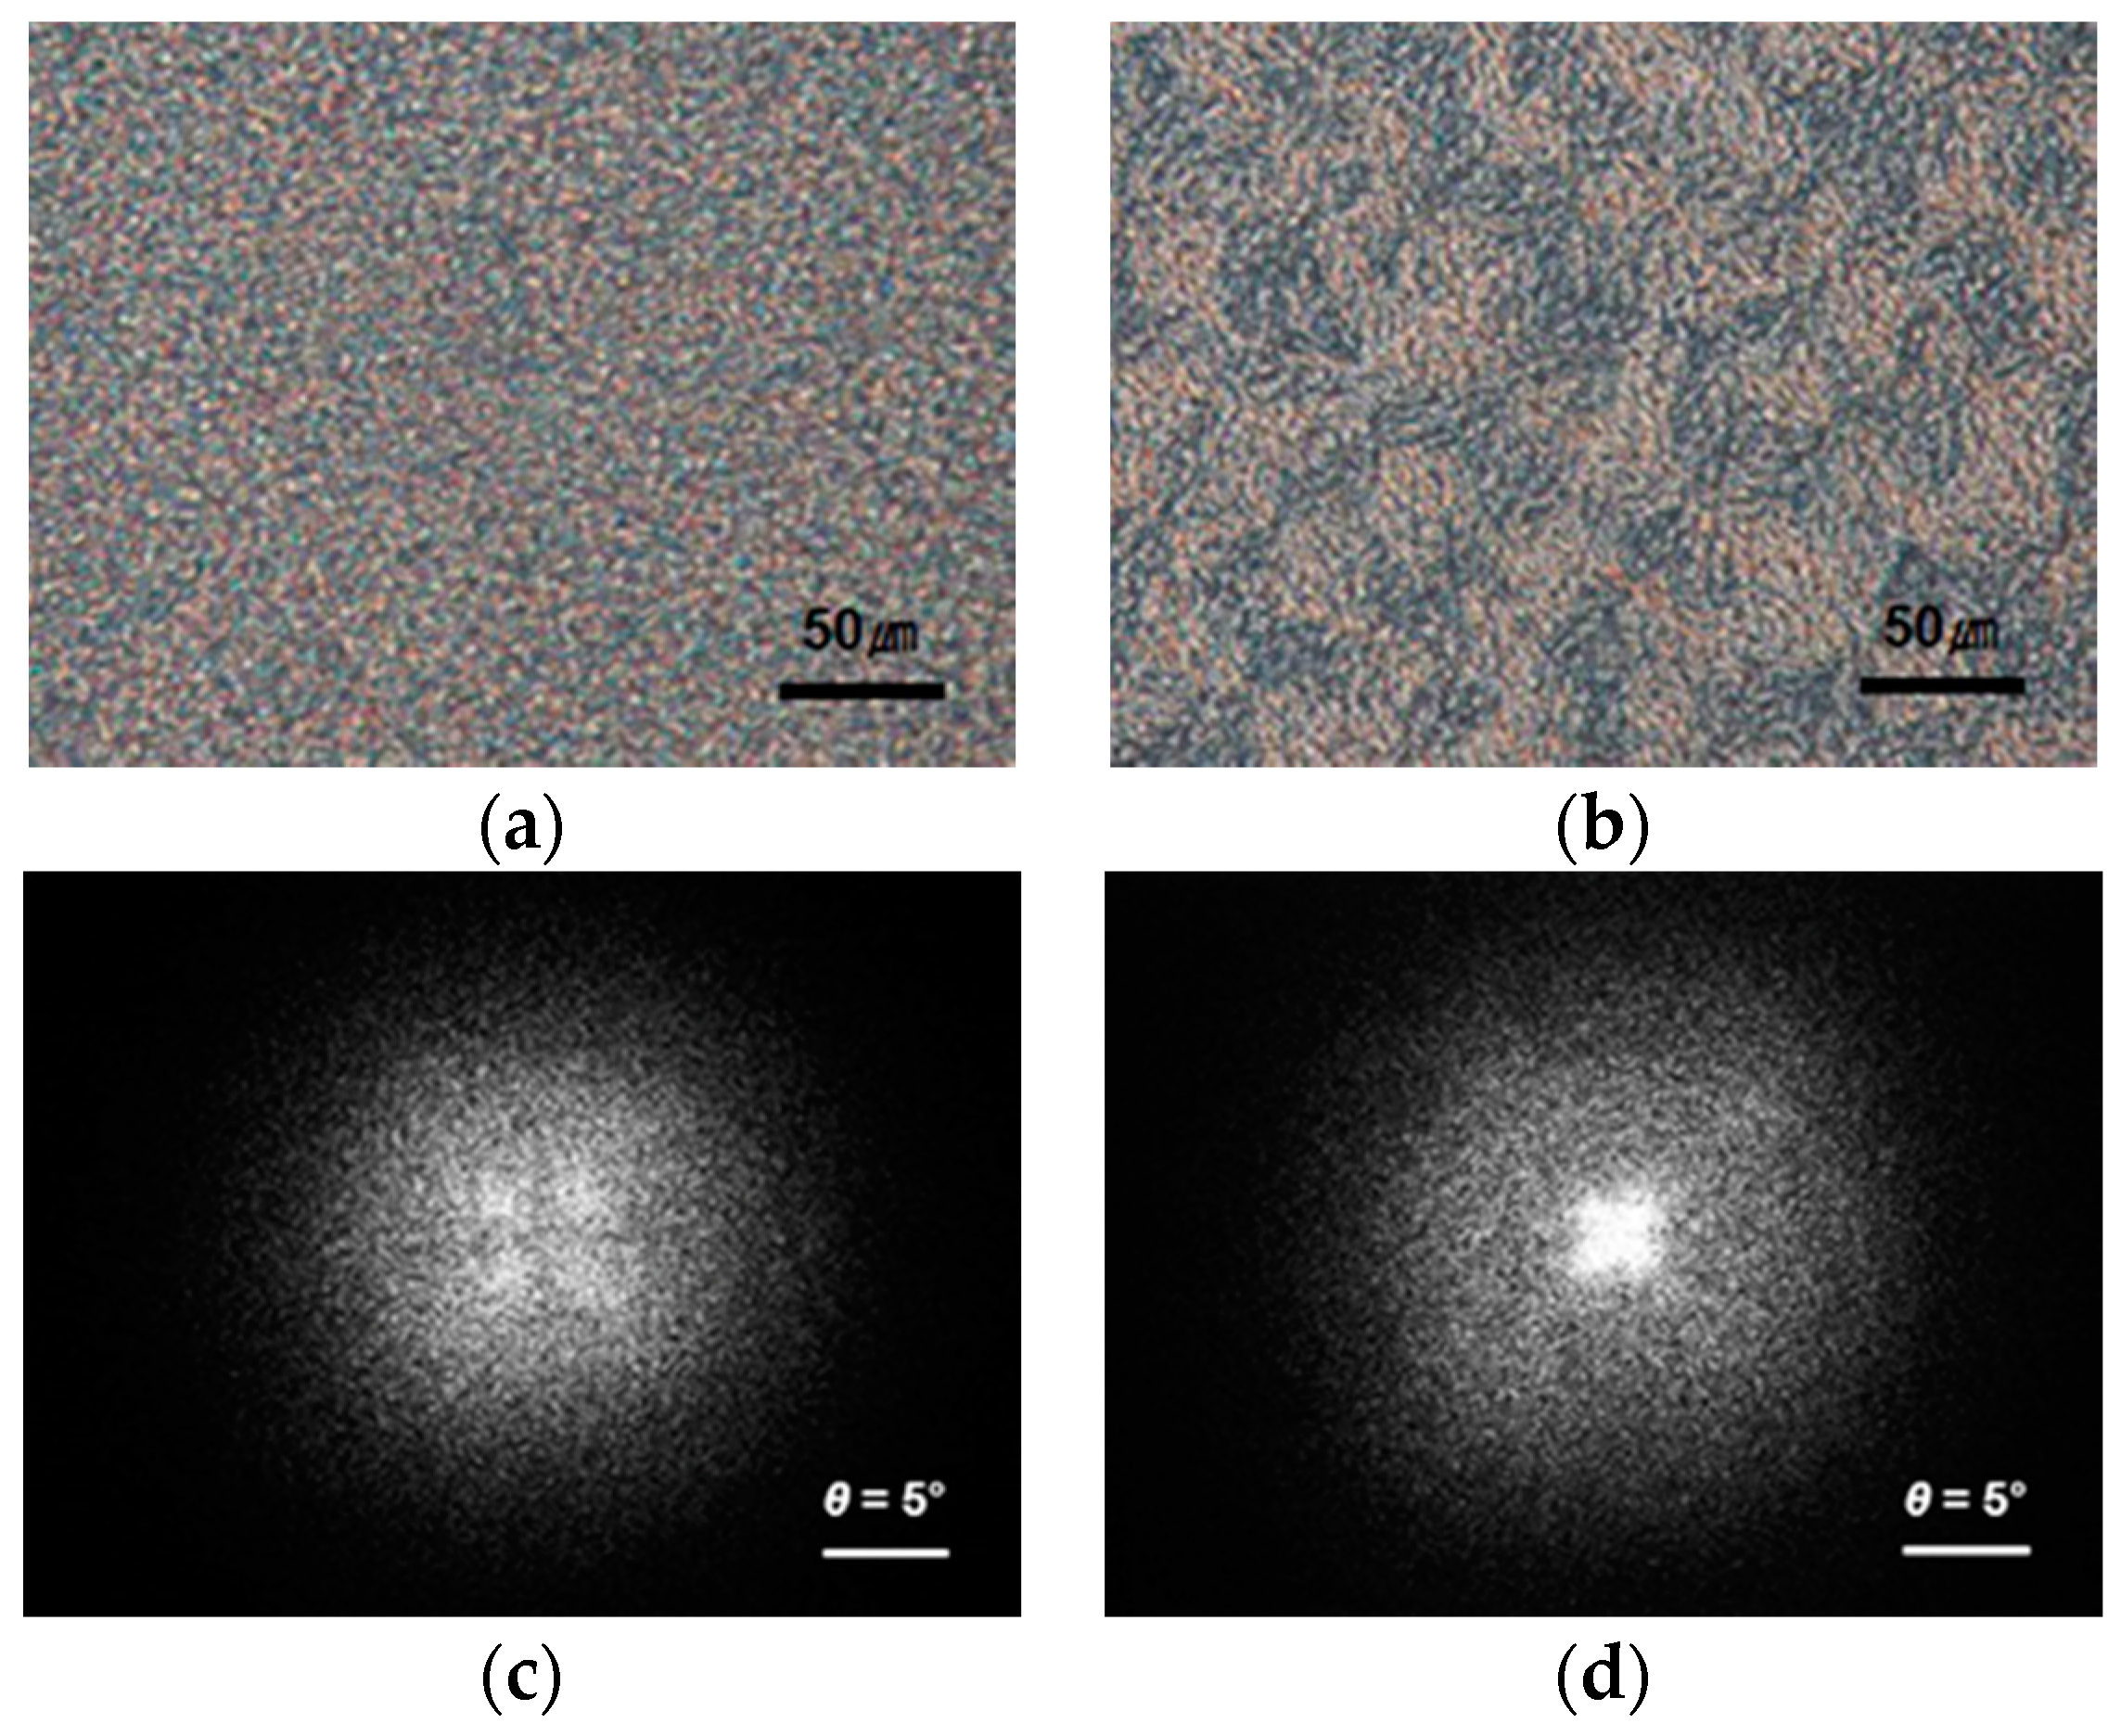
2.2. TRLS and OM
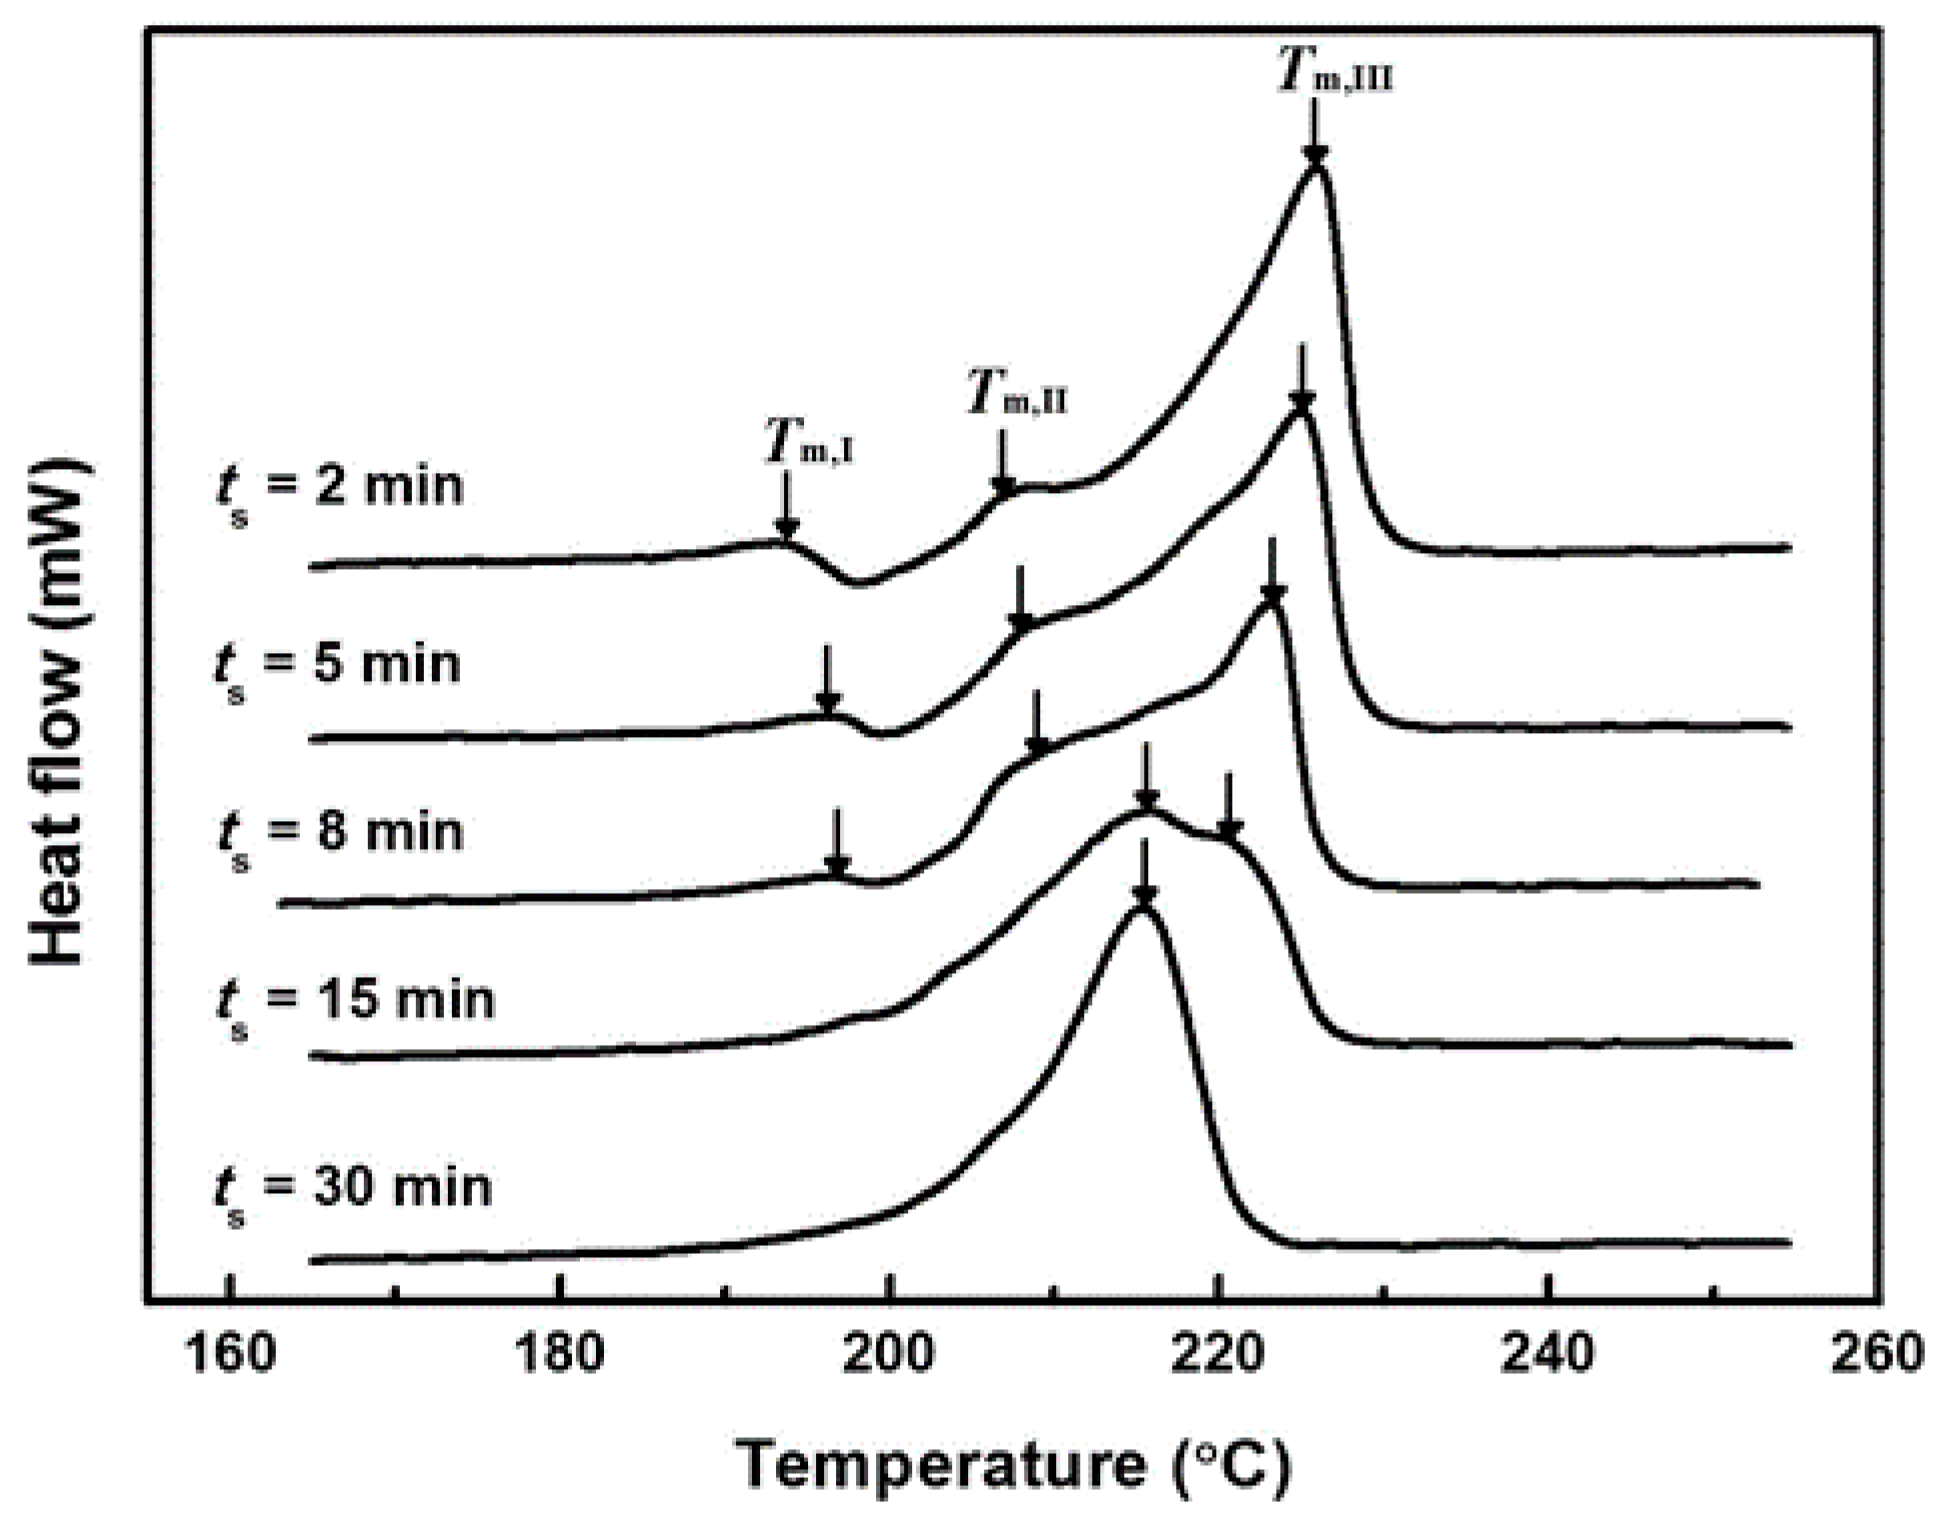
2.3. Differential Scanning Calorimetry (DSC)
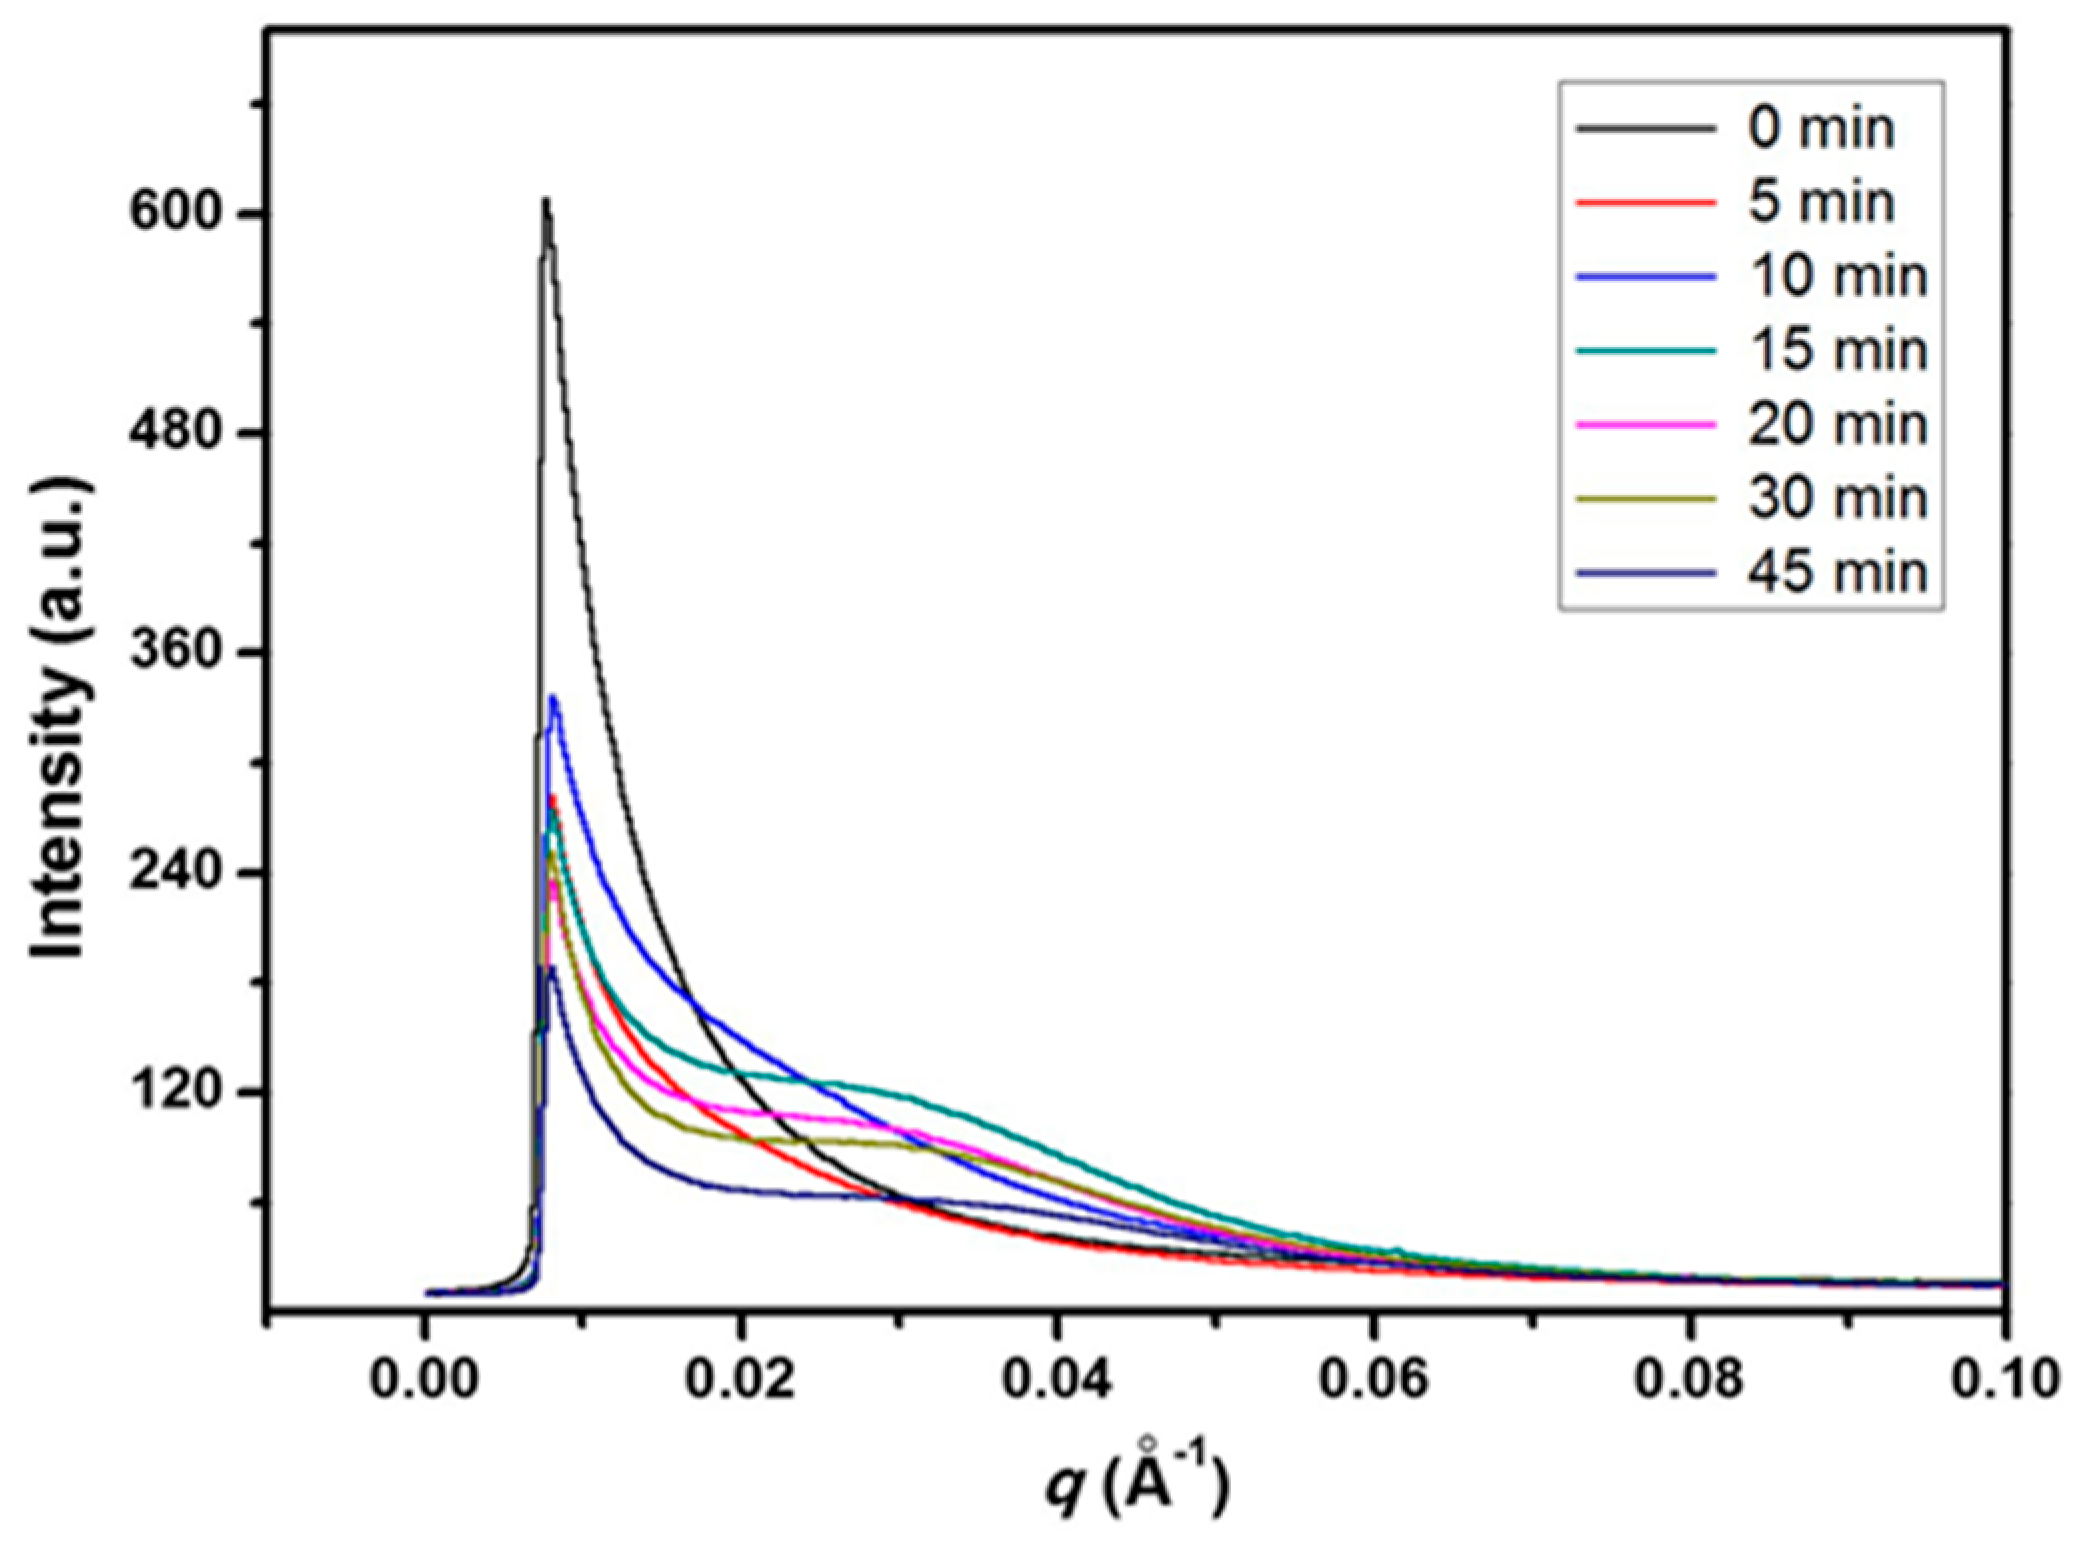
2.4. Small-Angle X-ray Scattering (SAXS)
3. Results and Discussion


4. Conclusions
Acknowledgments
Author Contributions
Conflicts of Interest
References
- Inaba, N.; Sato, K.; Suzuki, S.; Hashimoto, T. Morphology control of binary polymer mixtures by spinodal decomposition and crystallization. 1. Principle of method and preliminary results on PP/EPR. Macromolecules 1986, 19, 1690–1695. [Google Scholar] [CrossRef]
- Nojima, S.; Satoh, K.; Ashida, T. Morphology formation by combined effect of crystallization and phase separation in a binary blend of poly(iε-caprolactone) and polystyrene oligomer. Macromolecules 1991, 24, 942–947. [Google Scholar] [CrossRef]
- Lee, C.H.; Saito, H.; Inoue, T. Morphology development in isotactic polypropylene/partially hydrogenated oligo(styrene-co-indene) blend. Macromolecules 1995, 28, 8096–8101. [Google Scholar] [CrossRef]
- Okamoto, M.; Kotaka, T. Phase separation and homogenization in poly(ethylene naphthalene-2,6-dicarboxylate)/poly(ethylene terephthalate) blends. Polymer 1997, 38, 1357–1361. [Google Scholar] [CrossRef]
- Chen, H.-L.; Hsiao, M.-S. Morphological structure induced by combined crystallization and liquid−liquid demixing in poly(ethylene terephthalate)/poly(ether imide) blends. Macromolecules 1998, 31, 6579–6584. [Google Scholar] [CrossRef]
- Chen, H.-L.; Hwang, J.C.; Yang, J.-M.; Wang, R.-C. Simultaneous liquid–liquid demixing and crystallization and its effect on the spherulite growth in poly(ethylene terephthalate)/poly(ether imide) blends. Polymer 1998, 39, 6983–6989. [Google Scholar] [CrossRef]
- Shi, W.; Han, C.C. Dynamic competition between crystallization and phase separation at the growth interface of a PMMA/PEO blend. Macromolecules 2012, 45, 336–346. [Google Scholar] [CrossRef]
- Mondragon, I.; Remiro, P.M.; Nazábal, J. Exchange reactions on polyarylate-phenoxy blends: Their influence on the physical and mechanical behaviour. Eur. Polym. J. 1987, 23, 125–128. [Google Scholar] [CrossRef]
- Yang, X.; Painter, P.C.; Coleman, M.M. Infrared and thermal analysis studies of transreactions in phenoxy-polycarbonate blends. Macromolecules 1992, 25, 4996–5001. [Google Scholar] [CrossRef]
- Aravind, I.; Eichhorn, K.-J.; Komber, H.; Jehnichen, D.; Zafeiropoulos, N.E.; Ahn, K.H.; Grohens, Y.; Stamm, M.; Thomas, S. A study on reaction-induced miscibility of poly(trimethylene terephthalate)/polycarbonate blends. J. Phys. Chem. B 2009, 113, 1569–1578. [Google Scholar] [CrossRef] [PubMed]
- Su, C.-C.; Wang, S.-C.; Chen, W.-J.; Lee, L.-T. Phase compatibilization through chemical exchange reactions in blends of copolyesters with poly(hydroxyether of bisphenol A) upon annealing. Ind. Eng. Chem. Res. 2013, 52, 12587–12595. [Google Scholar] [CrossRef]
- Baldenegro-Perez, L.A.; Navarro-Rodriguez, D.; Medellin-Rodriguez, F.J.; Hsiao, B.; Avila-Orta, C.A.; Sics, I. Molecular weight and crystallization temperature effects on poly(ethylene terephthalate) (PET) homopolymers, an isothermal crystallization analysis. Polymers 2014, 6, 583–600. [Google Scholar] [CrossRef]
- Koberstein, J.T.; Morra, B.; Stein, R.S. The determination of diffuse-boundary thicknesses of polymers by small-angle X-ray scattering. J. Appl. Crystallogr. 1980, 13, 34–45. [Google Scholar] [CrossRef]
- Lee, J.K.; Im, J.E.; Park, J.H.; Won, H.Y.; Lee, K.H. Morphology development and crystallization behavior of a poly(ethylene terephthalate)/polycarbonate blend. J. Appl. Polym. Sci. 2006, 99, 2220–2225. [Google Scholar] [CrossRef]
- Kim, G.S.; Lee, J.K.; Choi, M.J.; Lee, K.H. Morphology development and crystallization behavior of poly(ethylene terephthalate)/phenoxy blend. J. Polym. Sci. B 2008, 46, 223–232. [Google Scholar] [CrossRef]
- Hong, P.-D.; Chung, W.-T.; Hsu, C.-F. Crystallization kinetics and morphology of poly(trimethylene terephthalate). Polymer 2002, 43, 3335–3343. [Google Scholar] [CrossRef]
- Chen, H.-B.; Zeng, J.-B.; Dong, X.; Chen, L.; Wang, Y.-Z. Block phosphorus-containing poly(trimethylene terephthalate) copolyester via solid-state polymerization: Retarded crystallization and melting behaviour. CrystEngComm 2013, 15, 2688–2698. [Google Scholar] [CrossRef]
- Al Raheil, I.A.M. Morphology and crystallization of poly(ethylene terephthalate). Polym. Int. 1994, 35, 189–195. [Google Scholar] [CrossRef]
- Stein, R.S.; Chu, W. Scattering of light by disordered spherulites. J. Polym. Sci. Polym. Phys. 1970, 8, 1137–1157. [Google Scholar] [CrossRef]
© 2016 by the authors. Licensee MDPI, Basel, Switzerland. This article is an open access article distributed under the terms and conditions of the Creative Commons by Attribution (CC-BY) license ( http://creativecommons.org/licenses/by/4.0/).
Share and Cite
Cho, S.J.; Cho, J.H.; Lee, K.H. Phase Behavior and Its Effects on Crystallization in a Poly(trimethylene terephthalate)/Phenoxy Resin Blend. Polymers 2016, 8, 21. https://doi.org/10.3390/polym8010021
Cho SJ, Cho JH, Lee KH. Phase Behavior and Its Effects on Crystallization in a Poly(trimethylene terephthalate)/Phenoxy Resin Blend. Polymers. 2016; 8(1):21. https://doi.org/10.3390/polym8010021
Chicago/Turabian StyleCho, Su Jung, Jae Han Cho, and Kwang Hee Lee. 2016. "Phase Behavior and Its Effects on Crystallization in a Poly(trimethylene terephthalate)/Phenoxy Resin Blend" Polymers 8, no. 1: 21. https://doi.org/10.3390/polym8010021