3.1. Illustrative Computational Examples
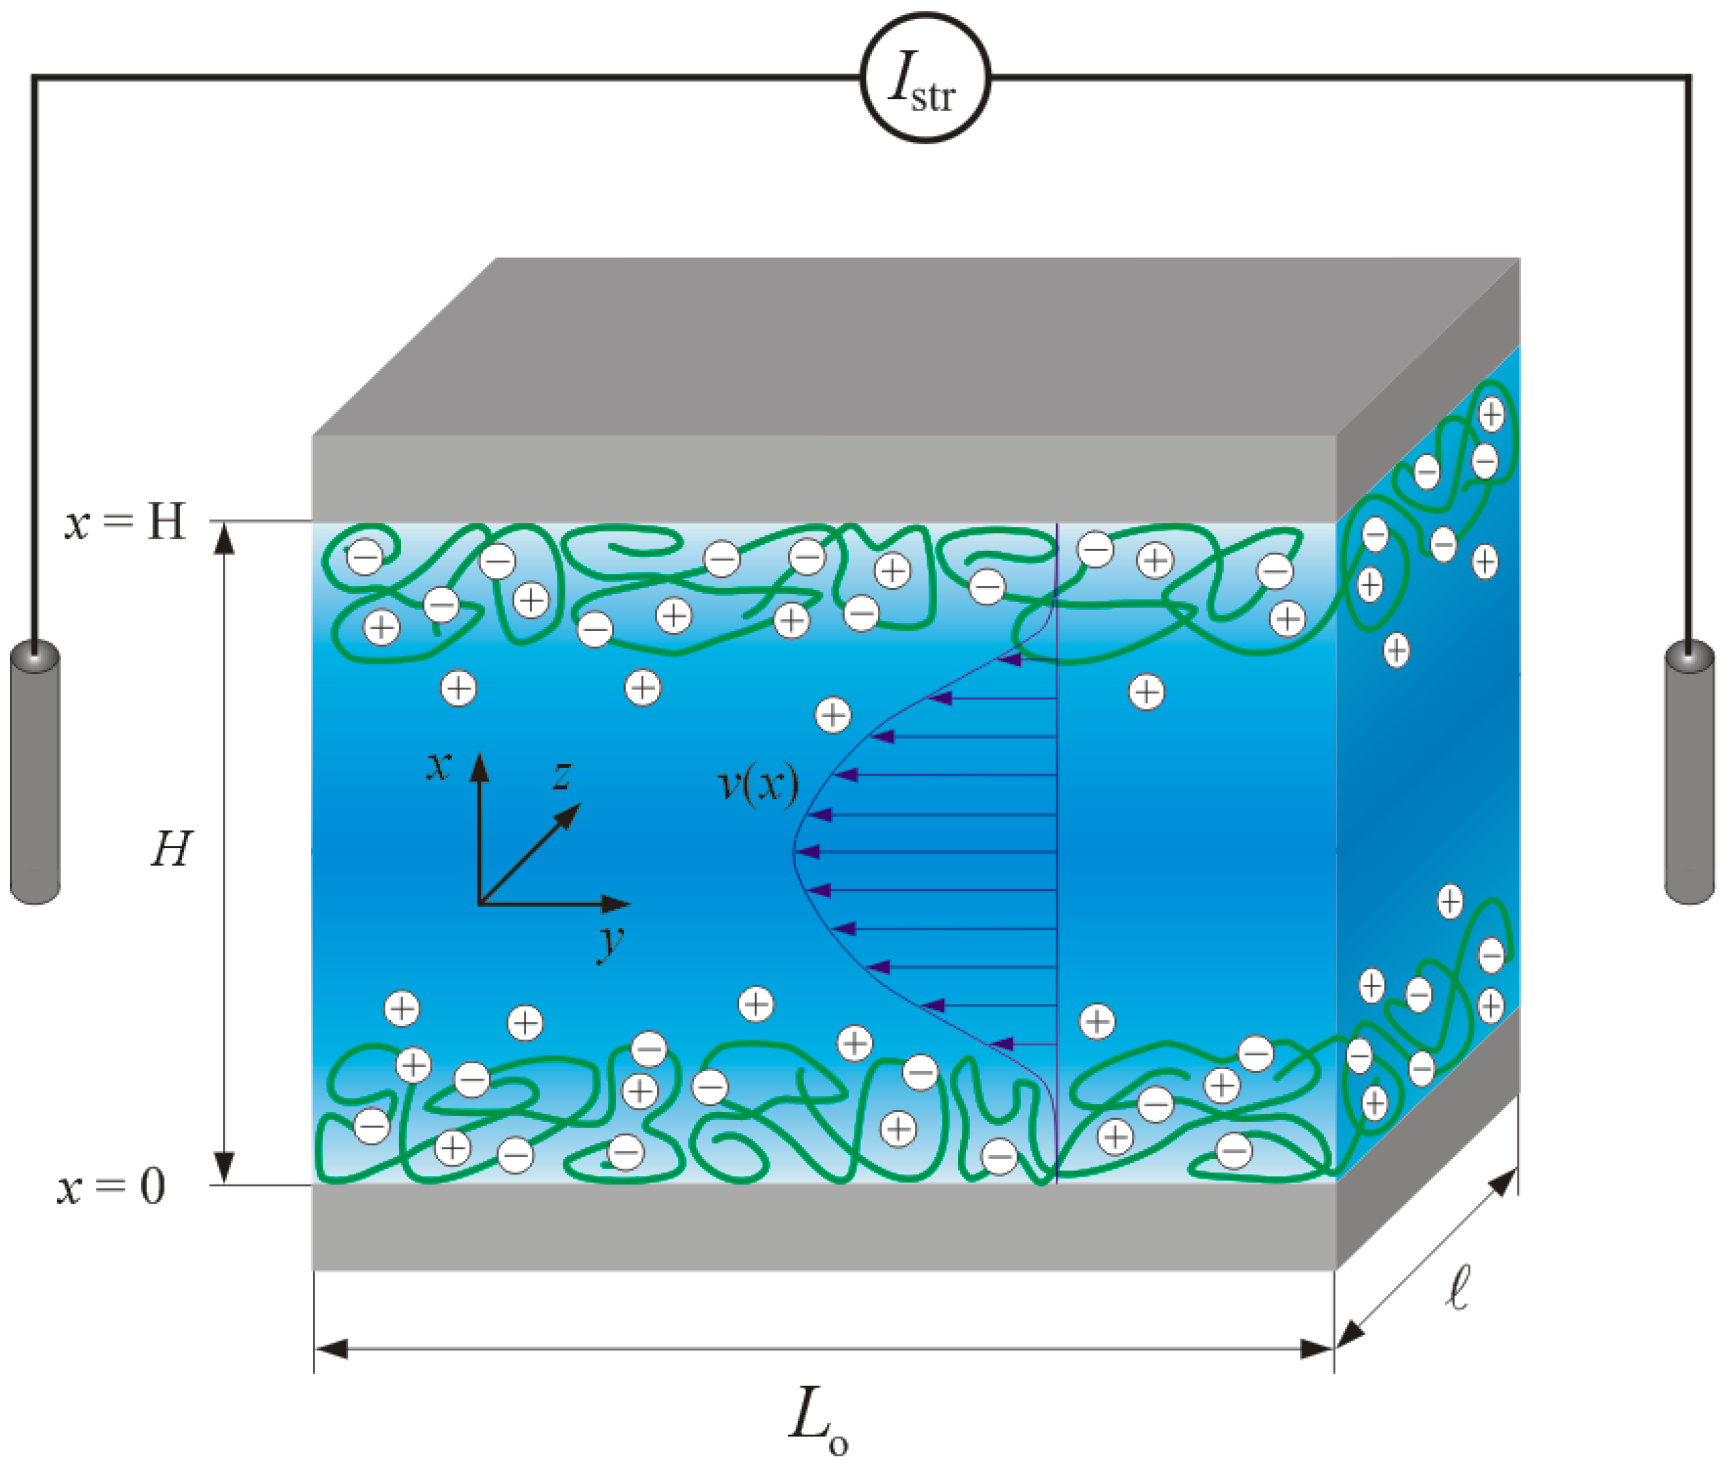
In this section, we briefly discuss the basic processes governing the dependence of the pressure-normalized streaming current,
, on electrolyte concentration, flow penetration length scale
(
Figure 2A,B), charge density
in (anionic) polyelectrolyte film (
Figure 2C) and segment density distribution therein (
Figure 2D). For the sake of demonstration, we consider a monovalent electrolyte of bulk concentration
c and films with a given (negative) density of charges (
i.e., no variation of the film charge with the pH).
In order to first highlight the hydrodynamic contribution of the polyelectrolyte film (thickness
d) to
,
Figure 2A refers to the situation of an uncharged film (
) supported by a hard carrier with (negative) surface potential, the latter identifying with the carrier zeta-potential
that can be measured in the absence of the film [
24]. The ratio
for this interfacial system is reported as a function of
c expressed here in terms of the dimensionless quantity
that compares the Debye layer thickness
with the film thickness
d. At fixed
,
Figure 2A illustrates that
increases in magnitude with increasing
. Upon increase of the penetration of the pressure-driven flow in the film, which is related to a decrease of the film hydrodynamic drag, the counter ions located in the vicinity of the charged supporting substrate become accessible to the flow and
increases accordingly. The amount of electrokinetically active ions thus increases with increasing
, and so does
. As expected, at fixed
decreases with increasing
because of the screening of the carrier surface charge by ions present in the medium. Doing so,
reaches at sufficiently large
an asymptotic plateau, the value of which is determined by
. In this limit where
, the electric double layer significantly recedes within the film coating and
becomes essentially determined by details of flow velocity and electrostatic potential distributions in the direct neighborhood of the carrier surface. Under such conditions, it can be shown that the streaming current reduces to [
24]:
where
and
is the dimensionless zeta-potential of the substrate. In the extreme
, the situation is that of a free-draining film fully permeable to flow. From a hydrodynamic point of view, the (uncharged) film is thus immaterial and its presence does not affect the electrokinetic signature of the rigid surface. The streaming current then simplifies into the well-known Smoluchowski formulation
. In the other limit where
, the film is
stricto sensu impermeable. The streaming current can then be written as a function of the electrostatic potential at the outer film surface (
in
Figure 1)
via the modified Smoluchowski equation
that holds at sufficiently low
where linearization of the Poisson-Boltzmann equation is legitimate.
Figure 2A makes it clear that the screening of the carrier surface charge by the film is defined by the interplay between 1/λ
o and
d (hydrodynamic screening), and by the respective magnitudes of
and
d (electrostatic screening).
Another way to formulate these two types of processes is to define the so-called electrokinetic thickness of the film coating, denoted as
δE and expressed
via the following relationship
The effective electrokinetic potential
involved in Equation (11) is obtained from the Smoluchowski-based conversion of the streaming current
rigorously evaluated in the presence of the film layer,
i.e. . The presence of the uncharged film leads to a partial or complete suppression of the flow in the vicinity of the charged rigid surface so that
. In this picture,
is thus basically determined from the outer shift of a virtual “plane of shear” for which the decrease in zeta potential is a measure, and this shift is identified to
. Examination of measured electrokinetic data on the basis of Equation (11) only, should be considered as phenomenological rather than based on physical arguments. Instead, the formulation given by Equation (11) necessarily implies that
reflects the details of the electrostatic and hydrodynamic flow field profiles within the soft surface layer.
Figure 2B collects the dependence of
on
under the conditions of
Figure 2A. In line with the preceding arguments, at fixed
decreases with increasing
because the electrokinetically active ions (
i.e. probed by the tangential flow) becomes gradually confined to the close vicinity of the carrier surface, and the more so the larger
is. It is observed that at large
,
decreases linearly with
(at fixed
d) in double logarithmic representation. This trend is confirmed by the analytical expression that may be developed for
at
and low
[
24]:
In the limit
where film thickness is small compared to the Debye layer extension from the rigid carrier surface,
reaches a plateau whose value is solely determined by the hydrodynamic film permeability (
Figure 2B). In this limit,
identifies with the so-called hydrodynamic thickness
of the film that further reduces to the physical film thickness
d for situations where film resistance to flow is infinite (
i.e. →0).
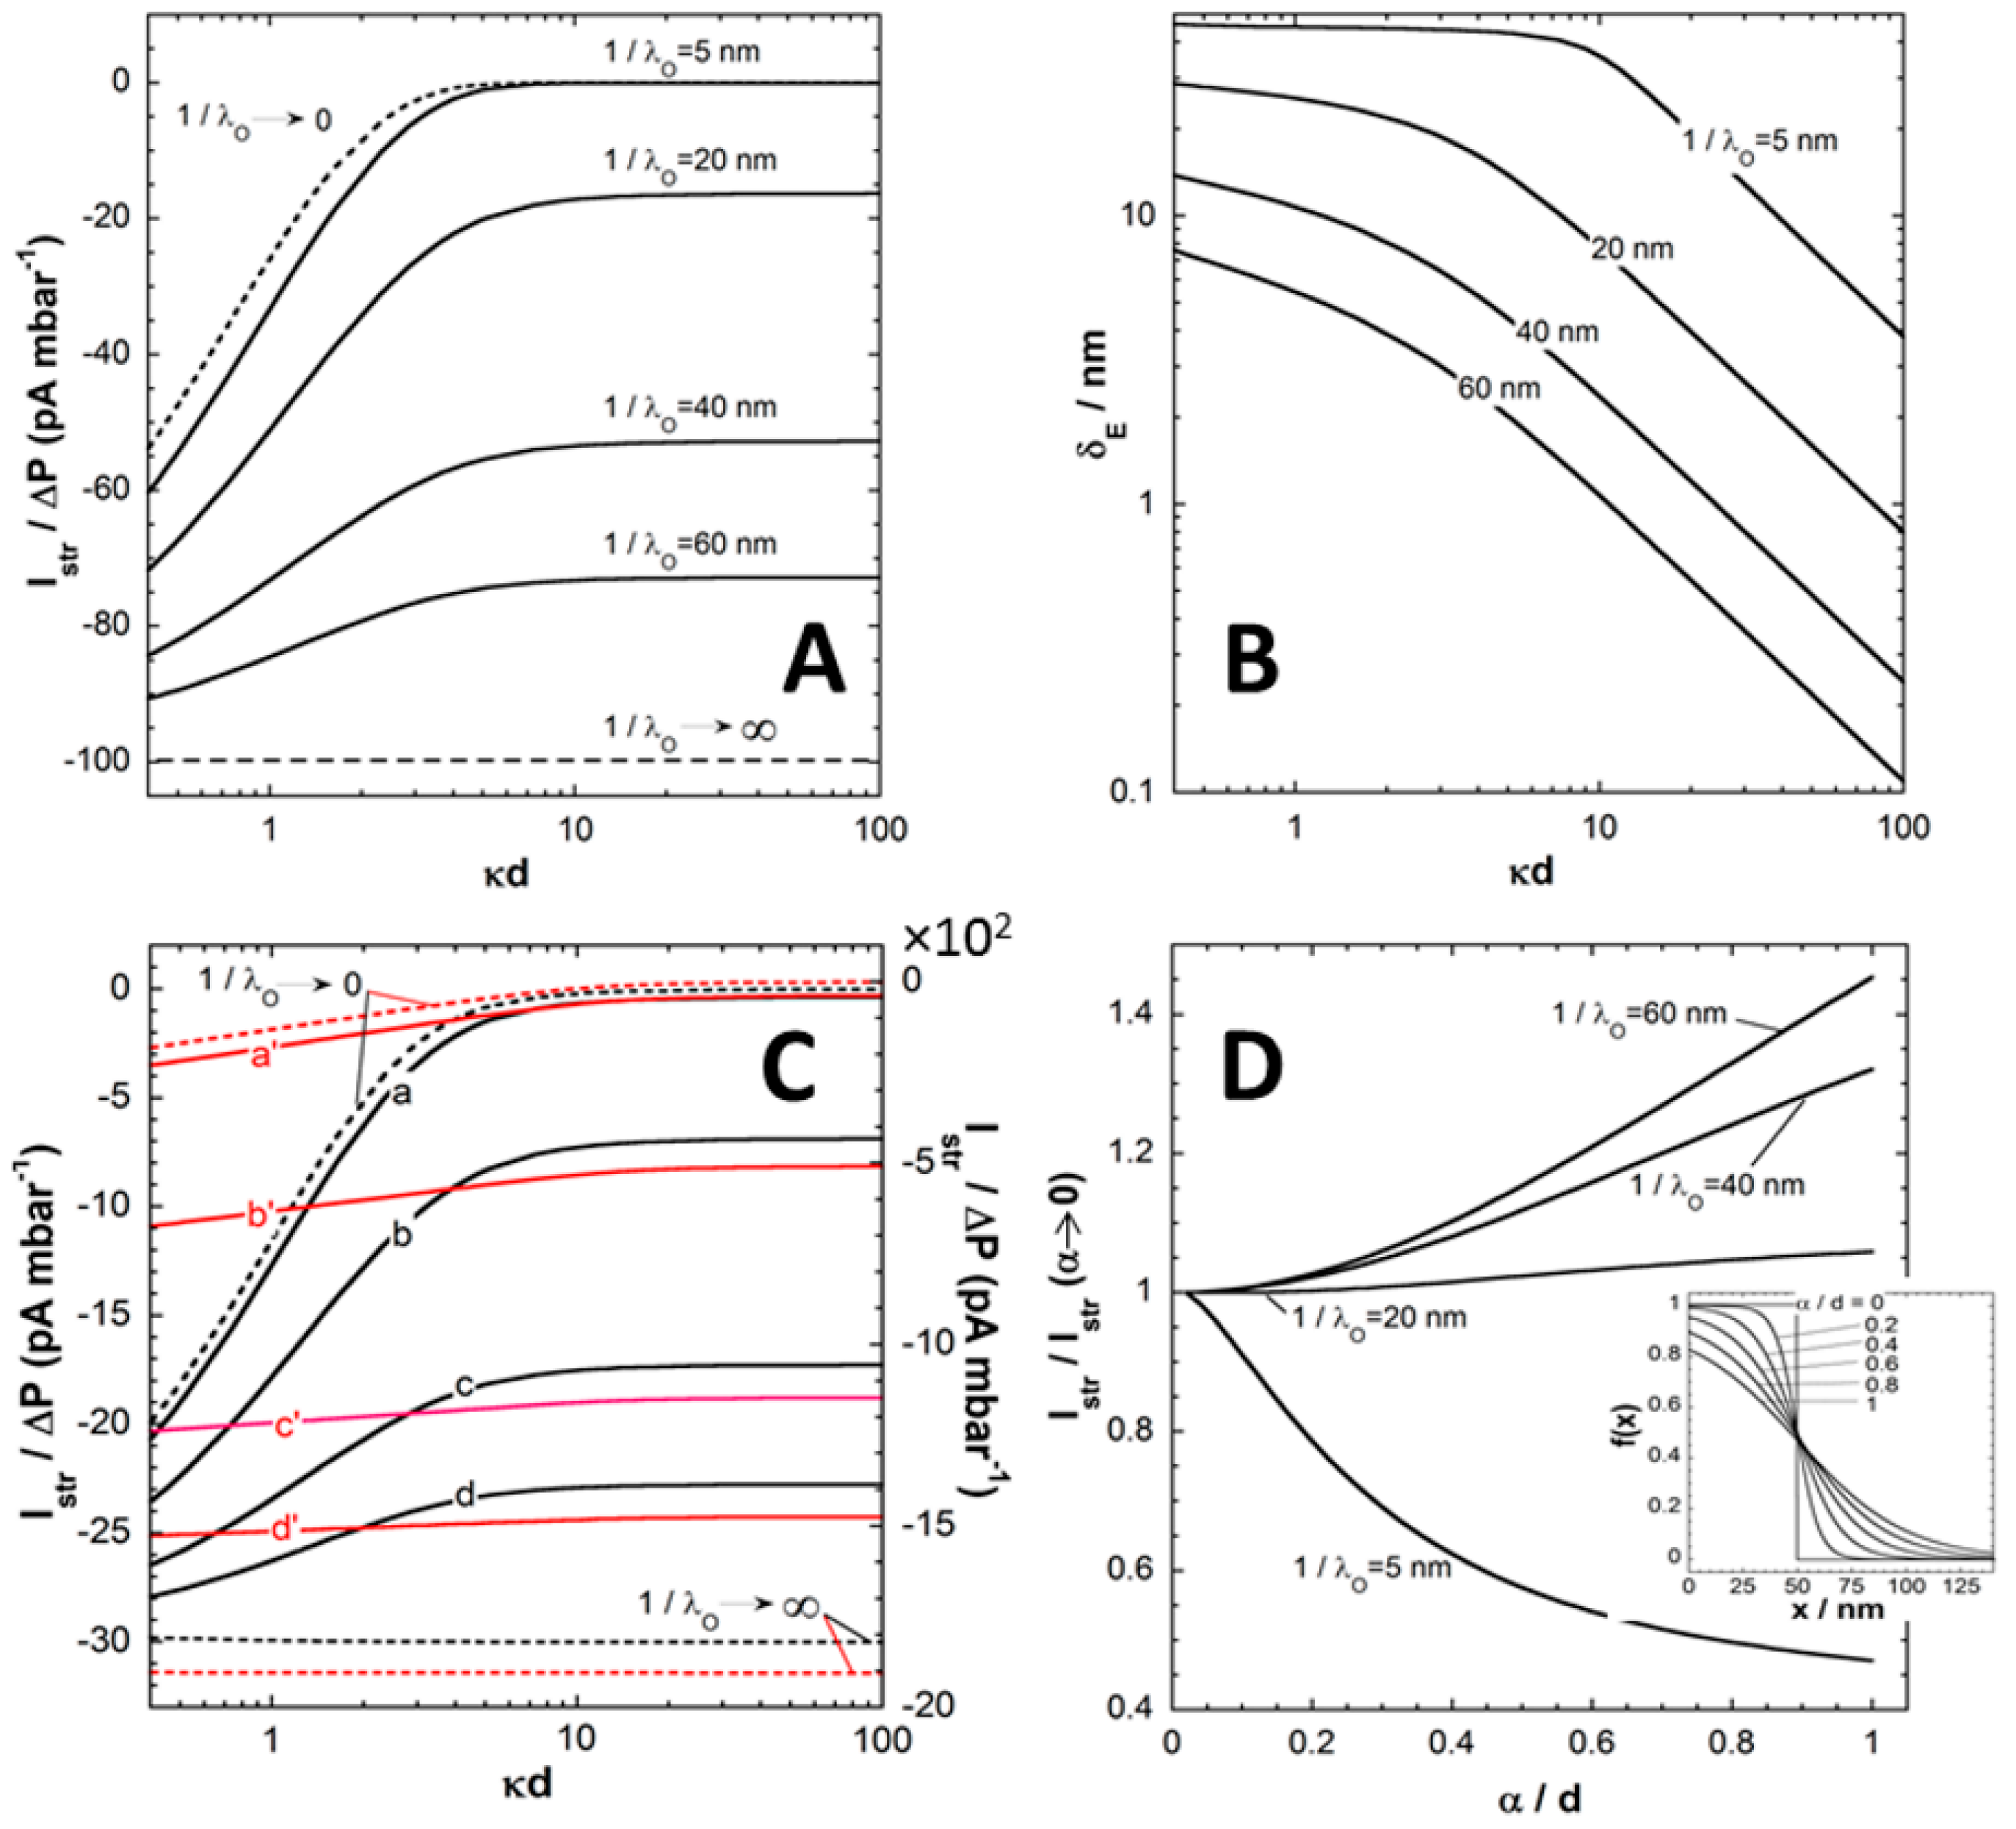
Figure 2.
(
A) Ratio between streaming current (
) and applied pressure (
)
versus ionic strength evaluated from theory for different values of the hydrodynamic penetration length
(indicated). (
B) Electrokinetic layer thickness
estimated from theory under the conditions of panel
A at various
(indicated). Model parameters in (
A) and (
B):
mV,
(monovalent electrolyte), T = 22 °C,
nm,
μm,
mm,
mm,
,
mPa s
-1,
(homogeneous segment density distribution in the film),
(uncharged film). (
C)
versus ionic strength evaluated from theory for
mM (black lines, left
y-axis) and
mM (red lines, right
y-axis) at (a, a’)
nm, (b, b’)
nm, (c, c’)
nm and (d, d’)
nm. The limits
and
are explicitly indicated. Other model parameters: as in (
A)-(
B) except
mV (
D) Ratio
as a function of
at various
(indicated). Other model parameters: as in (
A) and (
B) except that
mV,
mM and solution ionic strength = 1 mM. In the inset of panel (
D), representation of the segment density distribution
f(
x) for various values of
(indicated) and
nm. Adapted from [
24]. Copyright 2009 with permission from American Chemical Society.
![Polymers 08 00007 g002]()
Figure 2C shows the evolution of
on
for cases where both supporting carrier and polyelectrolyte film are charged. Data are reported for various values of
with
mM (poorly charged film, black lines) and
mM (red lines). At fixed
, the dependence of
on
and
is qualitatively similar to that discussed in
Figure 2A. Quantitatively, the introduction of structural charges in the polyelectrolyte films goes in pair with an enhancement of the local electrostatic potential under given salt concentration conditions, and thus with an increase in the amount of counterions accumulated therein. As a result, the streaming current increases in magnitude and the larger
is, the most pronounced is this increase in
. The dependence of
on
becomes weaker as the density of charges carried by the film increases. This is due to a reduction of the electrostatic screening of the carrier surface charge as the electric double layer composition becomes increasingly governed by the electrostatic properties of the polyelectrolyte layer. Similarly to the situation analyzed in
Figure 2A,
reaches an asymptotic plateau at
and the value of this plateau is not only a function of
and
(see Equation (10)) but also involves
as detailed in [
24]. Finally, the limits
and
corresponding to impermeable and free-draining films, respectively, can be rationalized
via a Smoluchowski-like equation of the form
where the dimensionless potential
is evaluated at
(case
) or
(case
). In both limits, it is stressed that
is a function of both the surface carrier potential
and the film charge density
. As an illustration, in the limit of low potentials,
is defined by
at
and
at
, expressions that are derived from the relevant analytical formulations reported in [
24]. In addition the former expression further reduces to
for
where
corresponds to the (dimensionless) potential at the film surface (
) with
the dimensionless Donnan potential in the Debye-Hückel approximation.
Finally, we report in
Figure 2D the impact of the interfacial film diffuseness
(see Equation (2), and insert in
Figure 2D) on streaming current
for various
values at fixed (monovalent) electrolyte concentration (
mM). It is stressed that variations in
lead to modifications of the segment density profile
as given in
Figure 2D with the condition of constant total amount of polymer segments in the film (condition ensured
via the scalar
involved in Equation (2)). Results are given in the form
versus in order to reveal how
evaluated under conditions where segment density distribution is diffuse, compares with that obtained for homogeneous polyelectrolyte film. At low to moderate
, the ratio
decreases with increasing
. This effect results from the friction exerted by the segments protruding from the film bulk phase on the flow in the region where flow velocity field is most significant. The reduction in streaming current thus results from an increased hydrodynamic drag of the outer film region and therewith from a marked immobilization of otherwise electrokinetically active ions.
On the opposite, at large
(typically
or
), the ratio
increases with increasing
. Indeed, extending the thickness of the diffuse interface also leads to an increase of the magnitude of the local electrostatic potential in the region
(see insert). For large
, this electrostatic feature overwhelms the hydrodynamic modulations of the flow velocity associated to changes in segment density distribution and, consequently, it results in an increase of
with increasing
. For values of
intermediate between the two aforementioned extremes, the balance between effects of
on interfacial hydrodynamics and electrostatics determines the magnitude of the ratio
[
24]. In situations of practical interest where
, heterogeneity in the outer distribution of polymer segments density primarily causes a reduction in
due to hydrodynamic screening, as further discussed below for poly(acrylic acid) thin films.
3.2. Charging and Structure of Poly(Acrylic Acid) Thin Films
The interfacial structure of PE films is governed by the level of ionization of their functional groups and the related increase in osmotic pressure. In this section, we review a strategy for the analysis of the charging and structure of surface-immobilized PE layers on the basis of streaming current, surface conductivity and swelling data measured at covalently-immobilized poly(acrylic acid) (PAA) films [
26]. The PAA was attached to hard surfaces using a low-pressure plasma treatment [
26].
Figure 3 shows the pH-dependence of streaming current at KCl solution concentrations in the range 0.1 to 10 mM. According to the polymer structure, the charging of PAA films is dominated by the ionization of carboxyl groups in the repeat unit (please note that unsymmetrical water ion adsorption [
39] can contribute to the overall film charge at low pH). In line with the highly anionic nature of PAA, the isoelectric point (IEP) of the films was found below pH 2. In 0.1 mM KCl solution, the streaming current exhibits a pronounced non-monotonous dependence on pH with the presence of a maximum at pH ~6 (
Figure 3), while data collected at lower salt concentrations conform to commonly-reported trends (see below). The maximum in streaming current gradually vanishes with increasing KCl solution concentration. To decipher the reasons for this unconventional electrokinetic fingerprint, surface conductivity and film swelling were systematically measured under the conditions adopted for the electrokinetic experiments [
26].
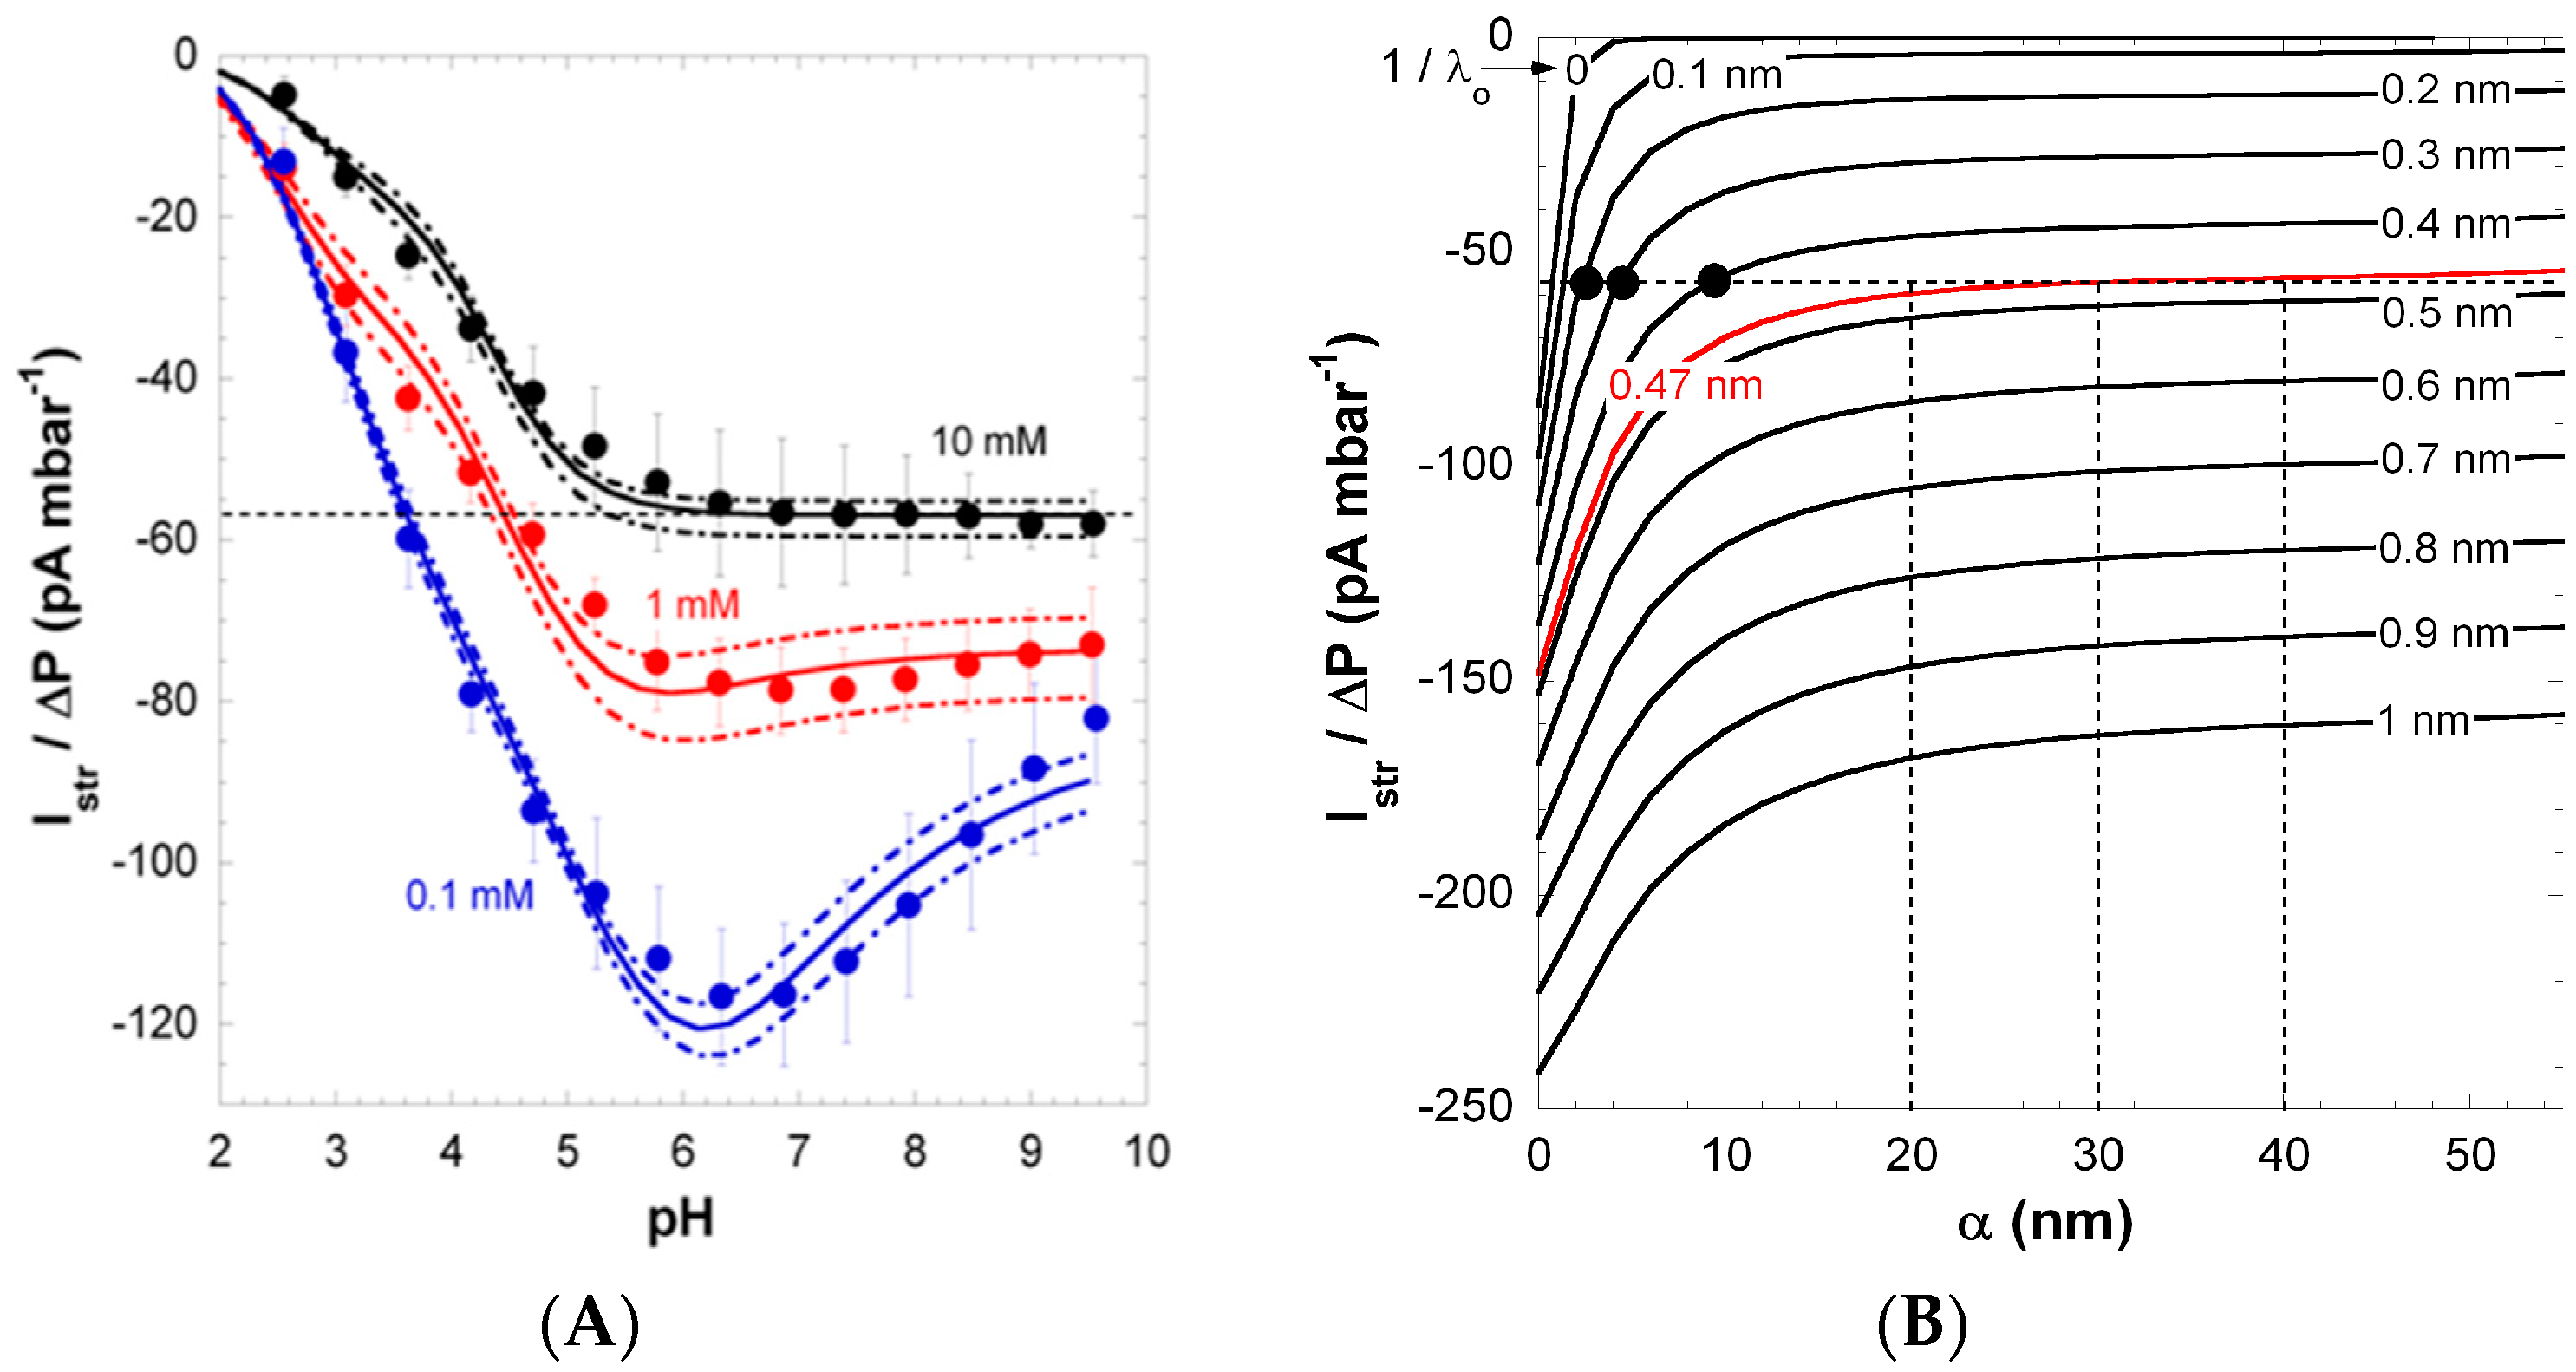
Figure 3.
(
A) Pressure-normalized streaming current,
, for PAA films as a function of pH in 0.1, 1 and 10 mM KCl solutions (indicated). Experimental data are represented by symbols. Solid and dotted lines were calculated on the basis of the theory by adjustment of the pH- and ionic-strength dependence of the interphasial diffuseness
α that best brackets experimental values (dotted lines). (
B) Dependence of
on
α and
at 10 mM KCl concentration under condition where full dissociation of the film charges is reached (pH > 6). For each
value tested, the value adopted for the charge density
in the film is that which fits the surface conductivity
at large pH (see
Figure 2). The unambiguous evaluation of
is done upon analysis of the intersection points between
vs. α curves with the
value measured at large pH in 10 mM KCl (dotted horizontal line in panel
A and
B), with as result
= 0.47 nm. The corresponding range of
α consistent with
at large pH in 10 mM KCl is then straightforwardly determined (see vertical dotted lines). The full black circles correspond to conditions that do not allow recovery of the
vs. pH curve displayed in panel
A (which was verified from theoretical simulations). Reprinted from [
26]. Copyright 2011 with permission from Elsevier.
![Polymers 08 00007 g003]()
Figure 4A shows the dependence of the measured surface conductivity
on pH in 1 mM KCl solution concentration.
increases significantly with increasing pH above 4 and reaches a ~330 nS plateau value at pH ≥ 8. The surface conductivity and the layer thickness (not shown here) exhibit very similar dependence on solution pH, underlining that both quantities are inherently functions of the ionization level of carboxyl groups within the PAA film [
26]. The increase in
with pH results from the accumulation of counterions within the film
and at the interfacial EDL region outside the film, thereby compensating the structural film charge stemming from ionized carboxyl groups. Under action of an electric field, these ions migrate along the PE surface layer and thus contribute to
. At sufficiently large pH (pH ≥ 8), dissociation of carboxyl groups is complete, which explains the presence of the plateau in
(
Figure 2A).
A mean film thickness of ~18 nm was estimated from ellipsometry measurements at pH 2 [
26]. For a given salt concentration, the film thickness increased with increasing pH and reached 60 to 70 nm at pH 10 [
26]. In line with the stronger ionization of densely-packed carboxyl groups at higher salt concentrations (see the charge source term in Equation (1)), film swelling occurred in a lower pH range upon the increase of the KCl solution concentration [
26]. As stated above, the increase in film thickness closely followed the increase in surface conductivity, meaning that surface conductivity mirrors the increasing counter ion concentration in the PAA film, a process that leads to increased osmotic pressure and enhanced film swelling.
Figure 4.
(
A) Surface conductivity
vs. pH for PAA film in 1 mM KCl solution (symbols). The solid line represents the reconstruction of the data by theory. Parameters:
-1635 mM,
0.47 nm,
3.3, and
α = 27 nm (solid line) as well as
(dotted line). The plateau value reached by
at large pH (horizontal dashed line) was used as a basis for the determination of (
). (
B) Set of (
) couples that best reproduce the experimentally determined surface conductivity
at large pH. The contribution of electroosmosis to the total surface conductivity is given in terms of the ratio
on the right axis. The (
) couple consistent with
and
data is highlighted in blue. See the text and [
26] for further details. Reprinted from [
26]. Copyright 2011 with permission from Elsevier.
With increasing charge density, electroosmosis may significantly contribute to the surface conductivity of the PE layer.
is then determined by the electrostatic properties of the film (contribution
) and by its permeability to flow
via the electroosmotic term
. Indeed, similar to the pressure-driven flow field
, the electroosmotic flow field
depends on the quantity 1/
λo (see Equation (3) and
Section 2.5). Duval et al. developed a procedure (detailed below) to evaluate the migration (
) and electroosmotic (
) components of the surface conductivity
with consistent account of the measured variations of
with changing pH and salt concentration [
26].
The pronounced maximum observed for the streaming current at 0.1 mM KCl (
Figure 3) was shown to originate from heterogeneous film swelling and the corresponding increase in the interphase diffuseness
α, the latter length scale quantifying how far PAA polymer segments protrude from bulk film toward the outer electrolyte solution [
26]. Indeed, as discussed in
Section 3.1, an increase in
α leads to enhanced friction exerted by the soft polymer interphase on flow, and thus, this results in decreased streaming current above a critical pH value, where swelling is most significant. Below that critical pH, the streaming current classically increases with pH as the result of the gradual dissociation of carboxylic groups. The maximum in the streaming current thus stems from interphase film swelling and the accompanied effects on developed hydrodynamic flow. Due to significant screening of film electrostatics, at fixed pH, the streaming current in a 10 mM KCl solution concentration is lower (in magnitude) compared to values measured in 1 and 0.1 mM KCl. More interestingly, the maximum disappears due to significant screening of film charges and to reduced Debye length compared to
α, thus rendering impossible the electrokinetic probing of the segment density distribution at high salt concentrations. At pH ≥ 6,
reaches a constant value, which suggests that ionization of the carboxyl groups is complete in this pH range.
Figure 4 shows that the increase in
with pH basically compounds that measured for
(in magnitude) in 10 mM KCl solution. The latter result was exploited in Ref. [
26] for deriving in a consistent way the relevant PAA electrohydrodynamic parameters
and
. Indeed, at pH ≥ 6, the magnitude of
is solely defined by these two quantities and hardly depends on
α, which was verified
a posteriori. The set of (
;
) couples that best recover the plateau value reached by
at large pH is given in
Figure 2B together with the corresponding ratio
. The latter increases with increasing hydrodynamic penetration, expressed in terms of the Brinkman length
and the magnitude of the charge density required to reproduce
at large pH decreases with increasing
. Considering the surface conductivity alone is therefore not sufficient for an unambiguous determination of the parameters
and
. Duval et al. [
26] have shown that a consistent solution may be obtained by the additional evaluation of the dependence of
on
α in 10 mM KCl under complete ionization conditions (pH ≥ 6). This analysis was performed for the different couples (
;
) that are in agreement with
data measured at large pH (as shown in
Figure 2B). In line with theory on electrokinetics of diffuse soft thin films [
25,
26],
decreases with increasing
α and increases with increasing
, as a result of the associated changes in the hydrodynamic flow-field (case discussed in
Figure 2D at low to moderate
). A comparison of the simulation results obtained for
vs. α (
Figure 1B) with the streaming current plateau value measured at large pH in 10 mM KCl solution (
Figure 1A) finally provided the searched
and
values,
i.e.,
= 0.47 nm and
= 1635 mM [
26]. The corresponding ratio
is 0.32, confirming that electroosmotic charge transport contributes significantly to the overall surface conductivity
for polymer films with moderate to high charge density. Using
= 0.47 nm and
= 1635 mM, the softness parameter
α (and its modulation with pH and salt concentration) and the dissociation p
K value pertaining to PAA carboxyl groups were subsequently obtained from reconstruction of the full dependence of
and
on pH and salt concentration [
26].
In summary, the developed strategy for the coupled analysis of the pH- and salt concentration-dependent streaming current, surface conductivity and swelling data allows for a comprehensive characterization of the charge and structure of polyelectrolyte layers. Strategies for polymer coatings without ionizable groups were further developed; see e.g., [
24,
28]. The gained information helps to better understand the fundamental properties and interactions of polymer systems, but it is also of interest for designing application-oriented materials, e.g., responsive or anti-fouling coatings.
3.3. Electrohydrodynamics of Polyelectrolyte Multilayers
Electrokinetic measurements are frequently applied to characterize the formation, charge and stability of polyelectrolyte multilayers (PEMs) [
39,
40,
41,
42]. Because of the inherent coupling between electrostatics and hydrodynamics in the development of soft surface electrokinetics, the unambiguous interpretation of data acquired on PEM materials requires concepts that extend the basic theory outlined in
Section 2. Here, we review recent theoretical developments on electrokinetics of planar PEMs, and these developments are shown to reproduce, at least qualitatively, the peculiar electrokinetic properties of PEM that exhibit some degree of charge stratification absent from the theory outlined in
Section 2.
The theory for the streaming current of PEMs was developed by Duval et al. for systems consisting of
N alternately deposited cationic and anionic layers of thickness denoted as
, each being assigned an index
, with
, where
stands for the most internal layer directly supported by the substrate surface and
for the outermost layer at the PEM/electrolyte solution interface [
27]. Each layer
j is considered to carry a single type of ionisable groups with a given p
K and ε value (denoted in [
27] as p
Kj and
εj, see analogy to Equation (1)). Furthermore, the theory is applicable for any spatial distribution of polymer segments and structural charge density from the hard supporting surface to the outer solution medium without limitations on thickness and charge magnitude pertaining to each layer constituting the PEM. The theoretical framework [
27] further ensures a smooth transition of the segment density between adjacent layers, each being attributed a given hydrodynamic softness
and charge density
, the analogue of the quantities
and
introduced in
Section 2 for monolayered films.
The electrostatic potential distribution across PEMs may be obtained by solving the non-linear Poisson–Boltzmann equation that includes terms for the structural charges resulting from the ionizable groups in each sub-layer and for mobile counter ions distributed inside and outside the PEM [
27]. The hydrodynamic flow field can be calculated on the basis of the Brinkman Equation (3) taking into account the impact of the local density of polymer segments on the friction they exert on flow under electrokinetic conditions. The expressions given in
Section 2 for the calculation of the streaming current and surface conductivity remain valid for PEMs.
In analogy to monolayered systems, the magnitude and sign of the streaming current of PEMs is determined by the spatial extension of the electrokinetically-active film region, i.e., the zone where film electrostatic properties are probed by the pressure-driven flow penetrating the film at a finite thickness. The extension of that electrokinetically-active outer film region depends not only on the hydrodynamic film permeability determined by the polymer segment density distribution, but also on the Debye layer thickness fixed by solution ionic strength. Streaming current measurements performed at PEMs may therefore reflect electrohydrodynamic contributions from internal layers embedded within PEMs and not only those from layers that directly face the outer electrolyte solution. As a consequence, the comprehensive electrokinetic characterization of PEMs requires measurements at varying pH values and different salt concentrations of a neutral background electrolyte in order to tune the Debye layer thickness and therewith the outer film region that is effectively probed by electrokinetic flow. Applying this strategy, the contributions of the different layers constituting the PEM may be evaluated, and the differentiated impacts of, e.g., outer polyanionic and inner polycationic layers are reflected by a salt concentration-dependent shift in the point of zero streaming current (PZSC), defined by the pH value where . This remarkable PEM electrokinetic feature is now discussed in some more detail.
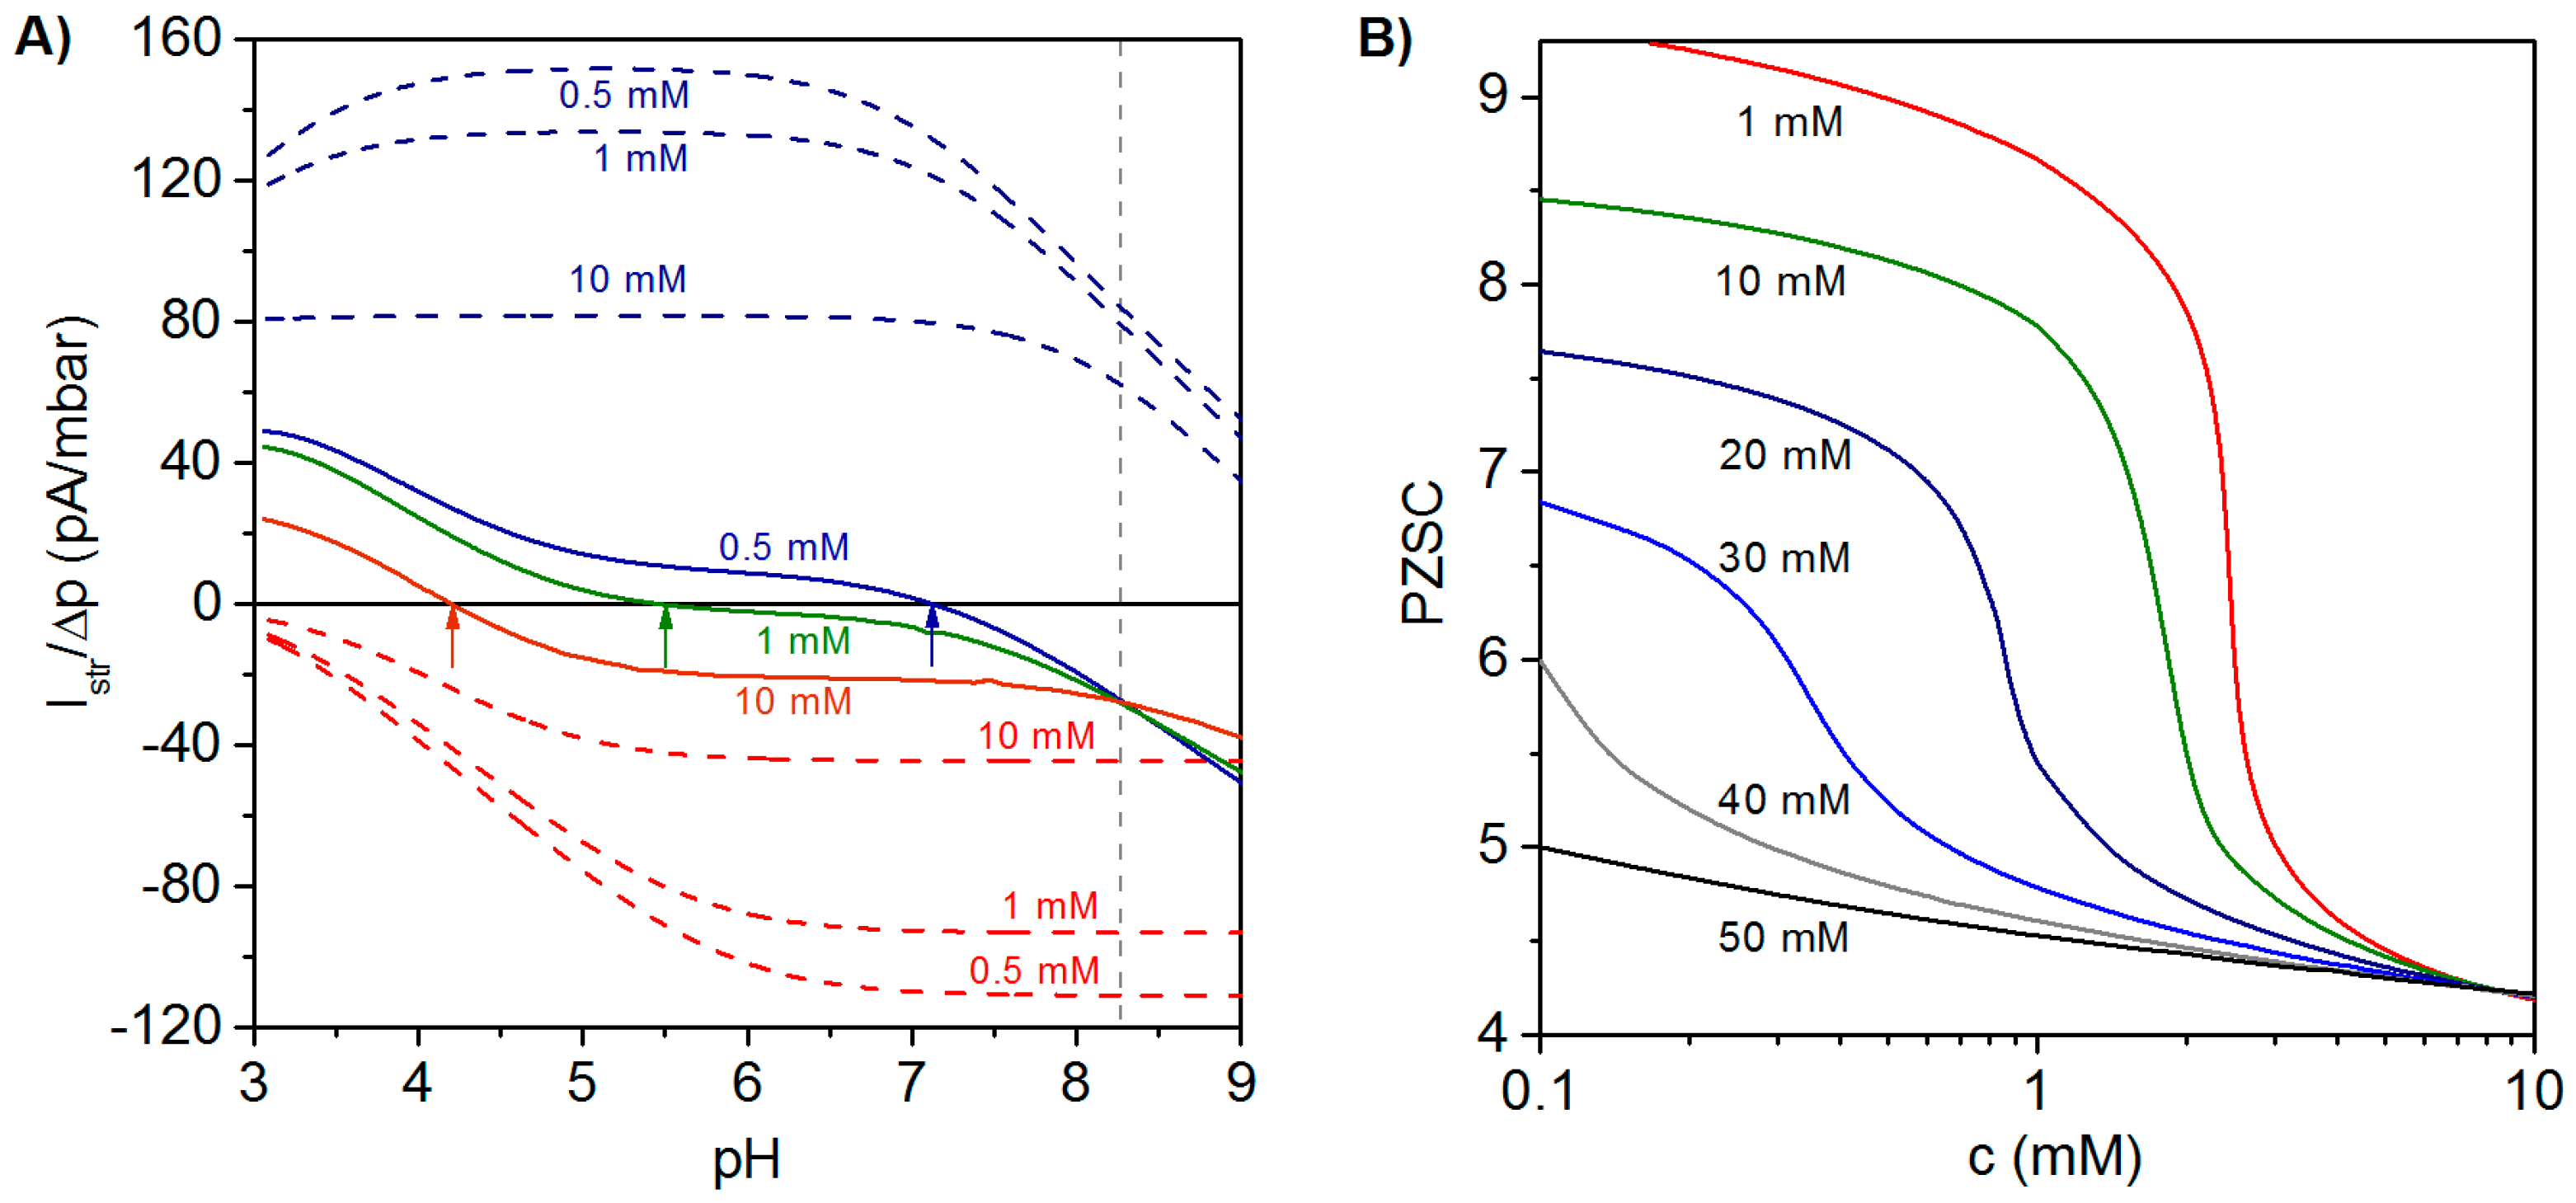
Illustrative simulation results for the dependence of
on pH and electrolyte concentration are shown in
Figure 5A for a polyelectrolyte bilayer film consisting of a polycationic layer (thickness
,
,
) immobilized on a hard and uncharged carrier, and a polyanionic layer (thickness
,
,
) located at the solution side of the bilayer construction [
27]. For the sake of comparison, the variation of
with pH and electrolyte concentration is shown for single polycationic and polyanionic layers. For the monolayered polycationic and polyanionic systems, the position of the PZSC and the dependence of
on solution pH are conform to the intrinsic ionization characteristics of the polyelectrolytes and to the compression of the electric double layer with increasing solution ionic strength that leads to reduction of
at given pH [
26,
27].
The electrokinetic fingerprint of the polyelectrolyte bilayer shows two remarkable features: (i) For a given electrolyte concentration,
changes its sign from negative values at high pH to positive values at low pH. The PZSC (
i.e., the pH where sign reversal occurs) is shifted to higher values with decreasing salt concentration. These results thus reveal an increasing contribution of the inner cationic layer to the streaming current at sufficiently low ionic strengths. In addition,
Figure 5A highlights the necessity to vary pH and salt concentration over broad ranges of values in order to achieve an unambiguous electrokinetic characterization of PEMs. (ii) The curves
vs. pH obtained at different salt concentrations exhibit a common intersection point at pH ~8.27. The occurrence of this feature is expected for multilayered systems provided that the thickness of the constituting layers is independent of the concentration of the background electrolyte and of pH. Changes in the layer structure would lead to varying contributions of the various layers to
and, as a consequence, to the absence of common intersection point.
Figure 5B illustrates the dependence of the PZSC on salt concentration for different densities of charges
in the topmost (anionic) layer, while all other model parameter values are identical to those adopted in
Figure 5A. At a fixed salt concentration, the origin of the change in PZSC towards acidic pH values with increasing the charge density (in magnitude) of the outermost anionic layer is the decrease of the electrical potential in the electrokinetically-active film region. Under such conditions, the potential in that zone becomes significantly affected by the electrostatic features of the external layer, which leads to a decrease in PZSC with increasing
. At a fixed charge density of the anionic layer, increasing salt concentration leads to an electric double layer that becomes mostly confined within the outer layer. The latter then predominantly governs the electrokinetic properties of the PEM as a whole, which results in the observed decrease of the PZSC with increasing salt concentration. This decrease is most pronounced for cases where the magnitudes of charge densities in cationic and anionic layers are significantly different from each other, which exacerbates their differentiated respective contributions upon increasing solution ionic strength. A detailed analysis given in [
27] further demonstrates that the PZSC of PEMs is strongly determined by the dissymmetry in p
K values of the ionogenic groups in each constituting layer, by the respective thickness of the layers and by their segment density distribution. Furthermore, the relevance of the theoretical framework outlined in this section for PEMs (in particular, the unconventional dependence of their PZSC on salt concentration) was confirmed by experimental results obtained on a polyelectrolyte bilayer consisting of PEI (poly(ethylene imine)) and PAA and on an anionic lipid bilayer supported by a polycationic PEI cushion [
27].
Figure 5.
(
A) Ratio of streaming current over applied pressure (
)
vs. pH evaluated at three electrolyte concentrations (indicated) for a polycationic layer (blue dashed lines), a polyanionic layer (red dashed lines) and a polycation (
)/polyanion (
) bilayer film (colored solid lines). Model parameters for the bilayer system:
,
,
nm,
,
,
nm,
mM,
nm; in each layer, a homogeneous distribution of polymer segments is considered. Model parameters for the polycation layer and polyanion layer are similar to those adopted for the polycationic and polyanionic layers forming the bilayer film. Arrows highlight the decrease of point of zero streaming current (PZSC) for the bilayer film with increasing electrolyte concentration. (
B) PZSC
vs. electrolyte concentration for a bilayer system consisting of a polycationic layer with fixed charge density and a polyanionic layer with varying charge density (indicated in terms of equivalent concentration of charges). Other parameters as in the left panel. Adapted from [
27]. Copyright 2011 with permission from American Chemical Society.
![Polymers 08 00007 g005]()
In summary, the PZSC of PEMs is determined by the complex interplay between pH- and ionic strength-dependent electrohydrodynamic processes that govern the charging, charge compensation and structural properties of the various layers constituting the PEM. For this reason, the PZSC measured for soft multilayered films does not correspond to the pH value where the overall film charge is zero. As a result, the comprehensive electrokinetic characterization of PEMs requires systematic measurements performed as a function of pH and salt concentration. Finally, it is stressed that the electrohydrodynamics and the point of zero mobility of charge-stratified particles exhibit similar characteristics as those discussed here for planar systems. A comprehensive overview about theory, experiments and simulations on charge-stratified particulate systems can be found in [
43,
44,
45,
46]. As an illustrative example, the point of zero electrophoretic mobility for poly(amidoamine) starburst dendrimers with a positive internal core and a negatively-charged outer shell layer strongly decreases with increasing salt concentration for the same reasons invoked here for planar charge-stratified polyelectrolyte systems.


