
Experimentation and Modeling of the Tension Behavior of Polycarbonate at High Strain Rates


Abstract
:
1. Introduction
2. Experiment
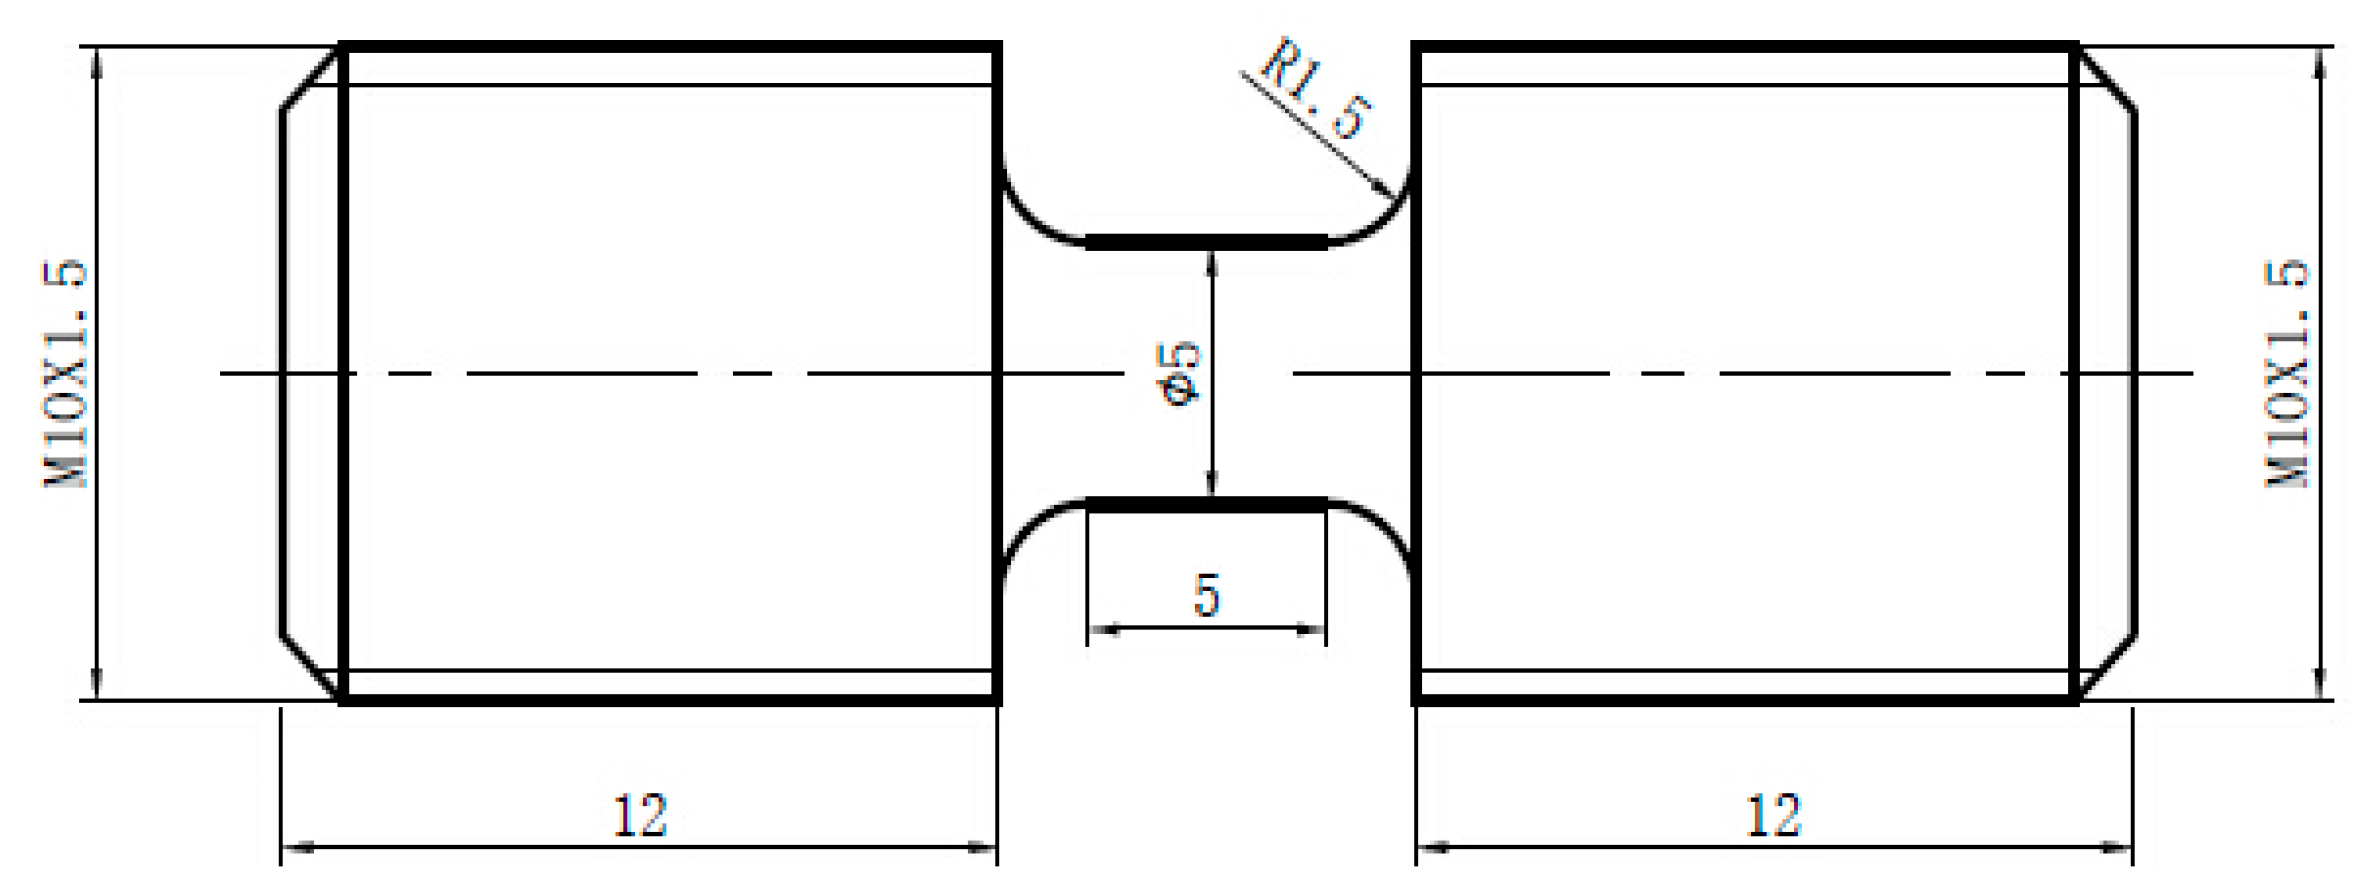
2.1. Material and Specimen
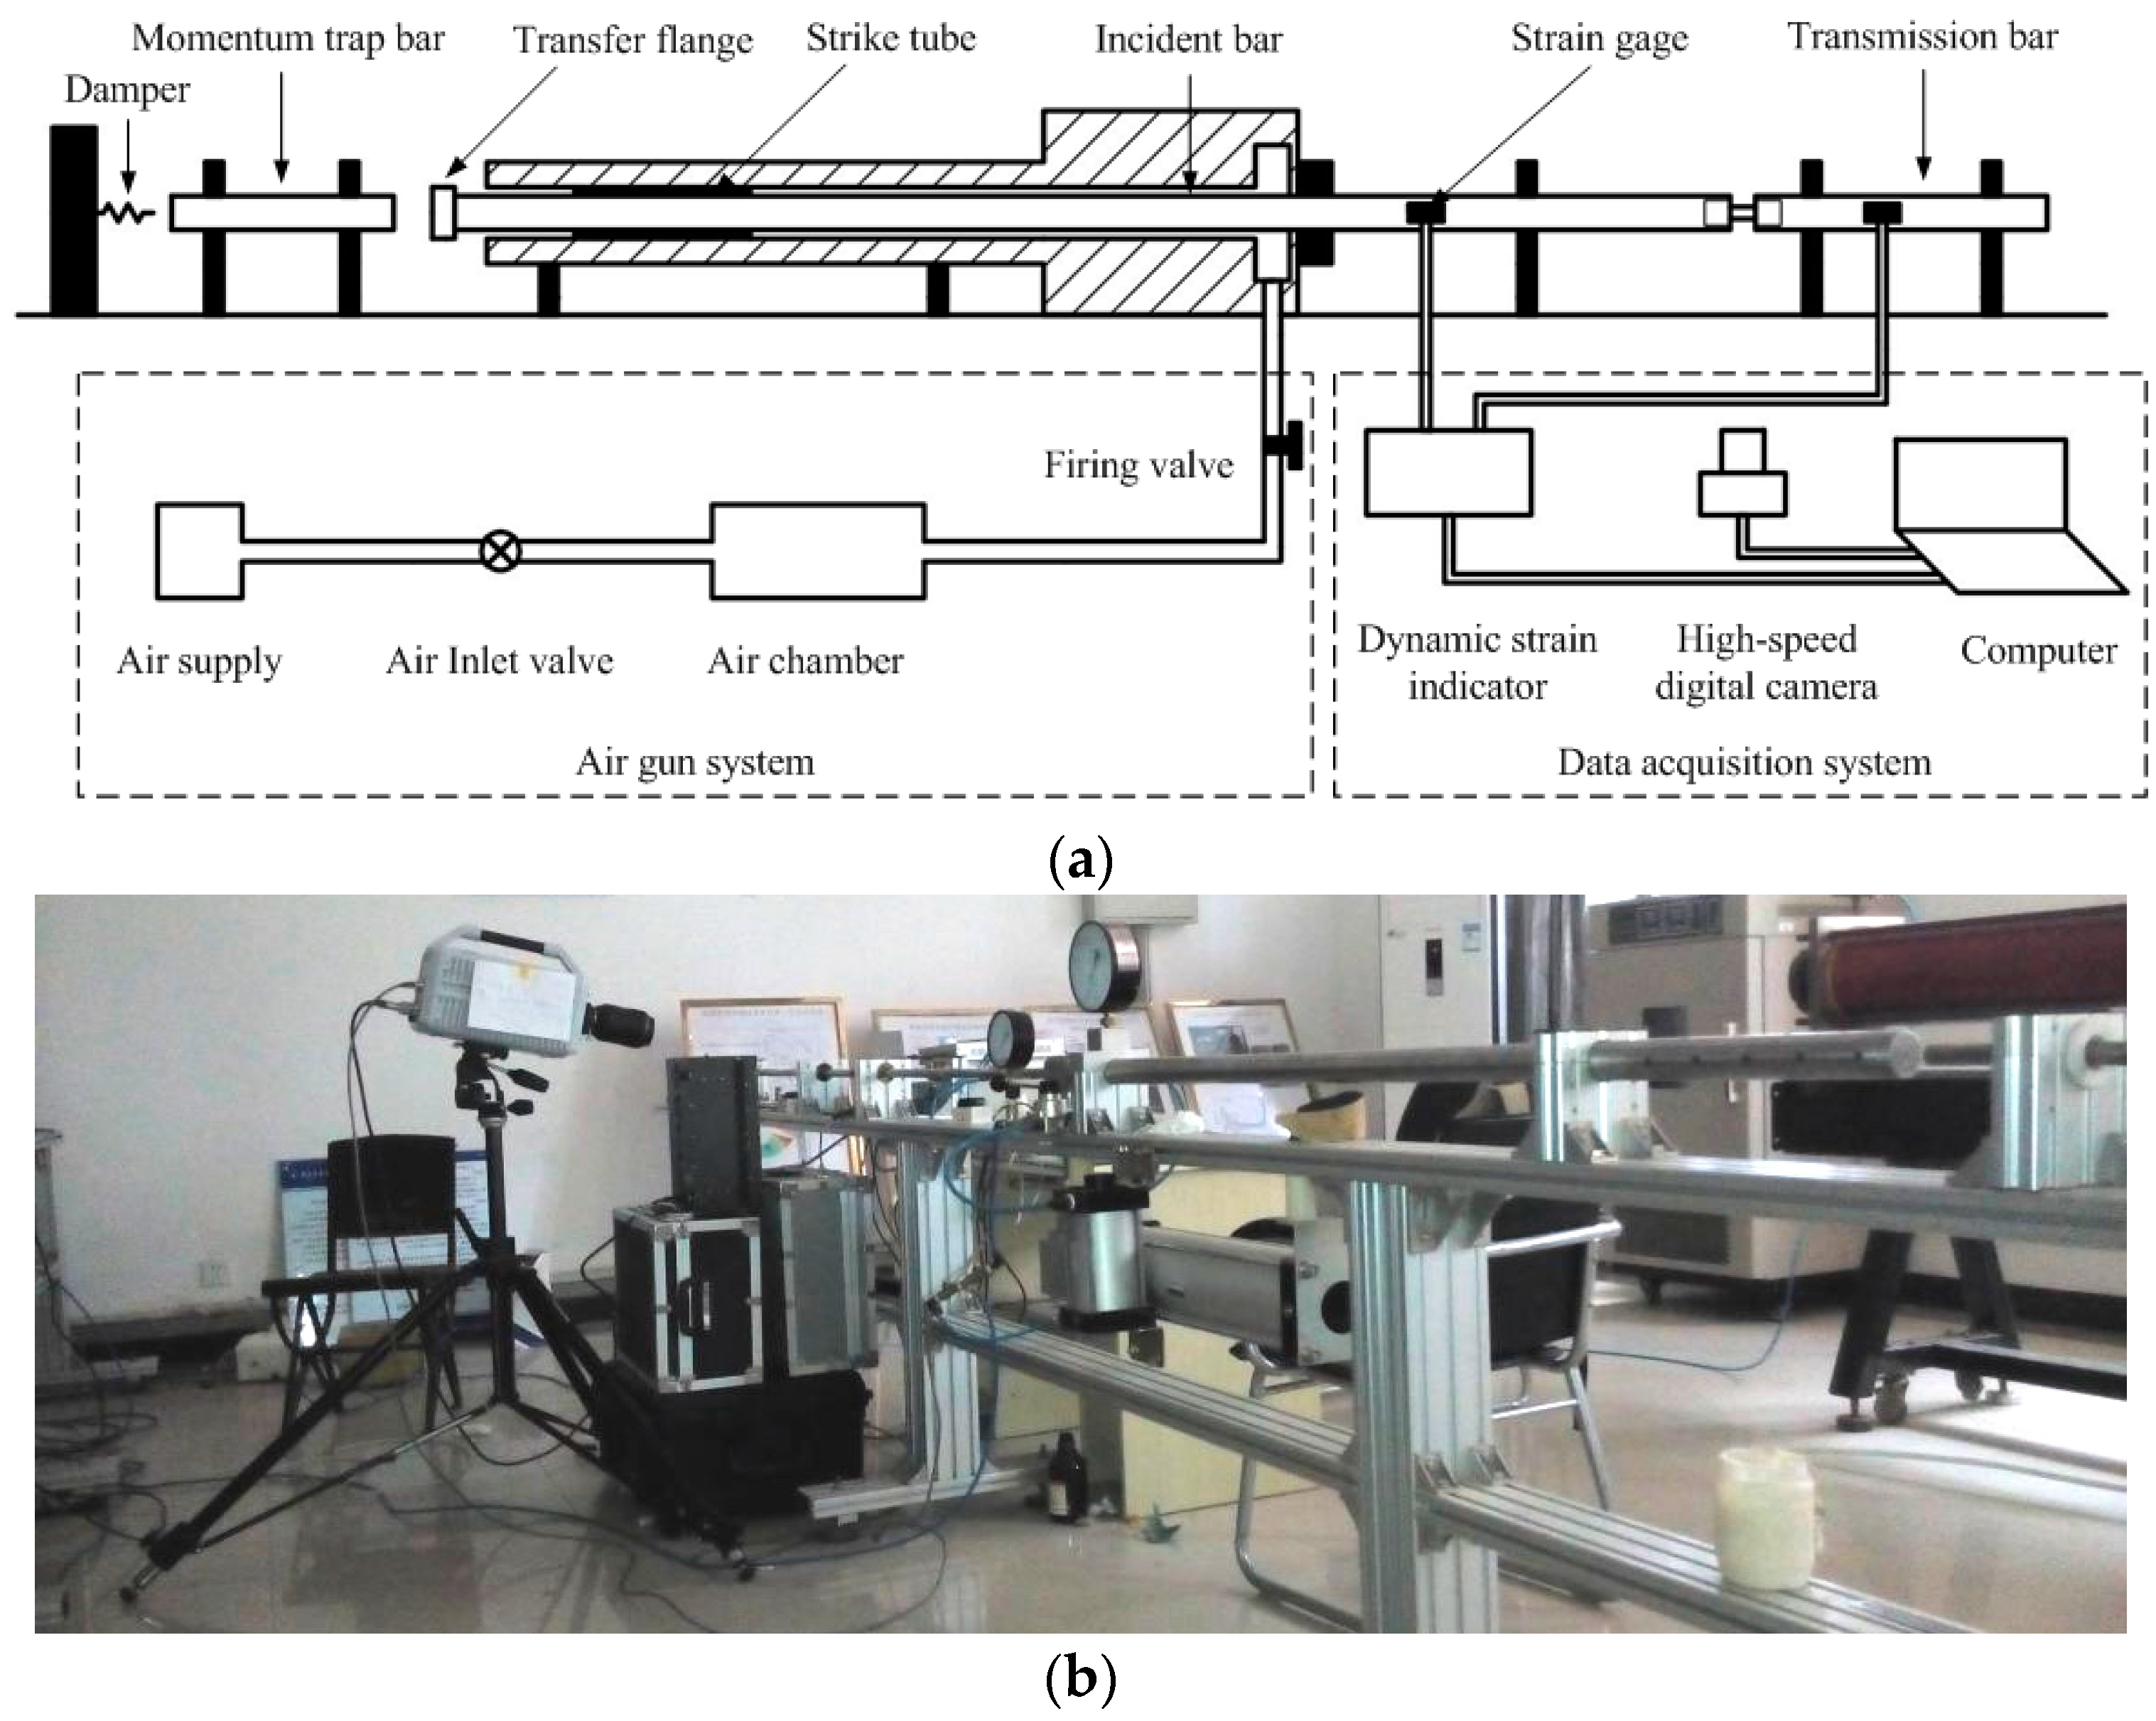
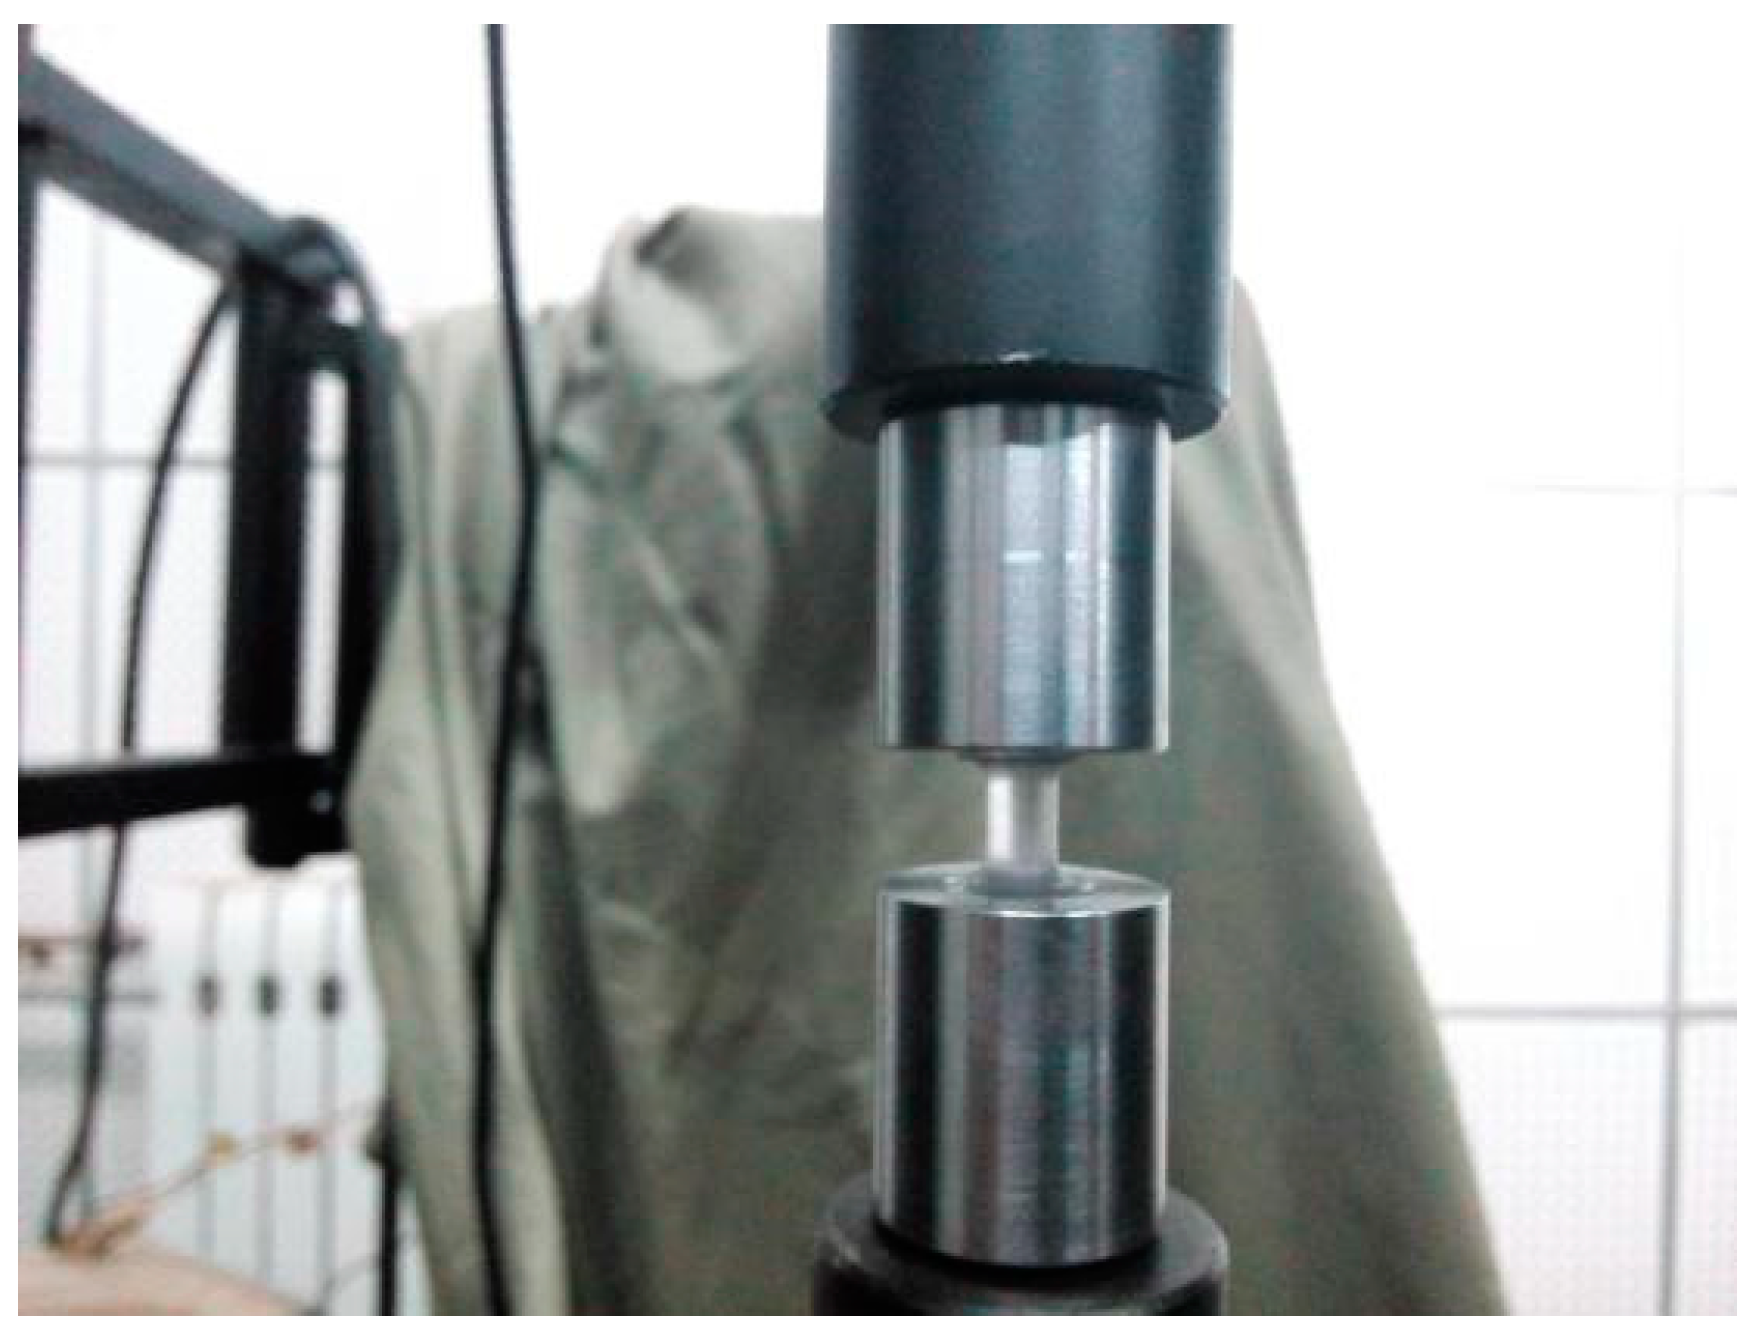
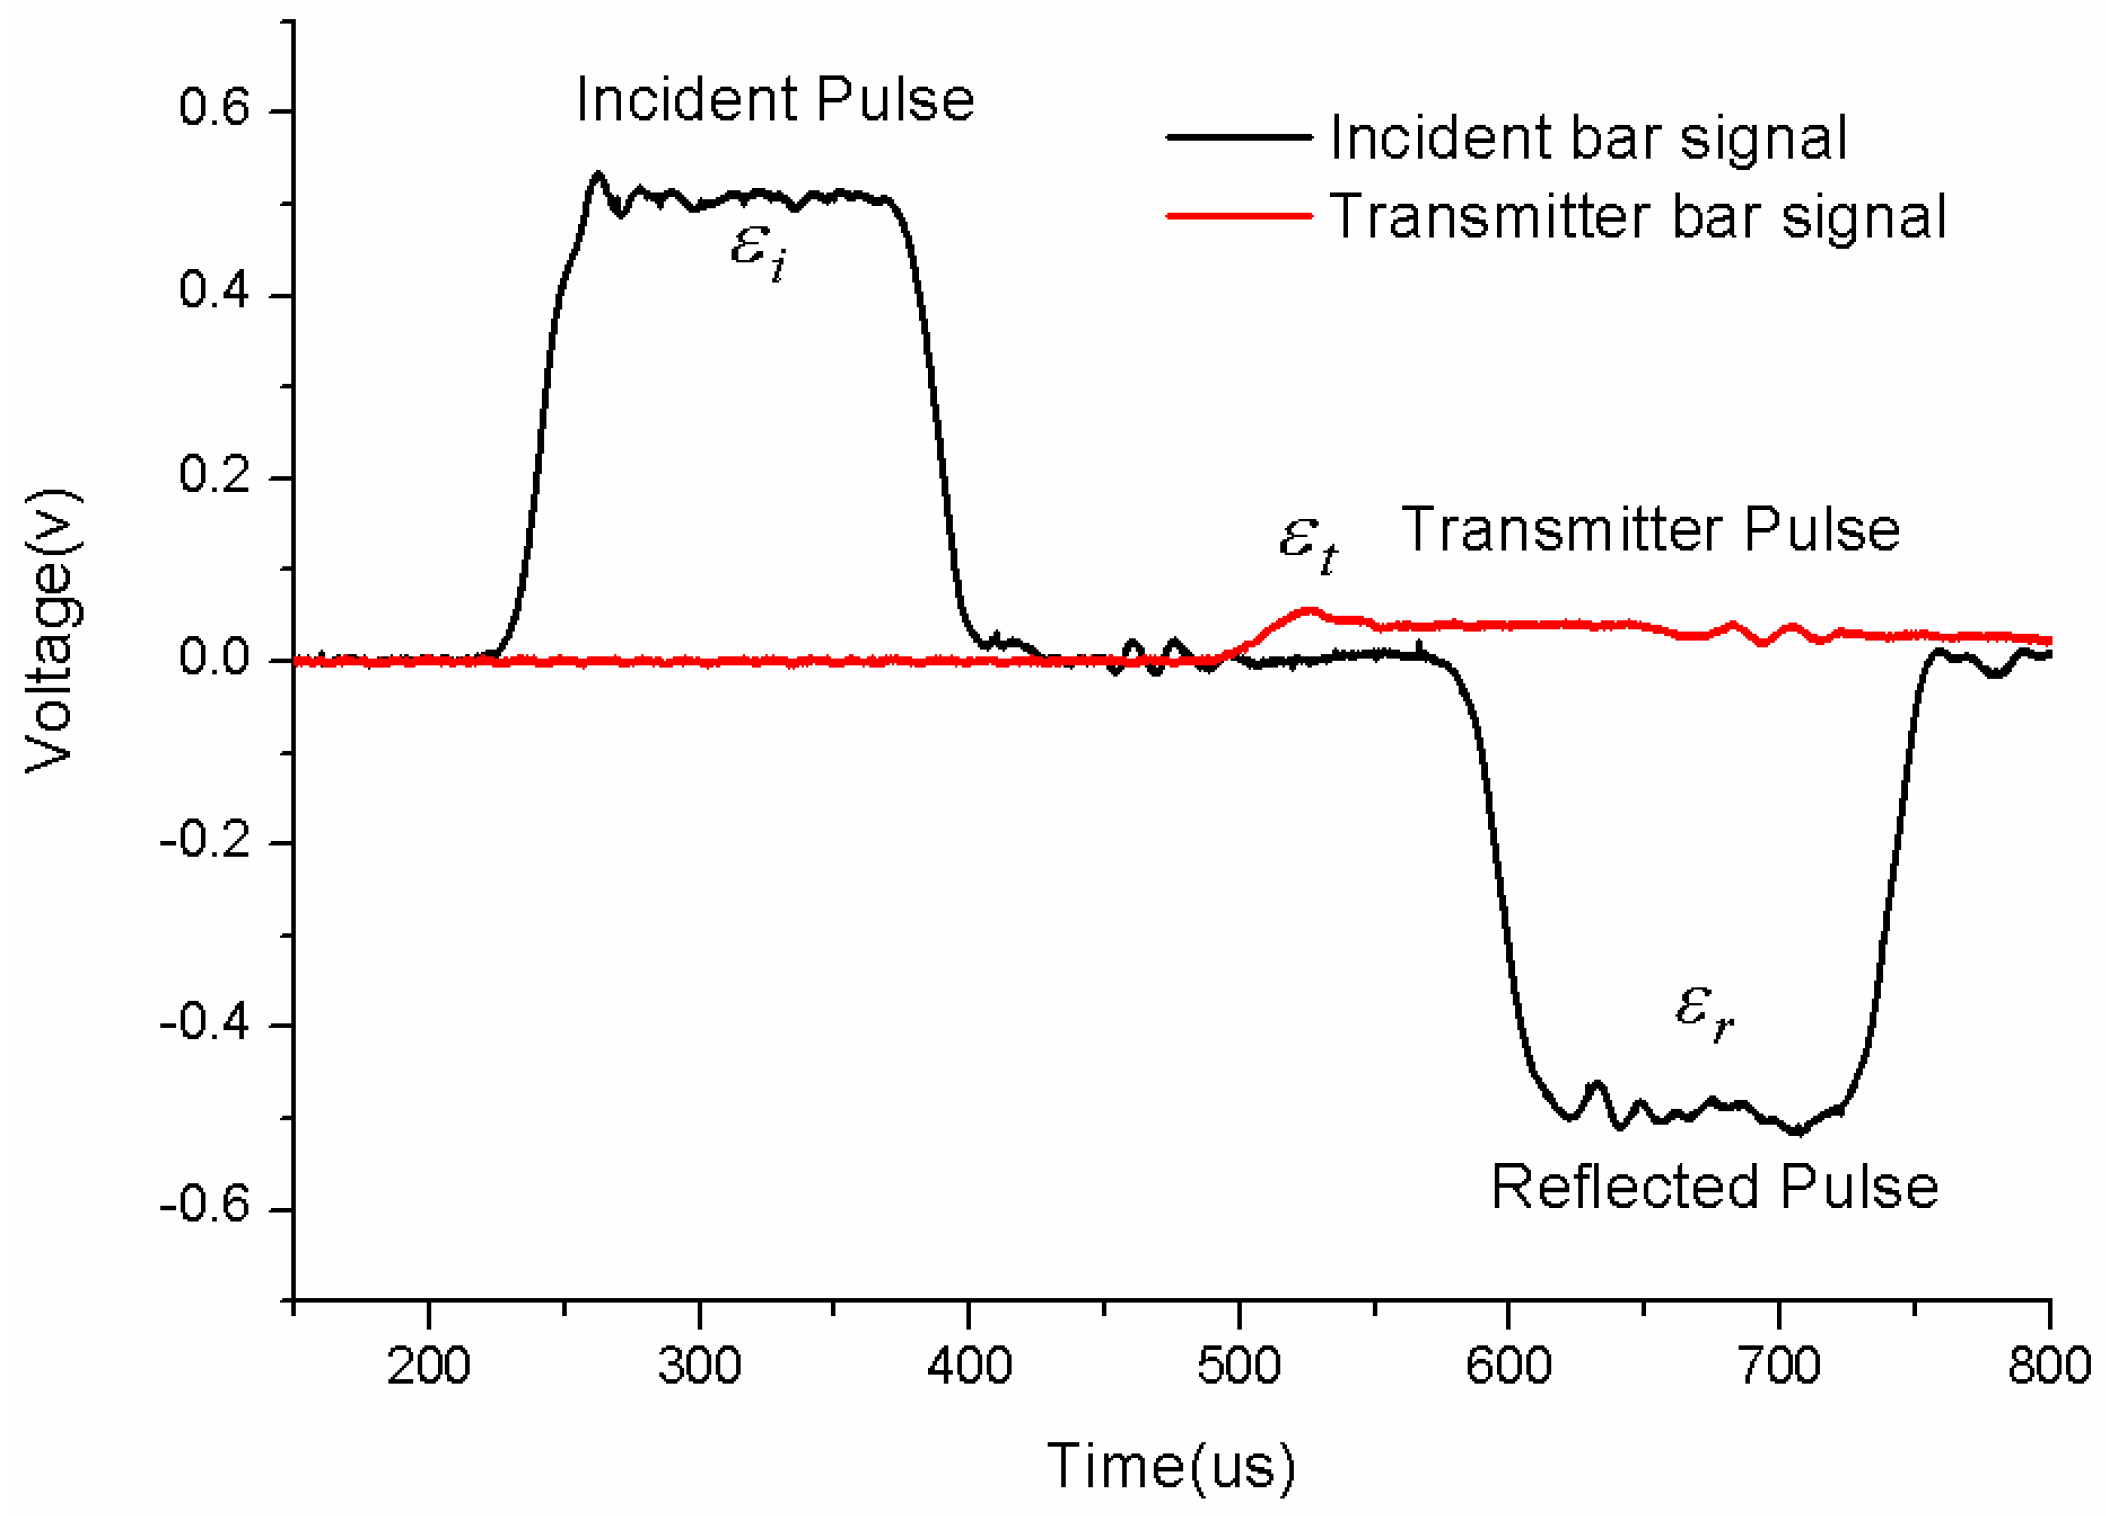
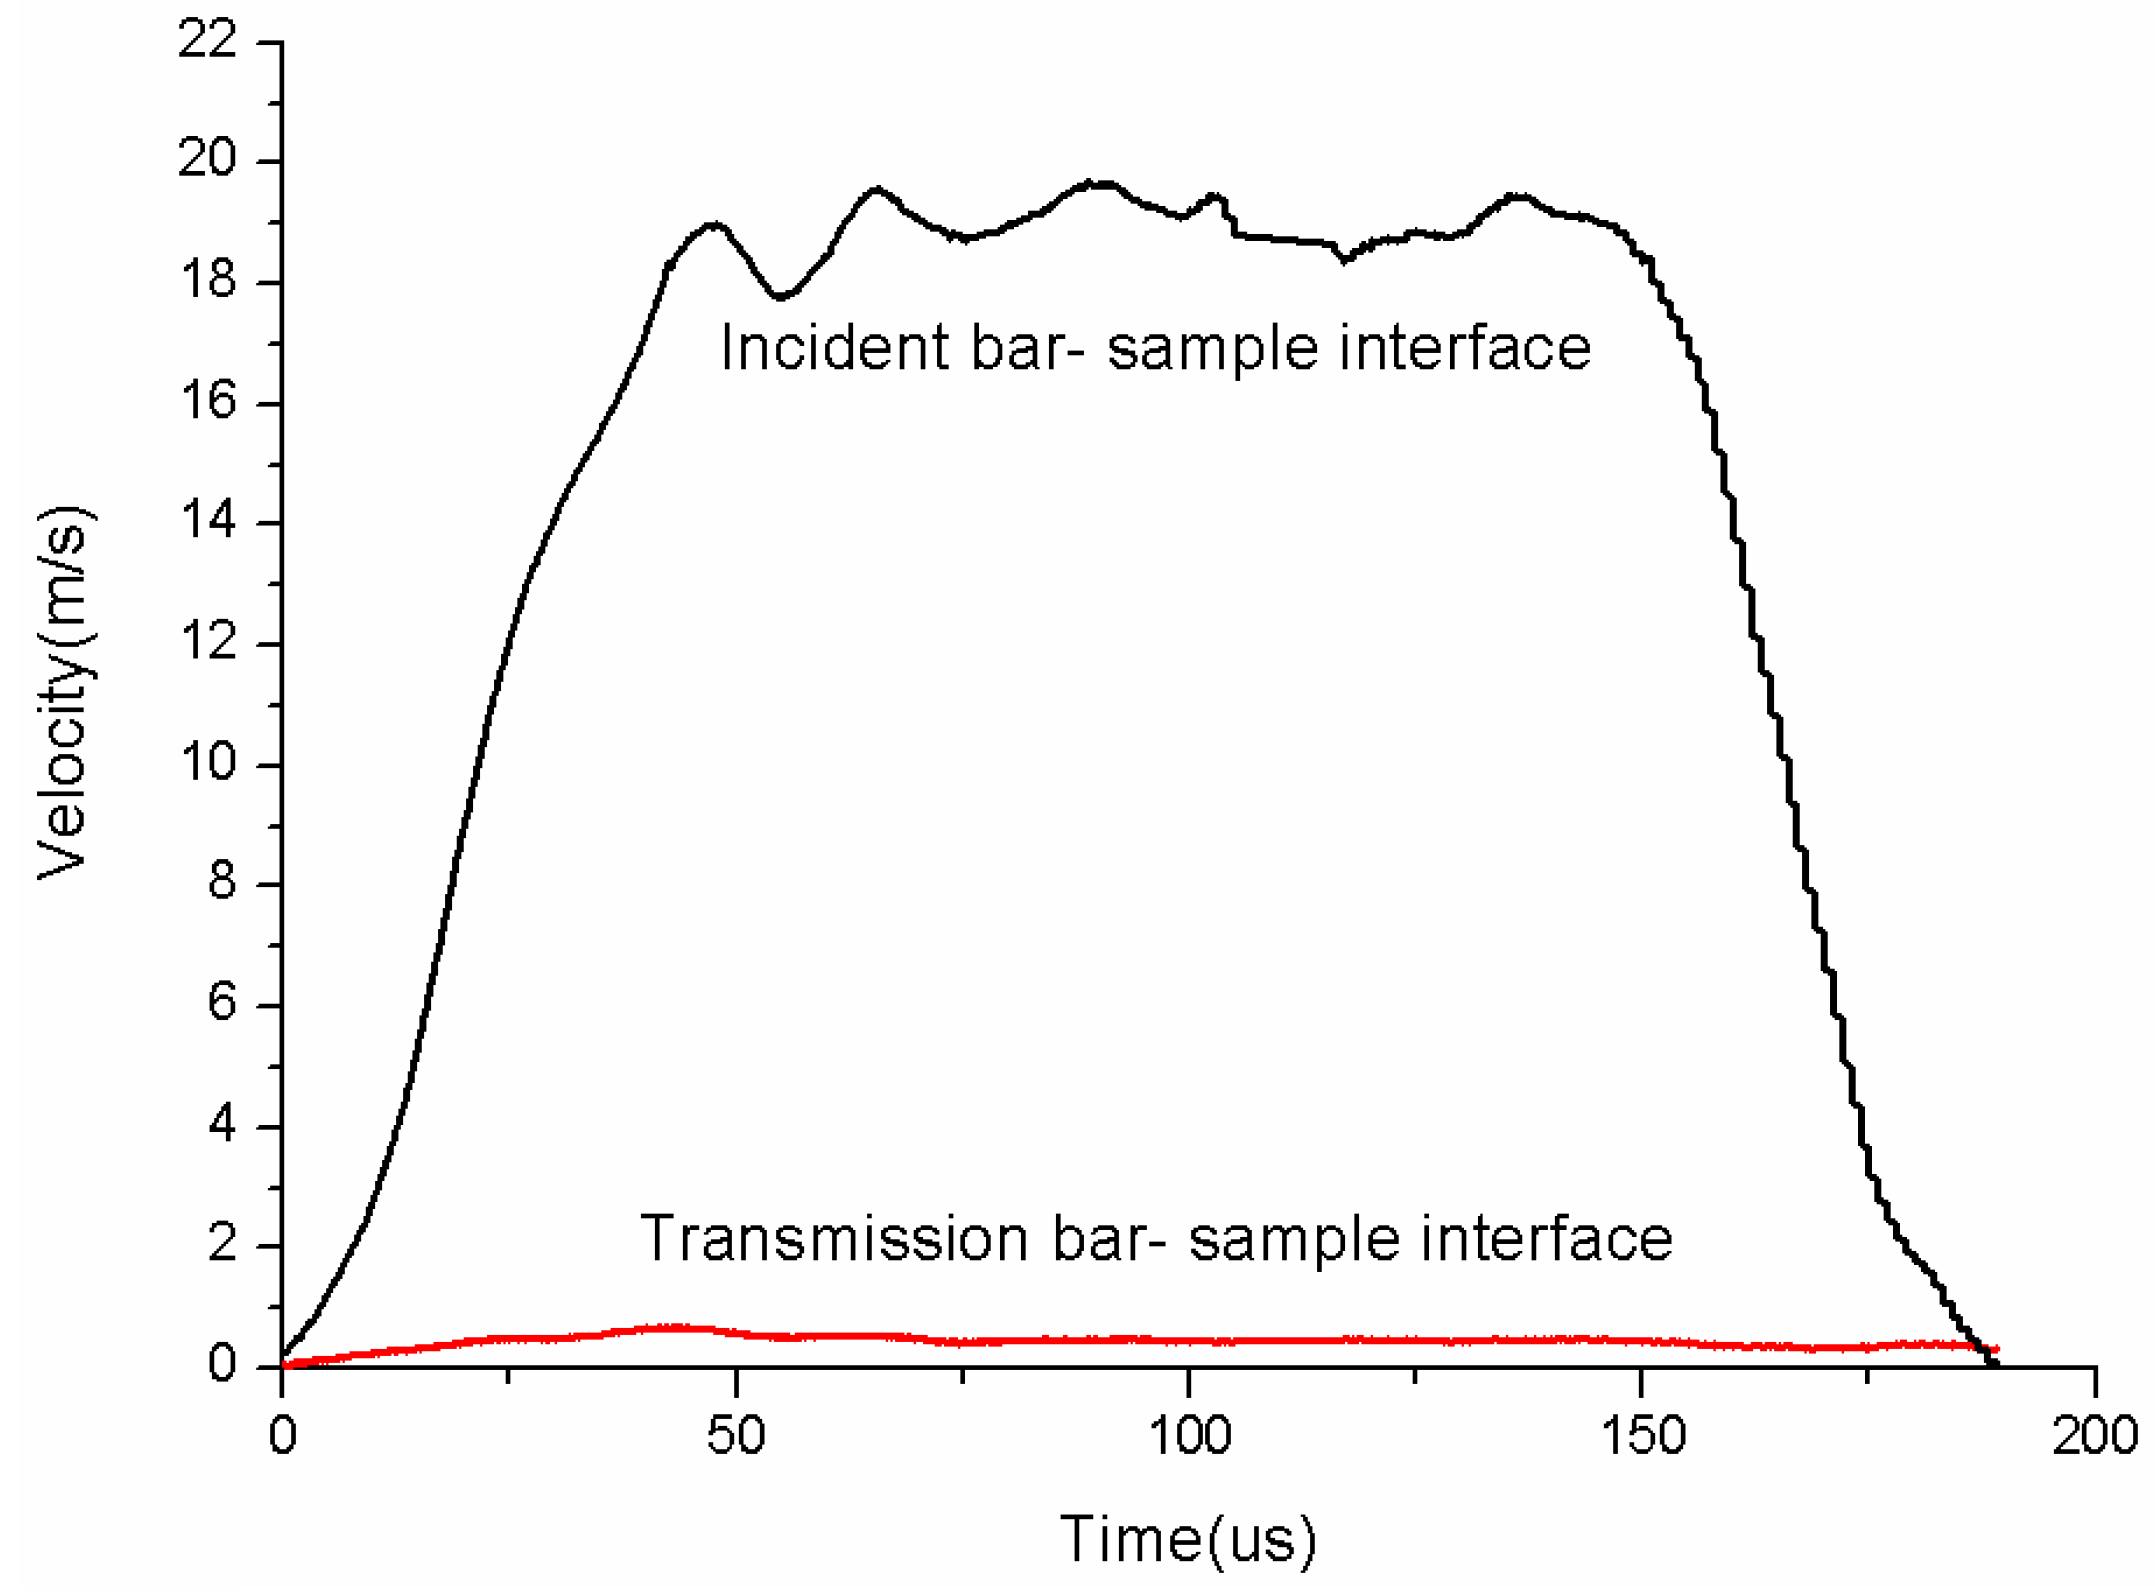
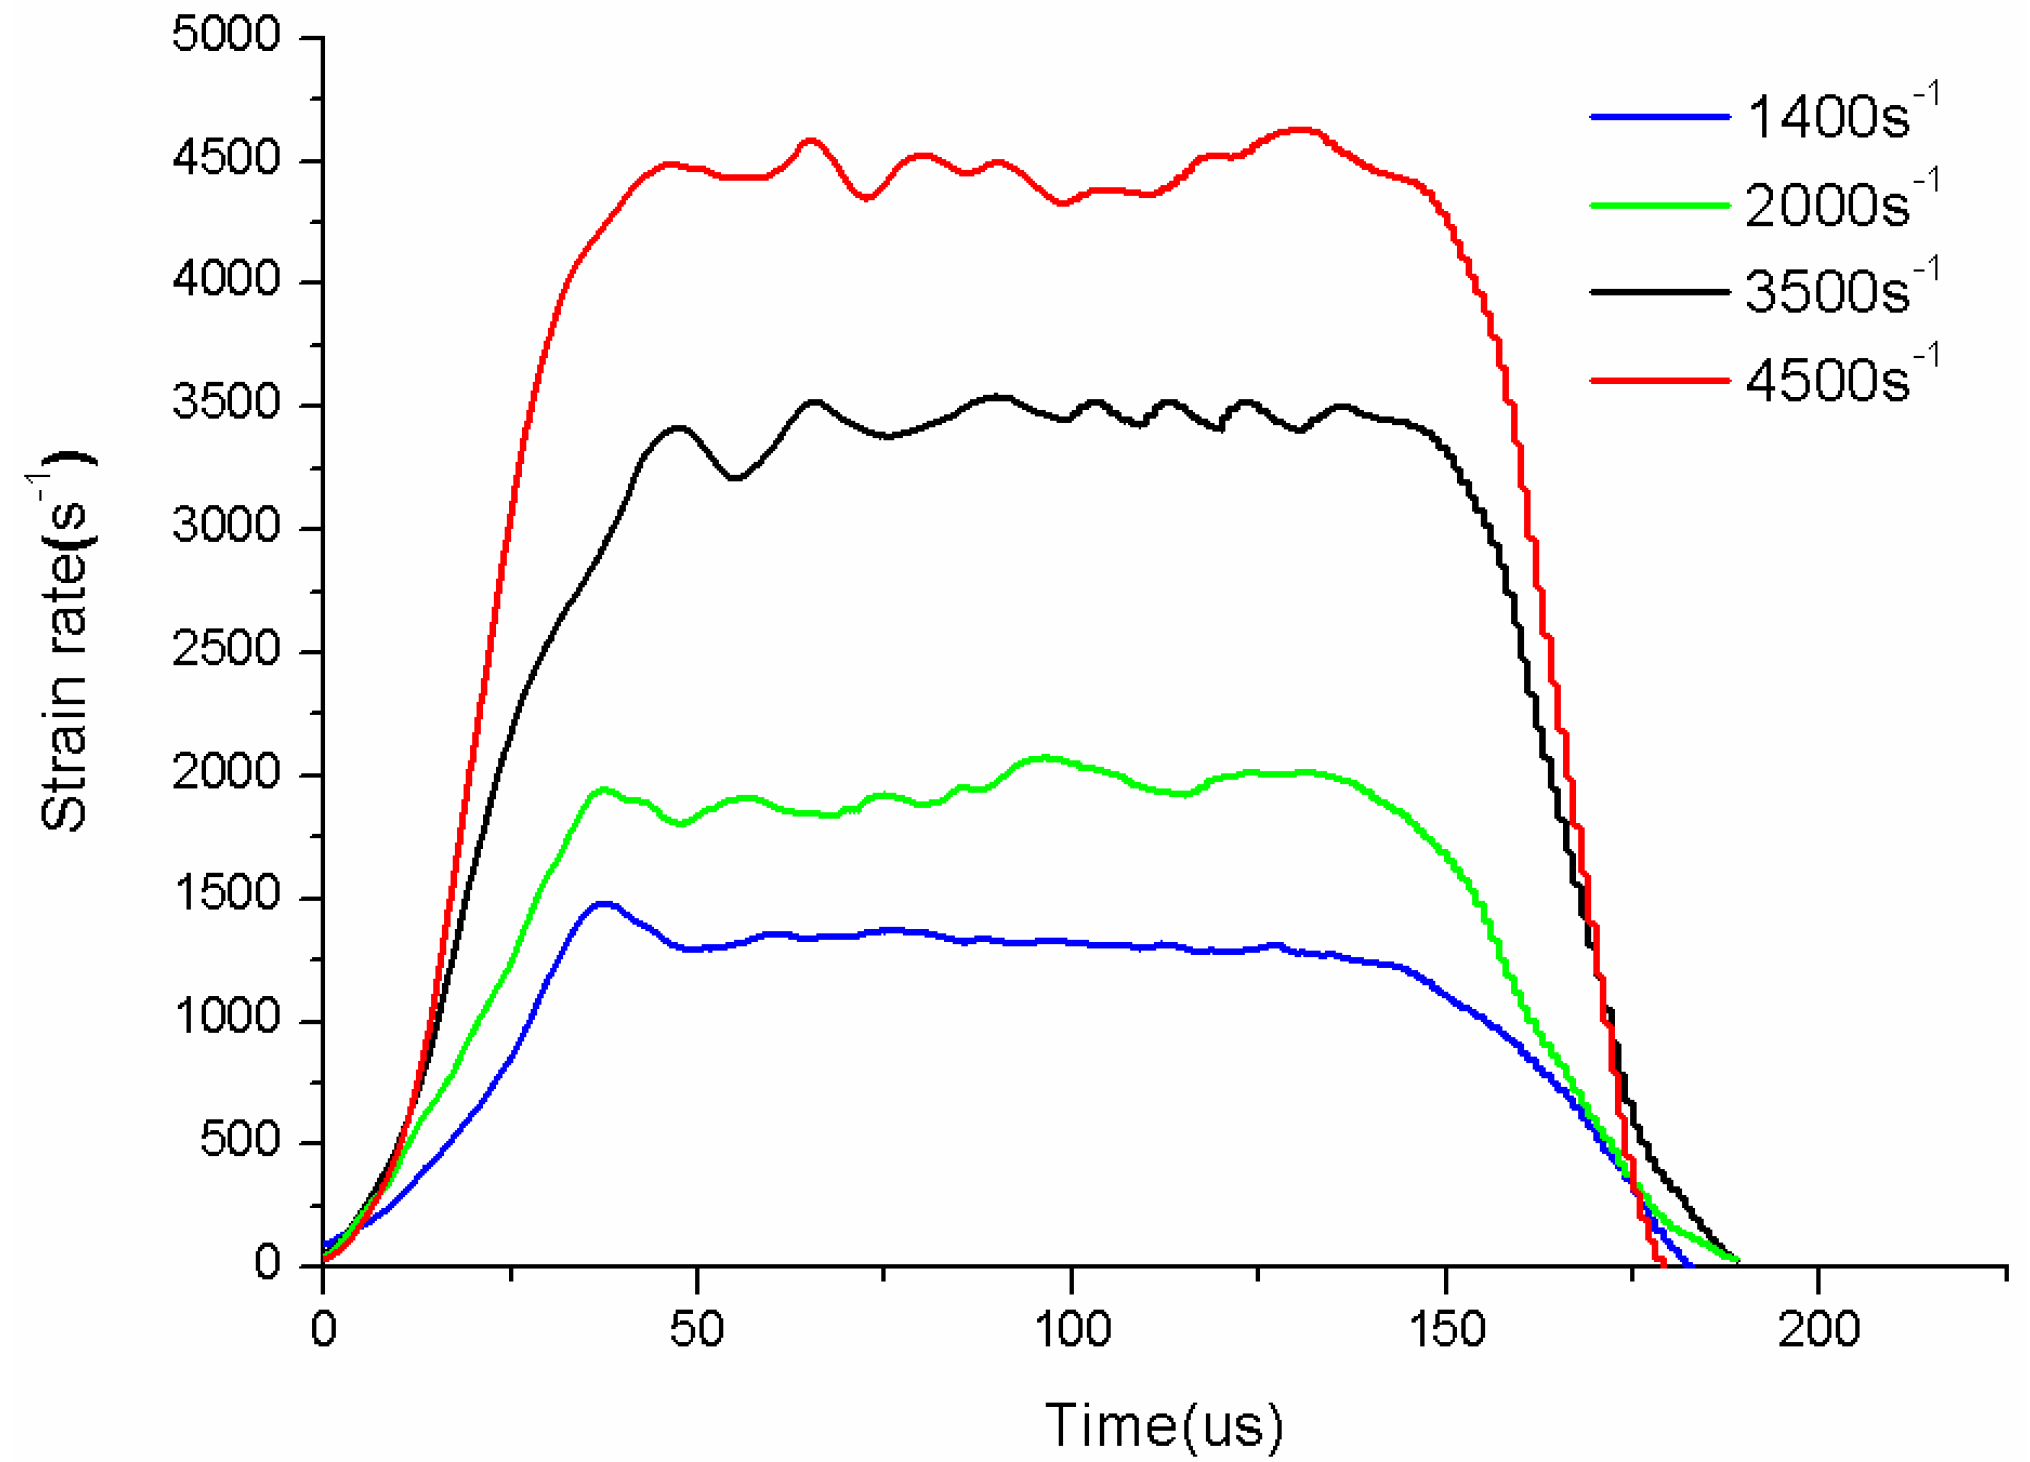
2.2. High Strain-Rate Uniaxial Tension Test
2.3. High-Speed Photography
2.4. Quasi-Static Uniaxial Tension Tests
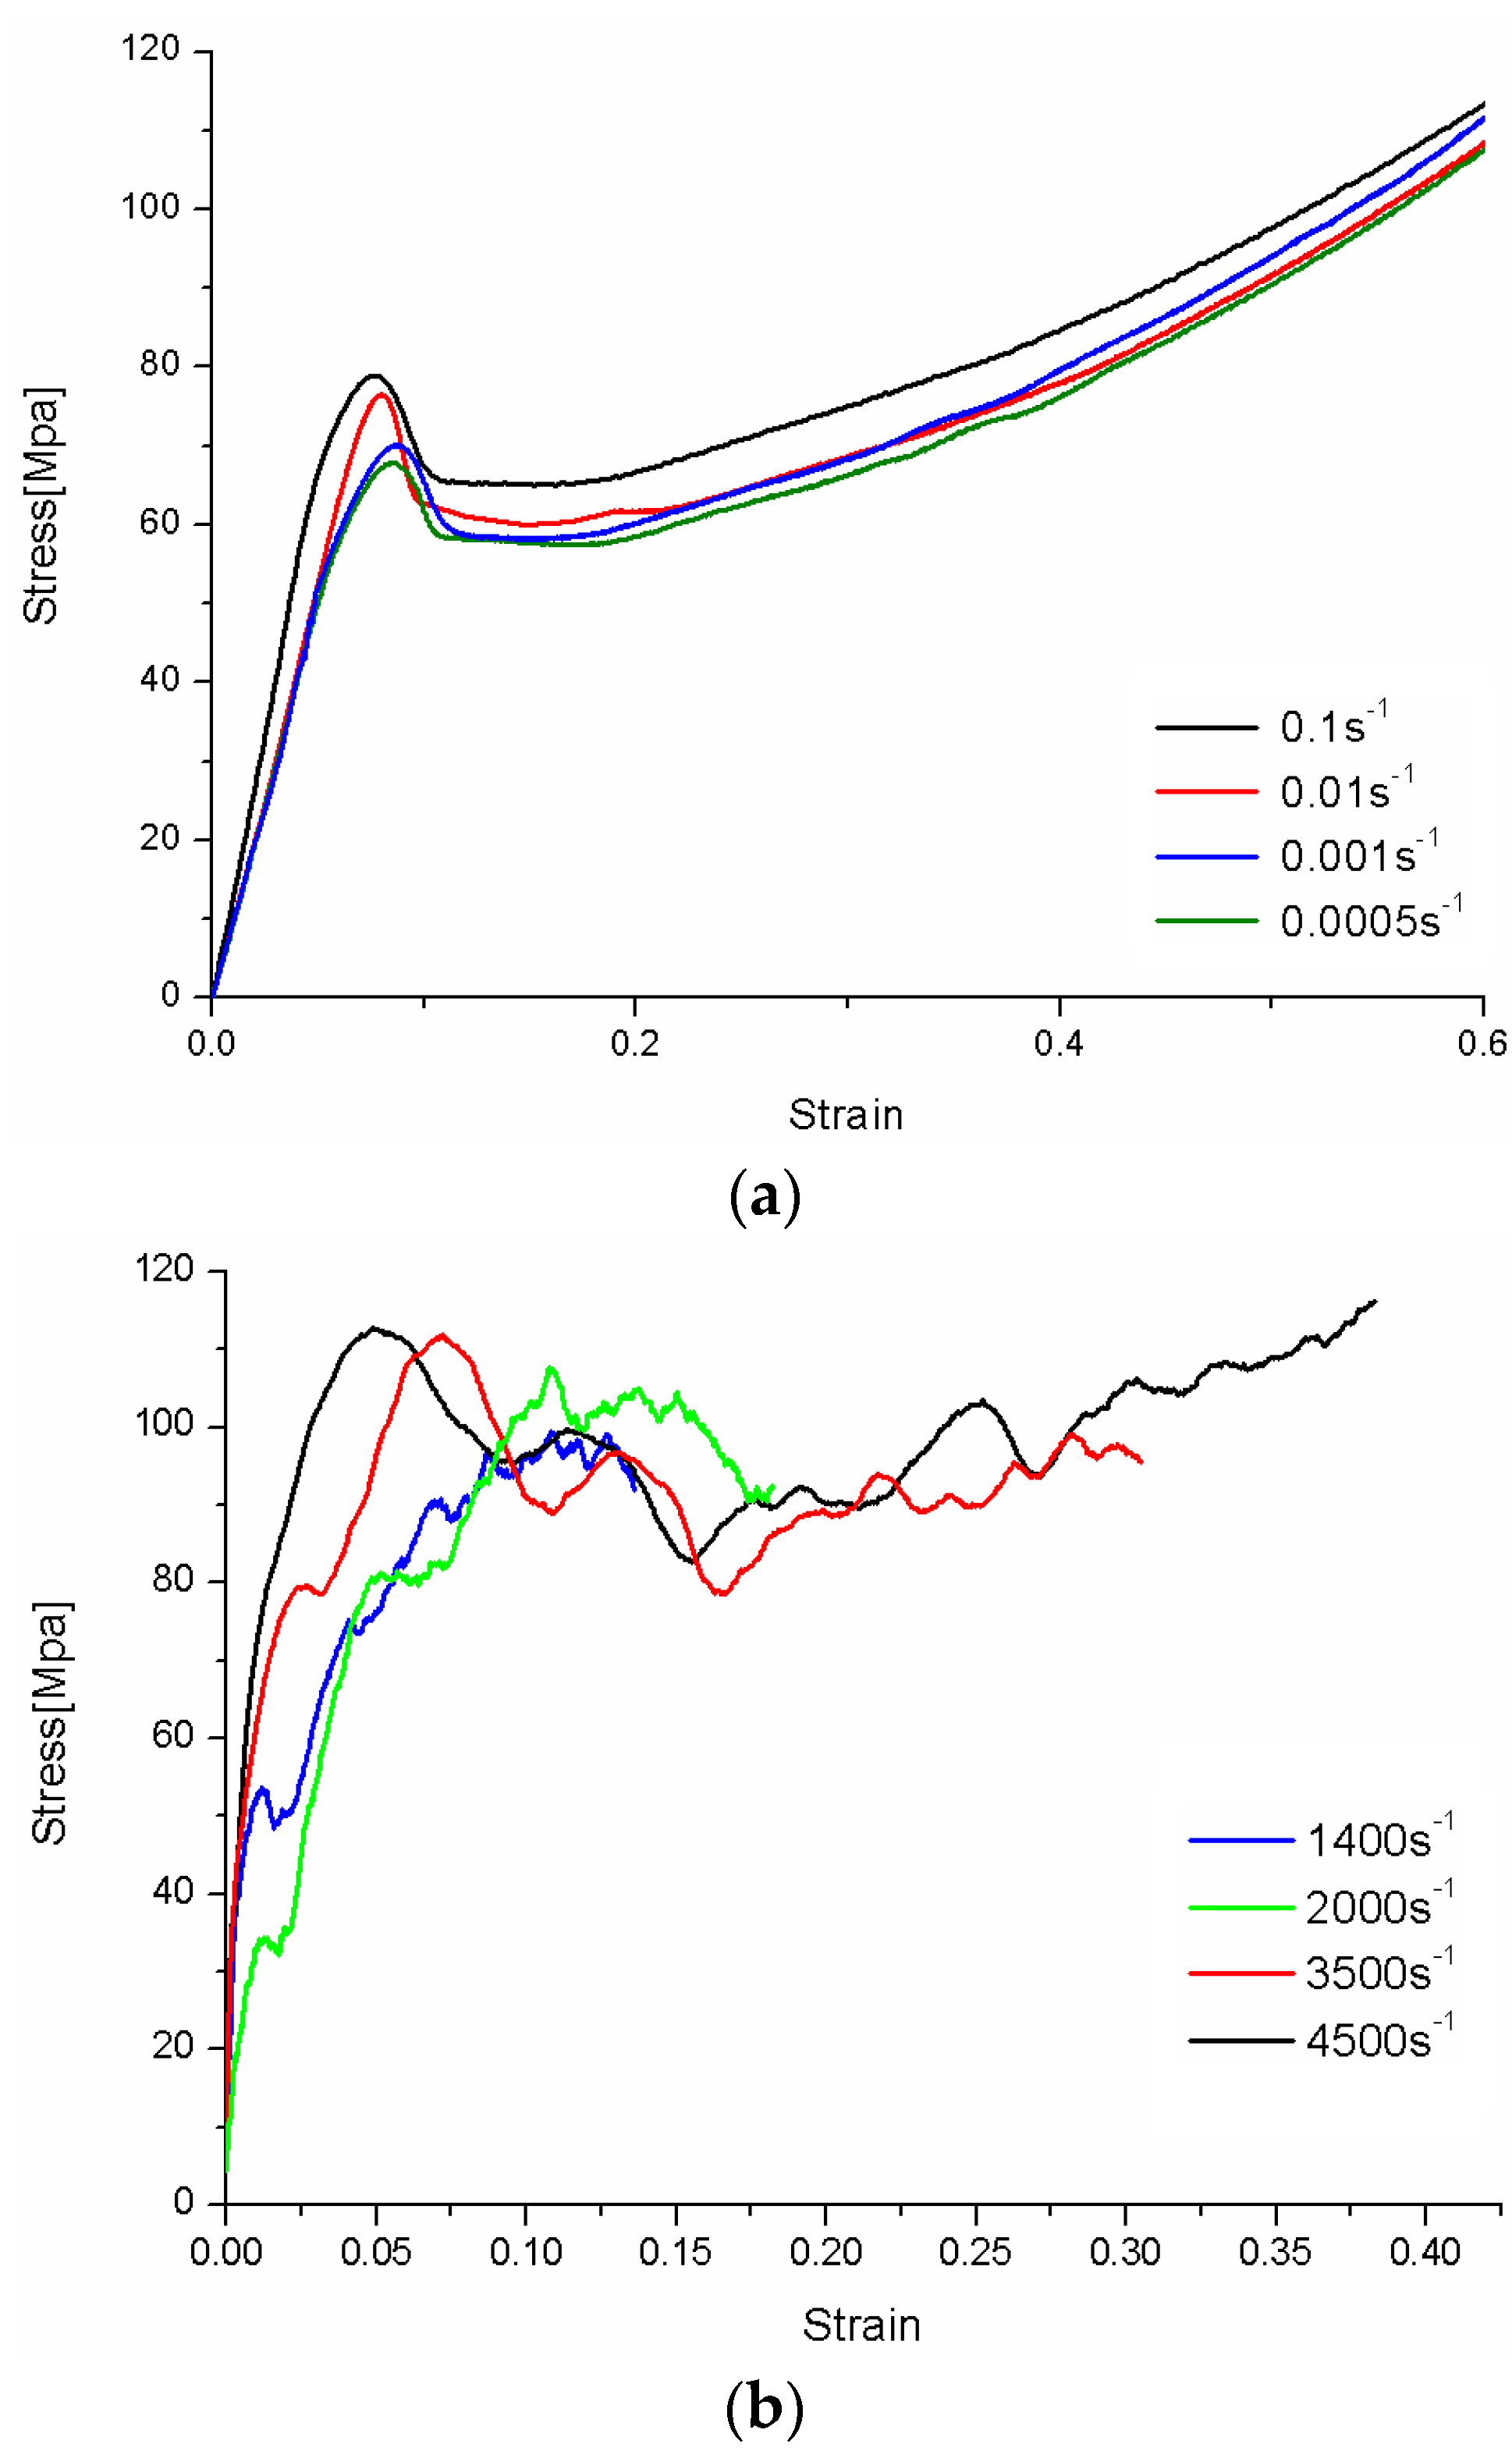
3. Experimental Results
4. Constitutive Model
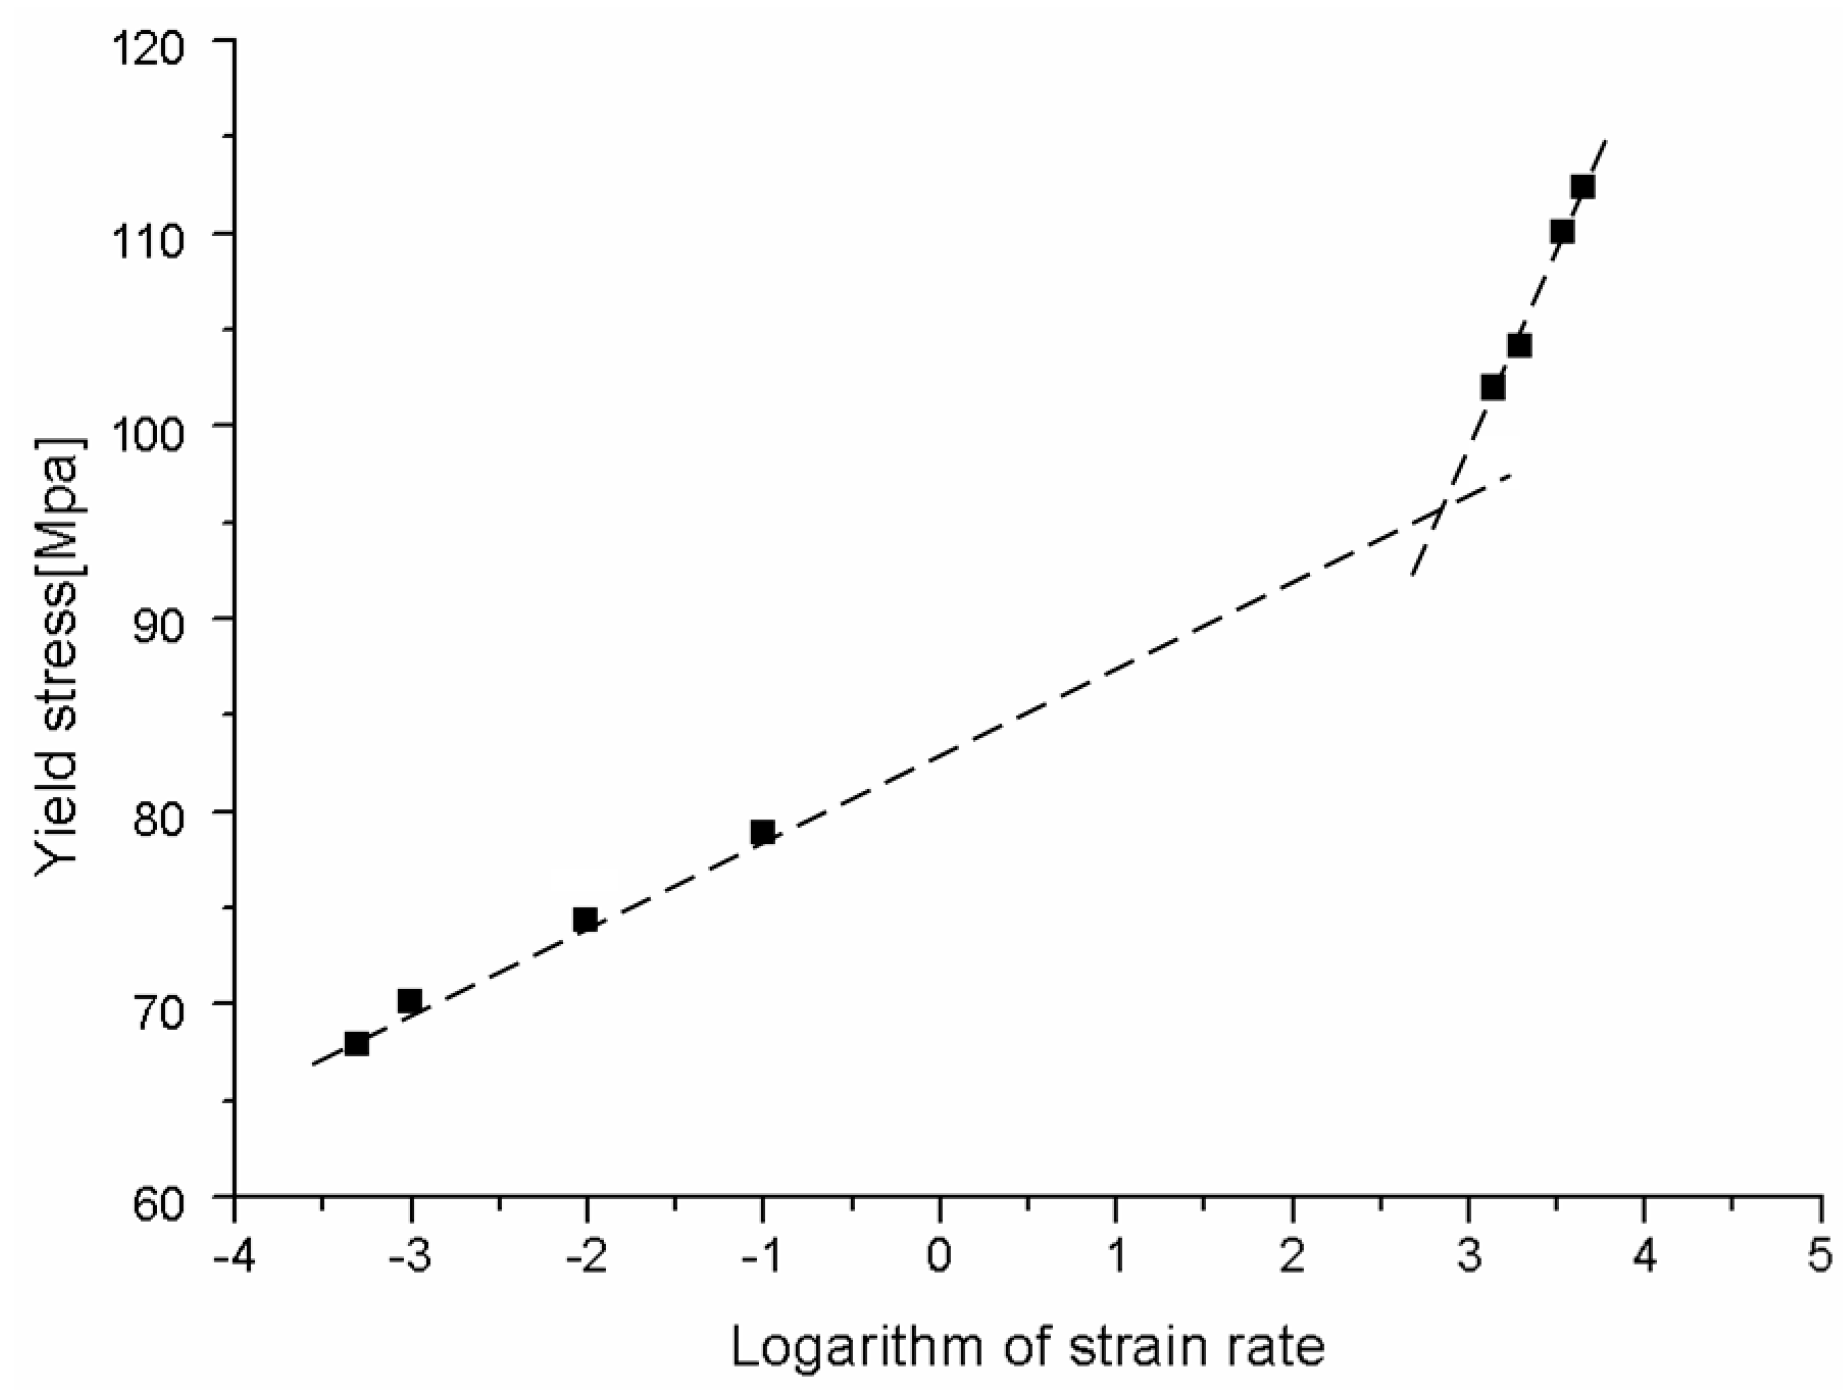
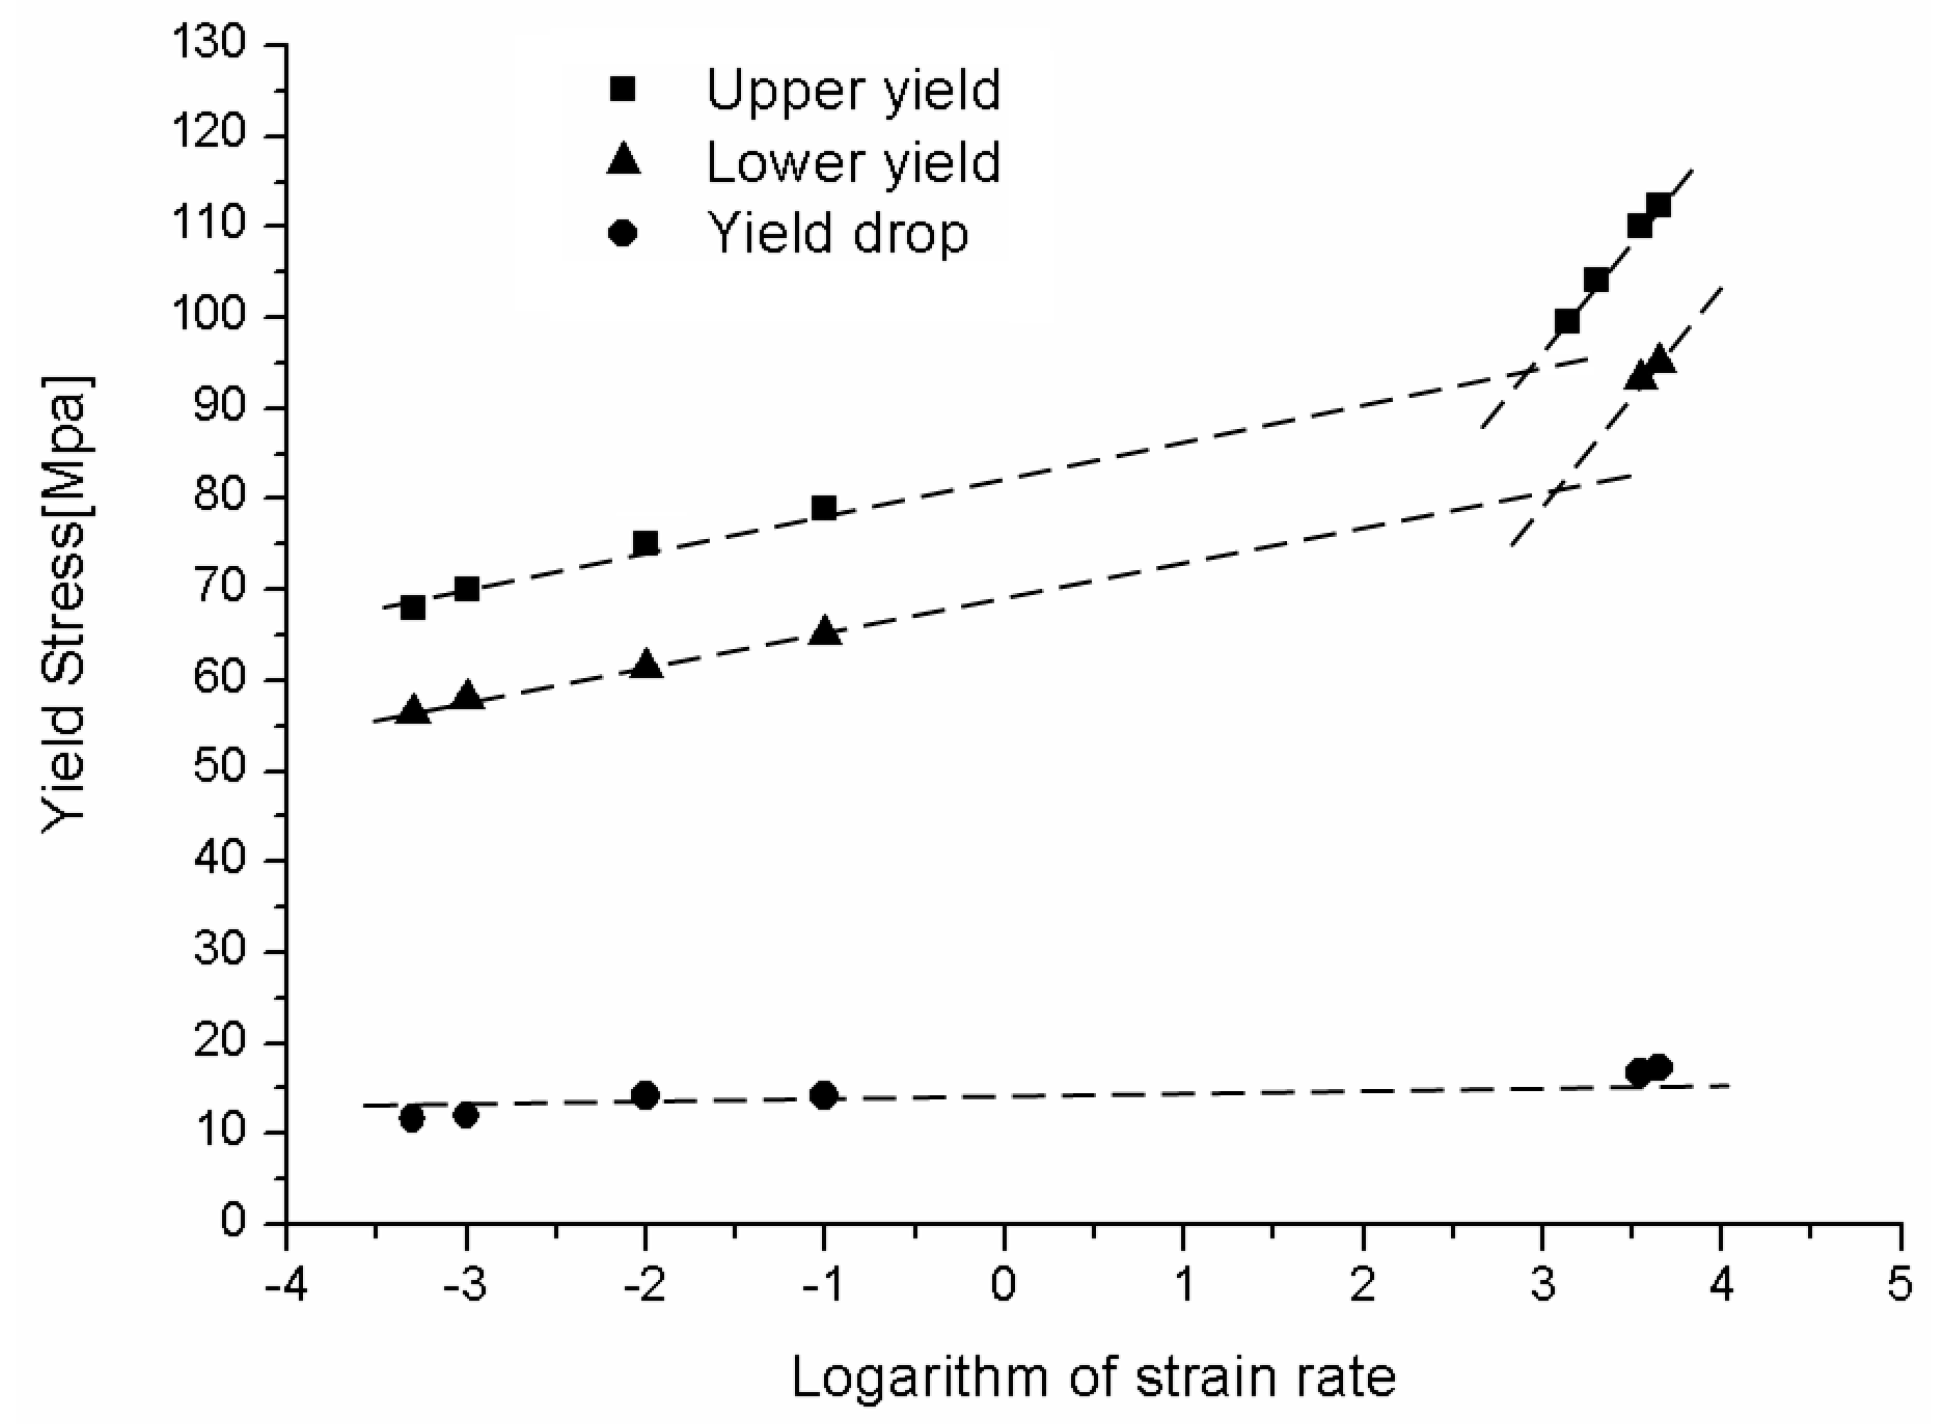
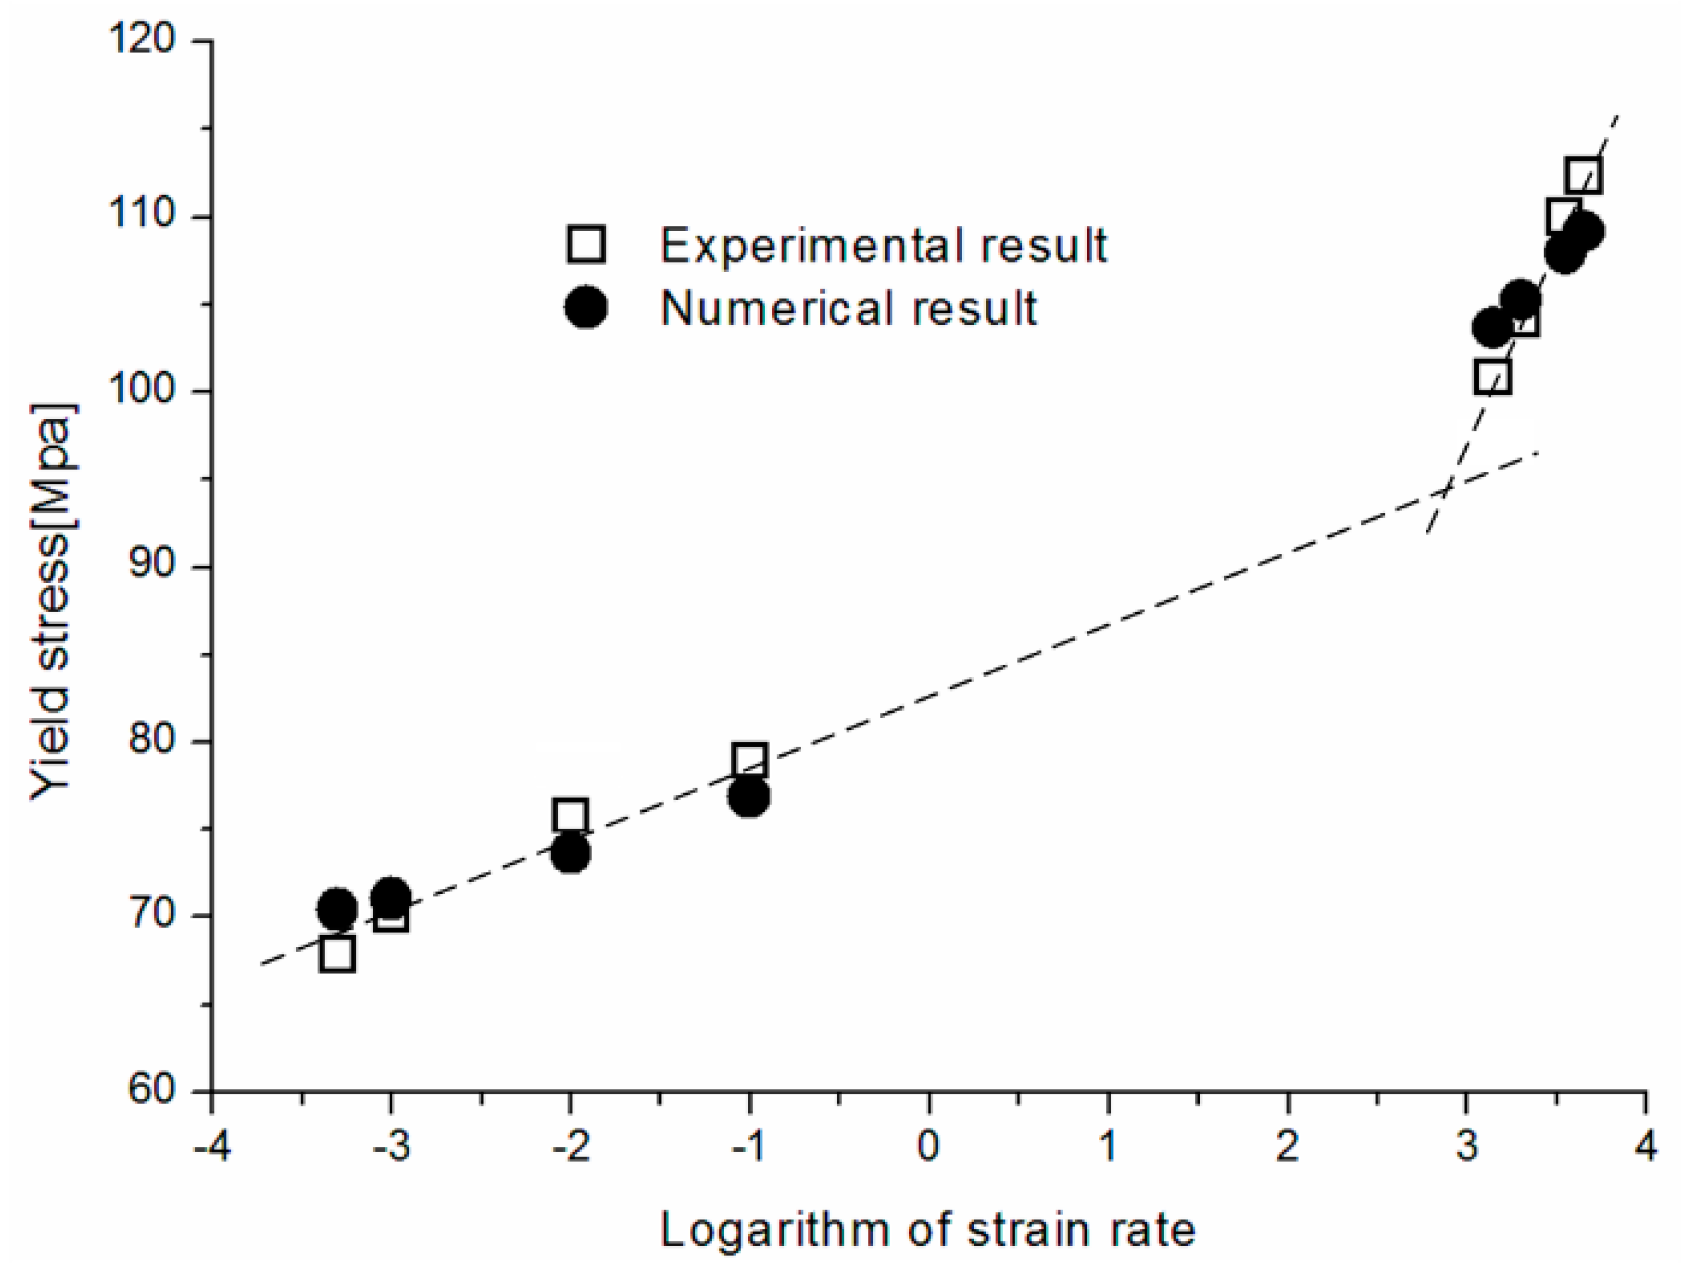
4.1. Strain Rate Dependent Yield
4.2. Strain Softening and Hardening
5. Finite Element Simulation of Tension Responses
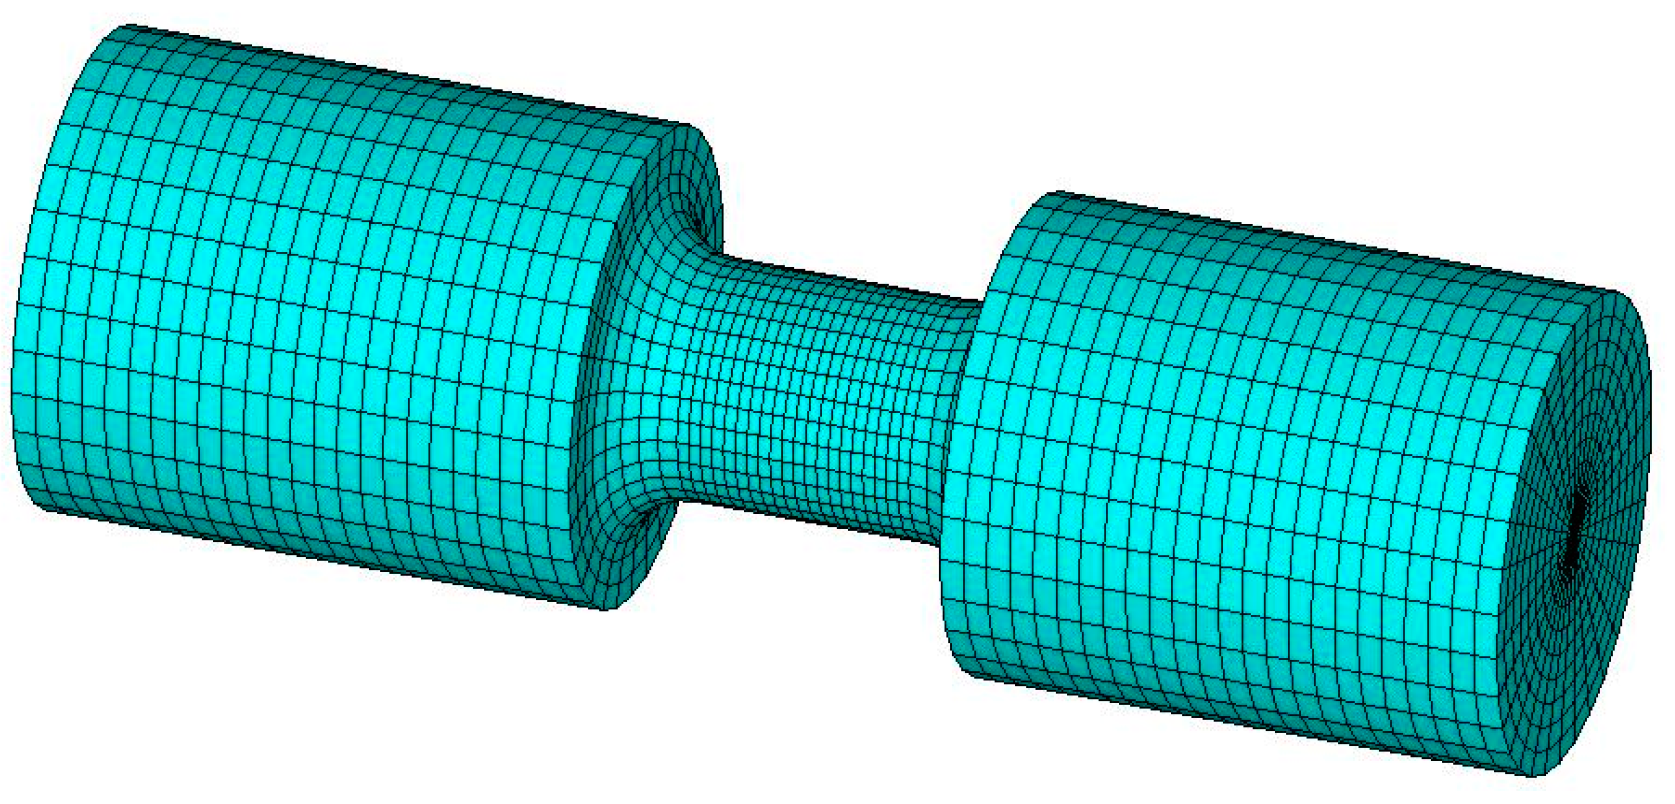
5.1. Finite Element Models
- Material constants
- Elastic modulus: E = 2271 MPa
- Poisson’s ratio: 0.4
- Density: = 1190 kg/m3
- Model parameters
- Yield parameters: K = 62.04 MPa, Cr = 0.307, m = 0.108
- Hardening parameters: Ch = 288.1 MPa, = 1.994
- Damage parameters: Cd = 0.365, = 0.399
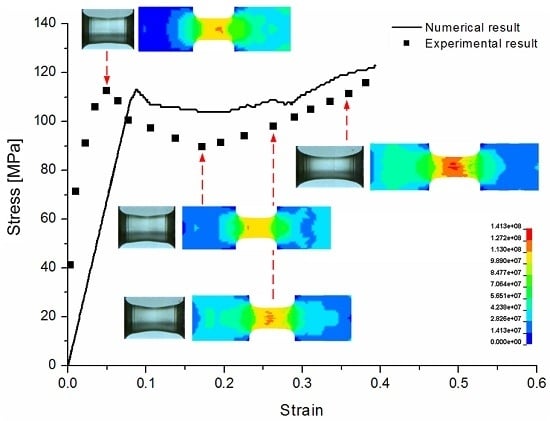
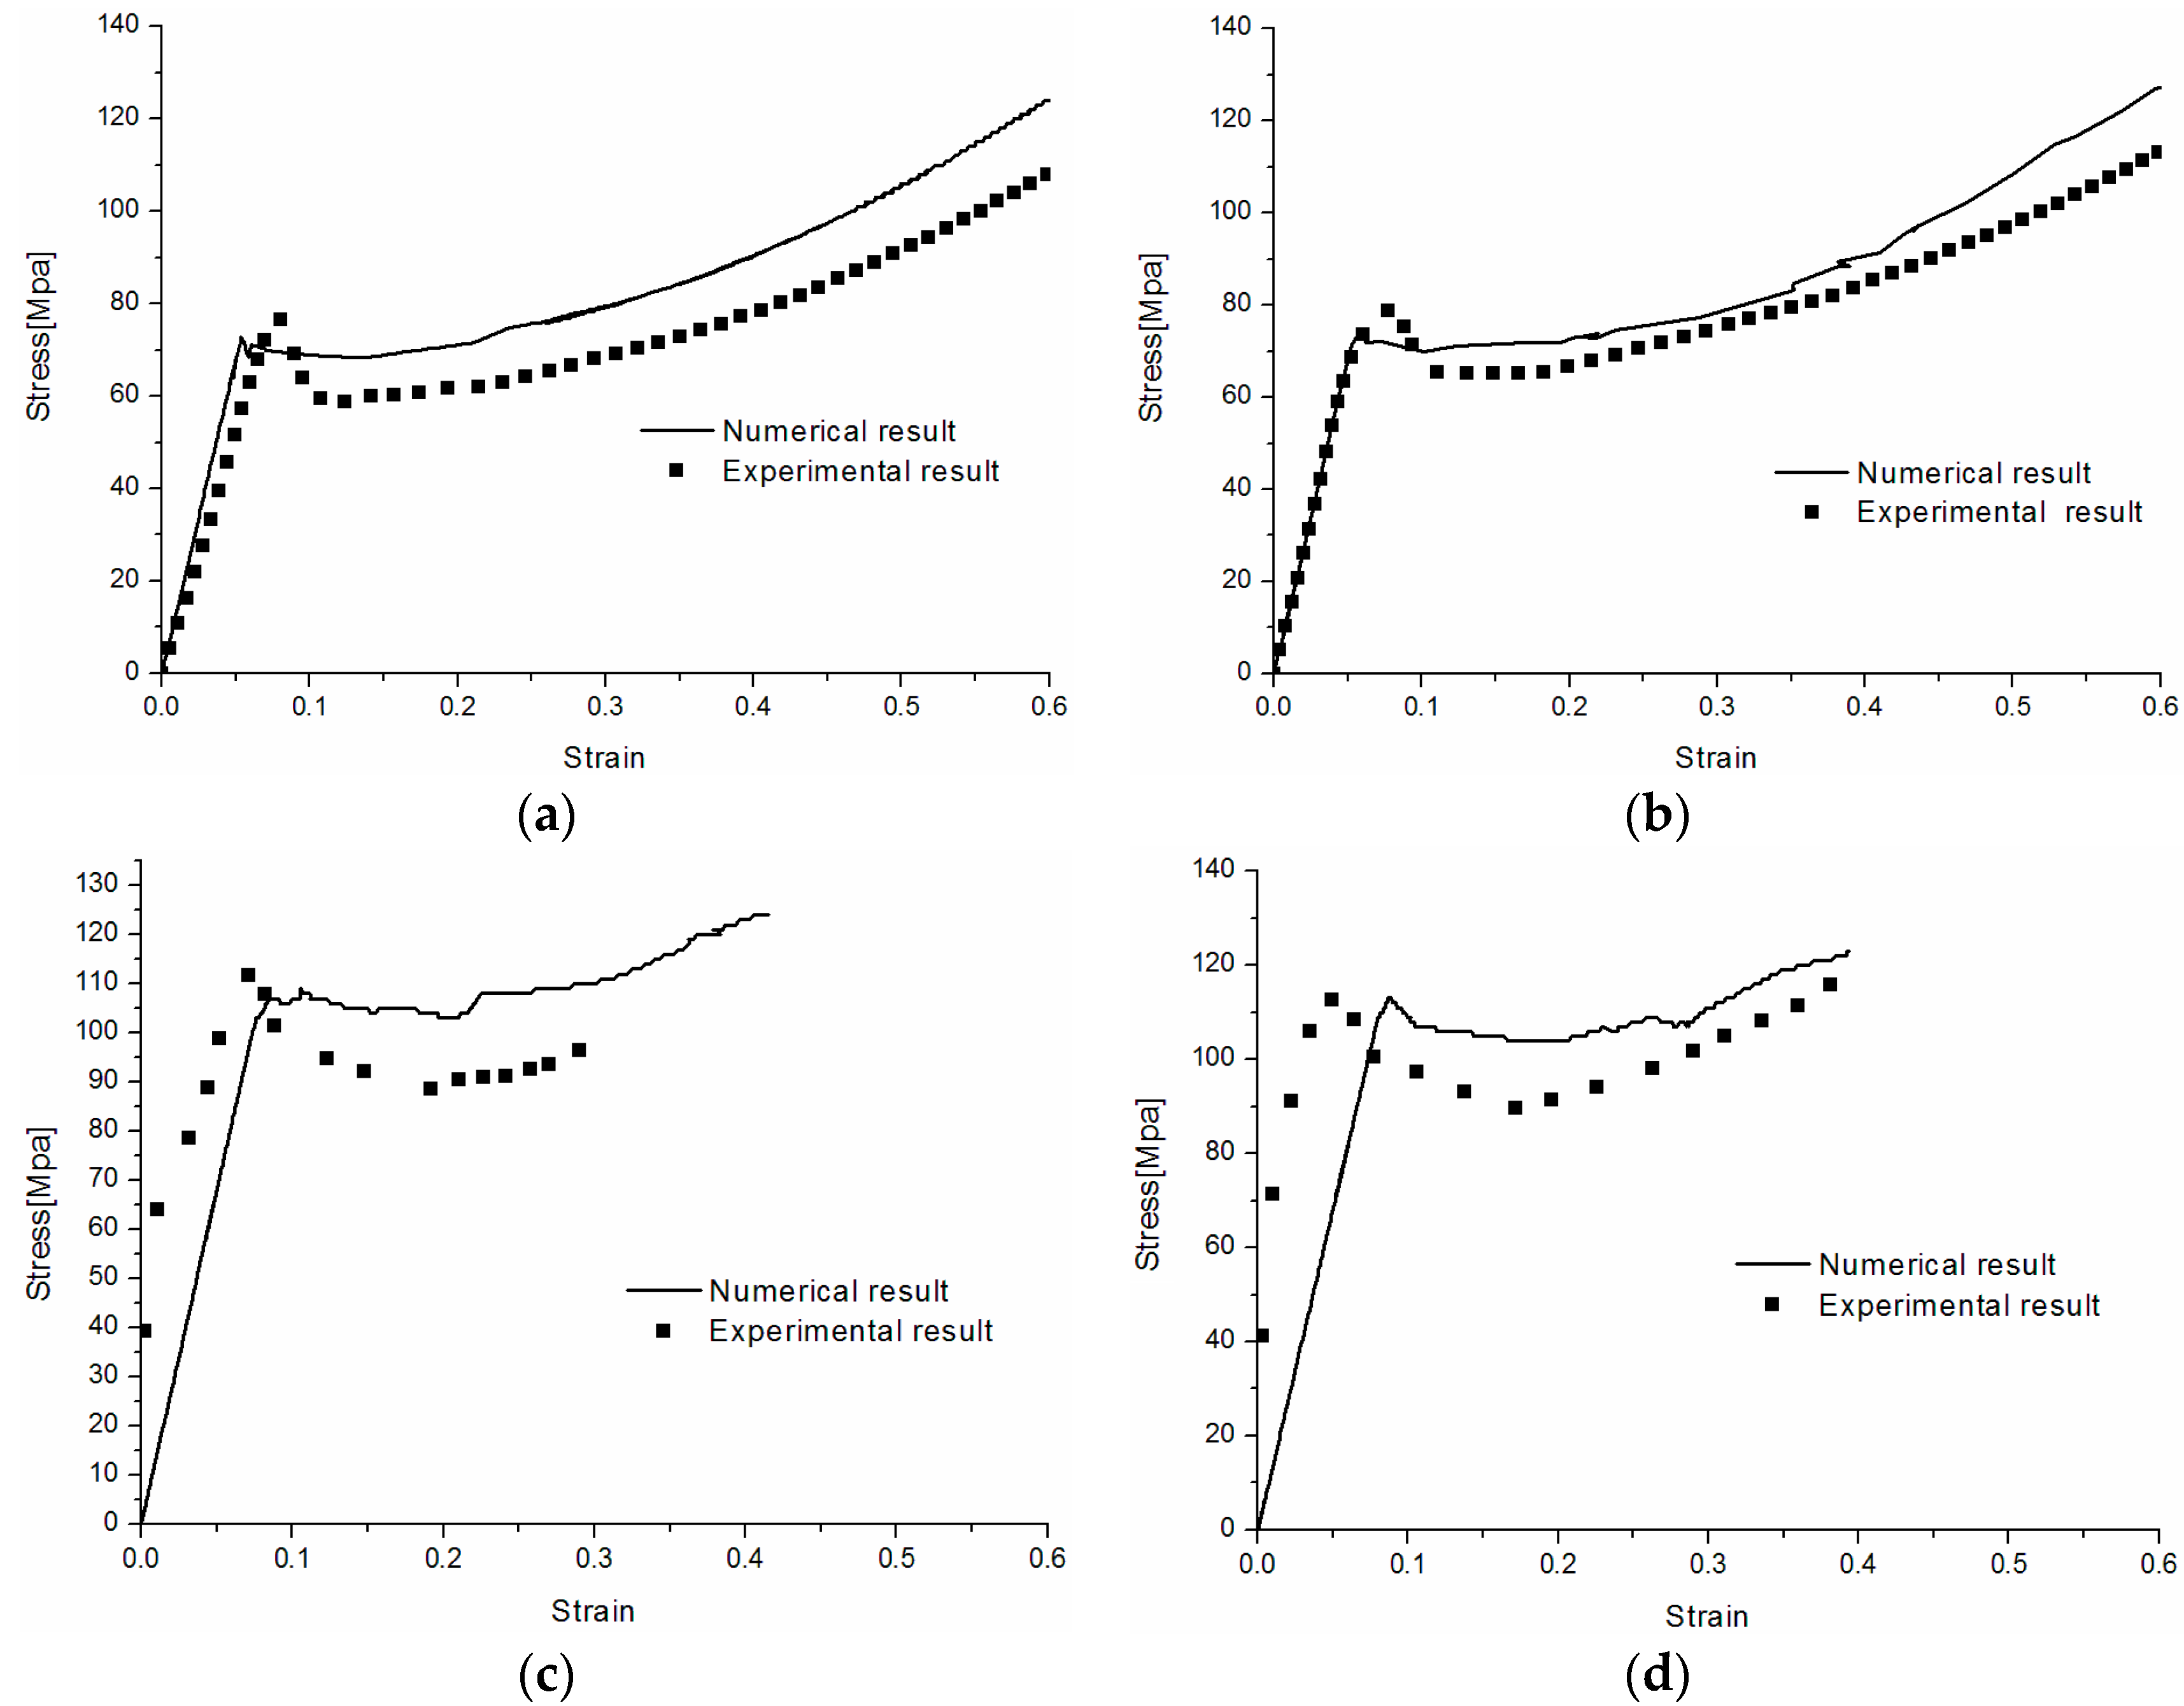
5.2. Numerical Results and Discussions
6. Conclusions
Acknowledgments
Author Contributions
Conflicts of Interest
References
- Xu, Y.J.; Zhang, Q.W.; Zhang, W.H.; Zhang, P. Optimization of injection molding process parameters to improve the mechanical performance of polymer product against impact. Int. J. Adv. Manuf. Technol. 2015, 76, 2199–2208. [Google Scholar] [CrossRef]
- Wang, J.; Xu, Y.J.; Zhang, W.H. Finite element simulation of PMMA aircraft windshield against bird strike by using a rate and temperature dependent viscoelastic constitutive model. Compos. Struct. 2014, 108, 21–30. [Google Scholar] [CrossRef]
- Xu, Y.J.; Lu, H.; Gao, T.L.; Zhang, W.H. Predicting the low-velocity impact behavior of polycarbonate: Influence of thermal history during injection molding. Int. J. Impact. Eng. 2015, 86, 265–273. [Google Scholar] [CrossRef]
- Gray, G.T. Classic split-Hopkinson pressure bar testing. In Mechanical Testing and Evaluation, Metals Handbook; American Society for Metals: Materials Park, OH, USA, 2008; Volume 8. [Google Scholar]
- Rietsch, F.; Bouette, B. The compression yield behaviour of polycarbonate over a wide range of strain rates and temperatures. Eur. Polym. J. 1990, 26, 1071–1075. [Google Scholar] [CrossRef]
- Duan, Y.; Saigal, A.; Greif, R.; Zimmerman, M.A. A uniform phenomenological constitutive model for glassy and semicrystalline polymers. Polym. Eng. Sci. 2001, 41, 1322–1328. [Google Scholar] [CrossRef]
- Siviour, C.R.; Walley, S.M.; Proud, W.G.; Field, J.E. The high strain rate compressive behaviour of polycarbonate and polyvinylidene difluoride. Polymer 2005, 46, 12546–12555. [Google Scholar] [CrossRef]
- Mulliken, A.D.; Boyce, M.C. Mechanics of the rate-dependent elastic–plastic deformation of glassy polymers from low to high strain rates. Int. J. Solids Struct. 2006, 43, 1331–1356. [Google Scholar] [CrossRef]
- Richeton, J.; Ahzi, S.; Vecchio, K.S.; Jiang, F.C.; Adharapurapu, R.R. Influence of temperature and strain rate on the mechanical behaviour of three amorphous polymers: Characterization and modeling of the compressive yield stress. Int. J. Solids Struct. 2006, 43, 2318–2335. [Google Scholar] [CrossRef]
- Omar, M.F.; Akil, H.M.; Ahmad, Z.A. Measurement and prediction of compressive properties of polymers at high strain rate loading. Mater. Des. 2011, 32, 4207–4215. [Google Scholar] [CrossRef]
- Dar, U.A.; Zhang, W.H.; Xu, Y.J.; Wang, J. Thermal and strain rate sensitive compressive behavior of polycarbonate polymer-experimental and constitutive analysis. J. Polym. Res. 2014, 21, 519–530. [Google Scholar] [CrossRef]
- Khan, A.S.; Lopez-Pamies, O.; Kazmi, R. Thermo-mechanical large deformation response and constitutive modeling of viscoelastic polymers over a wide range of strain rates and temperatures. Int. J. Plast. 2006, 22, 581–601. [Google Scholar] [CrossRef]
- Chen, W.; Lu, F.; Cheng, M. Tension and compression tests of two polymers under quasi-static and dynamic loading. Polym. Test. 2002, 21, 113–121. [Google Scholar] [CrossRef]
- Cheng, M.; Chen, W. Experimental investigation of the stress-stretch behavior of EPDM rubber with loading rate effects. Int. J. Solids Struct. 2003, 40, 4749–4768. [Google Scholar] [CrossRef]
- Rae, P.; Brown, E. The properties of poly(tetrafluoroethylene) (PTFE) in tension. Polymer 2005, 46, 8128–8140. [Google Scholar] [CrossRef]
- Yin, Z.N.; Wang, T.J. Deformation response and constitutive modeling of PC, ABS and PC/ABS alloys under impact tensile loading. Mater. Sci. Eng. A 2010, 527, 1461–1468. [Google Scholar] [CrossRef]
- Sarva, S.S.; Boyce, M.C. Mechanics of polycarbonate during high-rate tension. J. Mech. Mater. Struct. 2007, 2, 1853–1880. [Google Scholar] [CrossRef]
- Cao, K.; Wang, Y.; Wang, Y. Experimental investigation and modeling of the tension behavior of polycarbonate with temperature effects from low to high strain rates. Int. J. Solids Struct. 2014, 51, 2539–2548. [Google Scholar] [CrossRef]
- Anand, L.; Ames, N.M.; Srivastava, V.; Chester, S.A. A thermo-mechanically coupled theory for large deformations of amorphous polymers, part I: Formulation. Int. J. Plast. 2009, 25, 1474–1494. [Google Scholar] [CrossRef]
- Bouvard, J.L.; Ward, D.K.; Hossain, D.; Marin, E.B.; Bammann, D.J.; Horstemeyer, M.F. A general inelastic internal state variable model for amorphous glassy polymers. Acta Mech. 2010, 213, 71–96. [Google Scholar] [CrossRef]
- Richeton, J.; Ahzi, S.; Vecchio, K.S.; Jiang, F.C.; Makradi, A. Modeling and validation of the large deformation inelastic response of amorphous polymers over a wide range of temperatures and strain rates. Int. J. Solids Struct. 2007, 44, 7938–7954. [Google Scholar] [CrossRef]
- Xu, Z.; Li, Y.; Huang, F. Application of split Hopkinson tension bar technique to study of dynamic fracture properties of materials. Acta Mech. Sin. 2012, 28, 424–431. [Google Scholar] [CrossRef]
- Wang, J.; Xu, Y.J.; Moumni, Z.; Zhang, W.H. A new damage-based model for the non-linear behavior of polycarbonate polymers. Mater. Des. 2016. under review. [Google Scholar]
- De Souza Neto, E.A.; Peric, D.; Owen, D.R.J. Computational Methods for Plasticity; Wiley: New York, NY, USA, 2008. [Google Scholar]
- Lemaitre, J.; Lippmann, H. A Course on Damage Mechanics; Springer: Berlin, Germany, 1996. [Google Scholar]


| Time (μs) | The contours of axial stress (MPa) | Photograph of the gauge region | |
|---|---|---|---|
| 20 |  | 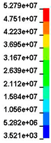 | 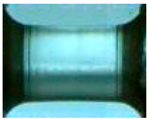 |
| 30 |  | 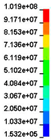 |  |
| 55 |  |  |  |
| 65 |  | 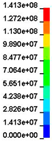 |  |
| 75 |  |  | 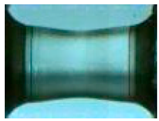 |
| 100 |  |  | 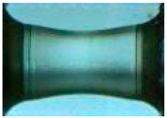 |
| 120 |  | 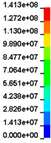 | 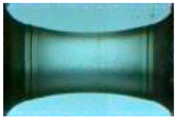 |
| 140 |  | 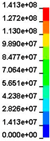 | 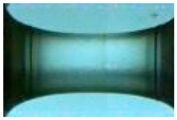 |
© 2016 by the authors. Licensee MDPI, Basel, Switzerland. This article is an open access article distributed under the terms and conditions of the Creative Commons by Attribution (CC-BY) license ( http://creativecommons.org/licenses/by/4.0/).
Share and Cite
Xu, Y.; Gao, T.; Wang, J.; Zhang, W. Experimentation and Modeling of the Tension Behavior of Polycarbonate at High Strain Rates. Polymers 2016, 8, 63. https://doi.org/10.3390/polym8030063
Xu Y, Gao T, Wang J, Zhang W. Experimentation and Modeling of the Tension Behavior of Polycarbonate at High Strain Rates. Polymers. 2016; 8(3):63. https://doi.org/10.3390/polym8030063
Chicago/Turabian StyleXu, Yingjie, Tenglong Gao, Jun Wang, and Weihong Zhang. 2016. "Experimentation and Modeling of the Tension Behavior of Polycarbonate at High Strain Rates" Polymers 8, no. 3: 63. https://doi.org/10.3390/polym8030063