1. Introduction
In the last two decades, the design of composite materials comprising either micro-scaled or nano-scaled inorganic particles has gained increased attention in power and high-voltage engineering [
1,
2,
3,
4,
5,
6,
7,
8]. Particularly, the use of micro- and nanotechnologies offers new approaches towards improved insulation systems that operate at higher temperatures and electrical stress. Along with material performance, basic research and development of “advanced” materials in the field of polymer base composites also pursue energy-efficient and low cost manufacturing routes in order to bring new material concepts into marketable products [
1].
Composite materials typically consist of two or more components that comprise significantly different physical and/or chemical properties. Due to the controlled combination of the components, new materials are obtained with distinct properties from the individual components [
2]. If at least one of the components has nanometric dimensions, these materials are termed nanocomposites [
3]. In Reference [
3] a nanocomposite is defined as “a multiphase solid material where one of the phases has one, two or three dimensions of less than 100 nanometers (nm), or structures with repeating distances between the different phases in nanoscale that form the material”. Nanocomposites differ from traditional composites in three major aspects: (i) they contain a small amount of filler (usually less than 10 wt %
vs. more than 50 wt % for composites); (ii) the filler size is in the range of nanometers in size (10
−9 m
vs. 10
−6 m for composites) and (iii) they have tremendously large specific surface area compared to micro-sized composites [
4]. Thus, nanocomposites are characterized by distinctive advantages including homogenous structure, no fiber rupture, and optical transparency, improved or unchanged processabillity [
4]. Depending on the matrix material, nanocomposites can be classified in three major categories: ceramic matrix nanocomposites, metal matrix nanocomposites and polymer matrix nanocomposites [
5]. In Reference [
4], polymer matrix nanocomposites are considered as “polymers in which a small amount of nanometer size fillers (≤ 10 wt %) is homogeneously dispersed”.
Composite materials are typically desired to be employed instead of traditional materials due to their enhanced materials performance involving high strength, toughness, heat resistance, light weight, impermeability against gasses, thermal endurance and stability in the presence of aggressive chemicals, water and hydrocarbons, high resistance to fatigue and corrosion degradation, re-processing recyclability and less leakage of small molecules such as stabilizers,
etc. [
4]. In particular, in the field of plastic engineering, composite materials are selected as a function of Young’s modulus
versus density or yield strength
versus density [
4]. For numerous applications in automotive, aircraft or maritime industry, light-weight materials with increased mechanical strength are preferred to be used. The present review addresses polymer based micro- and nanocomposites that are employed in high-voltage applications and gives an overview of electrical, mechanical and thermal properties of composite materials in dependence on the material structures and compositions.
In the power industry, inorganic filler (particularly aluminum nitride (AlN), boron nitride (BN), silicon dioxide or silica (SiO
2), aluminum oxide or alumina (Al
2O
3), titanium oxide or titania (TiO
2), silicon carbide (SiC) and zinc oxide (ZnO),
etc.) are usually incorporated into electrical insulating polymers to achieve specific electrical, mechanical, and thermal properties [
1,
6]. As an example, the resistance of nanocomposites to partial discharges and electric treeing enables the design of new insulation systems with enhanced electrical breakdown strength. Beside electrical properties, mechanical strength as well as thermal conductivity play an important role in selected applications such as insulation systems of large electrical machines. In addition, permittivity and dissipation factor are desired to be as low as possible for electrical insulation whilst for capacitors, loss factor should be as high as possible. Flame retardancy is a property desired for cables insulation used in the radiation field in tunnels, while tracking resistance is very important for outdoor insulators [
4].
The present study highlights the most recent studies and results concerning micro- and nanocomposites materials used in high-voltage applications and possible future work on these materials as the distinctive advantages of polymer based (nano) composites (
i.e., high temperature performance, improved dielectrics, structural properties and designability) offer promising concepts for the next generation of large motors, generators, transformers and other electrical devices, such as coil forms, slot liners and multifunctional components [
7] (see
Figure 1).
2. From Micro to Nanocomposites in Electrical Engineering
In 1987, Ashley described a perspective on advanced materials and the evolution of engineering materials (see
Figure 2) [
8]. It is obvious that the time scale is non-linear and in 2020, the estimation on materials usage is in a continuous increasing and the rate of change is far faster today than any previous time in history. The rapid rate of change offers opportunities that cannot be ignored by materials scientists, engineers and chemists. As a prominent example, engines efficiency increases at high operating temperatures and this requires high temperature resistant structural materials. However, new materials for rotating machines electrical insulation systems are not only faced by higher operation temperatures, but also by increased electrical, environmental and mechanical stresses. Further examples are nuclear power plants that require advanced materials for electrical equipment which are resistant to low- and high-energy radiations. In addition, developments in optical communication strongly rely on optical fibers that absorb light negligibly and on structural materials that are strong as metals and resist corrosion as plastics.
In electrical engineering, the first insulation systems were composite materials based on natural fibers of cellulose, silk, flax, cotton, wool, asbestos, sand, mica, quartz,
etc. and natural resins derived from trees, plants, insects and petroleum deposits including pitch, shellac, rosin or linseed oil [
9]. The fillers were applied as individual strands for wires and in combined forms as in nonwoven papers and woven cloths. The fact that in the early years of electrical industry, the focus was on renewable materials and trial experimentation to find systems which met minimum design criteria has to be take into account. Thus, operating temperatures, mechanical and electrical stresses were kept low to accommodate the limitations of these materials [
9].
During the First World War, mica splittings were combined with bitumen or asphalts, supported on both sides by a fine grade of cellulose paper. The so-called Kraft paper was formed by muscovite mica splittings bonded with natural shellac [
9]. Mica is an inorganic crystalline natural substance occurring commonly in bedrock. Chemically, mica is a complex silicate of aluminum with traces of other elements. The most employed varieties of mica are muscovite (K
2O·3Al
2O
3·6SiO
2·2H
2O) and phlogopite (K
2O·7MgO·Al
2O
3·6SiO
2·3H
2O). The structure of mica is complex and consists of silicon atoms layers (placed in the centers of some tetrahedrons formed by oxygen atoms) and aluminum, bounded together by oxygen atoms. Potassium atoms and hydroxyl groups (−OH) provide the connections between layers. This structure enables the flakes to be split into thin strips [
10]. The thermal endurance of mica is very high. Mica starts to lose its water at a temperature of 500 °C, although some types endure even above 1100 °C. These values are more adequate for electrical machines, since the highest permitted temperatures for their parts are usually above 200 °C at the maximum [
10]. Both dielectric strength and surface resistance of mica are high whilst the dielectric losses are low. Mica is characterized by a higher resistance to creepage currents and partial discharges in comparison to the best organic insulators. Taking into consideration all the properties described above, mica is almost a compulsory material in high-voltage electrical machines [
10].
Initially, mica was used as insulating material, in the way of small flakes and later for the manufacture of composite materials based on mica with natural (shellac, bitumen,
etc.) and synthetic (bakelite, epoxy, polyester,
etc.) resins used for the insulation systems of medium and high power electrical machines. Nowadays, mica is used mainly for mica paper and is composed of extremely small flakes of mica and produced in the same way as paper [
11]. The composites were prepared by using a vacuum, impregnation and pressurized process, call also VPI (vacuum pressure impregnation) process and they were employed in groundwall insulation of turbine generator stator coils (see
Figure 3) [
9].
Micafolium insulation systems were being manufactured in the same time as the asphaltic mica systems and at the beginning, they were applied for sheet wrapping of high-voltage coils and shaped insulating parts. Park [
12] synthesized epoxy resin/mica composites and estimated their electrical breakdown, in order to use the composite materials for manufacturing the insulation systems of high-voltage machines. In particular, mica particles with dimensions of 5–7 µm and different concentrations (20, 30 and 40 wt %) were applied. To reduce the composites viscosity, a plasticizer or a low molecular aliphatic epoxy was used [
12]. The electrical breakdown strength (measured with a sphere-to-sphere electrodes system) was increasing by the addition of mica filler and an optimum was achieved for a mica content of 20 wt % [
12]. The electrical breakdown strength of the system with an aliphatic epoxy was higher than of the system with a plasticizer [
12].
The beginning of synthetic products for insulations started in 1908 with phenol-formaldehyde resins, which were used in different electrical applications. Between the 1920s and 1940s, other synthetic products were introduced in the electrical engineering industry, including alkyd resins, aniline-formaldehyde, polyvinyl chloride (PVC), urea-formaldehyde, acrylic, polystyrene (PS) and nylon and melamine-formaldehyde, glass fibers,
etc., which lead to an explosion of new applications in electrical insulation. During the 1940s and the 1950s, the availability of numerous types of synthetic polymers and resins increased tremendously. Polyesters and polyethylenes (PEs) were introduced in 1942, fluorocarbons and silicones in 1943, epoxies in 1947 and polyurethane (PUR), polypropylene (PP) and polycarbonate (PC) in the 1950s [
9]. In the 1950s, the insulation engineers started to investigate the proliferation of new materials made from synthetic plastic films and, later, polymer fiber based nonwovens were employed for induction motors. Another major development was the replacement of solvent-borne natural and synthetic resins with solventless synthetic resins, such as polyesters, epoxy resins, silicones, acrylates, imides, blends of phenolics and other resins, which make their application more environmentally friendly and less likely to form voids within the insulation systems [
9]. Historically epoxy-based composites have been widely used in both, the power as well as the microelectronics industry due to their generally superior electrical, mechanical and thermal properties along with their economical and convenient processability. In power industry, epoxy resin is still the most popular applied material for stator groundwall insulation systems. Epoxy resins with micro-scaled inorganic fillers (quartz flour) are particularly applied for dry distribution transformers and for voltage and current transformers. Previous work has demonstrated that the properties of epoxy/inorganic filler composites are governed by the chemical nature, physical structure, shape and dispersion of the inorganic filler within the epoxy matrix [
1].
The composites industry began to mature in the 1970s, when improved plastic resins and reinforcing fibers (
i.e., Kevlar [
9]) were developed and since then it has been in a continuous evolution. The first sign of “new materials” was given in the 1990s by Toyota research group that developed the first polymer nanocomposites based on clay and nylon-6 with improved thermal and mechanical performances, for timing belt covers [
15].
Although the concept of “nanometric dielectrics” [
16] or simply “nanodielectrics” [
17] was introduced for the first time in 1994 by Lewis [
16], it did not became clear how electrical insulation would benefit by the potential property changes due to nano-sized filler inclusion. Numerous studies regarding electrical phenomena in nanodielectrics, their electrical and thermal properties and the fabrication of different devices and systems with novel properties obtained due to their nanometric structures were achieved [
16,
18]. In 1988, Johnston and Markovitz [
19] showed that some advantages could be obtained for mica-based systems used for the groundwall insulation of the form-wound generators. In 1999 Henk
et al. [
20] made similar investigations on SiO
2 nanoparticles which are improving the voltage endurance of polymer insulation when they are dispersed in polymers. Even so, the potential application of nanodielectrics in the area of high-voltage and power engineering did not draw too much attention from researchers and material engineers until the pioneer experimental work of Nelson and Fothergill
et al. [
21,
22]. A series of experimental work was performed in order to obtain a fundamental understanding of the way in which nanoparticles interact in a polymer matrix (especially, epoxy resin) to modify the dielectric properties.
Nanodielectrics analyzed by Fréchette
et al., in their work [
17], were used to explore nanometric dielectrics and dielectrics associated with nanotechnology and to produce molecularly tailored materials [
17]. Starting from these experimental results, intensive work and research has been invested on preparation, evaluation, and characterization of this new generation of materials, called nanodielectrics [
23]. The interest in researching nanodielectrics materials has been increased in the last 10 years and different working groups were formed all over the over the world, as CIGRE WG D1.24 who investigated the potential of polymer nanocomposites as electrical insulation [
24,
25,
26]. The first review articles on the nanodielectrics results was published in 2004 [
4,
18,
27]. The studies suggested that the unique properties of polymer nanocomposites used as dielectrics in high-voltage applications are due to the interfaces, which play a key role in determining dielectric performance. In addition, several publications indicated that self-assembly is a crucial process in the formulation of nanocomposites [
28,
29].
The “interfaces” between inorganic fillers and the organic polymers (see
Figure 4), such as epoxy resin systems, represent the key to understand the mechanisms and phenomena which control the properties of nanocomposites used as advanced dielectrics [
1]. Therefore, interfacial control is critical for achieving good coupling between the inorganic filler and the base polymer. The present goal of the research studies in this field is to optimize these benefits and to provide a better understanding of the physical and chemical structure of the interface region [
1]. In this case, there is a promise of new and enhanced properties, which are derived from the interactions between fillers and polymer matrices. Due to the complexity of nano-, meso- and micro-materials interactions, there is a large number of variables to tailor novel properties, which could be interesting for scientists and material engineers [
1].
In order to describe the scientific development of micro and nanocomposites electrical features desired in power engineering, the review article is focused on the electrical, mechanical and thermal properties of the insulating materials, especially cross-linked polyethylene (XLPE) and epoxy resins, unfilled and filled with different types of particles. Polymer micro/nanocomposites based on XLPE and epoxy resins are usually used as insulating systems for high-voltage applications, such as cables, electrical machines (especially power generators and motors), dry transformers, etc.
3. Nanocomposite Used in High-Voltage Applications
Among properties enhancement, perhaps the most important property of the composites is the change in electric strength that is found when the filler particles attain nanometric dimensions [
1]. Recent investigations have shown that the epoxy based nanocomposites [
31] demonstrate some advantages in both mechanical and dielectric properties compared to pure resin systems and epoxy resin composites with micro-fillers at low concentration (1–10 wt %) [
4,
32,
33]. It was found that over a wide range of frequency, the permittivity values of epoxy nanocomposites were reduced significantly compared to the base resin and epoxy micrometer-size filler at lower concentration. It was revealed that the reduction of the permittivity values strongly depends on filler type as well as filler size [
33,
34,
35]. On the other hand, the presence of nanofillers in epoxy resin affects the space charge accumulation in polymer matrix [
26,
36,
37,
38]. The accumulation of space charge has a huge influence on dielectric properties of insulation systems. Earlier researcher in this field showed that the accumulation of space charge could affect the internal electric field which can present important local intensifications and may lead to partial discharges, electrical treeing and to an early breakdown of the insulation [
31,
39,
40]. Consequently, it is very important to reduce space charge accumulation and its influence on dielectric behavior of insulating materials. Several works revealed that epoxy nanocomposites could accumulate less charge than neat epoxy resins [
26,
31]. It was also observed that epoxy nanocomposites provide faster charge dynamics, especially for negative charges [
41]. Thus, it is important to study the influence of matrices and the chemical structure of fillers on the space charge accumulation in order to avoid and/or reduce their influence on the lifetime of polymer composites used in electrical engineering.
Gröpper
et al. [
42] showed that with the utilization of specially treated spherical SiO
2 nanoparticles as part of the well-approved epoxy-mica stator winding insulation for large electrical machinery it is possible to improve significantly the properties of the high-voltage insulation system. Resistance to partial discharge erosion and electrical treeing is greatly increased and results in a longer lifetime (until electrical breakdown). In addition, the mechanical and thermal properties, which are important for stator windings of large turbine and hydro generators, showed increased values due to the application of nanocomposites [
42]. The mica-based impregnating resin includes an epoxy resin/anhydride mixture and nanoparticles filler, as SiO
2 and/or Al
2O
3 modified by a silanizing agent. Further, a method of producing the mica-based impregnating resin is provided, too [
43]. To improve the partial discharge resistance, Gröpper
et al. [
44] have used an insulating tape comprises a mica paper and a carrier material that are glued to each other by means of an adhesive The adhesive comprises at least one nanoparticulate filler material and the insulating tape wound about the conductor is impregnated with plastic resin [
44].
Nowadays, the topic of interest and technical importance in electrical power generators industry is thermal conductivity of the VPI insulation [
1]. In order to improve the performance of a generator or motor, the thermal conductivity of the insulation must be improved for increased thermal power dissipation capability of the stator slot [
1]. In order to obtain all these performances, the increase in thermal conductivity of insulation systems components is very important for the manufacturing process of electrical rotating machines. The improvements of thermal conductivity is generally achieved by the dispersion of high thermal conductive (HTC) particles, such as BN, SiC and Al
2O
3 within a conventional resin [
1]. However, for successful approaches in medium and high-voltage electrical insulation, it is necessary to obtain a clear understanding of the influence of particle size and shape distribution and also, the role of the interface between particles and neat resin system on the composite properties.
There are several studies on the improvements of thermal conductivity for high-voltage electrical insulation applications [
1]. Lee
et al. [
45] investigated various inorganic fillers including AlN, wollastonite, SiC whisker and BN. Particles with different shape and size were used alone or in combination to prepare thermally conductive polymer composites. With respect to AlN, a titanate-coupling agent was employed for the surface treatment of the inorganic fillers. The application of hybrid fillers resulted in an increase of composites thermal conductivity, which was attributed to the connectivity enhancement offered by structuring fillers. For the same content of filler, the use of larger and surface treated particles has lead to an enhanced thermal conductivity of composite materials. On the other hand, the surface treatment of filler allowed the production of composites with lower coefficient of thermal expansion.
Zweifel
et al. [
46] investigated the potential advantages and uses of submicron and micron-sized fillers (BN, SiC and diamond) for thermal management in reinforced composites applied in electrical insulation systems. Particularly, the effect of type, size, concentration and dimensions of the fillers on the properties (electrical, thermal, mechanical,
etc.) of reinforced epoxy laminates was determined in detail. It was also found that an improvement of thermal properties of the corresponding composite material could be accomplished whilst a minimal change in the dielectric properties was observed. Zhang
et al. [
1,
47] studied the overall thermal conductivity of epoxy resin composites with the addition of selected inorganic fillers (BN, Al
2O
3, SiO
2, diamond). These individual fillers have high thermal conductivity and their average size span the nano to micro dimensions. In order to obtain high thermal conductivity systems, these fillers were used singly or combined with other fillers in the epoxy resins. The results suggest that the size of BN (BN-Micro, BN-Meso and BN-Nano) is not necessary crucial to the thermal conductivity of the epoxy/hardener/filler composites at low to moderate concentrations. In terms of α-Al
2O
3, nano-diamond, nano β-SiC and nano amorphous silicon nitride (Si
3N
4) the results evidenced that the performance of these fillers is not so good as BN regarding the enhancement of the thermal conductivity of epoxy resin composites despite the fillers have comparable or in some cases higher conductivities than BN. Other studies [
37,
48] were performed on the thermal conductivity of different micro and nanocomposites containing selected inorganic fillers such as Al
2O
3, AlN and magnesium oxide (MgO). It was observed that the thermal conductivity values of the nanocomposites depend on several factors including interfacial layer structure, dimensions, and specific surface area.
Along with epoxy based thermosetting resins, thermoplastics are another class of polymer materials that are employed in electrical applications. In particular, PE was used as insulating material for medium-voltage and high-voltage energy cables in the early 1970s. After the occurring of massive cable failures due to quality problems and moisture diffusion, insulating systems of cables based on PE were replaced by XLPE. First modern XLPE cables were mainly employed for alternating current (AC) applications due to space charge accumulation purposes, but nowadays the cable technology is sophisticated enough that also high-voltage direct current (HVDC) cables can be in used in service. At the beginning of the HVDC, a general-purpose of cable development was the addition of inorganic filler into the base polymer [
49]. However, in the process of adapting the cable to higher voltage application, miniaturization, higher purification and higher distribution of the inorganic filler material were pursued.
First experiments on nanocomposite insulation materials with inorganic nanoparticles distributed uniformly into the polymer matrix were performed, in order to gain advanced properties, such as improved space charge accumulation, volume resistivity, thermal conductivity, direct current (DC) breakdown strength, and lifetime in service of the insulation system. Different types of nanofiller materials were used, such as layered silicate (LS), SiO
2, TiO
2, and Al
2O
3 [
50]. An example of the achieved enhancements was described by Lee
et al. [
51], where conventional AC-XLPE, DC-XLPE and nano-DC-XLPE cable insulation materials properties were compared. The volume resistivity and space charge characteristics were investigated. Between AC and DC breakdown strength a factor of more than two was demonstrated whilst the volume resistivity and the electric field loading capacity could be enhanced significantly due to the addition of nanofillers. Regarding AC XLPE cables, voltages up to 550 kV and a rated power up to 1.5 GVA were realized. The cross section of the copper conductor is up to 2500 mm² and a cable length can be 1000 m without joints. At DC XLPE cables, voltages up to 320 kV and a rated power of 1 GVA have been realized as well as cables with a length of several 100 km for subsea projects. For example an Extra High-Voltage (EHV) cable of ± 320 kV DC was applied for the interconnection between Spain and France. Underground and submarine cables have been in use since the early stages of electricity transmission [
52].
High-voltage alternating current (HVAC) underground transmission cables are usually employed in densely populated areas, in submarine connections and, in general, where the implementation of overhead lines is difficult or impossible. Due to the fact that cables are installed out of sight, underground in tunnels, or under water, they have a reduced impact on the territory and a limited occupation of the soil. Terminal ends are often the only visible evidence for the presence of underground cables. The development of the power cable technology is a rather slow process. Due to the efforts of the cable industry in the recent years, a solid dielectric transmission cable with XLPE insulation is now available.
It is expected that the adoption of this type of cable will give a strong input to the realization of HVAC and HVDC underground transmission lines in the near future. Therefore, the trend towards nanodielectric research comes from the emerging need of power engineers to design new electrical insulation systems that are capable of withstanding higher voltage levels, such as HVAC and HVDC applications [
53].
5. Preparation Methods
Preparation methods of microcomposites are relatively simple and these can be manufactured in large quantities [
54]. Taking into consideration different types of polymer and fibers from which polymer microcomposites can be made, the preparation methods represent a broad subject [
88]. The basic steps include impregnation of the fiber with the resin, forming of the structure, curing of thermosets or thermal processing of thermoplastic matrices and finishing [
88].
Depending on the process, these steps may occur separately or continuously. For example, the starting material for many polymer microcomposites is a prepreg process, where fiber tapes or cloths that have been preimpregnated with resin, are partially cured. Pultrusion, impregnation, forming and curing are done in a continuous process. Some other important manufacturing techniques are: sheet molding (fast flexible technique), injection molding (fast technique, high volume of fibers in thermoplastics matrices), resin transfer molding (fast technique, complex parts and good control of fiber orientation), prepreg tape lay-up (slow and laborious technique, reliable, expensive), pultrusion (continuous technique, constant cross-section parts), filament winding (moderate speed technique, complex geometries and hollow parts) and thermal forming (fast, easy, repair and joining technique, reinforced thermoplastics) [
88].
Over the last two decades, chemists and material scientists have shown significant interest and important development on the preparation methods of organic and/or inorganic nanocomposites [
89]. Nanocomposite materials can be obtained using similar microcomposites design and synthesis techniques, which make them interesting from the production point of view [
90]. The incorporation of nanoparticles into the polymer matrix can lead to novel high-performance compared to the unfilled or micro-filled polymers [
89].
In order to obtain these high-performances in thermal, mechanical or electrical properties, nanofillers should be homogeneously dispersed into the polymer matrix and should be physically or chemically bounded by the surrounding polymer [
89]. During the fabrication process, agglomerations of nanoparticles tend to appear due to the interfacial tension, accumulated on the nanofillers surface and due to the incompatibility of inorganic and organic components. It was recognized that the surface treatment of nanoparticles would bring a better dispersion in the polymer matrix [
89]. The correctly chosen curing dispersion agent will bind the organic polymers and inorganic particles, which are immiscible [
89]. Taking into consideration all these aspects, a certain number of techniques were developed in order to obtain improved nanocomposite materials.
Usually, the synthesis of polymers nanocomposites applies bottom-up or top-down methods [
90]. Bottom-up methods involves chemical processes (sol-gel process, chemical vapor deposition, spray pyrolysis,
etc.), where the precursors are used to construct and grow organized structures, from the nanometric level (see
Figure 17a). Top-down techniques top-down are using in the most cases physical methods (LSs dispersion in polymer,
etc.) and the bulk material is broken down into smaller pieces or patterning (see
Figure 17b) [
90].
Inorganic nanofillers can be dispersed into the polymer matrices via four different ways: (i)
intercalation method based on the exfoliation of LSs; (ii)
sol-gel process which starts, at room temperature, with a molecular precursor and then forms by hydrolysis and condensation reactions a metal oxide framework; (iii)
in situ formation of nanofillers and
in situ polymerization of monomers in the presence of fillers previously obtained and (iv
direct mixing of the polymer and the nanofillers, either as discrete phases (melt mixing), or in solution (solution mixing) [
91]. In the following section, well-established preparation techniques to obtain nanocomposites materials are described.
5.1. Intercalation Method
Intercalation method is a typical top-down method based on the decreasing size of filler to the nanometric scale [
92]. This method can be achieved by three ways: direct intercalation of polymer chains from solution, polymer melt intercalation and intercalation of monomers followed by
in situ polymerization [
73].
5.1.1. Direct Intercalation of Polymer Chains from Solution
Direct intercalation of polymer chains from solution is the procedure of dispersing layered fillers (
i.e., silicates) into a solvent in which the polymer is soluble and is known as exfoliation or adsorption process. When the solvent is eliminated from the polymer-clay complex through evaporation, the silicates sandwich the polymer to form a multi-layered structure (see
Figure 18) [
91,
93].
5.1.2. Polymer Melt Intercalation
Polymer melt intercalation involves the mixing of the layered filler (
i.e., silicate) with the polymer in the molten state. If the surfaces of the silicate layers are sufficiently compatible with the polymer chains, the polymer can be inserted into the interlayer space, without any solvent, forming intercalated or exfoliated nanocomposites (see
Figure 19) [
91,
93].
5.1.3. Intercalation of Monomers Followed by In Situ Polymerization
Intercalation of monomers followed by
in situ polymerization is the procedure that uses monomers with initiators, which are allowed to polymerize in the presence of the layered filler (one prominent example is clay). During the polymer chains growing, the clay layers are separated and the polymer chains enter the interlayer space, forming polymer/clay nanocomposites (see
Figure 20) [
91,
93].
5.2. Sol-Gel Method
Sol-gel method is a typical bottom-up method and is associated with two reactions steps, namely sol and gel. Sol represents a colloidal suspension of solid particles in a liquid phase and gel is the interconnected network formed between phases [
90]. This process consists of two main reactions: hydrolysis of the metal alkoxides (Equation (1)) and condensation of the hydrolyzed intermediates (Equations (2) and (2′)) [
90]:
| • | Hydrolysis: | M(OR)4 + H2O → HO − M(OR)3 + ROH, | (1) |
| • | Condensation: | (OR)3M − OH + OH − M(OR)3 → (OR)3M − O − M(OR)3 + H2O, | (2) |
| (OR)3M − OH + RO − M(OR)3 → (OR)3M − O − M(OR)3 + ROH. | (2’) |
Both are multi-steps processes and occur sequentially [
90]. This method can be used in order to obtain inorganic metal oxides from organic metal alkoxides, esters,
etc. and transparent films of organic-inorganic hybrid trough co-hydrolysis and polycondensation of alkyltrimethoxysilane-tetramethoxysilane mixtures [
91]. The sol-gel procedure is a useful way to produce inorganic-organic hybrids [
91].
5.3. In Situ Polymerization
Formation of nanoparticles via
in situ polymerization is a method of synthetisation of nanoparticles via polymerization of colloidal sols containing metal ions and monomers. The size of the nanoparticles depends on the experimental conditions (temperature, thermal coagulation,
etc.) and colloidal sols properties [
91]. This method is used to prepare nanocomposites based on thermosetting polymers and nanoparticles, which are dispersed within monomer (or monomer solution) and the mixtures-polymerized by standard methods [
92].
5.4. Direct Mixing of Nanoparticles with the Polymer
Direct mixing of nanoparticles with the polymer is a typical top-down approach and is the simplest method to obtain nanocomposites. This method involves, either direct mechanical mixing of the polymer with nanofillers (in the absence of any solvent), above the softening point of the polymer (termed melt-compounding method) or mixing the polymer and fillers as a solution (termed solution-mixing method) [
23,
92]. Due to the surface treatment of the nanoparticles and the development of mixing equipment, homogenous samples can be obtained through this method (see
Figure 21).
Polymer nanocomposites represent very promising materials for applications as dielectrics and electrical insulations, from the viewpoint of their excellent properties [
33]. Nevertheless, in order to move these materials from the lab to an industrial production, it is necessary to develop suitable methods towards the large-scale manufacturing of polymer nanocomposites. This will help to create reproducible and reliable data that are needed for expanding development of these advanced materials in the high-voltage applications.
6. Properties of (Nano)Composites
It is a challenge to design and optimize proper electrical insulation systems of electrical equipment, in the conditions when energy demands, voltage level and temperature values are increasing and on the other hand, the electrical components and equipment sizes are becoming smaller and more compact compared to the traditional ones, increasing the demands on the insulation systems. Thus, current research aims at systems that are expected to have better endurance and reliability compared to their conventional counterparts [
94].
In the insulation engineering, polymer composites are the second generation of what is called filled resins and consists of polymers filled with a large amount (the order of 50 wt %) of inorganic microfillers [
33]. They are traditionally designed to be used as structural materials [
95]. Due to the rapid growth of the electrical engineering industry, composite materials were involved more and more in electrical applications, as structural and electronic composites. However, there is a vast difference in their property requirements: while structural composites emphasis high strength and high modulus, electronic composites emphasis high thermal conductivity and low thermal expansion. Considering all these aspects, the industry is continuously looking for better alternative materials, which come at affordable prices to maintain the requisite price margin, besides considering the depleting natural resources of conventional materials [
95].
Composite materials offers some advantages in terms of light-weight, resistance, ease of maintenance and better environmental protections, but also poses some disadvantages in terms of processing costs and the choice of materials. Composite materials offers the opportunity to provide the suitable product with required performance for the final application and thereby optimizing the price-performance ratio [
95]. In high-voltage applications, solid electrical insulation materials, termed dielectrics, in the early days of electrical power applications were made of natural materials and ceramic materials [
94,
96]. There were two areas where few advances had been observed for cellulose-based paper, which is still the main insulation system in power transformers and sub-water cables applications and outdoor electric insulation materials for high-voltage lines and bushing [
94]. However, polymer composites with better performance as well as lower weight than the conventional polymers were developed in the last several decades. Later, the use of plastics and epoxy resins in electrical engineering applications, allowed the manufacturing of insulation systems with controlled properties. In general, plastics are easier to be shape and process compared to glass and ceramics, but do not possess sufficient mechanical strength. Light-weight designs of polymer composites (containing inorganic fillers) with enhanced material properties were pursued in the last several decades. Epoxies offered new possibilities in developing electrical insulation, particularly to reach a more compact design in electrical power equipment [
97]. Fillers have been introduced to improve the mechanical and other properties (electrical, thermal) of polymers [
94]. Due to their good adaptability and simple manufacturing technology, mineral filled epoxies are the preferred materials for indoor and outdoor insulation. The disadvantage of these materials is long-term aging [
97]. Nowadays, polymeric epoxy resins, hardeners and industrially available fillers are of good quality, but their internal interfaces, which lead to aging, cannot be avoided [
97].
Newly born emerging advanced materials, called polymer nanocomposites are defined as polymers filled with a small amount of nanofillers (few wt % in content and 1 to 100 nm in size), which should be homogeneously dispersed in the polymer matrix and poses a tremendously large surface as compared to microfillers [
33]. Therefore, in order to understand the characteristics that emerge due to nanostructuration, it is indispensable to investigate the interaction between nanofillers and polymer matrix [
33]. These materials possess a huge potential in applications, such as building, transportation, food packaging, electrical and electronics engineering, industries,
etc. and could be used as high functional materials (coating and barrier-functional materials, flame-retardant and foamed materials,
etc.) [
33].
First experimental results on the electrical properties of polymer nanocomposites were reported by Nelson and Fothergill in 2002 [
98]. Their investigations on epoxy systems filled with TiO
2 micro/nanoparticles concluded that: (i) nanofilled epoxy exhibits a flat loss tangent response at low frequency compared to microcomposites; (ii) nanofilled epoxy exhibits mitigated space charge behavior compared to microcomposites and (iii) the decay of charge for nanofilled epoxy is rapid compared with microfilled epoxy [
53,
98]. Whereas conventional microfilled materials reduce dielectric strength due to bulk charge accumulation, they reported [
22] that the nanofilled epoxy exhibited a higher DC breakdown strength compared to microcomposites, but the values were close to the base polymer. Subsequent experimental findings on the use of nanocomposites in electrical insulation were overwhelming positive [
53].
Various nanocomposite systems, such as PE/TiO
2, PP/LS, EVA/LS, epoxy/TiO
2, epoxy/Al
2O
3, epoxy/ZnO, were investigated and it was reported that space charge formation was mitigated upon nanostructuration and showed reduced charge accumulation at high fields when compared with the base polymer [
53]. Meanwhile, the breakdown performance of various nanocomposite systems was found to be enhanced compared to equivalent microcomposites [
53]. In addition, nanocomposites were generally more resistive to partial discharges compared to microcomposites and base polymers. Because microfillers are much less closely packed as nanofillers, erosion of the matrix around the nanofillers was assumed to proceed as in the unfilled polymer. Similar mechanisms were also suggested for tree-retardant effect found in nanocomposites [
53]. Nanocomposites were found to exhibit lower permittivity and loss tangent compared to microcomposites and sometimes to unfilled polymer [
53]. Mechanical and thermal properties, such as tensile strength, bending strength, elastic modulus, weight deflection temperature and heat decomposition temperature were found to be improved for various types of nanocomposites [
33]. Long-term characteristics such as creep, stress relaxation and fatigue were obtained for different nanocomposites systems. Furthermore, some types of nanocomposites exhibit characteristics that are particularly important for selected target applications, such as paint performance, high biodegradability, gas barrier effect, flame retardancy, foaming ability,
etc. [
33].
Nanodielectrics are expected to possess unique dielectric properties due to the interfacial region between nanofillers and polymer, rather than a simple binary combination of properties, such as in conventional microcomposites. This distinct property lead to the idea of a new class of dielectric materials with combined electrical, mechanical and thermal properties and can be an excellent class of material as far as AC and DC applications are concerned [
53]. Nevertheless, many promising experimental results have been reported concerning the use of nanodielectrics as electrical insulation materials in high-voltage applications.
6.1. Electrical Properties
6.1.1. Electrical Conductivity
Imai
et al. [
99] investigated the electrical properties of micro/nanocomposites based on epoxy resin and LS/silica fillers.
Figure 22a shows the relationship between absorption current and time.
It was found that the damping curve of the nano- and micro- filler mixture composite (NMMC) with 1.5 vol % organically modified layered silicate (OMLS) is almost the same as that of the conventionally filled epoxy and a very small influence of modifier ions of LSs is observed on these results. At room temperature there was no significant difference between the results for conventional filled epoxy resin and the NMMC/1.5 vol % OMLS on volume resistivity values, but increasing the temperature, resistivity decrease slightly in the case of nanocomposites [
99].
Castellon
et al. [
26] observed that the conduction currents are significantly influenced by the SiO
2 concentration compared to unfilled epoxy resin. The greater the concentrations of micro- and nanoparticles in the base polymer are, the greater the conduction currents are obtained [
26]. All the obtained results were explained through the Schottky model approach.
Singha
et al. [
32] analyzed the variations of DC volume resistivity with respect to filler concentrations (TiO
2, Al
2O
3 and ZnO) in epoxy nanocomposites. Even the introduction in the systems of free ions by adding inorganic particles, which can increase the DC conductivity of composites, their influence was not found to be significant in this study [
32]. Patel
et al. [
100] performed similar studies on nanocomposites based on epoxy resin and Al
2O
3 nanofillers.
Lutz
et al. [
101] analyzed the influence of water absorption on volume resistivity of epoxy resin insulators. They proposed a model (based on Fickian diffusion) to simulate the dynamic process of volume resistivity decrease during humidity storage.
Roy
et al. [
102] studied the time dependent conduction characteristics of micro/nanocomposites based on XLPE and 5 wt % SiO
2, unfunctionalized and functionalized with aminosilane, hexamethyldisilazane (HMDS) and triethoxyvinylsilane, respectively. Samples with a thickness of 100–150 µm were prepared and an electric field intensity of 2 kV/mm was applied. As it can be observed from
Figure 23, the curves of absorption currents in time for functionalized and untreated SiO
2 nanocomposites have the same slope, but the currents values are lower for functionalized materials. It was observed that the absorption currents are consistent with the loss tangent behavior in the low frequency region, which strongly suggests that the conductivity could be associated with the interfacial region and/or hydration effects, which are alerted by the enhanced coupling associated with the functionalized materials [
102]. Similar results were obtained in other studies [
103,
104,
105,
106].
Lau
et al. [
107] investigated the absorption currents behavior of PE nancocomposites unfilled and filled with 2, 5 and 10 wt % nanoSiO
2, untreated and treated with trimethoxy(propyl)silane coupling agent (C3-treated). The results indicated that the presence of nanoSiO
2 fillers influenced the values of absorption current. Thus, while the unfilled polymer showed a decrease in time of the absorption currents (in a conventional manner), all the analyzed nanocomposites systems reveal an initial decrease followed by a period in which the current values increase by rising the time of DC field application. It was observed that the time-current characteristics of all analyzed nanocomposites were different from the unfilled polymer and the rate of nanocomposites current values decrease was significantly greater compared to unfilled PE [
107]. Using these experimental values, the charge carrier mobility was estimated for unfilled and nanoSiO
2 filled PE. The results on absorption currents measurements can be used to gain understanding of the relationship between space charge accumulation and movement [
107].
6.1.2. Micro/Nanocomposites with Controlled Electrical Conductivity
In many high-voltage and medium-voltage applications such as cables accessories, generator or motor end windings or bushing, many problems with the electrical field stress concentrations can be noticed [
108]. In order to avoid breakdown or flashover in these situations, it is necessary to control the electrical field throughout materials with tailored conductivity and non-linear conductivity. These termed field grading materials will reduce the local surface stress in the way which will not exceed the breakdown strength in any location. Even in the past time the field grading materials were used only in AC terminations for medium-voltage applications, nowadays they are involved in both medium and high-voltage applications, under AC and DC conditions because voltage requirements steadily increased and the size of equipment decreased [
108].
The main components of a cable are conductor, insulation and grounded shield. In operation, the rated voltage (the potential difference between the conductor and the shield) occurs across the insulation system and the radial stress in this region is non-linear [
108]. During the operation process, problems can occur in joints or at the end of the cable due to the fact that the shield has to be removed at cable terminations and the concentrated field in the insulation has to be spread out in a controlled manner in this discontinuity. If this action is not taken into consideration, the electric field stresses may cause flashover problems or breakdown [
108]. One solution to solve this problem is called geometrical stress control and it refers to the shield bending and increasing the thickness of the insulation. The major drawback of this solution is the size and cost of the components, particularly in high-voltage applications. Another approach refers to the field grading material, which means that the material possess the ability to distribute the field by itself. Usually, the electrical properties of these materials must be field dependent. In terms of HVAC cables, the field grading materials provide field grading in two ways, either by non-linear resistivity or by capacitive field grading. In latter, the relative permittivity becomes high enough to redistribute the field. For HVDC applications, field grading can be controlled trough a material with field dependent resistivity, which means that the material should become conductive at high fields and stay insulating at low fields [
108,
109]. In many high-voltage applications, conducting layers are used to obtain equipotential surfaces. Thus, with respect to medium and high-voltage cables, semiconducting layers for levelling and attenuation of high field local values, respectively for reduction of partial discharges phenomena are used. Conducting layers of large radius are commonly tied to the potential of a high-voltage termination to afford some protection from unwanted corona discharges,
etc. Furthermore, the end windings of high-voltage machines are covered with a semiconducting layer to reduce the partial discharges and leakage [
108,
110]. As these layers do not have to carry currents, their resistivity does not need to be similar to a metal in order to be effective. For example, a graphite ink is used for rendering cellulose layers conductive as a substitute for metallic foils in the internal stress grading of high-voltage bushing [
108]. Similar, semiconducting layers, arranged on both sides of the high-voltage or medium-voltage cable insulation, are manufactured of PE and carbon black or SiC [
111,
112]. The polymers that are employed for semiconductor layers (acrylates, acetates, PEs,
etc.) have to exhibit a high thermal stability (up to 250–300 °C during the crosslinking process) to maintain the mechanical properties of the screen and the electrical nature of the inter carbon particle gap [
113]. In addition, the polymer materials should comprise a reduced risk for scorching and lumping [
112]. Account has to be also taken into the fact that protrusions of the semiconductive layer can push into the insulation and enhance the local electrical field (accelerating electrical aging). The smoothness of a semiconductive material is an important parameter to measure the material consistency and quality. Carbon black has a big influence on the surface smoothness (dispersion of the particles) and on the cleanliness of the semiconductive layers (ions and grit particles) [
112]. Semiconductor layers resistivity depends on the polymer matrix nature (recently PE), the concentration of carbon black, process parameters for achieving technological semiconductor layers, temperature,
etc. [
114,
115].
In other applications, such as shielding for electronic devices and electrostatic dissipation (ESD), encapsulating, electromagnetic and radio frequency interference (EMI/RFI), thin films coating, packing of electronic circuits,
etc., polymeric composite materials with high electrical conductivity are used. The matrixes of these composites are usually based on PE, PVC, PC, PS, epoxy resins, nylon 6.6, acrilonitril-butadien-stiren (ABS),
etc. As fillers, AlN, carbon and graphite, aluminum, copper, steel or silver particles, polyacrylonitrile (PAN), barium titanate (BaTiO
3),
etc., are applied. [
116,
117].
Another alternative to impart some conductivity to conventional polymers can be offered by CNTs and nanofibers. As their conductivities can have values in a broad range (from semiconducting to conducting materials), CNTs (single walled carbon nanotubes (SWCNTs) or multi-walled carbon nanotubes (MWCNTs)) can be used in many applications [
108]. In literature, several studies on this subject [
118,
119,
120] have been published and one early observation was that the electrical conductivities were not as high as expected given the conductivity of the nanotubes. One example is the study of Cravanzola
et al. [
121] on a piezoresistive sensor device, which has been made by integrating two piezoresistive fibers into two sandwiched PP panels. The fibers were prepared by extrusion from piezoresistive polymeric composites manufactured by melt mixing PP with expanded graphite (EG) and/or MWCNTs (1–2 wt %). It was shown that due to the applied loads mechanical deformation remarkably affected the resistivity of the materials. Haznedar
et al. [
122] investigated composites based on graphite nanoplatelets (GNPs) and/or (MWCNTs)/LDPE and showed the synergistic role of CNTs (1D) and GNPs (2D) in improving the conductive properties of the materials.
Multiple studies regarding the properties of composites demonstrated that percolation phenomenon is very important in controlling electrical properties of these materials, considered as disordered systems [
108]. Regarding polymer composites with conducting or semiconducting fillers, there is a critical volume/weight concentration of particles in the matrix, called percolation threshold, above which the electrical or thermal conductivity increases suddenly, as a result of a continuous conductive path formation [
108].
In classical percolation, theory applied to composites a physical connection between the filler particles and the conductivity (σ) near the percolation threshold can be described by the power law:
where φ is the volume fraction of filler, φ
c is the percolation threshold and
t is a power law constant that depends on the geometry of the system [
108,
116,
122]. φ
c is also a function of the filler geometry, dispersion and the type of connectivity between particles (
i.e., tunneling
versus Schottky barrier) [
62]. Typical values for three dimensional systems are
t = 2.0 and φ
c = 0.17 for spherical particles [
108].
The model requires some modifications due to the filler geometry, dispersion and conduction in nanoparticles filled polymers. In the case of polymers nanocomposites, there can be a very thin polymer layer completely encasing the nanofillers that prevents direct particle-particle contact. In this case, electrical percolation occurs when particles are close enough for tunneling conduction through the interstitial layer (
i.e., carbon black filler polymers) [
108]. In the case of spherical nanofillers that are not perfectly dispersed in the polymer matrix, there are resulting fractally and not necessarily spherical agglomerates during synthesis and processing. This situation will shift the percolation threshold because the aspect ratio of nanofillers is greater than one or they effectively fill a larger volume because of the fractal shape. Thus, φ
c could be predicted by using the concept of an excluded volume, which is the volume around the filler that cannot be occupied by the center of another object [
108]. Due to the fact that CNTs tend to bundle, their shape remaining cylindrical, a hard core model is the most appropriate to estimate the percolation threshold.
Thus, nano/microfillers offer the ability to tailor and optimize the electrical properties of polymers, but their commercial use meets challenges such as a poor dispersion performance during large scale processing and understanding the electrical and thermal conduction mechanisms.
6.1.3. Relative Permittivity and Loss Factor
Many research studies were performed on the relative permittivity and loss factor of micro/nanocomposites materials [
123]. If several tens weight percentage of inorganic microfillers are introduced in polymers, usually the relative permittivity of the composite increases [
33]. This is because fillers have a higher permittivity by nature compared to the base polymers and they cause Maxwell-Wagner interfacial polarization, which provide information about charge trapping associated with internal surfaces and relaxation processes associated with dipole reorientation [
124]. This type of polarization will increase the values of loss tangent, too [
33]. Increased values for microcomposites are usually explained in the terms of the Lichtenecker-Rother logarithmic law of mixing [
33]. Conversely, the addition of nanoparticles causes major changes in the dielectric response and their permittivities were found to decrease in many cases, such as
Figure 24a,b from Nelson
et al. [
22] experimental studies.
At high frequencies, the microcomposites showed a higher relative permittivity, probably, due to the higher permittivity of fillers incorporated in the base polymer (ε
r(TiO
2) ≈ 99) [
22]. For example at 1 kHz and 393 K, the measured relative permittivities were 9.99 for the base resin, 13.8 for microcomposites and 8.49 for nanocomposites, which is significantly less than the base polymer. This result suggests that the interaction zone, which surrounds the nanoparticles, has a profound effect on the dielectric behavior of nanocomposite and gives rise to limited cooperative movements of dipolar reorientation within them [
22,
124]. This behavior could be also due to the movement restriction of epoxy molecules end-chains of side-chains by the presence of nanoparticles [
22].
In the mid-range of frequency between 0.1 and 100 Hz, the base resin and the nanocomposites show the same behavior with a small dielectric relaxation, probably due to the bound water [
22,
124]. The real permittivity of the microcomposite shows a significant increase with decreasing frequency associated with Maxwell-Wagner polarization [
22].
At low frequencies, the nanocomposite materials show a different behavior. The slope of the real part changes from −2 to −1 in these Bode plots and the loss tangent is flat and independent of frequency and this can be explained by the “low-frequency dispersion” (LFD) proposed by Jonscher [
125] or what Dissado and Hill [
126] refer to as “quasi-DC” (QDC) behavior. This behavior is observed when charge carriers have some limited freedom of movement within the material and they may follow tortuous paths under the influence of the electric field, that do not allow complete transport through the material [
22]. Since nanoparticles could cause morphological changes to the epoxy resin during the crosslinking process, a “dielectric interaction” layer surrounding these particles could be formed. Lewis [
79] has considered the electrical (polarization and conduction) phenomena in the zones that are surrounding the nanoparticles and the formation of a charged layer (Stern layer) on the surface of the particles, encircled by a diffuse charged layer (Gouy-Champan layer) [
76,
127]. The Gouy-Champan layer is highly conductive compared to the polymer base and charge movement through it would be relative facile [
22]. If these layers overlap between several nearby nanoparticles, charge movement over limited distances will be facilitated and the path-lengths of such carriers would form a distribution [
22]. Dissado and Hill [
126] modeled this field-enhanced percolation in the terms of fractal circuits. Therefore, the reduction of the fillers concentration from 10 to 1 wt % did not bring fundamental changes, but nanocomposite materials showed a low frequency response, more typical of the base polymer and microcomposites, suggesting that behavior changing requires filler concentrations higher than a few percent [
22].
Singha
et al. [
128] analyzed the dielectric behavior of epoxy nanocomposites with single nanofillers of Al
2O
3 and TiO
2 at low filler concentrations (0.1/0.5/1/5 wt %) over a frequency range of 1 MHz–1 GHz. The experimental results obtained on these nanocomposites samples showed very different dielectric characteristics compared to those for microcomposites. In the case of polymer microcomposites the permittivity was increasing by rising the filler concentration, but for a certain concentration of nanofillers into the polymer and depending on their permittivity value, the equivalent permittivity of the epoxy nanocomposite is smaller compared to the one of the base resin, for all the measured frequencies. These results suggest that there is a strong dependence of the filler permittivity and concentration on the equivalent permittivity of the nanocomposite material for all the analyzed frequencies. The loss tangent behavior was not affected by the filler concentrations, but in the case of epoxy/Al
2O
3 nanocomposites, loss tangent values were found to be marginally lower at all concentrations when compared to the values for unfilled polymer [
128].
Kochetov
et al. [
129] realize a study on the dielectric spectroscopy of epoxy-based nanocomposites filled with different types of particles, such as Al
2O
3, AlN, MgO, SiO
2 and BN. The nanoparticles surfaces were modified with a silane-coupling agent, in order to realize the compatibility between the inorganic and organic components and to obtain a better dispersion of the nanofillers into the polymer matrix. The relative permittivity of nanocomposites shows an unusual behavior. It was observed that the introduction of a low percentage (below 5 wt %) of high permittivity filler results in a decrease of the bulk polymer permittivity. This can be explained by the presence of the interface layer of surface modified particles, which plays a more important role than the nature of the particles and also by the immobilization caused by the surface treatment of the nanoparticles [
129]. It was observed that dielectric losses in the system do not change significantly with the addition of nanofillers up to 5 wt. % [
129]. Similar studies on dielectric behavior of micro/nanocomposites systems based on epoxy resin and different types and concentrations of filler were performed by Mackersie
et al. [
123], Fothergill
et al. [
124,
130], Tanaka
et al. [
4,
33], Singha
et al. [
32,
128], Smith
et al. [
104], Plesa
et al. [
131], Kozako
et al. [
132], Castellon
et al. [
26], Heid
et al. [
133], Mo
et al. [
134],
etc.Roy
et al. [
102,
135] analyzed the dielectric behavior of different systems based on XLPE/SiO
2 functionalized with amino-silane, hexamethyl-disilazane (HMDS) and triethoxyvinylsilane agents. The dielectric spectroscopy analyses (see
Figure 25a,b) provide considerable insight into the nature of the structure, which contributes to the polarization and loss. The results showed that the untreated nanocomposites exhibit a relative permittivity lower than the unfilled polymer, which suggests the presence of an interfacial zone around the particles with a smaller permittivity compared to the bulk polymer [
102]. A marked dispersion was observed in the case of unfilled XLPE at the frequency of 1 Hz, but was eliminated for the cases of functionalized nanocomposites. With respect to the loss tangent, it is very significant that a QDC conduction region appears in the case of untreated nanoparticles, which suggests the presence of a conductive interface in their case [
102]. Low frequency dispersion can be observed in microcomposites which is absent in all nanocomposites. This behavior likely results from Maxwell-Wagner polarization, which is mitigated for the nanodielectrics [
102]. Similar studies on dielectric behavior of micro/nanocomposites systems based on polyethylene and different types and concentrations of filler were performed by Ciuprina
et al. [
83,
136,
137,
138], Tanaka
et al. [
24], Panaitescu
et al. [
139], Plesa [
84], Hui
et al. [
140], Lau
et al. [
53],
etc.In other systems such as PI/SiO
2 materials [
141], loss tangent tends to decrease for pure PI, PI/SiO
2 microcomposites and PI/SiO
2 nanocomposites, at low frequency region, up to 200 Hz. Regarding PI/SiO
2 microcomposites, a peak appears in the middle frequency region (about 1 kHz) due to the Maxwell-Wagner interfacial polarization and is more much reduced in terms of PI/SiO
2 nanocomposites. This peak can be caused by the mitigation of the field around fillers due to their size differences [
4,
141]. Room temperature vulcanized (RTV) silicone rubber/LS nanocomposites exhibit a slight increase of loss tangent and a slight decrease of relative permittivity at the industrial frequency [
4]. Evaluation of the dielectric behavior seems to be more complicated when comparing neat polymer, microcomposites and nanocomposites materials [
4]. The most important aspect to be clarified is whether or not relative permittivity and loss tangent are reduced by nanomization at the industrial frequencies. In literature, some reported data indicate a certain reduction whilst other data did not, which creates confusions [
4]. These results can depend on many factors, such as how inorganic and organic components are compatibilized, the dispersion of the fillers in the base polymer, fillers agglomerations, humidity, temperature,
etc. 6.1.4. Partial Discharges and Erosion Resistance
The resistance of insulating materials to partial discharges (PD) is a very important property for high-voltage applications, such as the stator end windings of rotating machines or wires of randomly wound motors or HVDC XLPE cables, where PD will gradually erode the insulating materials and cause breakdown [
25]. PD resistance of polymer insulation can be evaluated by using several configurations of electrode systems such as International Electrotechnical Commission (IEC) electrode and rod-to-plane electrode systems. The former gives surface roughness, while the latter allows evaluation of erosion depth and can be used for micro/nanocomposites materials characterization [
142].
Krivda
et al. [
25] evaluated the resistance to erosion due to PD of the epoxy micro/nanocomposites mixtures, using a rod-to-plane electrode system (see
Figure 26a,b). From the results showed in
Figure 26a, it became clear that a combination of micro and nano-sized fillers in epoxy composites provided better protection against PD erosion than the base resin, composites containing either solely microfillers or solely nanofillers [
25]. Due to the fact that results depend on the test conditions (
Figure 26a) shows the results obtained at 4 kV/600 Hz and
Figure 26b shows the results at 10 kV/250 Hz) it is impossible to identify the best combination of micro and nanofillers in the polymer matrix. Nevertheless, from the obtained results is clear that micro+nanocomposites had smaller erosion depths and longer times to failure compared to unfilled resin and micro/nanocomposite materials [
25]. When the material is only filled with microparticles, there is a relatively large volume of neat epoxy that is exposed to PD and degrades much faster compared to inorganic fillers. Inorganic particles can easily withstand temperatures above 1000 K, whereas epoxy thermally decomposes at 600 K and gives rise to large erosion depths in microcomposite materials. When nanoparticles are added into the mixture, they are filling the space between microparticles, creating additional barriers to PD. In addition, when the epoxy resin layer from the top is degraded, nanoparticles are released, but remaining on the surface, provide an additional PD protection of the composite [
25].
Many experiments were done to investigate PD resistance of epoxy micro/nanocomposite materials. Most of them demonstrated that the addition of nanoparticles could improve this electrical property, despite of using the epoxy without fillers [
143].
Iizuka
et al. [
144] analyzed two types of epoxy/ SiO
2 nanocomposites, such as Aerosil (prepared by dispersing commercially available nanoSiO
2, termed Aerosil, in epoxy resin and by curing the whole mixture) and Nanopox (prepared by directly curing available mixture of epoxy and nanoSiO
2, termed Nanopox) in order to clarify the effect of nanofiller dispersion and coupling agents on the electric filed endurance. It was found that partial discharges resistance was improved only by adding nanofillers and coupling agents [
144].
Tanaka
et al. [
145] investigated PD endurance of epoxy and 1, 2, 3, 4, and 5 wt % SiC nanocomposites in comparison with that of epoxy/SiO
2 nanocomposites. It was remarked that epoxy resins could be improved in their PD erosion performance by replacing SiO
2 with SiC nano fillers, while the erosion profile was narrow in epoxy/SiO
2 nanocomposite. It can be concluded that SiO
2 fillers remain more stuck on the surface after exposure to PD than SiC fillers [
145].
Preetha
et al. [
146] analyzed PD characteristics of epoxy nanocomposites samples with a good dispersion of Al
2O
3 particles (0.1, 1, 5, 10 and 15 wt %) into the polymer matrix. PD experiments were conducted at 10 kV for different durations using IEC type electrodes. The results were compared to unfilled epoxy and epoxy microcomposites. It was observed that even for a concentration of 0.1 wt % Al
2O
3 nanoparticles, the PD resistance of nanocomposite improved considerably. It was observed that the inter-particle distance has a significant effect on the discharge resistance to degradation and the improvements are attributed to the interactions between nanoparticles and the epoxy chains [
146].
Kozako
et al. [
147,
148] investigated PD for four types of epoxy nanocomposites with nanoTiO
2, two different sizes of SiO
2 and LS, unfilled epoxy and filled with microSiO
2 (see
Figure 27a,b).
Li
et al. [
149,
150] analyzed PD erosion resistance of different kinds of insulation samples, such as neat epoxy, epoxy/5 wt % nanoAl
2O
3 composite, epoxy/60 wt % microAl
2O
3 composite, and combined epoxy/2 wt % nano- with 60 wt % micro-Al
2O
3 composite, using a rod-to-plane electrode system. It was observed that nanocomposites take the longest breakdown time (307 min) compared to neat epoxy (186 min), microcomposite (94 min), and micro/nanocomposite (275 min) [
143]. From all these experimental results, it was concluded that by adding a low concentration of nanofillers into epoxy resin matrix, PD are significantly improved [
143]. This is most likely due to the strong bonding between nanoparticles and epoxy resin chains at the interface zone, which causes a speed reduction of the material local degradation [
32]. Addition of microfillers does not make any significant contribution to PD resistance compared to nanofillers, but they can increase the thermal conductivity, which is an advantage [
149]. Similar results were obtained by Henk
et al. [
20], Li
et al. [
151], and Zhang
et al. [
152], Imai
et al. [
153].
The available results and data for XLPE polymer with nanofiller are limited in literature. Tanaka
et al. [
24] reported evidence of the enhanced of XLPE nanocomposite PD resistance values (see
Figure 28a,b). The analyzed samples were based on standard commercial XLPE, in order to have more impact on improving the current insulation used for power-extruded cables.
Two methods of PD resistance evaluation were conducted in this investigation: the first by using a rod-to-plane electrode and the second similar to the IEC electrodes system. The first method showed that partial discharges endurance was significantly improved in the case of XLPE with 5 wt % SiO
2 nanofillers (chemically surface functionalized) compared to unfilled XLPE (see
Figure 28a,b) [
24].
On the other hand, with the second method, which uses an electrode similar to the IEC electrode system to test the three heat-treated samples (unfilled, filled nanoSiO
2 without and with surface-treated filler), no apparent improvement was observed by the addition of nanofillers (see
Figure 29a,b). It was generally speculated that this is due to the effect of the filler treatment of the samples, but the test method and data analysis should be further investigated [
24,
143].
Experimental studies were also performed on other type of systems. Ansorge
et al. [
154] analyzed the influence of various fillers (alumina trihydrate (ATH), Al
2O
3 and SiO
2 with different sizes (from 0.3 to 18 μm)) and their surface modifications (by the material supplier and
in situ during compounding) on the erosion resistance of high temperature vulcanized (HTV) silicone rubber (SR) composites. It was found that with respect to ATH particles, larger particles showed slightly better results than smaller ones, due to the formation of boehmite [AlO(OH)], which causes a release of the bound water if the temperature exceeds certain values. The particles modifications with vinyltrimethoxysilane (VTMS) and methyltrimethoxsilane (MTMS) improved not significantly the erosion resistance of the composites, but reduced the water-uptake. It was concluded that to achieve a low erosion rate, high- filler loadings are necessary [
154]. Heid
et al. [
133] found that incorporation of hexagonal boron nitride (h-BN) particles in epoxy resin resulted in significant improvements of parameters such as resistance to PD. Other studies showed that PD resistance improves in PI by nanostructuration with LS [
33] and PD resistance was larger in PI/SiO
2 nanocomposites than pure PI [
4]. In summary, it is indicated that nanomization improves PD resistance of polymers, but depends also how nanofillers are dispersed in the polymer matrix and the compatibility between organic and inorganic components [
4].
6.1.5. Space Charge Accumulation
Space charge occurs in a dielectric material when the rate of charge accumulation is different from the rate of removal and arises due to the moving or trapped internal charges, such as electrons, holes and ions [
155]. It is generally undesirable since it causes a distortion in the electric field, increasing the internal field locally within the insulator, which will lead to a faster and premature failure of the material [
124,
155]. Thus, the homocharge (charge near an electrode of the same polarity as the electrode originally in contact with it) decreases the electric field in the electrode vicinity. As a result, a concomitant increase of the electric field elsewhere in the insulator volume is undesirable. This increase can lead to an intensification of partial discharges in the insulating system which results in an acceleration of the material electrical degradation process and a reduction on its lifetime [
124]. Heterocharge increases the electric field next to the electrode, so a reduction of space charge accumulation is therefore an important goal [
124]. Thus, the mechanisms of space charge formation are considered as a determination factor in establishing the overall dielectric properties of a polymeric insulation system and they are very complex in comparison to many other types of materials [
155]. In semicrystalline PE, the interfaces between the crystalline and amorphous phases are associated with the presence of charge trapping sites, which are likely to influence the charge accumulation. By the addition of nanofillers, the charge transport mechanism will become much more complicated because fillers will introduce numerous interfaces and interactions between the polymer and nanofillers. The presence of such interfaces will introduce/modify the distribution of the trapping sites within the system and the charge transport mechanisms will be affected [
155]. Space charge is usually measured by different methods, such as piezoelectric induced pressure wave propagation (PIPWP) method, laser induced pressure propagation (LIPP) method, thermal step method (TSM) and pulsed electro-acoustic (PEA) method. Being aware of space charge density by different analytical and numerical methods, the electric field distribution and its maximum field values can be calculated [
33]. The early experimental work regarding the space charge accumulation in nanocomposites was reported in comparison with microcomposites [
22]. Nelson
et al. were the first in reporting the reduction of space charge density through nanocomposites compared to microcomposites based on epoxy resin and TiO
2 [
22].
Figure 30 demonstrate the difference between nanocomposites and microcomposites based on epoxy resin with 10 wt % of TiO
2, with the average diameter of 23 nm/1.5 µm and shows the maximum field intensity (at that point in the sample, where the electric field is highest) as a function of time for the two systems [
22].
Accordingly to these analyses, it was observed that the maximum field in microcomposites builds up to over twice the average applied electric field, whereas nanocomposites stabilize at the field just a little bit higher than the average [
33]. Trials were made in order to assign the polarity of charge formed in composites, but they were not conclusive if the charge formed near the electrodes is homo or hetero, due to the complicated distribution and conditions that affect space change [
33].
In literature, it was reported that space charge is mitigated by nanostructuration in different nanocomposites systems, such as epoxy/TiO
2, Al
2O
3 and ZnO, PP/EVA layer silicate and LDPE/TiO
2 [
33]. Yin
et al. [
156] analyzed nanocomposites of LDPE with TiO
2, prepared via solution blending method. The space charge distribution of the samples with and without nanoTiO
2 was measured with PEA method. It was found that hetero-polar space charge near electrodes was much less in LDPE/TiO
2 nanocomposites compared with pure LDPE under lower DC stress, no more than 40 kV/mm [
4,
156]. The space charge inside the nanocomposites was much more uniform compared to the base polymer, which means that electrical stress concentration was improved under DC stress in nanocomposites [
4,
156]. Another observation was that the decay rate of the space charge remnant in LDPE/nanoTiO
2 increased by increasing TiO
2 concentration, when short-circuited after pre-stress at 50 kV/mm for 1 hour [
4,
156].
CIGRE Working Group D1.24 [
24] realized a comprehensive experimental investigation of XLPE and its nanocomposites with fumed SiO
2. The research studies were carried out in different countries, but all the samples were prepared by only one source and evaluated by experts from several laboratories [
24]. Three types of samples were analyzed involving unfilled XPLE (standard commercial material used for extruded power cables—sample 1), XLPE with 5 wt % unfunctionalized nanoSiO
2 (sample 2) and XLPE with 5 wt % functionalized nanoSiO
2 (sample 3). The samples were vacuum heat treated at different temperature values and time durations. Two types of measurements systems were applied to measure space charge in XLPE samples, such as PEA method and thermal step (TS) method at high/low field, by different research teams [
24]. One of the results revealed that the lowest space charge amount is obtained when the nanofiller is surface treated (see
Figure 31).
The overall results showed that heterocharge is generated for unfilled XLPE and is due to some cross-linking residues and natural impurities [
24]. On the other hand, it was confirmed that nanofillers reduce this heterocharge since nanoparticles are characteristic for impurities absorbance. Concerning the charge injection, it was shown that homocharges are easier injected into filled than unfilled XLPE and when nanofillers are added, a charge compensation takes place. It was also highlighted that charge packets appeared for very high electric field values (near breakdown) [
24]. This unstable and chaotic phenomenon consists of a slowly travel across the insulator of some waves of charges, with a rate of about 1 mm/hour and a magnitude that can double the local electric field. These charge packets are generally found to be reduced by the addition of nanoparticles [
124]. Similar findings were obtained also by Lau
et al. [
155] on nanocomposites based on XLPE with 2 wt %/5 wt %/10 wt % treated and untreated nanoSiO
2.
In other polymer systems, such as EVA and i-PP, charge accumulations were considerably large at the field value of 60 kV/mm, but tended to decrease by increasing the addition of nanofillers from 2 to 6 wt % [
33]. A common behavior is the charge reducing at high electric field due to nanofillers introduction, while it is increasing at low field due to ionic impurities included in nanofillers. This charge can be swept away by the pretreatment of nanofiller purification [
33].
In summary, the following findings are confirmed as effects of nanostructuration: space charge increases at low fields and decreases at high field; space charge inception field decreases; space charge is generated internally and charge decay time decreases [
124].
6.1.6. Electrical Breakdown
Electrical breakdown of insulating materials is an important factor in high-voltage applications [
59]. The incorporation of inorganic fillers into the base polymer can significantly modify the electrical breakdown of the composite material, depending on the filler concentration, their shape, size and surface modifications with different agents, materials homogeneity affected by the dispersion of the fillers into the base polymer, and the electrical properties of the fillers [
59]. In order to obtain high electrical breakdown strength of composites is it necessary to choose fillers with similar electrical characteristic as the polymer matrix, since electric field distortion and enhancement can be caused by the differences in relative permittivity and electrical conductivity between inorganic fillers and organic polymers [
59]. The dielectric strength of the polymers can be deteriorated by high-permittivity fillers (BaTiO
3, SiC, ZnO and AlN) and high electrical conductivity fillers (carbon black, carbon fiber and nanotubes, graphite, metals), but they can be used in applications demanding high thermal conductivity materials [
59]. Low permittivity and high electrical resistivity fillers can be used in polymer composites with high thermal conductivity and high breakdown strength for the insulation systems of electrical equipment. For example, combining BN nanofiller (70 nm, 10 wt %) with microfiller (500 nm, 1.5 μm, 5 μm, 10 wt %), Andritsch
et al. [
30] demonstrated an increase in the DC breakdown strength of an epoxy composite. From
Figure 32a it can be observed that the increase coincides with the increase of the interfaces in the composite material [
30]. It is suspected that one of the key parameters in improving the dielectric behavior of nanodielectrics refers to the strong interfaces between polymers and fillers, because of their surface modifications [
30]. Even when the functionalization of nanoparticles was not performed, surprising results were obtained [
30].
The electrical breakdown strength values were measured in the case of epoxy-nanocomposites with Al
2O
3, SiO
2 and AlN as-received/functionalized and plots for a Weibull scale parameter can be seen in
Figure 32b, which shows the voltage for 63.2% failure probability of the samples [
157].
Electrical breakdown results are frequently analyzed through Weibull statistics (Weibull plots) and represent the cumulative probability of breakdown, which would equate to the proportion of specimens failed for a large sample size [
124]. Since these composites had their highest DC breakdown strength for 0.5 and 2 wt % fillers concentrations, it can be assumed that also epoxy resin/BN composites with surface functionalized particles of 70 nm on average would also have higher breakdown strength for fillers concentration between 0.5 and 2 wt % [
30]. Other studies [
4] reported that electrical breakdown values remained almost the same up to 10 wt % nanoparticles concentration, while it decreased significantly for 10 wt % microparticles loading.
Roy
et al. [
135] observed that incorporation of SiO
2 nanoparticles into XLPE increased the dielectric strength significantly compared to the incorporation of microparticles and their values were compared with the base polymer in
Figure 33.
A dramatic increase in breakdown strength was observed in the case of untreated nanocomposites compared to microcomposites. However, the largest increase was observed for the vinylsilane treated SiO
2/XLPE composites at 25 °C that maintained to increase their values at elevated temperature of 80 °C. For all the analyzed samples, the Weibull shape parameter (β) increased at 80 °C due to an increase in free volume with temperature [
135]. Electrical breakdown of polymer-based micro/nanocomposites is affected by several factors, such as degree of crystallinity, space charge accumulation, interfacial area, temperature, free volume and type of bonding [
135]. In this study [
135], the highest increase in electrical breakdown was achieved with nanoparticles compared to microparticles, where no significant change in crystallinity occurred. It has been postulated that nanoparticles prevent the space charge accumulation in the volume of nanocomposites, by generating local conducting paths. The existence of these paths through the overlapping of nanometric double layers, can explain the breakdown values [
135]. Similar results were obtained by Lau
et al. [
155] in their experimental studies.
Li
et al. observed in their review [
151] that DC breakdown strength decreases for micro/nanocomposites by increasing the filler loadings as illustrated in
Figure 34a. In order to effectively comment on these published experimental data in the review [
151], the ratio
k2, between the breakdown voltage values of nanocomposites with different fillers concentration and the ones of the polymer matrix are employed. Below a certain content (about 10 wt %) nanofillers indicate a positive effect on improving DC electrical breakdown strength [
151]. From
Figure 34a it can be observed that microfillers have a negative effect on DC electrical breakdown [
151].
Calebrese
et al. [
158] demonstrated that nanoparticles exhibit both increasing and decreasing of breakdown strength in different systems. In obtaining these variations, the effect of processing can also be a determining factor. For example, it was shown that both microfillers and size agglomeration of nanoparticles, lead to reductions in the breakdown strength [
158]. Tanaka
et al. [
4] observed that DC breakdown strength was enhanced for nanocomposites based on PP, while it did not changed significantly in the case of EVA copolymers.
Electrical breakdown property of dielectrics depends also on the applied voltage [
151]. It was observed that in the process of data compilation, electrical breakdown field stress presents a strong dependence on the applied voltage as depicted in
Figure 34b [
151]. This figure clearly reveals that nanofillers are beneficial to improve electrical breakdown strength of unidirectional voltage, which was affected by space charge [
151].
In other nanocomposites systems based on epoxy resin/ZnO and epoxy resin/layers silicate, better performance in AC breakdown strength were reported [
33]. It was shown that the addition of a very small amount of ZnO nanoparticles (between 0.5 and 1 wt %) in epoxy resin, leads to a significant improvement in breakdown time [
33].
Therefore, electrical breakdown strength might not be significantly affected by nanomization, under small concentrations of nanofillers and proper dispersion conditions. Favorable results were reported in the cases presented before in comparison to unfilled and micro-filled materials [
4].
6.1.7. Tracking Resistance
In high-voltage applications, especially on outdoor polymeric insulators appear tracking phenomena, which means the formation of permanent conducting path across the insulator surface due to surface erosion under voltage stress. During the service, the outdoor polymeric insulators are coated with dust, moisture or environmentally impurities, leading to conducting path formation on their surface. When a voltage is applied, this path will start to conduct, resulting in heat generation and sparks occurrence, which damage the surface of the insulator. Due to the fact that polymers are organic materials, the carbonizes regions at the sparking places act as semiconducting or conducting channels resulting in an increased stress in these regions and over the rest of the material. Consequently, the temperature increases in the vicinity of the channels and a new region is carbonized. As the process is cumulative, the channels increase in time and the carbonized track bridges the entire distance resulting in a failure of the insulation [
159].
One common approach for increasing the tracking resistance of polymeric insulators, corresponding to an increase of equipment lifetime, is the introduction of inorganic microfillers into the polymer matrix. In this direction, Piah
et al. [
160] analyzed the tracking resistance through experimental observations of leakage currents values and carbon track development of linear low density polyethylene and natural rubber (LLDPE/NR) blends with and without ATH fillers. The experimental results showed that the compound of 80% LLDPE mixed with 20% NR, without ATH seems to be the best compound based on the least damage and the lowest normalized degradation index [
160]. Although the experimental results revealed favorable tracking resistance enhancement, for high-voltage applications, this property of polymeric insulators should be further improved to attain greater reliability [
159] and nanocomposites materials could be the answer.
Tanaka [
33] considers that silicone elastomers, which can be used for outdoor insulators are expected to have better tracking resistance performances by nanostructuration, but further investigations need to be accomplished in this direction. By addition of ATH nanoparticles in RTV silicone rubber, the tracking performances of the silicone rubber are improved [
4]. El-Hag
et al. [
161] obtained experimental results on the erosion resistance of silicone rubber (SIR) filled with 12 nm size fumed nanoSiO
2 and filled with 5 µm size SiO
2 microfiller. It was concluded that the erosion resistance of SIR materials increased by increasing the percentage of fillers, and similar performances were observed for 10 wt % nano-filled SIR and 50 wt % micro-filled SIR. Sarathi
el al. [
162] demonstrated that the tracking time is higher in terms of aged epoxy nanocomposites compared to pure epoxy. Ageing studies were carried out to understand the surface characteristic variation through contact angle measurements. Raetzke
et al. [
163] tested the resistance to tracking and erosion of silicone rubber with two different kinds of nanoscale SiO
2 filler particles. The results showed a high improvement of the resistance to both stresses for one type of untreated SiO
2 particles at very low filler contents. Later, in 2015, Ansorge
et al. [
154] analyzed the influence of various fillers, such as ATH, Al
2O
3 and SiO
2 with different sizes (from 0.3 μm to 18 μm) and surface modifications (unmodified, modified by the material supplier and
in situ modified during compounding, using vinyltrimethoxysilane (VTMS) and methyltrimethoxsilane (MTMS)) on the erosion resistance of high temperature vulcanized (HTV) silicone rubber (SR) composites (see
Figure 35). The main research focus was on ATH fillers as they have the ability to release water at elevated temperature.
It was found that for very small filler contents, ATH was not favorable for the erosion performance of polymeric composite and by employing 20 wt % of filler, the performance is even worse compared to the base polymer. For a positive effect on this property, a sufficient amount of ATH filler must be added into the polymer matrix. The behavior of the surface modified ground SiO
2 particles is slightly worse in case of high filler loadings (> 50 wt %), while there was no substantial difference visible at filler loading of 30 wt %. The composite material filled with ground modified ATH of 3.5 µm shows the best performance. The performance of ground modified ATH of 3.5 µm and material supplier filler was very similar [
154]. Until the present time, literature on tracking performance of polymer nanocomposites is limited. Experimental investigation onto the tracking resistance of polymer nanocomposites would be of great importance, especially in confirming its performance with nanofillers [
159].
6.1.8. Electrical Tree Resistance
The propagation of electrical trees represents one of the major causes for electrical breakdown of high-voltage equipment and power cables insulation [
164]. In order to extend the lifetime of an insulation until breakdown, composite materials with barriers and surrounding polymer matrix are commonly used in power engineering. The influence of barriers on the electrical trees propagation were analyzed and many research studies were made on the micro/nanocomposites development for electrical breakdown resistance compared to the base polymer.
Ding
et al. [
165] analyzed the electrical tree growth on samples, such as unfilled Araldite epoxy resin and micro-sized Al(OH)
3 particle, in different concentrations ranging from 0 to 15 wt %, as reinforcement to enhance the time to breakdown of the composite material. It was concluded that the addition of filler particles in the epoxy resin could make considerable improvements in breakdown resistance by increasing the time of the electrical breakdown with the increase of filler concentrations [
165]. Different models could explain the results. For unfilled polymers, it has been assumed that the propagation of electrical trees arises from the formation of a damage process zone (DPZ) which precedes and surrounds the tree tip during the tree growth process [
165]. It was supposed that the submicroscopic trees are initiated and grow due to the submicroscopic voids created by thermal fluctuation within the DPZs from the vicinities of the tree tips [
165]. With respect to composite materials, it is suggested that by introducing microfillers into the polymer matrix, more submicron-size voids are generated around ATH fillers due to the induced changes in local thermal and residual mechanical stress. Therefore, when a tree channel tip reaches this area, the immovable submicron-voids in the matrix will behave as submicron-trees near the primary tree tip. The DPZ size is then expanded and consequently may increase the resistance to electrical growth of dielectrics and hence increasing the electrical insulation lifetime.
Uehara
et al. [
166] analyzed the tree growth and breakdown characteristics of composites based on polymer barrier film layers molded in an EVA copolymer, using a needle – plan configuration and an AC voltage. The electric field was perpendicular to the EVA/barrier film interfaces. It was found that the barrier film retards the electrical tree development, which punctures the film, or develops along the edge of the film. It was also demonstrated that the pressure of the decomposing gas in the tree channels and the interface of the analyzed composite materials play an important role in tree propagation [
166]. Vogelsang
et al. [
164] analyzed the tree growth diagrams in composites structure of mica-epoxy winding insulations and their growth characteristic was optically analyzed (see
Figure 36a). During the electrical tree propagation, electrical discharges take place in the small branches and their structure changes to hollow pipe-shaped channels (see
Figure 36a) [
164].
Experimental results showed that the electrical tree propagation could be slowed down when a barrier is introduced between the needle and the plane electrode. This barrier may cause significantly increased time of breakdown values. The enhancement depends on the barrier nature, their thickness and widths, and the dielectric strength of the surrounding polymer interface. When multiple barriers exists, their arrangement influence significantly the time to breakdown and when they are overlapped a much higher time until breakdown is obtained than impinged ones [
164]. Based on these results, Vogelsang
et al. [
164] proposed a model that emphasizes the widening of the small branches to pipe-shaped channels. There are three stage in electrical tree propagation until the final breakdown of the composite material (
Figure 36b). The first stage represents the tree inception and the second one is the growth of the first small branches to the opposite electrode. The third stage is the stage where the small branches are widened up to pipe shaped channels. It starts when the first branch has reached the opposite electrode and it ends with final electrical breakdown [
164]. It can be concluded that the barrier materials and their processing play a major role concerning the time to breakdown of composite insulation materials [
164].
Based on similar experimental results, Christantoni
et al. [
167] simulated with the aid of Cellular Automata (CA), the propagation of electrical trees in an insulating system consisted of epoxy resin and mica sheets, which is affected by the applied voltage, the local dielectric strength and the relative permittivity of the involved material. The simulation results indicated that the mica barriers hinder the propagation of electrical trees [
167]. Iizuka
et al. [
144] analyzed two types of epoxy/SiO
2 nanocomposites, Aerosil and Nanopox samples, respectively, in order to clarify the effect of nanofiller dispersion and of coupling agents on electrical tree resistances and voltage endurance. The study revealed that nanofillers and coupling agents could improve treeing resistance in both cases, but depend on the level of nanofiller dispersion [
144].
6.1.9. Water Absorption
The presence of absorbed water can have undesired effects on the improvements of electrical properties of micro/nanocomposites and these influences were analyzed by many researchers [
87]. Zhang
et al. [
168] analyzed the dielectric behavior in the presence of humidity and dried nanocomposites consisting of either epoxy resin or PE with different concentration of nanoAl
2O
3. With respect to the epoxy/Al
2O
3 nanocomposites, no difference in the dielectric properties compared to the unfilled polymer were detected under dry conditions. Nevertheless, their dielectric characteristics differed significantly when the adsorbed water amounted to 0.4% b.w. (body weight), which is the normal concentration that occurs under ambient exposure. It can be concluded that the sites for absorbed water in the epoxy nanocomposites increases compared to the unfilled polymer, which does not present interface regions [
168]. Zou
et al. [
87] reported that epoxy/SiO
2 nanocomposites absorbed significantly more water than unfilled polymer due to the fact that extra water was located around the surface of nanoSiO
2. Epoxy microcomposites were found to absorb less water than the base resin due to the reduced proportion of the polymer in this composite. These hypotheses were confirmed by the measurements on the water uptake, swelling and density change, as a function of humidity. The water shell model, in which percolation of charge carriers occurred through overlapping water shells, explained the low frequency dielectric results [
87]. It was observed that nanofillers with functionalized hydrophobic surfaces considerably reduced the amount of water absorbed in the same conditions of humidity.
Dodd
et al. [
169] analyzed the dielectric properties in the presence of humidity for two types of bisphenol-A epoxy resin systems, Araldite CY1301 and Araldite CY1311. It was found that frequency and magnitude parameters, for all the analyzed electrical conduction and dielectric process were dependent on the humidity. In particular, above the glass transition temperature of both epoxy systems, it was found that absorbed moisture was involved in the formation of a bulk quasi-DC dielectric response (QDC) consistent with cluster formation of the absorbed water molecules [
169]. Lutz
et al. [
101] analyzed the water absorption behavior of disk-like mineral filled epoxy resin samples determined by charge of weight measurements at different relative air humidity. A significant decrease of volume resistivity was achieved by increasing the water content. This dynamic degradation of the volume resistivity during humidity storage was simulated with a model based on Fick’s diffusion law and the results were verified by periodic measurements of the volume resistivity on epoxy samples during storage at 99% relative humidity [
101].
Calebrese
et al. [
158] accomplished a review study of the experimental literature regarding nanodielectrics, such as PAI/nanoAl
2O
3 and XLPE/SiO
2, which indicated numerous inconsistencies in the obtained results. It was concluded that if the processing parameters of the nanocomposites are not carefully selected, the addition of nanoparticles can alter the structure of the materials and can introduce water into the system, generating cavities and facilitating materials degradation [
158].
Hui
et al. [
140] analyzed the dielectric behavior of XLPE/SiO
2 nanocomposites in the presence of humidity. Decreases in AC breakdown strength, increases on losses and space charge formation and significant reduction in water tree aging were obtained. It was also demonstrated that XLPE/SiO
2 nanocomposites have an increased moisture uptake compared to the base polymer, due to the addition of nano SiO
2 particles. The results were hypothetically explained by two major factors, which influence the dielectric behavior of XLPE/SiO
2 nanocomposites, as the concentric water shell around the particles and the charge from inter-particle distances. It was also concluded that a water layer thickness of nanometers tens could initiate percolation in the analyzed XLPE/SiO
2 nanocomposites [
140].
In 2015, Lau
et al. [
53] prepared a review article with the most recent findings and issues concerning nanodielectrics research, highlighting the role of nanofiller/polymer interfaces. One important section referred to the water absorption in nanocomposite materials. It can be concluded that due to the hygroscopic character of nanoparticles, the presence of water on their surface lead to agglomerations. Taking into consideration this aspect, nanoparticles and matrix drying under vacuum conditions or nanoparticles surface functionalization, which replace surface hydroxyl groups and physically block water from getting to the surface of the particles, should be necessary steps. The presence of water can have additional effects on the behavior of nanocomposites, leading to changes in their dielectric behavior [
158,
170].
6.2. Thermal and Mechanical Properties
6.2.1. Thermal Properties
To improve the performance of high-voltage electrical equipment, new electrical insulating materials (with superior properties) are necessary [
134]. One important issue is the necessity to use dielectric polymers, as micro/nanocomposites with higher thermal conductivities, which has also excellent processability and low costs. Most of the used polymers are thermally insulating and have a thermal conductivity between 0.1 and 0.5 W/m·K [
59]. One of the possibilities to reach this goal is to introduce high-conductivity fillers in polymers, such as Al
2O
3, AlN, BN, Si
3N
4, beryllium oxide (BeO) or diamond, such as it can be seen in
Table 3 [
59].
From the all high-thermal conductivity fillers listed in
Table 3, only some of them are useful and attractive to be employed in high-voltage applications. Al
2O
3 has a relatively high value of λ and is often used as filler because of the low cost and high electrical resistivity. Nevertheless, the main disadvantage in high-voltage applications is its high relative permittivity (ε
r ~ 9) [
59]. Crystalline SiO
2 and fumed SiO
2 are the most commonly material used in electronics and also as fillers to produce highly conductive composites, but their intrinsic thermal conductivity is a bottleneck for the thermal conductivity of their composites [
59]. ZnO is a semiconductor and it has been widely exploited as an additive in the rubber industry. Its high thermal conductivity and nonlinear property make its composites useful for electric stress control in high-voltage applications. Another filler with non-linear electrical property and high thermal conductivity is SiC. Due to properties, such as high-saturated carrier drift velocity and high permittivity, its applications in dielectric materials, microelectronic packaging, and high-voltage insulation are limited [
59]. Although BeO possesses a higher thermal conductivity than other non-metals and is corrosion resistant, with excellent electrical insulating properties, its toxicity and high cost makes it unattractive for commercial use. Due to the high intrinsic thermal conductivity, low thermal expansion coefficient and high electrical resistivity, AlN attracts much interest. Nevertheless, the low oxidation resistance and relatively high permittivity, limits its applications. Due to its high thermal conductivity and electrical resistivity, low permittivity and density and excellent high temperature resistance, BN is ideal for electronic packaging application. Despite its excellent properties, Si
3N
4 has been rarely used as filler for high-thermal-conductivity composites because of its moderate thermal conductivity. Diamond is used as filler for preparing highly conductive composites, but its high cost makes it unattractive for industrial applications. BaTiO
3 has relatively low thermal conductivity, very high permittivity and density, which makes it unattractive for preparing high-thermal-conductivity composites [
59].
The effective thermal conductivity of a composite material composed of one type of filler introduced into a polymer matrix depends on the thermal conductivity of the components, the fillers shape, size and concentration, their dispersion into the polymer and the thermal interfacial resistance [
59]. Taking into consideration all these aspects, many theoretical models for computing the thermal conductivity of a composite had been proposed until now, but due to the complex influences (inexact data intrinsic thermal conductivity, shape, size, distribution and orientation of the fillers), only few of them fit the experimental data very well [
59]. It was observed that as the intrinsic thermal conductivity of the fillers increases, appears a limit to the thermal conductivity of the composite, as in the theoretical prediction of Nielsen [
171] for spherical particles (see
Figure 37) with packing fraction 0.637 and the ratios of λ
p/λ
m = 10, 20, 50, 100, 500 and 1000 (λ
p is the intrinsic thermal conductivity of the filler and λ
m is the thermal conductivity of the composite) [
59].
Kochetov
et al. [
172] compared different theoretical models for predicting thermal conductivity of a two-phase system with experimental data of nanoAlN and nanoBN particles distributed in an epoxy resin matrix. From
Figure 38 was concluded that the Agari&Uno model correlated best with the experimental data on the analyzed nanocomposites.
Heat conduction processes in polymer composites are based on phonons. Interfacial thermal resistance is due to the differences between phonon spectra of different phases of the composites and due to scatterings at the interface between these phases [
59]. This means that a large interfacial area can cause large phonon scattering and low thermal conductance. Thus, it is expected that the thermal conductivity of polymer composites to increase by increasing the particle size for a given filler loading. Han
et al. [
173] showed in
Figure 39 that the thermal conductivities of all analyzed composites increase by increasing BN concentration and that there is no distinctive difference between BN-Micro, BN-Meso and BN-Nano. These results suggest that the size of BN is not necessarily crucial for the thermal conductivity of the epoxy/hardener/filler composites at low to moderate concentrations as the sizes of these BNs are very different [
173].
In general, the high thermal conductivity of a composite is achieved when thermally conductive pathways (percolating network) are formed in the material. A percolating network is obtained if either the filler particles are spherical and their concentration is high, or if the particles exceed a critical value. These requirements increase the material and processing costs and could deteriorate the mechanical and other properties of composite materials [
59]. In this situation, there are two methods to ensure a low percolating threshold: (i) immiscible polymer blends can be used as matrix and (ii) composites can be prepared by molding the filler-coated polymer particles [
59]. It was reported that the thermal conductivity was enhanced for PI nanocomposite filled with coated nanoparticles compared to pure PI and PI microcomposite (see
Figure 40) [
174].
The thermal conductivity of nanocomposites cannot be completely determined by size, concentration, dispersion, aspect ratio or particles orientation in the polymer matrix [
59]. Xu
et al. [
175] showed in
Figure 41 that the surface treatment of BN with acetone, silane, nitric acid (HNO
3) or sulfuric acid (H
2SO
4), resulted in epoxy composites with increased thermal conductivity. The greatest increase was given by silane modification and the least effective was obtained with acetone treated particles.
Thermal conduction in glassy and crystalline dielectrics is caused through elastic vibrations of the crystalline lattice. The use of high thermal conductivity fillers can enhance this process because of the rapidly heat transfer along the fillers [
59].
Significant progress has been made during the last few years in the research for high thermal conductivity dielectric micro/nanocomposites. Based on the papers and discussions with numerous equipment manufacturers, there is a strong- interest in improved thermal conductivity with various goals such as: (i) lower operating temperature; (ii) longer service life; (iii) increased operating stress without increasing hot spot temperature; (iv) reduced wall build,
etc. Various methods have been proposed for improvements ranging from solventless resins to modification of the insulation with high thermal transfer modifiers [
176].
6.2.2. Mechanical Properties
Polymer composites used in the production of high-voltage insulating systems, applied in electrical machines, generators, electrical equipment,
etc., are often subjected to constant vibrations/abrasion by power frequency magnetic forces and high shear stress under rapid thermal loading conditions [
177]. Nevertheless, composite insulation state of the art reports that these mechanical stresses lead to voids/crack initiation or delamination effects with subsequent electrical discharge and catastrophic failure. Many experimental studies were performed on the mechanical properties of composites filled with nano- and micro-fillers and compared with the base polymer.
Yasmin
et al. [
178] investigated composites based on epoxy resin (anhydride-cured diglycidyl ether of bisphenol A, DGEBA) reinforced with 2.5 to 5 wt % graphite. It was concluded that tensile strength and elastic modulus of the composites are increased by adding fillers, and an agglomeration of fillers occurred at 5 wt % fillers concentration. Yang
et al. [
179] studied the mechanical properties of composites based on PP filled with 10, 20, 30 and 40 wt % rice husk flour. They demonstrated that the tensile and impact strength of the composites decreased, while the tensile modulus increased by increasing the filler concentration. In 2005, Lam
et al. [
180] experimentally investigated the mechanical and thermal properties of nano-clay filled epoxy resin composites. The results evidenced that the hardness values of the nanocomposite were increasing by adding nano-clay fillers up to a limit and then were decreasing due to the clusters formed for a high filler concentration. The fracture surfaces observed by microscopic techniques revealed that the size of clusters varied with the nano-clay concentration in the nanocomposite materials. Ray
et al. [
181] analyzed the mechanical properties of vinylester resin matrix composites prepared with 30, 40, 50 and 60 wt % of fly ash. It was found that fly ash enhanced the stiffness and rigidity of composite, but the mechanical strength was reduced at high filler content.
Later, in 2009, Gao
et al. [
182] characterized the mechanical performance of nanocomposites based on PS with nanoCaCO
3. Tensile and compact tensile tests showed that the strength and toughness of PS were decreasing after the addition of nanoCaCO
3 particles, which can be explained by the defects induced by interfacial debonding and nanofiller agglomerations. Asi [
183] investigated the mechanical properties of Al
2O
3-filled glass fiber-reinforced epoxy composites. The results demonstrated that the tensile strength and the shear strength of the composites decreased by increasing Al
2O
3 particles content, while the bending strength increased up to 10 wt % filler ratio and decreased at higher ratios.
Panaitescu
et al. [
139] analyzed the influence of nanostructration and fillers dispersion on the mechanical and electrical properties of nanocomposites filled with inorganic fillers, such as SiO
2 and Al
2O
3. An increase of the tensile strength and elongation at break were observed for low nano-oxide concentration (2 wt %). These results were associated with a more favorable dispersion of nanoparticles as well as an increased adhesion at the interface. In 2012, Zaman
et al. [
184] studied the micro- and nano- ZnO-filled i-PP composites with filler concentrations between 2 and 8 wt %. Tensile tests showed that the tensile strength at yield and tensile modulus of the composites tended to increase by increasing contents of microZnO/nanoZnO particles. Nano-filled composites provided improved mechanical properties compared to micro-filled composites for the same filler concentration. It was concluded that the dispersion of particles was optimal at a filler content of 5 wt % since the morphology images and dispersion of nanofillers were better, which led to stronger interfacial adhesion between matrix and fillers. Ibrahim
et al. [
185] investigated composites based on oil palm ash (OPA) as filler in unsaturated polyester, in different concentrations between 10 and 30 vol %. The study revealed that the modulus increases by increasing the filler content, while tensile and flexural strength of UP/OPA composites decrease.
In 2013, Agubra
et al. [
186] analyzed the effects of nano-clay dispersion in glass fiber epoxy composites on the mechanical properties. It was concluded that the high viscosity of the composite generates homogeneity problems due to the agglomeration of the fillers. Chuhan
et al. [
187] investigated the filler size and loading effects on the mechanical and tribological performance of cenosphere-filled vinylester composites. The work revealed that the mechanical and tribological performance could be enhanced, and optimum values were obtained with 6 wt % filler content. Sayer [
188] concluded that the elastic modulus and bulking load caring capability of composites based on glass reinforced epoxy resin composites were increased by adding ceramic fillers, such as SiC, Al
2O
3, and boron carbide (B
4C). Sudheer
et al. [
189] studied the mechanical and tribological characteristics of potassium titanate whisker (PTW) reinforced epoxy composites. It was found that PTW additions present beneficiary effect on density, hardness, and stiffness properties of composites; however, mechanical strength and ductility were found to decrease with the increasing content of PTW. In 2015, Pakash
et al. [
190] studied flexural strength, compressive strength, vickers micro-hardness and density for different concentrations of ceria filler. As the content of ceria is increased, an enhancement of the mechanical properties was achieved until a maximum value was reached and then, these properties decreased again by increasing filler concentration.
Ozsoy
et al. [
191] studied the influence of microfiller (between 10 and 30 wt % Al
2O
3, TiO
2 and fly ash) and nanofillers (between 2.5 and 10 wt % Al
2O
3, TiO
2 and clay) on the mechanical behavior of epoxy based composites.
Figure 42 shows the tensile strength
versus filler content in epoxy resin based micro/nanocomposites. It was observed that the tensile strength of micro-filled composites decreased by increasing filler concentration. In the case of nanocomposite materials, an increase of strength values was observed for up to 2.5 wt % filler content, but beyond this concentration the strength of the composite depleted again.
Figure 43 illustrates the tensile modulus in dependence on the filler content in epoxy resin based micro/nanocomposites. It was observed that the tensile modulus of epoxy based composites increased with rising filler concentration, which was attributed to the fact that micro- and nanofillers increased the polymer stiffness [
191].
Figure 44 describes the elongation at break
versus the filler content in epoxy resin based micro/nanocomposites. It is clear that the elongation at break decreased by increasing filler concentration distributed into the base epoxy, due to the fact that fillers imposes to the matrix the brittle behavior [
191].
Ozsoy
et al. [
191] attributed the decrease in the tensile strength of microcomposites at high filler concentration to the weak adhesion between epoxy matrix and particles. In terms of nanocomposites, the drop in mechanical strength was associated with the inhomogeneous distribution of fillers at higher concentrations, which led to agglomerations and caused stress concentration regions. When it comes to nano-clay-filled epoxy composite even at low filler contents the decrease in strength was related to agglomeration problems [
191]. The drop in elongation at break due to the addition of inorganic filler was mainly attributed to the elastic properties of the composite, which depend on the polymer matrix properties. Nevertheless, in the presence of fillers that restrict the mobility of the polymer, epoxy resin shows brittle behavior and the higher the filler content is, the higher the brittleness of the composite is [
191].
The attempt of improving the electrical, thermal and mechanical properties of an existing micro- or nanocomposite material or synthesizing a new material can be based on an Edisonian approach. In the case of a new material, many testing samples are necessary to build reliable statistics [
94]. The results presented in this review reveal that various nanodielectric systems have a promising future in high-voltage applications.


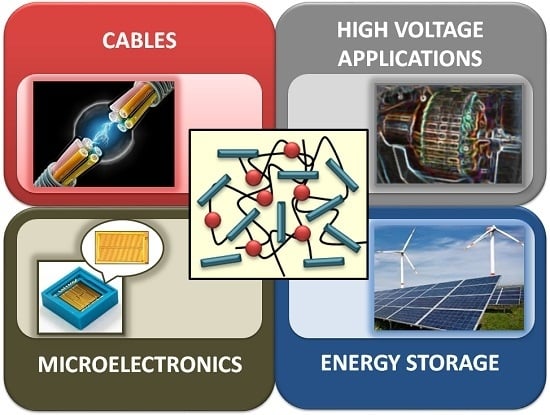


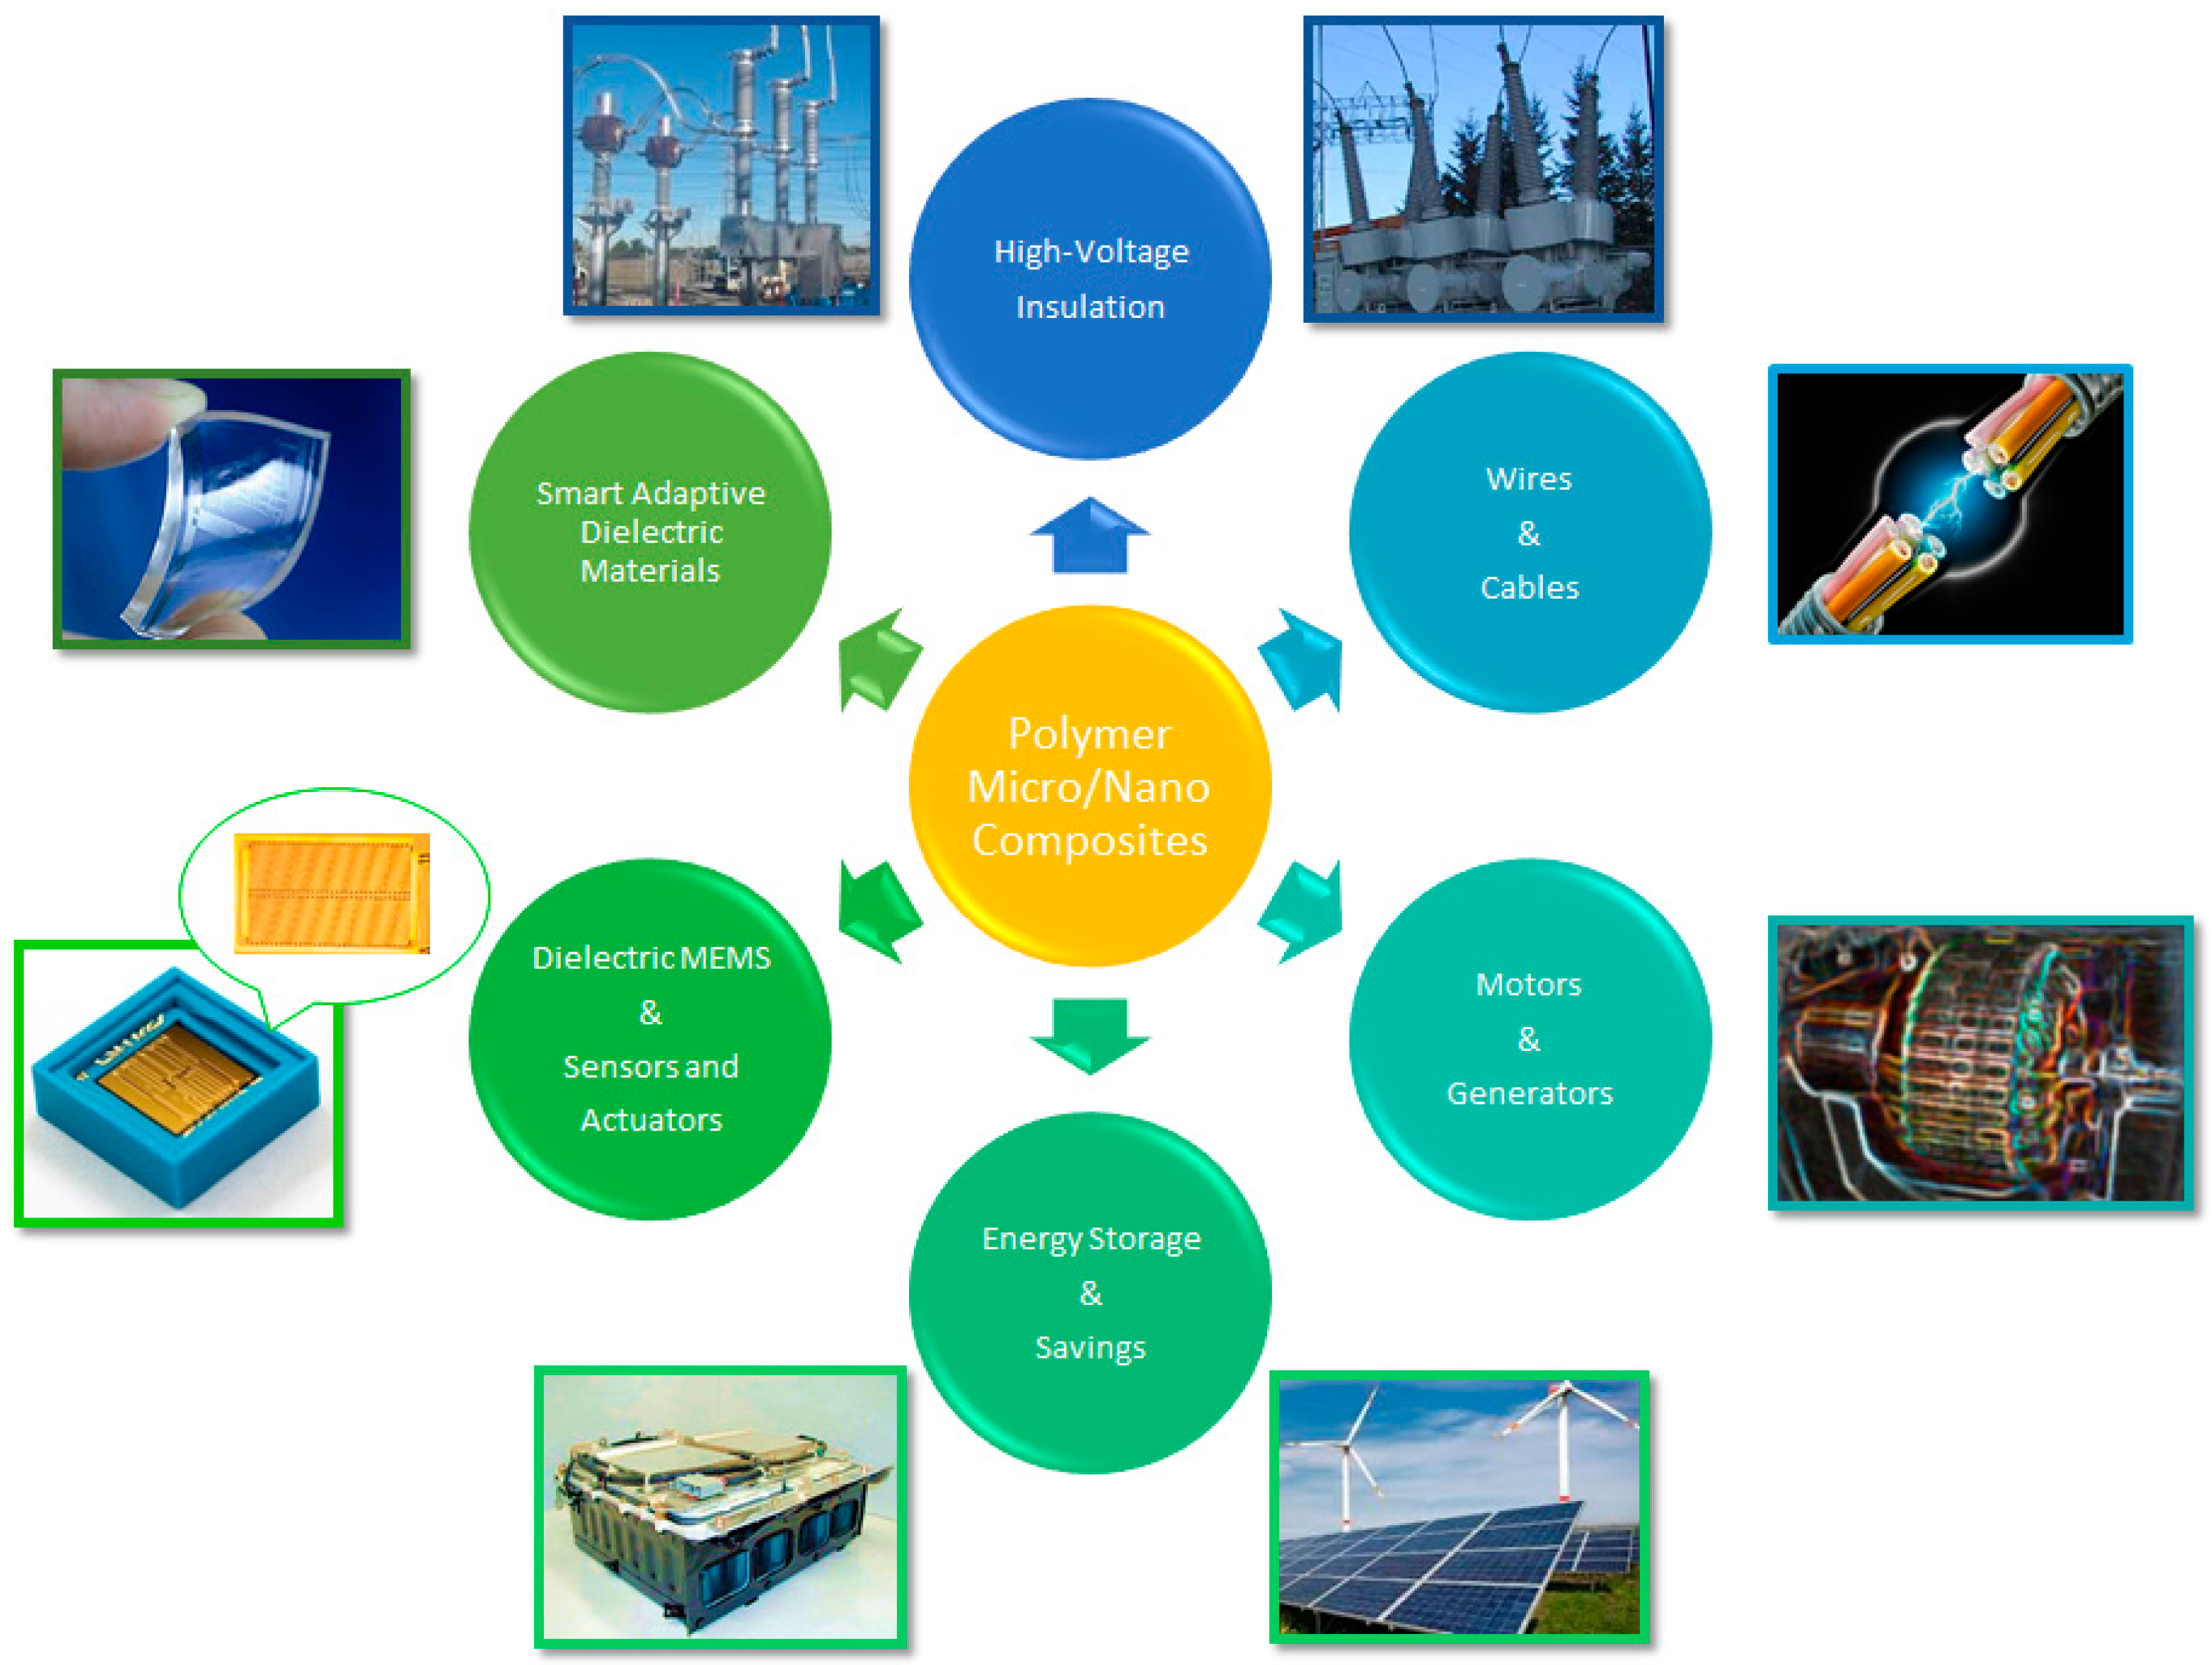
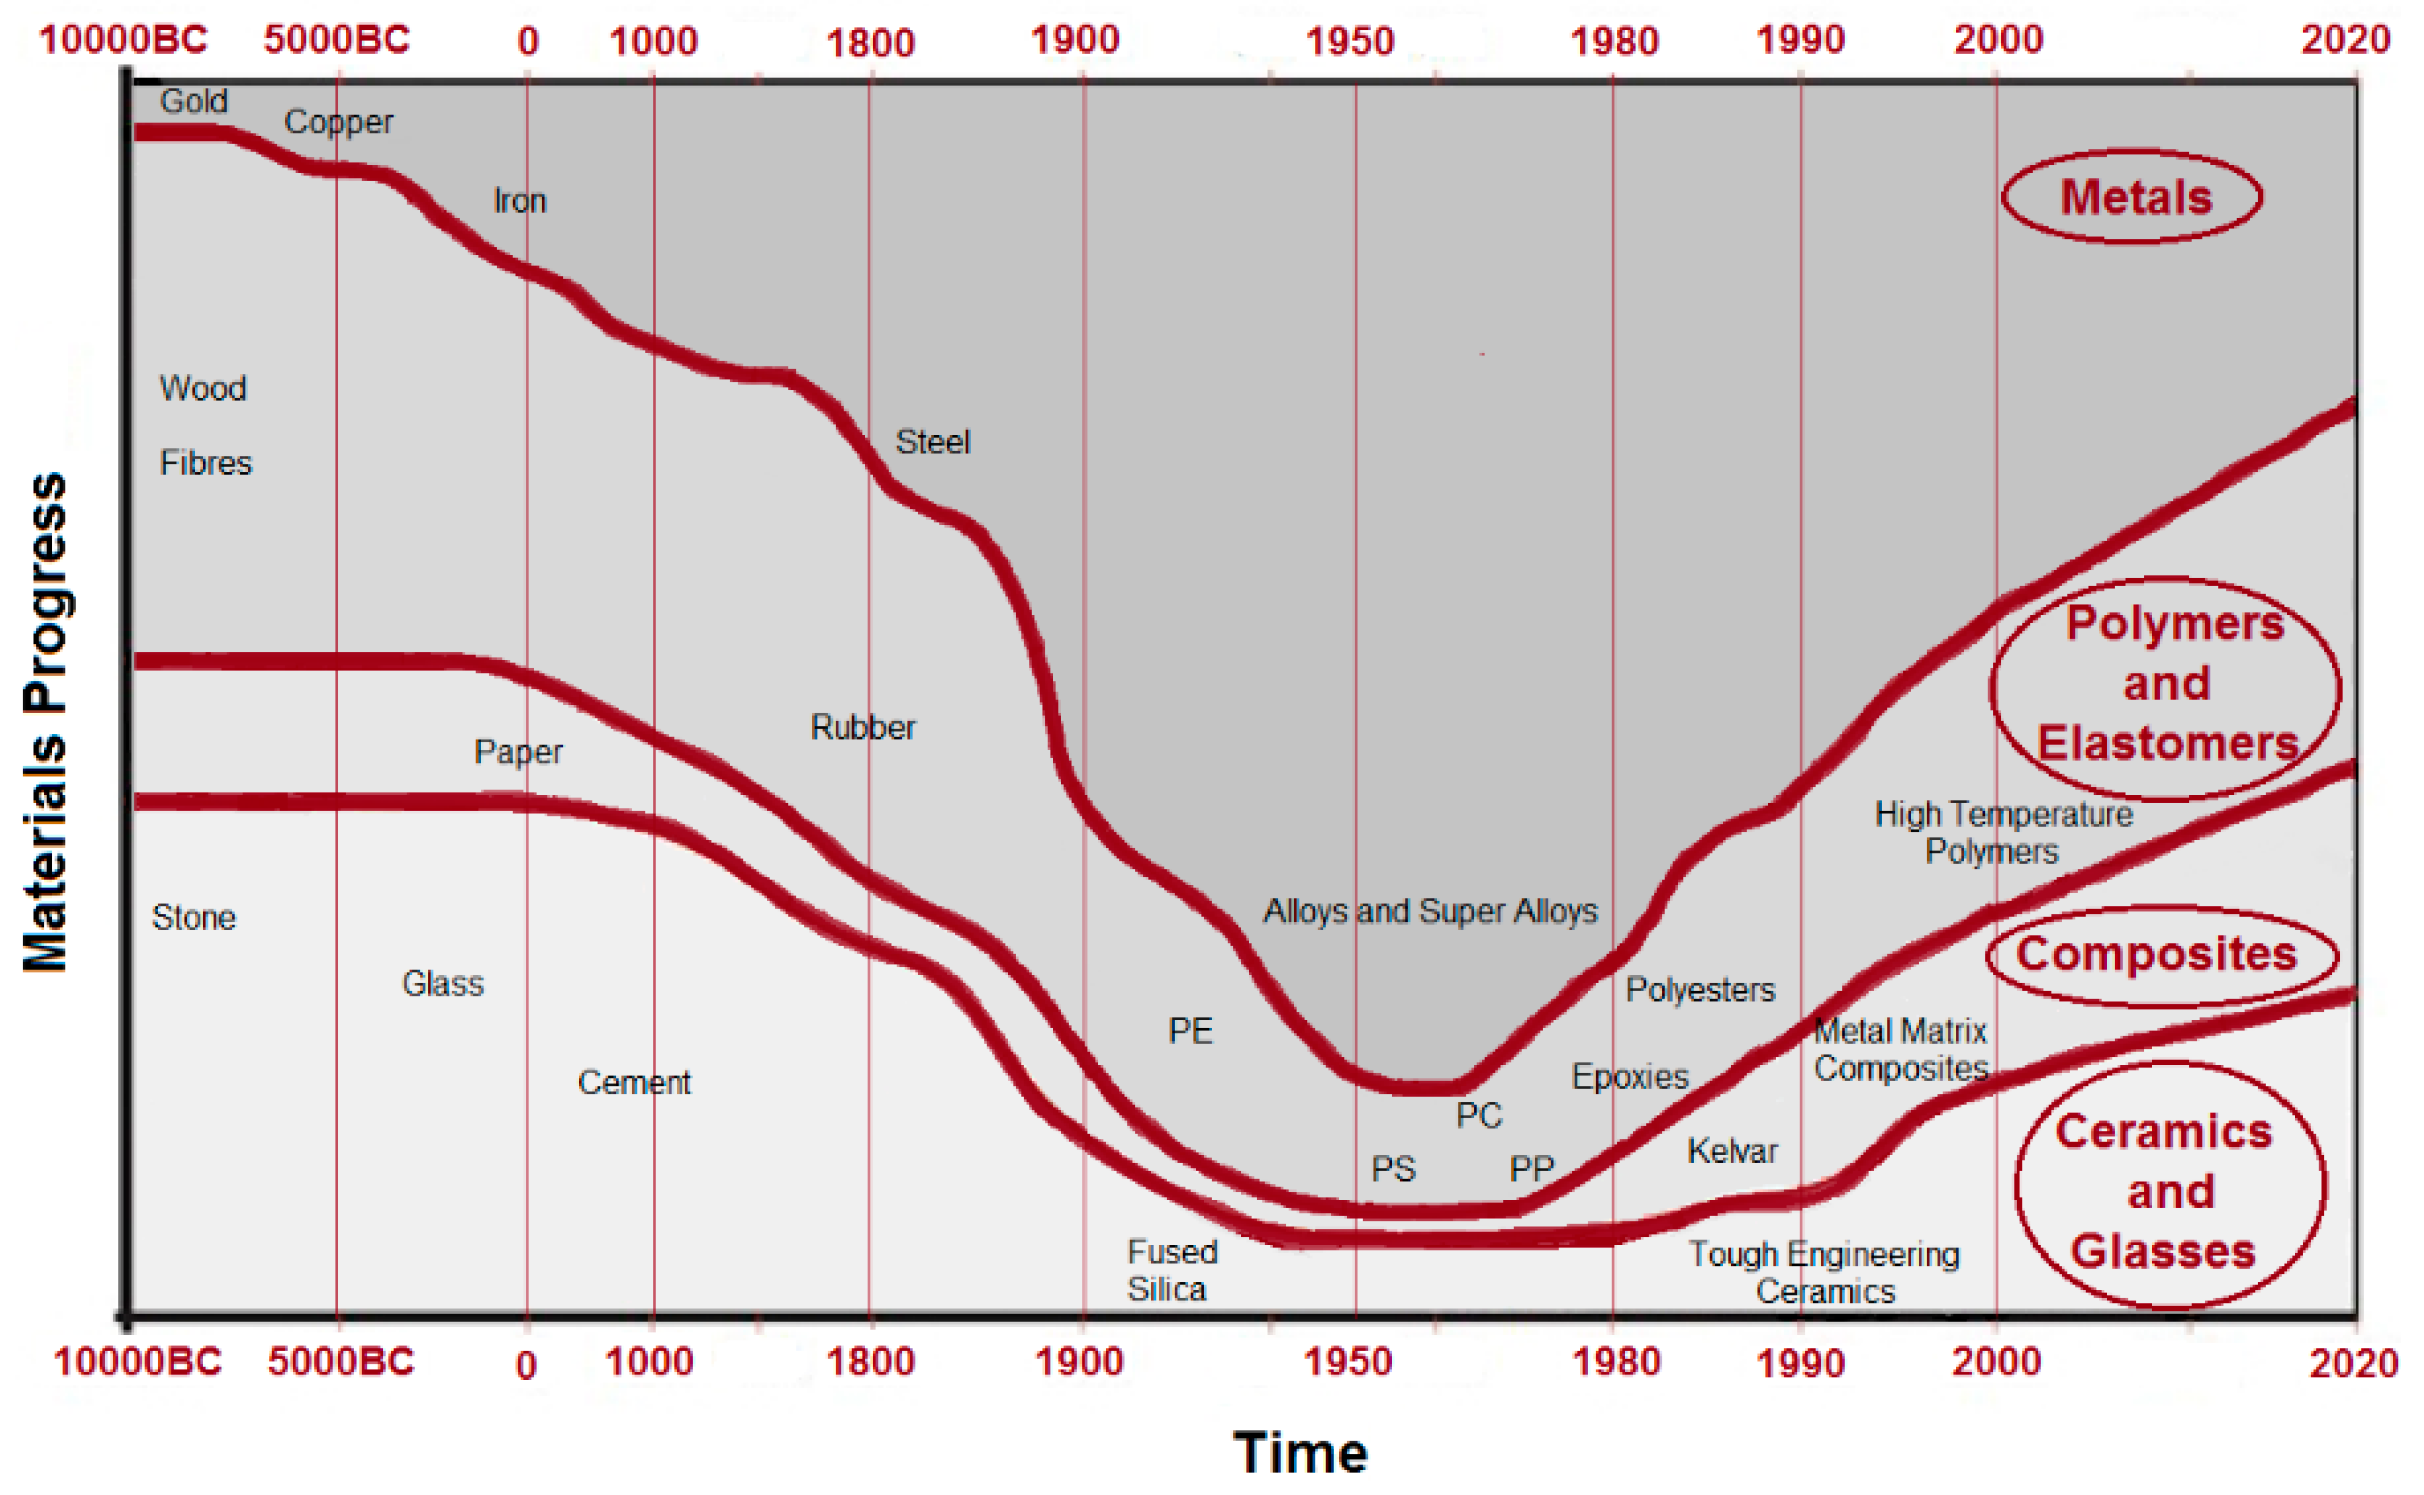
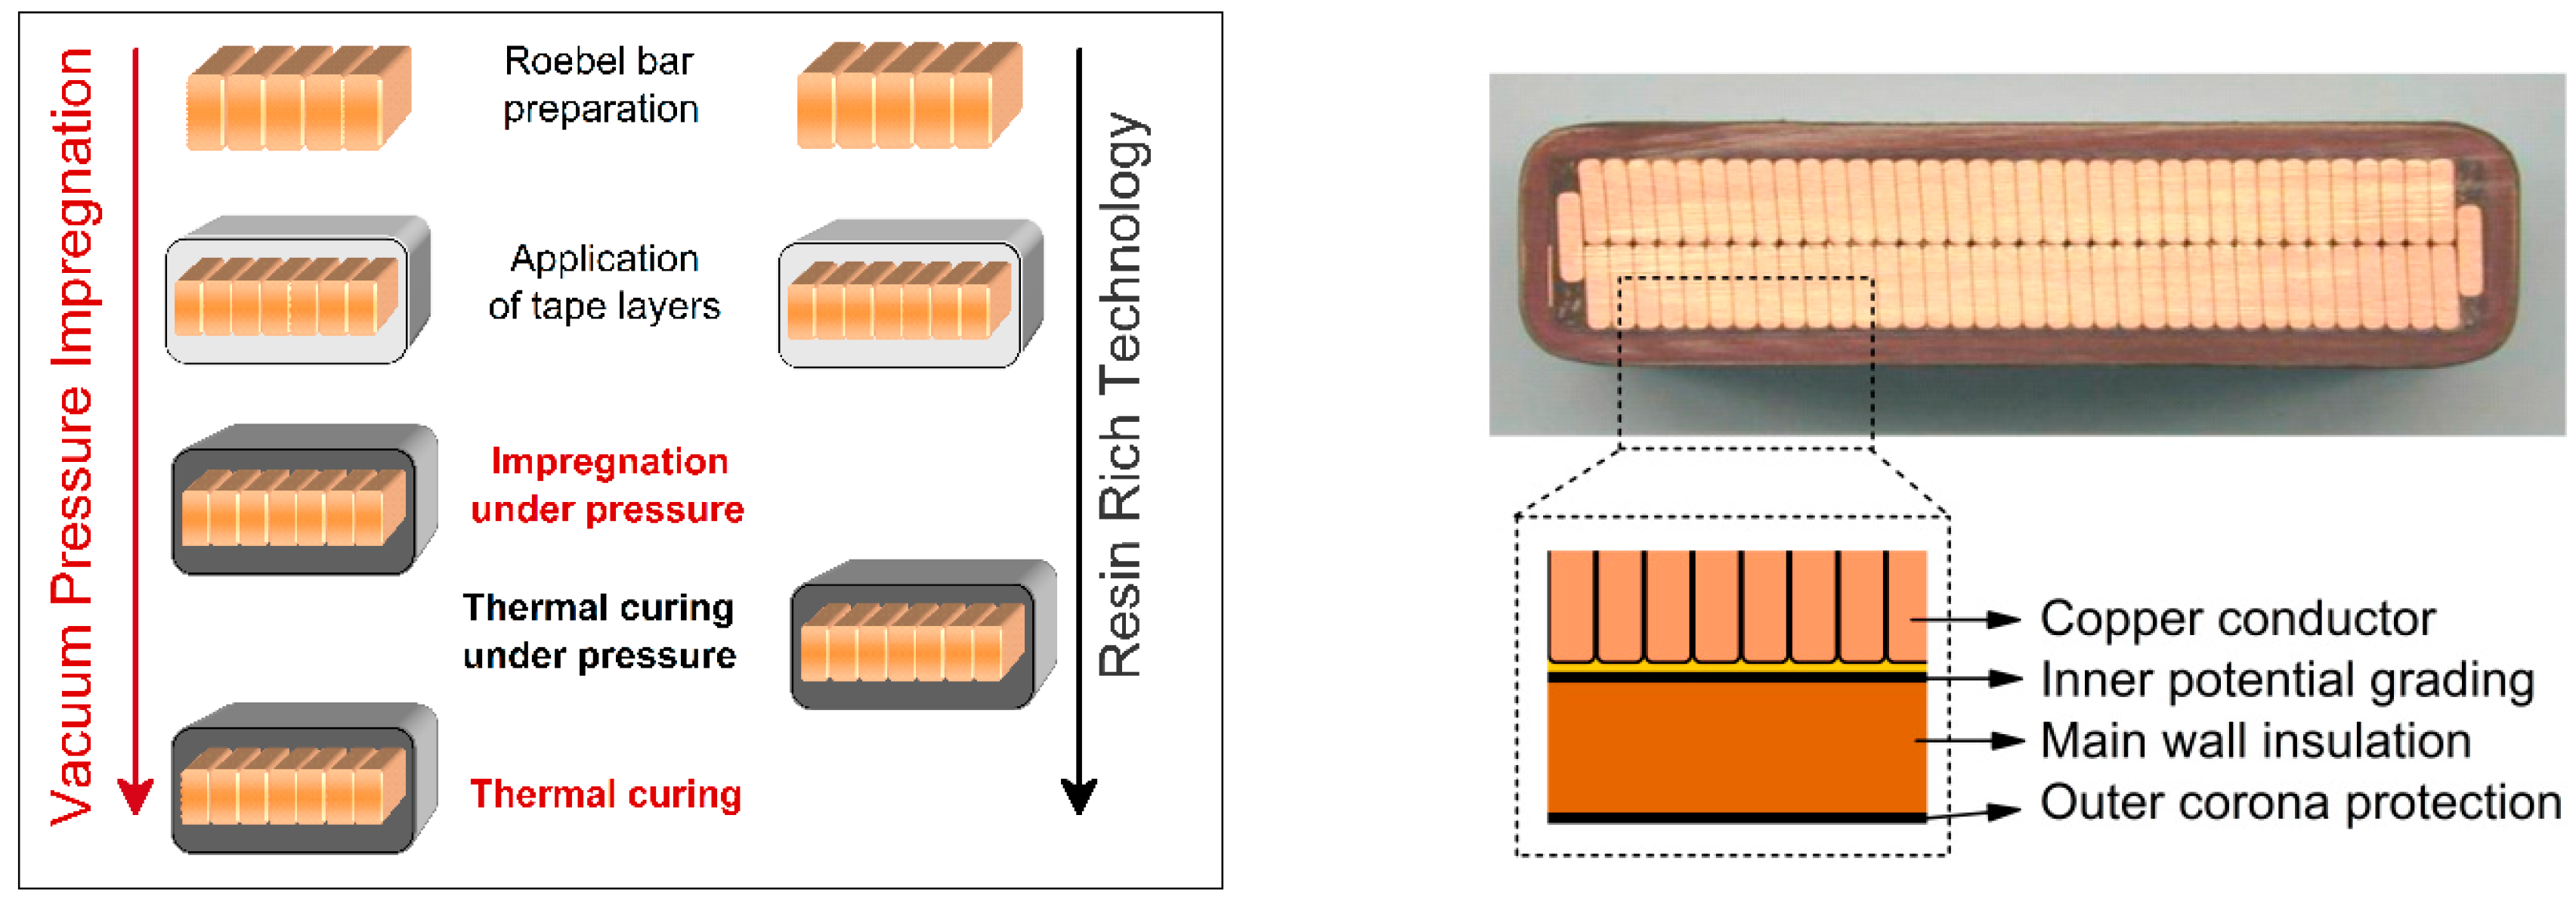
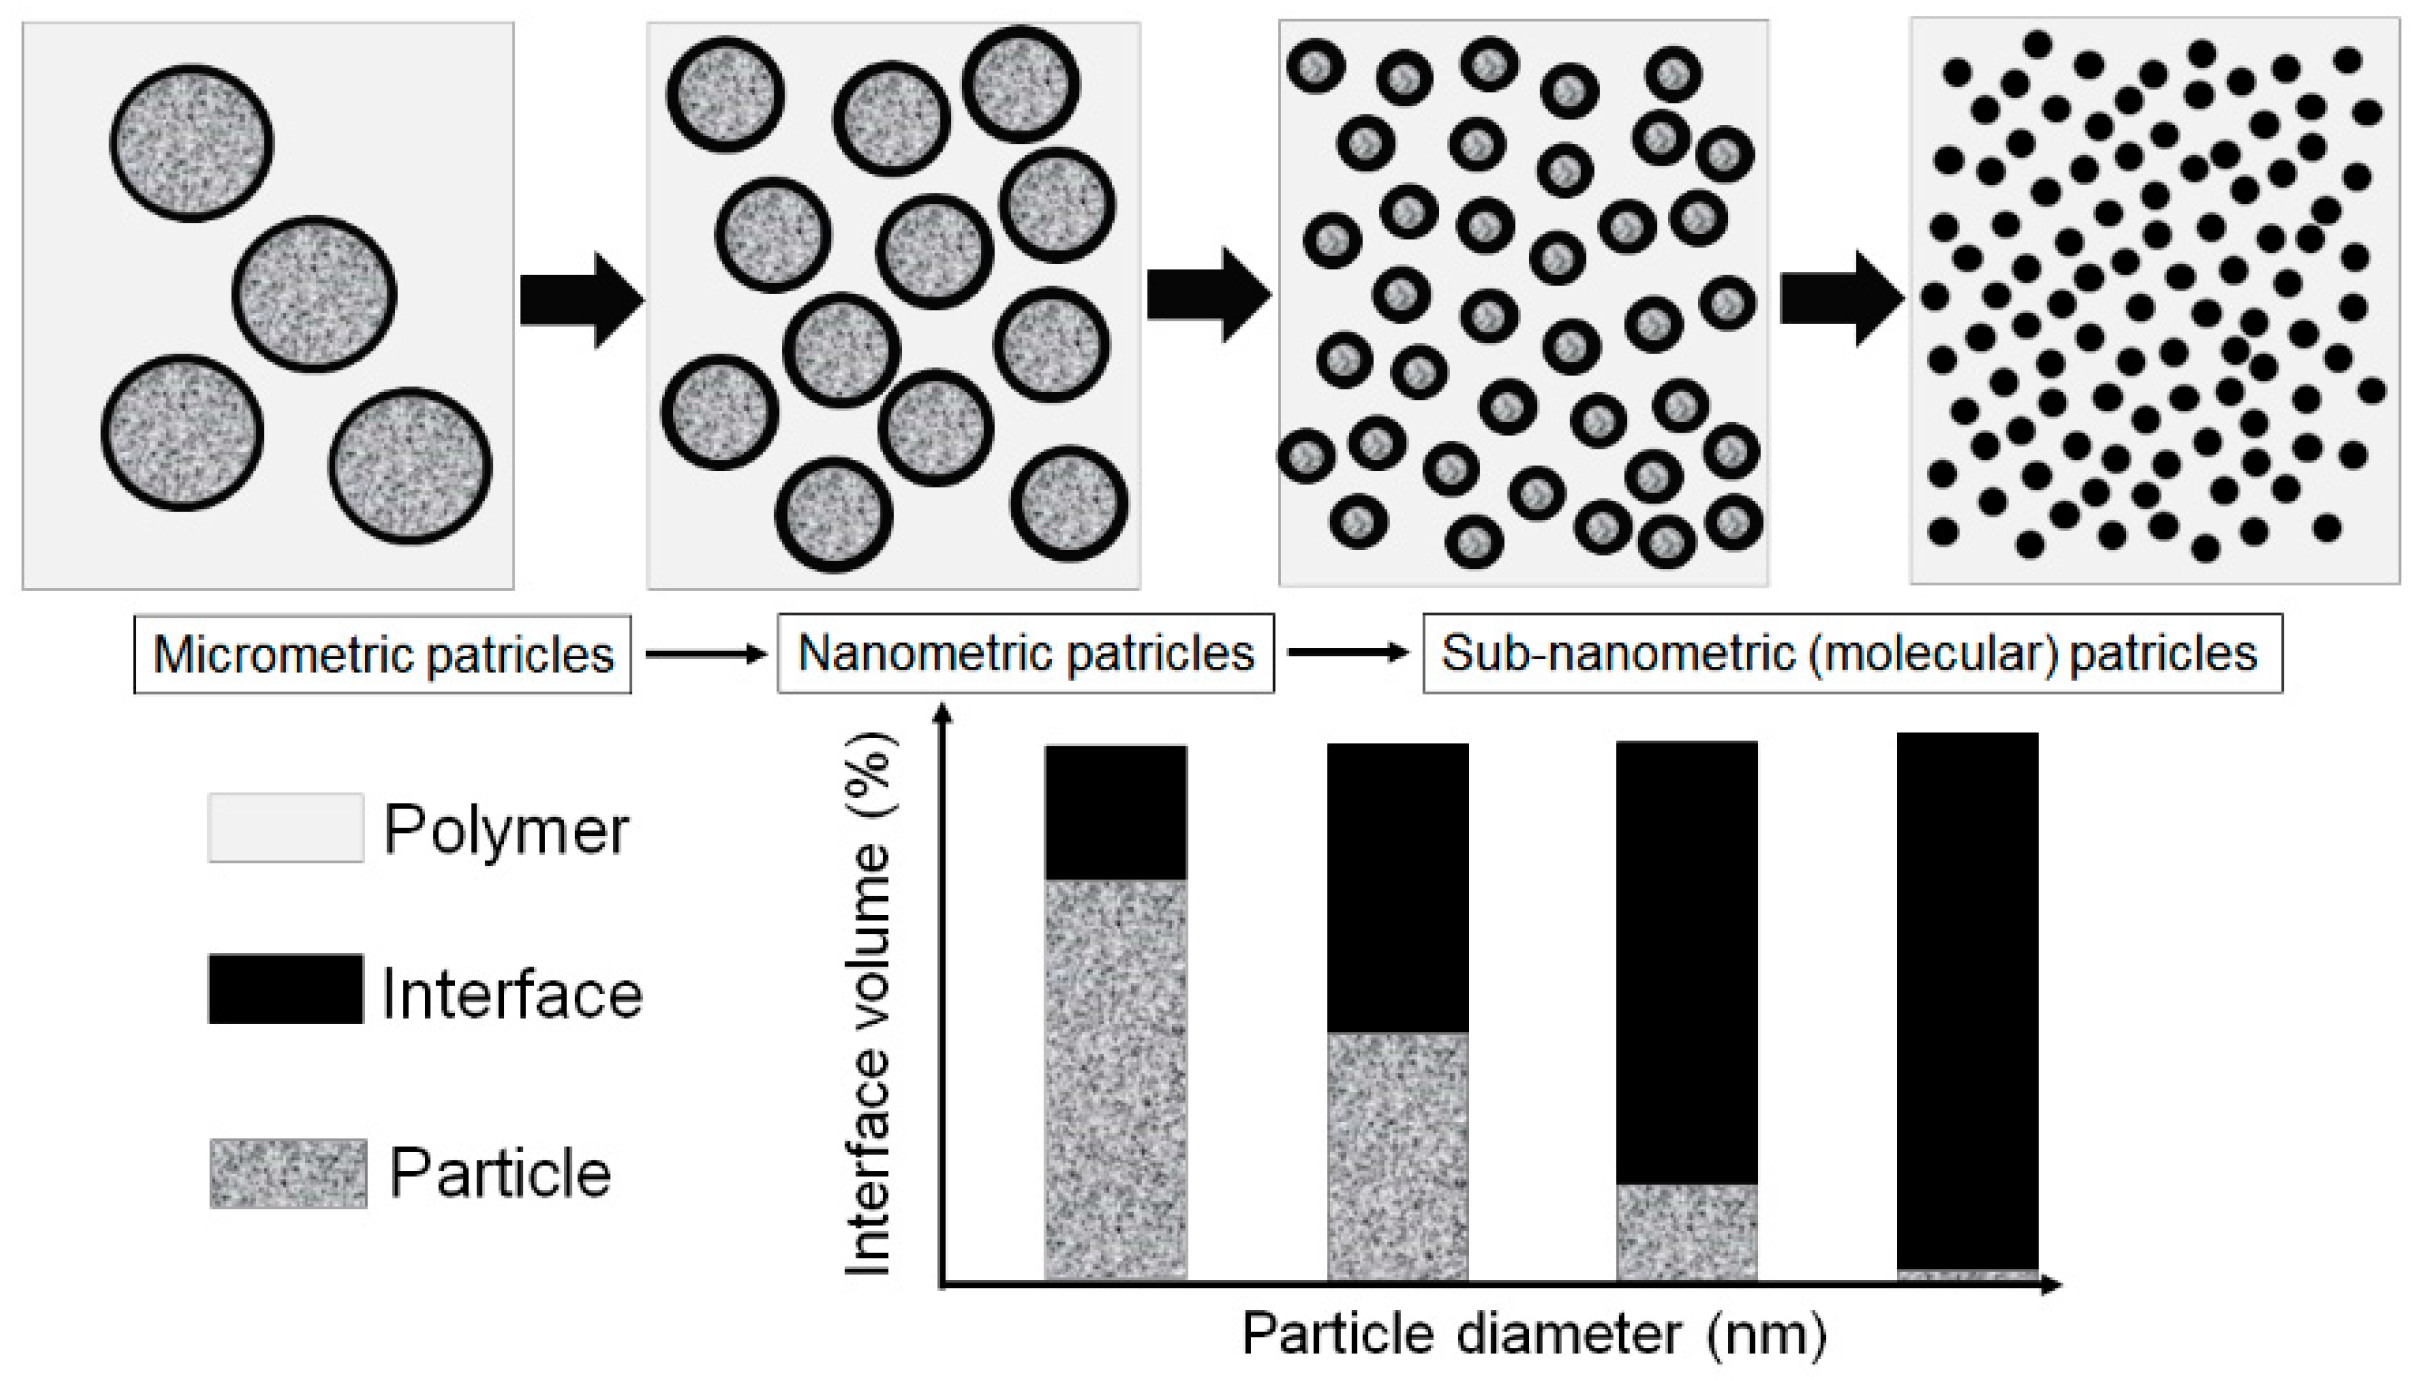
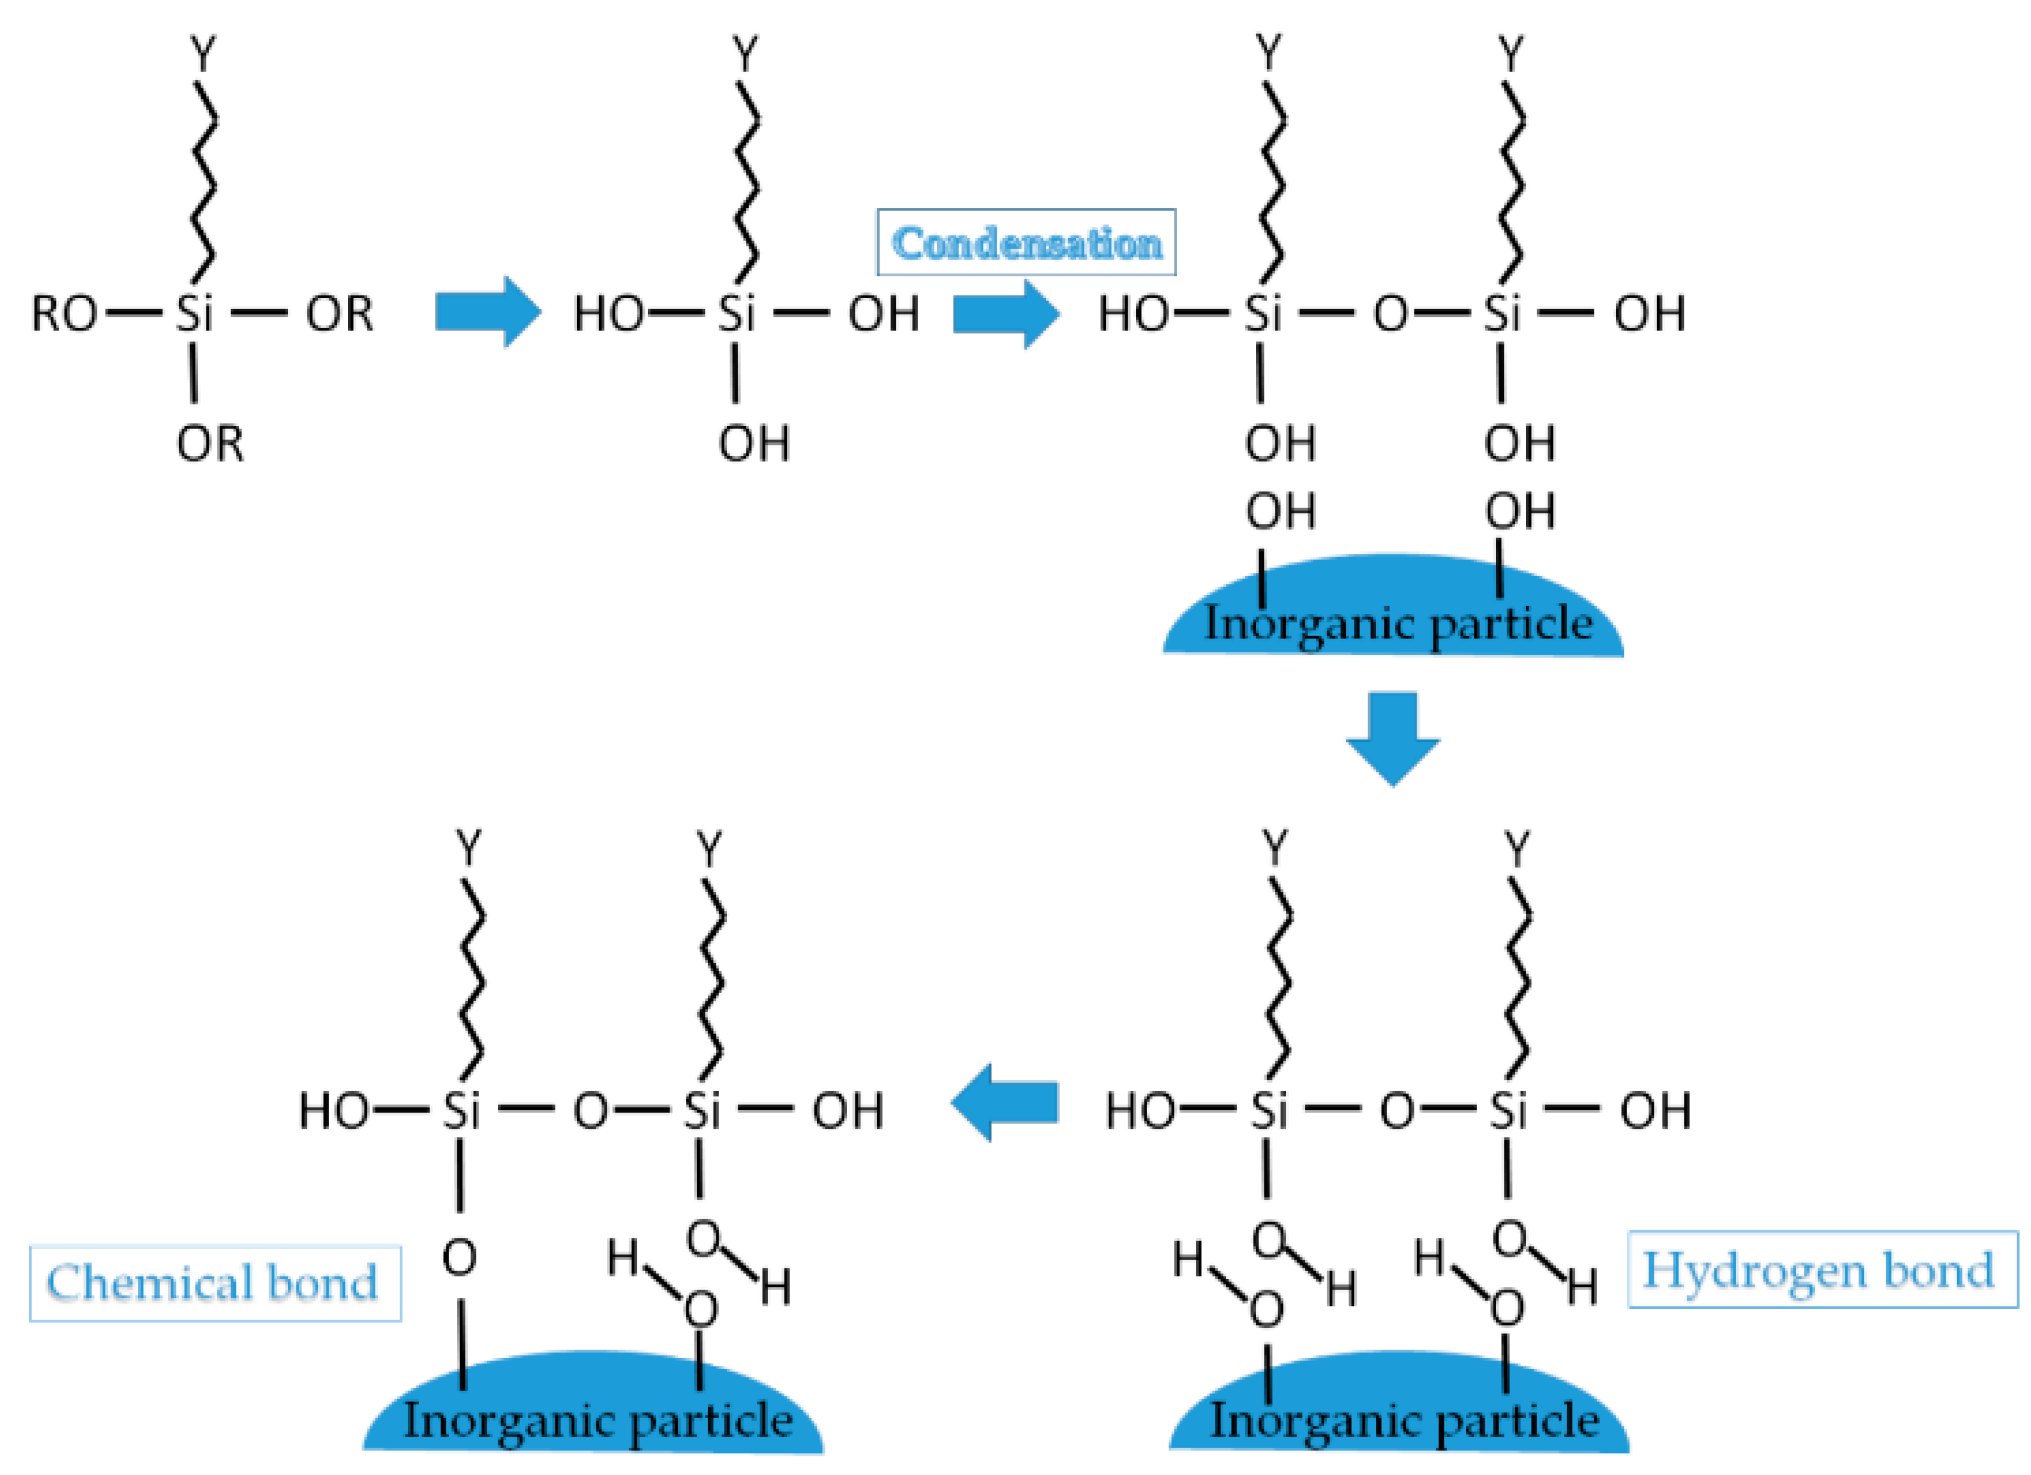
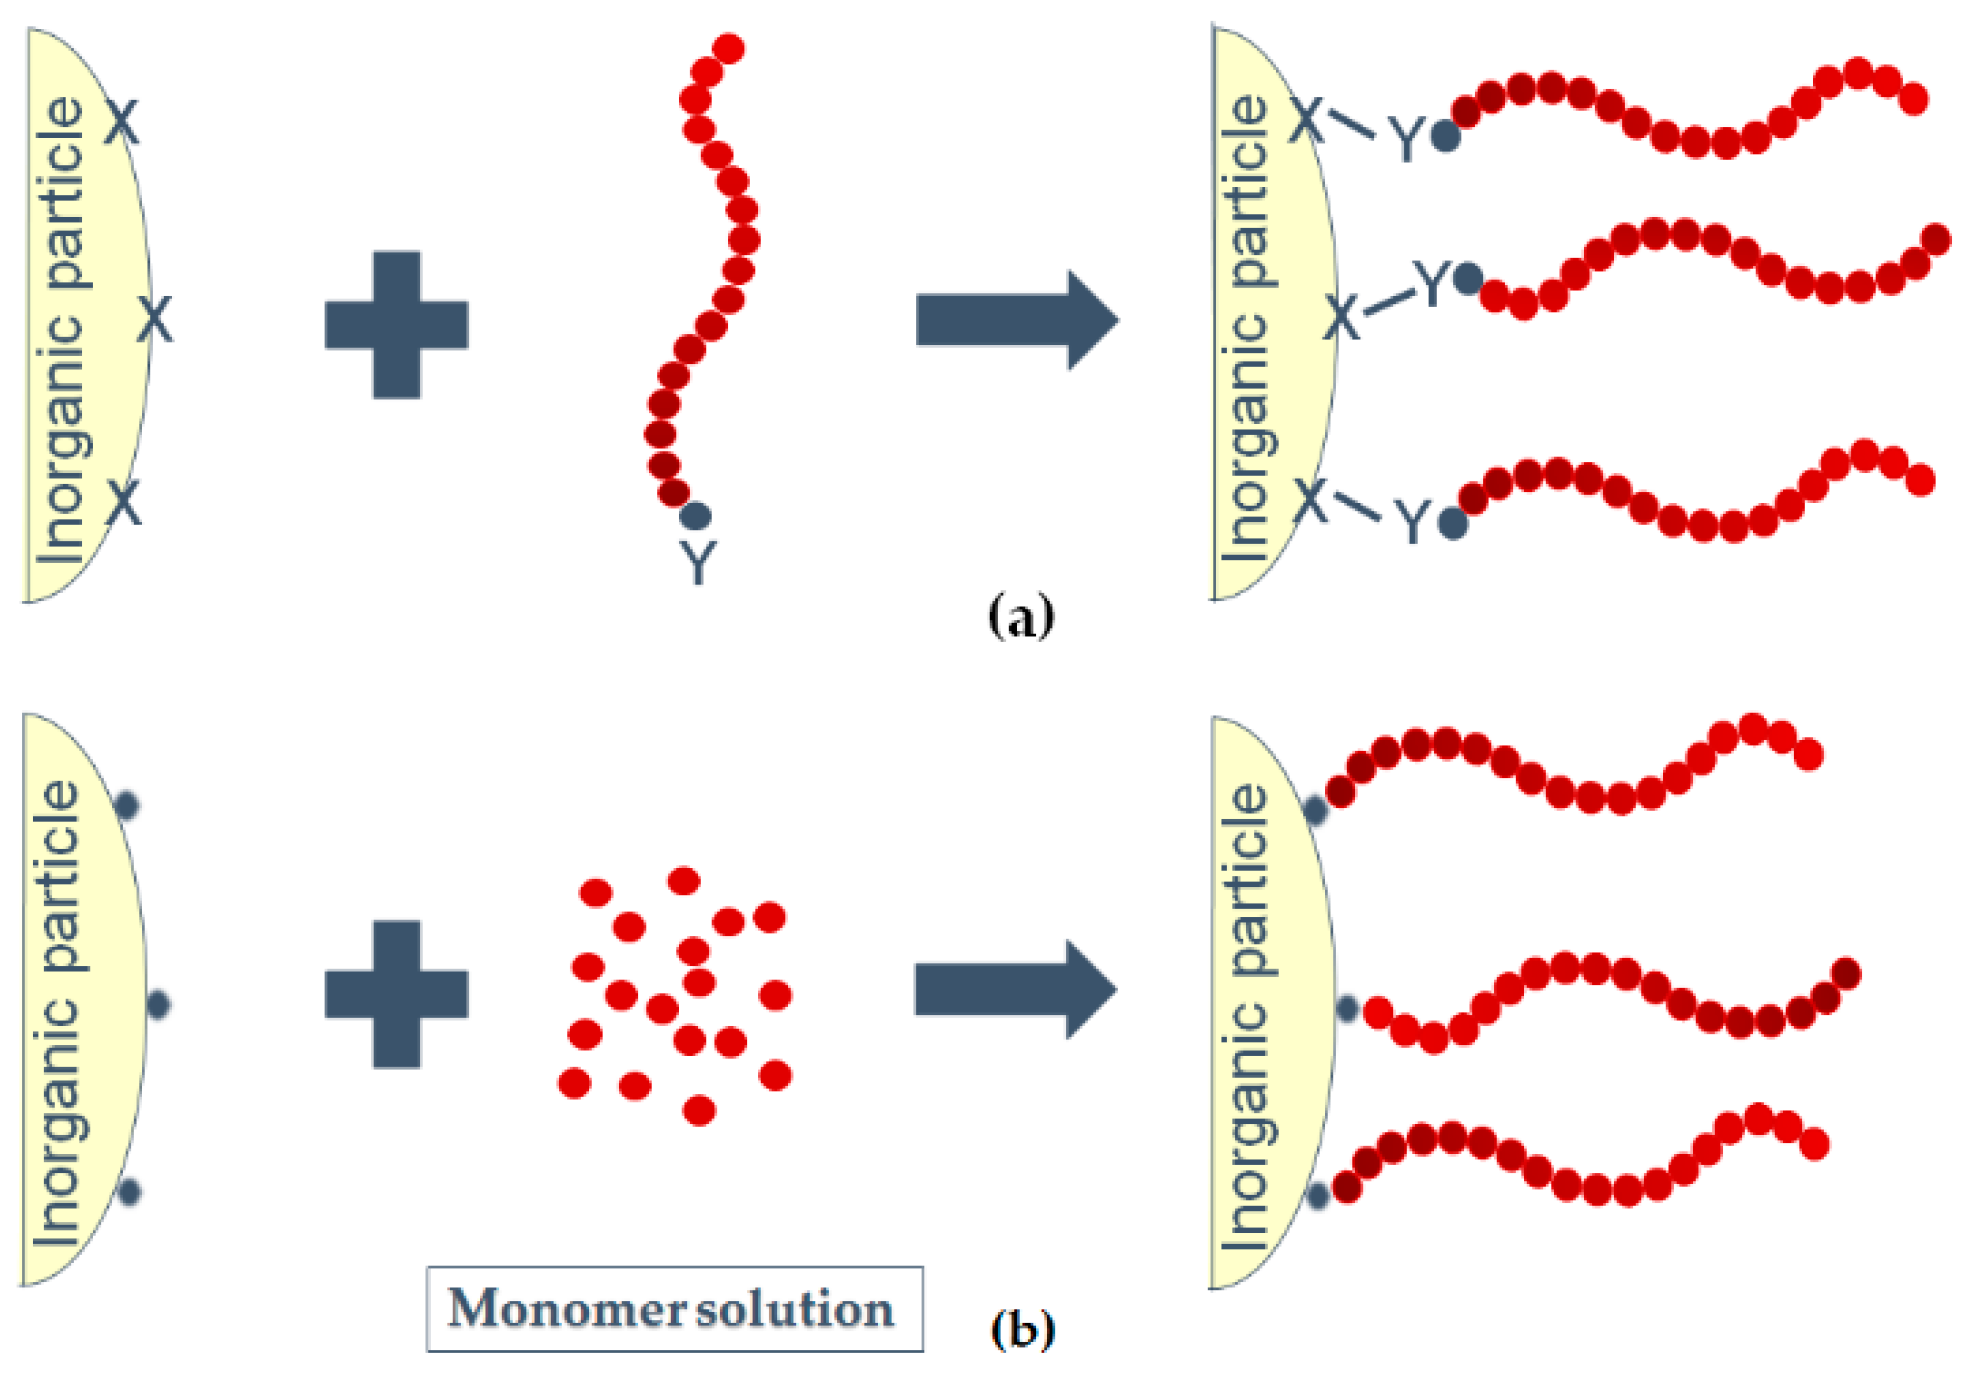
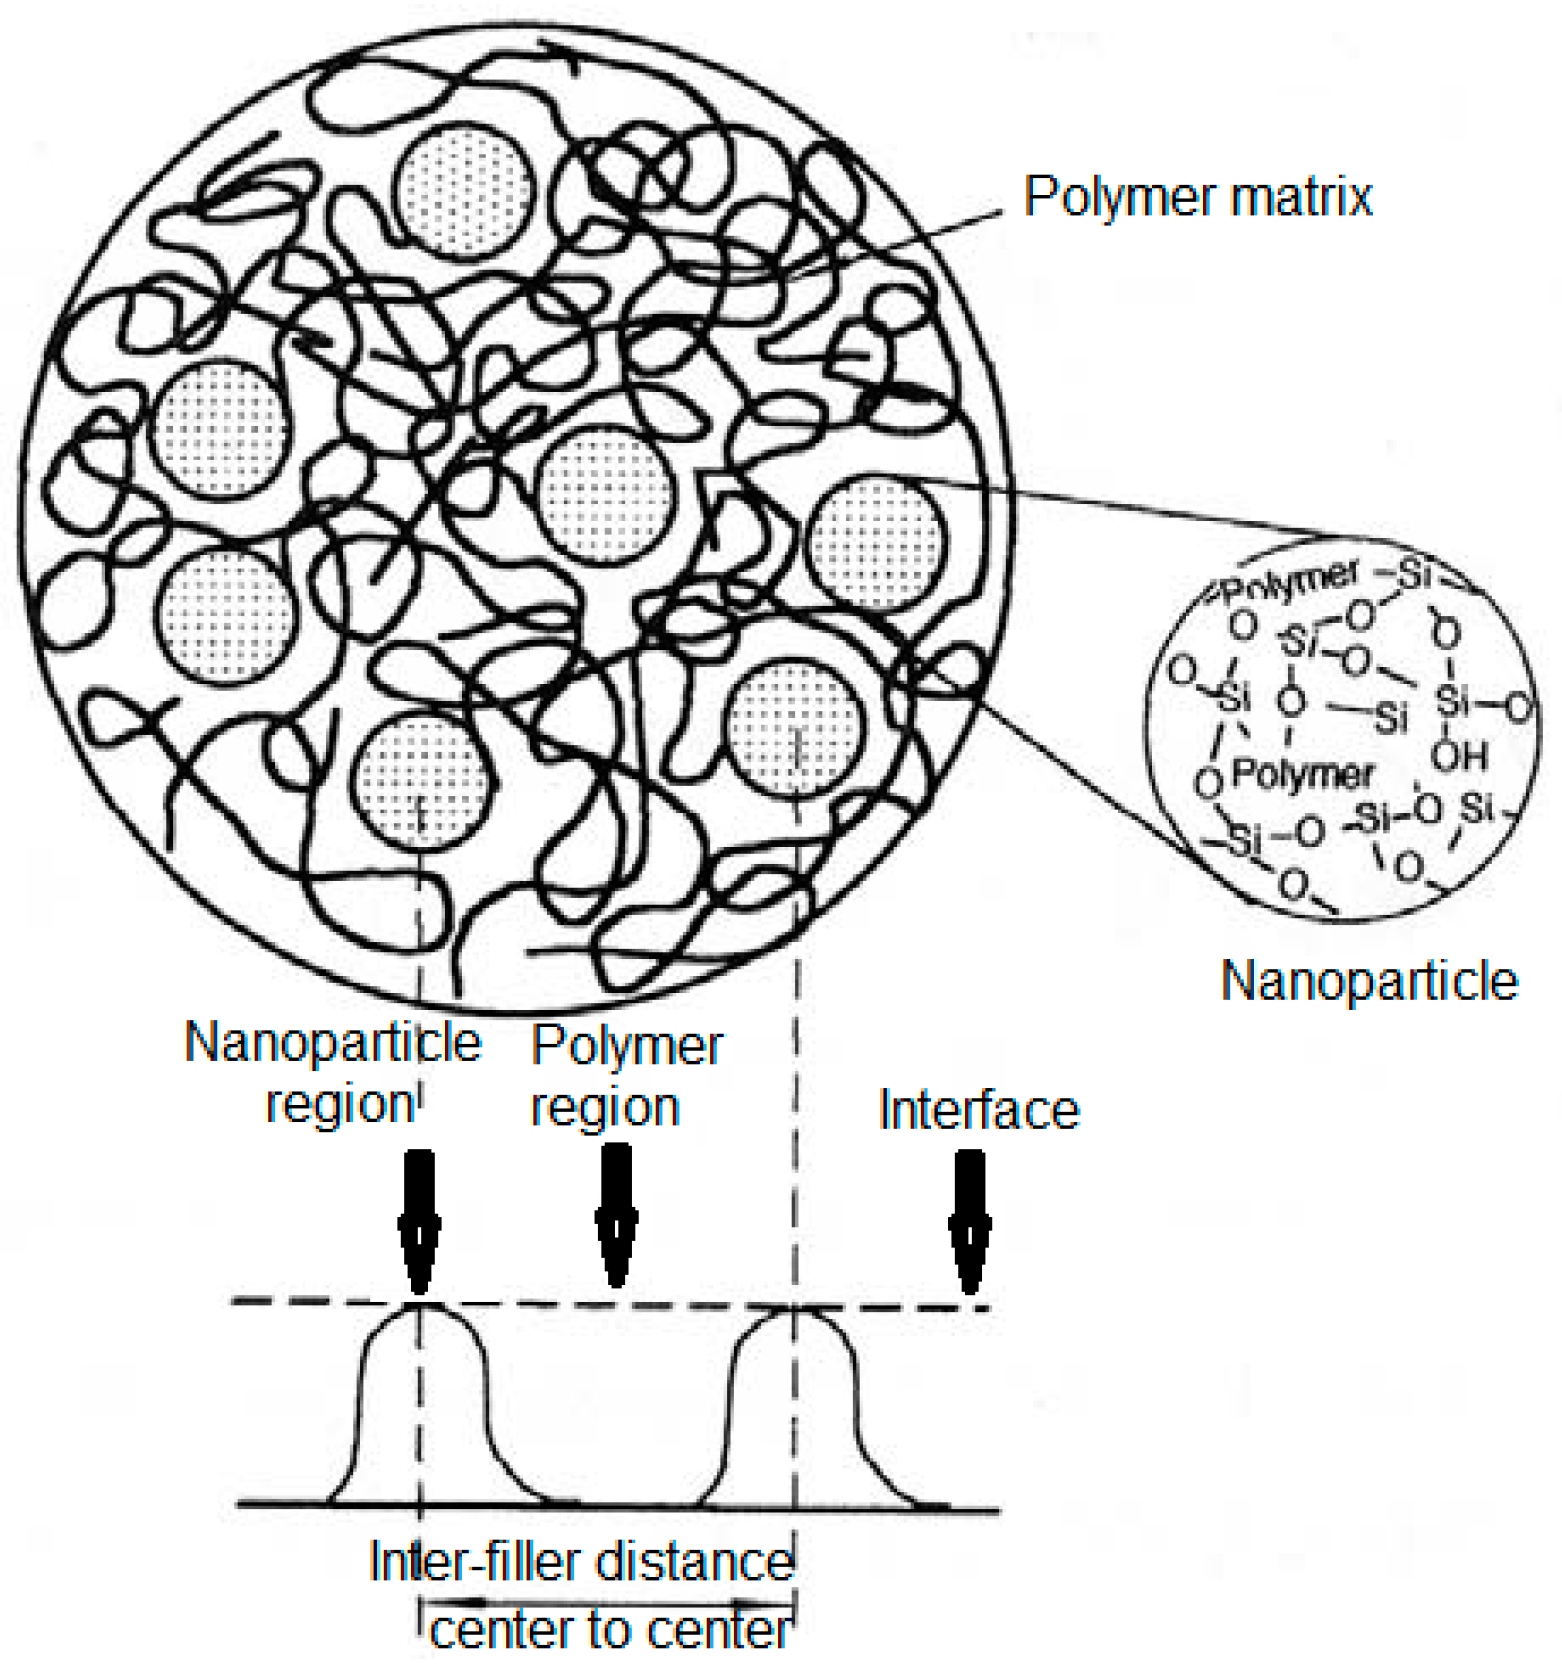
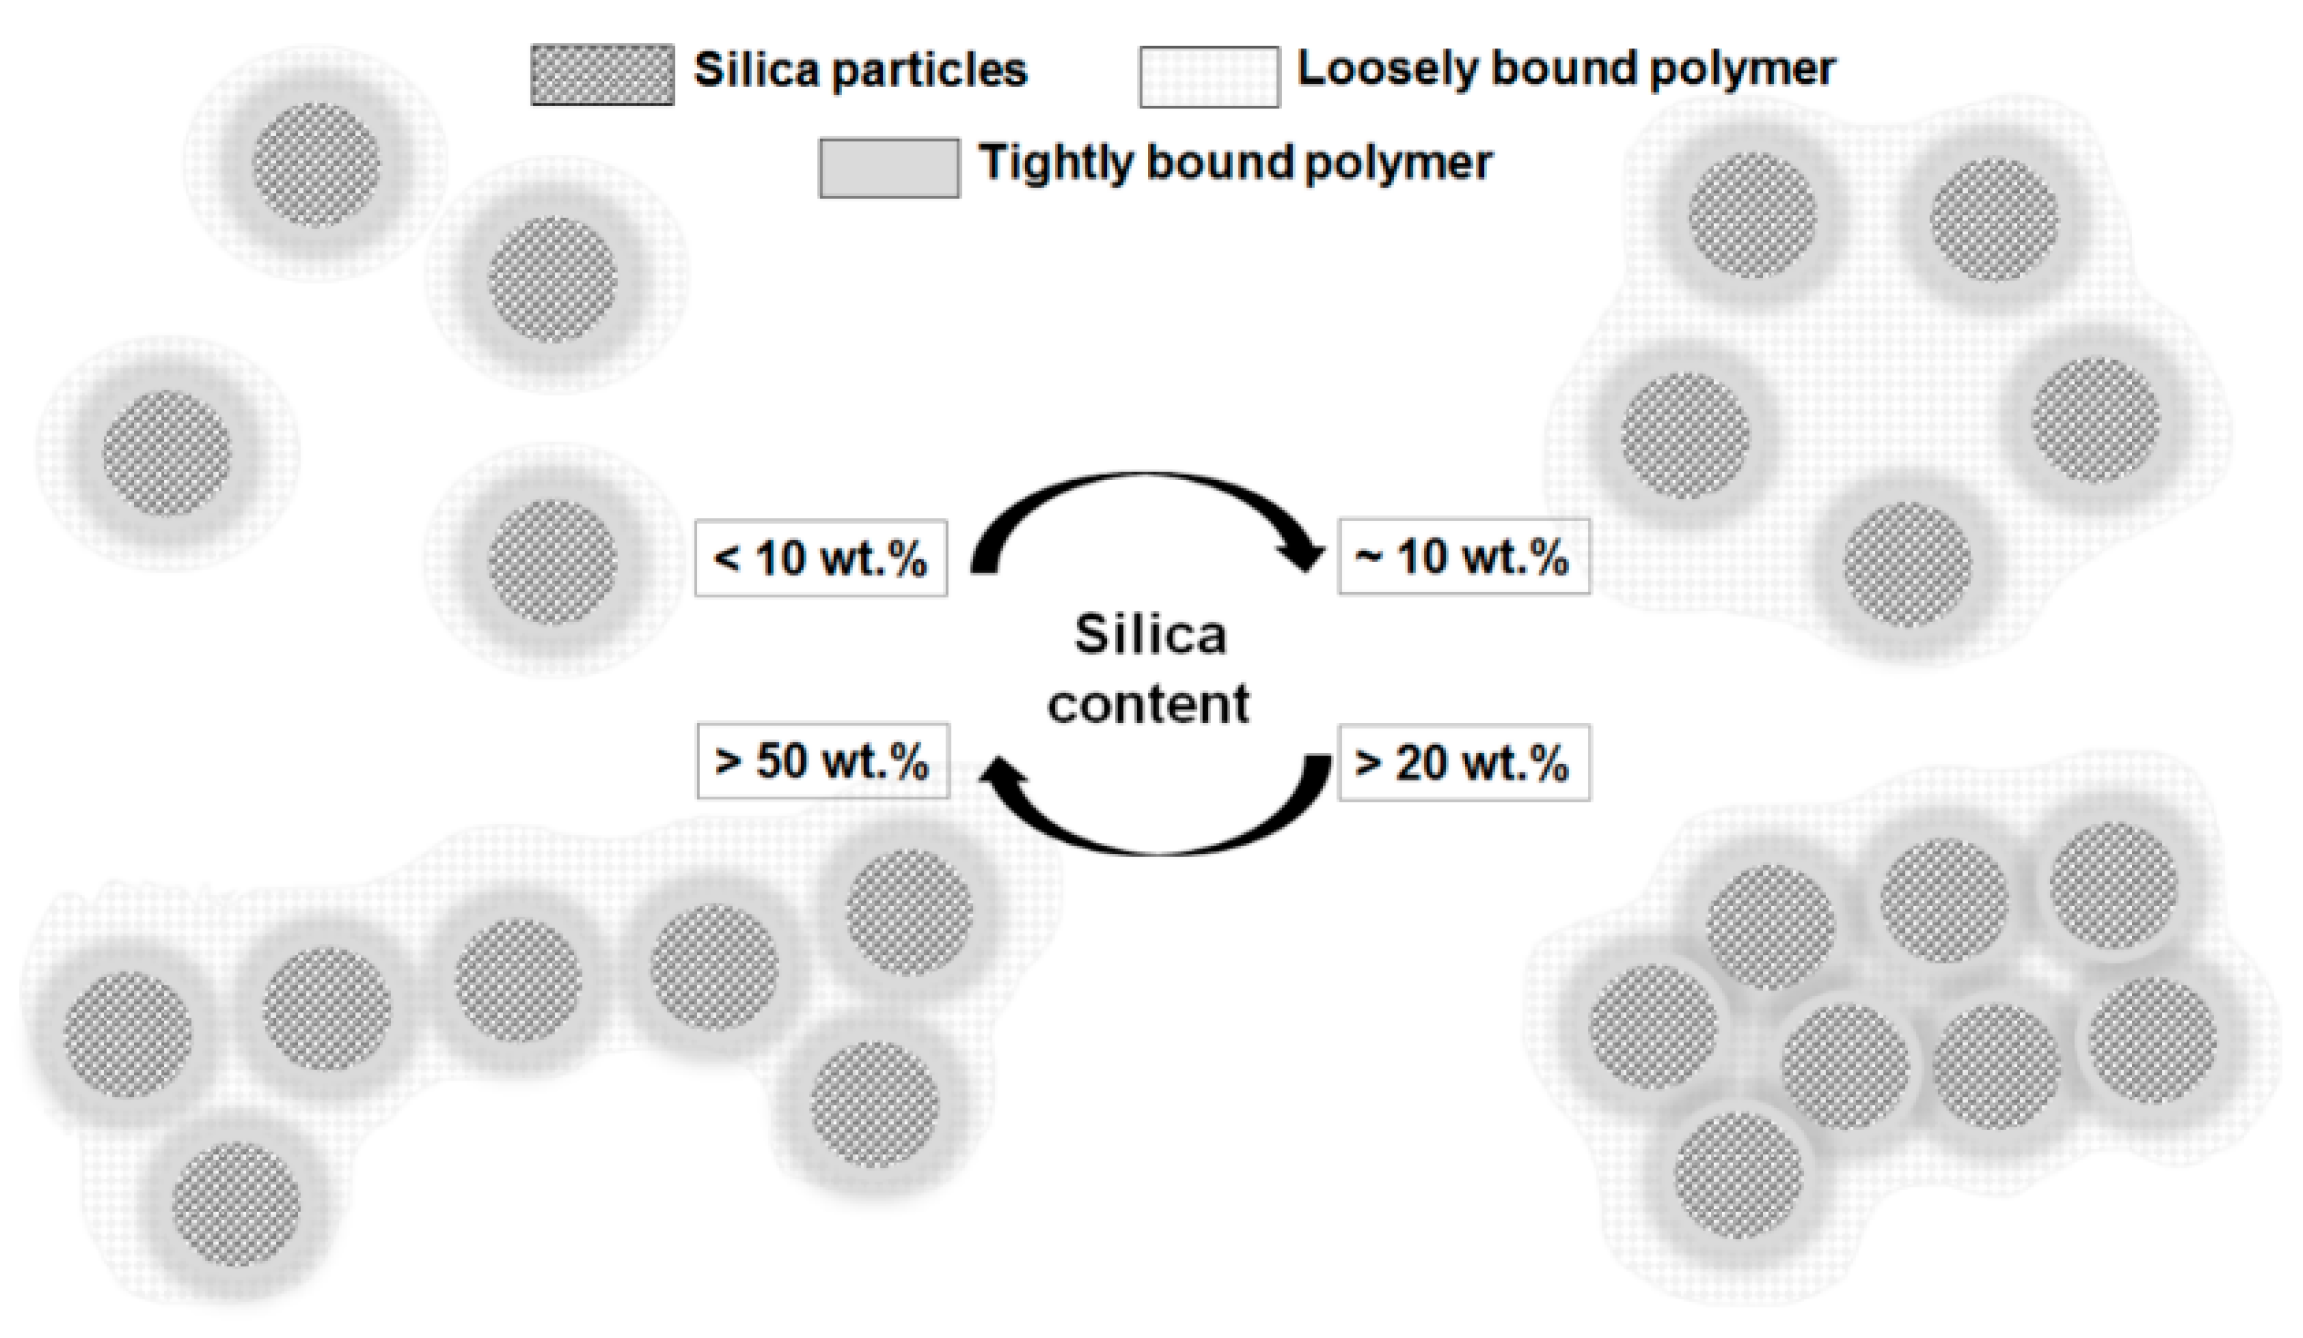
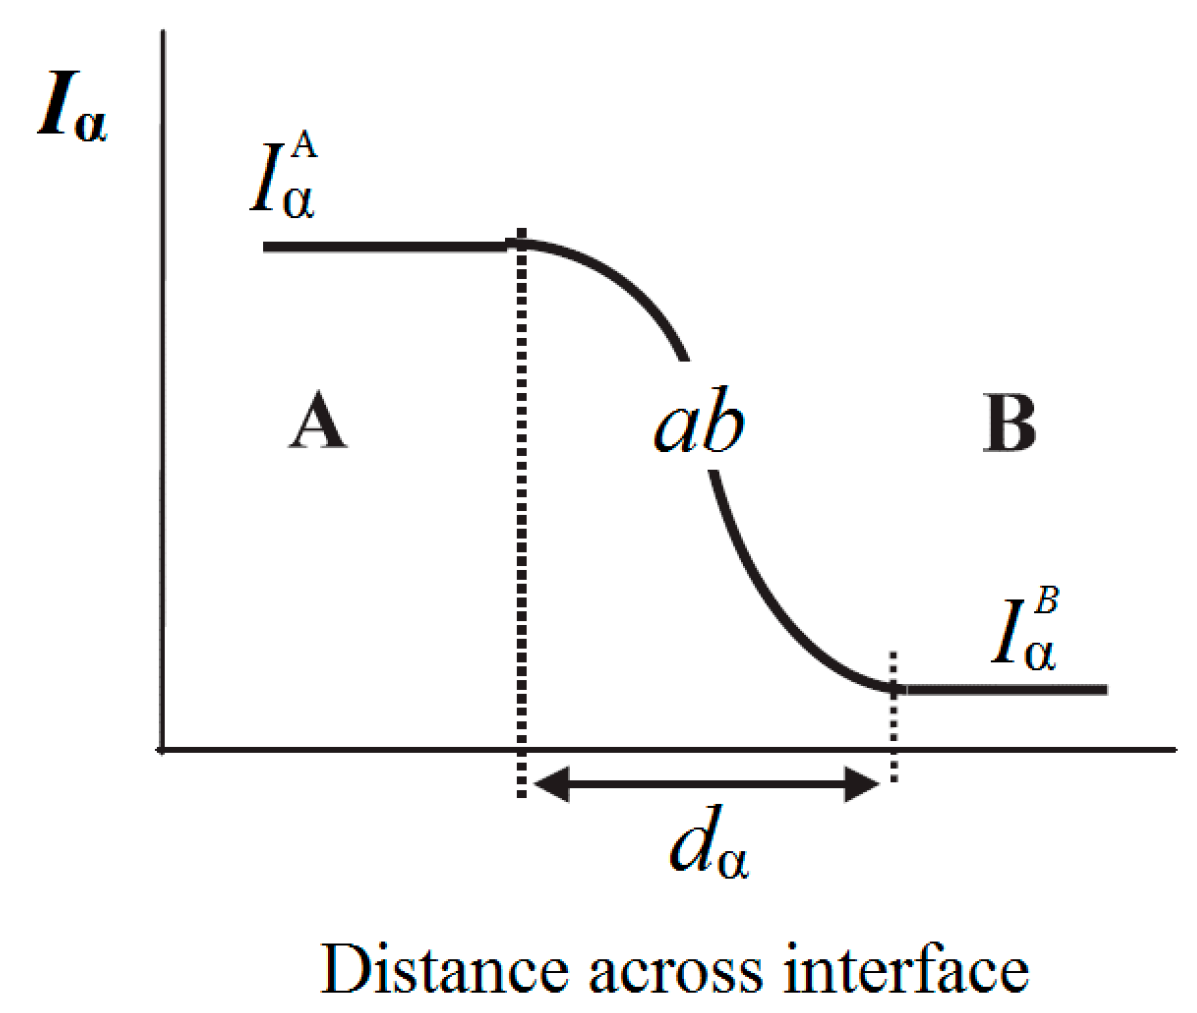
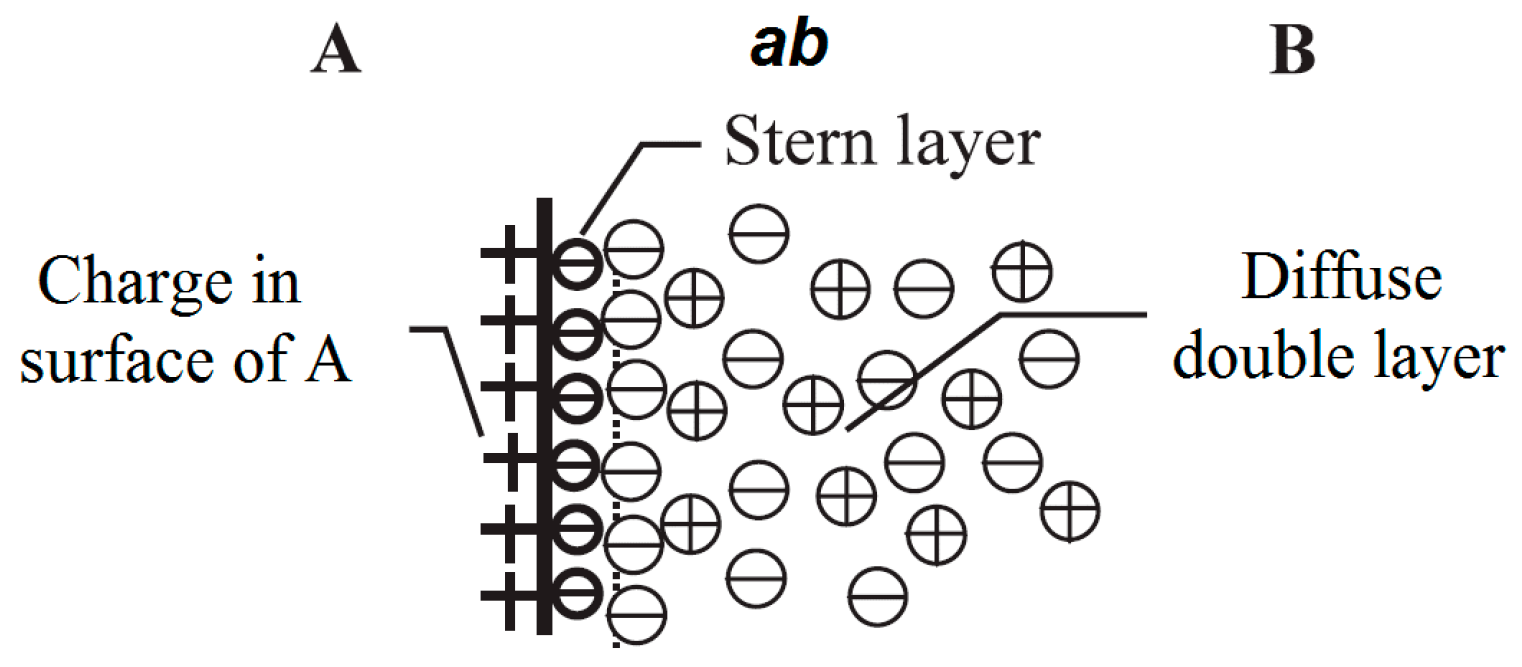
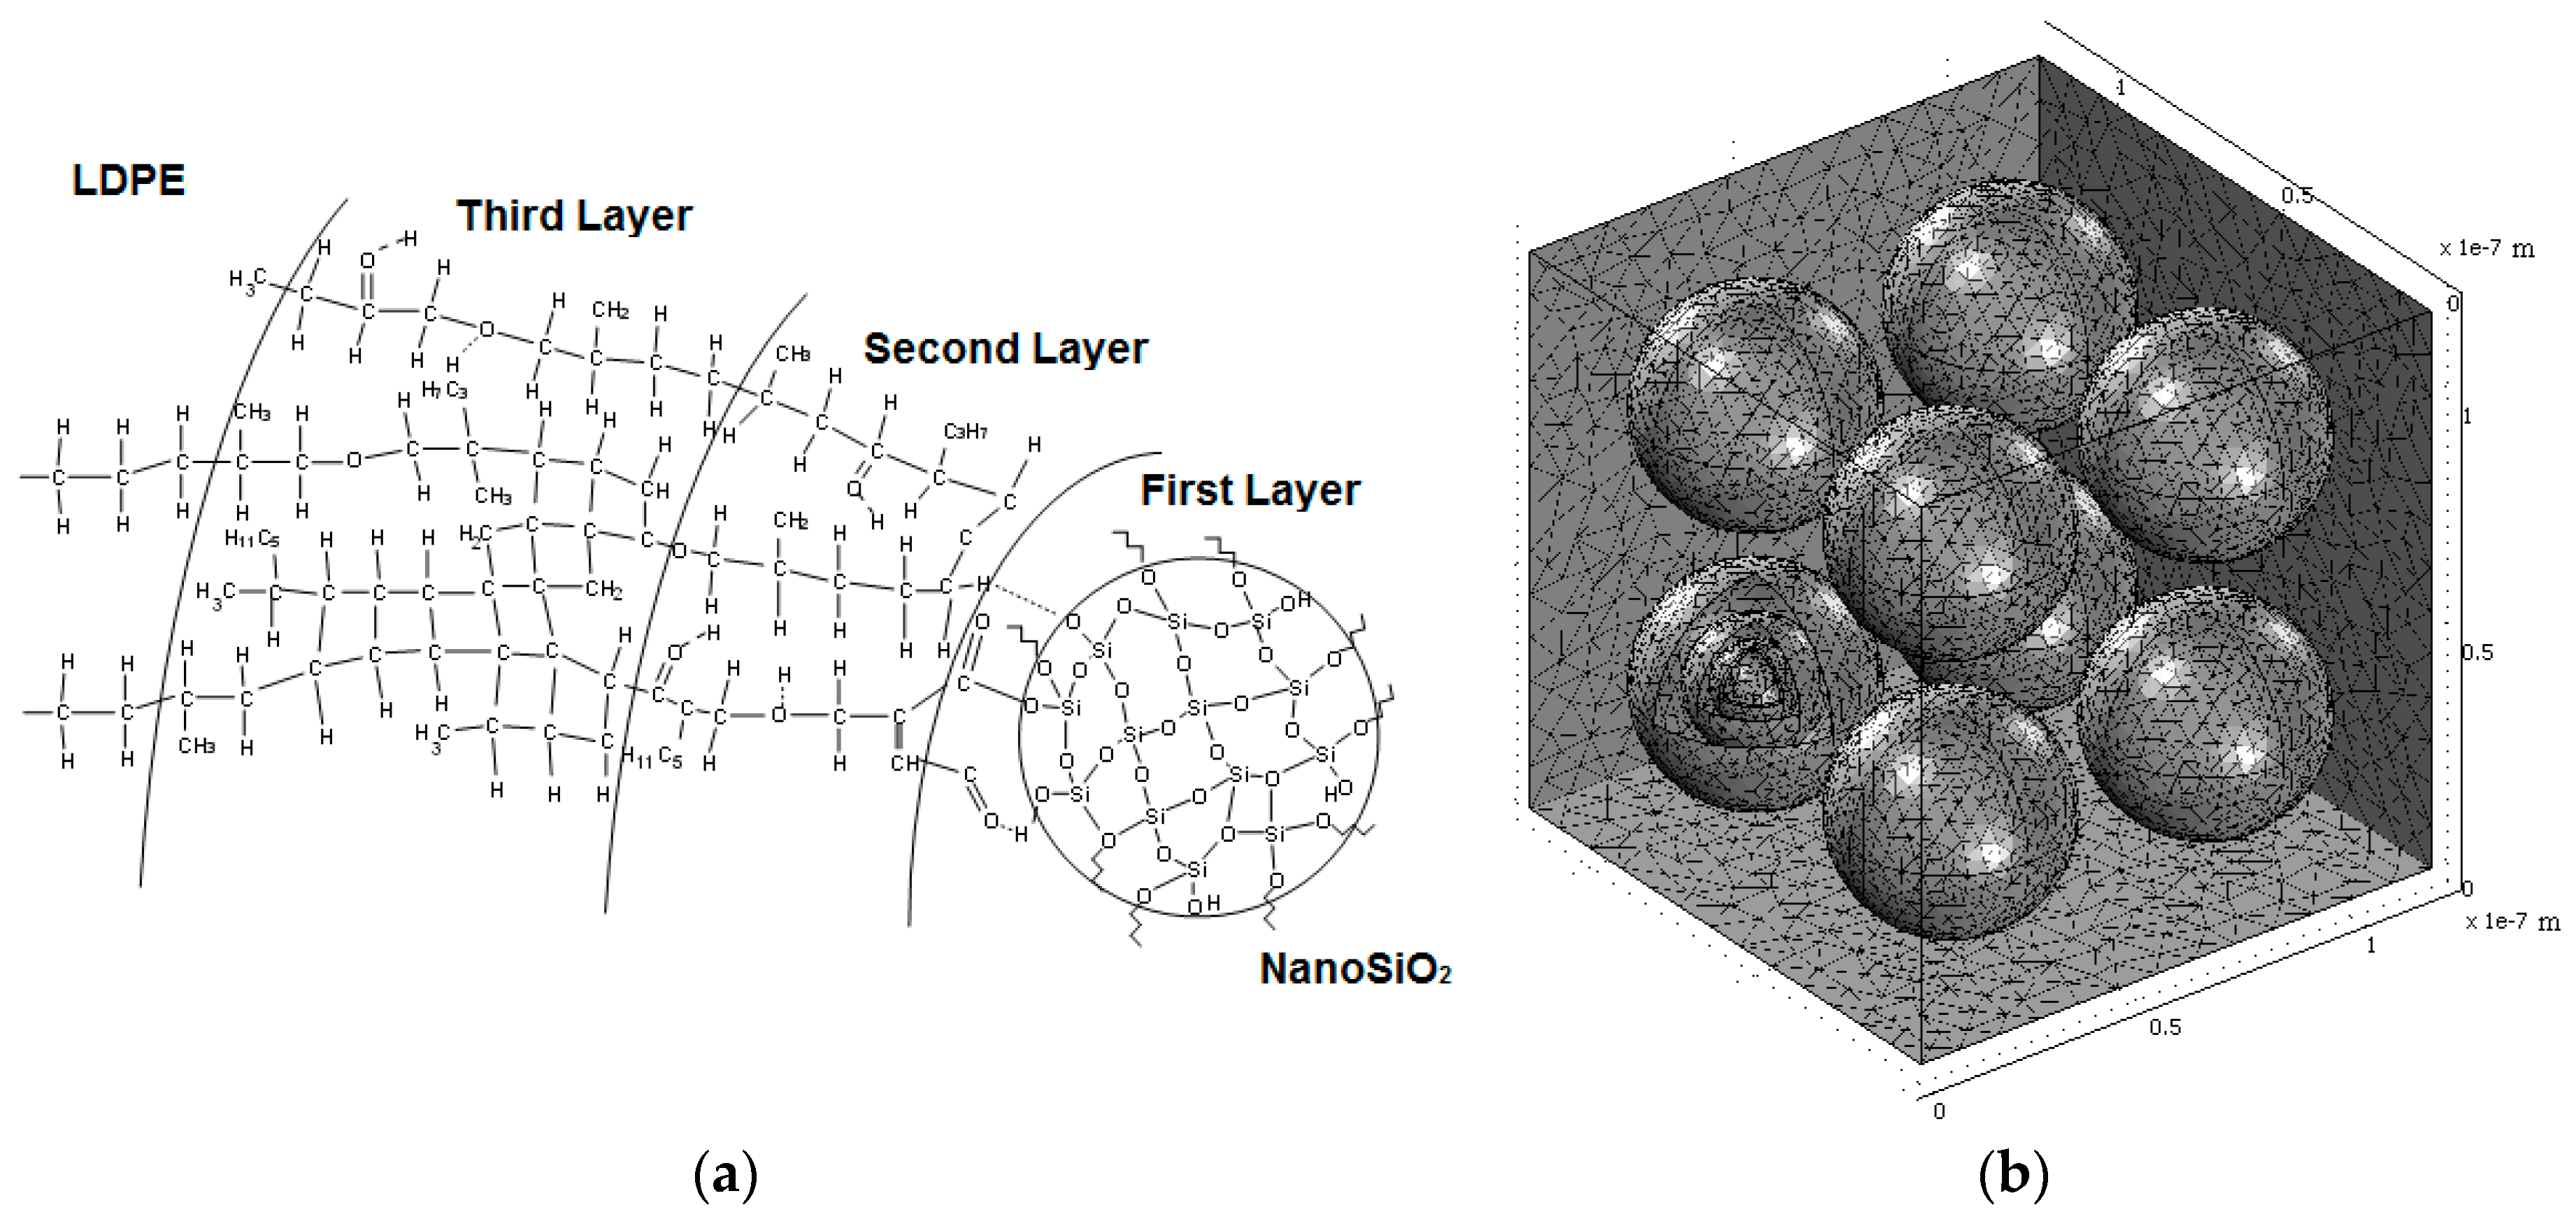
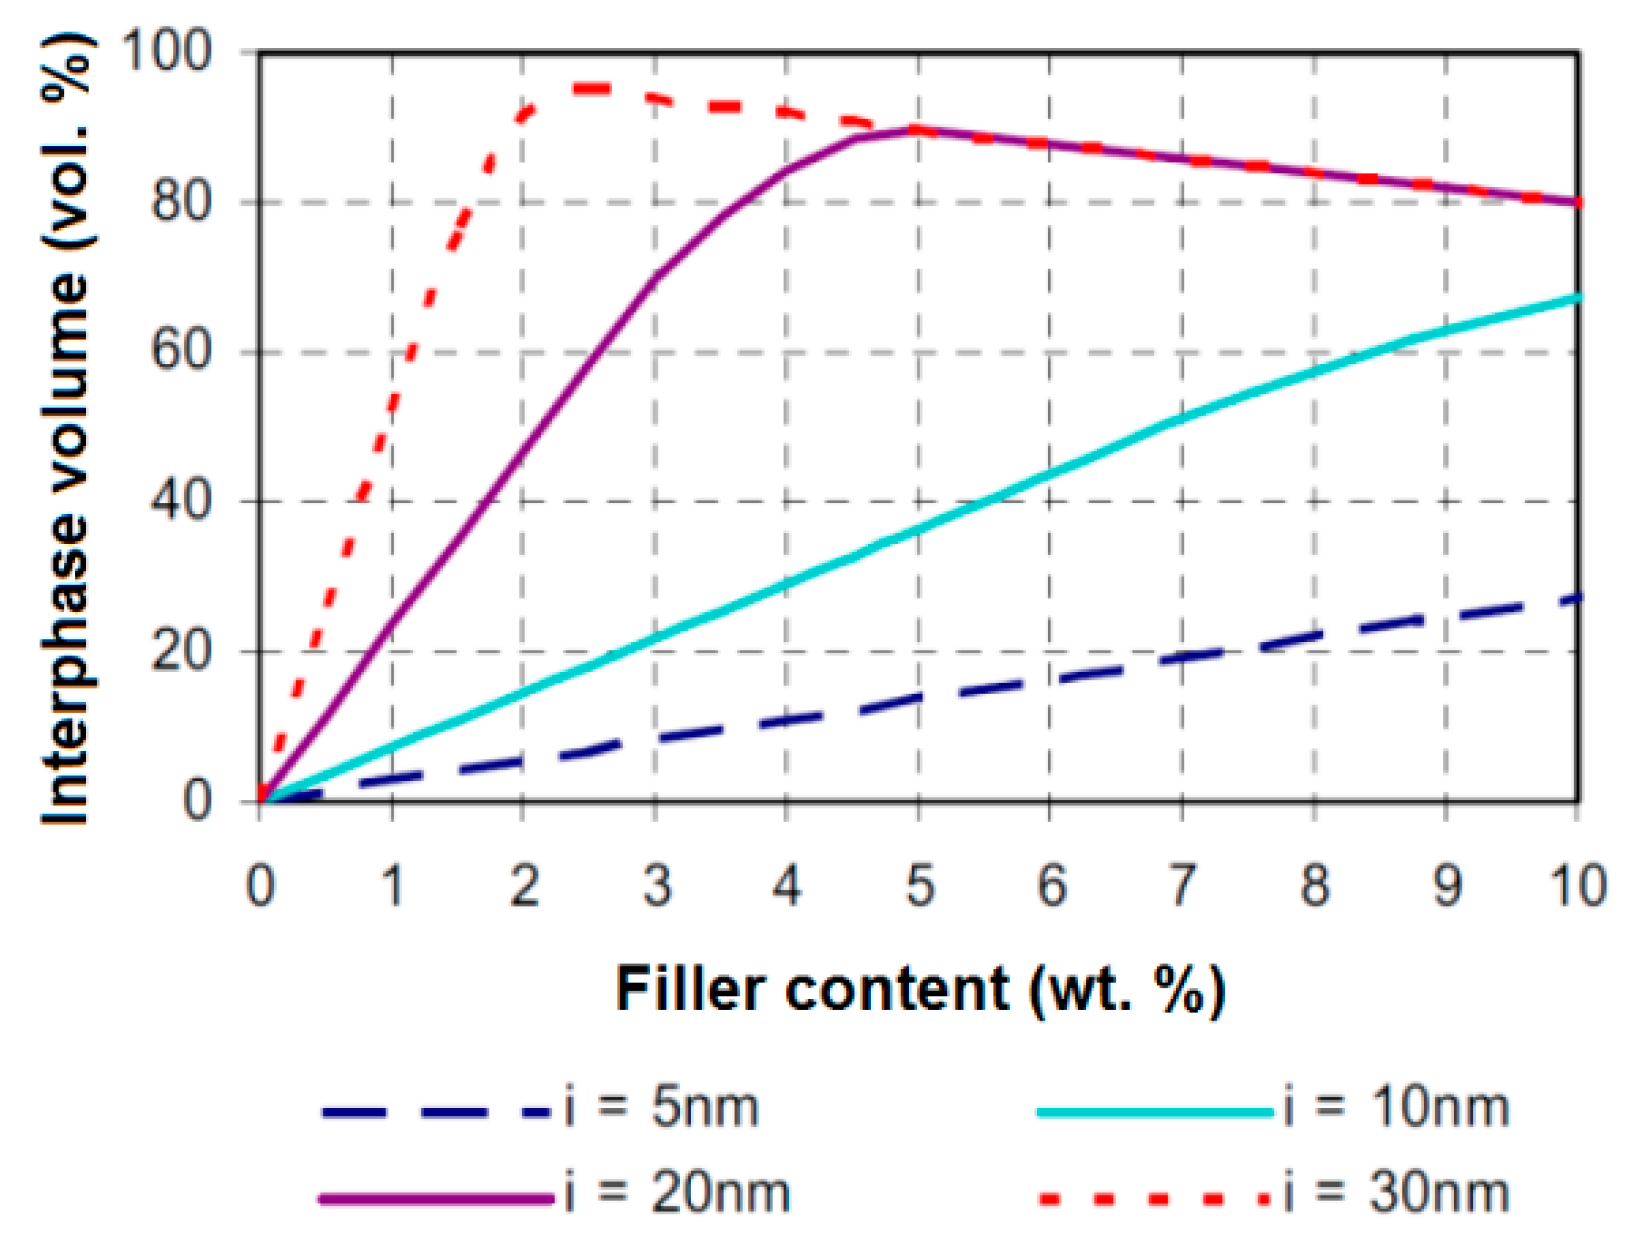
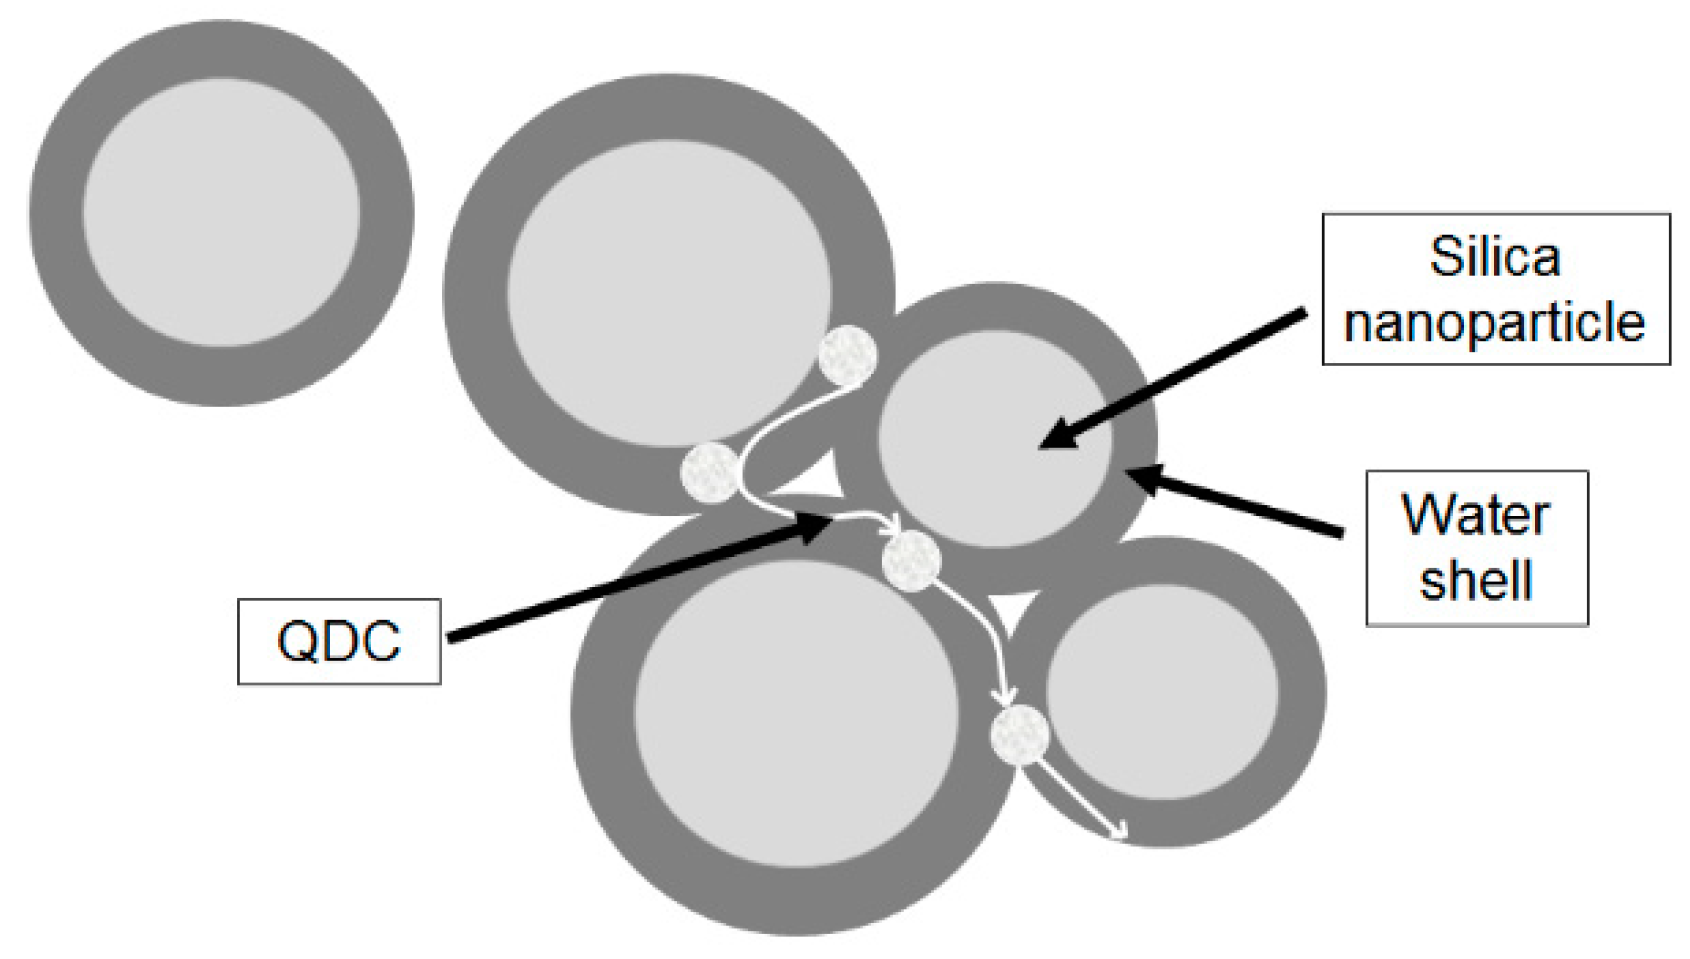
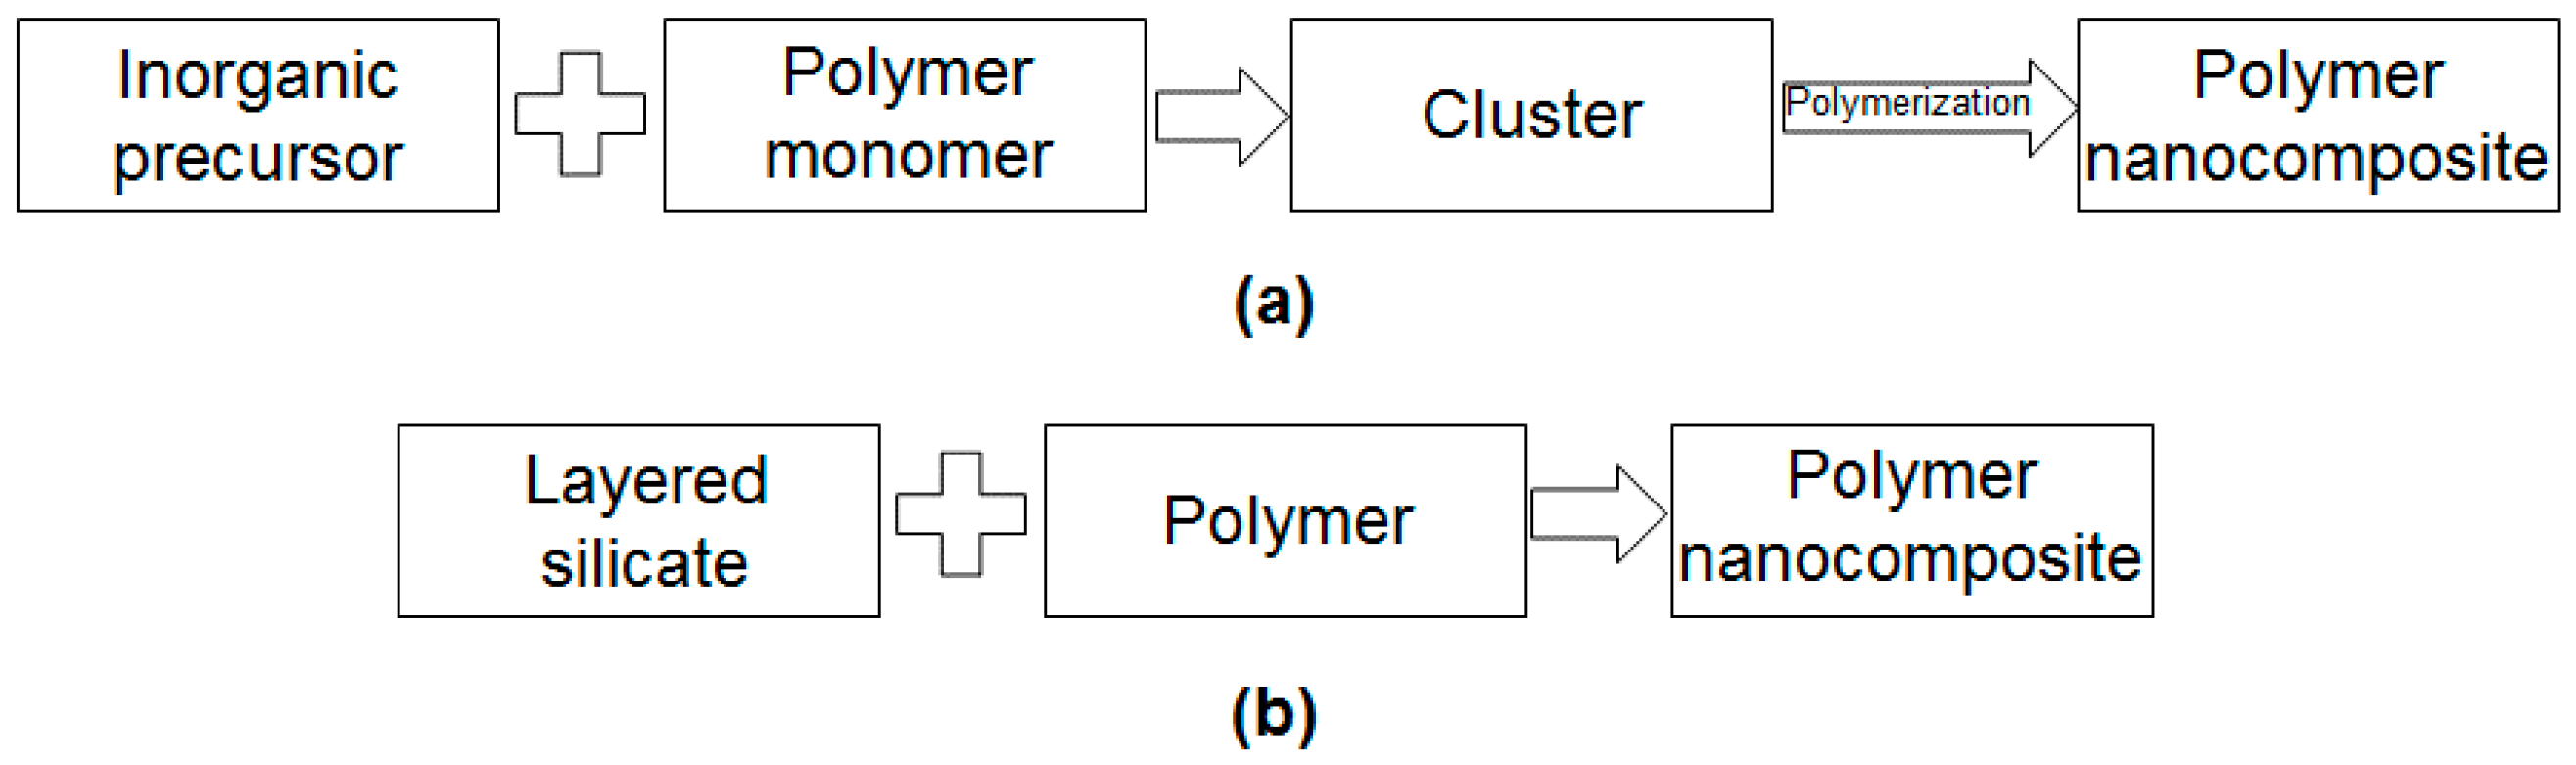
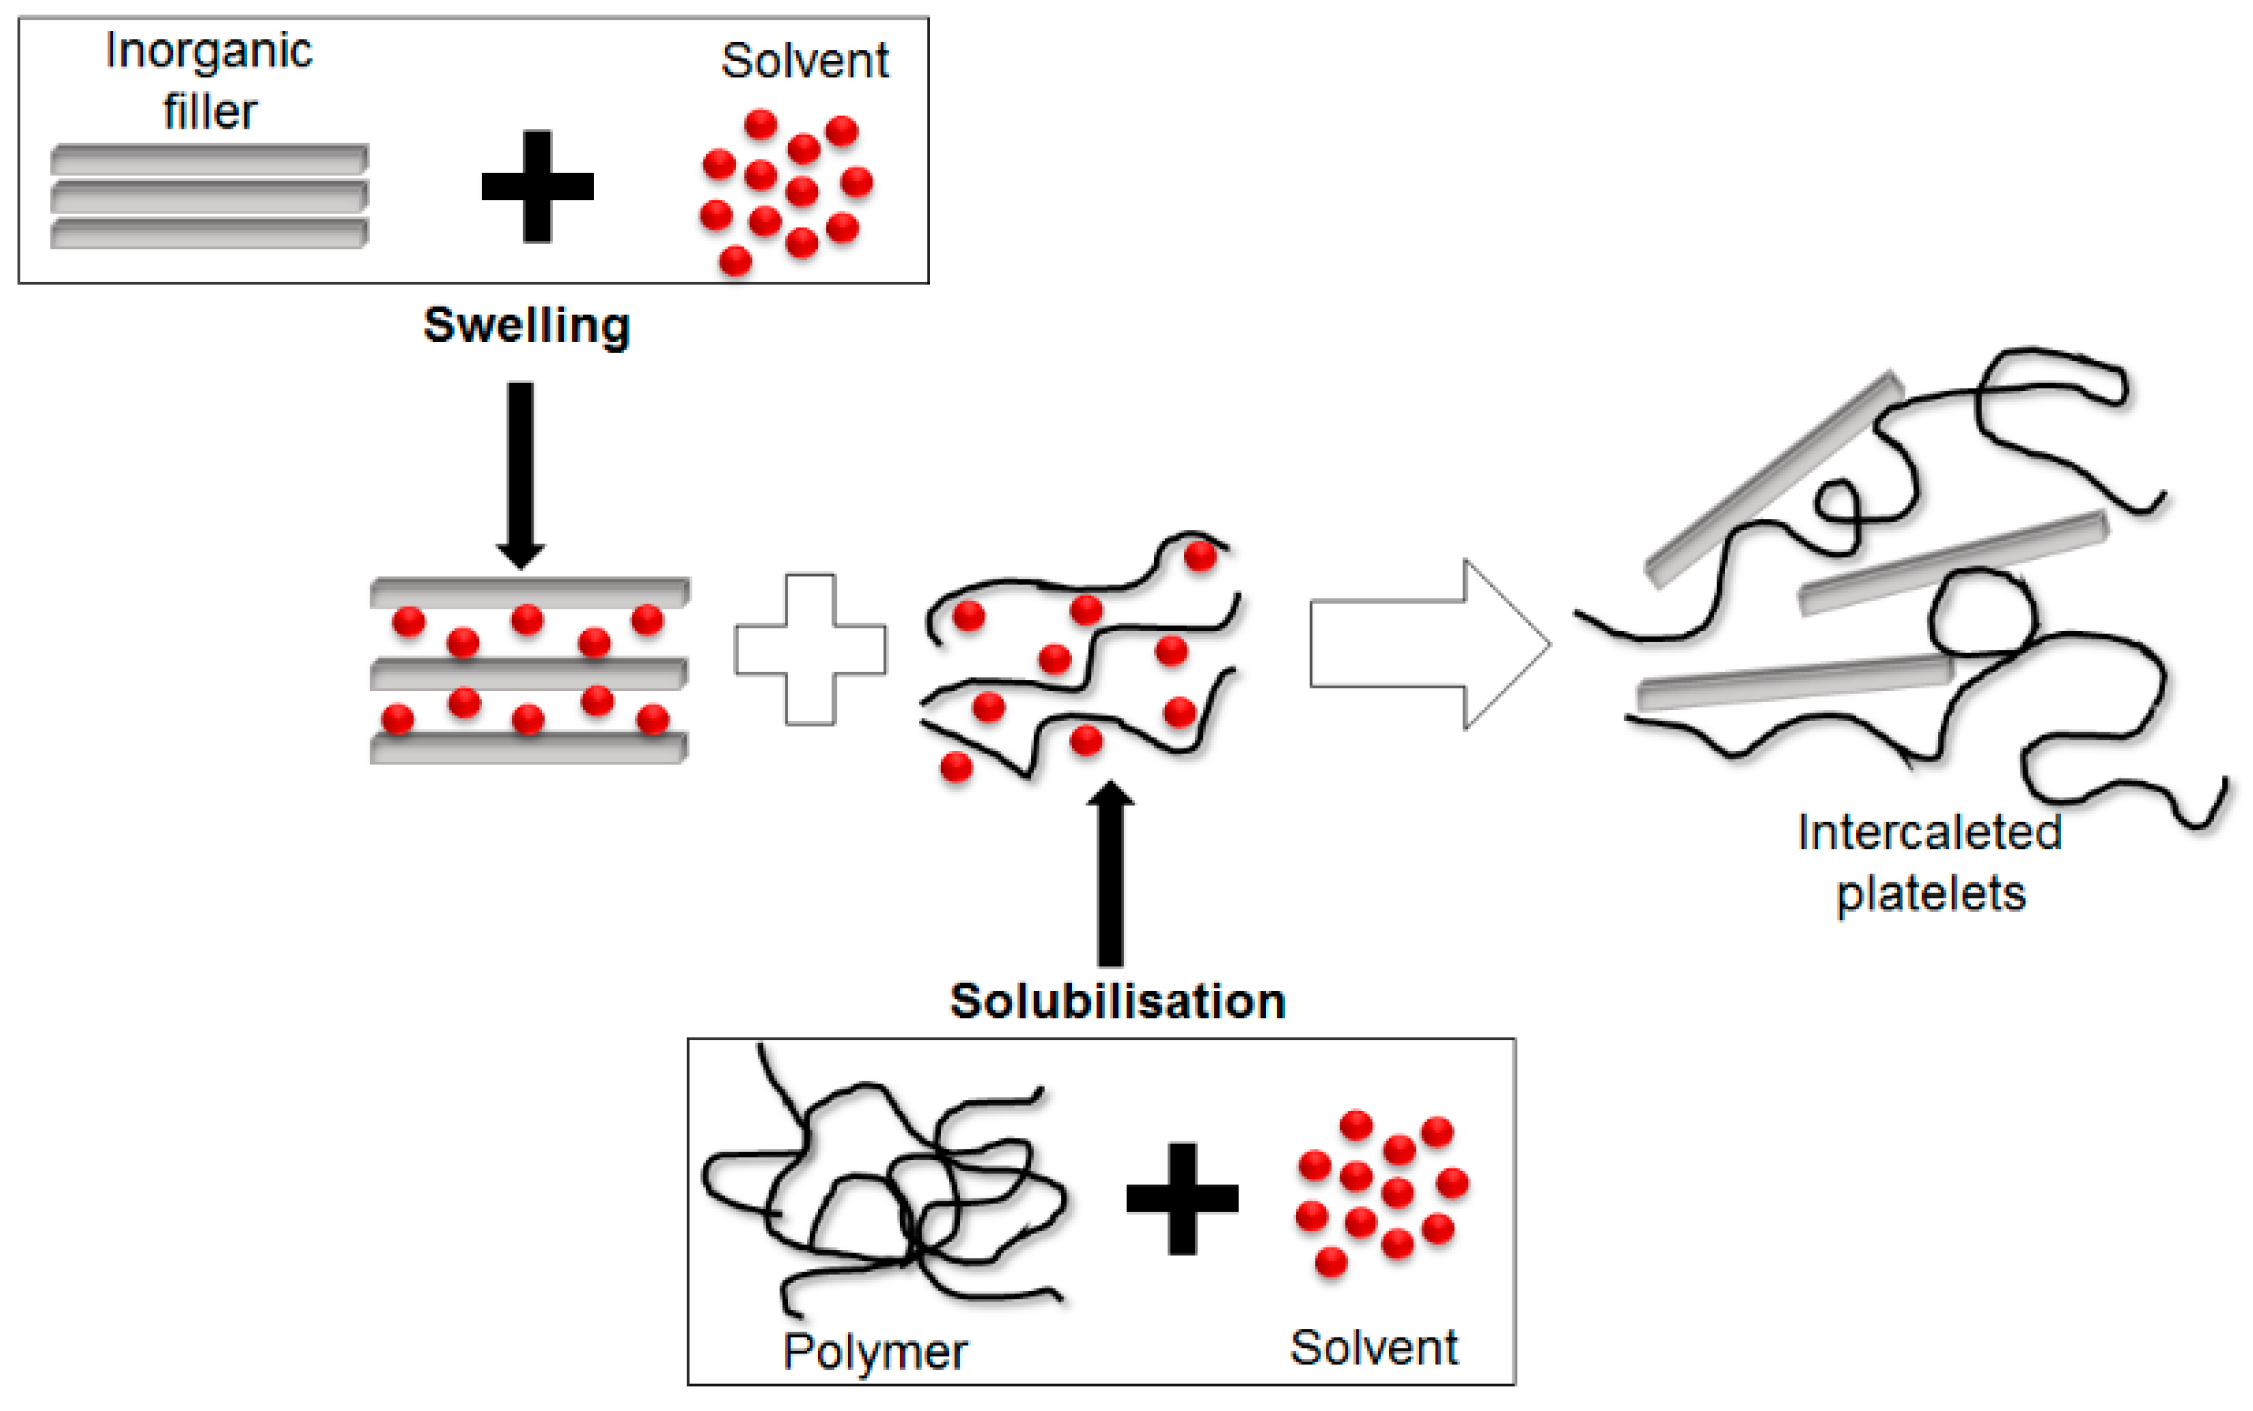
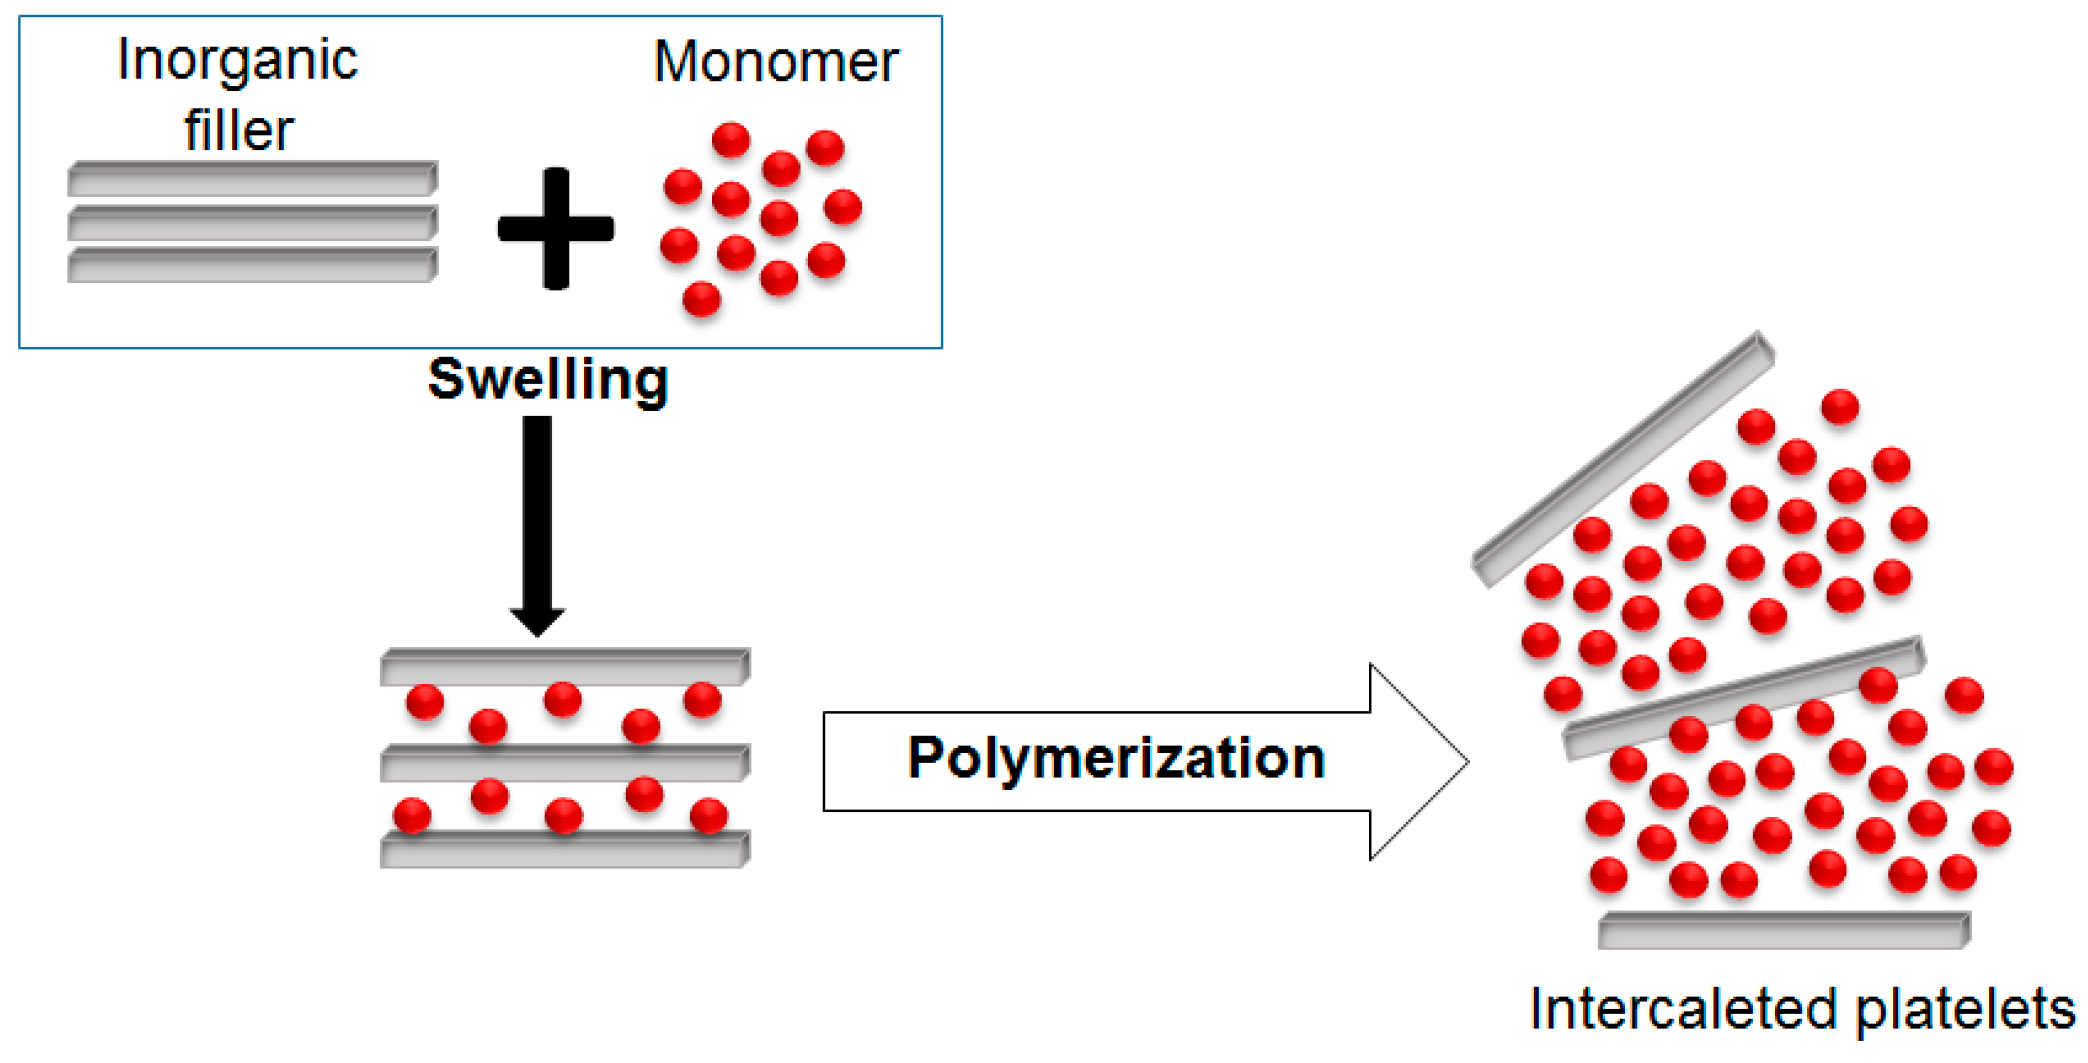
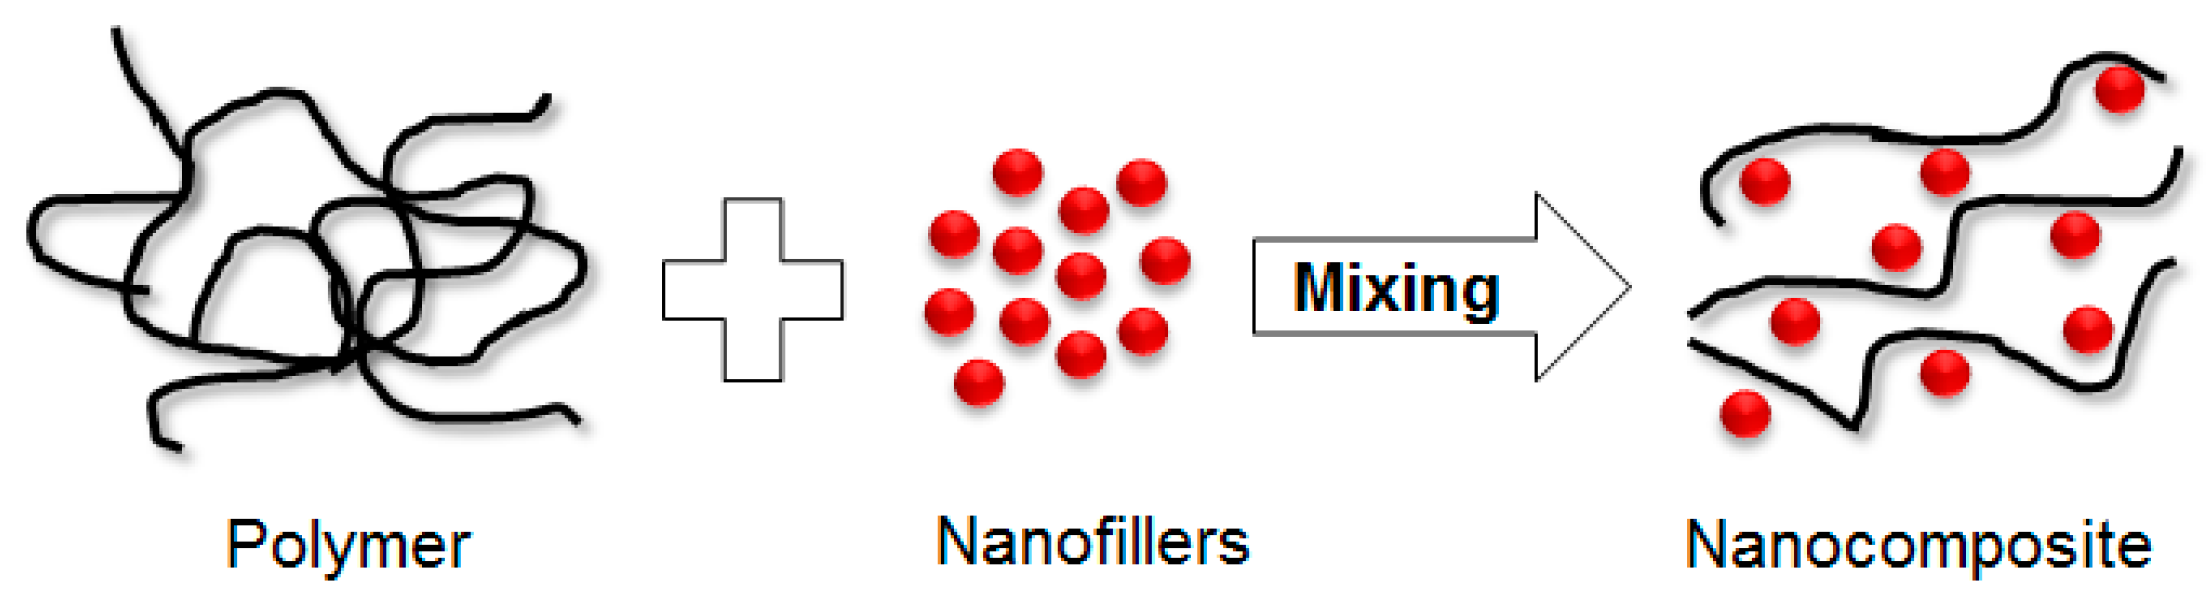
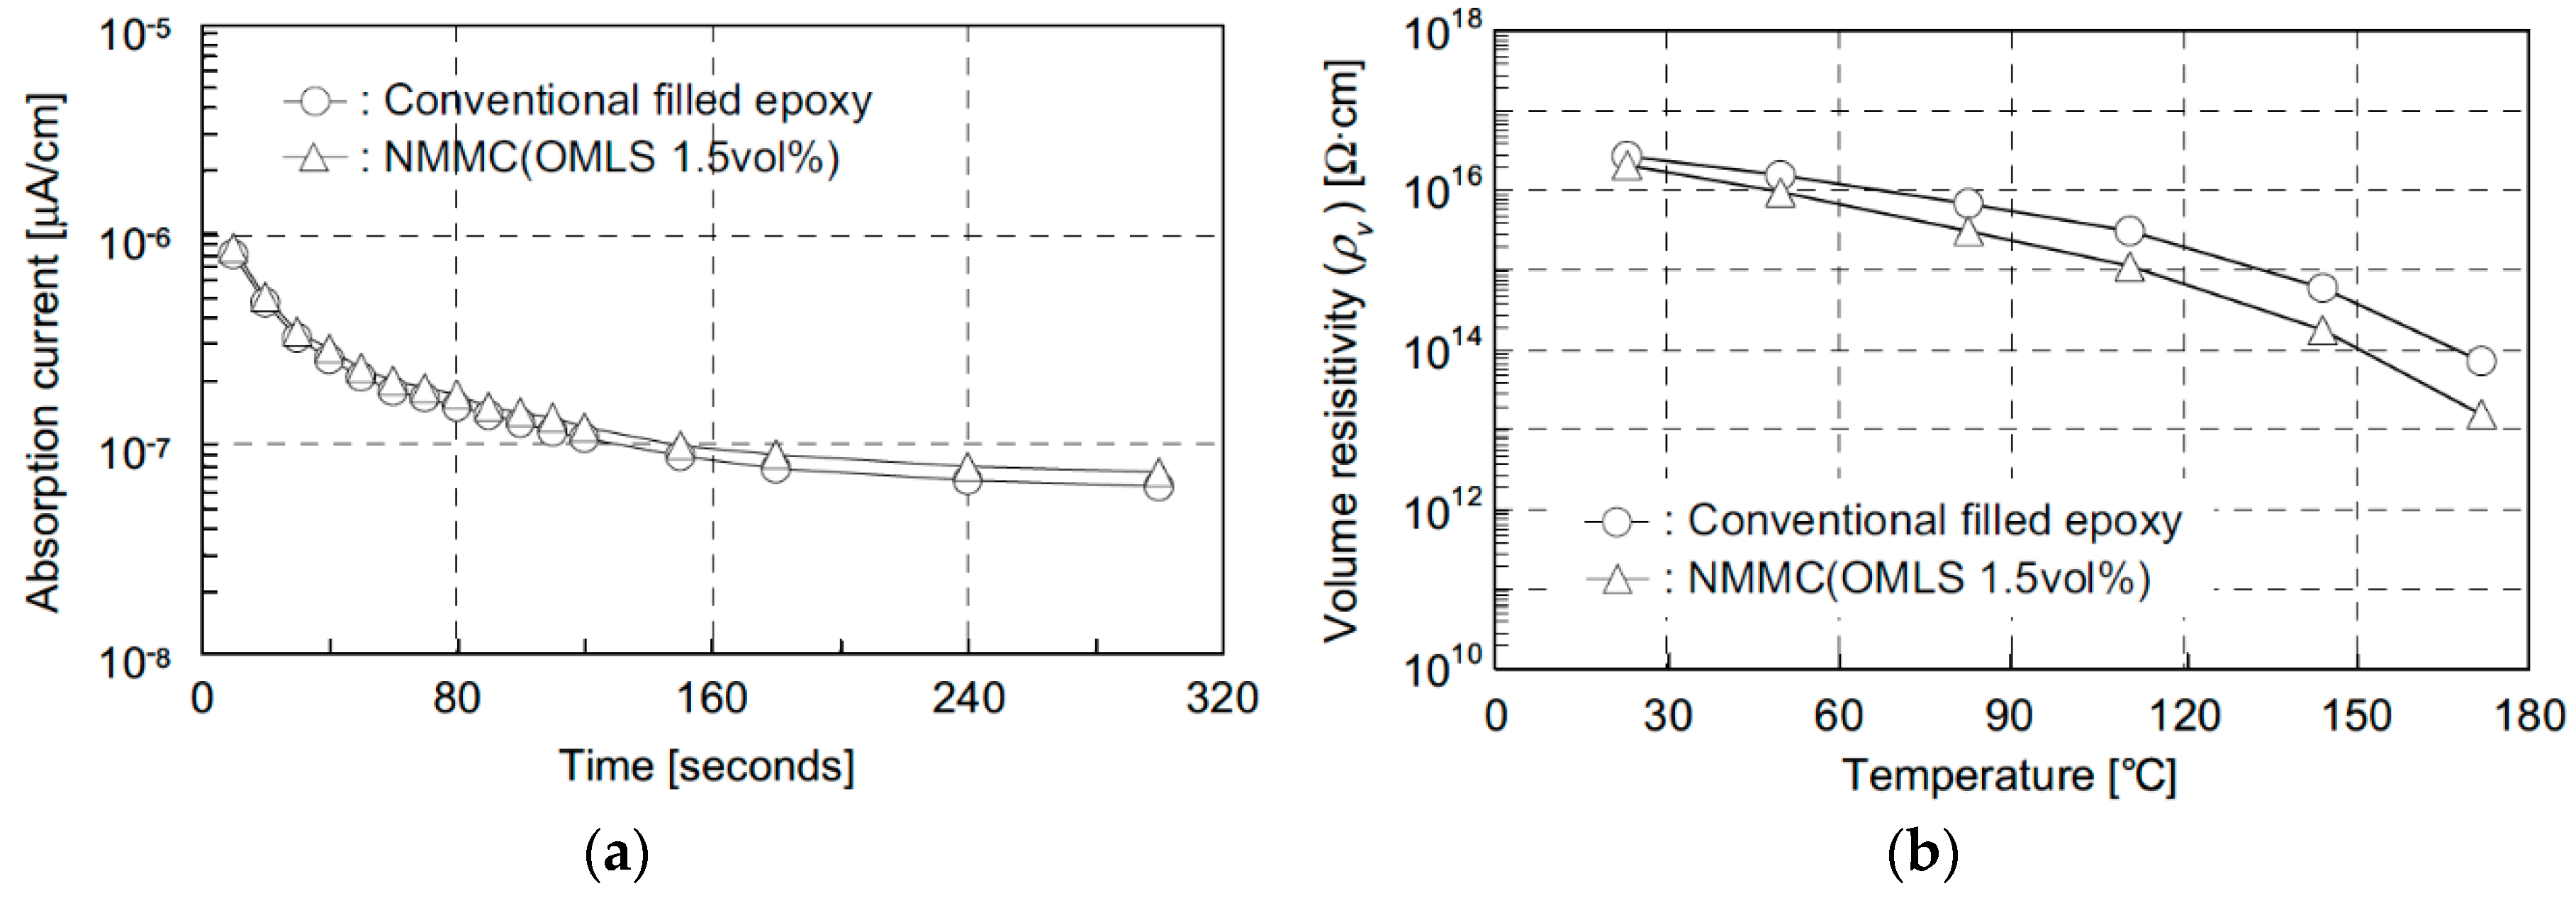
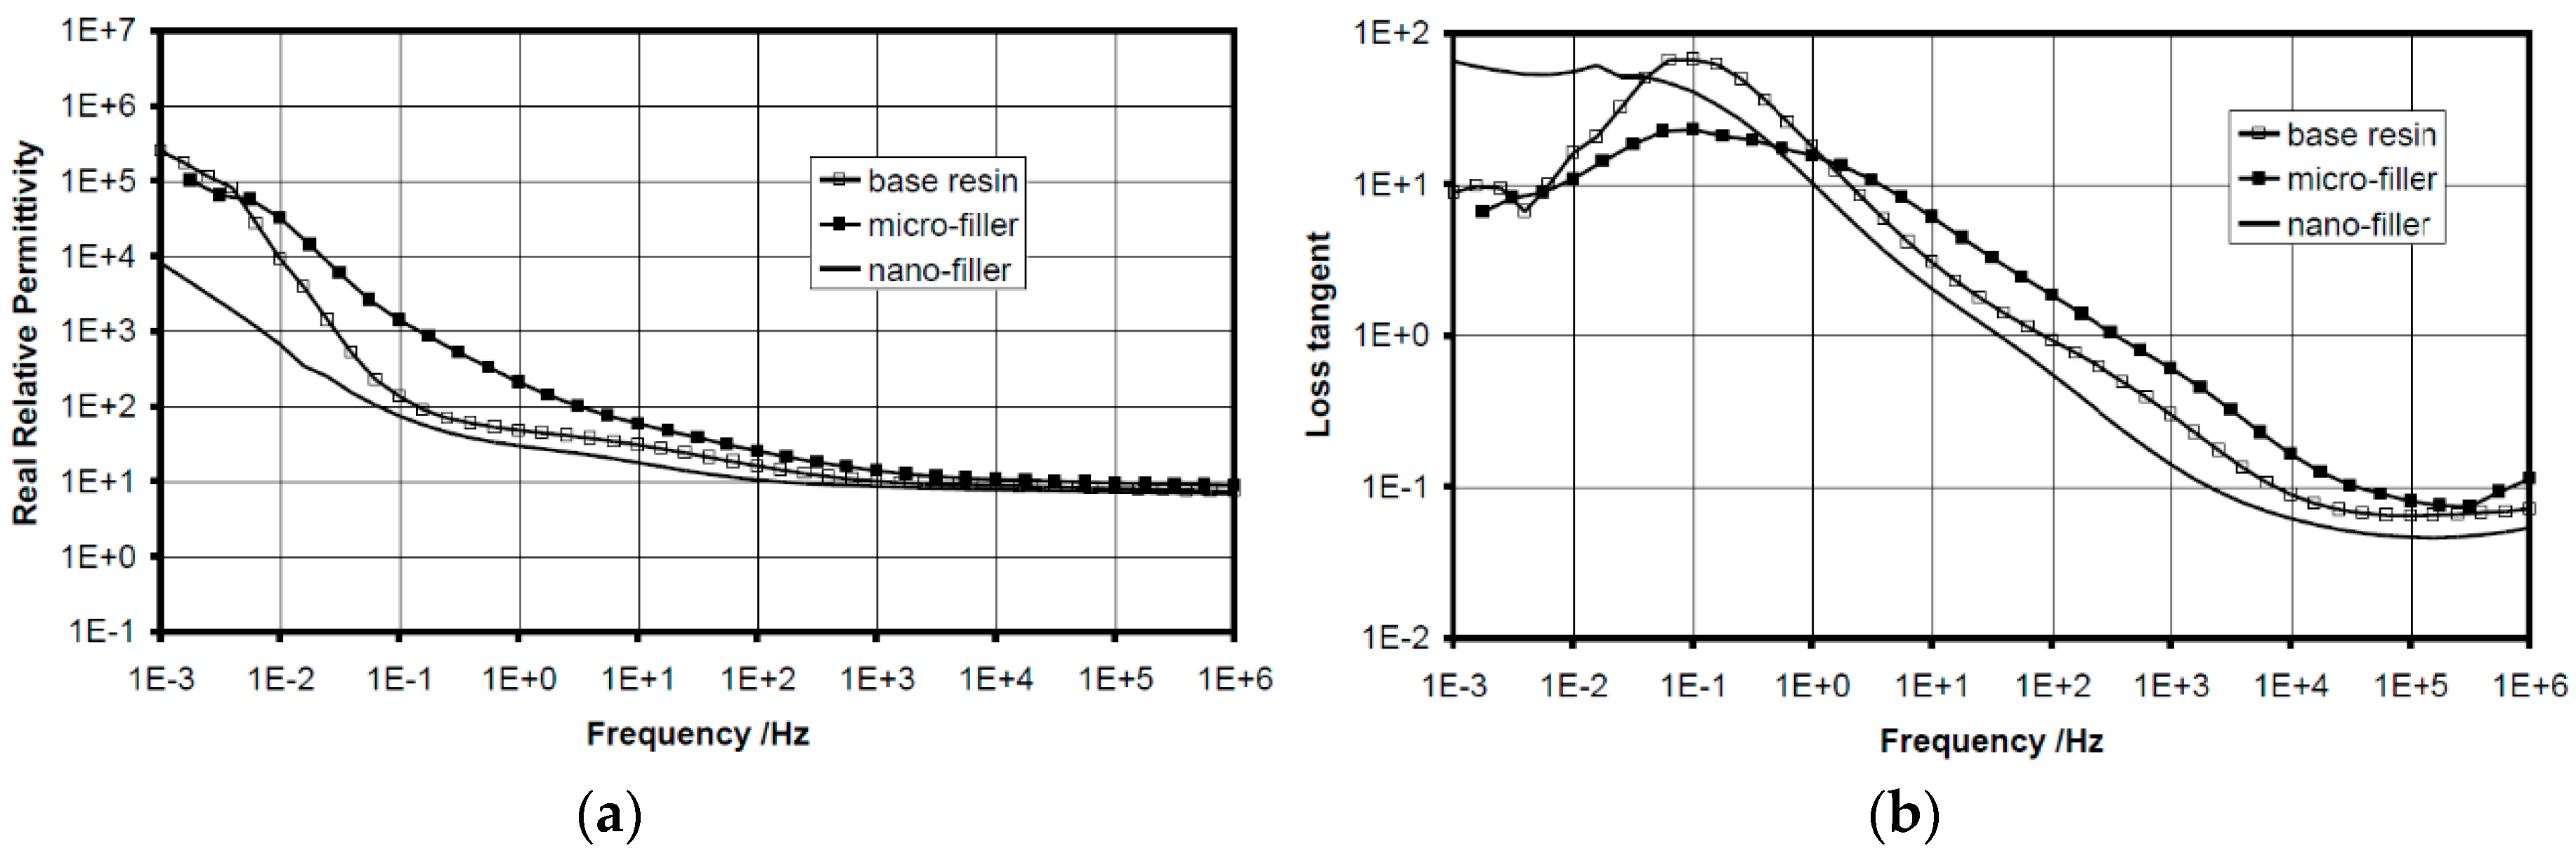
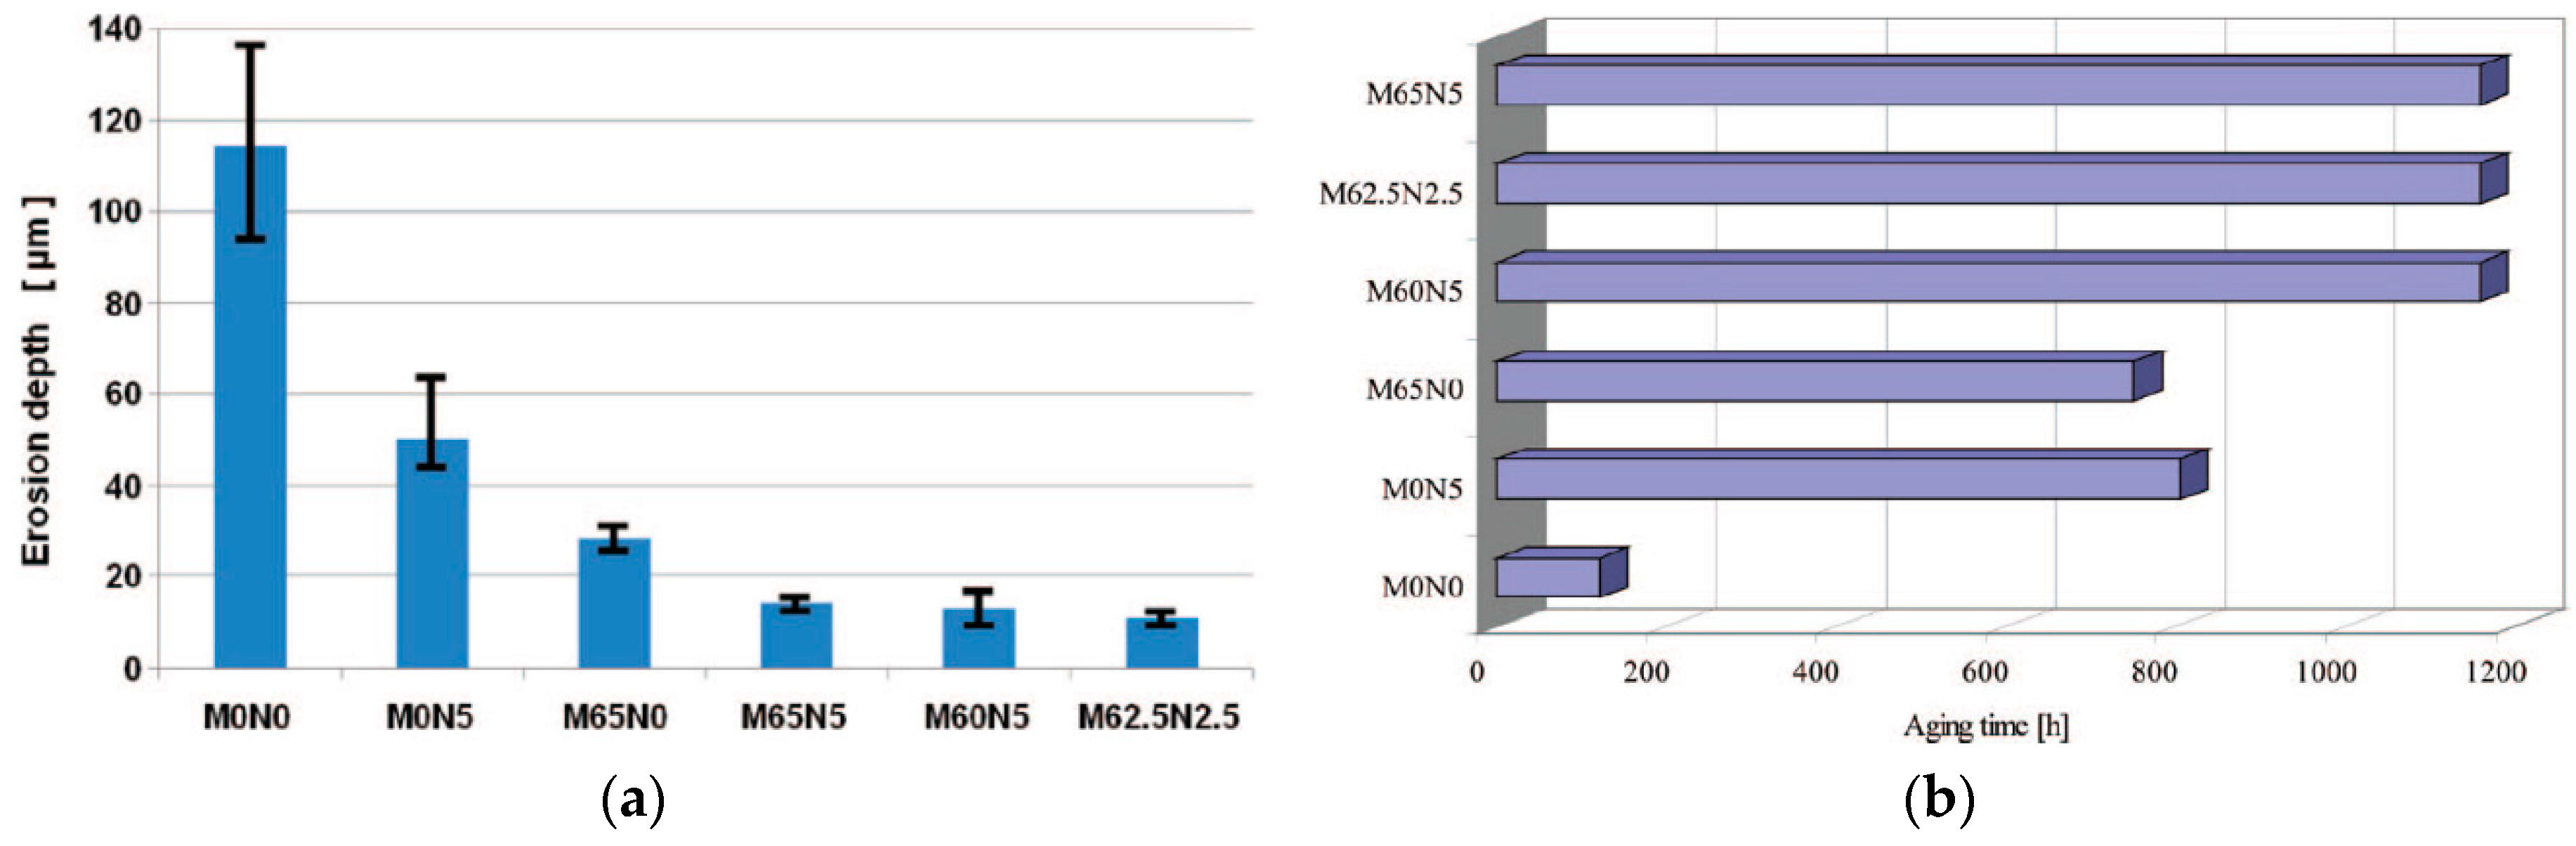
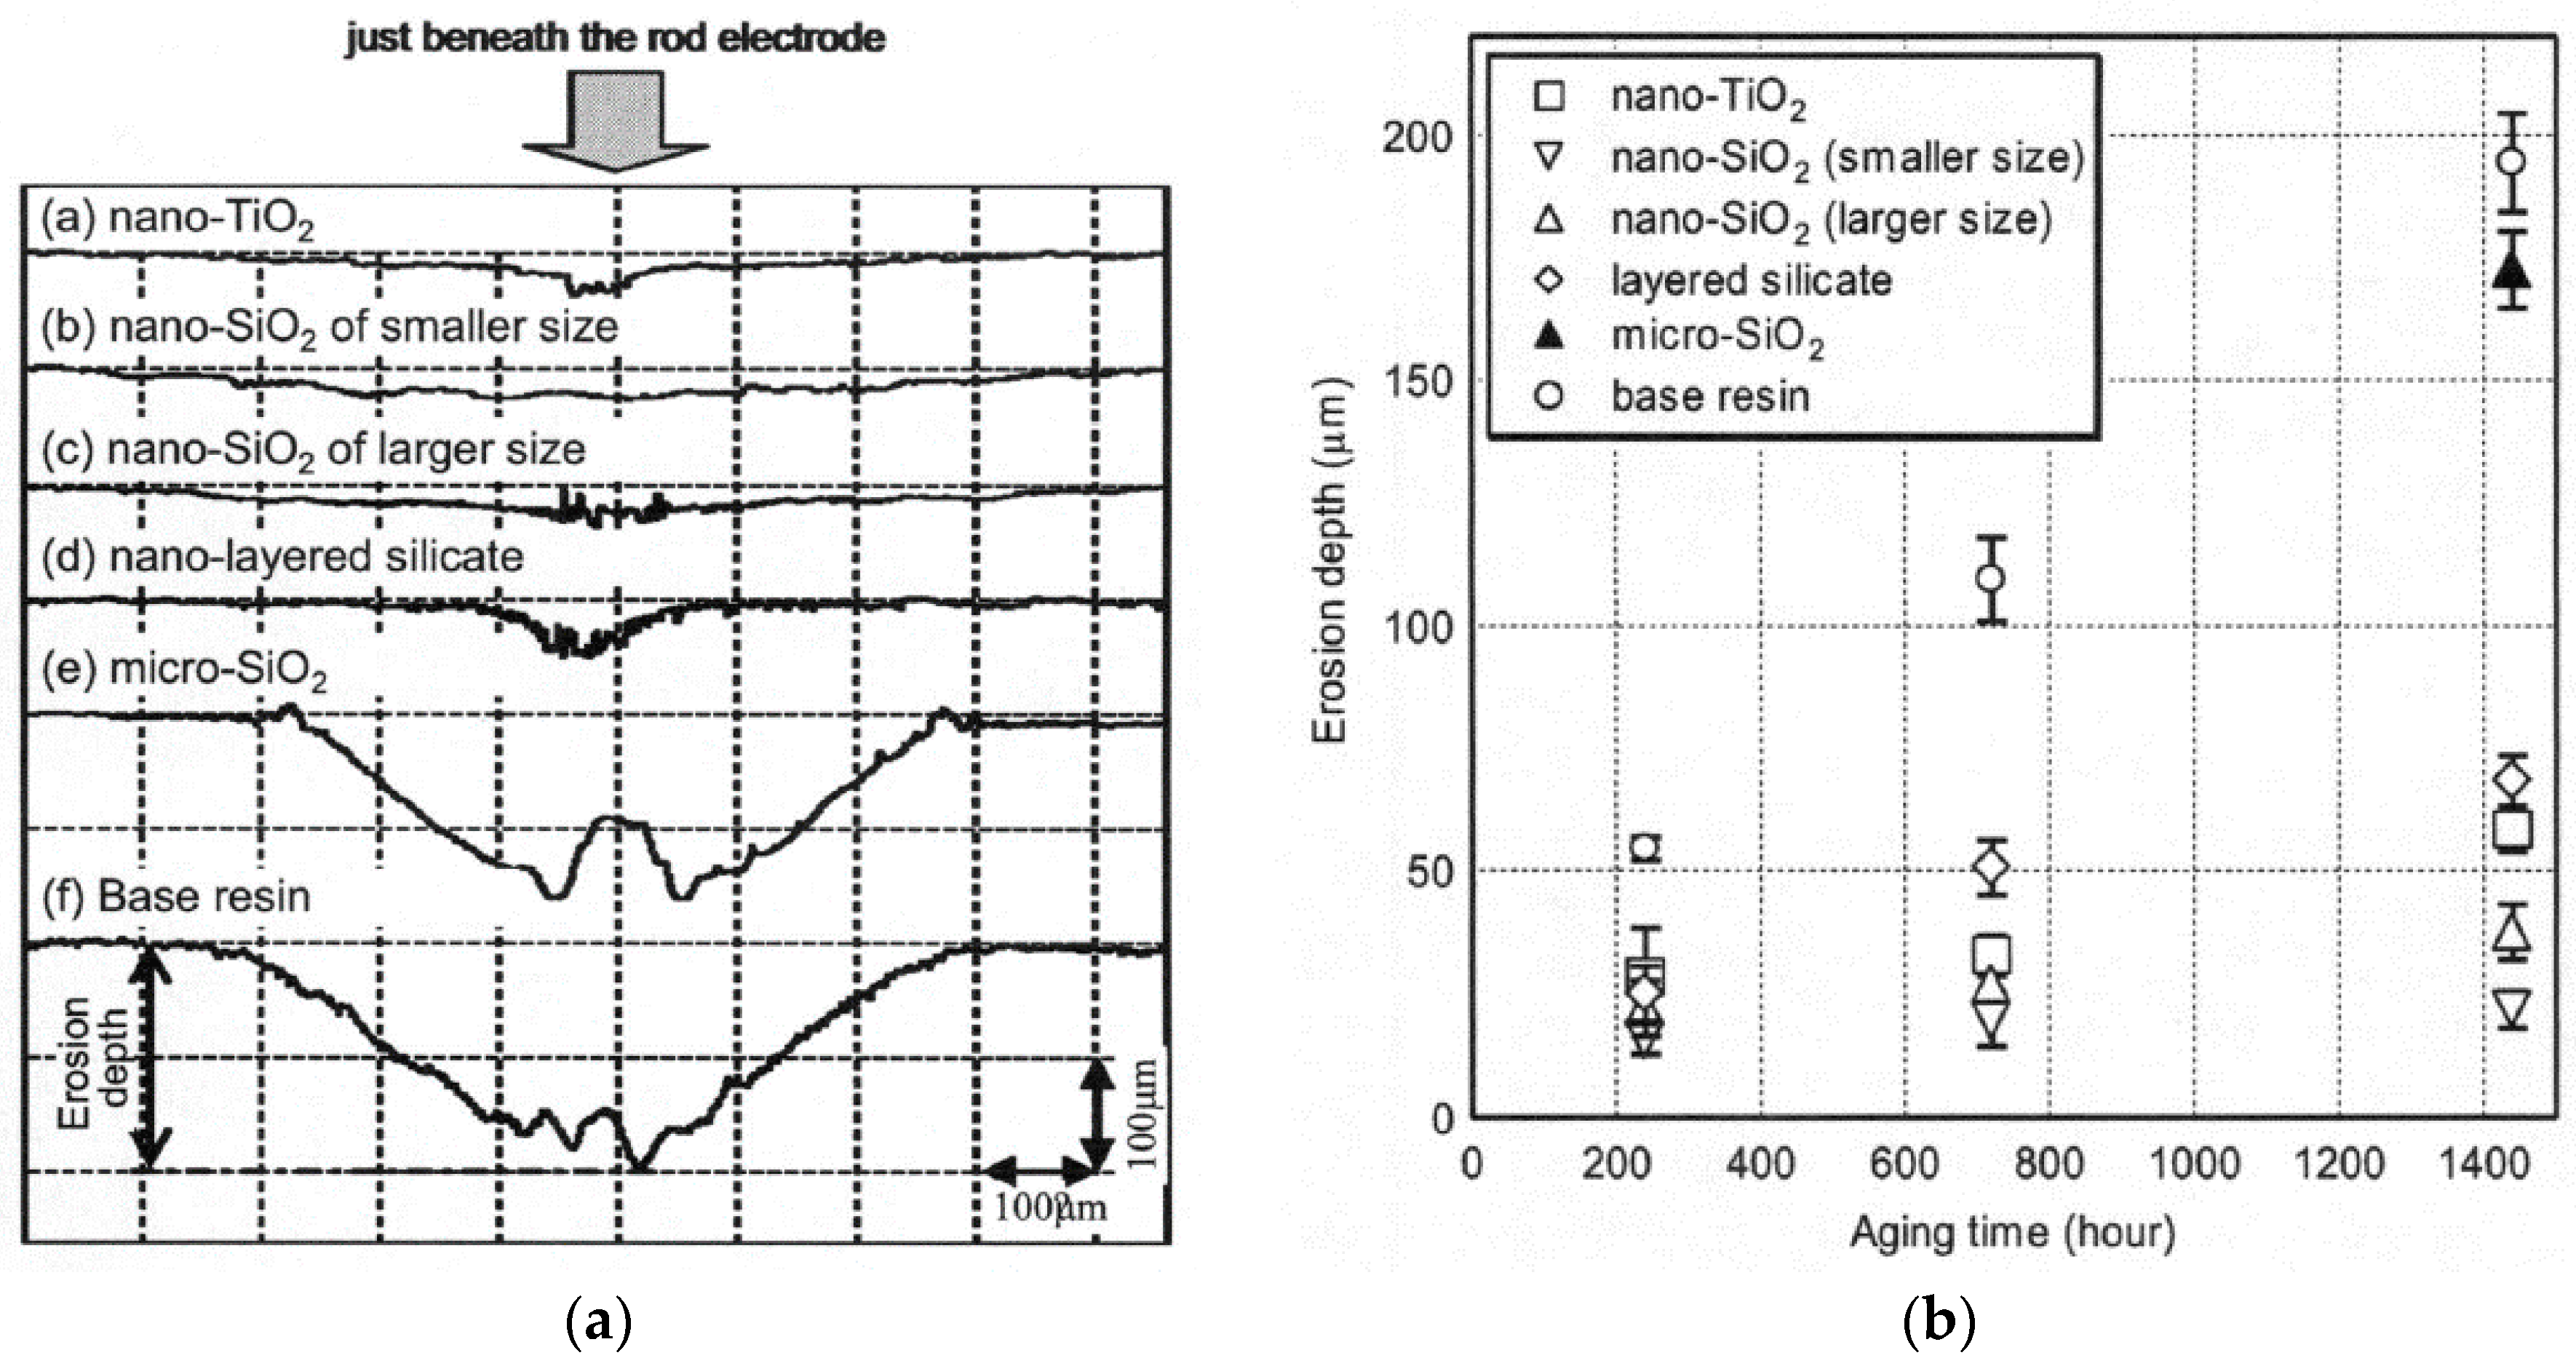
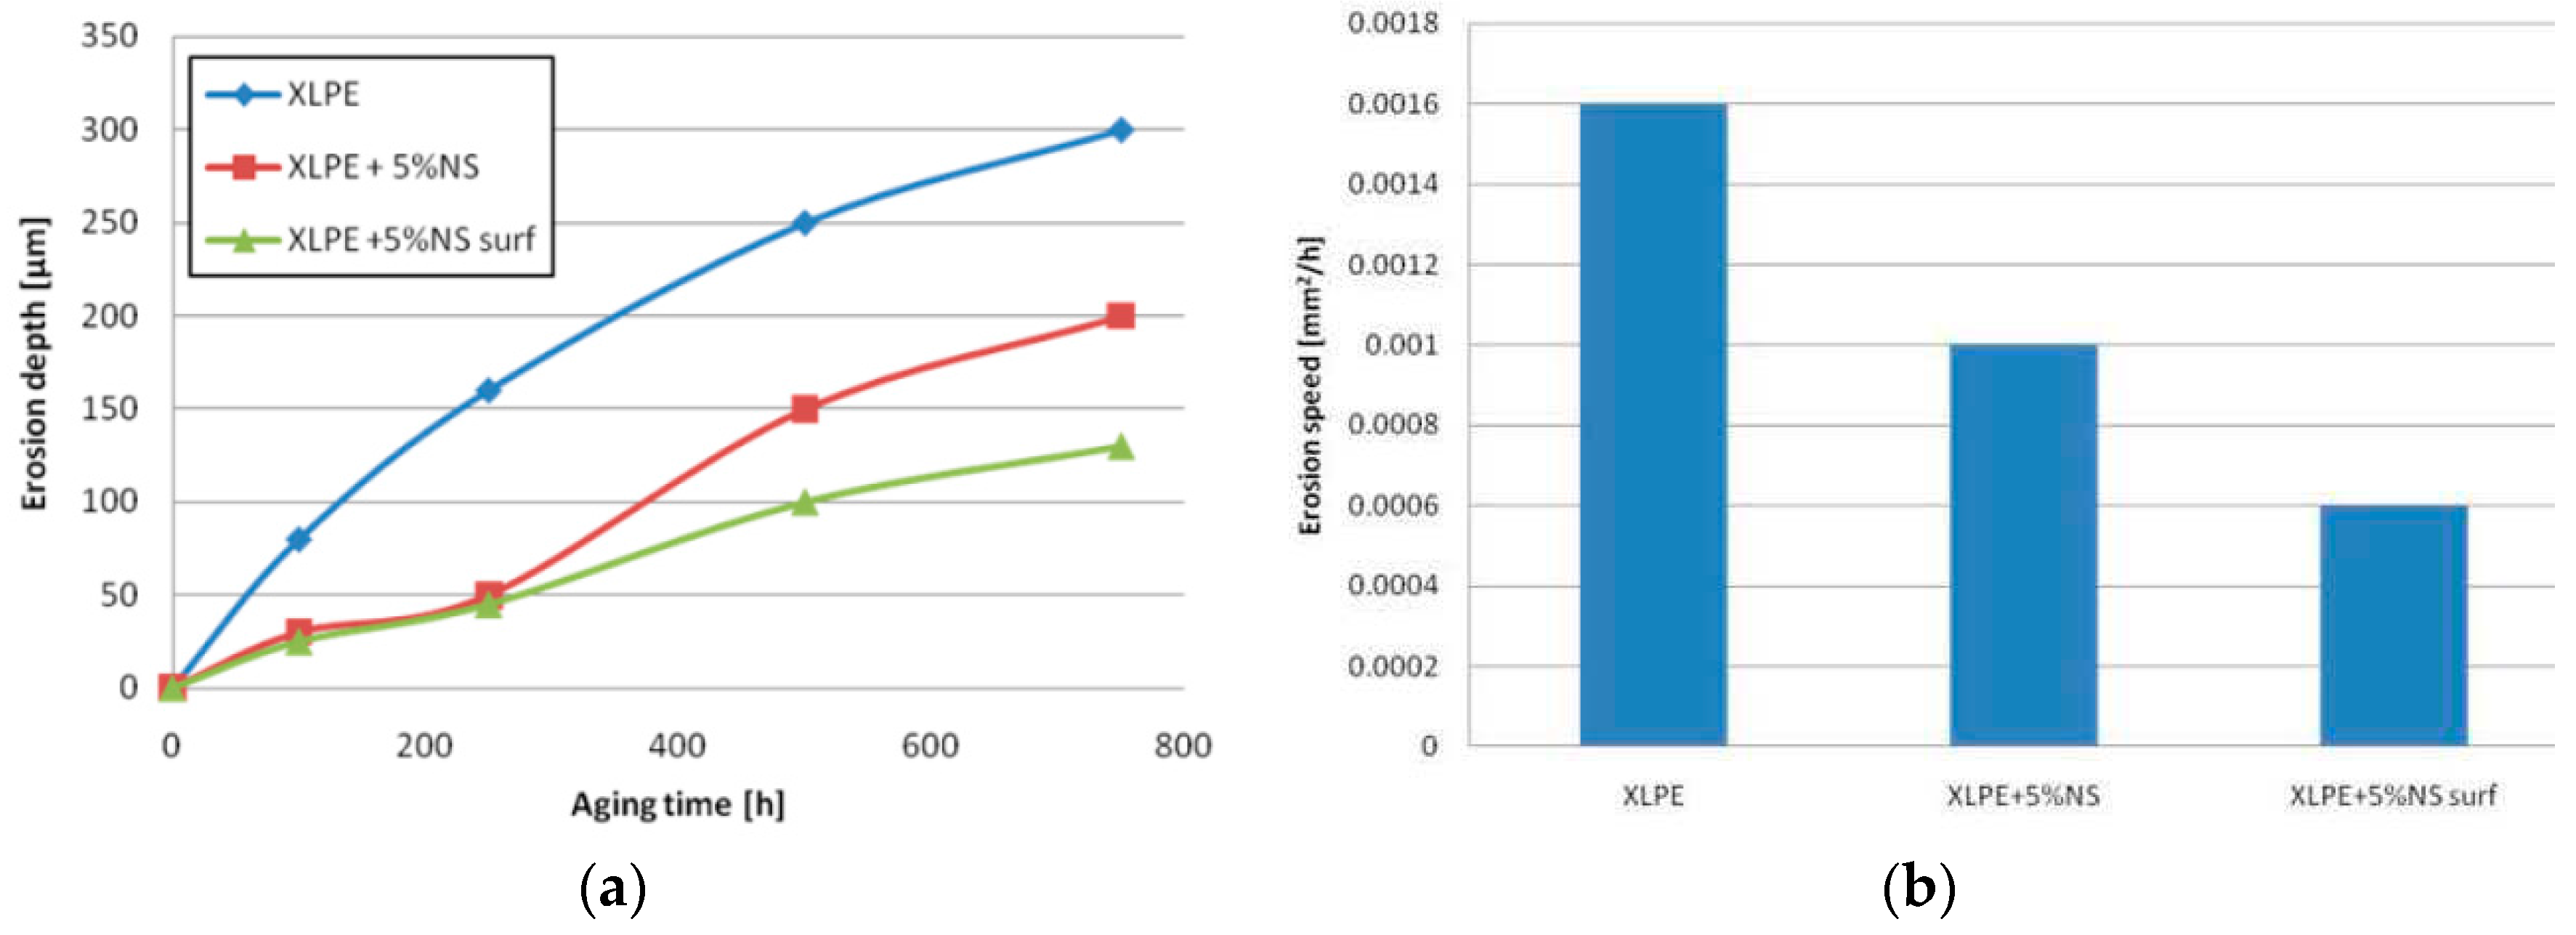
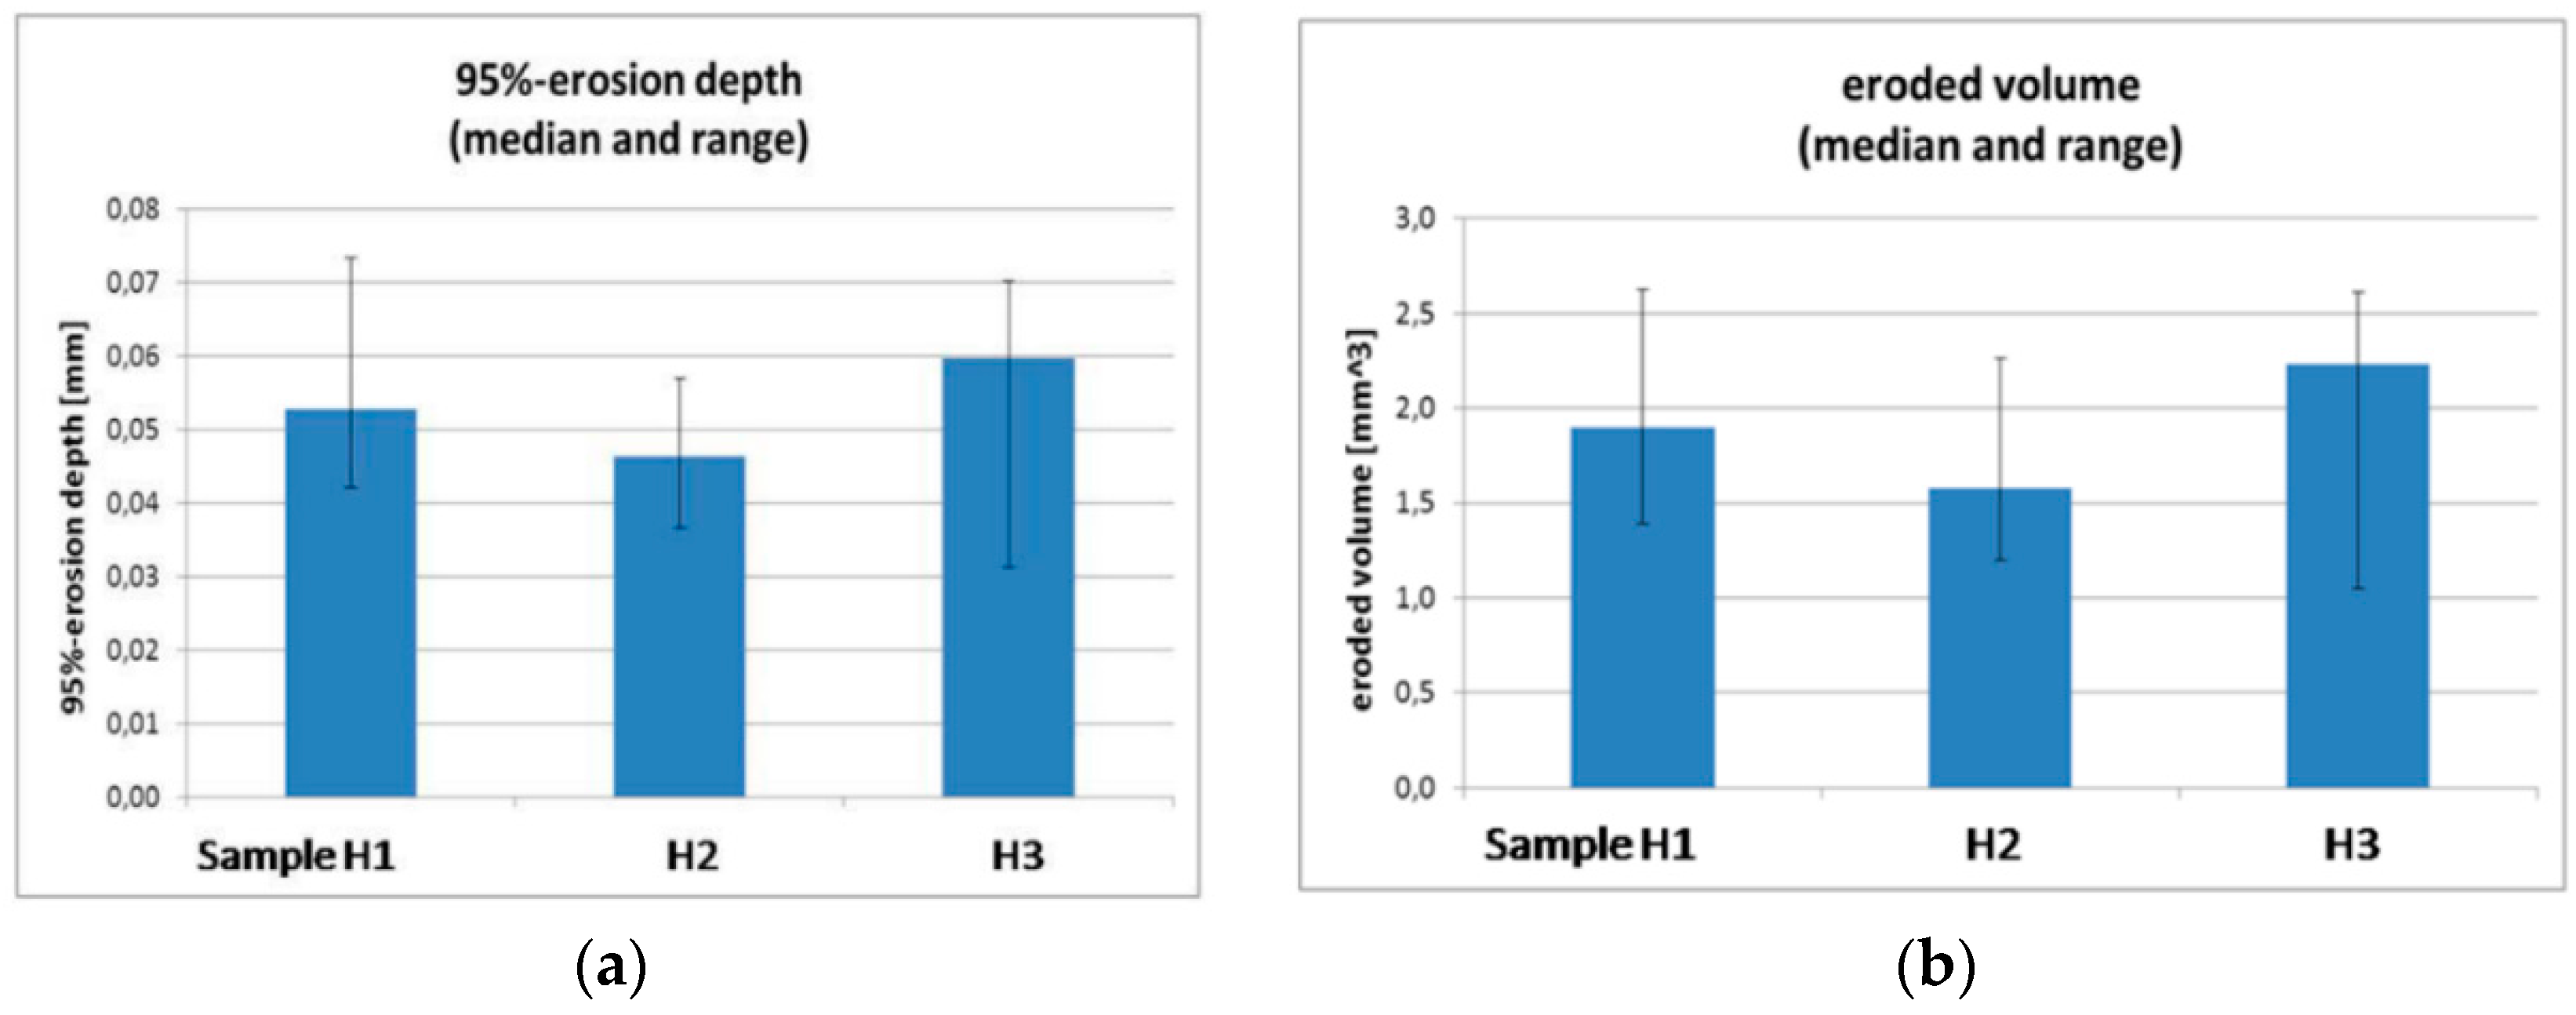
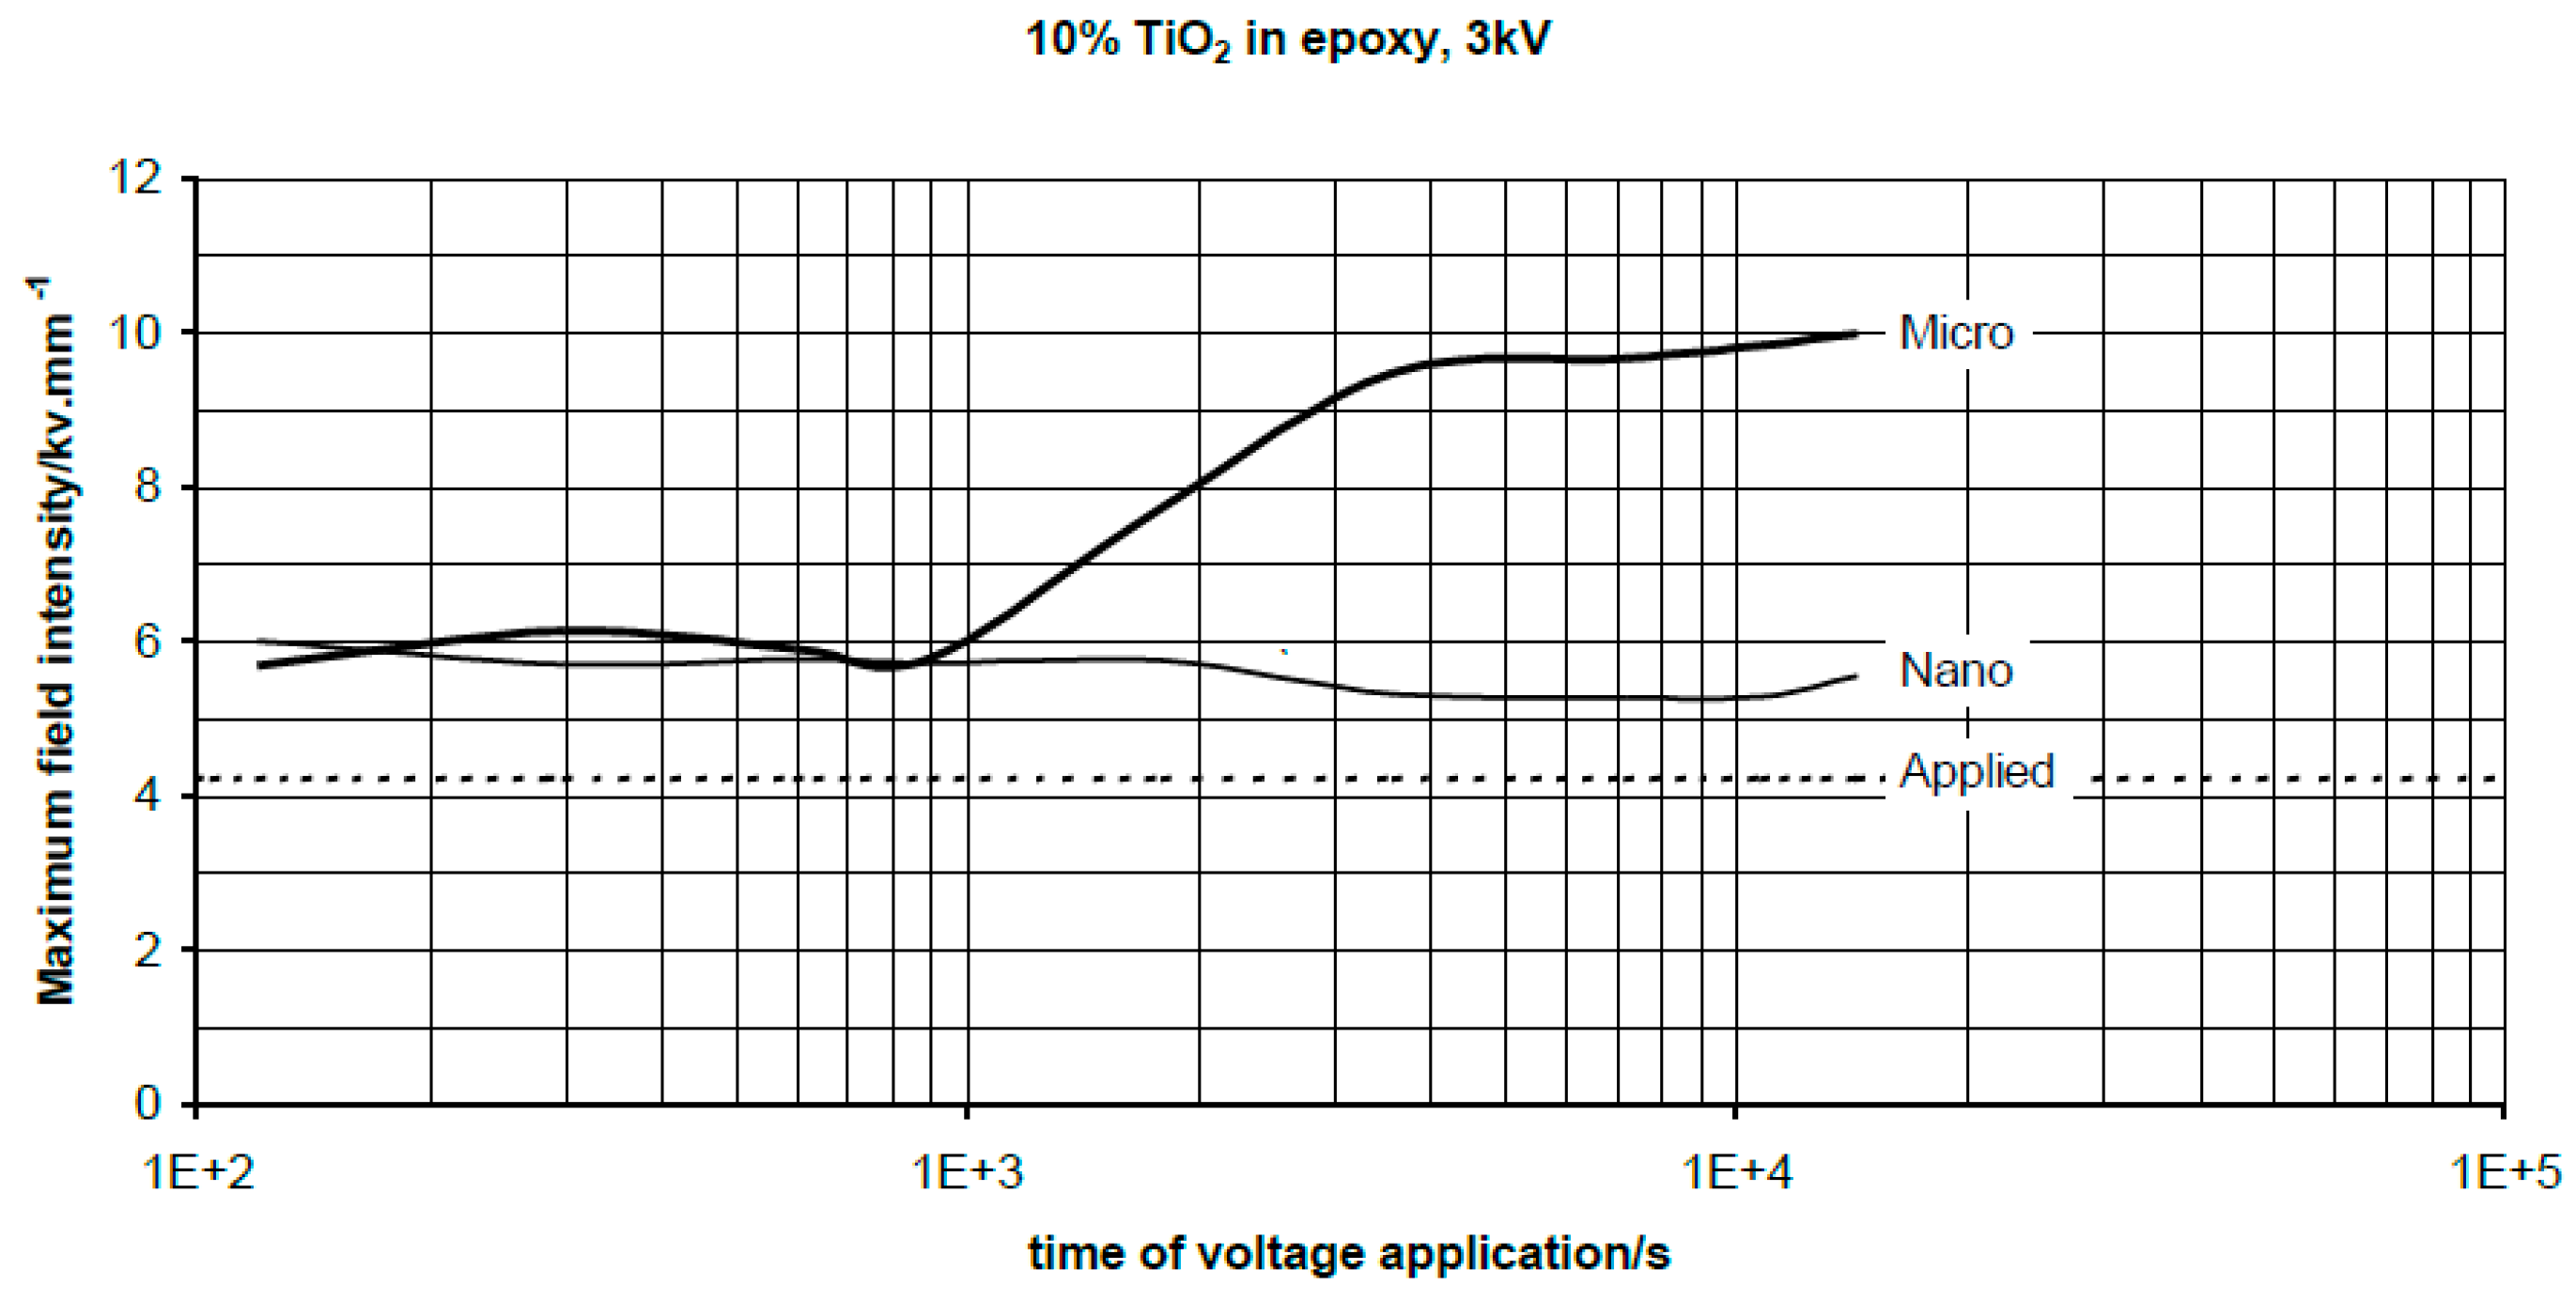
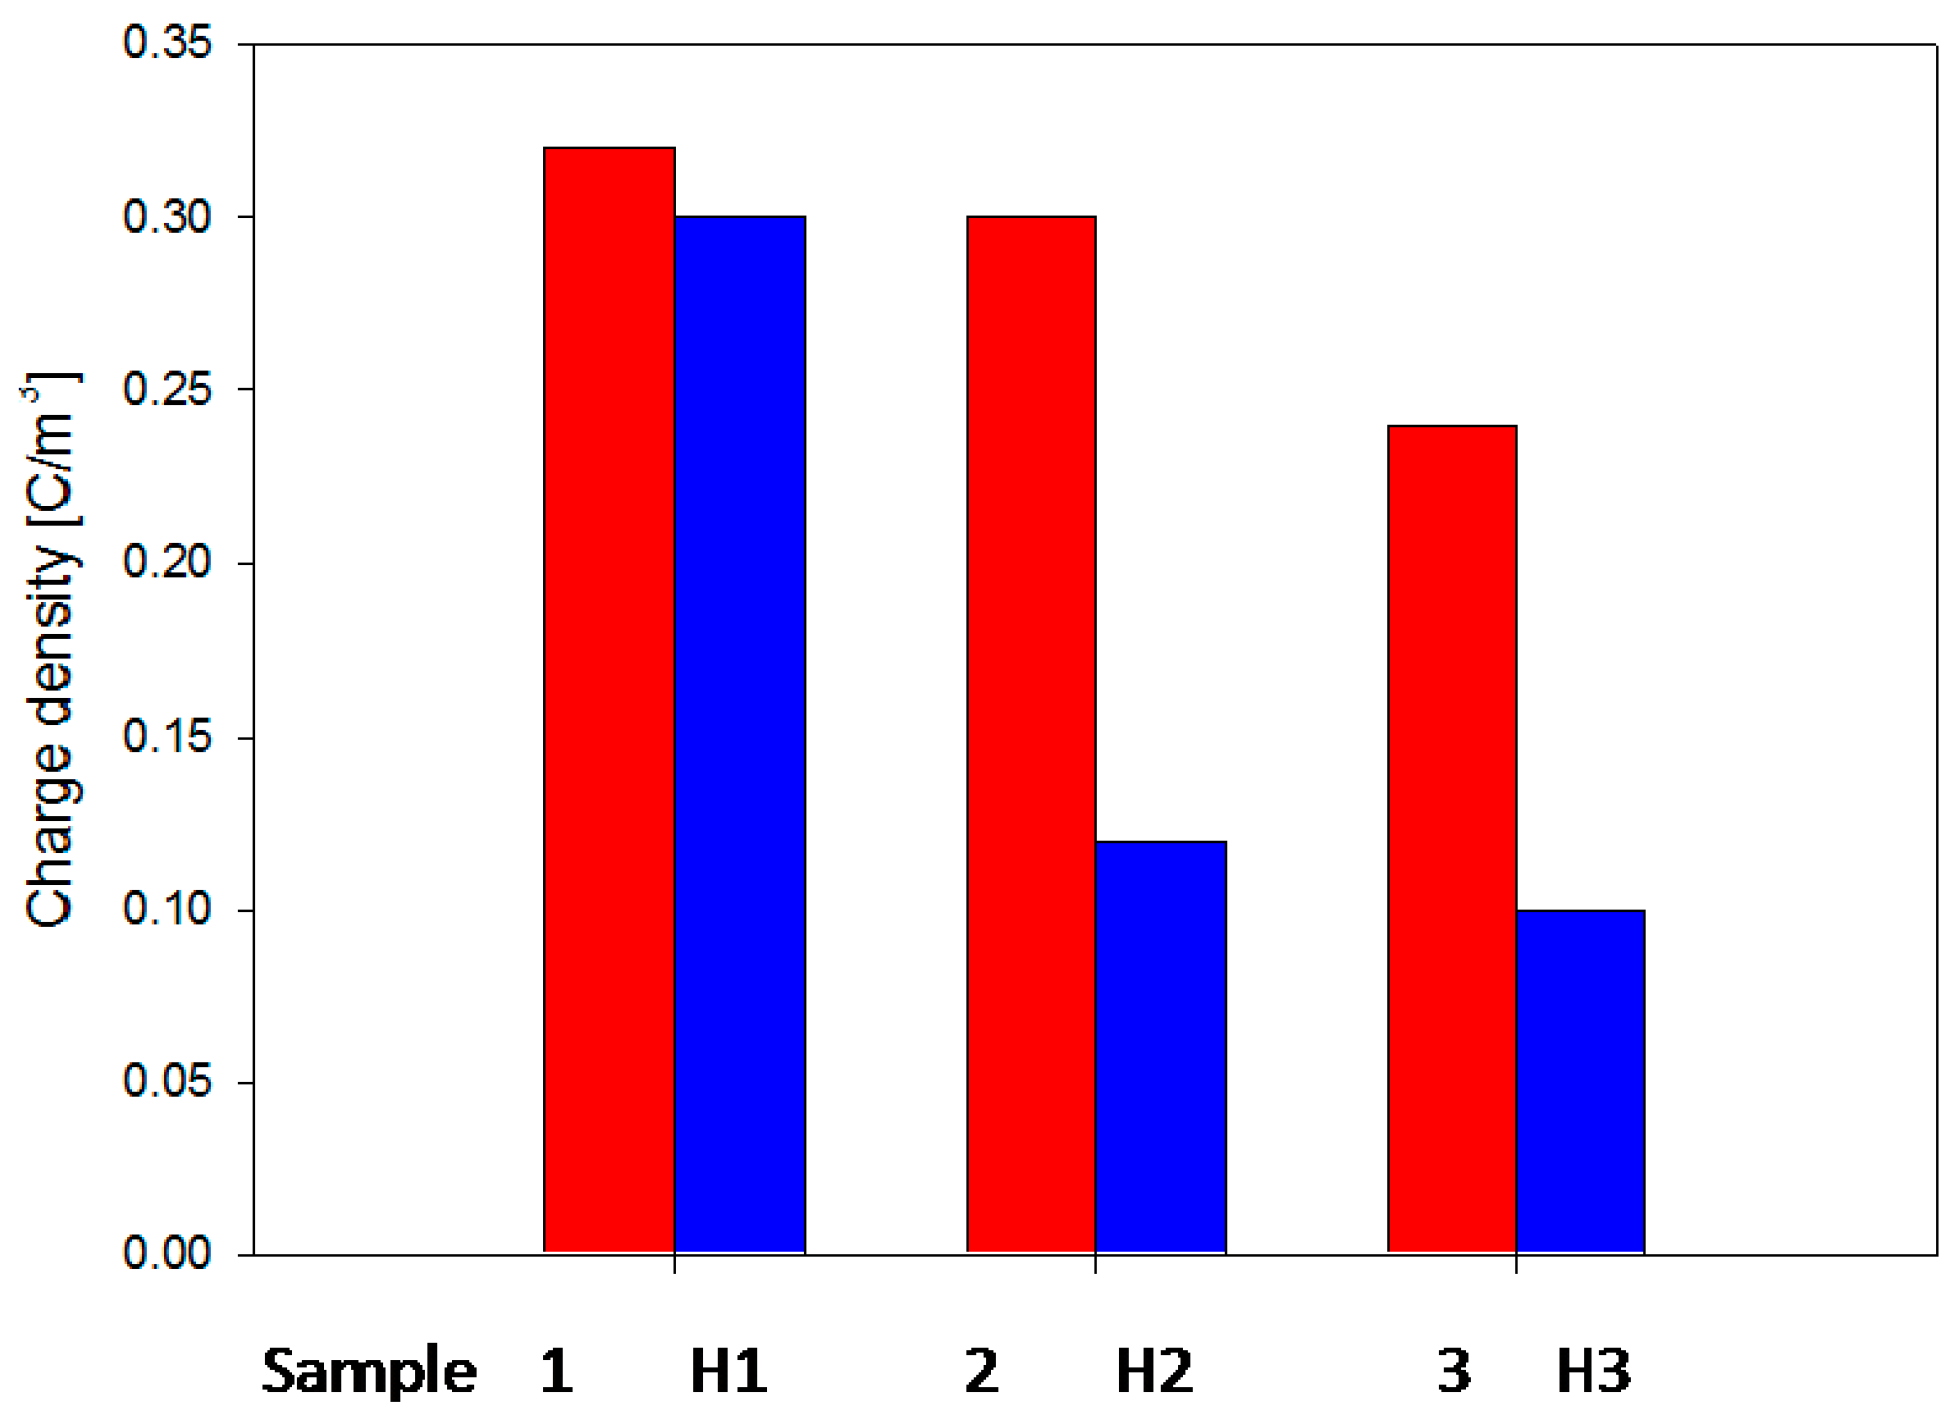
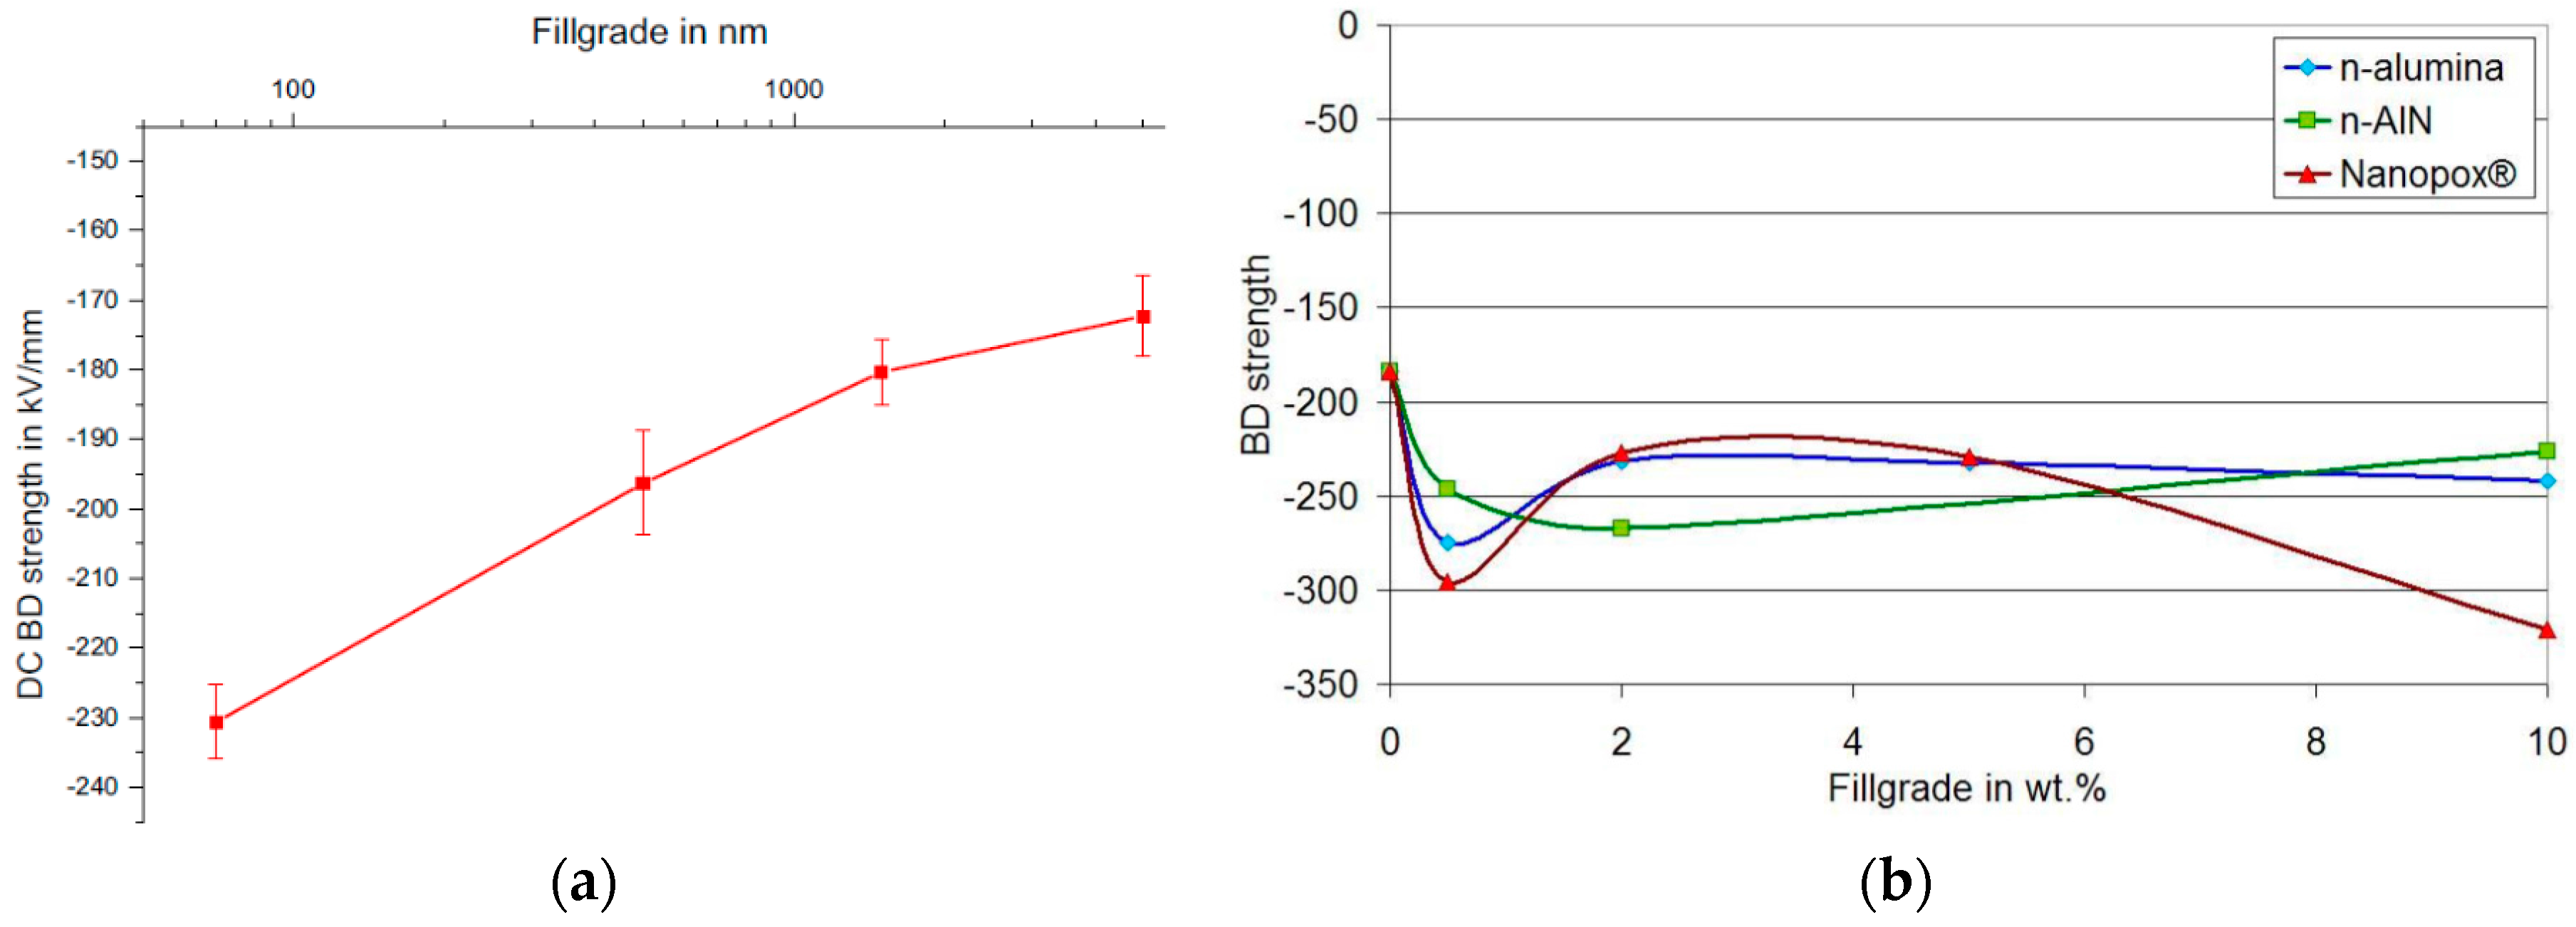
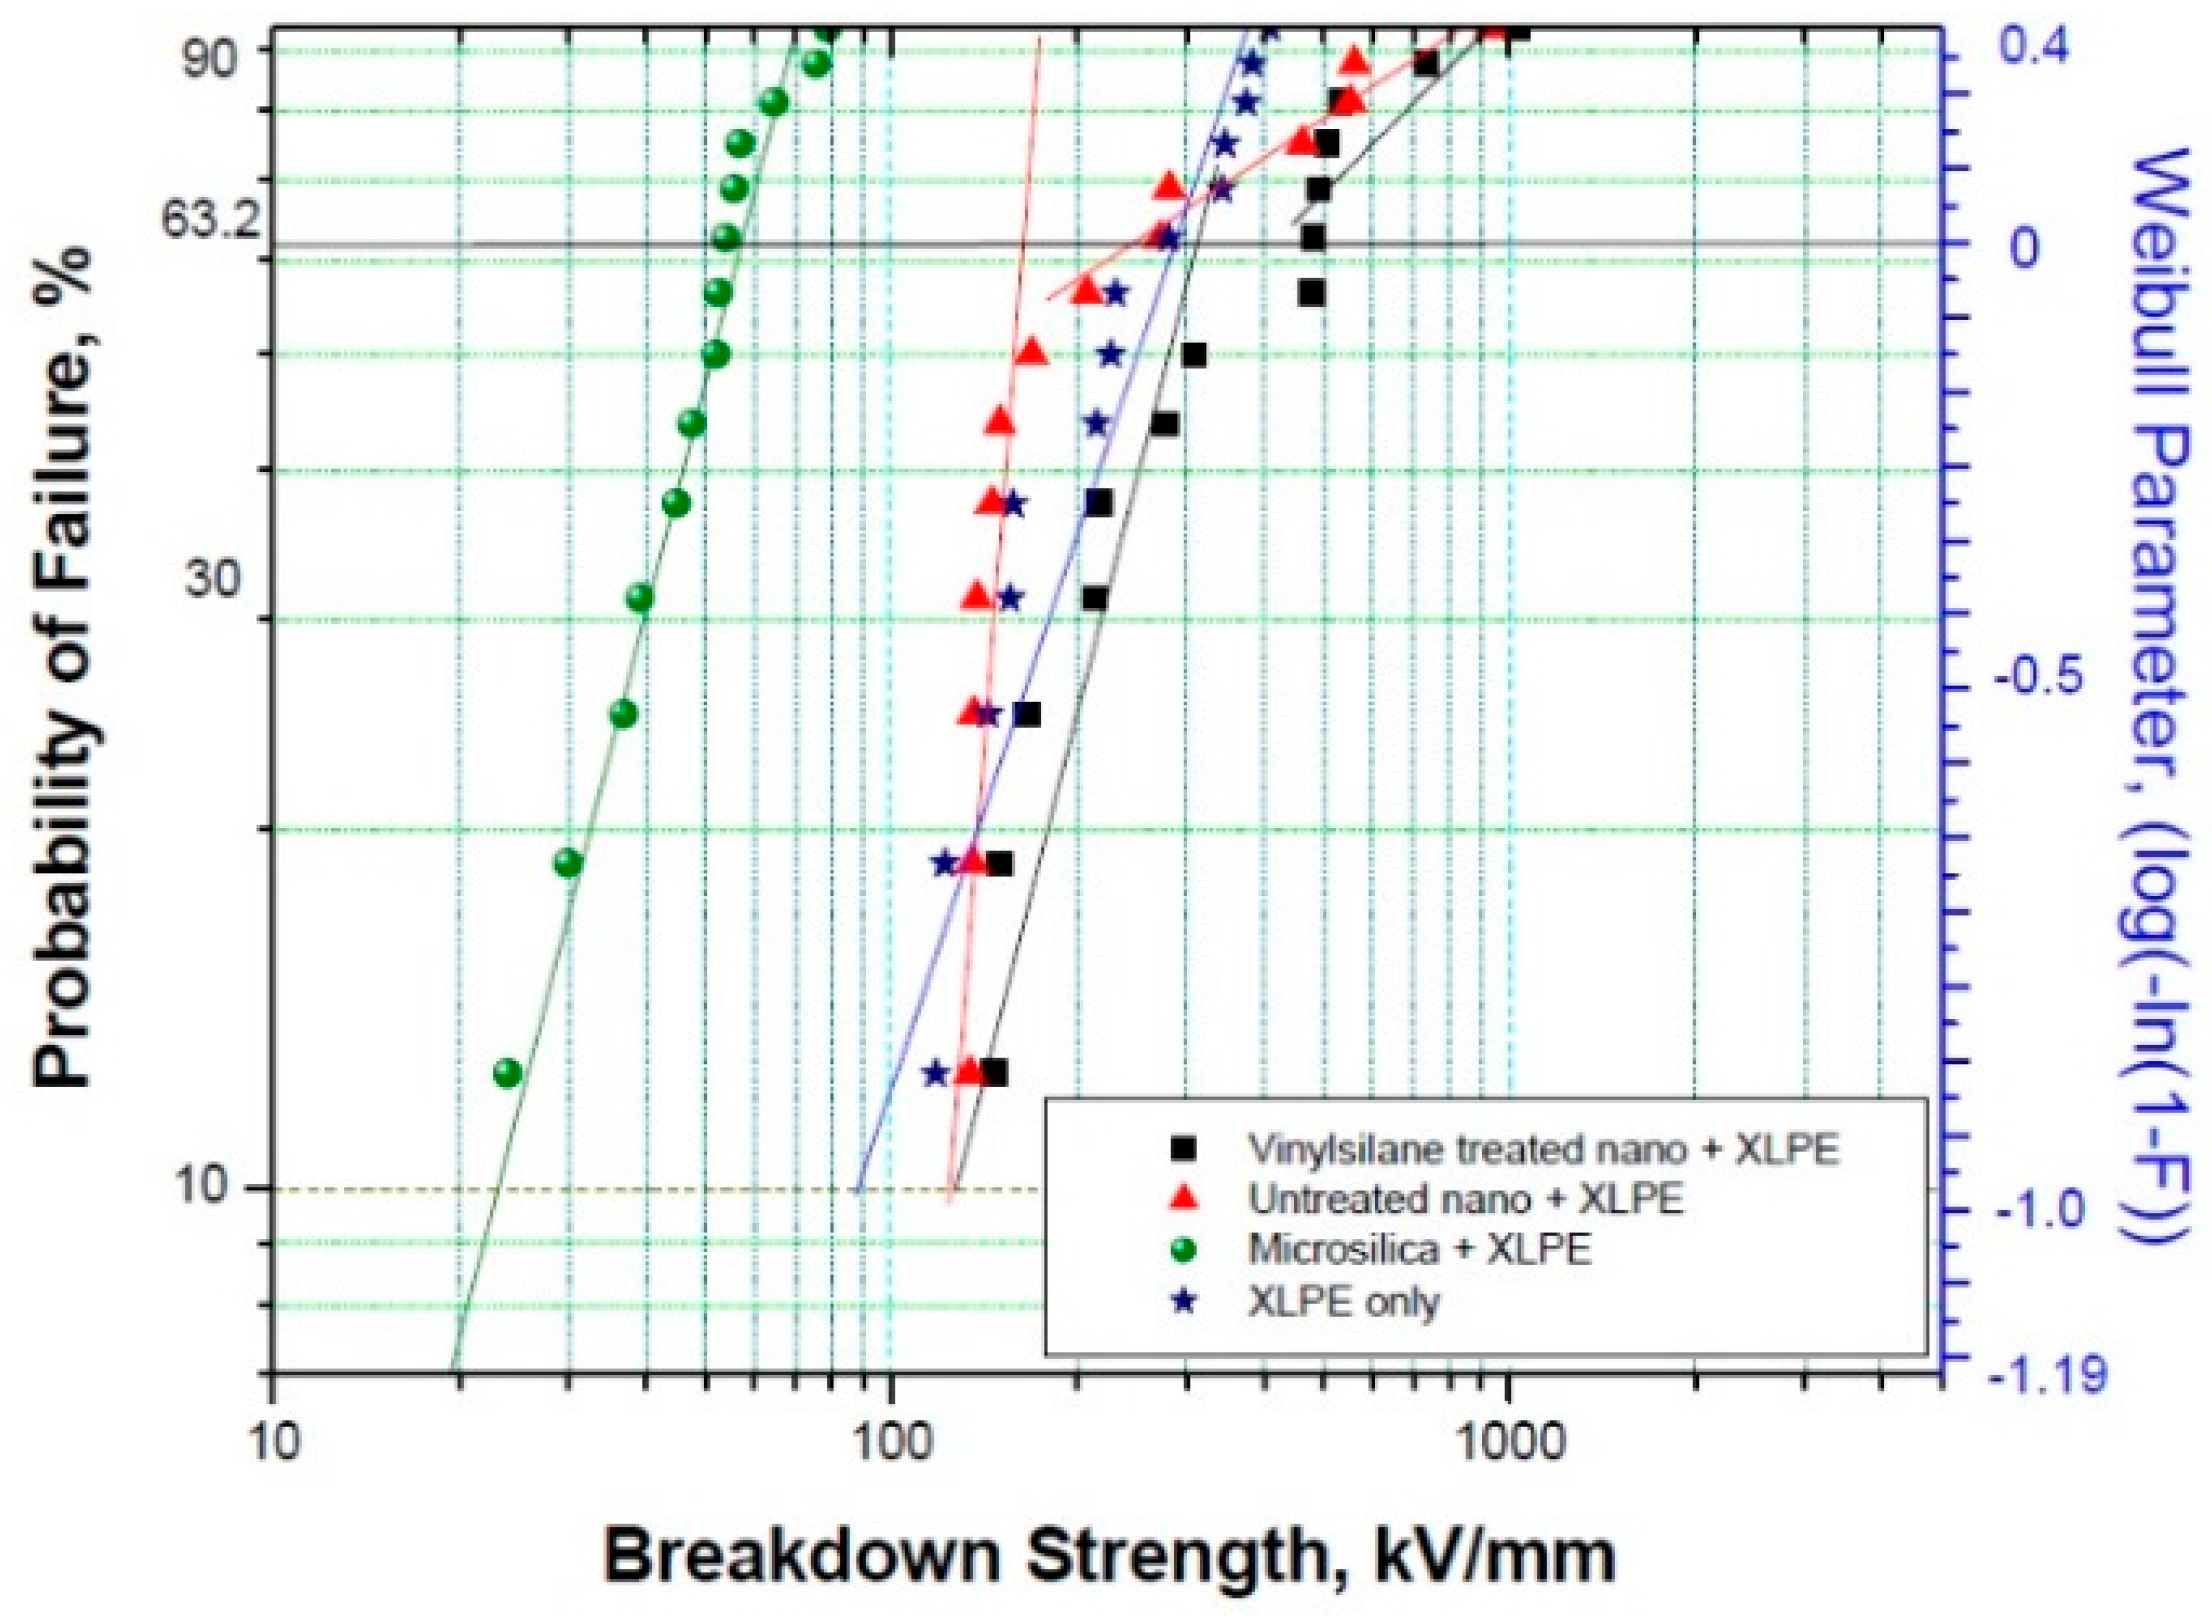
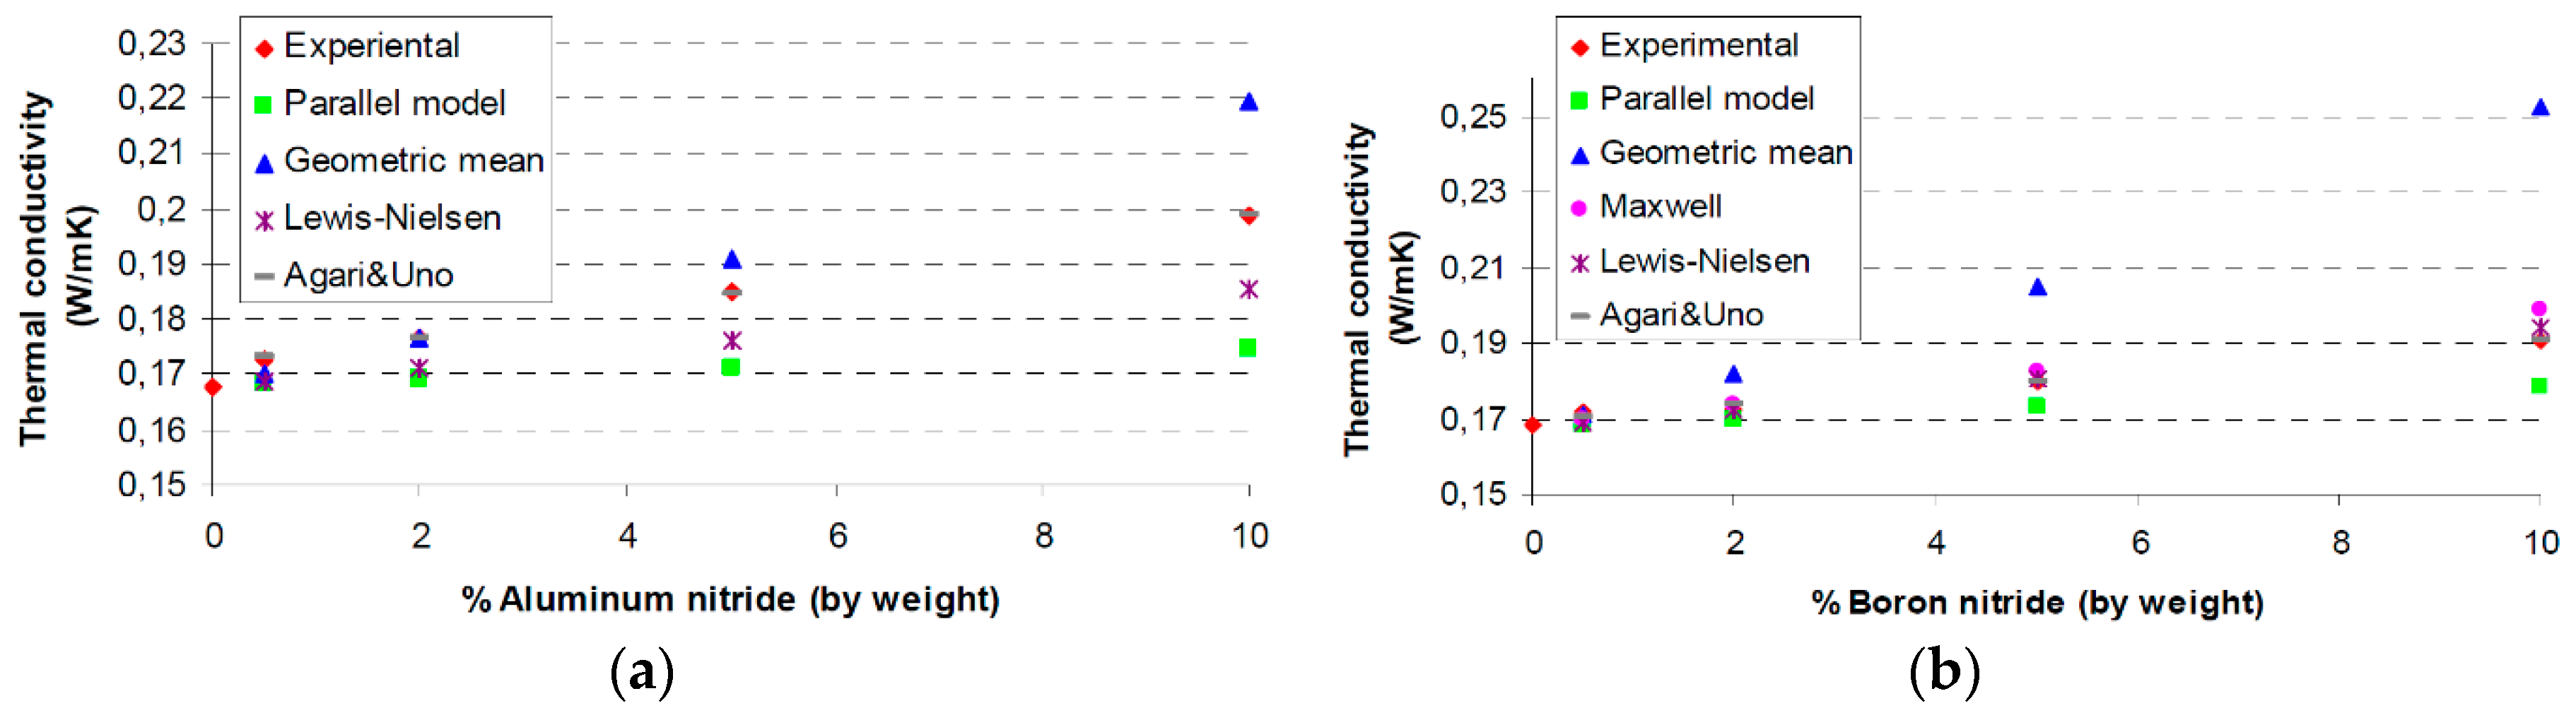
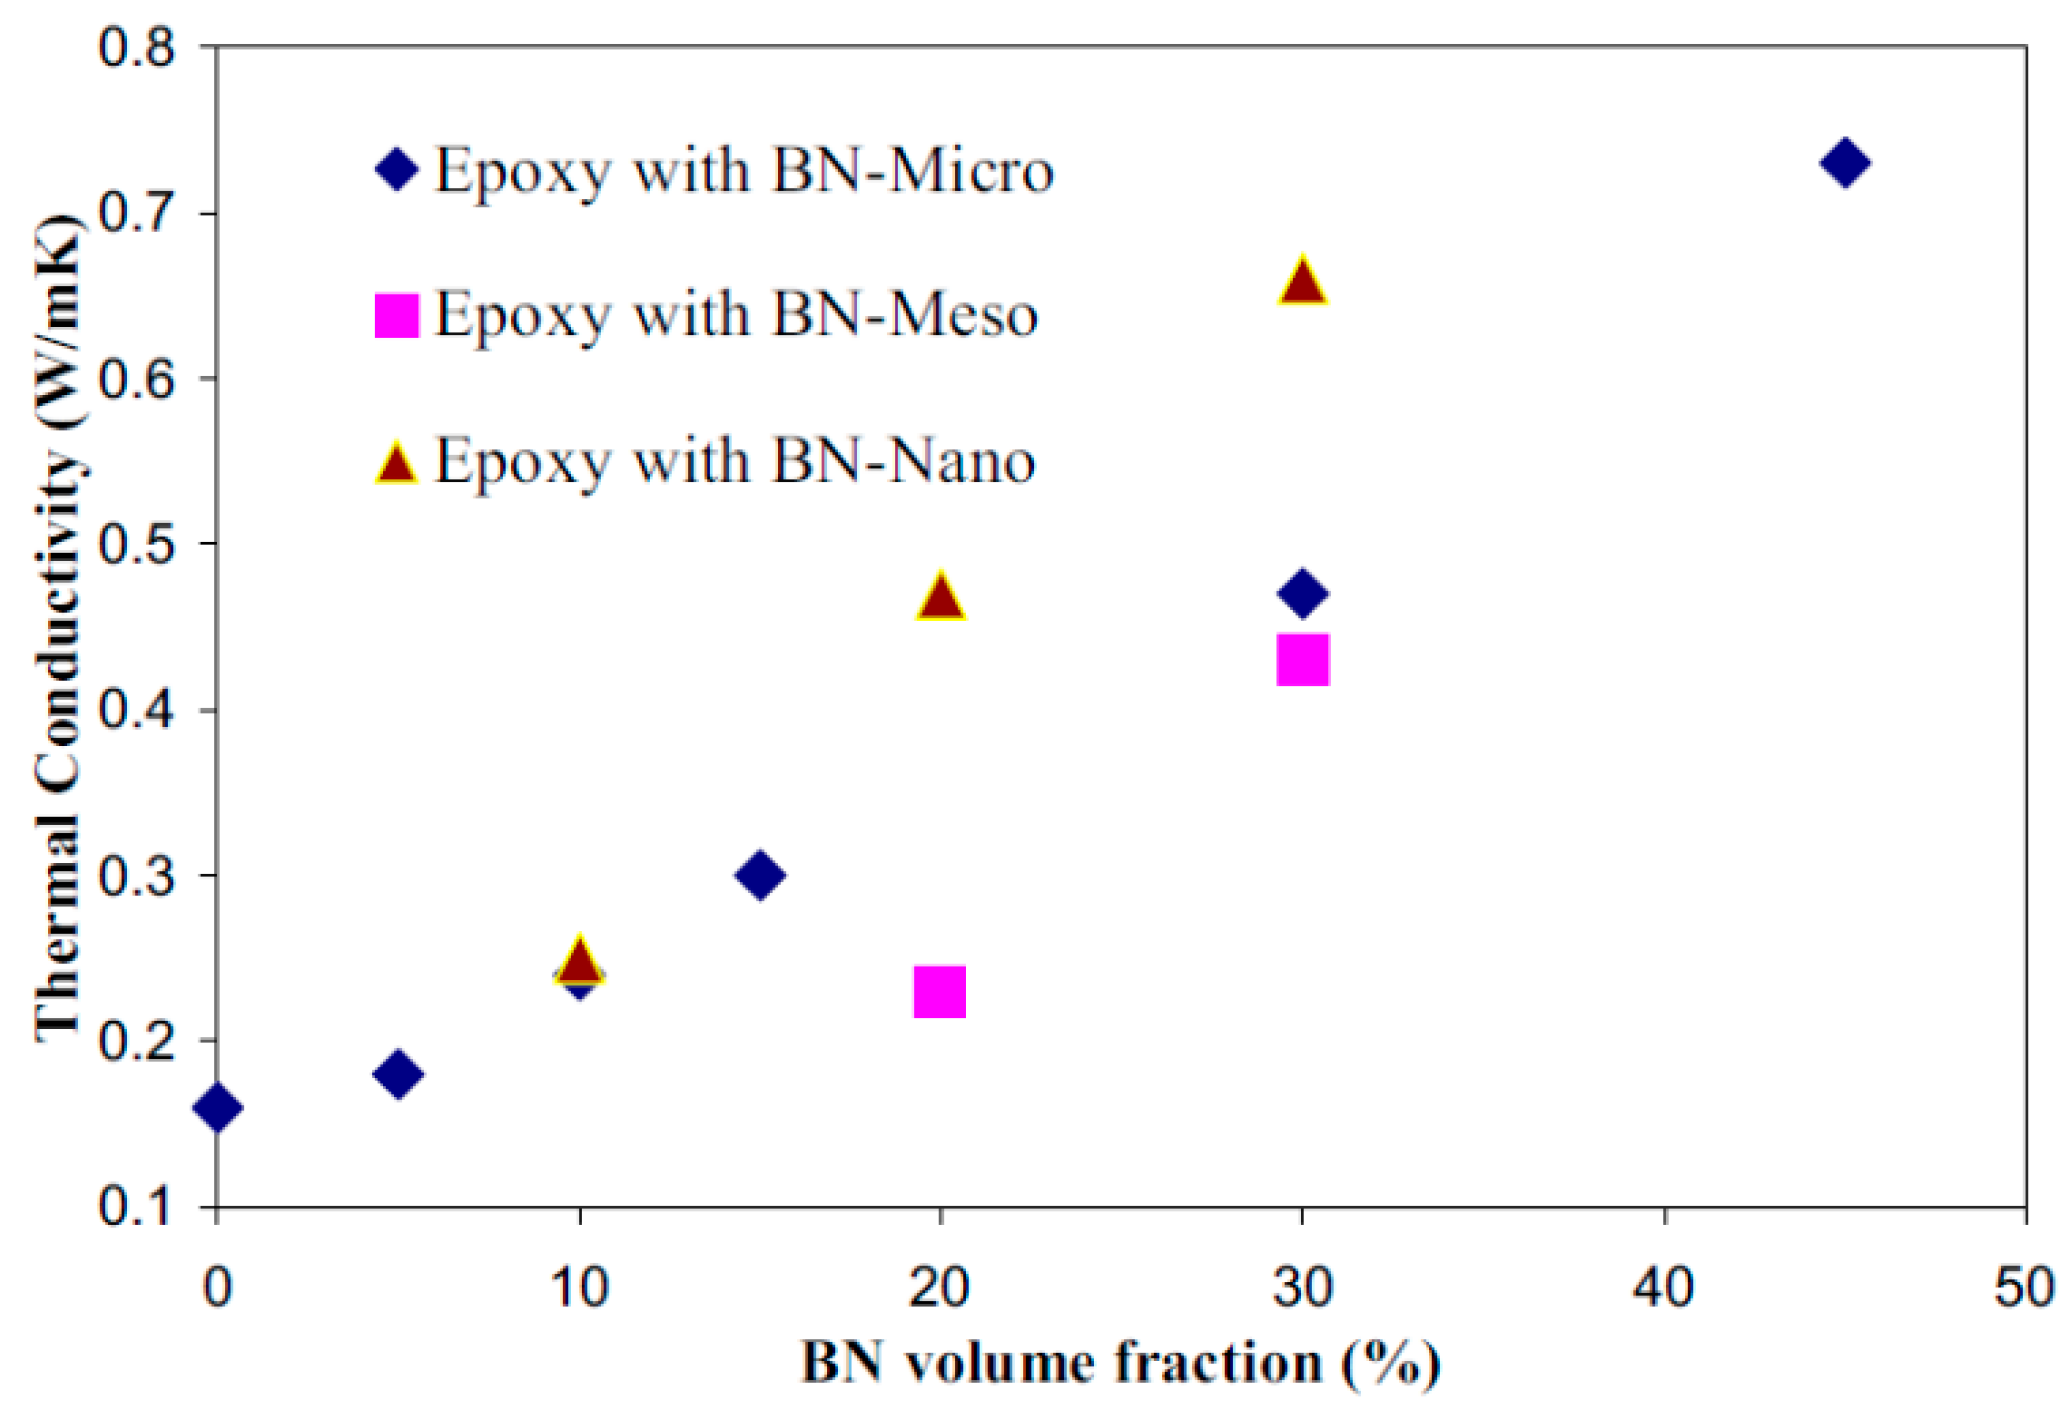
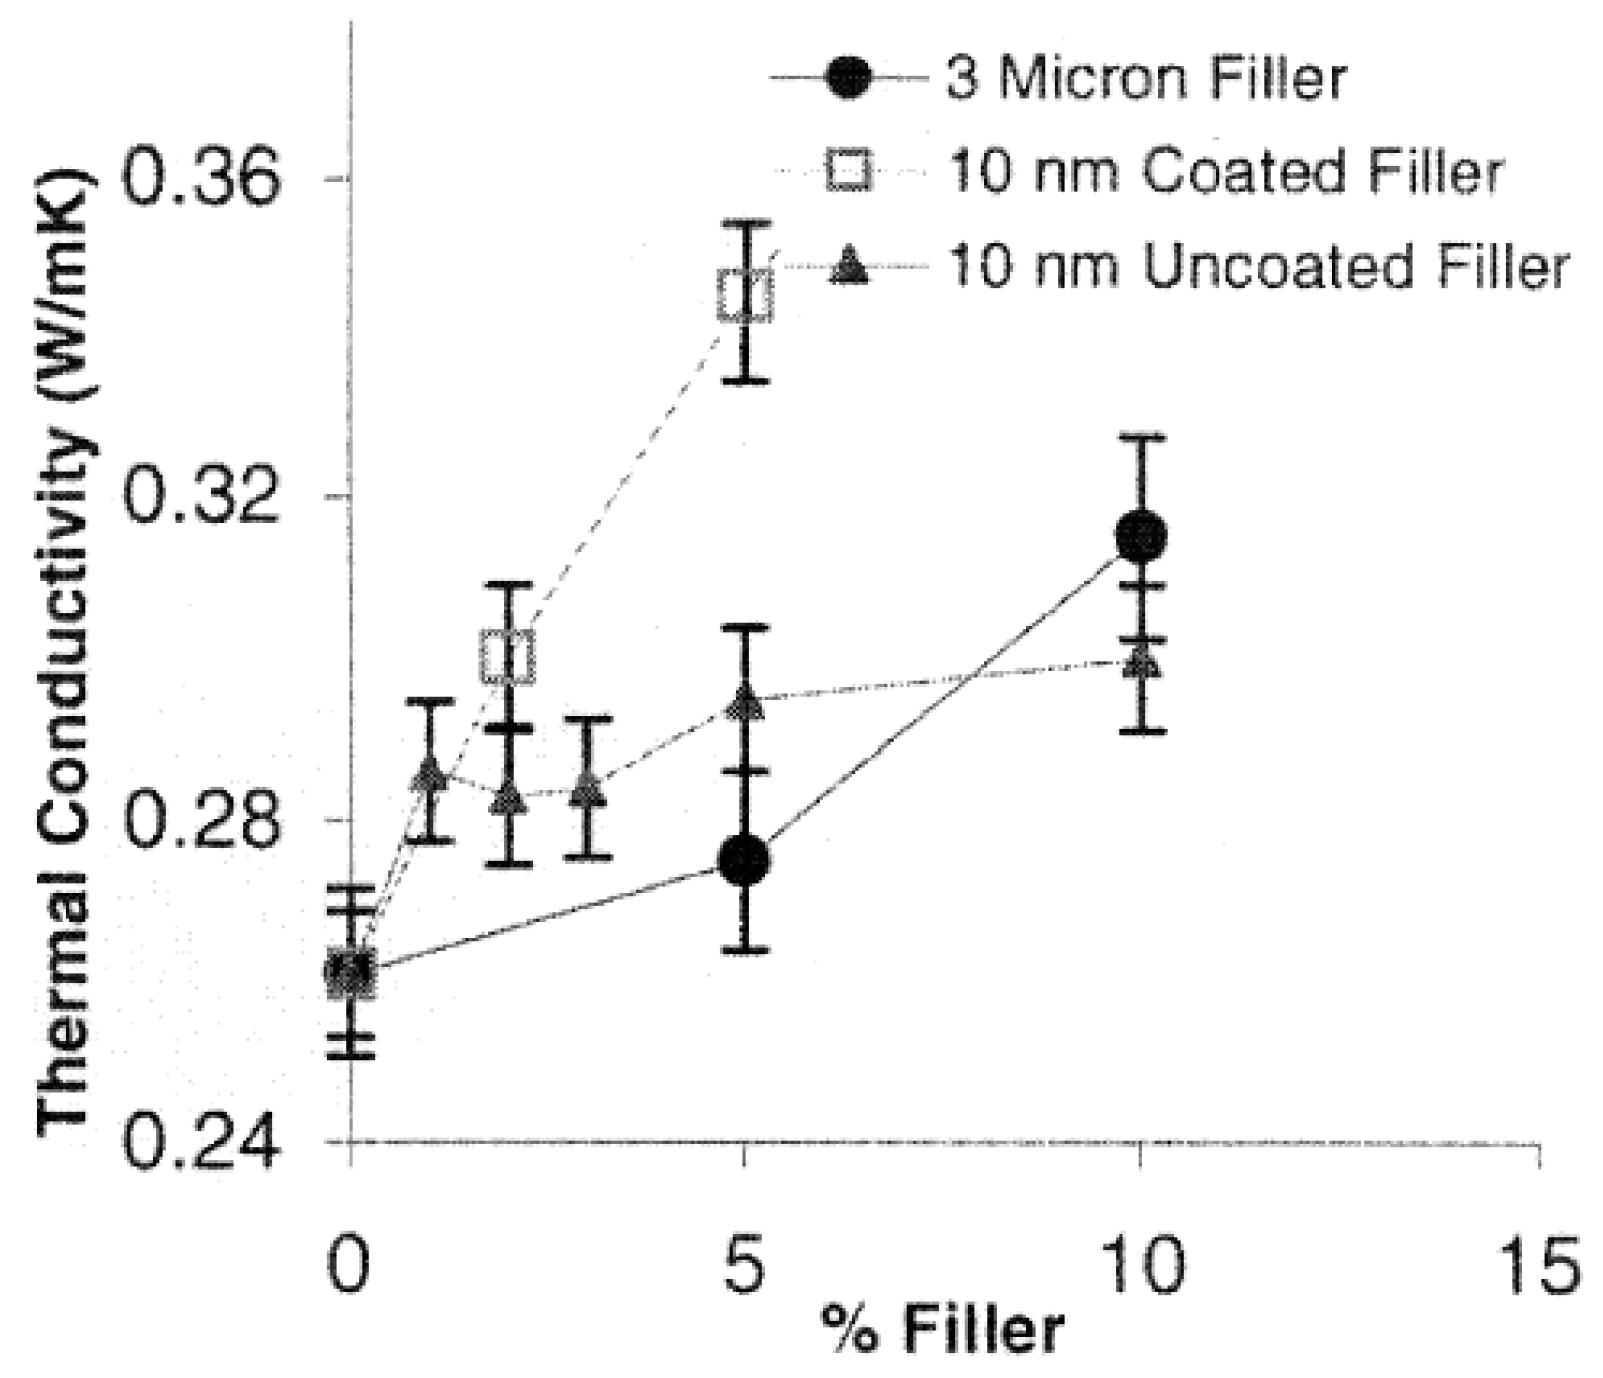
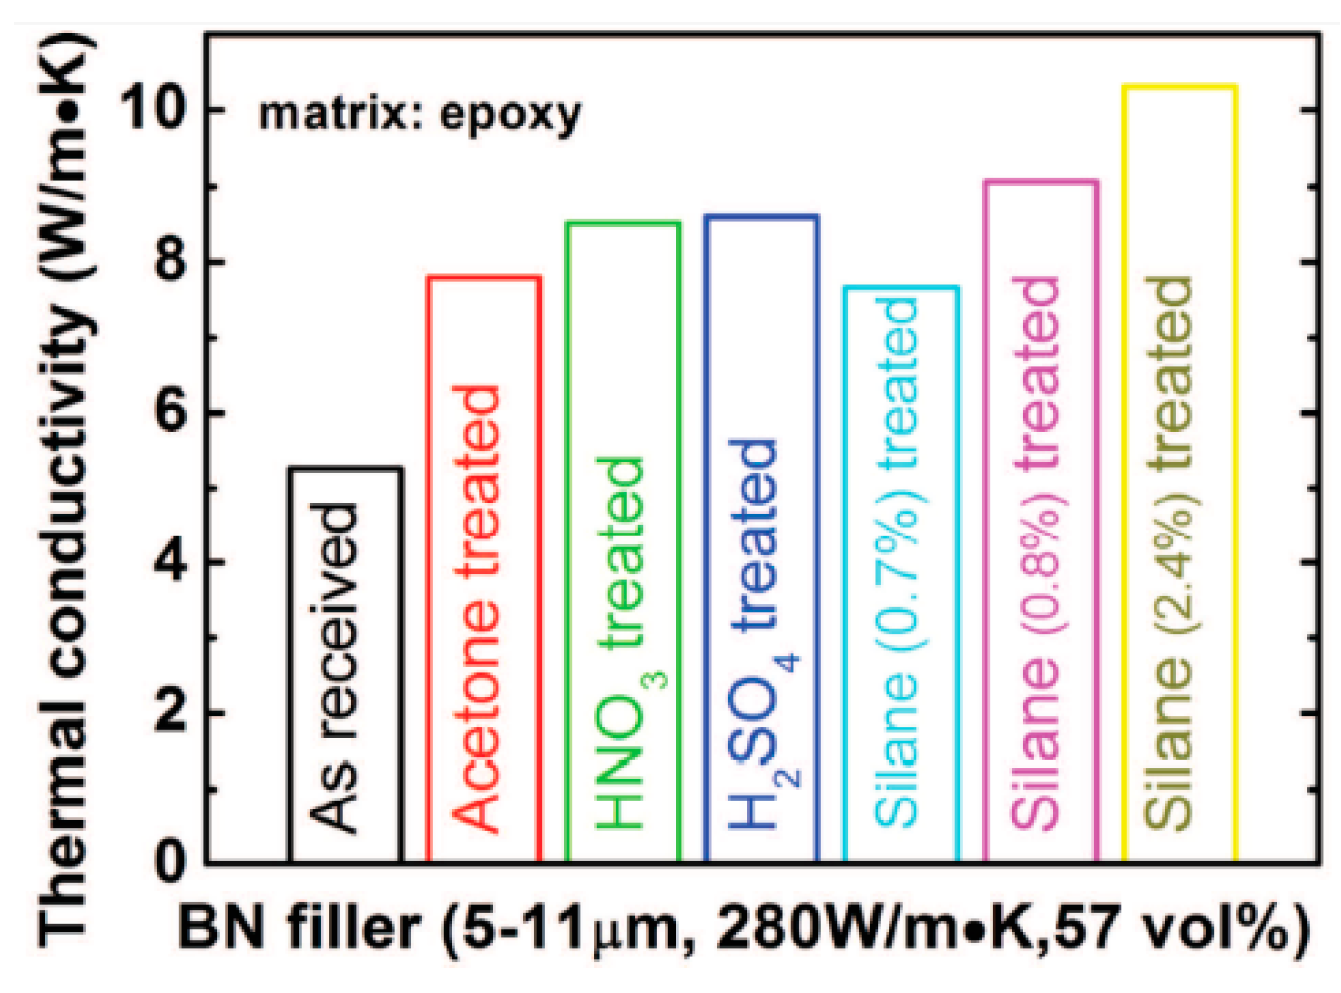
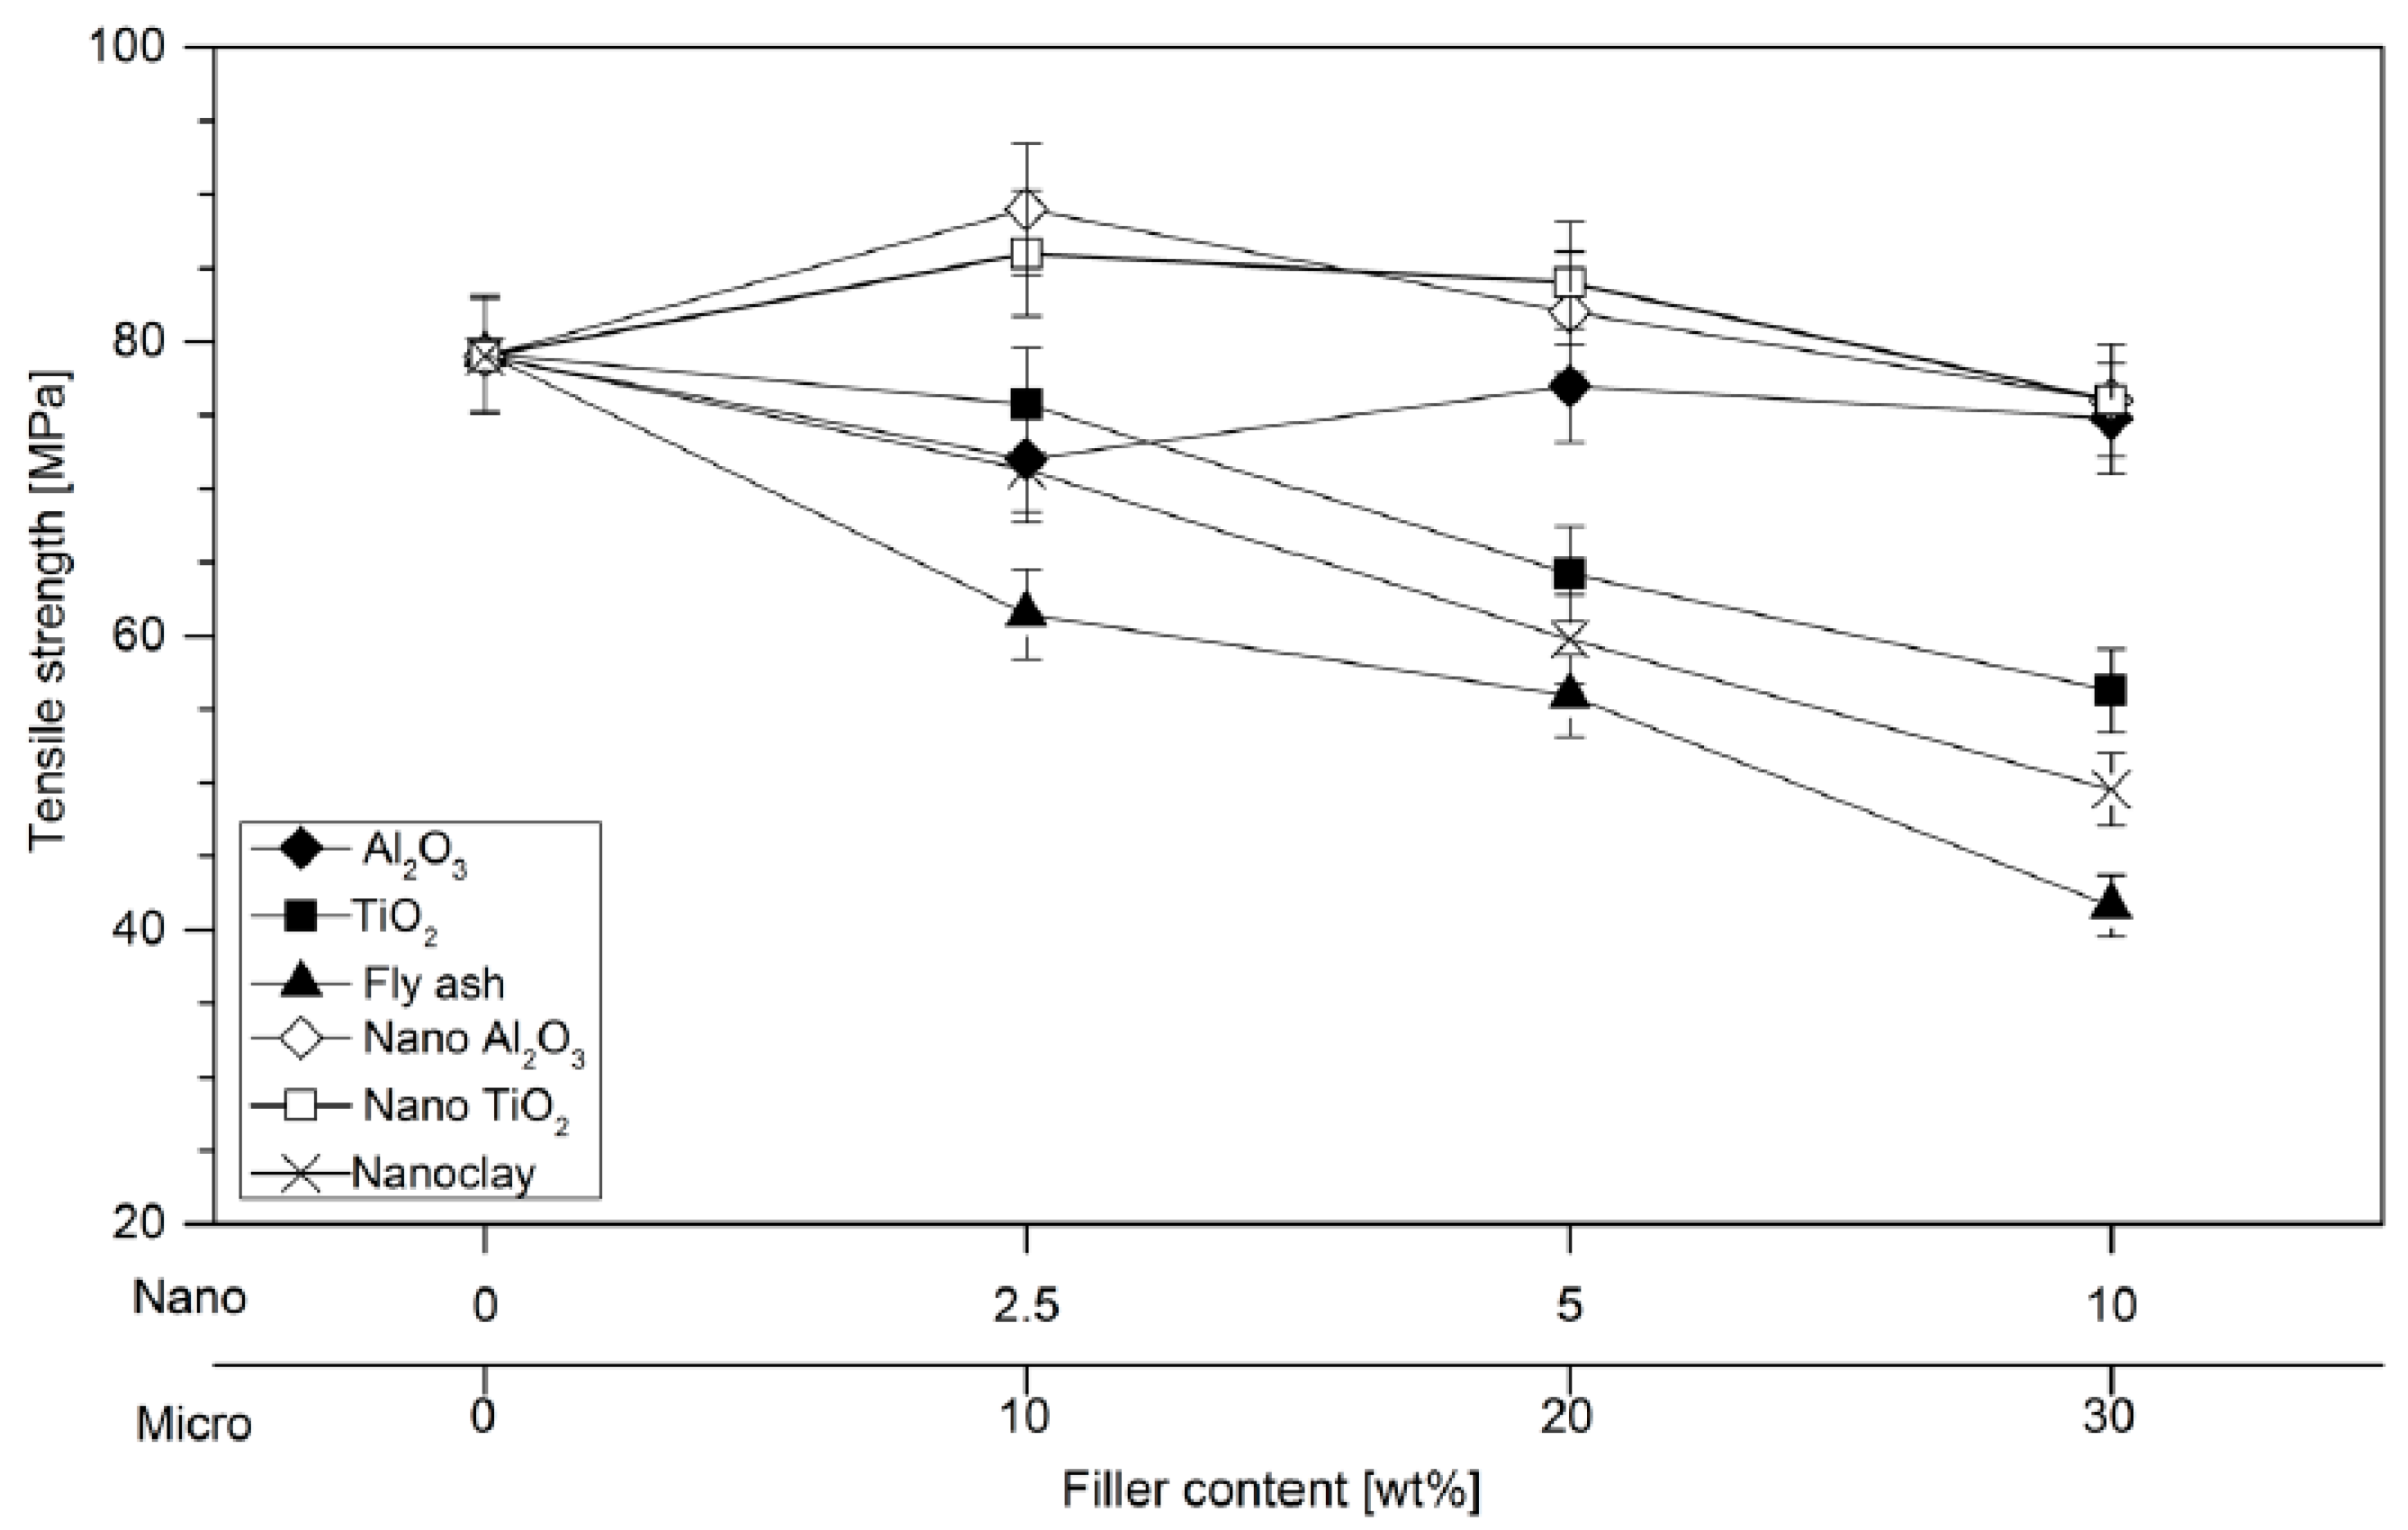
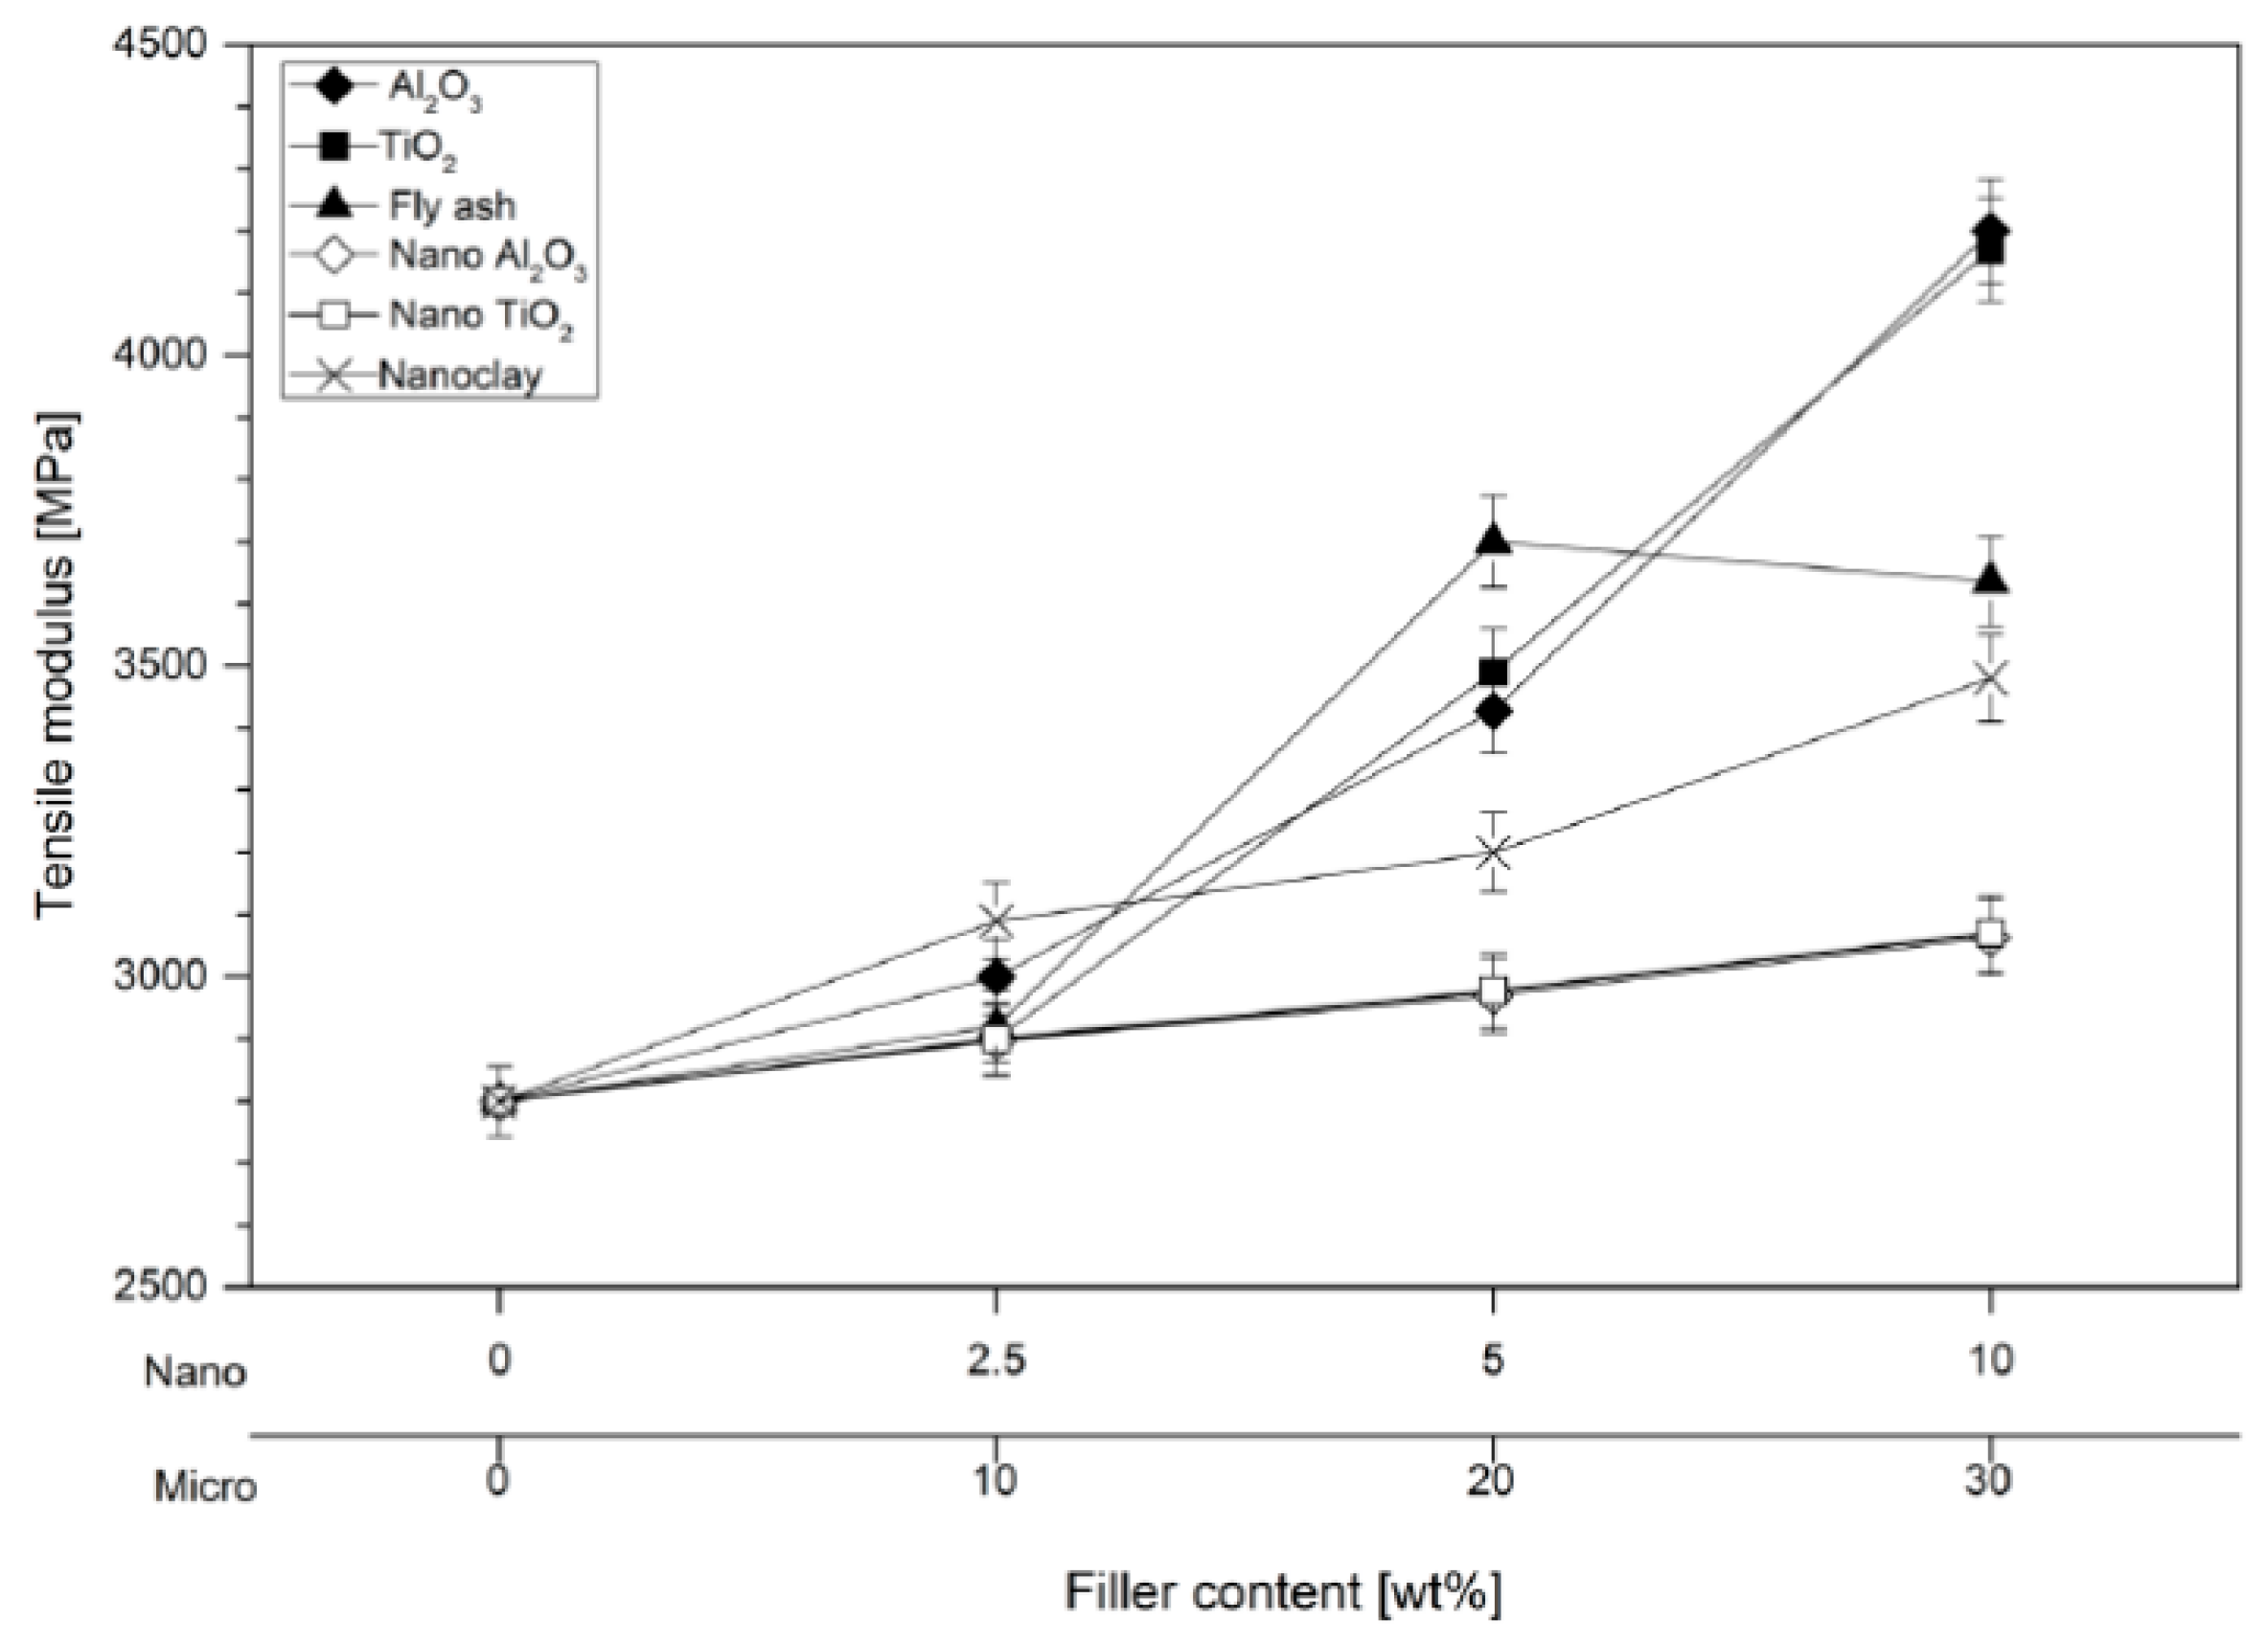
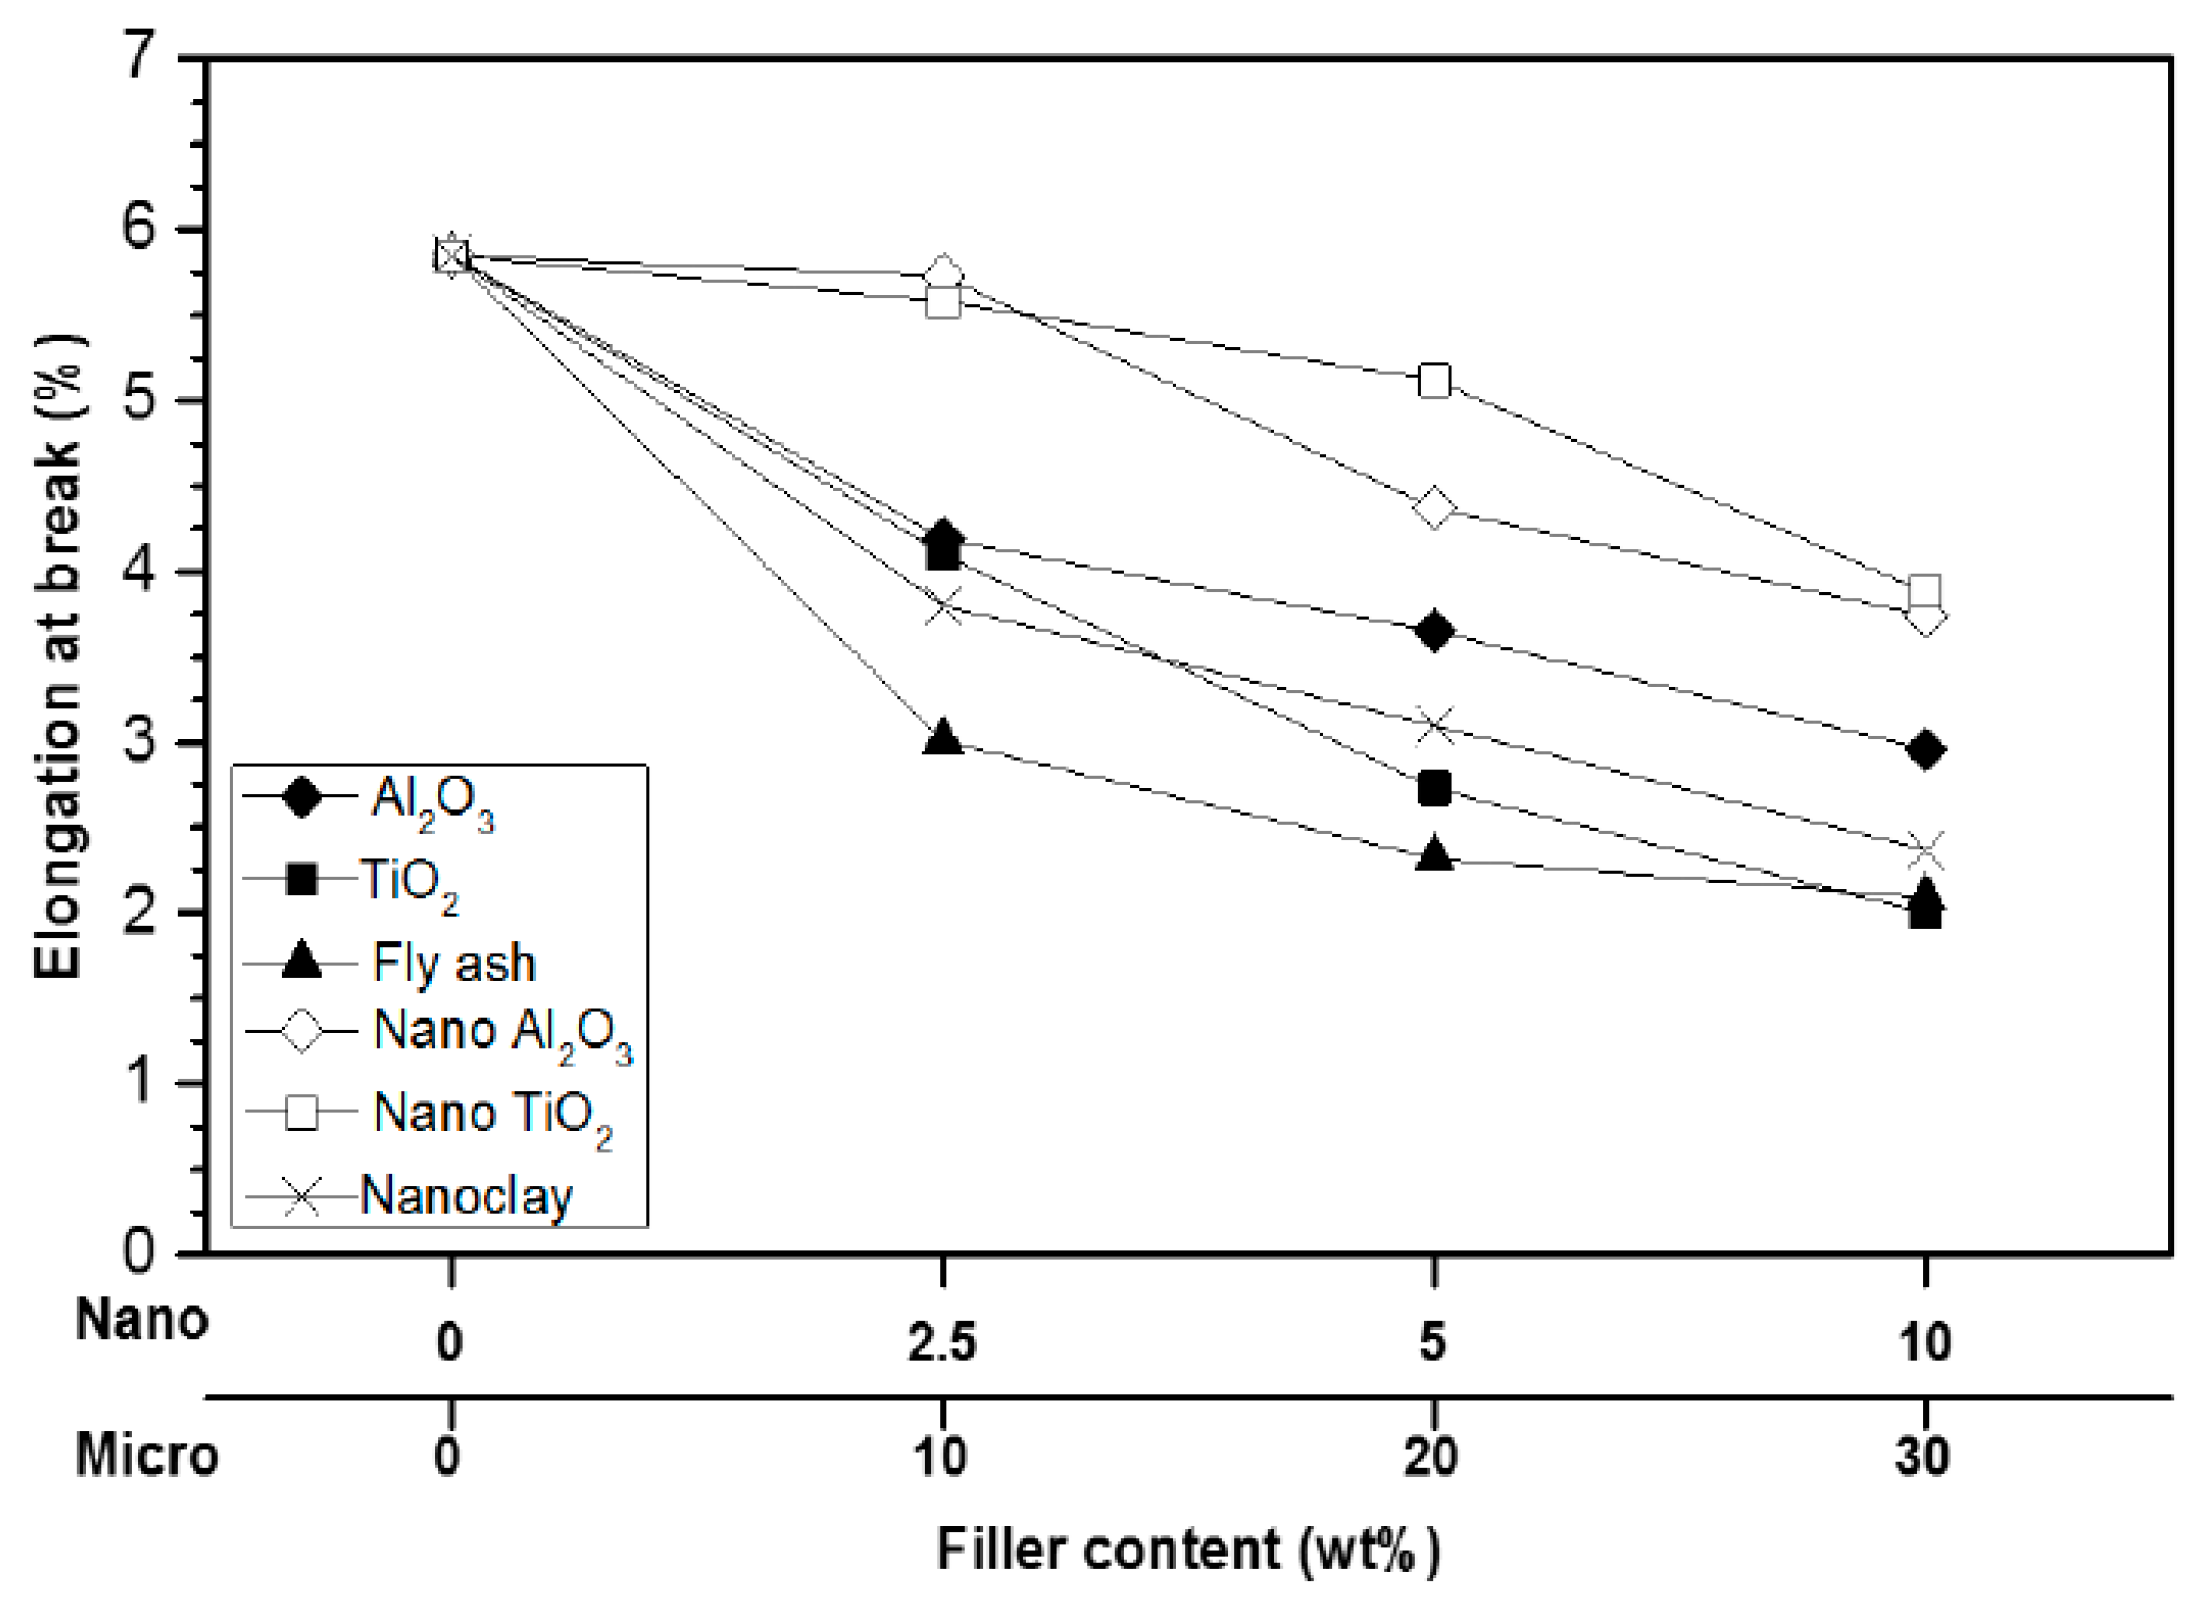