Article

Novel Magnet and Thermoresponsive Chemosensory Electrospinning Fluorescent Nanofibers and Their Sensing Capability for Metal Ions

1
Institute of Organic and Polymeric Materials, National Taipei University of Technology, Taipei 10608, Taiwan
2
Institute of Glycosciences, Grenoble Alpes University, CNRS, CERMAV UPR 5301, 38000 Grenoble, France
3
Department of Materials Engineering, Ming Chi University of Technology, New Taipei 24301, Taiwan
4
Department of Chemical and Materials Engineering, Chang Gung University, Taoyuan 33302, Taiwan
*
Author to whom correspondence should be addressed.
Polymers 2017, 9(4), 136; https://doi.org/10.3390/polym9040136
Submission received: 27 February 2017 / Revised: 4 April 2017 / Accepted: 6 April 2017 / Published: 10 April 2017
(This article belongs to the Special Issue Polymers for Chemosensing)

Abstract

:
Novel multifunctional switchable chemosensors based on fluorescent electrospun (ES) nanofibers with sensitivity toward magnetism, temperature, and mercury ions (Hg2+) were prepared using blends of poly(N-isopropylacrylamide)-co-(N-methylolacrylamide)-co-(Acrylic acid), the fluorescent probe 1-benzoyl-3-[2-(2-allyl-1,3-dioxo-2,3-dihydro-1Hbenzo[de]isoquinolin-6-ylamino)-ethyl]-thiourea (BNPTU), and magnetite nanoparticles (NPs), and a single-capillary spinneret. The moieties of N-isopropylacrylamide, N-methylolacrylamide, acrylic acid, BNPTU, and Iron oxide (Fe3O4) NPs were designed to provide thermoresponsiveness, chemical cross-linking, Fe3O4 NPs dispersion, Hg2+ sensing, and magnetism, respectively. The prepared nanofibers exhibited ultrasensitivity to Hg2+ (as low as 10−3 M) because of an 80-nm blueshift of the emission maximum (from green to blue) and 1.6-fold enhancement of the emission intensity, as well as substantial volume (or hydrophilic to hydrophobic) changes between 30 and 60 °C, attributed to the low critical solution temperature of the thermoresponsive N-isopropylacrylamide moiety. Such temperature-dependent variations in the presence of Hg2+ engendered distinct on–off switching of photoluminescence. The magnetic ES nanofibers can be collected using a magnet rather than being extracted through alternative methods. The results indicate that the prepared multifunctional fluorescent ES nanofibrous membranes can be used as naked eye sensors and have the potential for application in multifunctional environmental sensing devices for detecting metal ions, temperature, and magnetism as well as for water purification sensing filters.

1. Introduction

In recent years, identifying the presence and concentration of heavy metal ions has received gradually increasing levels of attention because of emerging environmental and human health issues [1,2]. Heavy transition metal (HTM) cations and their derivatives are used extensively in the industrial sector, and can cause adverse environment and health problems [3,4]; thus, developing sensitive and selective fluorescent chromogenic probes composed of chelating ligands that are used to detect HTM cations in biological and environmental sensory devices is crucial. Colorimetric derivative probes based on 1,8-naphthalimide have been used extensively in fluorescence detection for HTMs such as Hg2+, Cd2+, and Cu2+ because of their many excellent optical properties such as high quantum yields and high photo stability [5,6,7,8,9,10,11]. A new fluorescent chemodosimeter, namely a 1,8-naphthalimide-based colorimetric derivative, 1-benzoyl-3-[2-(2-allyl-1,3-dioxo-2,3-dihydro-1Hbenzo[de]isoquinolin-6-ylamino)-ethyl]-thiourea (BNPTU), with high selectivity for Hg2+ in aqueous solutions and based on the reactivity of thiourea derivatives toward Hg2+ was reported by Liu et al. [5]. Mercury-triggered intramolecular cyclization of thiourea results in the formation of a highly blue fluorescent naphthalimide derivative, whereas the dosimeter itself fluoresces yellowish green.
Poly(N-isopropyl acrylamide) (PNIPAM) is a well-known thermosensitive polymer that exhibits a low critical solution temperature (LCST) of 32 °C, close to the healthy human body temperature. PNIPAM exhibits a hydrophilic extended structure below its LCST, whereas above its LCST, it dehydrates and exhibits a compact structure [12]. Chen reported that introducing hydrophilic acrylic acid (AA) monomers with different compositions can change the thermal responses of PNIPAM microgels. Furthermore, the AA content of poly(NIPAM-co-AA) can be adjusted to change the LCST, with the hydrogen bonding interaction being the fundamental cause of the change [13]. However, all of the aforereferenced studies adopted solutions and polymer composites rather than nanofibers in sensory applications. The high surface-to-volume ratio of nanofibers could induce responses in metal ions-sensitive, temperature-sensitive, and multifunctional sensory materials.
Electrospinning is an easy, versatile, and inexpensive technique that enables the assembly of various functional nanofibers [14,15,16,17]. The high surface-to-volume ratio of electrospun (ES) nanofibers has encouraged extensive research on sensory applications including sensors for pH levels [18], temperatures [19,20], nitric oxide [21], and metal ions [22,23,24,25,26]. Recently, various fluorescent sensor-based ES polymer nanofibers for sensing pH or different metal ions such as Hg2+, Fe3+, Zn2+, and Cu2+ were successfully prepared by our research group [24,25,26]. These multifunctional fluorescent ES nanofibers exhibited distinct on–off switching capabilities such as quenching–enhancing photoluminescence (PL) intensity and changed–recovered PL colors for sensing various pH levels or metal ions.
Poly(acrylic acid) (PAA) is a weak polyelectrolyte often used to change the surface properties of inorganic particles, because of the strong chelation of its numerous carboxyl groups with metal ions. Iron oxide (Fe3O4) nanoparticles (NPs) obtained through a one-pot method with PAA can solve the agglomeration problem [27,28,29,30,31]. Recently, Liu reported the fabrication of Fe3O4 NP, PAA, and polyvinyl alcohol composite ES nanofibers with a homogeneous dispersion of Fe3O4 NPs and high water resistance [32]. In addition, Xu et al. developed a material for industrial wastewater treatment combining polydopamine-coated mesh with PAA. This material not only selectively detects Hg2+ but also effectively separates oil and water, a process attributed to the hydrophilicity of PAA and the change in mesh wettability based on the chelation between Hg2+ and PAA [33]. However, most studies on polymer-inorganic composites have focused on exploring their physical properties, which have seldom been studied in terms of their combination with metal ions, temperature, and magnetic mulfunctional materials in sensory applications. This paper reports the production of novel multifunctional switchable ES nanofiber sensors from blends of multifunctional copolymers and Fe3O4 NPs. Comprising traditional polymer-inorganic composite ES nanofibers, our chemosensors can simultaneously detect metal ions, temperature, and magnetism.
In this study, we developed magnetic fluorescent sensory ES nanofibers by using blends of poly(N-isopropylacrylamide)-co-(N-methylolacrylamide)-co-(acrylic acid) (poly(NIPAAm-co-NMA-co-AA)), fluorescent BNPTU, and Fe3O4 NPs and a single-capillary spinneret. The nanofibers, which can sense Hg2+, temperature, and magnetism simultaneously, were prepared by combining synthesis and electrospinning, and their optical applications and morphological characteristics were analyzed. The process for synthesizing fluorescent BNPTU probes is shown in Figure 1. The poly(NIPAAm-co-NMA-co-AA) was synthesized through free radical polymerization (Figure 2a). The moieties of N-isopropylacrylamide (NIPAAm), N-methylolacrylamide (NMA), AA, BNPTU, and Fe3O4 NPs were designed to achieve thermoresponsiveness, chemical cross-linking, hydrophilicity, Hg2+ sensing, and magnetism, respectively. A single-capillary spinneret was used to fabricate ES nanofibers from poly(NIPAAm-co-NMA-co-AA) blended with BNPTU (10%) and Fe3O4 NPs (5%). The nanofibers were then post-treated through chemical cross-linking to enhance their stability in water (Figure 2b). The fluorescence emission of BNPTU is highly selective and Hg2+ dependent. When BNPTU is used to detect Hg2+, its fluorescence emission changes from green to blue, and the NIPAAm and Fe3O4 NPs exhibit thermoresponsive magnetic properties, respectively (Figure 2c). The relationship between the morphology of the ES nanofibers and their photophysical properties together with their sensing behavior in aqueous solutions was systematically investigated. The favorable detection of Hg2+, temperature, and magnetism demonstrated by the experimental results suggests that ES nanofibrous membranes can be used as naked eye sensors, and have the potential for application in multifunctional environmental sensing devices.

2. Experimental Section

2.1. Materials

N-Isopropylacrylamide (NIPAAm) and N-methylolacrylamide (NMA) were provided by Tokyo Chemical Industry Co. Japan. NIPAAm was re-crystallized three times from hexane–toluene (10/1, v/v) prior to use. Acrylic acid (AA, Aldrich, Saint Louis, MO, USA, 99%) was dried over CaH2 to distill in a round-bottomed flask overnight, then purified by passing it through a short aluminum-oxide column (50–200 μm), and stored at 4 °C prior to use. The radical initiator 2,2′-azobis(2-methylpropionitrile) (AIBN) was purchased from UniRegion Bio-Tech and was recrystallized twice in ethanol prior to use. Iron (II) (FeCl2∙4H2O) and Iron (III) (FeCl3∙6H2O) chloride hexahydrate (Aldrich, 99%), dichloromethane (Tedia, Fairfield, OH, USA, 99.9%); methanol (Tedia, HPLC/SPECTRO); NH4OH (Alfa, 28%); anhydrous tetrahydrofuran (99.9%); acetone (99.8%); calcium hydride (reagent grade 95%); diethyl ether (99%); 4-bromo-1,8-naphthalic anhydride (95%); benzoyl isothiocyanate (98%); allylamine (98%); 1,2-ethylenediamine (99%); chloroform (anhydrous, 99%); N,N-dimethylformamide (99%); 1,4-dioxane (99.5%); acetonitrile (99%); ethanol (99.8%); and hydrazine hydrate (reagent grade, N2H4 50–60%) were used as received. Perchlorate salts of metal ions (Co2+, Cu2+, Fe2+, Mg2+, Hg2+, Pb2+, Zn2+, Cd2+, Ni2+) were purchased from Sigma-Aldrich (Saint Louis, MO, USA).

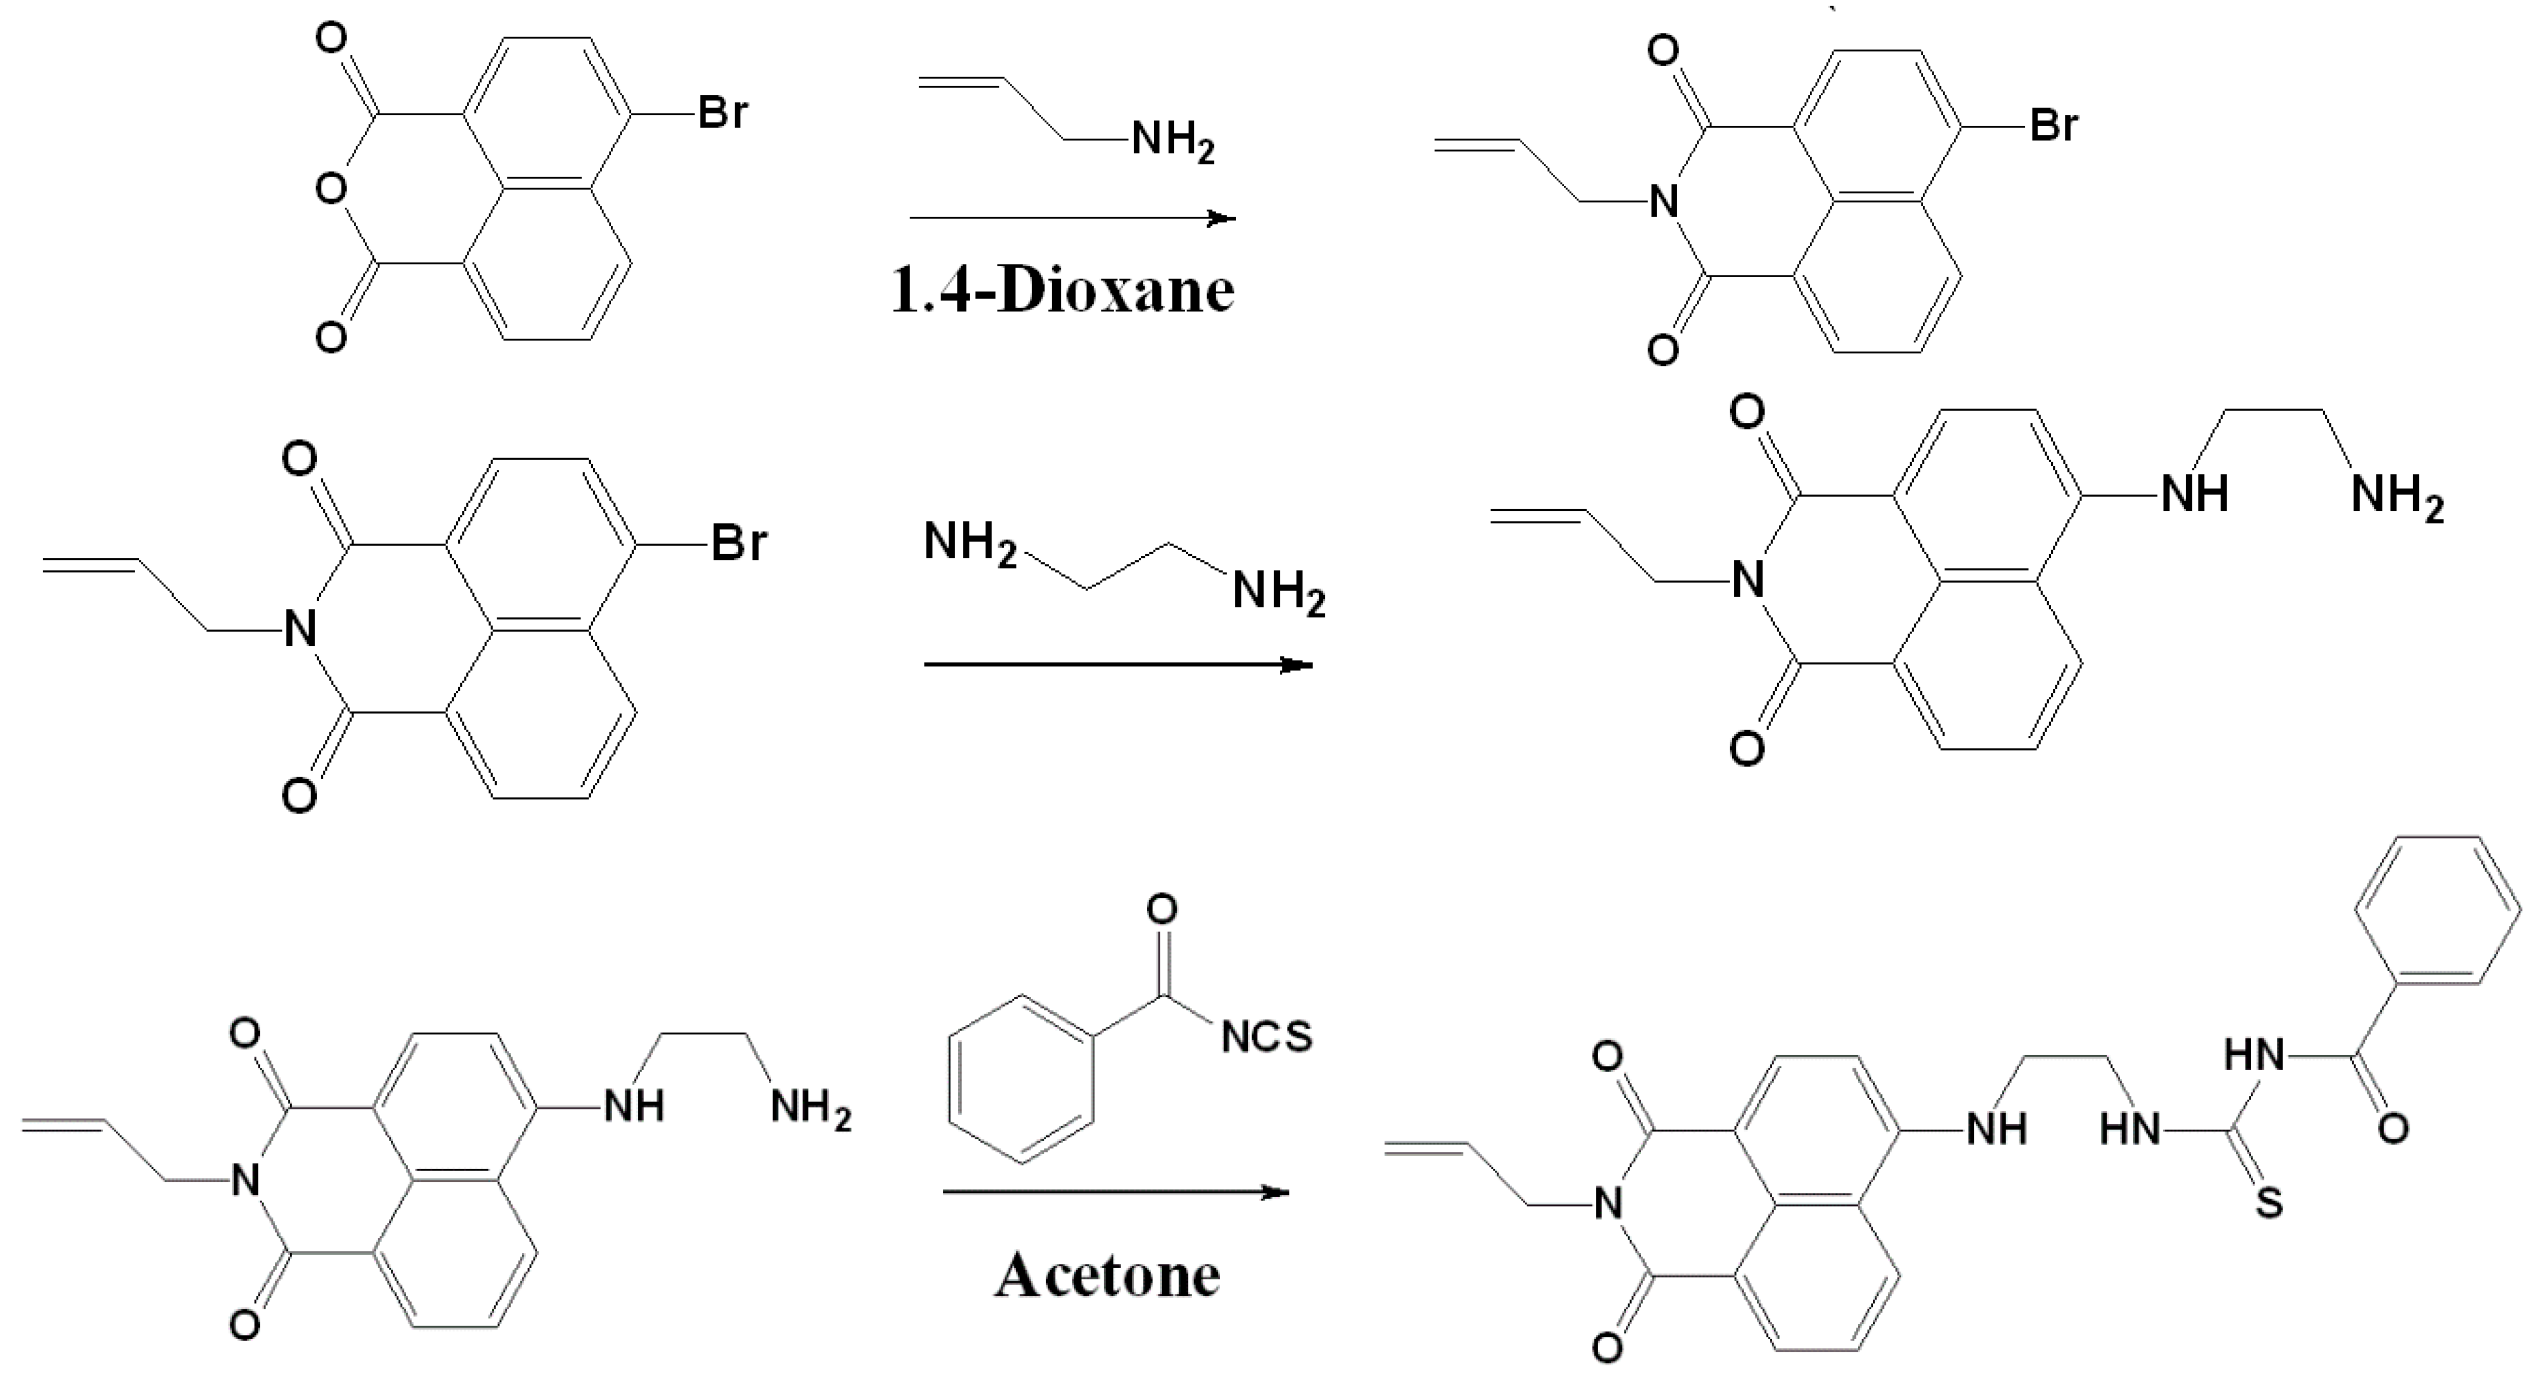
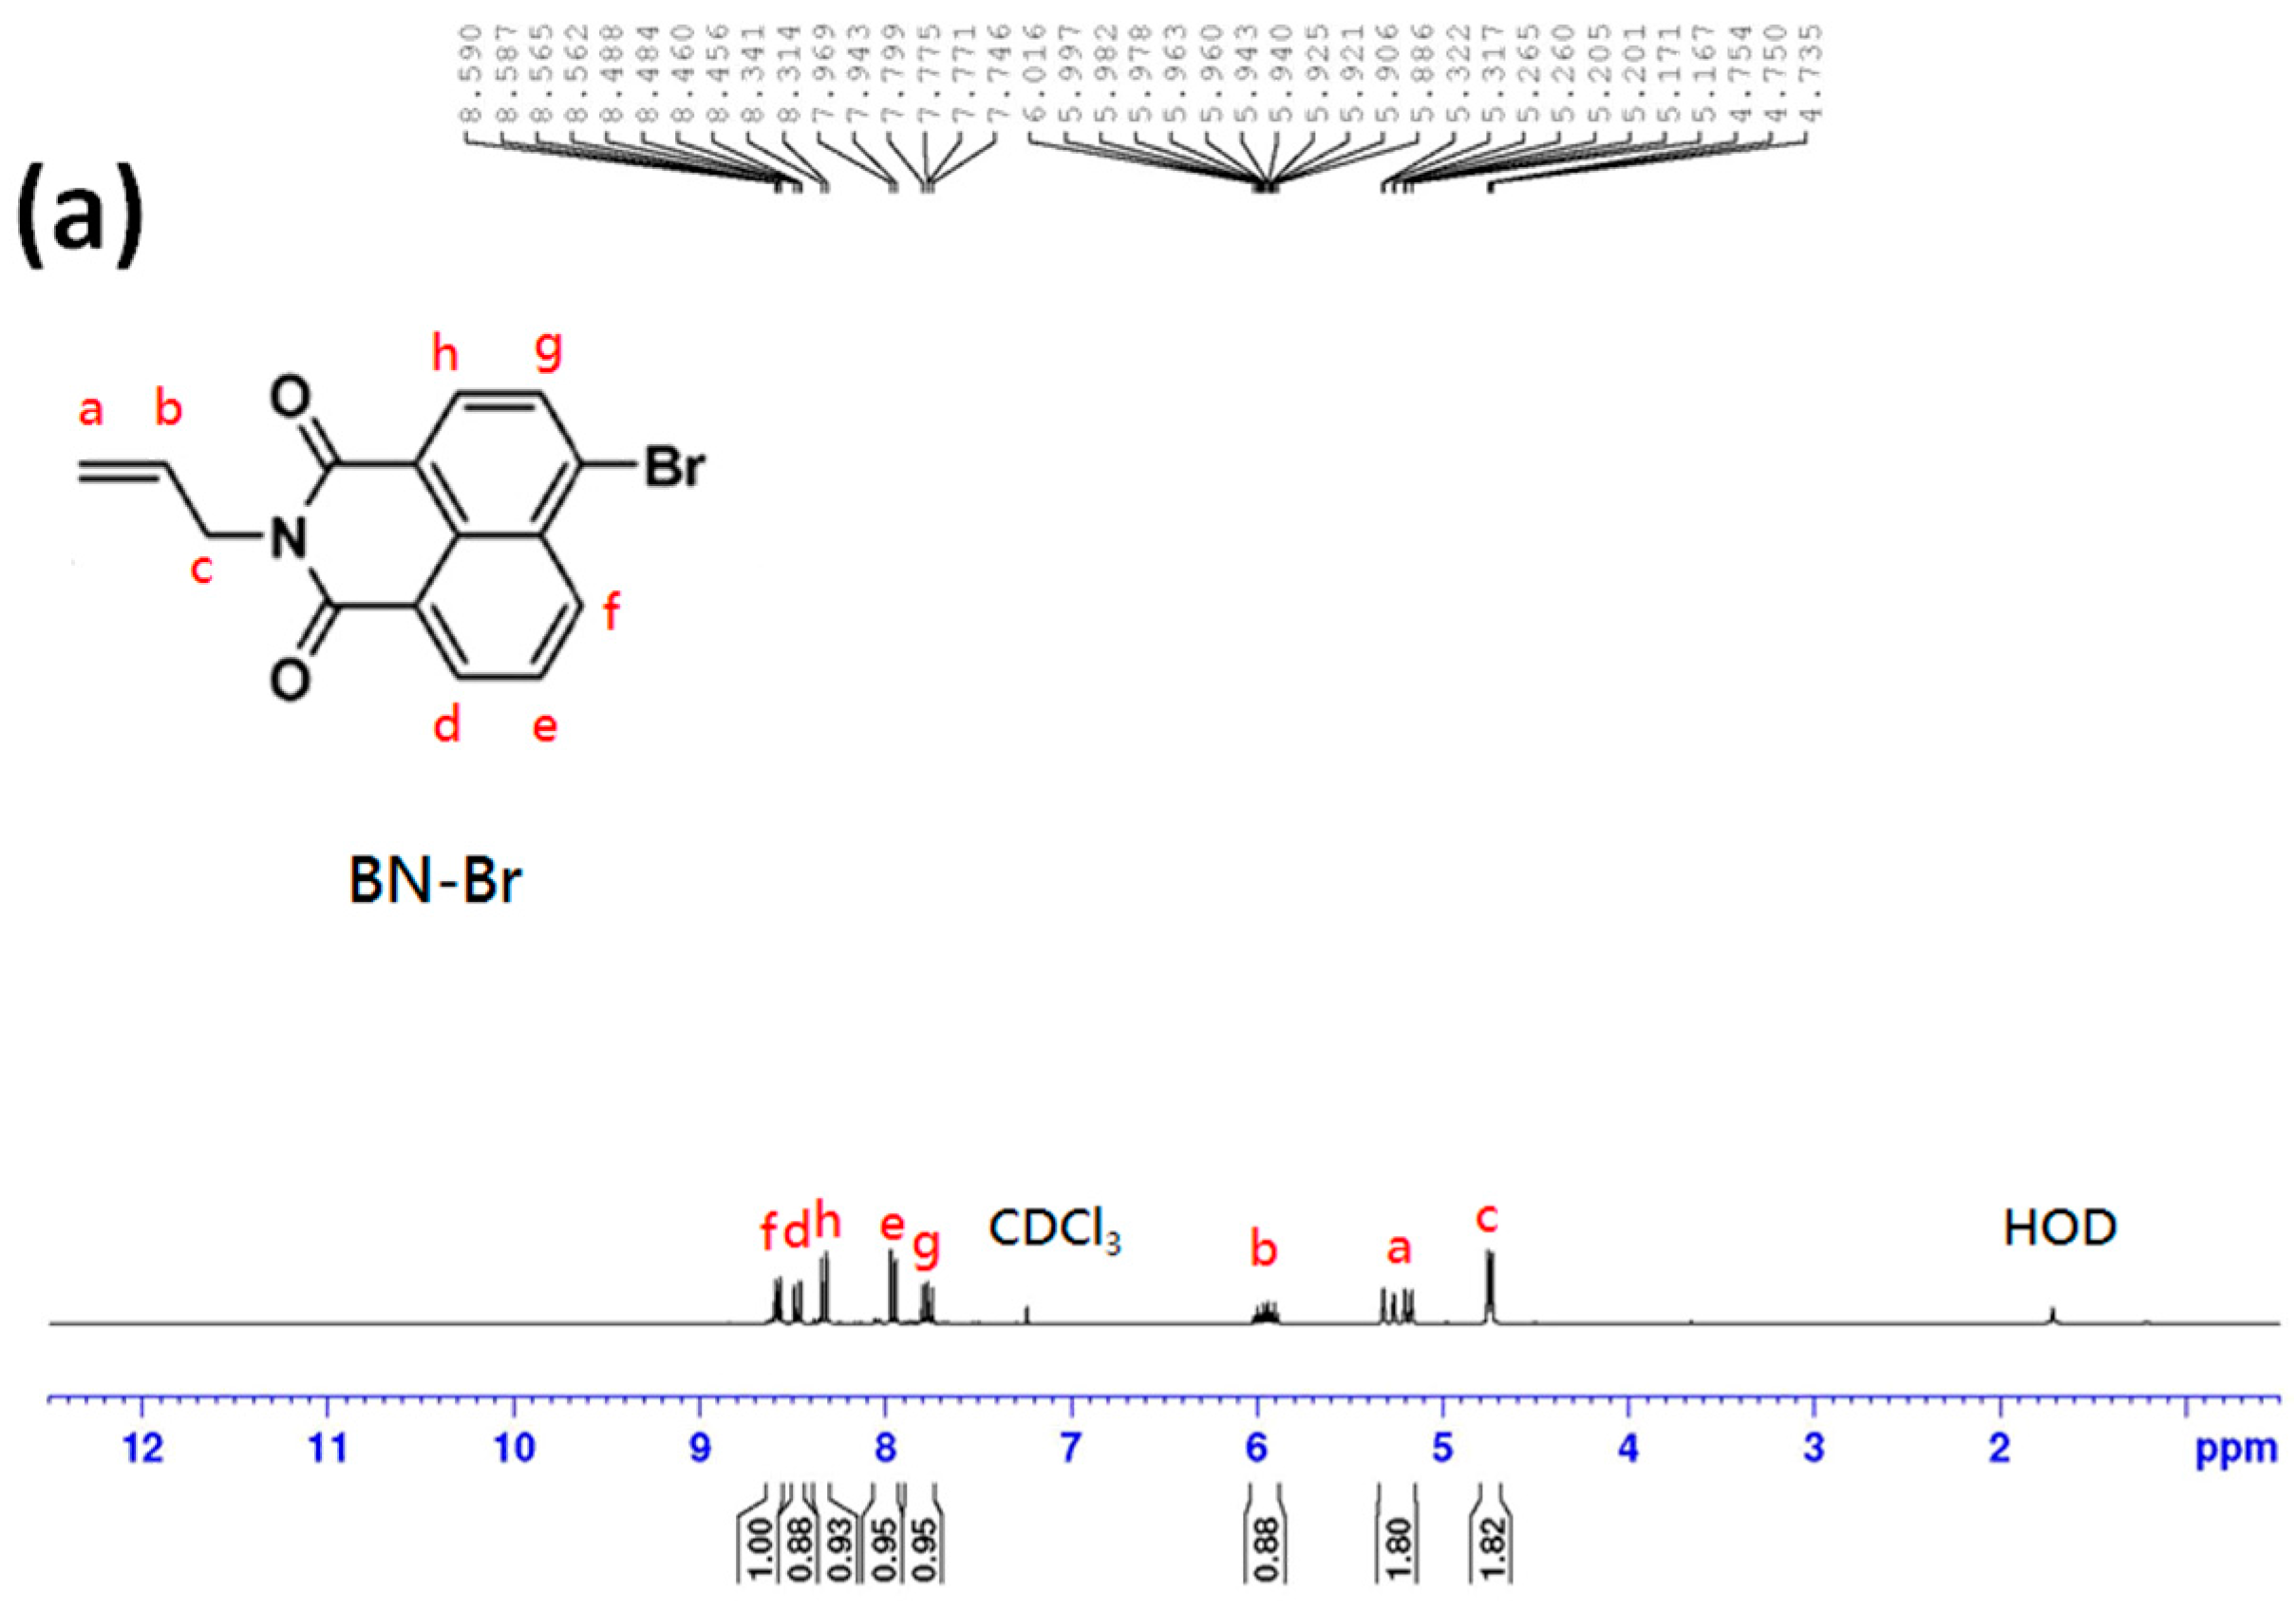
2.2. Synthesis of 4-Bromo-N-allyl-1,8-naphthalimide

Fluorescent BNPTU was prepared according to a previously reported method [8]. The process of its synthesis is illustrated in Figure 1. A 50-mL round-bottomed flask was charged with 4-bromo-1,8-naphthalic anhydride (1.385 g, 5 mmol), allylamine (0.317 g, 5.18 mmol), and 20 mL of 1,4-dioxane. The reaction mixture was stirred at reflux for 8 h. After cooling to room temperature, the suspension was poured into 600 mL of ice water and then filtrated. After drying in a vacuum oven overnight at room temperature, 4-bromo-N-allyl-1,8-naphthalimide (BN-Br) was obtained as a slightly gray solid (1.12 g, yield: 85%). 1H-NMR (300 MHz, CDCl3, TMS, Figure 3a): δ = 5.33 (a, 2H, –CH2CHCH2–); δ = 5.91 (b, 1H, –CH2CHCH2–); δ = 4.58 (c, 2H, –CH2CHCH2–); δ = 8.56 (d, 1H, 7–CH); δ = 8.03 (e, 1H, 3–CH); δ = 8.64 (f, 1H, 5–CH); δ = 7.94 (g, 1H, 6–CH ); δ = 8.45 (h, 1H, 2–CH).

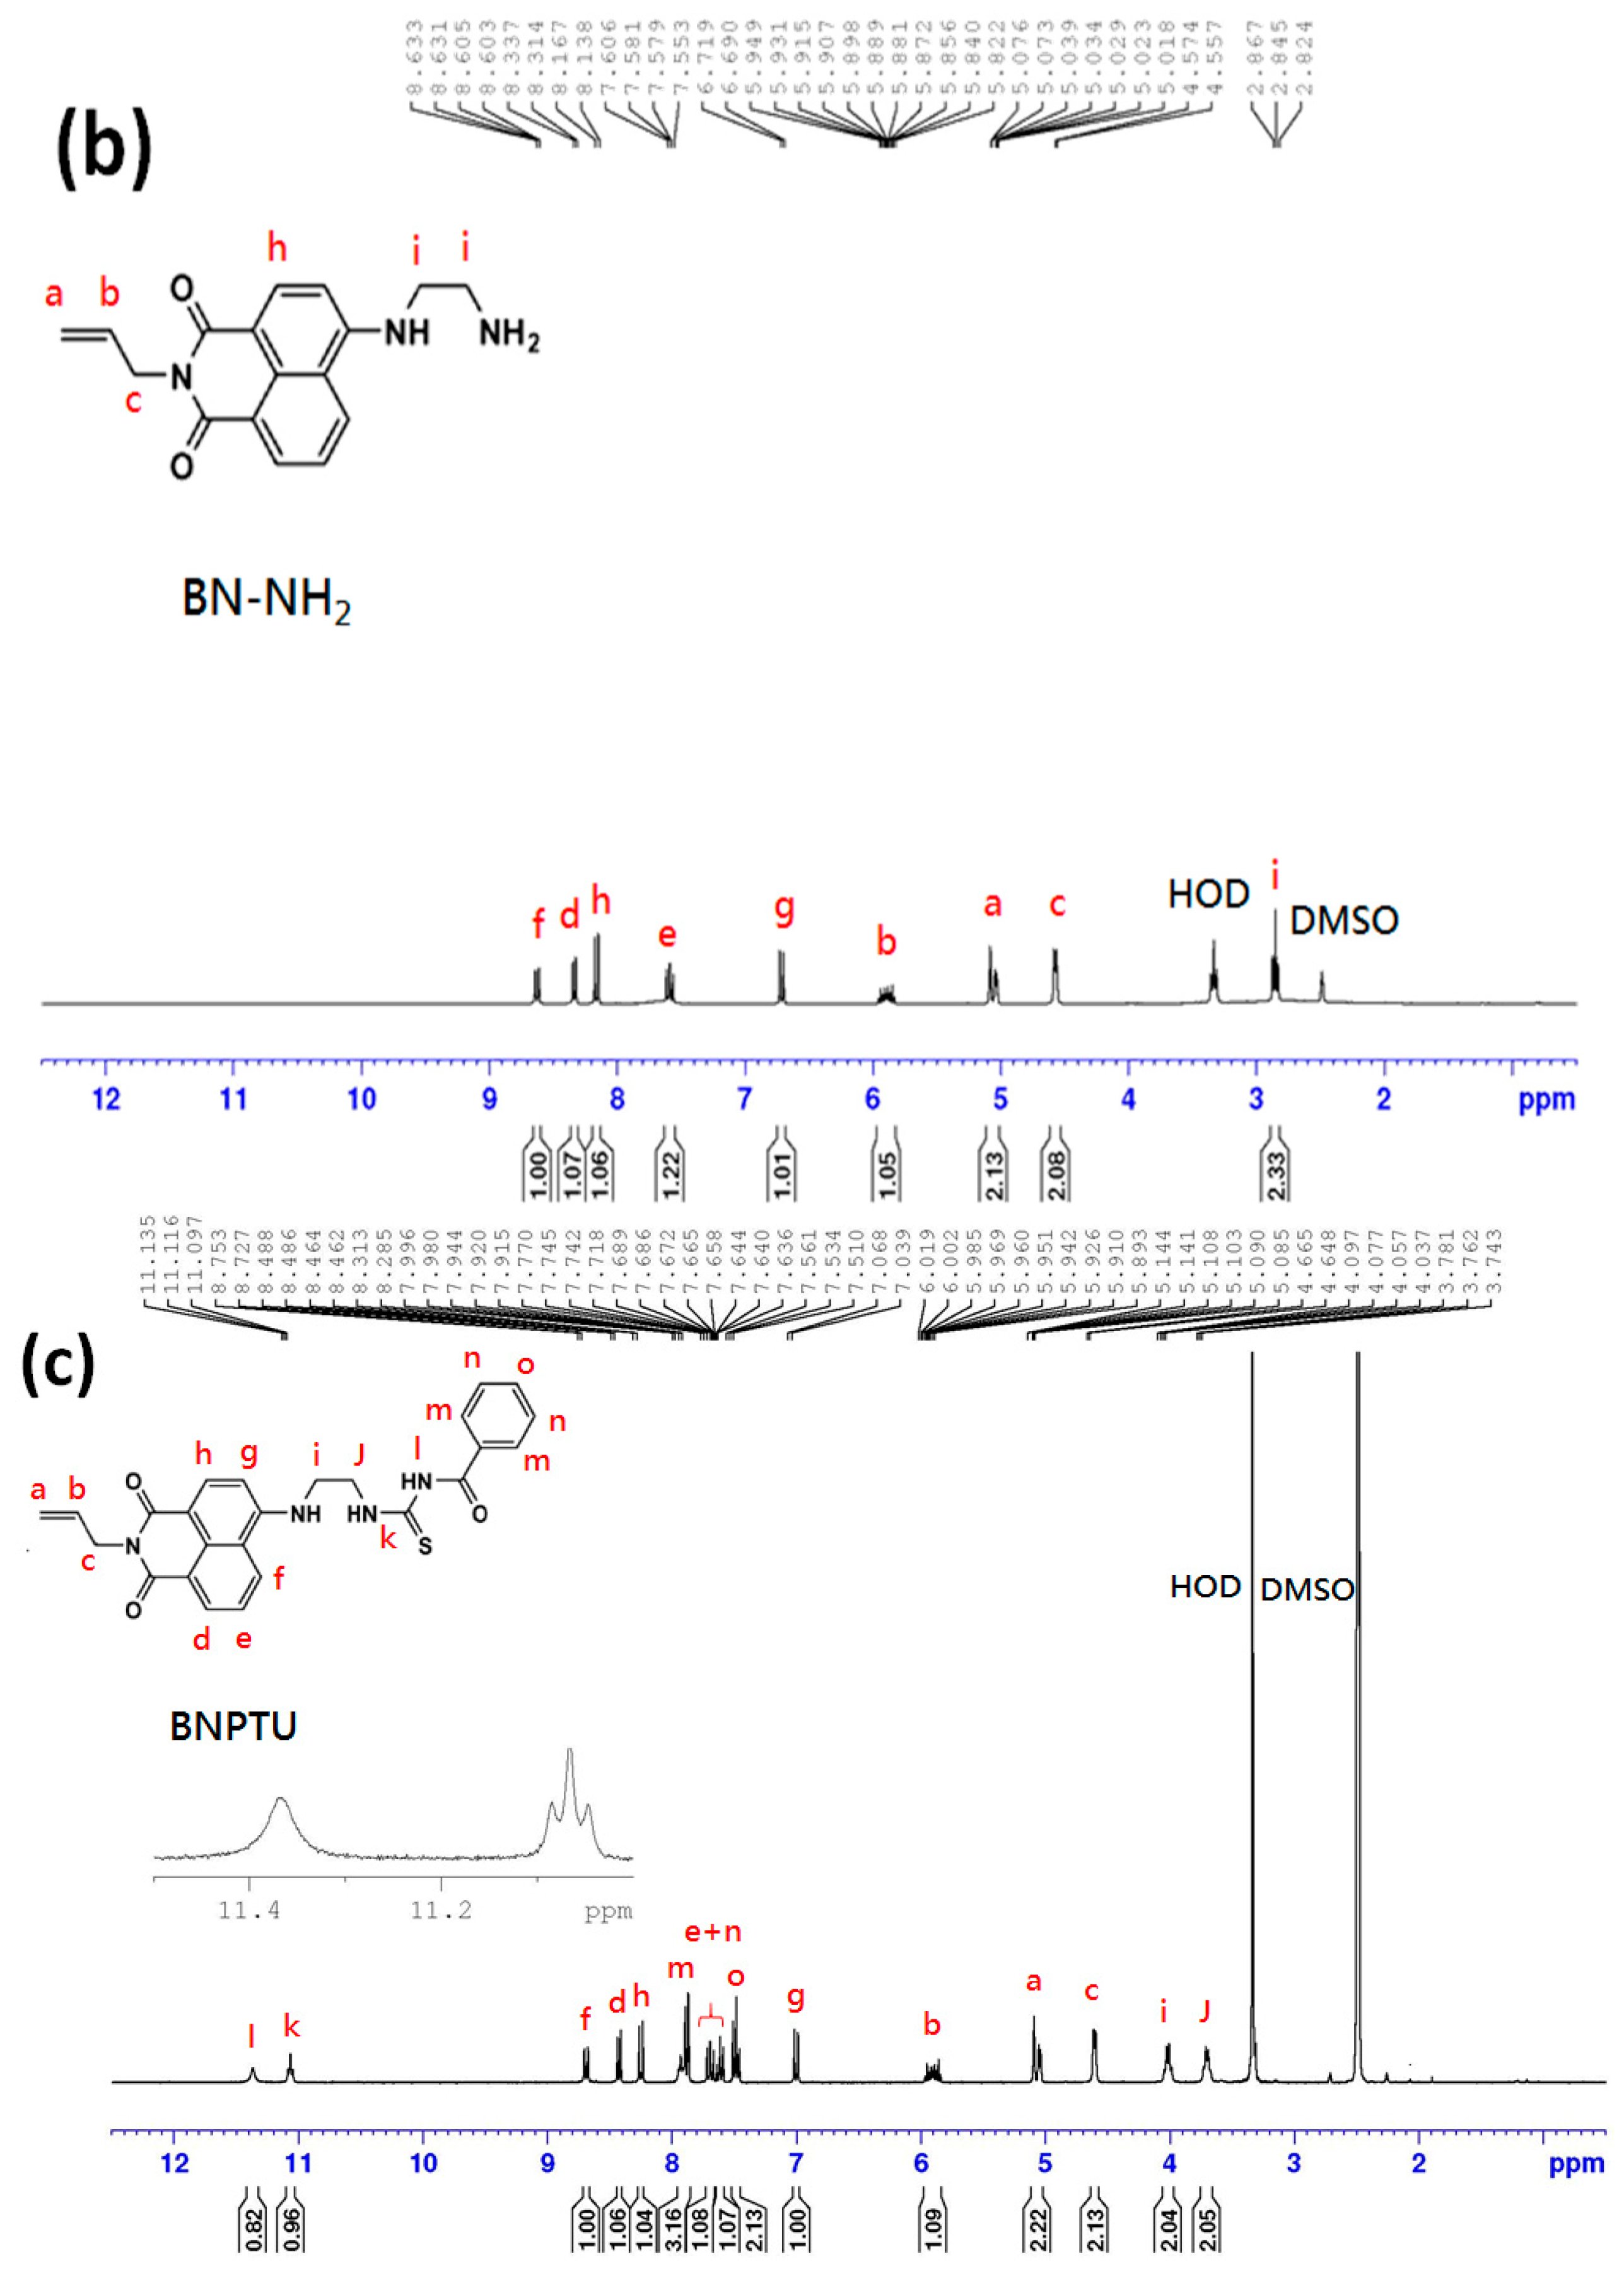
2.3. Synthesis of 4-(Aminoethylene)amino-N-allyl-1,8-naphthalimide

A 25-mL round-bottomed flask was charged with NP-Br (500 mg, 1.57 mmol) and an excess of 1,2-ethylenediamine (8 mL). The reaction mixture was stirred at reflux for 6 h. The residues were dissolved in CH2Cl2 (200 mL) and extracted with water. Finally, 4-(aminoethylene) amino-N-allyl-1,8-naphthalimide (NP-NH2) was obtained as an orange crystal (400 mg, yield: 80%). 1H-NMR (300 MHz, DMSO-d6, TMS, Figure 3b): δ = 5.33 (a, 2H, –CH2CHCH2–); δ = 5.91 (b, 1H, –CH2CHCH2–); δ = 4.58 (c, 2H, –CH2CHCH2–); δ = 8.56 (d, 1H, 7–CH); δ = 8.03 (e, 1H, 3–CH); δ = 8.64 (f, 1H, 5–CH); δ = 7.94 (g, 1H, 6–CH); δ = 8.45 (h, 1H, 2–CH); δ = 2.85 (i, 2H, –CH2NH2).

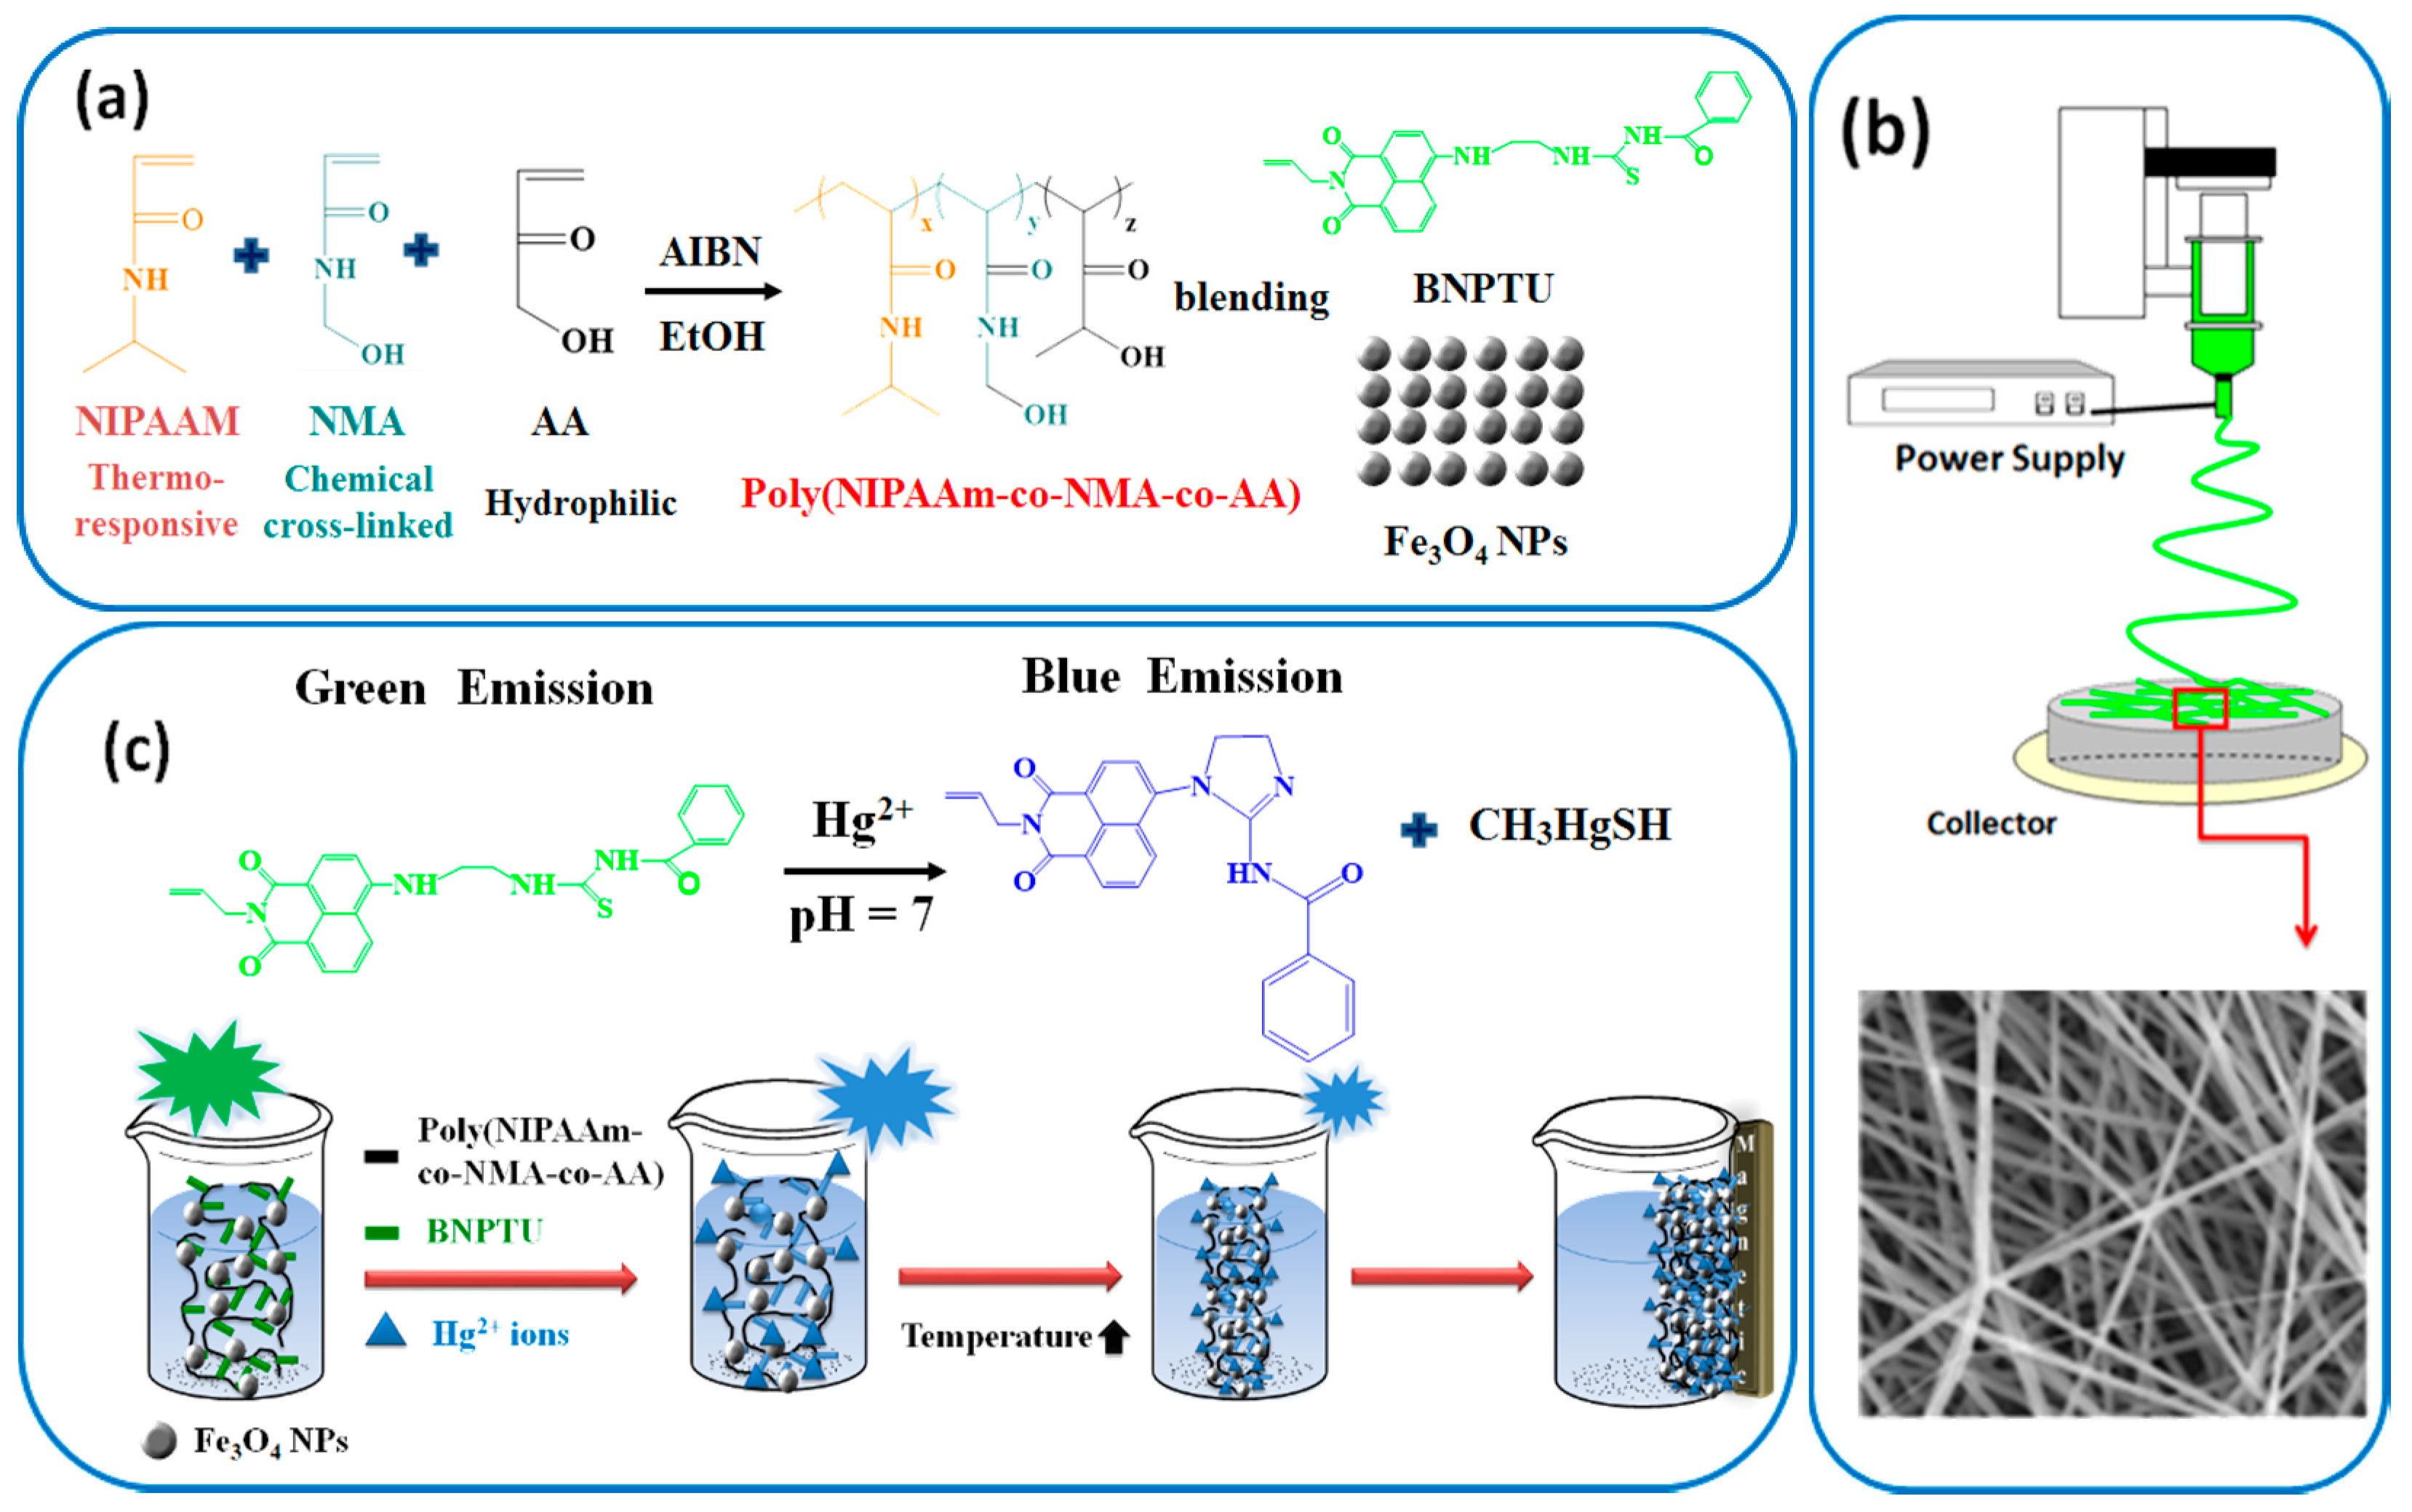
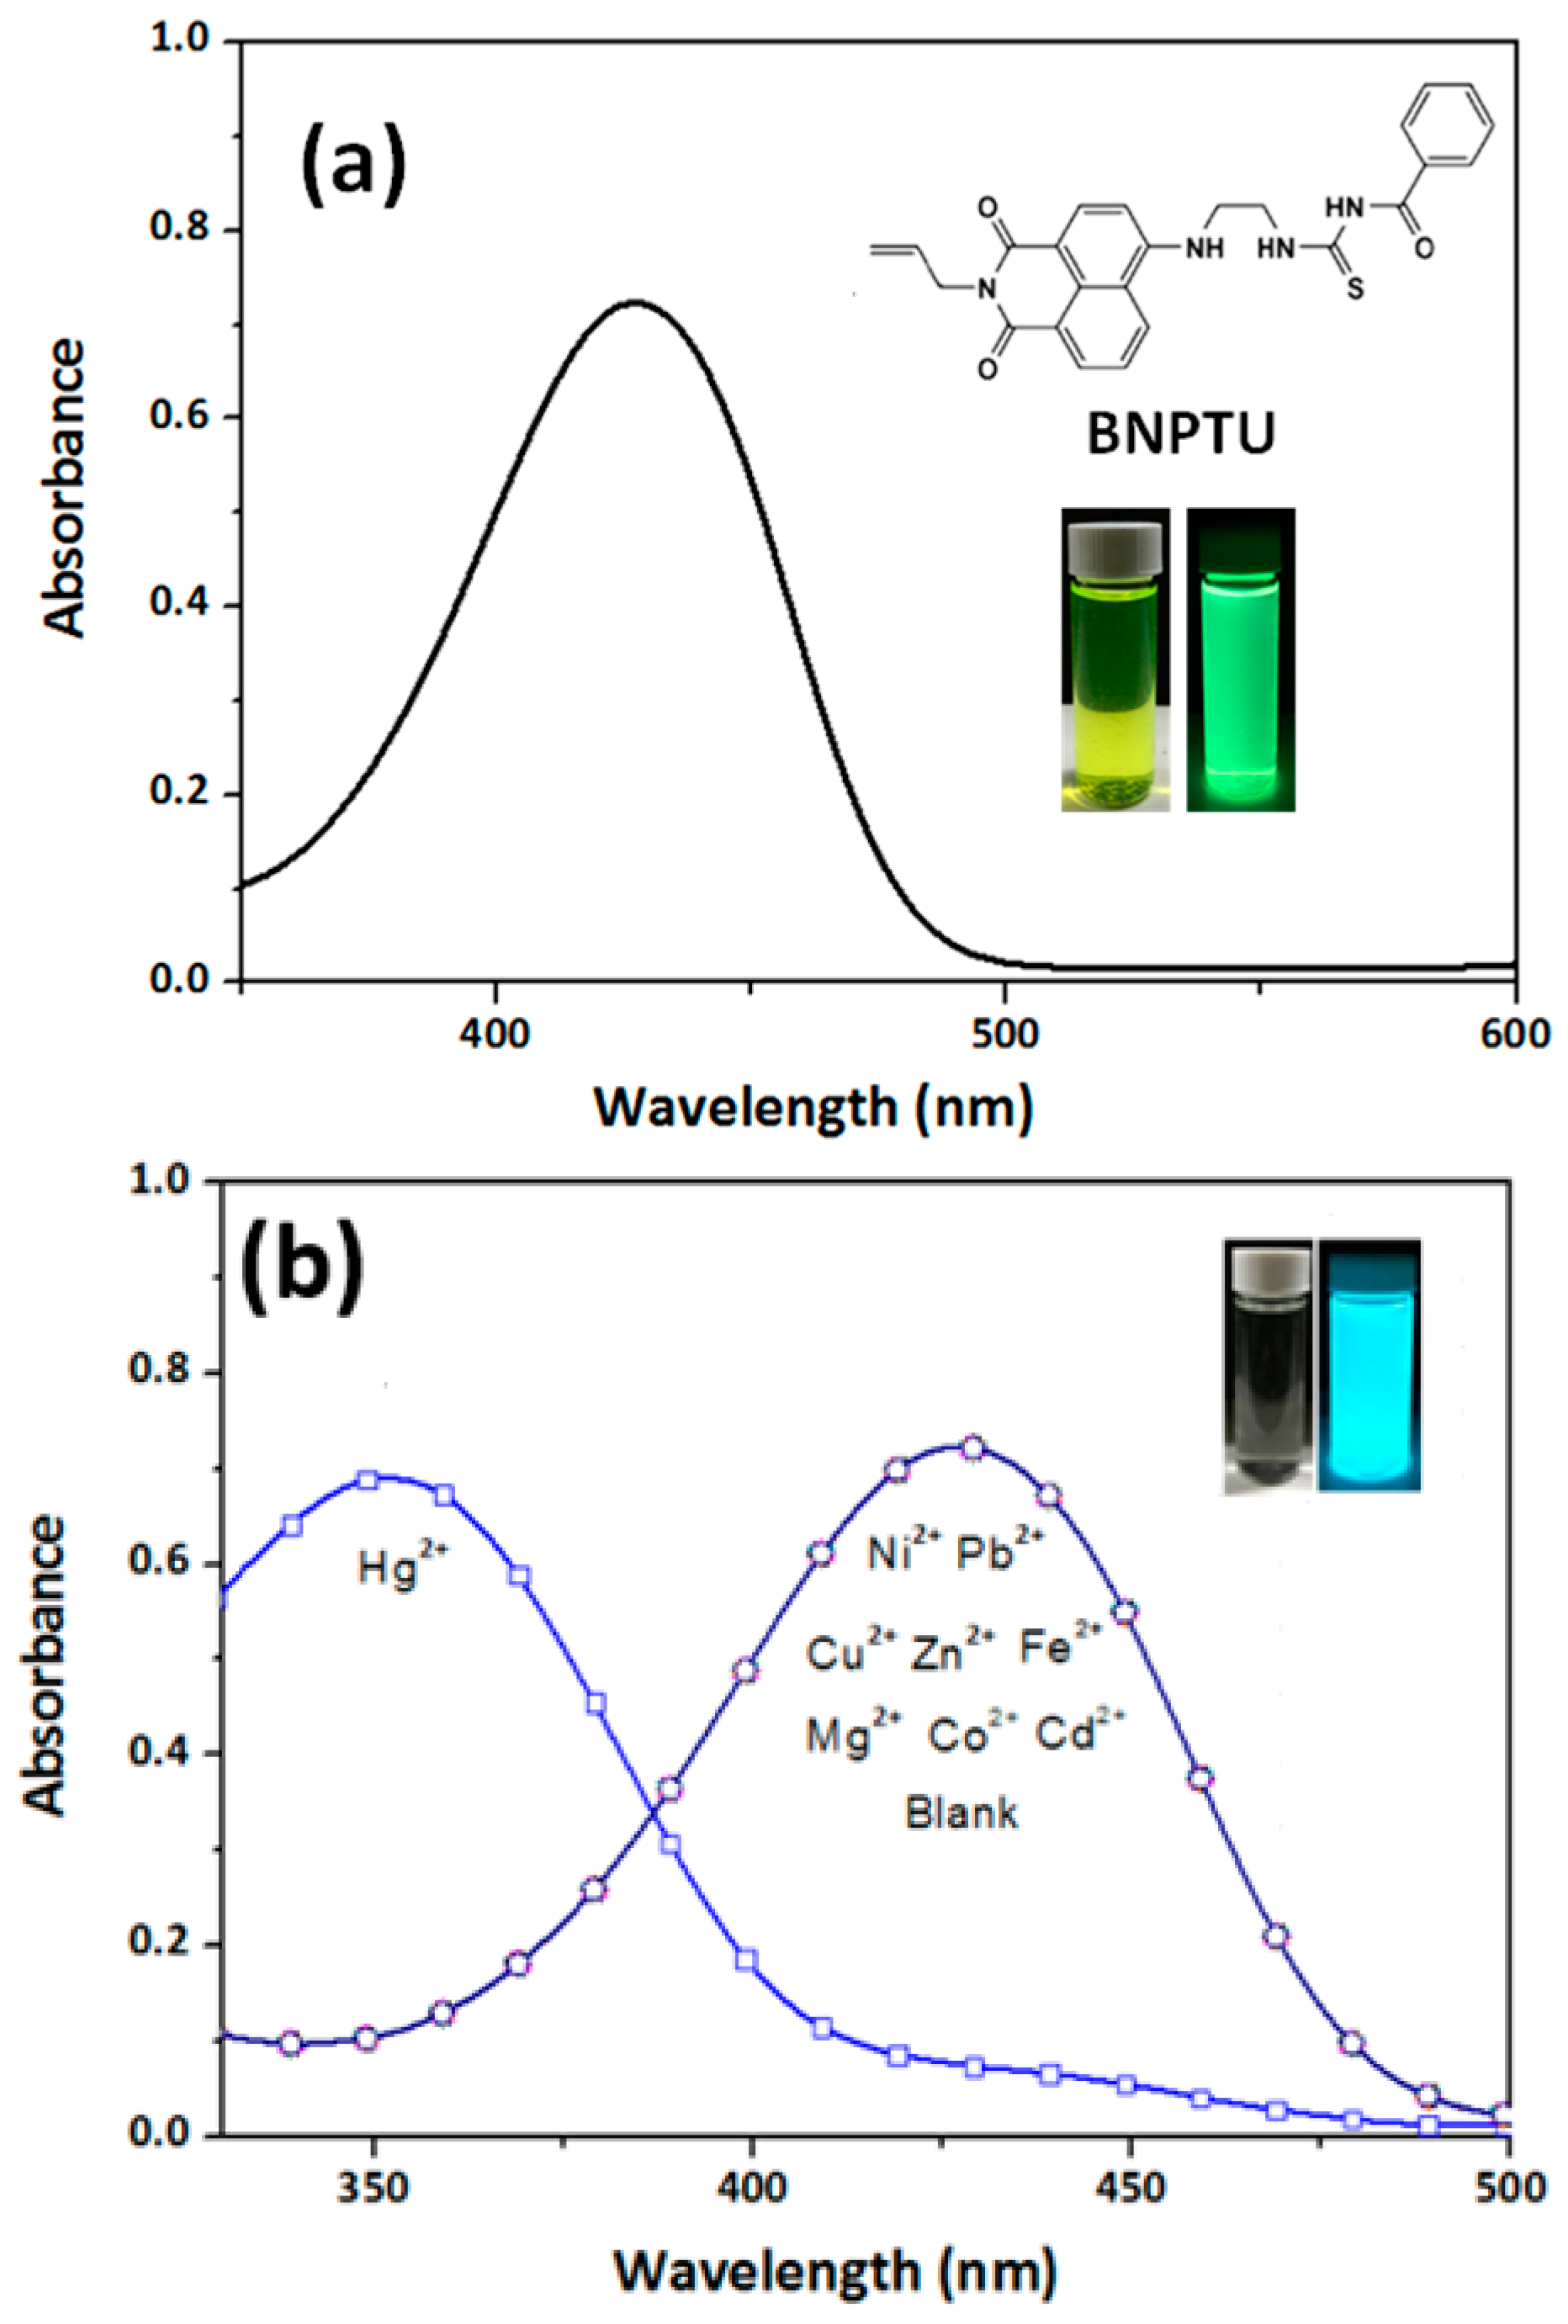
2.4. Synthesis of 1-Benzoyl-3-[2-(2-allyl-1,3-dioxo-2,3-dihydro-1Hbenzo[de]isoquinolin-6-ylamino)-ethyl]-thiourea (BNPTU)

A 25-mL round-bottomed flask was charged with NP-NH2 (400 mg, 1.36 mmol), benzoyl isothiocyanate (0.22 g, 1.36 mmol), and 12 mL of acetone. The reaction mixture was stirred at reflux for 1 h. After cooling to room temperature, the solution was filtrated and washed with ethanol. The product was purified using chromatography with CH2Cl2 (320 mg, yield: 80%). 1H-NMR (300 MHz, DMSO-d6, TMS, Figure 3c): δ = 5.33 (a, 2H, –CH2CHCH2–); δ = 5.91 (b, 1H, –CH2CHCH2–); δ = 4.58 (c, 2H, –CH2CHCH2–); δ = 8.41 (d, 1H, 7–CH); δ = 7.62–7.88 (e + n, 3H, 6–CH; –COCCHCHCHCH–); δ = 8.72 (f, 1H, 5–CH); δ = 7.03 (g, 1H, 3–CH); δ = 8.26 (h, 1H, 2–CH); δ = 4.02 (i, 2H, –NCH2CH2N–); δ = 3.95 (j, 2H, –NCH2CH2N–); δ = 11.08 (k, 1H, –CSNH–); δ = 11.38 (l, 1H, –CONH–); δ = 7.48 (m, 1H, –COCCHCH–); δ = 7.93 (o, 2H, –COCCH–; –COC(CH)4CH–).

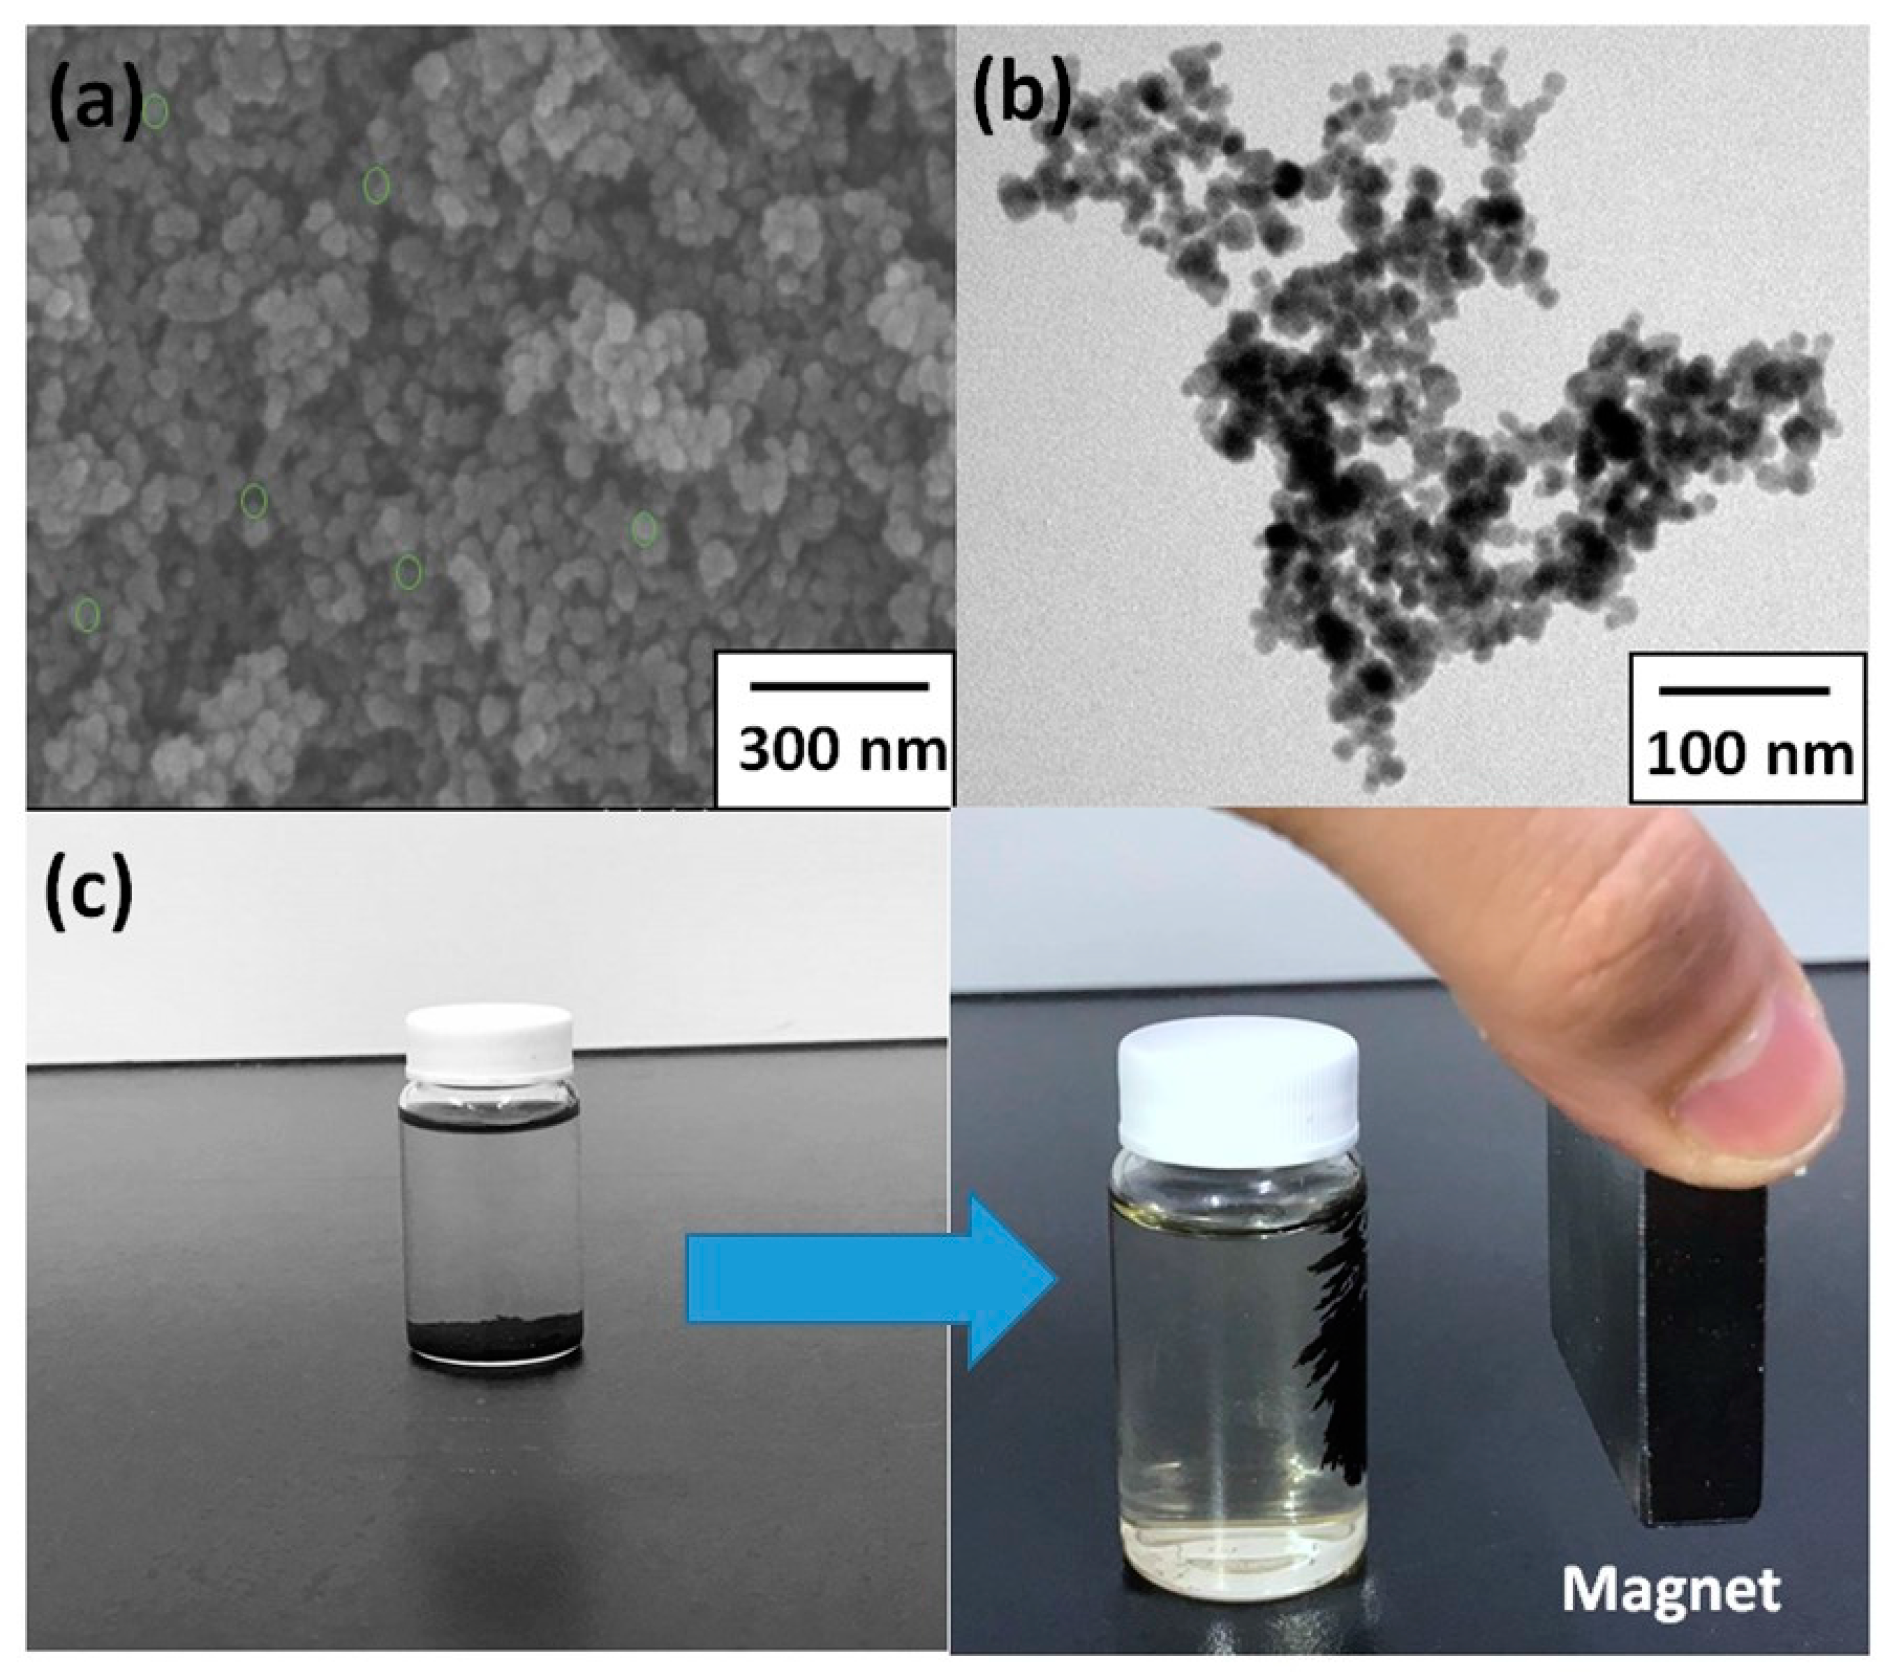
2.5. Synthesis of Magnetic Iron Oxide (Fe3O4) Nanoparticles (NPs)

Magnetic nanoparticles, Fe3O4, were prepared by a coprecipitation method as reported [27]. A 100-mL round-bottomed flask was charged with FeCl3∙6H2O (380 mg, 1.4 mmol), FeCl2∙4H2O (140 mg, 0.7 mmol) and 80 mL of water. The reaction mixture was stirred at reflux under N2 until the mixture had completely dissolved. The ammonium hydroxide (8 mL) was added dropwise under mechanical stirring at 60 °C for 30 min under N2. Then, the magnetic iron oxides were isolated from the solution by a magnet bar and dried in a vacuum oven at 40 °C for 24 h.

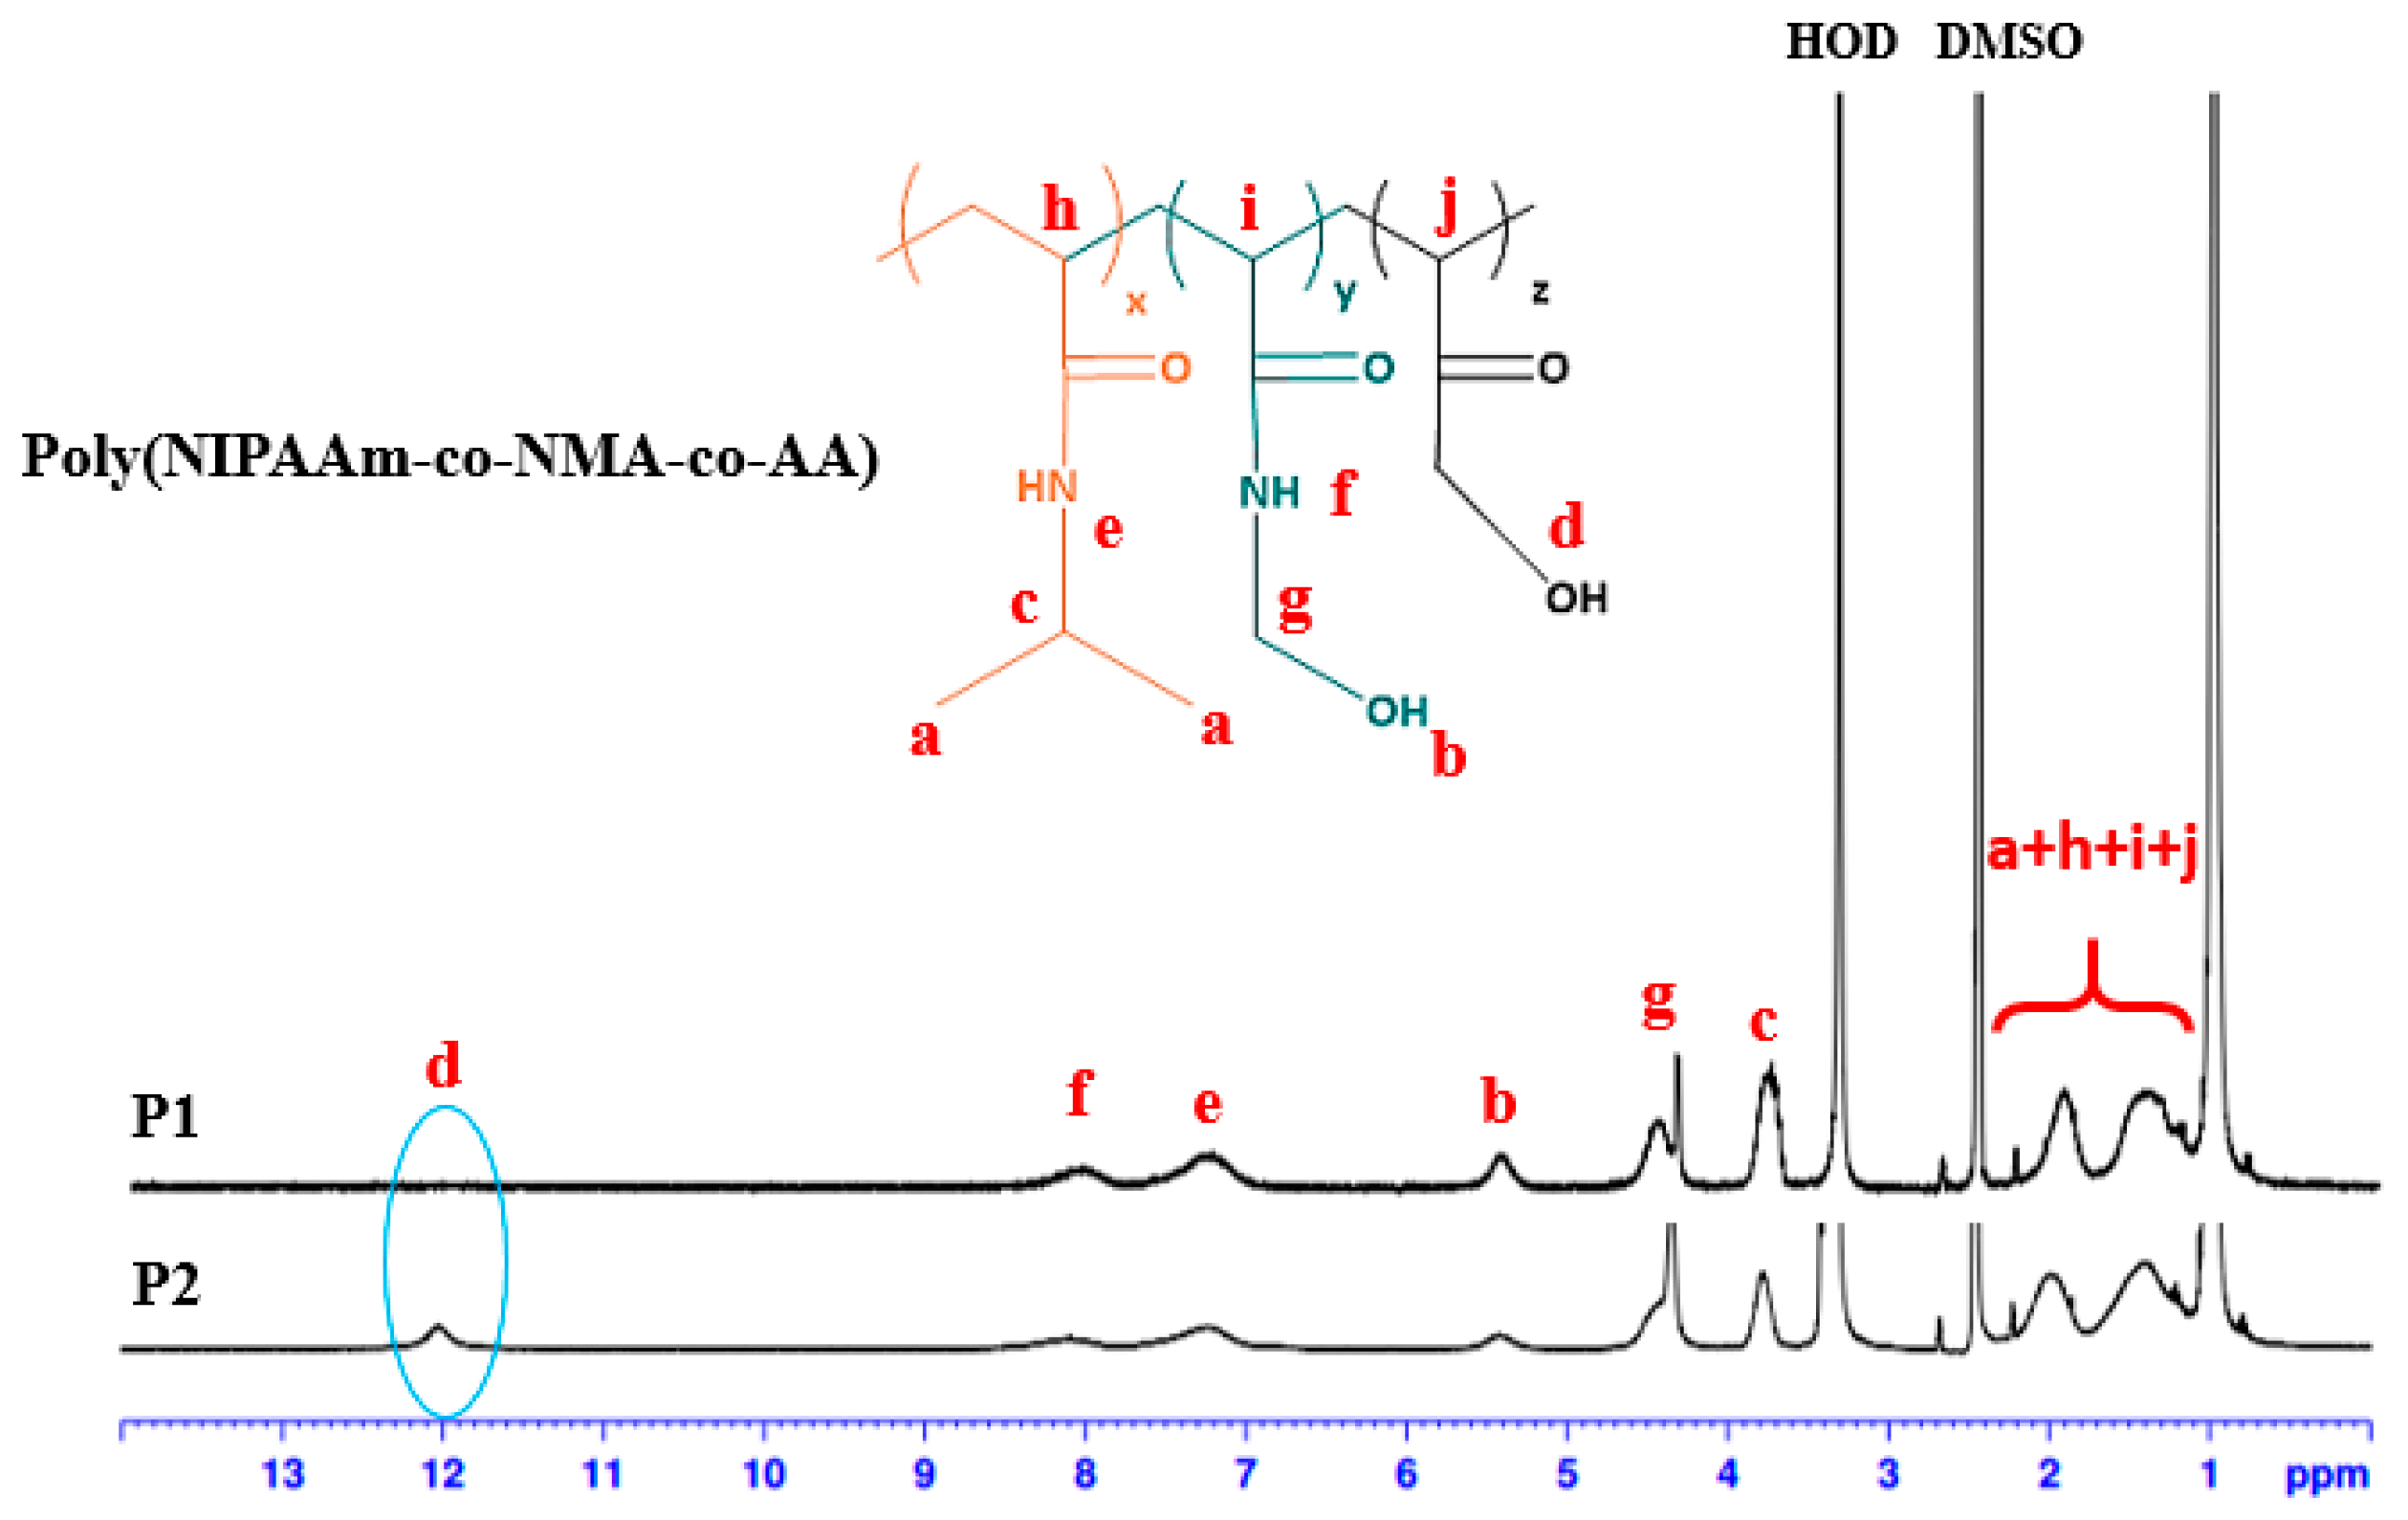
2.6. Synthesis of Poly(NIPAAm-co-NMA-co-AA)

Poly(NIPAAm-co-NMA-co-AA) was synthesized through free-radical copolymerization of the following three monomers: NIPAAm, NMA, and AA (Figure 2) Poly(NIPAAm-co-NMA-co-AA) with different monomer ratios were denoted P1P2, as listed in Table 1. The concentration of AIBN used as the initiator was 0.004 M. The reaction mixture, containing dimethylformamide (DMF) and monomers, was degassed by first bubbling nitrogen through for 30 min and then left to react at 70 °C for 24 h. The reaction mixture was quenched by exposure to air. The mixture was diluted with methanol to remove the unreacted monomers. The light white filtrate was concentrated, re-precipitated from diethyl ether, collected by filtration, and dried under vacuum to obtain the polymer product. The synthesis and characterization of P1P2 are described in the following sections. The number-averaged molecular weight (Mn) and polydispersity index (PDI) estimated from gel permeation chromatography (GPC) (THF eluent) are listed in Table 1 and Figure S1.

2.7. Synthesis of Poly(NIPAAm-co-NMA) Random Copolymers (P1)

A reaction mixture of 1.131 g (9.99 mmol) of NIPAAm, 505 mg (4.99 mmol) of NMA, 5 mg (0.03 mmol) of AIBN, and 7.5 mL of EtOH was used to produce an orange solid (yield: 86%). Figure 4 and Table 1 present the molecular weight and chemical structure characterization of poly(NIPAAm-co-NMA) obtained using GPC with THF as the eluent and 1H-NMR, respectively. The copolymer composition, estimated by performing peak integration, was consistent with the proposed structure. The estimated copolymer ratio of poly(NIPAAm-co-NMA) based on the NMR spectrum was 81:19, and the number-averaged molecular weight Mn and PDI estimated using GPC were 26,856 and 2.01, respectively. 1H-NMR (300 MHz, DMSO-d6, TMS, Figure 4): δ = 0.82–1.12 (a, 6H, –CH(CH3)2); 1.23–1.46 (h + i, 4H, –CH2CH–, –CH2CH–); 1.84–2.10 (h + i, 2H, –CH2CH–, –CH2CH–,); 5.34–5.53 (b, 1H, –NHCH2OH); 3.71–3.82 (c, 1H,–CH(CH3)2); 7.23–7.59 (e, 1H, –CONHCH–); 7.92–8.14 (f, 1H, –NHCH2OH); 4.36–4.65 (g, 2H, –NHCH2OH–).

2.8. Synthesis of Poly(NIPAAm-co-NMA-co-AA) Random Copolymers (P2)

A reaction mixture of 1.131 g (9.99 mmol) of NIPAAm, 505 mg (4.99 mmol) of NMA, 0.204 mL (0.0029 mmol) of AA, 5 mg (0.03 mmol) of AIBN, and 9 mL of EtOH was used to produce an orange solid (yield: 82%). Figure 4 and Table 1 present the molecular weight and chemical structure characterization of poly(NIPAAm-co-NMA-co-AA) obtained using GPC with THF as the eluent and 1H NMR, respectively. The copolymer composition, estimated by performing peak integration, was consistent with the proposed structure. The copolymer ratio of poly(NIPAAm-co-NMA-co-AA) based on the NMR spectrum was 72:15:13, and the number-averaged molecular weight Mn and PDI estimated using GPC were 18041 and 1.76, respectively. 1H-NMR (300 MHz, DMSO-d6, TMS, Figure 4): δ = 0.82–1.12 (a, 6H, –CH(CH3)2); 1.23–1.46 (h + i + j, 6H, –CH2CH–, –CH2CH–, –CH2CH–); 1.84–2.10 (h + i + j, 3H, –CH2CH–,–CH2CH–, –CH2CH–); 5.34–5.53 (b, 1H, –NHCH2OH); 3.71–3.82 (c, 1H, –CH(CH3)2); 11.92–12.05 (d, 1H, –COCH2OH); 7.23–7.59 (e, 1H, –CONHCH–); 7.92–8.14 (f, 1H, –NHCH2OH); 4.36–4.65 (g, 2H, –NHCH2OH–).

2.9. Preparation of Electrospun (ES) Nanofibers

As shown in Figure 2b, the ES nanofibers were prepared using a single-capillary spinneret in a procedure similar to that described in our previous papers [19,20,21,22,23,24,25,26]. The poly(NIPAAm-co-NMA) (P1), poly(NIPAAm-co-NMA-co-AA) (P2), BNPTU, and Fe3O4 NPs blend was dissolved in methanol (MeOH) as solvent at 250 mL h−1 and stirred overnight. The blend composition (wt %) of (P1 or P2), BNPTU, and Fe3O4 NPs for preparing the ES nanofibers was 85/10/5. The polymer solution was fed into a metallic needle using syringe pumps (Model 100, KD Scientific, Holliston, MA, USA) at a feed rate of 0.8–1.0 mL h−1. The tip of the needle was connected to a Chargemaster CH30P high voltage power supply (Simco, Hatfield, PA, USA) set at 13.4 kV during electrospinning. A piece of aluminum foil or quartz was placed 15 cm below the tip of the needle for 30 min to collect the ES nanofibers. All experiments were performed at room temperature and a relative humidity of approximately 30%. P1 and P2 blended with the Fe3O4 NPs at a 5 wt % ratio are denoted by P1-5% and P2-5%. The ES nanofibers were annealed at 100 °C for 24 h in an oven for chemical cross-linking.

2.10. Characterization

1H-NMR data were recorded at room temperature using an AM 300 (300 MHz) spectrometer (Bruker, Billerica, MA, USA) and the residual proton resonance of deuterated chloroform and deuterated dimethyl sulfoxide. High resolution electrospray ionization mass spectrometry spectra were recorded using an ion-trap time-of-flight liquid chromatograph mass spectrometer (Shimadzu, Kyoto, Japan). Gel permeation chromatography (GPC) analysis was performed using a Lab Alliance RI2000 instrument (two-column, MIXED-C and MIXED-D from Polymer Laboratories, Theale, UK) connected to a refractive index detector (Schambeck SFD GmbH, Bad Honnef, Germany). All GPC analyses were performed using a polymer and THF solution at a flow rate of 1 mL min−1 at 40 °C and calibrated with methyl methacrylate. The thermal decomposition temperature was determined using a Q50 thermal gravimetric analyzer (TGA) (TA Instruments, Lukens Drive, New Castle, DE, USA) over a heating range of 100–800 °C at a heating rate of 10 °C min−1 in a nitrogen atmosphere. The LCST of the prepared copolymer solution was recorded by monitoring the transmittance of a 520 nm light beam on Shimadzu UV–Vis spectrophotometer. The copolymer concentration in water was 1 wt %, and the temperature was raised from 10 to 70 °C in 2.5 °C increments every 10 min. A plot of the changes in optical transmittance as a function of temperature for polymers in water was made, the LCST corresponds to the first turning point of the transition curve [21]. Magnetic properties of Fe3O4 nanoparticles or ES nanofibers were measured on a Lake Shore VSM-7407 instrument (MPMS (SQUID) VSM, Quantum Design, San Diego, CA, USA). The magnetization hysteresis loops were measured at 300 K [30].
The morphologies of ES nanofibers were characterized using an S-520 scanning electron microscope (Hitachi, Tokyo, Japan) equipped with X-ray microanalysis capability. Samples were coated with platinum prior to scanning electron microscopy (SEM) characterization, and analysis was conducted at an increased voltage of 10 kV. Fluorescence optical microscopy images were captured using an LCS SP5 two-photon laser confocal microscope (Leica, Mannheim, Germany). The morphologies of the ES nanofibers were similar to those reported in our previous studies [15,20,24].
Ultraviolet–visible (UV–Vis) absorption and PL spectra were measured to examine photophysical properties and recorded using a UV–Vis spectrophotometer (Shimadzu) and a Fluorolog-3 spectrofluorometer (Horiba Jobin Yvon, Edison, NJ, USA), respectively. Variations in the optical absorption and PL of the prepared ES nanofibers with different metal ion concentrations are described as follows. To ensure that the beam excited the same point on the prepared samples during each measurement, the ES nanofibers were fixed in cuvettes with adhesive tape, and the cuvette was filled with a basic aqueous metal ion solution at 10−4–10−2 M. Each measurement was maintained for 15 min to ensure that the chelating reaction reached equilibrium. All PL spectra of the ES nanofibers were recorded using the spectrofluorometer, and the samples were excited at a suitable wavelength, as described in our previous studies [19,20,21,22,23,24,25,26].

3. Results and Discussion

3.1. Characterization of BNPTU and Poly(NIPAAm-co-NMA-co-AA)

The chemical structure of BNPTU was characterized using 1H-NMR (Figure 3). The synthesis routes of BNPTU (Figure 1) are similar to those reported in a previous study [8]. Figure 2a shows the route by which poly(NIPAAm-co-NMA-co-AA) copolymers were synthesized through free radical polymerization. The two types of copolymers (P1 and P2) were synthesized and their composites are listed in Table 1. Figure 4 shows the 1H-NMR spectrum of poly(NIPAAm-co-NMA) (P1) and poly(NIPAAm-co-NMA-co-AA) (P2). The proton peaks at 7.23–7.59 ppm (Peak e) and 3.71–3.82 ppm (Peak c) correspond to the methylene neighbors of the secondary amine moiety and the alkyl chains on NIPAAm, respectively. The proton peaks at 5.34–5.53 ppm (Peak b), 7.92–8.14 ppm (Peak f), and 4.36–4.65 ppm (Peak g) correspond to the methylene neighbors of the hydroxyl, secondary amine moiety, and alkyl chains on NMA, respectively. The proton peak at 11.92–12.05 ppm (Peak d) corresponds to the methylene neighbor of hydroxyl on the AA in P2. The peak at 0.82–1.12 ppm (Peak a) and those at 1.23–2.1 ppm (Peaks h, i, and j) correspond to the alkyl chains on the copolymers. The copolymer ratios of P1 and P2 were estimated from NMR spectra, and were 81:19 and 72:15:13, respectively. The favorable agreement between the feeding ratio and experimental composition suggests the successful preparation of the target copolymers. The molecular weights, thermal properties, and LCSTs of P1 and P2 are listed in Table 1. The number-averaged molecular weights and polydispersity indices (PDIs) of P1 and P2 were 26,856 and 2.01, and 18,041 and 1.76, respectively. Notably, Figure S1 shows that the accurate PDI (Mn/Mw) data of P1 were 26,856/53,980 equal to 2.01 and that of P2 was 18,041/31,752 equal to 1.76. The thermal decompositon curves of the prepared polymers are presented in Figure S2 (Supplementary Materials). The identical thermal decomposition temperature of 210 °C for P1 and P2 is attributable to their similar NIPAAm compositions. All decompostion temperatures for P1 and P2 were higher than 270 °C, and thus, they exhibited favorable and stable thermal properties. Figure S3 shows the typical optical transmittance (520 nm) versus temperature curves of P1 and P2, which exhibit thermoresponsive soluble-to-insoluble phase transitions in an aqueous medium. The copolymers are soluble in water below their LCSTs. The LCSTs of P1 and P2 are both approximately 55 °C, slightly higher than that of PNIPAM (32 °C) because of the hydrophilic characteristics of the NMA and AA compounds, as stated in our previous study [23] and one other study [34].
Figure 5a illustrates that BNPTU in CH3CN had a maximum in the UV–Vis absorption peak (λabsmax) of 430 nm at pH 7 and emitted green fluorescence under UV light (inset) as it is a fluorescent dye. Figure 5b shows variations in the UV–Vis spectra of BNPTU in a CH3CN solution containing various metal ions at a concentration of 10−5 M (pH 7). The λabsmax of BNPTU was blueshifted from 430 to 350 nm when the Hg2+ ion was added. The Hg2+ ion transformed the thiourea unit of BNPTU under aqueous conditions into an imidazoline moiety with considerably weakened electron-donating ability (Figure 2c) [5,35,36,37]. However, no change in the absorption peak was observed when other metal ions such as Co2+, Ni2+, Pb2+, Zn2+, Mg2+, Cu2+, Fe2+, and Cd2+ were added, suggesting that BNPTU exhibited high selectivity and sensitivity toward Hg2+.

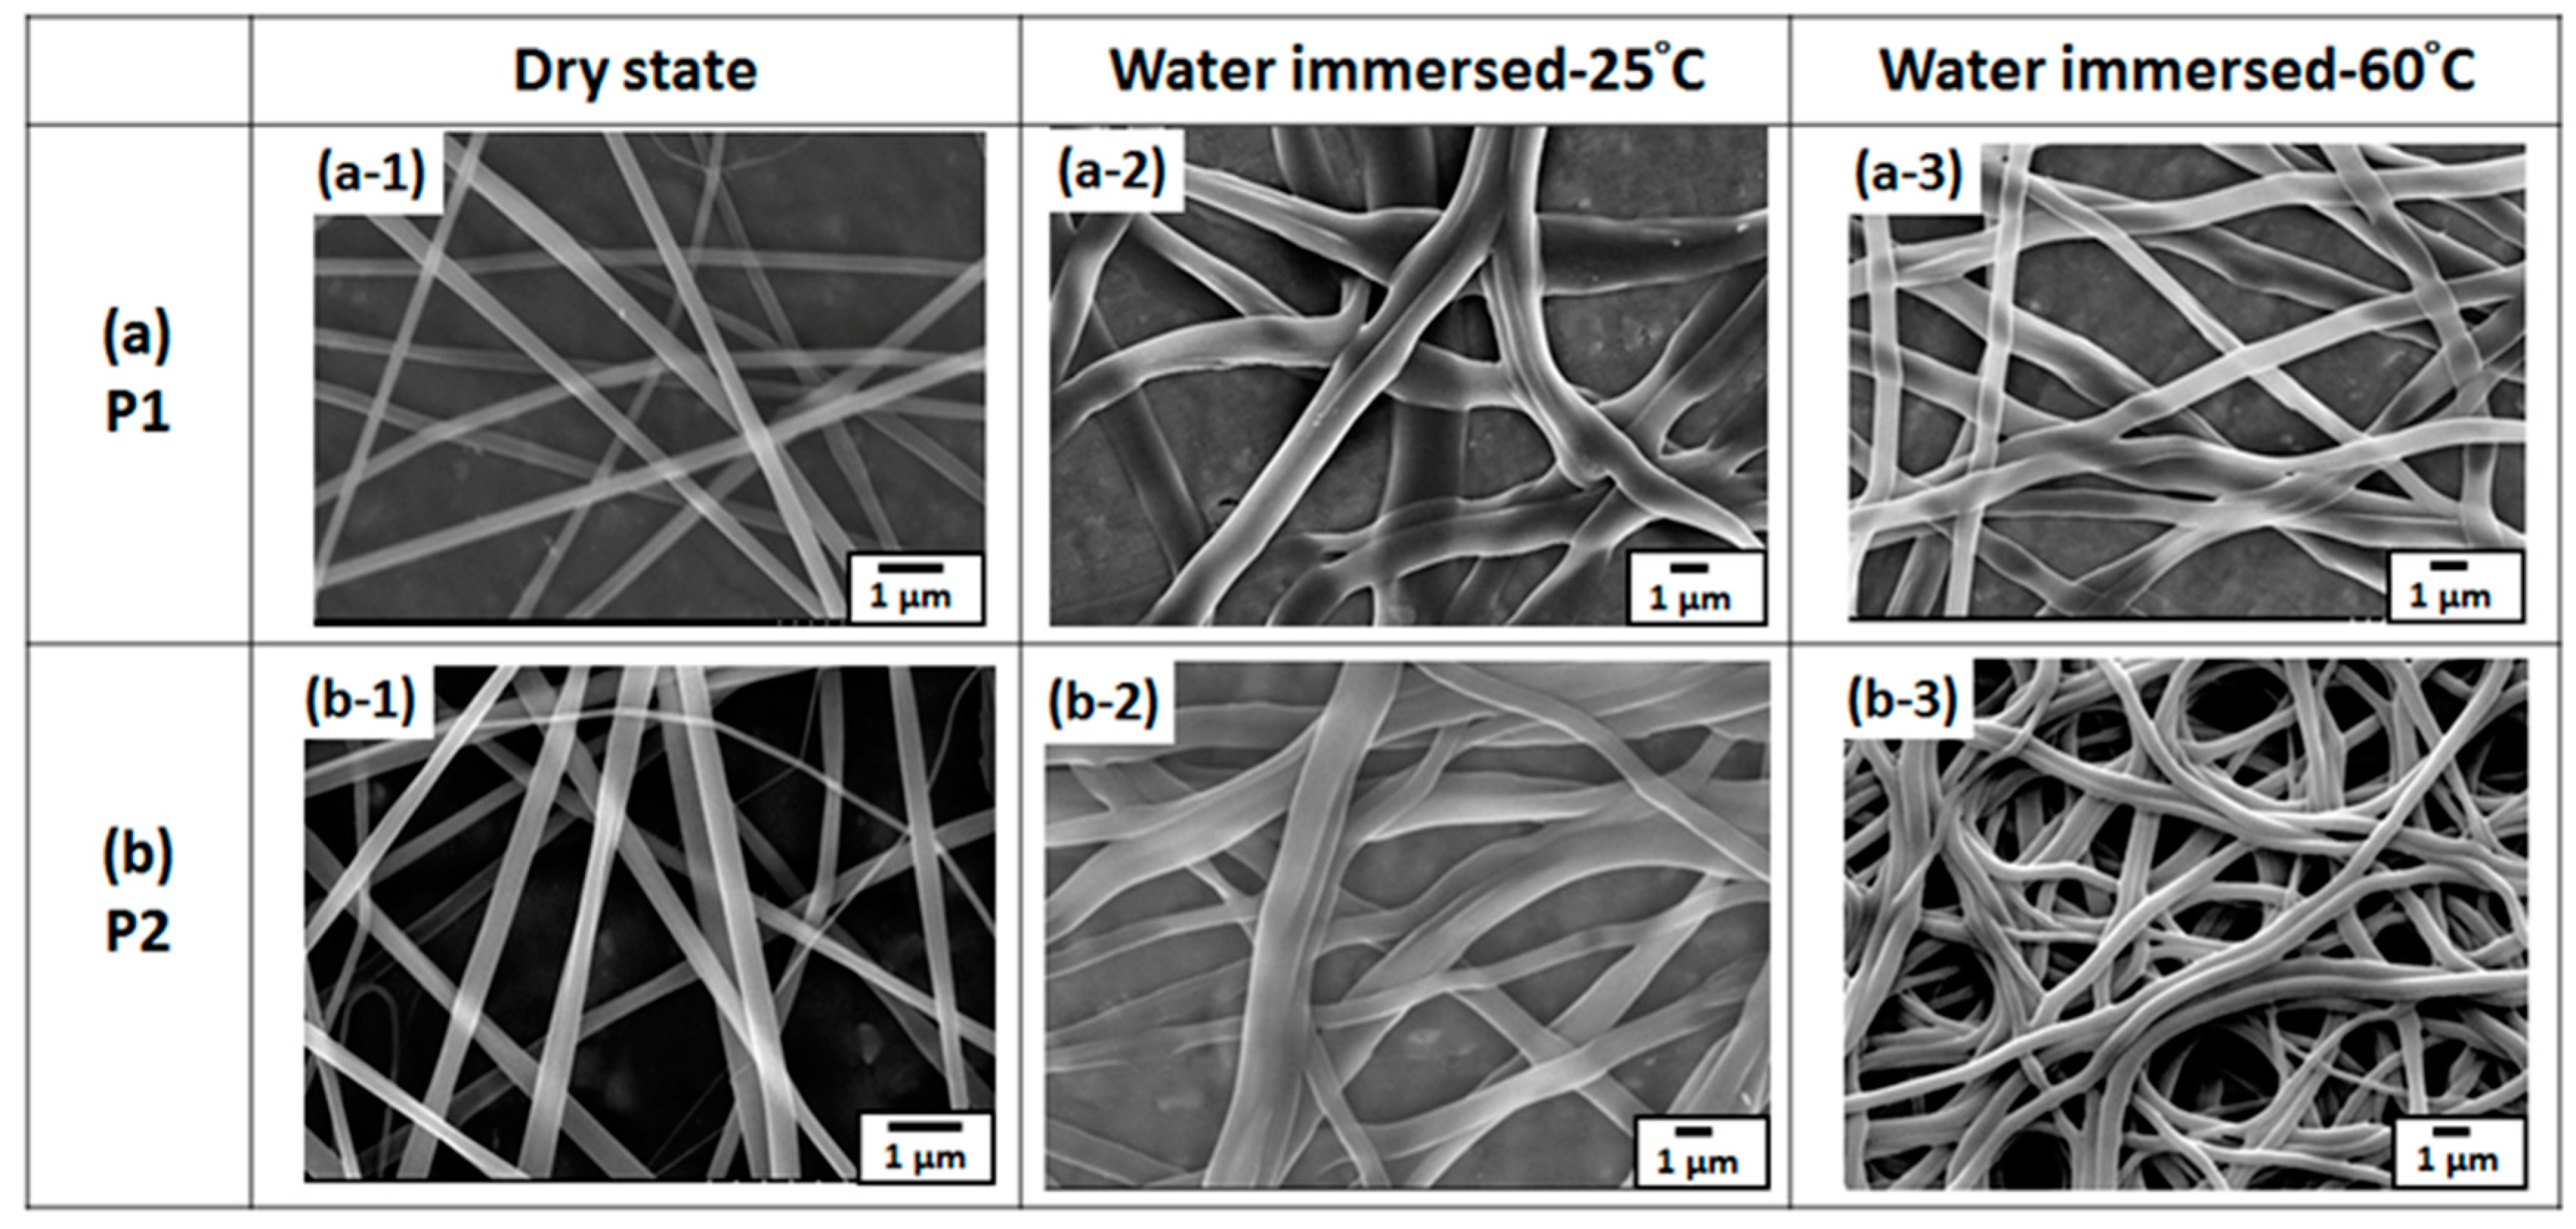
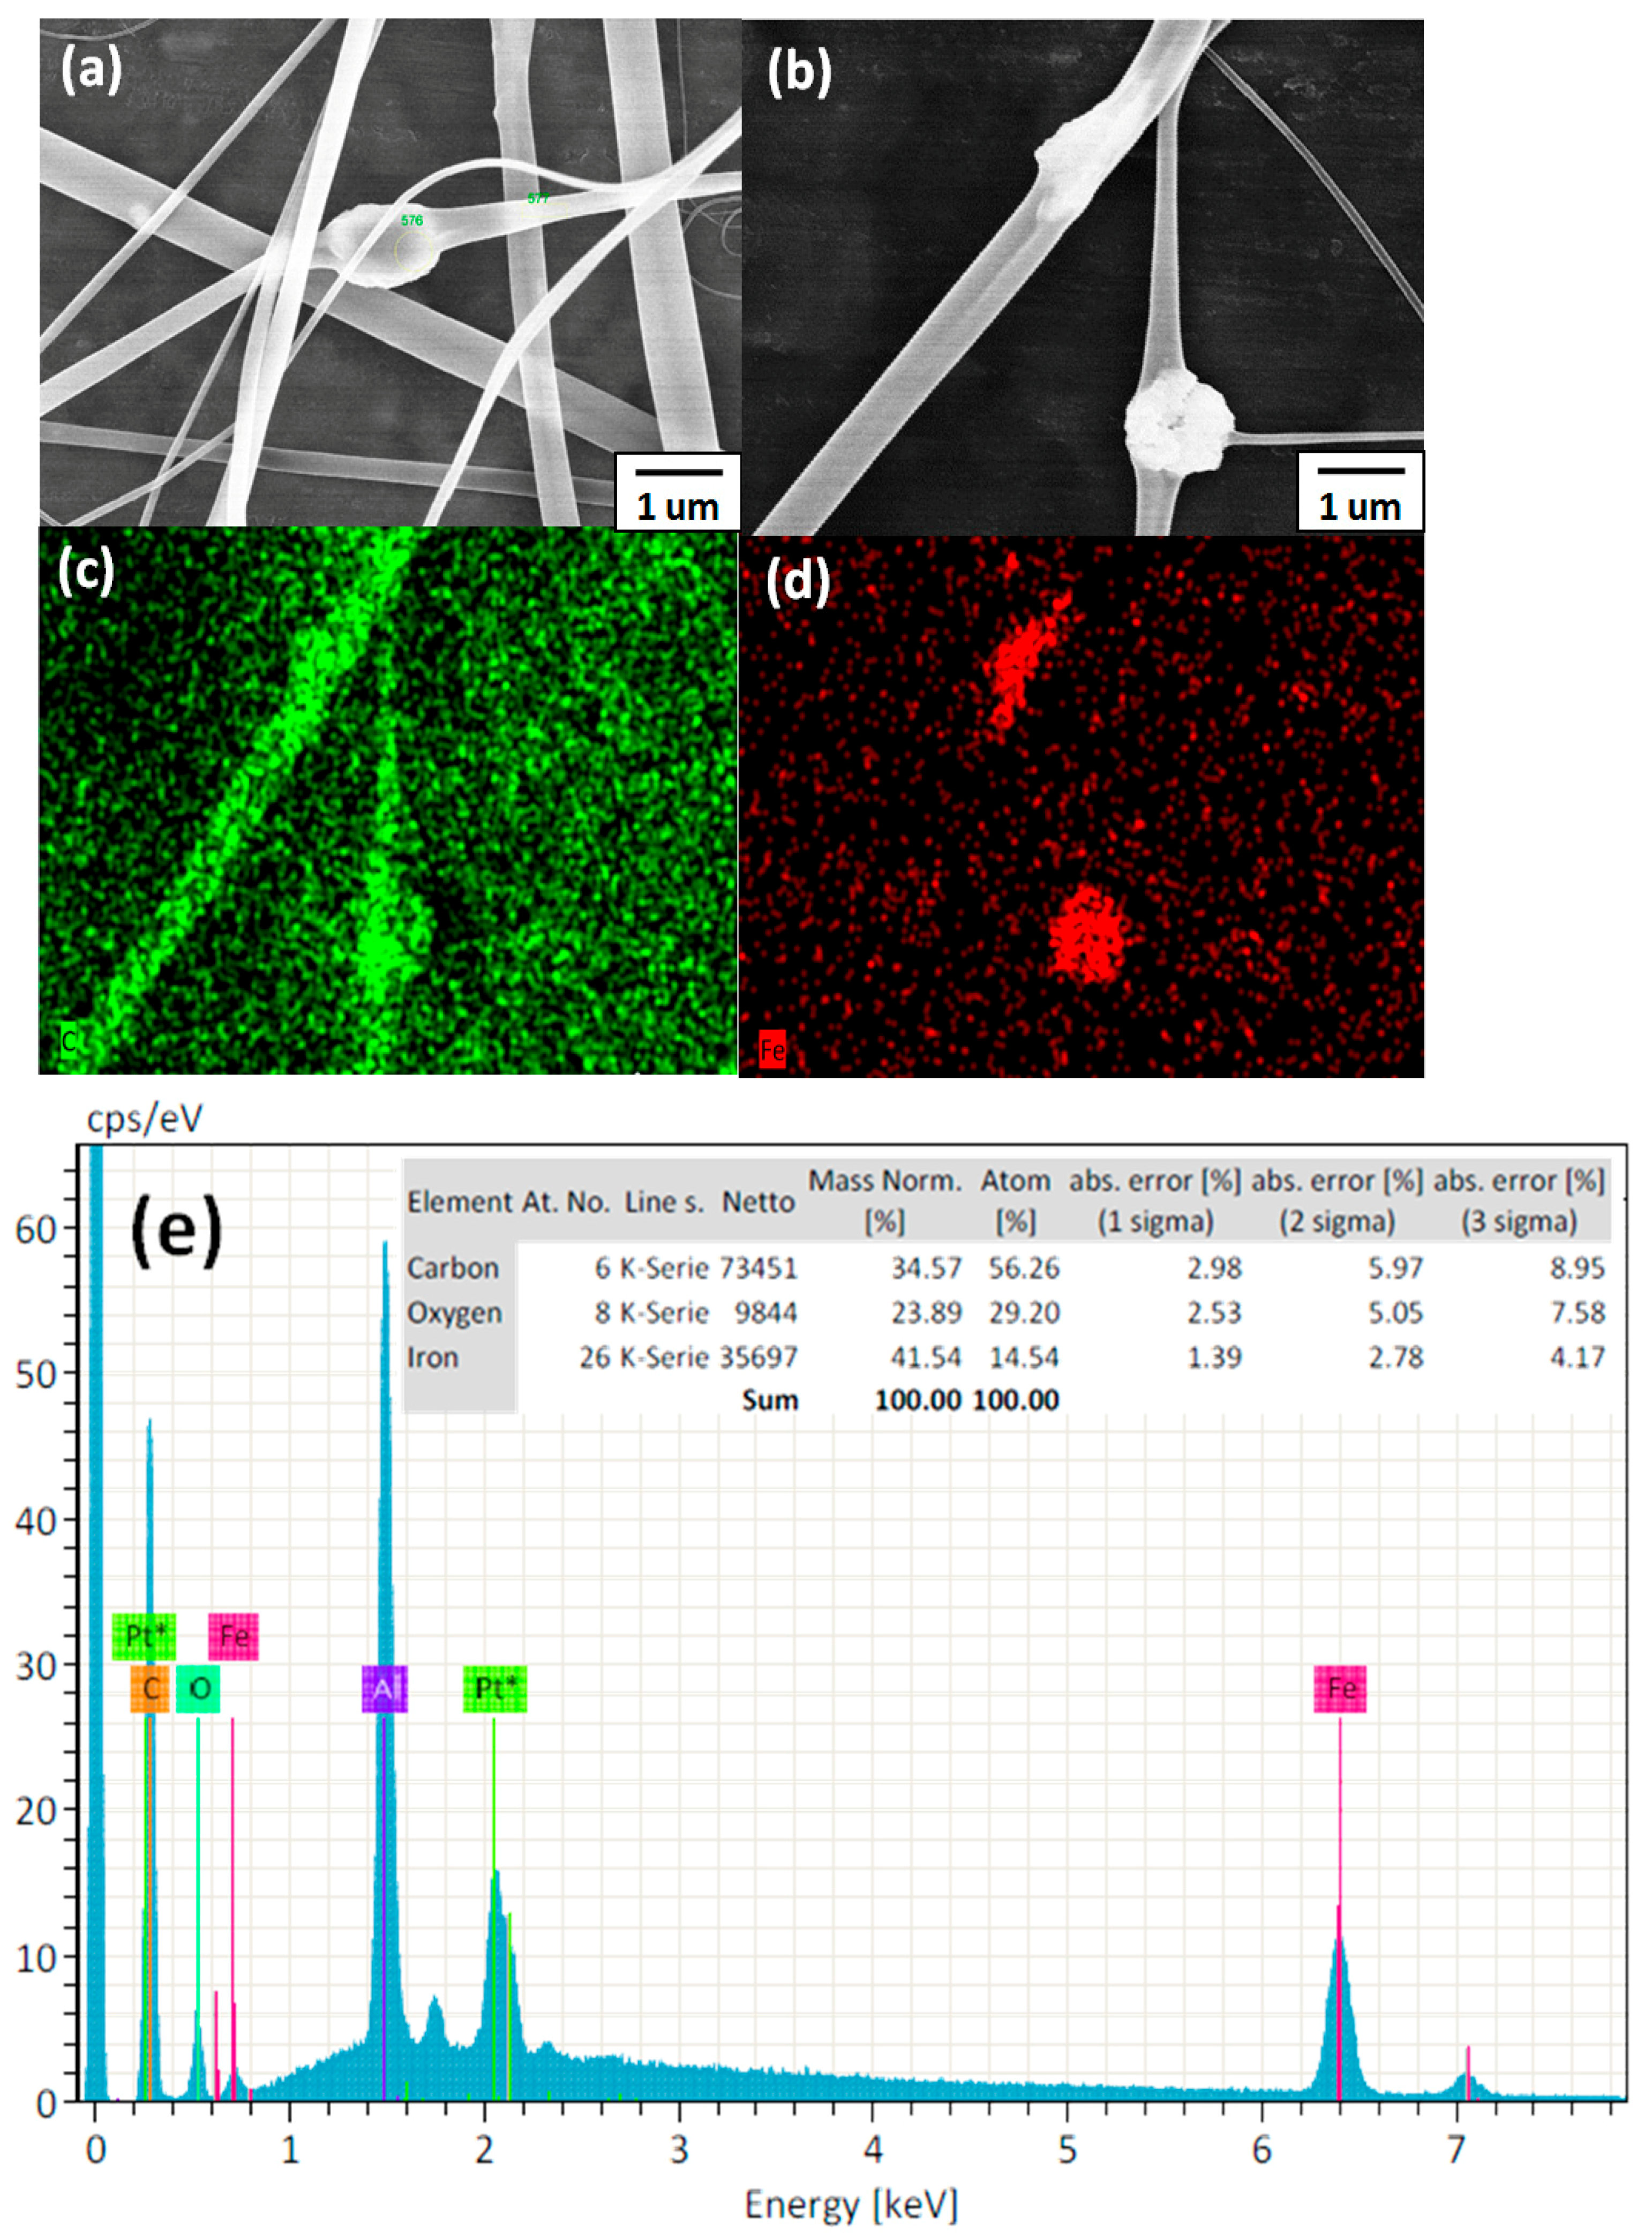
3.2. Morphology and Characterization of ES Nanofibers

Figure 6 presents field-emission SEM (FE-SEM) images of the ES nanofibers prepared using P1 and P2 at a solution concentration of 250 mg mL−1 with MeOH. When dry, the P1 and P2 ES nanofibers had average diameters of 416 ± 31 and 437 ± 42 nm, respectively. The recorded average diameter was a statistical average of 50 fibers from each sample. Moreover, all of the ES nanofibers from pure MeOH solvent were smooth and nonporous. The diameters of the P1 and P2 ES nanofibers were similar when they were dry because the concentration of the ES solution was fixed and the molar ratios of the NMA and AA moieties in the copolymers were lower than that of NIPAAm. To observe the morphologies of the cross-linked P1 and P2 ES nanofibers in pure water at various temperatures, the fibers were collected on a small piece of aluminum foil and immersed in water at 30 °C or 60 °C. After 10 min, the samples were solidified by placing in a flask containing liquid nitrogen, and the residual water was removed using a vacuum for 30 min to retain the original morphology. Figure 6 shows the FE-SEM images of the P1 and P2 ES nanofibers in a wet state after they were immersed in water at 30 or 60 °C. As shown in Figure 6 (wet state), the P1 and P2 fibers exhibited diameters of 1250 ± 205 and 1420 ± 282 nm at 25 °C and 830 ± 124 and 920 ± 138 nm at 60 °C, respectively. The diameters were substantially enlarged after the nanofibers were immersed in water (416 ± 31, 437 ± 42 nm, respectively; Figure 6) because the hydrophilic NIPAAm chain swelled in the water. However, these swollen fibers maintained their cylindrical shape and did not dissolve in water, a phenomenon attributed to the efficient chemical cross-linking of the NMA moiety [23]. Furthermore, the fiber diameters at 30 °C were greater than those at 60 °C because of the hydrophilic NIPAAm chain, the temperature of which was below the LCST. By contrast, the nanofiber diameters decreased from approximately 1.5 μm to 1.0 μm as the temperature increased from 30 to 60 °C, due to the temperature of which was above the LCST resulting in the hydrophobic NIPAAm chain.
Figure 7a,b shows FE-SEM images and transmission electron microscopy images of the Fe3O4 NPs, respectively. The diameters of the nanoparticles were monodispersed within the range 15–25 nm. Figure 7c shows that the Fe3O4 NPs precipitated out of the solution and dropped to the bottom because of higher density (left image) and then accumulated on the side of the bottle because of a magnetic bar placed next to the bottle (right image), indicating that magnetic Fe3O4 NPs can be absorbed using a magnet [38].
Figure 8a presents an SEM image of P2-5% ES nanofibers prepared from P2 copolymers blended with Fe3O4 NPs at a 5% weight ratio. The strong stretching force associated with electrospinning induces orientation of these Fe3O4 NPs along the axis of the fiber. The numerous carboxyl groups of PAA in P2 inhibited the aggregation of Fe3O4 NPs, a result similar to those of several previous studies [27,28,29,30,31]. The result can be attributed to P2-5% containing carboxyl groups of PAA that interact with the Fe3O4 NPs, thereby enabling the PAA to be easily adsorbed by Fe3O4 NPs. Figure 8b shows an SEM image of P2-5% ES nanofibers before elemental mapping, and Figure 8c,d shows the corresponding SEM images of P2-5% ES nanofibers after carbon (C) and iron (Fe) elemental mapping, respectively, by using energy dispersive X-ray spectroscopy (EDS). Notably, the C and Fe are contributed by the P2 and Fe3O4 NPs, respectively. The C and Fe mapping images in Figure 8b–d indicate that Fe3O4 NPs were present within the P2-5% ES nanofibers because no Fe species remained on the substrate, as shown by the dark region. The Fe content within the P2-5% ES nanofibers was 14.54 wt % as estimated according to the EDS spectrum (Figure 8e). Furthermore, the amounts of Fe3O4 NPs within the P2-5% ES nanofibers were confirmed through TGA in an oxygen atmosphere (Figure S4). Figure S4 shows the stages within the temperature range 100–750 °C, including the decomposition of poly(N-methylolacrylamide)(PNMA) and PAA, and the oxdiation of the Fe3O4 NPs. Weight loss initially occurred below 300 °C, and originated from either the decomposition of noncoordinated carboxyls or the evaporation of trace water. Weight loss that occurred between 300 and 450 °C was caused by the cleaving of PNIPAM chains [31]. Finally, the copolymers were degraded and Fe3O4 was completely transformed into Fe2O3 at 700 °C [30]. The calculated weight percentage of the remaining content, consisting of carbon residue and Fe2O3, was approximately 14 wt %.

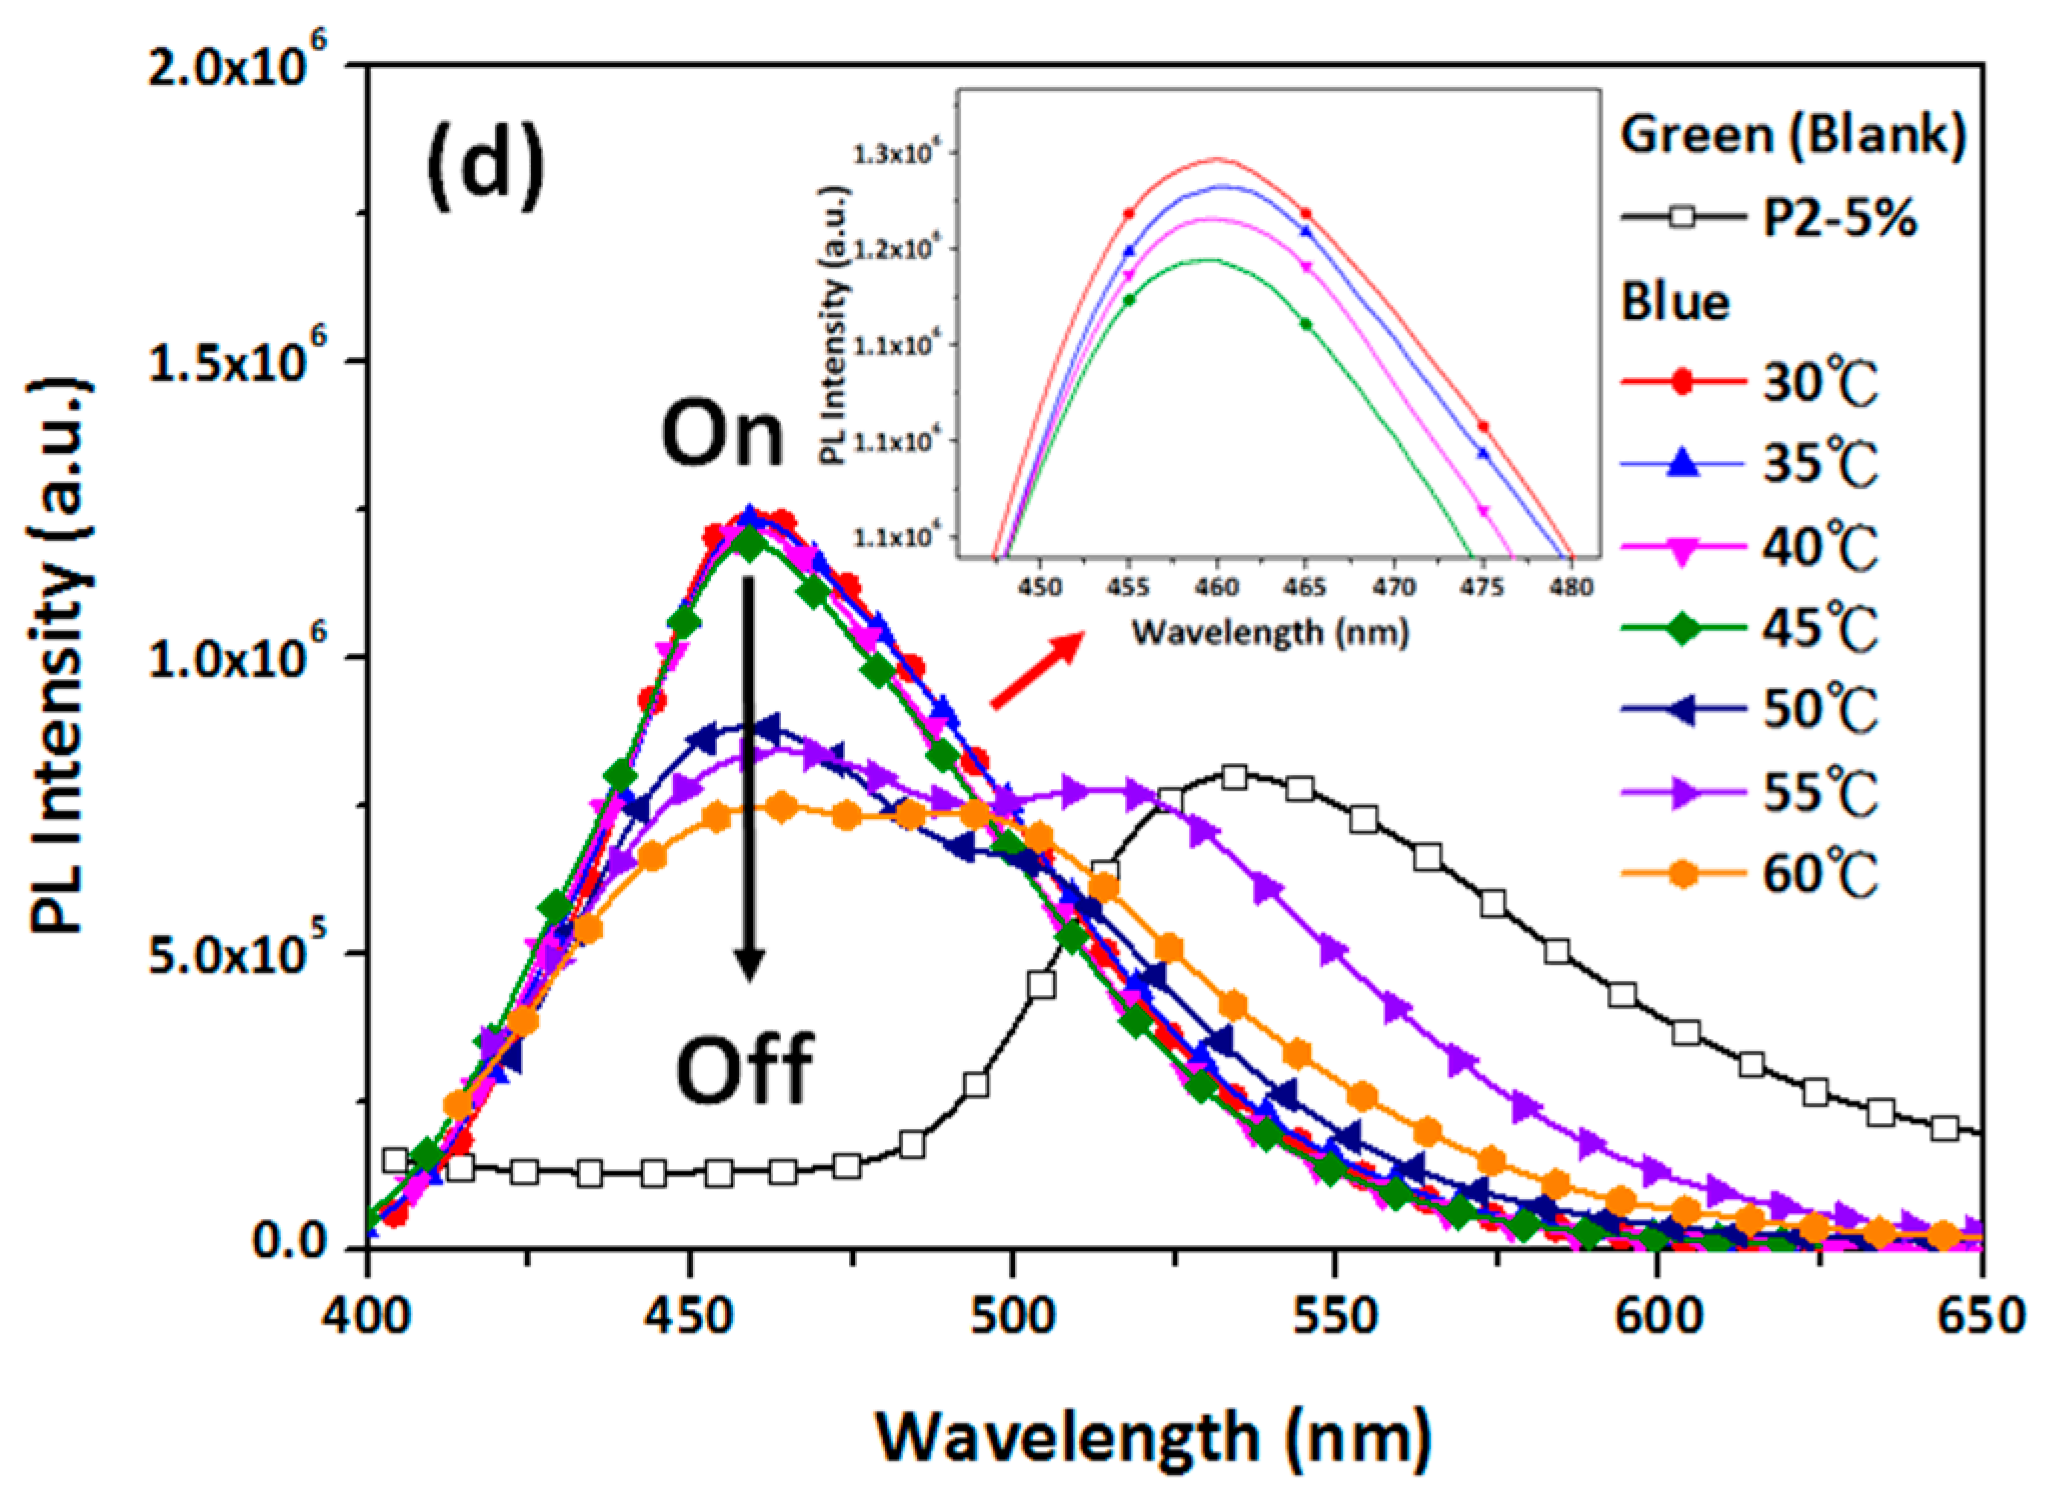
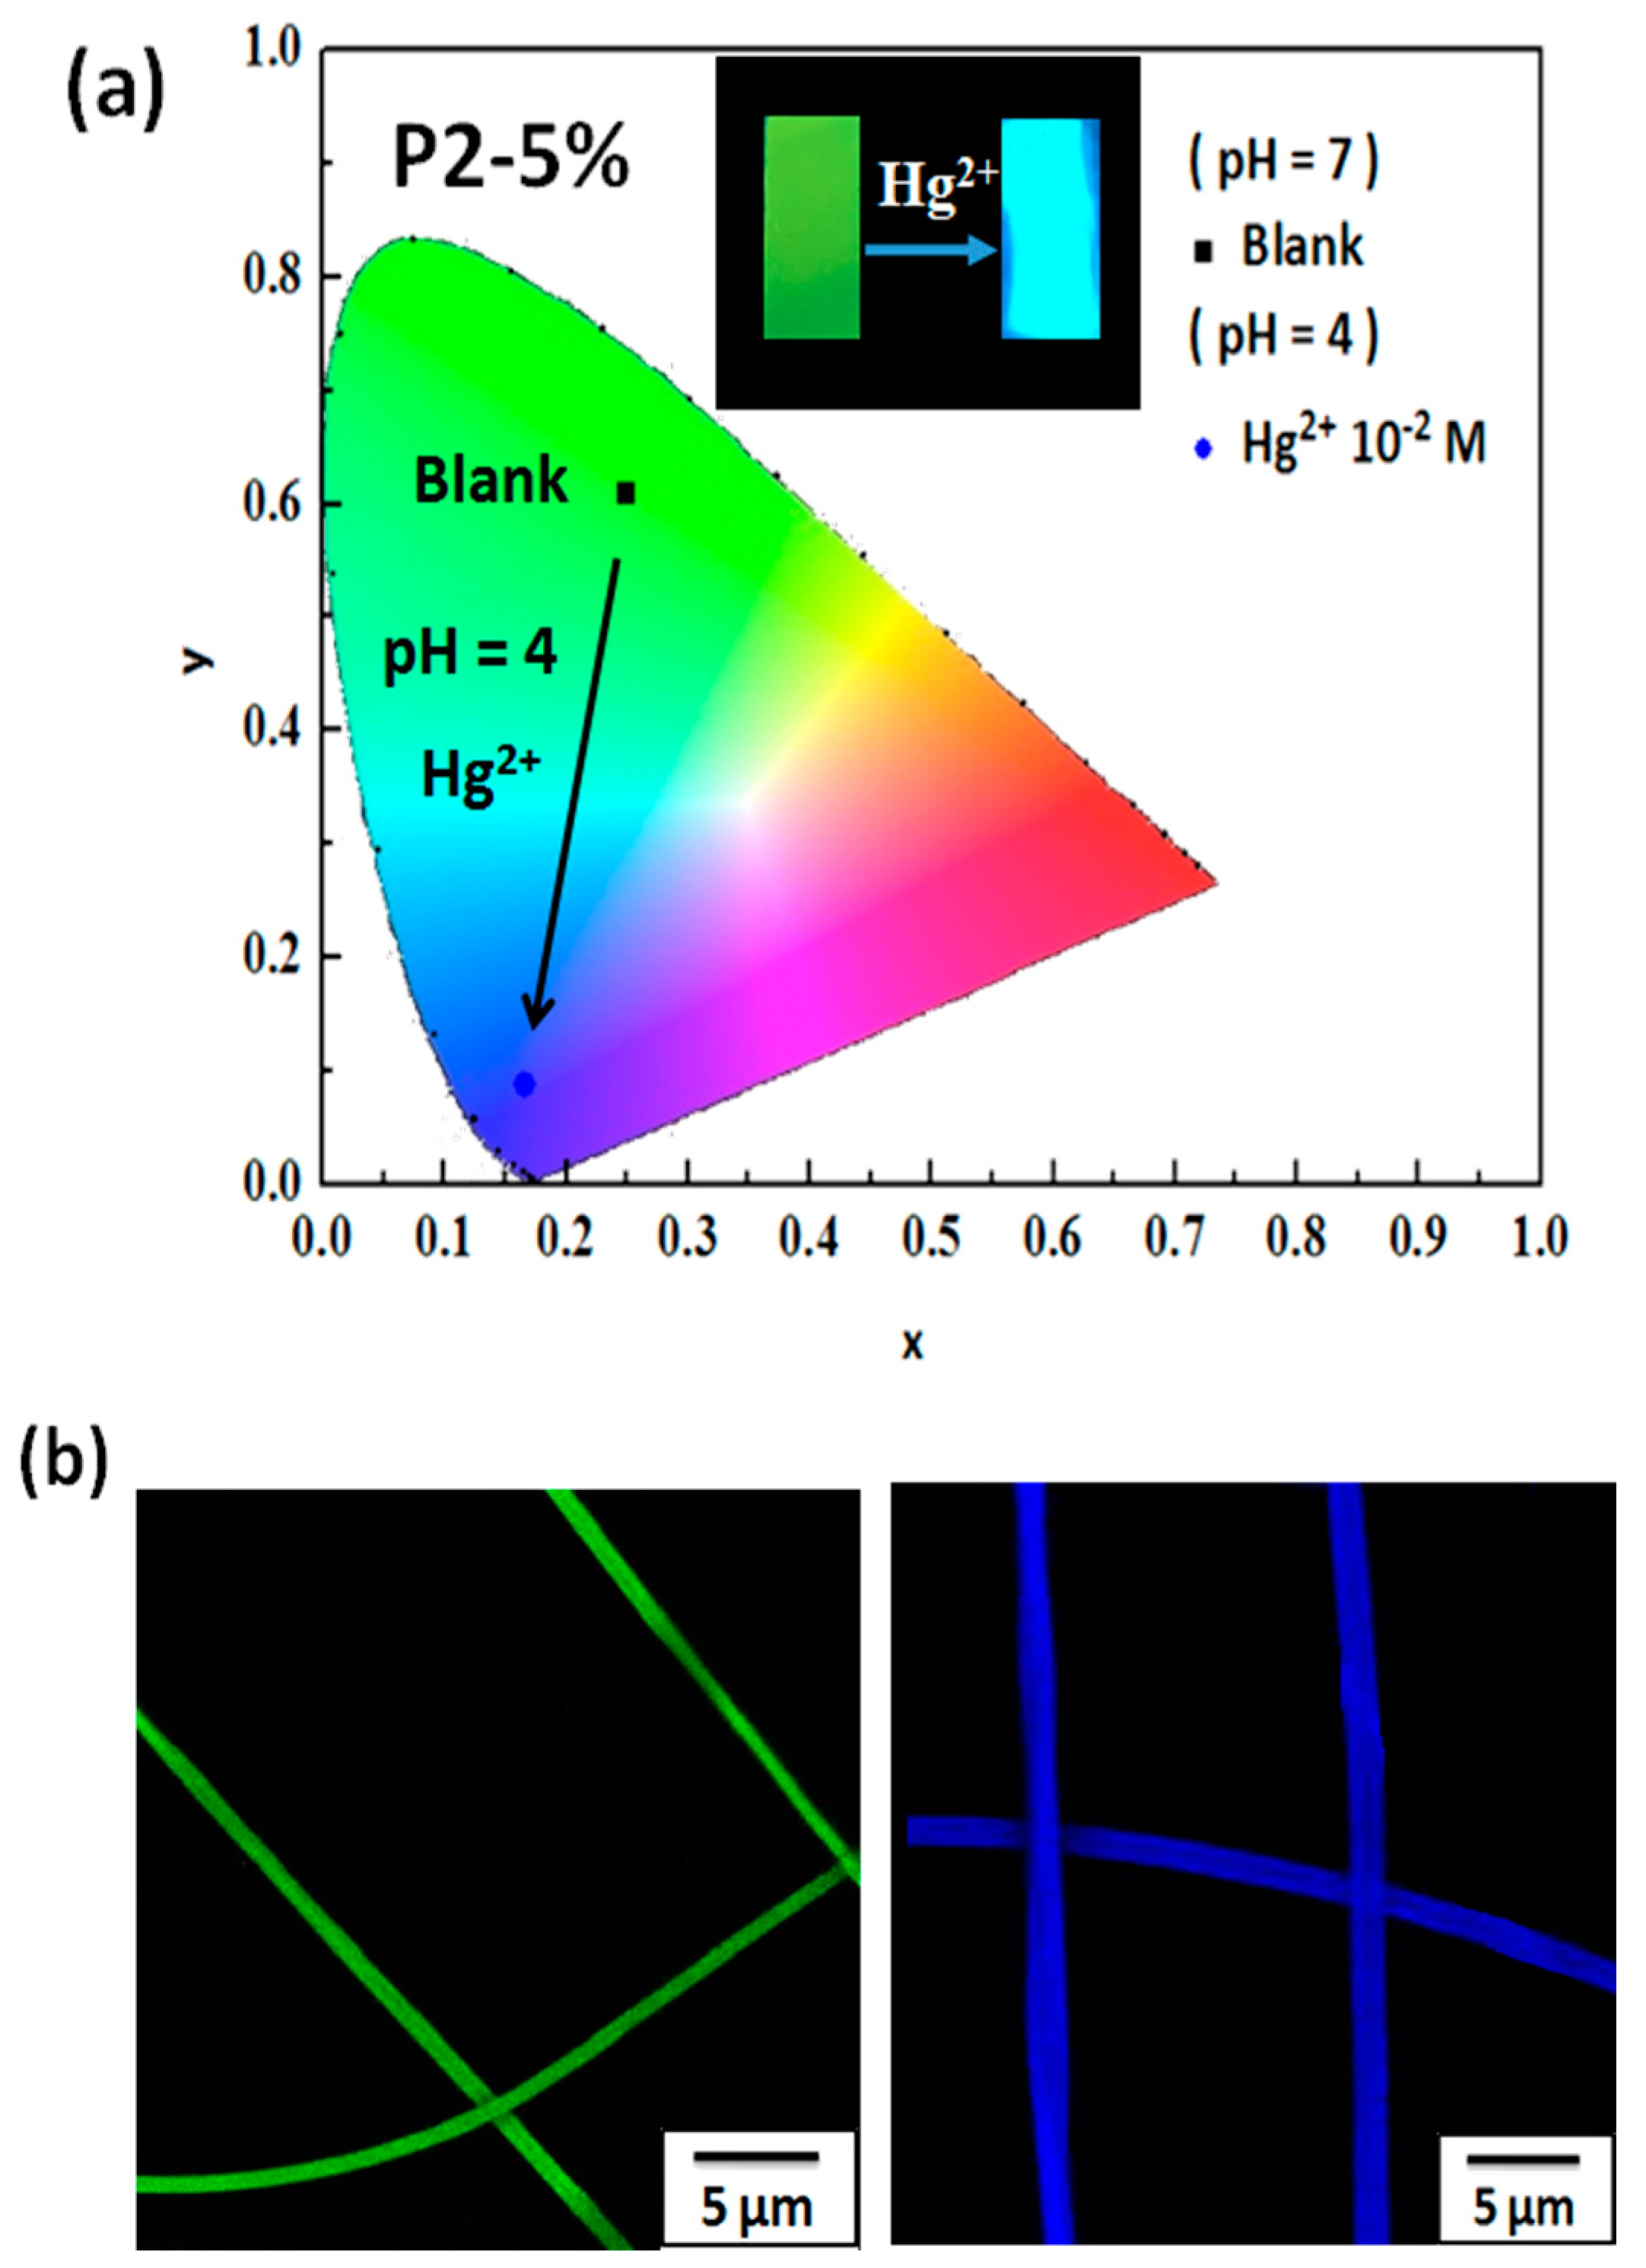
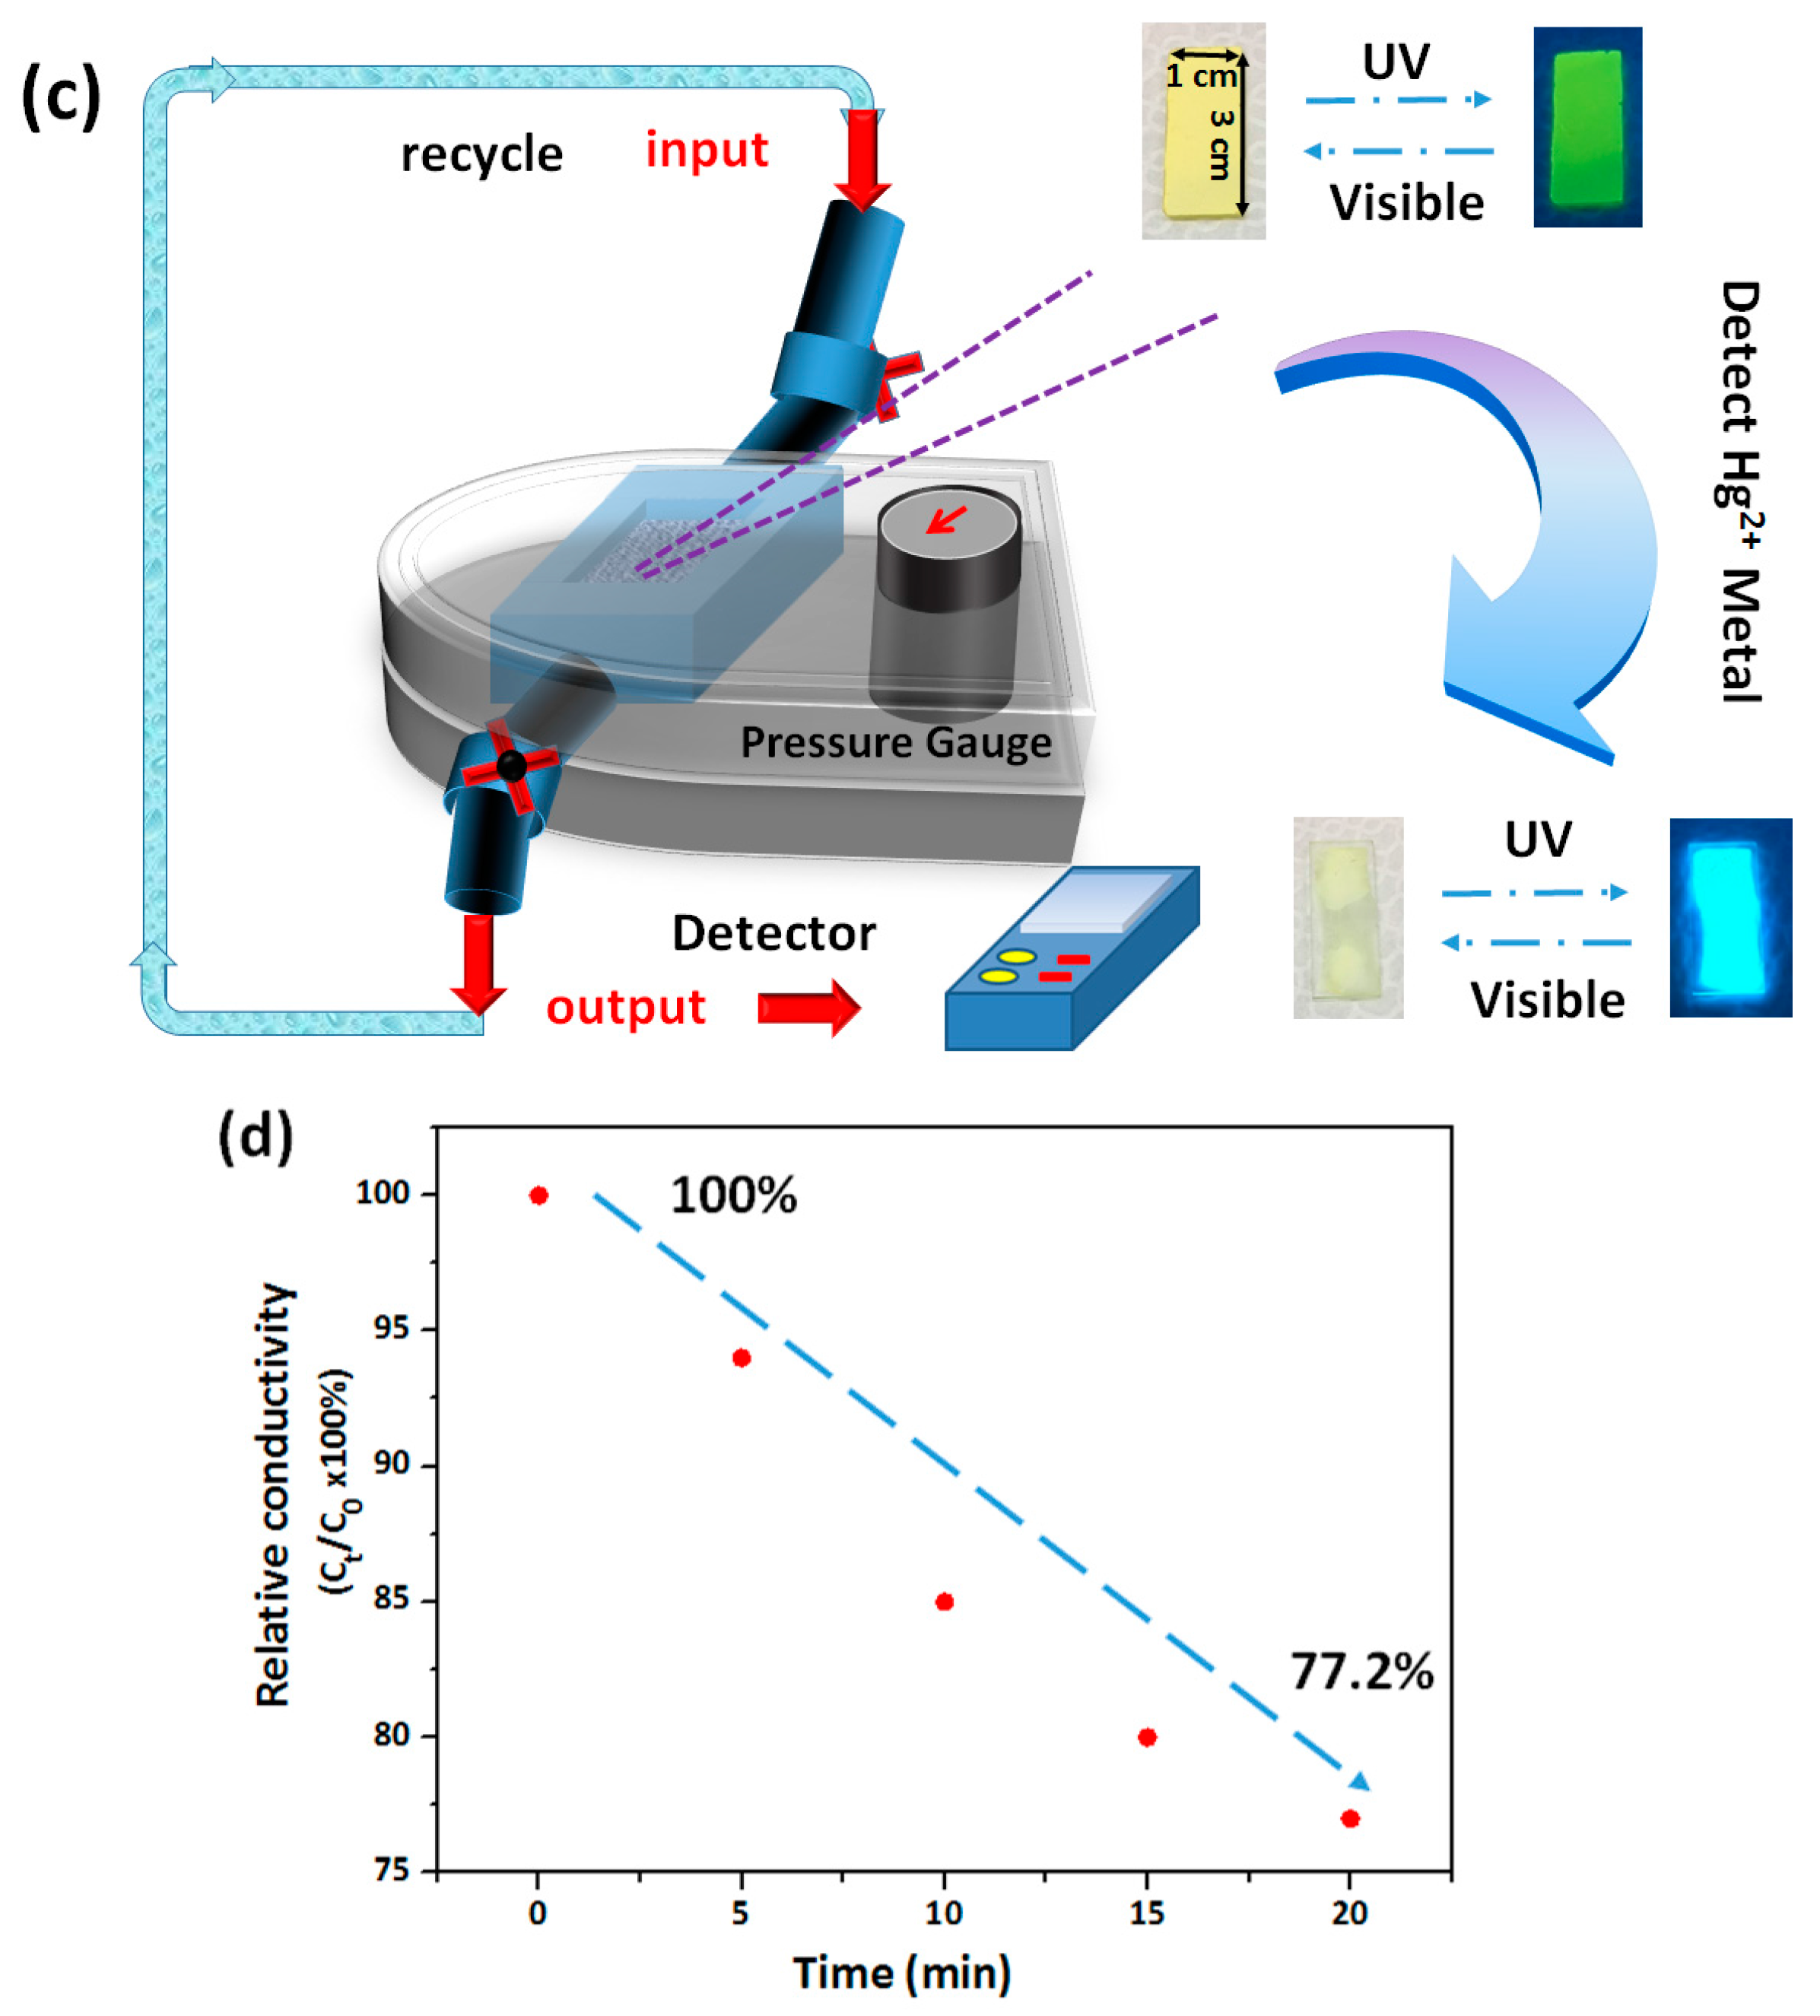
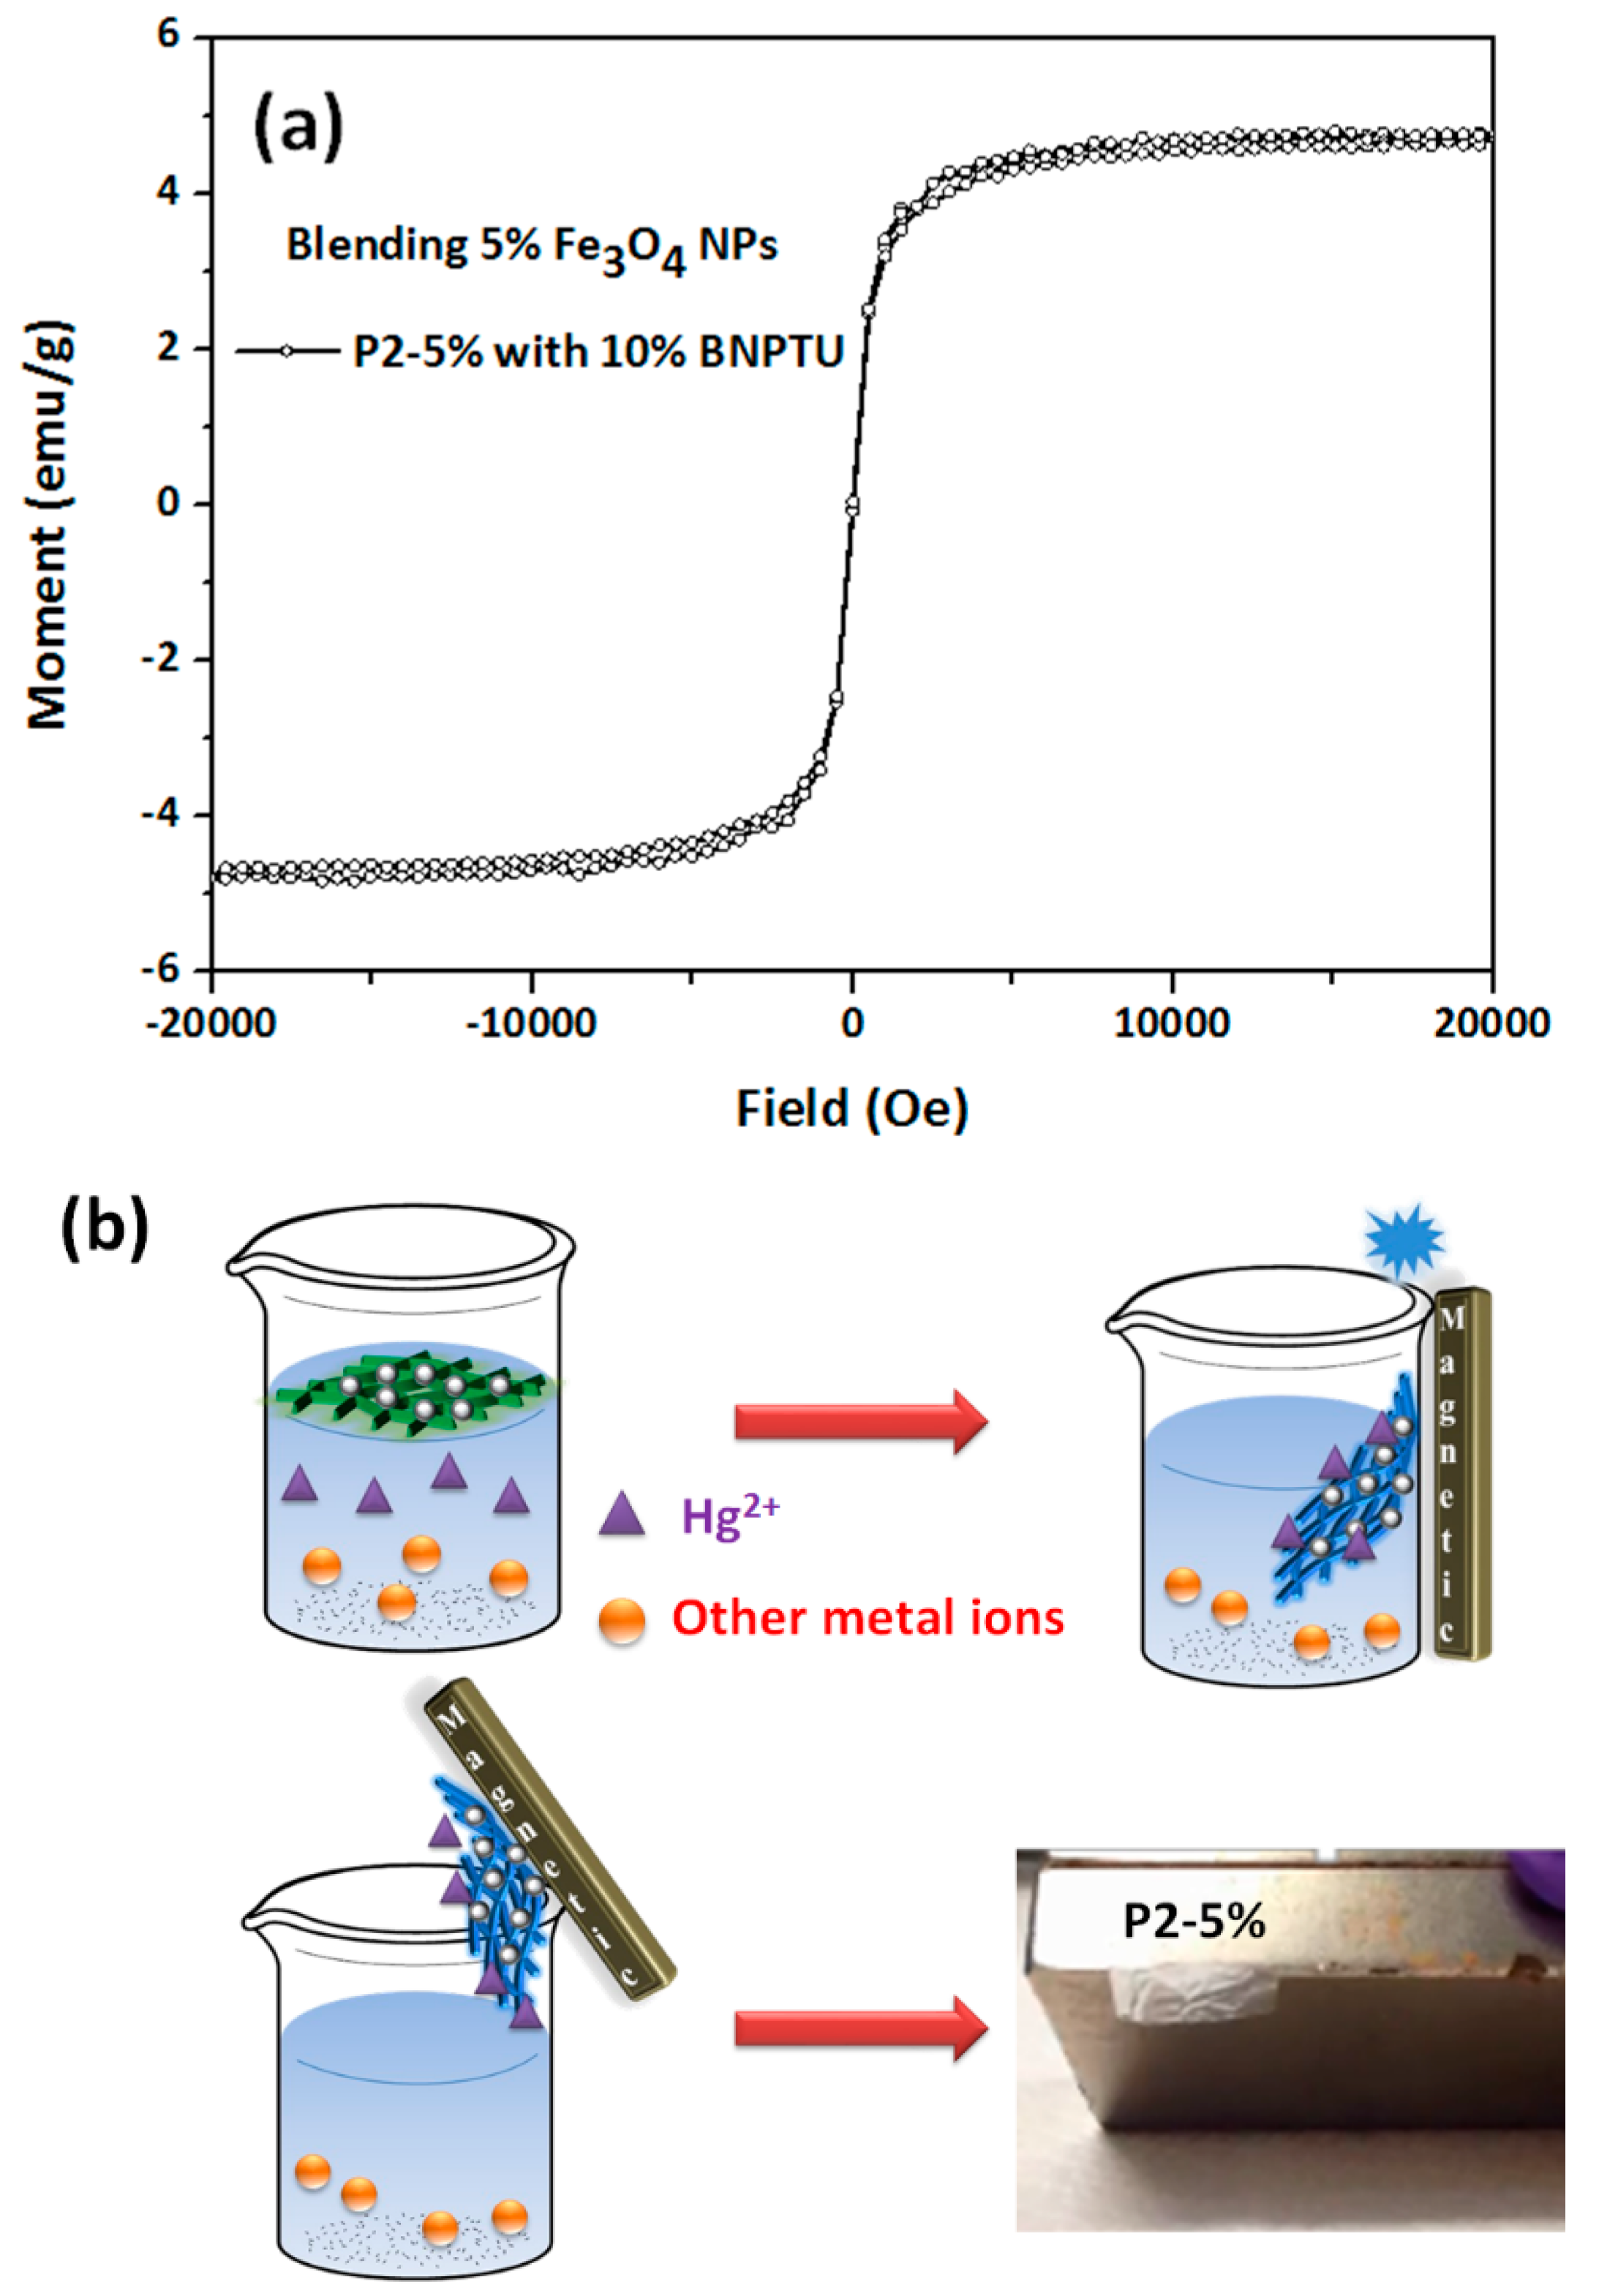
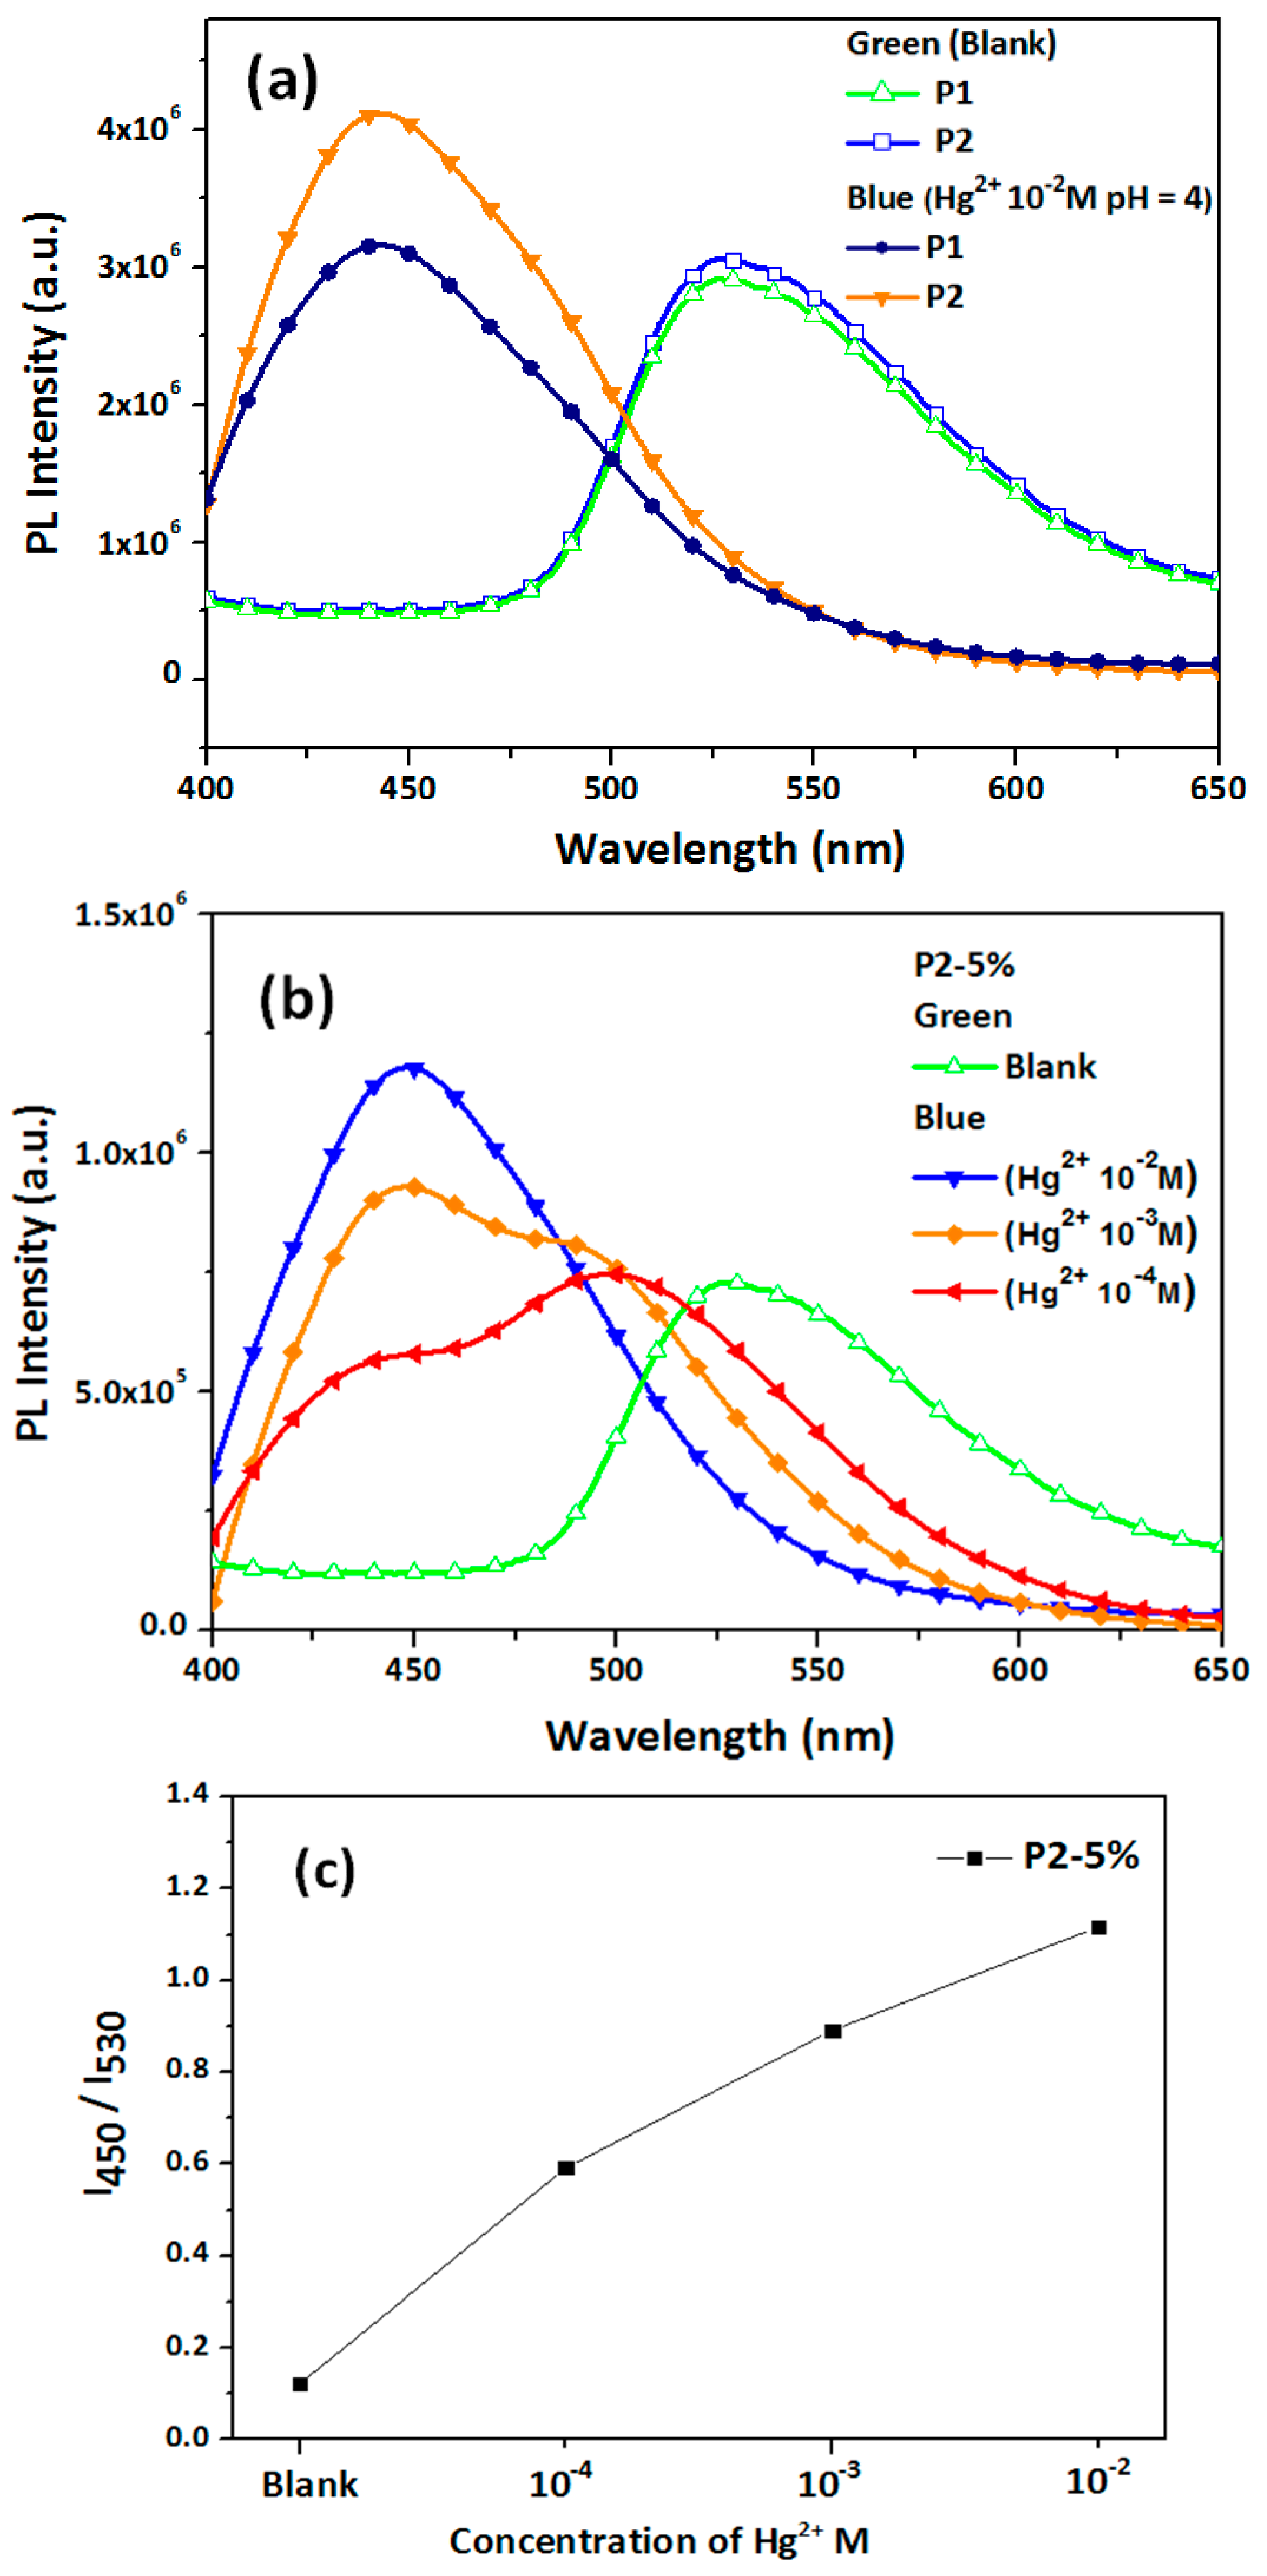
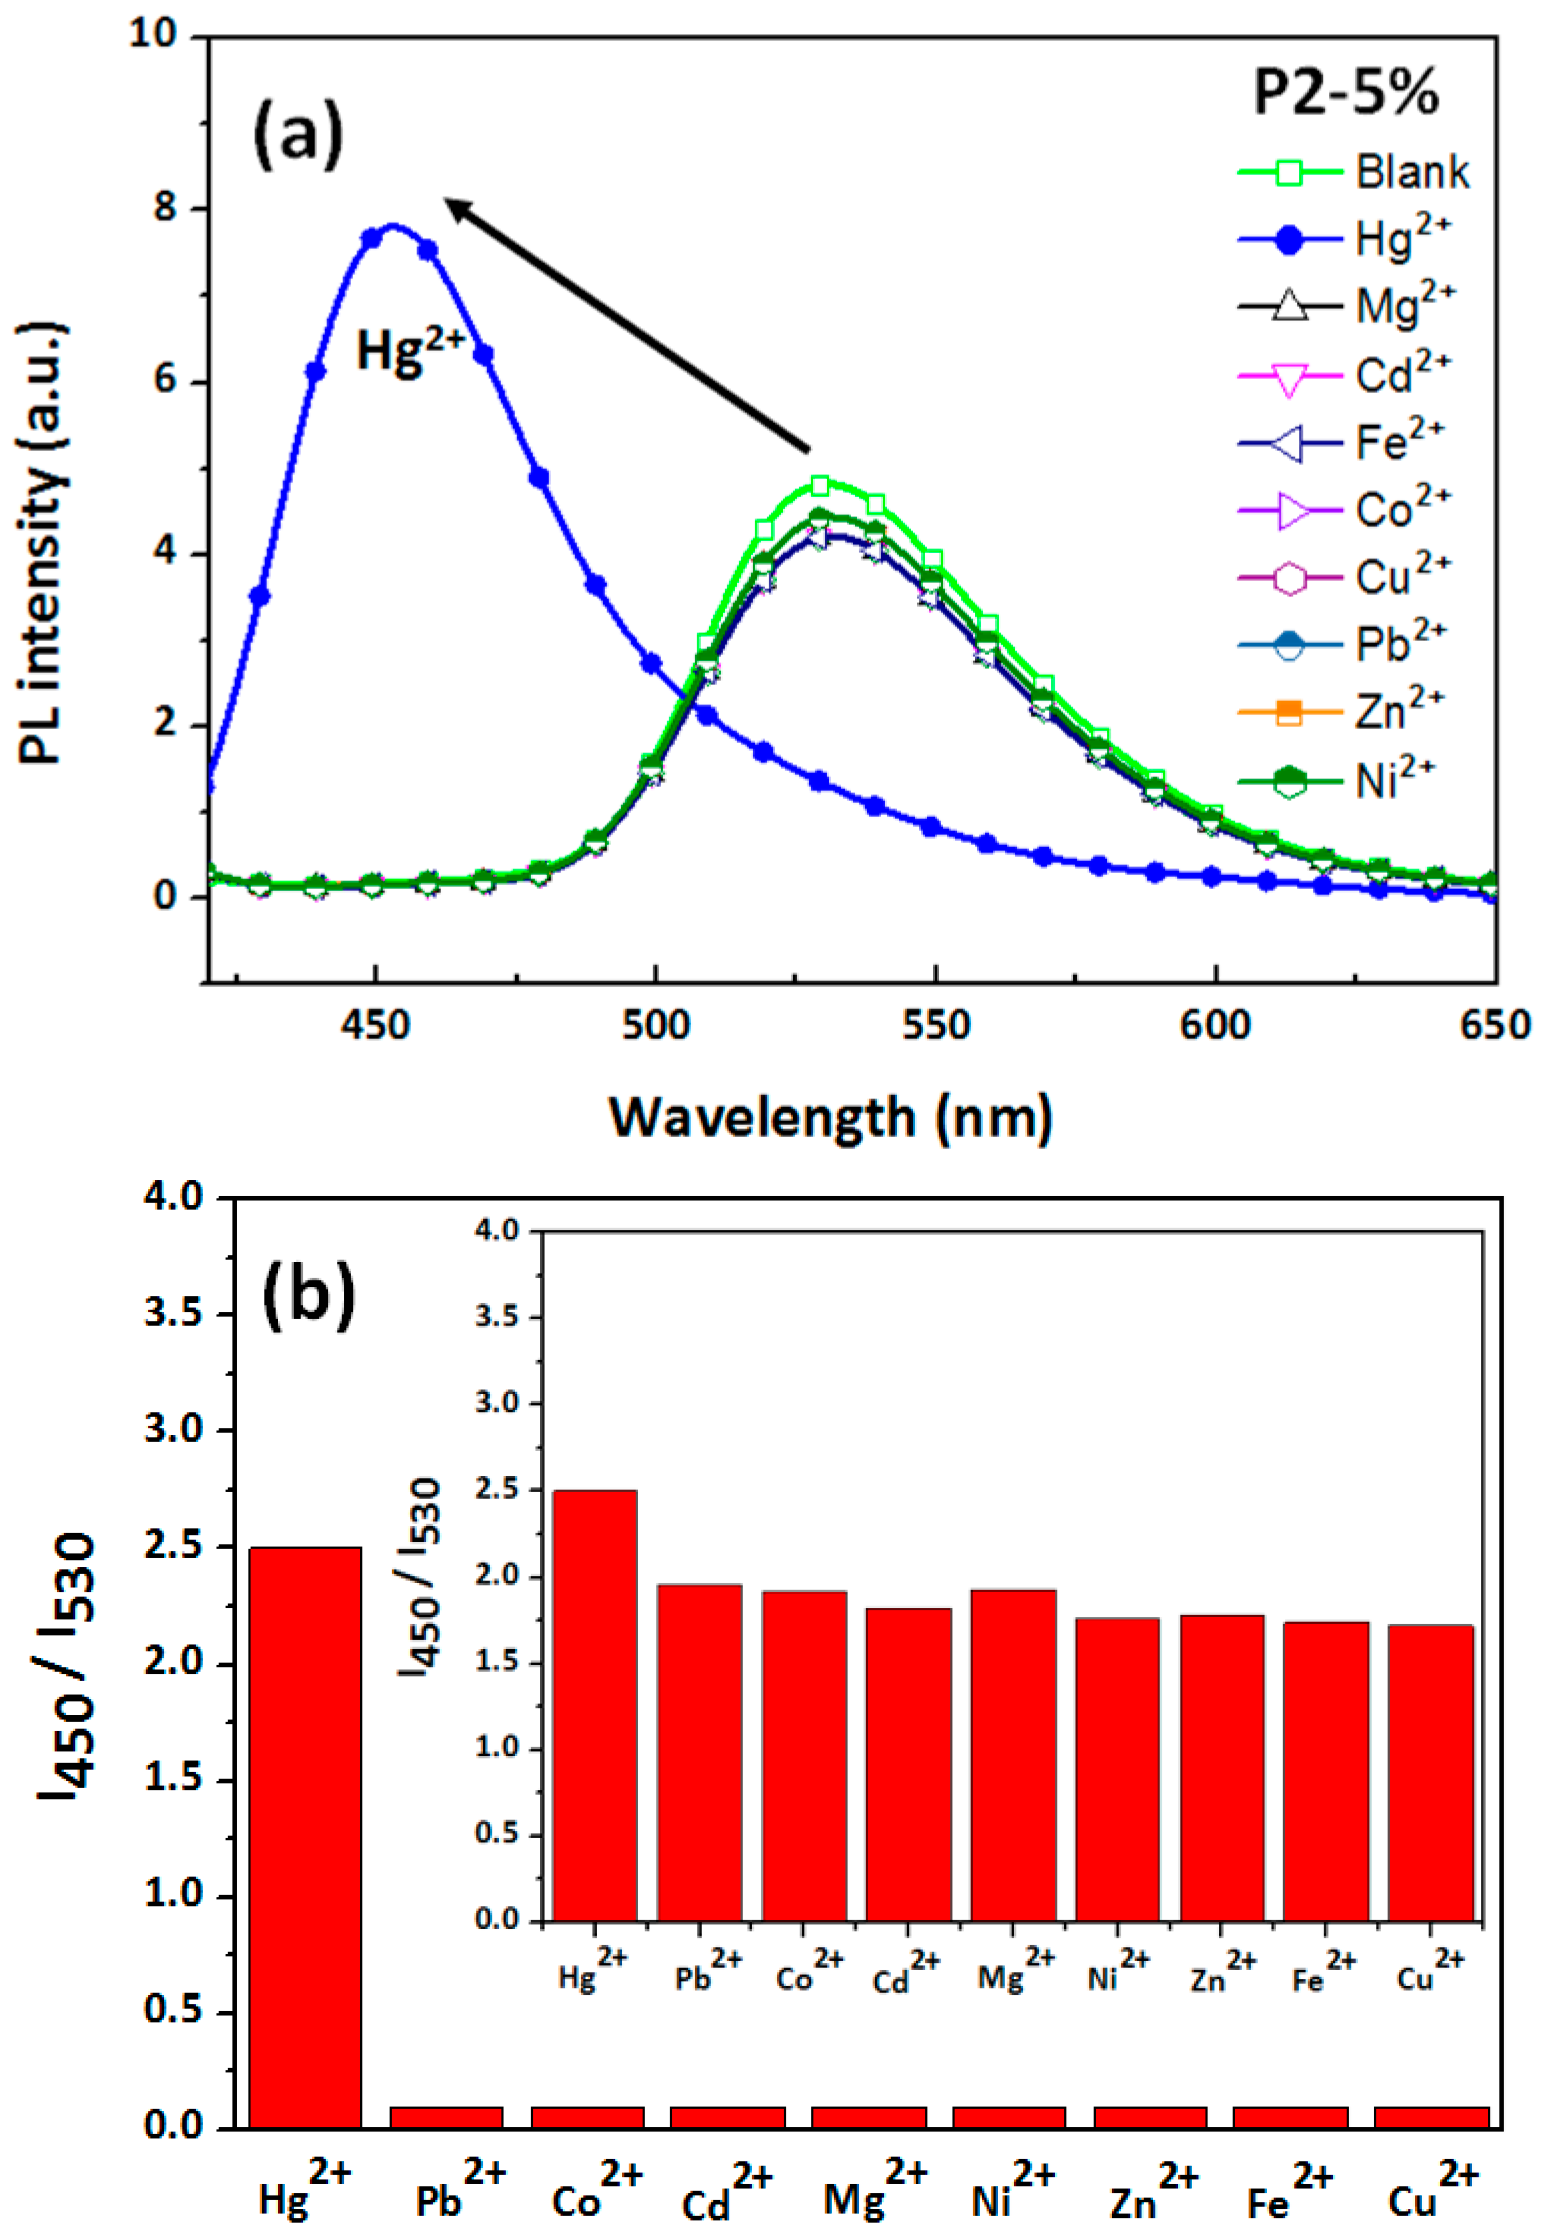
3.3. Hg2+ Sensing, Thermoresponsiveness, and Magnetic Properties of ES Nanofibers

P1 or P2 blended with 10% BNPTU and 5% Fe3O4 NP ES nanofibers, which can sense metal ions because of the ability of PAA and BNPTU to adsorb Hg2+, was systematically explored [8,33]. Figure 9a shows the PL spectra of ES nanofibers prepared from P1 and P2 blended with 10% BNPTU in an aqueous solution without Hg2+ (blank) or with Hg2+ at 10−2 M and subjected to 430-nm excitation. The maximum emission peak (λPLmax) of the P1 and P2 ES nanofibers blueshifted substantially from 530 nm in a non-Hg2+ aqueous solution to 450 nm in an Hg2+ aqueous solution. This change corresponded to the thiourea unit of BNPTU, which transformed the imidazoline moiety (with the Hg2+ ion), thereby causing a significant reduction in electron delocalization within the fluorophore (Figure 2c) [5,35,36,37]. Moreover, the PL intensity of the P2 ES nanofibers was 1.3 times that of P1 ES nanofibers, indicating that the AA moiety of P2 enhances the adsorption of mercury ions, similar to one report [33].
Figure 9b shows the PL spectra of ES nanofibers prepared from P2 blended with 10% BNPTU and 5% Fe3O4 NPs. P2-5% was placed in aqueous solutions without Hg2+ (blank), with Hg2+ at 10−4, 10−3, and 10−2 M, and under neutral conditions at 430-nm excitation. The presence of the highest Hg2+ concentration (10−2 M) led to a λPLmax blueshift from 530 nm to 450 nm in the emission spectra, similar to that of the P2 ES nanofibers without Fe3O4 NPs, indicating that the metal ion sensing ability was unaffected by Fe3O4 NPs. As shown in the figure, the concentration of Hg2+ increasing from 0 (blank) to 10−4, 10−3, and 10−2 M resulted in clear blueshifts in the λPLmax from 530 to 500, 450, and 450 nm, respectively. Furthermore, when the mercury ion concentration was at the extremely dilute level of 10−3 M, the emission maximum shift Δλmax was observed to be as high as 80 nm, resulting in a color change easily observable by the naked eye. Moreover, the lowest detectable Hg2+ concentration for the ES nanofibers was 10−4 M, suggesting that the P2-5% ES nanofibers were highly sensitive to Hg2+ but not to general ions, even when the system contained Fe3O4 NPs.
Figure 9c shows the changes of the fluorescence intensity ratio, I450/I530 (I450 is the fluorescence intensity of BNTPU after the detection of Hg2+ emission at 537 nm, whereas I530 is the fluorescence intensity of BNTPU before the detection of Hg2+ emission at 530 nm) of the P2-5% ES nanofibers when subjected to Hg2+. As the concentration of Hg2+ was increased, BNTPU emission at 530 nm gradually decreased, and BNTPU-Hg2+ emission at 450 nm gradually increased. These changes corresponded to the fluorescence of BNTPU chelated with Hg2+ ions, causing the I450/I530 to increase from approximately 0.1 to 1.2 as the Hg2+ ion concentration increased from 0 to 10−2 M. The P2-5% ES nanofibers exhibited high sensitivity to Hg2+ ions between 10−4 and 10−2 M. Moreover, the titration data of Figure 9c show that the Kd was calculated as 1.58 mM [24].
Figure 9d shows fluorescence variations in the P2-5% ES nanofibers in a 10−2 M Hg2+ environment as the temperature was varied from 30 to 60 °C. At 30 °C, the temperature at which the ES nanofibers chelate Hg2+, the λPLmax was blueshifted substantially from 530 nm (blank, green emission) to 450 nm (blue emission) in the emission spectra. When the temperature was increased from 30 to 45 °C, only a mild decrease in PL intensity at 450 nm (λPLmax) was observed, exhibiting almost no change, as shown in the enlarged inset image. However, when the temperature was increased from 45 to 50 °C, a dramatic quenching of the PL intensity of the ES nanofibers was observed. The PL intensity decreased as the temperature increased from 50 to 60 °C, reaching its lowest point at 60 °C. Notably, Figure S5 shows no changes in the PL intensity of the pristine BNPTU compound as the temperature was increased from 30 to 60 °C because the chemical stability of BNTPU is favorable at room temperature or higher temperatures (e.g., 60 °C), indicating that the quenching of the PL intensity of the ES nanofibers (Figure 9d) was not caused by the pristine BNPTU compound.
The aforementioned thermoreversible luminescence characteristics are explained as follows. As shown in Figure 6, compared with those in the dry state, the ES fibers soaked in water (wet state) underwent morphological change at 30 °C (below the LCST). At 30 °C, the hydrophilic groups in the PNIPAM interacted easily with water molecules to form intermolecular hydrogen bonds. However, the swollen ES fibers were insoluble in water because of the chemically cross-linked NMA segment. When the temperature was raised to 60 °C (above the LCST), the intermolecular hydrogen bonds between the PNIPAM and water were broken, leading to the release of water molecules from the fibers. However, Hg2+ was still present within the fibers. Furthermore, as the temperature was 60 °C (above the LCST), the PNIPAM was collapsed and densely packed, potentially suppressing absorption of incident light by the BNPTU moiety with Hg2+, resulting in a reduction of the PL intensity. Thus, the prepared ES fibers exhibited an on–off PL intensity profile with temperature variation (Figure 9d), indicating that the ES nanofibers have thermoresponsive properties.
The selectivity of P2-5% ES nanofibers toward Hg2+ over other common metal ions was also studied (Figure 10). Figure 10a shows that among all tested metal ions, namely Hg2+, Pb2+, Co2+, Cd2+, Mg2+, Ni2+, Zn2+, Fe2+, and Cu2+ (10−2 M; all metal ion test solutions were controlled at pH 4), a substantial blueshift in PL was observed only in the presence of Hg2+. In Figure 8b, I450/I530 indicates the ratio of a PL intensity of 530 nm (λPLmax), corresponding to other metal ions (Hg2+, Pb2+, Co2+, Cd2+, Mg2+, Ni2+, Zn2+, Fe2+, and Cu2+), to a PL intensity of 450 nm (λPLmax), corresponding to Hg2+. The presence of Hg2+ induced the most prominent I450/I530 enhancement (approximately 2.5-fold), resulting in blue emission. For all of the other metal ions, the nanofibers exhibited reduced I460/I510 values (approximately 0.1-fold), resulting in green emission (Figure 10b). In addition, the fluorescence spectra recorded in the presence of Hg2+ ions and the other metal ions revealed that none of the other metal ions interfered with the Hg2+ ion-induced fluorescence enhancement (inset Figure 10b), indicating that the sensing of Hg2+ by the P2-5% ES nanofibers was virtually unaffected by commonly coexisting ions.
Figure 11a shows the CIE coordinates of the P2-5% ES nanofibers in 0–10−2 M Hg2+ aqueous solutions. All of the inset figures show corresponding photographs captured under UV light. The CIE coordinates show a strong blueshift from (0.24, 0.61) (blank) to (0.16, 0.08) (pH 4, Hg2+ 10−2 M) as the concentration of Hg2+ was varied from 0 to 10−2 M because of the detection of BNPTU by Hg2+, resulting in a color change from green to blue in the P2-5% ES nanofibers. Furthermore, as shown in the confocal microscopy images in Figure 11b, the color emission of the P2-5% ES nanofibers varied from green to blue as the concentration of Hg2+ was increased. A microfluidics system was constructed, in which a P2-5% ES nanofiber filter membrane with an area of 3 cm2 placed in the middle of a tube was used to rapidly absorb and sense Hg2+ in a solution flowing through the tube (Figure 11c). Figure 11d depicts the measured time-dependent variation in the solution conductivity. The prepared Hg2+ solution contained 1 ppm Hg2+ (6.3 × 10⁻³ M Hg2+ in 0.5 L of water) and the conductivity of the Hg2+ solution in its initial state (0 min) was 131.2 μS cm−1. The solution conductivity gradually decreased to 101.4 uS cm−1. Table S1 contains raw data on the conductivity changes over 20 min, and Figure 11d depicts Ct/C0 (%) versus time (C0: original conductivity at 0 min; Ct: conductivity at time t). The solution conductivity decreased as the flow time increased, indicating that an increasing number of Hg2+ ions was absorbed by the P2-5% ES nanofiber membrane, yielding less Hg2+ in the solution. Thus, the 100% conductivity of the solution in its initial state (0 min) had decreased to 77.2% after 20 min. This rapid change in conductivity was caused by the high surface-to-volume ratio of the P2-5% ES nanofibers. The sensory filter membrane based on the P2-5% ES nanofibers specifically absorbed Hg2+ in an aqueous solution that contained a variety of metal ions and had a dual fluorescent chemosensory function for Hg2+.
Figure 12a shows the saturation magnetization and coercivity of the P2-5% ES nanofibers-nanocomposite, which were determined using a vibrating sample magnetometer in the field range of ±20,000 Oe at 300 K. The results indicate that the P2-5% ES nanofibers exhibited magnetic properties, and the saturation magnetization was 4.8 emu g−1. Moreover, the magnetic P2-5% ES nanofibers specifically adsorbed Hg2+ in an aqueous solution containing a variety of metal ions and had a fluorescent chemosensory response to Hg2+ (Figure 11). Thus, filter membranes based on the P2-5% ES nanofibers with porous architectures can specifically chelate with Hg2+ in an aqueous solution containing many types of metal ion and serve as fluorescent chemosensors for Hg2+. These results could assist researchers in cleaning water while simultaneously chelating and sensing Hg2+. In addition, rather than removal through alternative methods, a magnet can directly attract the P2-5% ES nanofibers because of the magnetism of the Fe3O4 NPs. The results in Figure 12b and Figure 2c indicate that P2-5% ES nanofibers have the potential for application in multifunctional sensory filter membrane devices for HTM ion chelation, temperature sensing, and magnetism. In conclusion, these copolymer inorganic NP-based sensory fibers have considerable potential for application in water purification sensing filters for the filtration of industrial wastewater with HTM, and may assist researchers in purifying water while simultaneously chelating and sensing Hg2+; moreover, used magnetic fluorescent switchable chemosensors can be collected using magnets (noncontact force).

4. Conclusions

Novel magnetic fluorescent switchable chemosensors for the simultaneous detection of temperature, magnetism, and Hg2+ based on fluorescent ES nanofibers were prepared using blends of poly(NIPAAm-co-NMA-co-AA), BNPTU, and Fe3O4 NPs by employing a single-capillary spinneret. The NIPAAm, NMA, AA, BNPTU, Fe3O4 NPs moieties were designed to provide thermoresponsiveness, chemical cross-linking, dispersion of Fe3O4 NPs, sensing of Hg2+, and magnetism, respectively. Cross-linked ES nanofibers maintained their structure in water and exhibited sensitivity toward temperature variations and Hg2+ because of the sufficient NMA composition. The fluorescence emission of BNPTU within the ES nanofibers exhibited strong selectivity toward Hg2+ with green emission in aqueous solutions without Hg2+ (thiourea-derived), shifting to blue emission in aqueous solutions with Hg2+ (imidazoline-derived). The P2-5% ES nanofibers exhibited considerable blueshifts in photoluminescence spectra and enhanced emission intensity for detecting an extremely dilute concentration of Hg2+ (10−3 M). Furthermore, the LCST of the NIPAAm moiety in the P2-5% nanofibers showed a significant temperature-dependent variation in PL intensity due to fiber volume change (or hydrophilic to hydrophobic change), engendering distinct on–off switching of photoluminescence when the nanofibers were exposed to Hg2+. Furthermore, a magnet can directly attract the P2-5% ES nanofibers because of the magnetism of the Fe3O4 NPs, which serves as a substitute for removal through other methods. The present study demonstrated that the prepared magnetic fluorescent ES nanofibers can be used as naked eye sensors and have potential for application in multifunctional environmental sensing devices.

Supplementary Materials

The following are available online at www.mdpi.com/2073-4360/9/4/136/s1. Figure S1: GPC profiles of P1 and P2 copolymers. Figure S2: TGA curves of P1 and P2 copolymers with a heating rate of 10 °C min−1 in a nitrogen atmosphere. Figure S3: Variations in optical transmittance of P1 and P2 in pH 7 water solutions with temperatures between 30 and 60 °C. Figure S4: TGA curves of P2-5% blended with 5 wt % Fe3O4 NPs nanofibers with a heating rate of 10 °C min−1 in a nitrogen atmosphere. Figure S5: PL intensity of pristine BNPTU compound as the temperature is increased from 30 to 60 °C. Table S1: Time-dependent solution conductivity of the prepared Hg2+ solution.

Acknowledgments

We thank the Ministry of Science and Technology (MOST 104-2221-E-027-108).

Author Contributions

Fang-Cheng Liang, Yi-Ling Luo, and Chi-Ching Kuo conceived and designed the experiments; Fang-Cheng Liang, Yi-Ling Luo, Bo-Yu Chen, Chia-Jung Cho and Fan-Jie Lin, performed the experiments; Chi-Ching Kuo, Yang-Yen Yu, and Redouane Borsali contributed reagents/materials/analysis tools; Fang-Cheng Liang, Yi-Ling Luo, and Chi-Ching Kuo analyzed the data and wrote the paper.

Conflicts of Interest

The authors declare no conflict of interest.

References

  1. Rurack, K.; Resch-Genger, U. Rigidization, Preorientation and Electronic Decoupling—The ‘Magic Triangle’ for the Design of Highly Efficient Fluorescent Sensors and Switches. Chem. Soc. Rev. 2002, 31, 116–127. [Google Scholar] [CrossRef] [PubMed]
  2. Amendola, V.; Fabbrizzi, L.; Foti, F.; Licchelli, M.; Mangano, C.; Pallavicini, P.; Poggi, A.; Sacchi, D.; Taglietti, A. Light-emitting molecular devices based on transition metals. Coord. Chem. Rev. 2006, 250, 273–299. [Google Scholar] [CrossRef]
  3. Boening, D.W. Ecological Effects, Transport, and Fate of Mercury: A General Review. Chemosphere 2000, 40, 1335–1351. [Google Scholar] [CrossRef]
  4. Milaeva, E.R. The Role of Radical Reactions in Organomercurials Impact on Lipid Peroxidation. J. Inorg. Biochem. 2006, 100, 905–915. [Google Scholar] [CrossRef] [PubMed]
  5. Liu, B.; Tian, H. A Selective Fluorescent Ratiometric Chemodosimeter for Mercury Ion. Chem. Commun. 2005, 3156–3158. [Google Scholar] [CrossRef] [PubMed]
  6. Leng, B.; Zou, L.; Jiang, J.; Tian, H. Colorimetric Detection of Mercuric Ion (Hg2+) in Aqueous Media Using Chemodosimeter-Functionalized Gold Nanoparticles. Sens. Actuators B 2009, 140, 162–169. [Google Scholar] [CrossRef]
  7. Zou, Q.; Tian, H. Chemodosimeters for Mercury(II) and Methylmercury(I) Based on 2, 1, 3-Benzothiadiazole. Sens. Actuators B 2010, 149, 20–27. [Google Scholar] [CrossRef]
  8. Lua, Z.J.; Wang, P.N.; Zhang, Y.; Chen, J.Y.; Zhen, S.; Leng, B.; Tian, H. Tracking of Mercury Ions in Living Cells with a Fluorescent Chemodosimeter under Single- or Two-Photon Excitation. Anal. Chim. Acta 2007, 597, 306–312. [Google Scholar] [CrossRef] [PubMed]
  9. Wang, W.; Wen, Y.; Zhang, Y.; Fei, X.; Li, Y.; Yang, Q.; Xu, X. Simple Naphthalimide-Based Fluorescent Sensor for Highly Sensitive and Selective Detection of Cd2+ and Cu2+ in Aqueous Solution and Living Cells. Dalton Trans. 2013, 42, 1827–1833. [Google Scholar] [CrossRef] [PubMed]
  10. Liu, C.; Xu, J.; Yang, F.; Zhou, W.; Li, Z.; Wei, M.; Yu, M. Nanomolar Cu2+ and F Naked-Eye Detection with a 1,8-Naphthalimide-Based Colorimetric Probe. Sens. Actuators B 2015, 212, 364–370. [Google Scholar] [CrossRef]
  11. Patrick, L.G.F.; Whiting, A. Synthesis of Some Polymerisable Fluorescent Dyes. Dyes Pigment. 2002, 55, 123–132. [Google Scholar] [CrossRef]
  12. Gil, E.S.; Hudson, S.M. Stimuli-Reponsive Polymers and Their Bioconjugates. Prog. Polym. Sci. 2004, 29, 1173–1222. [Google Scholar] [CrossRef]
  13. Chen, S.; Jiang, L.; Dan, Y. Preparation and Thermal Response Behavior of Poly(N-isopropylacrylamide-co-acrylic acid) Microgels via Soap-Free Emulsion Polymerization Based on AIBN Initiator. J. Appl. Polym. Sci. 2011, 121, 3322–3331. [Google Scholar] [CrossRef]
  14. Babel, A.; Li, D.; Xia, Y.; Jenekhe, S.A. Electrospun Nanofibers of Blends of Conjugated Polymers: Morphology, Optical Properties, and Field-Effect Transistors. Macromolecules 2005, 38, 4705–4711. [Google Scholar] [CrossRef]
  15. Kuo, C.C.; Lin, C.H.; Chen, W.C. Morphology and Photophysical Properties of Light-Emitting Electrospun Nanofibers Prepared from Poly(fluorene) Derivative/PMMA Blends. Macromolecules 2007, 40, 6959–6966. [Google Scholar] [CrossRef]
  16. Kuo, C.C.; Tung, Y.C.; Lin, C.H.; Chen, W.C. Novel Luminescent Electrospun Fibers Prepared from Conjugated Rod–Coil Block Copolymer of Poly[2,7-(9,9-dihexylfluorene)]-block-Poly(methyl methacrylate). Macromol. Rapid Commun. 2008, 29, 1711–1715. [Google Scholar] [CrossRef]
  17. Chen, Y.Y.; Kuo, C.C.; Chen, B.U.; Chiu, P.C.; Tsai, P.C. Multifunctional Polyacrylonitrile-ZnO/Ag Electrospun Nanofiber Membranes with Various ZnO Morphologies for Photocatalytic, UV-shielding, and Antibacterial Applications. J. Polym. Sci. Part B Polym. Phys. 2015, 53, 262–269. [Google Scholar] [CrossRef]
  18. Kuo, C.C.; Tung, Y.C.; Chen, W.C. Morphology and pH Sensing Characteristics of New Luminescent Electrospun Fibers Prepared from Poly(phenylquinoline)-block-Polystyrene/Polystyrene Blends. Macromol. Rapid Commun. 2010, 31, 65–70. [Google Scholar] [CrossRef] [PubMed]
  19. Chiu, Y.C.; Kuo, C.C.; Hsu, J.C.; Chen, W.C. Thermoresponsive Luminescent Electrospun Fibers Prepared From Poly(DMAEMA-co-SA-co-StFl) Multifunctional Random Copolymers. ACS Appl. Mater. Interfaces 2010, 11, 3340–3347. [Google Scholar] [CrossRef] [PubMed]
  20. Chiu, Y.C.; Chen, Y.; Kuo, C.C.; Tung, S.H.; Kakuchi, T.; Chen, W.C. Synthesis, Morphology, and Sensory Applications of Multifunctional Rod–Coil–Coil Triblock Copolymers and Their Electrospun Nanofibers. ACS Appl. Mater. Interfaces 2012, 4, 3387–3395. [Google Scholar] [CrossRef] [PubMed]
  21. Chen, L.N.; Chiu, Y.C.; Hung, J.J.; Kuo, C.C.; Chen, W.C. Multifunctional Electrospun Nanofibers Prepared from Poly((N-isopropylacrylamide)-co-(N-hydroxymethylacrylamide)) and Their Blends with 1,2-Diaminoanthraquinone for NO Gas Detection. Macromol. Chem. Phys. 2014, 215, 286–294. [Google Scholar] [CrossRef]
  22. Wang, W.; Yang, Q.; Sun, L.; Wang, H.; Zhang, C.; Fei, X.; Sun, M.; Li, Y. Preparation of Fluorescent Nanofibrous Film as a Sensing Material and Adsorbent for Cu2+ in Aqueous Solution via Copolymerization and Electrospinning. J. Hazard. Mater. 2011, 194, 185–192. [Google Scholar] [CrossRef] [PubMed]
  23. Chen, L.N.; Kuo, C.C.; Chiu, Y.C.; Chen, W.C. Ultra Metal Ions and pH Sensing Characteristics of Thermoresponsive Luminescent Electrospun Nanofibers Prepared from Poly(HPBO-co-NIPAAm-co-SA). RSC Adv. 2014, 4, 45345–45353. [Google Scholar] [CrossRef]
  24. Chen, B.Y.; Kuo, C.C.; Huang, Y.S.; Lu, S.T.; Liang, F.C.; Jiang, D.H. Novel Highly Selective and Reversible Chemosensors Based on Dual-Ratiometric Fluorescent Electrospun Nanofibers with pH- and Fe3+-Modulated Multicolor Fluorescence Emission. ACS Appl. Mater. Interfaces 2015, 7, 2797–2808. [Google Scholar] [CrossRef] [PubMed]
  25. Cho, C.J.; Lu, S.T.; Kuo, C.C.; Liang, F.C.; Chen, B.Y.; Chu, C.C. Pyrene or Rhodamine Derivative–Modified Surfaces of Electrospun Nanofibrous Chemosensors for Colorimetric and Fluorescent Determination of Cu2+, Hg2+, and pH. React. Funct. Polym. 2016, 137–147. [Google Scholar] [CrossRef]
  26. Hung, C.C.; Kuo, C.C.; Weng, N.K.; Wu, W.C.; Chen, B.Y.; Cho, C.J.; Hsu, I.J.; Chiu, Y.C.; Chen, C.C. Novel Highly Sensitive and Reversible Electrospun Nanofibrous Chemosensor-Filters Composed of poly(HEMA-co-MNA) and Bpy-F-Bpy with Metal-Ionmodulated Multicolor Fluorescence Emission. Polym. J. 2016, 48, 439–449. [Google Scholar]
  27. Kuo, C.Y.; Liu, T.Y.; Hardiansyah, A.; Lee, C.F.; Wang, M.S.; Chiu, W.Y. Self-Assembly Behaviors of Thermal- and pH Sensitive Magnetic Nanocarriers for Stimulitriggered Release. Nanoscale Res. Lett. 2014, 9, 520. [Google Scholar] [CrossRef] [PubMed]
  28. Yang, X.; Jiang, W.; Liu, L.; Chen, B.; Wu, S.; Sun, D.; Li, F. One-Step Hydrothermal Synthesis of Highly Water-Soluble Secondary Structural Fe3O4 Nanoparticles. J. Magn. Magn. Mater. 2012, 324, 2249–2257. [Google Scholar] [CrossRef]
  29. Si, S.; Kotal, A.; Mandal, T.K.; Giri, S.; Nakamura, H.; Kohara, T. Size-Controlled Synthesis of Magnetite Nanoparticles in the Presence of Polyelectrolytes. Chem. Mater. 2004, 16, 3489–3496. [Google Scholar] [CrossRef]
  30. Zhao, C.; Jiang, Z.; Zhao, J.; Cao, K.; Zhang, Q.; Pan, F. High Pervaporation Dehydration Performance of the Composite Membrane with an Ultrathin Alginate/Poly(acrylic acid)–Fe3O4 Active Layer. Ind. Eng. Chem. Res. 2014, 53, 1606–1616. [Google Scholar] [CrossRef]
  31. Jiang, X.; Zhai, S.; Jiang, X.; Lu, G.; Huang, X. Synthesis of PAA-g-PNIPAM Well-Defined Graft Oolymer by Sequential RAFT and SET-LRP and its Application in Preparing Size-Controlled Super-Paramagnetic Fe3O4 Nanoparticles as a Stabilizer. Polymer 2014, 55, 3703–3712. [Google Scholar] [CrossRef]
  32. Liu, F.; Ni, Q.Q.; Murakami, Y. Preparation of Magnetic Polyvinyl Alcohol Composite Nanofibers with Homogenously Dispersed Nanoparticles and High Water Resistance. Text. Res. J. 2013, 83, 510–518. [Google Scholar] [CrossRef]
  33. Xu, L.; Liu, N.; Cao, Y.; Lu, F.; Chen, Y.; Zhang, X.; Feng, L.; Wei, L. Mercury Ion Responsive Wettability and Oil/Water Separation. ACS Appl. Mater. Interfaces 2014, 6, 13324–13329. [Google Scholar] [CrossRef] [PubMed]
  34. Zhang, W.; Zhang, W.; Zhou, N.; Cheng, Z.; Zhu, J.; Zhu, X. Synthesis and Self-Assembly Behaviors of Three-Armed Amphiphilic Block Copolymers via RAFT Polymerization. Polymer 2008, 49, 4569–4575. [Google Scholar] [CrossRef]
  35. Manimala, J.C.; Anslyn, E.V. Solid-Phase Synthesis of Guanidinium Derivatives from Thiourea and Isothiourea Functionalities. Eur. J. Org. Chem. 2002, 3909–3922. [Google Scholar] [CrossRef]
  36. Kim, K.S.; Qian, L. Improved Method for the Preparation of Guanidines. Tetrahedron Lett. 1993, 34, 7677–7680. [Google Scholar] [CrossRef]
  37. Batey, R.A.; Powell, D.A. A General Synthetic Method for the Formation of Substituted 5-Aminotetrazoles from Thioureas: A Strategy for Diversity Amplification. Org. Lett. 2000, 2, 3237–3240. [Google Scholar] [CrossRef] [PubMed]
  38. Zhang, X.; Niu, Y.; Meng, X.; Li, Y.; Zhao, J. Structural Elution and characteristics of the phase transformations between a-Fe2O3, Fe3O4 and c-Fe2O3nanoparticles under reducing and oxidizing atmospheres. CrystEngComm 2013, 15, 8166–8172. [Google Scholar] [CrossRef]
Figure 1. Synthesis of BNPTU fluorescent monomer.
Polymers 09 00136 g001
Figure 2. Design of multifunctional sensory electro spun (ES) nanofibers synthesized from poly(NIPAAm-co-NMA-co-AA), BNPTU, and Fe3O4 blends with magnetic fluorescence emission. (a) Polymerization and chemical structure of poly(NIPAAm-co-NMA-co-AA), BNPTU, and Fe3O4 particles. (b) Fabrication of ES nanofibers from the blends. (c) Change in the chemical structure of BNPTU in solutions containing Hg2+. The fluorescence emission from the ES nanofibers exhibited color changes. A magnet can directly attract the ES nanofibers because of the magnetism of Fe3O4 NPs.
Polymers 09 00136 g002
Figure 3. 1H-NMR spectra recorded for (a) BN-Br in CDCl3, (b) BN-NH2 in DMSO-d6, and (c) BNPTU monomer in DMSO-d6.
Polymers 09 00136 g003aPolymers 09 00136 g003b
Figure 4. 1H-NMR spectrum of poly(NIPAAm-co-NMA-co-AA) in DMSO.
Polymers 09 00136 g004
Figure 5. UV–Vis spectra of (a) BNPTU in CH3CN solution (10−5 M) and (b) variation of UV–Vis spectra of BNPTU CH3CN solution (10−5 M, pH 7) with different metal ions at 10−4 M. The corresponding inset figures show the color changes under visible light and 254-nm UV light.
Polymers 09 00136 g005
Figure 6. Field-emission scanning electron microscopy (FE-SEM) images of copolymers. (a) P1 and (b) P2 cross-linked nanofibers at 120 °C in a dry state and treated with water at 30 and 60 °C.
Polymers 09 00136 g006
Figure 7. (a) FE-SEM and (b) Transmission electron microscopy (TEM) images of Fe3O4 NPs synthesized through coprecipitation. (c) Magnetic Fe3O4 NPs in the solution (left: Fe3O4 precipitated out of the solution and dropped to the bottom; right: Fe3O4 accumulated on the side of the bottle because of the magnet).
Polymers 09 00136 g007
Figure 8. (a) SEM image of Fe3O4 NPs blended with nanofibers at a 5% weight ratio. (b) FE-SEM image of P2-5% cross-linked nanofibers in the presence of Fe3+. (c,d) Energy dispersive X-ray spectroscopy EDS maps of C and Fe within the confined area in (b). (e) EDS spectrum recorded within the region defined in (b).
Polymers 09 00136 g008
Figure 9. (a) Photoluminescence (PL) spectra of P1 and P2 nanofibers blended with 10 wt % BNPTU. (b) Comparison of P2-5% nanofibers with different Hg2+ concentrations between 10−2, 10−3 and 10−4 M in aqueous solution. (c) Relative fluorescence intensity changes (I450/I530) of P2-5% ES nanofibers in aqueous solutions with various Hg2+ concentrations. (d) PL spectra of P2-5% ES nanofibers in 10−2 M Hg2+ solution with a temperature increase from 30 to 60 °C.
Polymers 09 00136 g009aPolymers 09 00136 g009b
Figure 10. (a) Variation in the normalized PL spectra of P2-5% ES nanofibers in aqueous solutions with various metal ions (10−2 M) and no cation (blank). (b) Fluorometric responses (I450/I530) of P2-5% ES nanofibers to various cations at 10−2 M aqueous solutions. From left to right: Hg2+, Pb2+, Co2+, Cd2+, Mg2+, Ni2+, Zn2+, Fe2+, and Cu2+. All the inset figures show corresponding photographs recorded under UV light. Inset of (b): fluorimetric response of the P2-5% ES nanofibers to solutions containing various metal ions at 10−2 M (as in (b)) when Hg2+ at 10−2 M is present.
Polymers 09 00136 g010
Figure 11. (a) CIE coordinates of P2-5% ES nanofibers in pH 7 aqueous solutions and after the detection of Hg2+ at 10−2 M aqueous solutions. (b) Confocal microscopy images of the ES nanofibers. All the inset figures show corresponding photographs recorded under UV light. (c) Schematic of a sensory filter microfluidics system for real-time metal ion sensing using an ES nanofiber membrane. (d) Relative conductivity versus time of the prepared Hg2+ solution in the microfluidics system.
Polymers 09 00136 g011aPolymers 09 00136 g011b
Figure 12. (a) Hysteresis loops of P2-5% ES nanofibers (5 wt % Fe3O4 NPs) measured at 25 °C. (b) Schematic of a filter sensory membrane prepared from P2-5% ES nanofibers composed of poly(NIPAAm-co-NMA-co-AA)), BNPTU, and Fe3O4 NPs blends to simultaneously chelate and sense Hg2+. A magnet can directly attract the P2-5% ES nanofibers because of the magnetism of Fe3O4 NPs.
Polymers 09 00136 g012
Table 1. Polymerization conditions and molecular weights of poly(NIPAAm-co-NMA-co-AA) random copolymers.
Polymer No.Composition a
NIPAAm:NMA:AA
Mn bPDITd (°C)LCST (°C)
(in pH = 7)
P110:5:026,8562.0137554.5
P210:5:318,0411.7637458.1
a Molar ratio (%) estimated from 1H-NMR spectra. b Determined using THF eluent.

