
5000 h Multi-Factor Accelerated Aging Test of FRP Made Transmission Tower: Characterization, Thermal Decomposition and Reaction Kinetics Study


Abstract
:1. Introduction
2. Materials and Methods
2.1. Materials
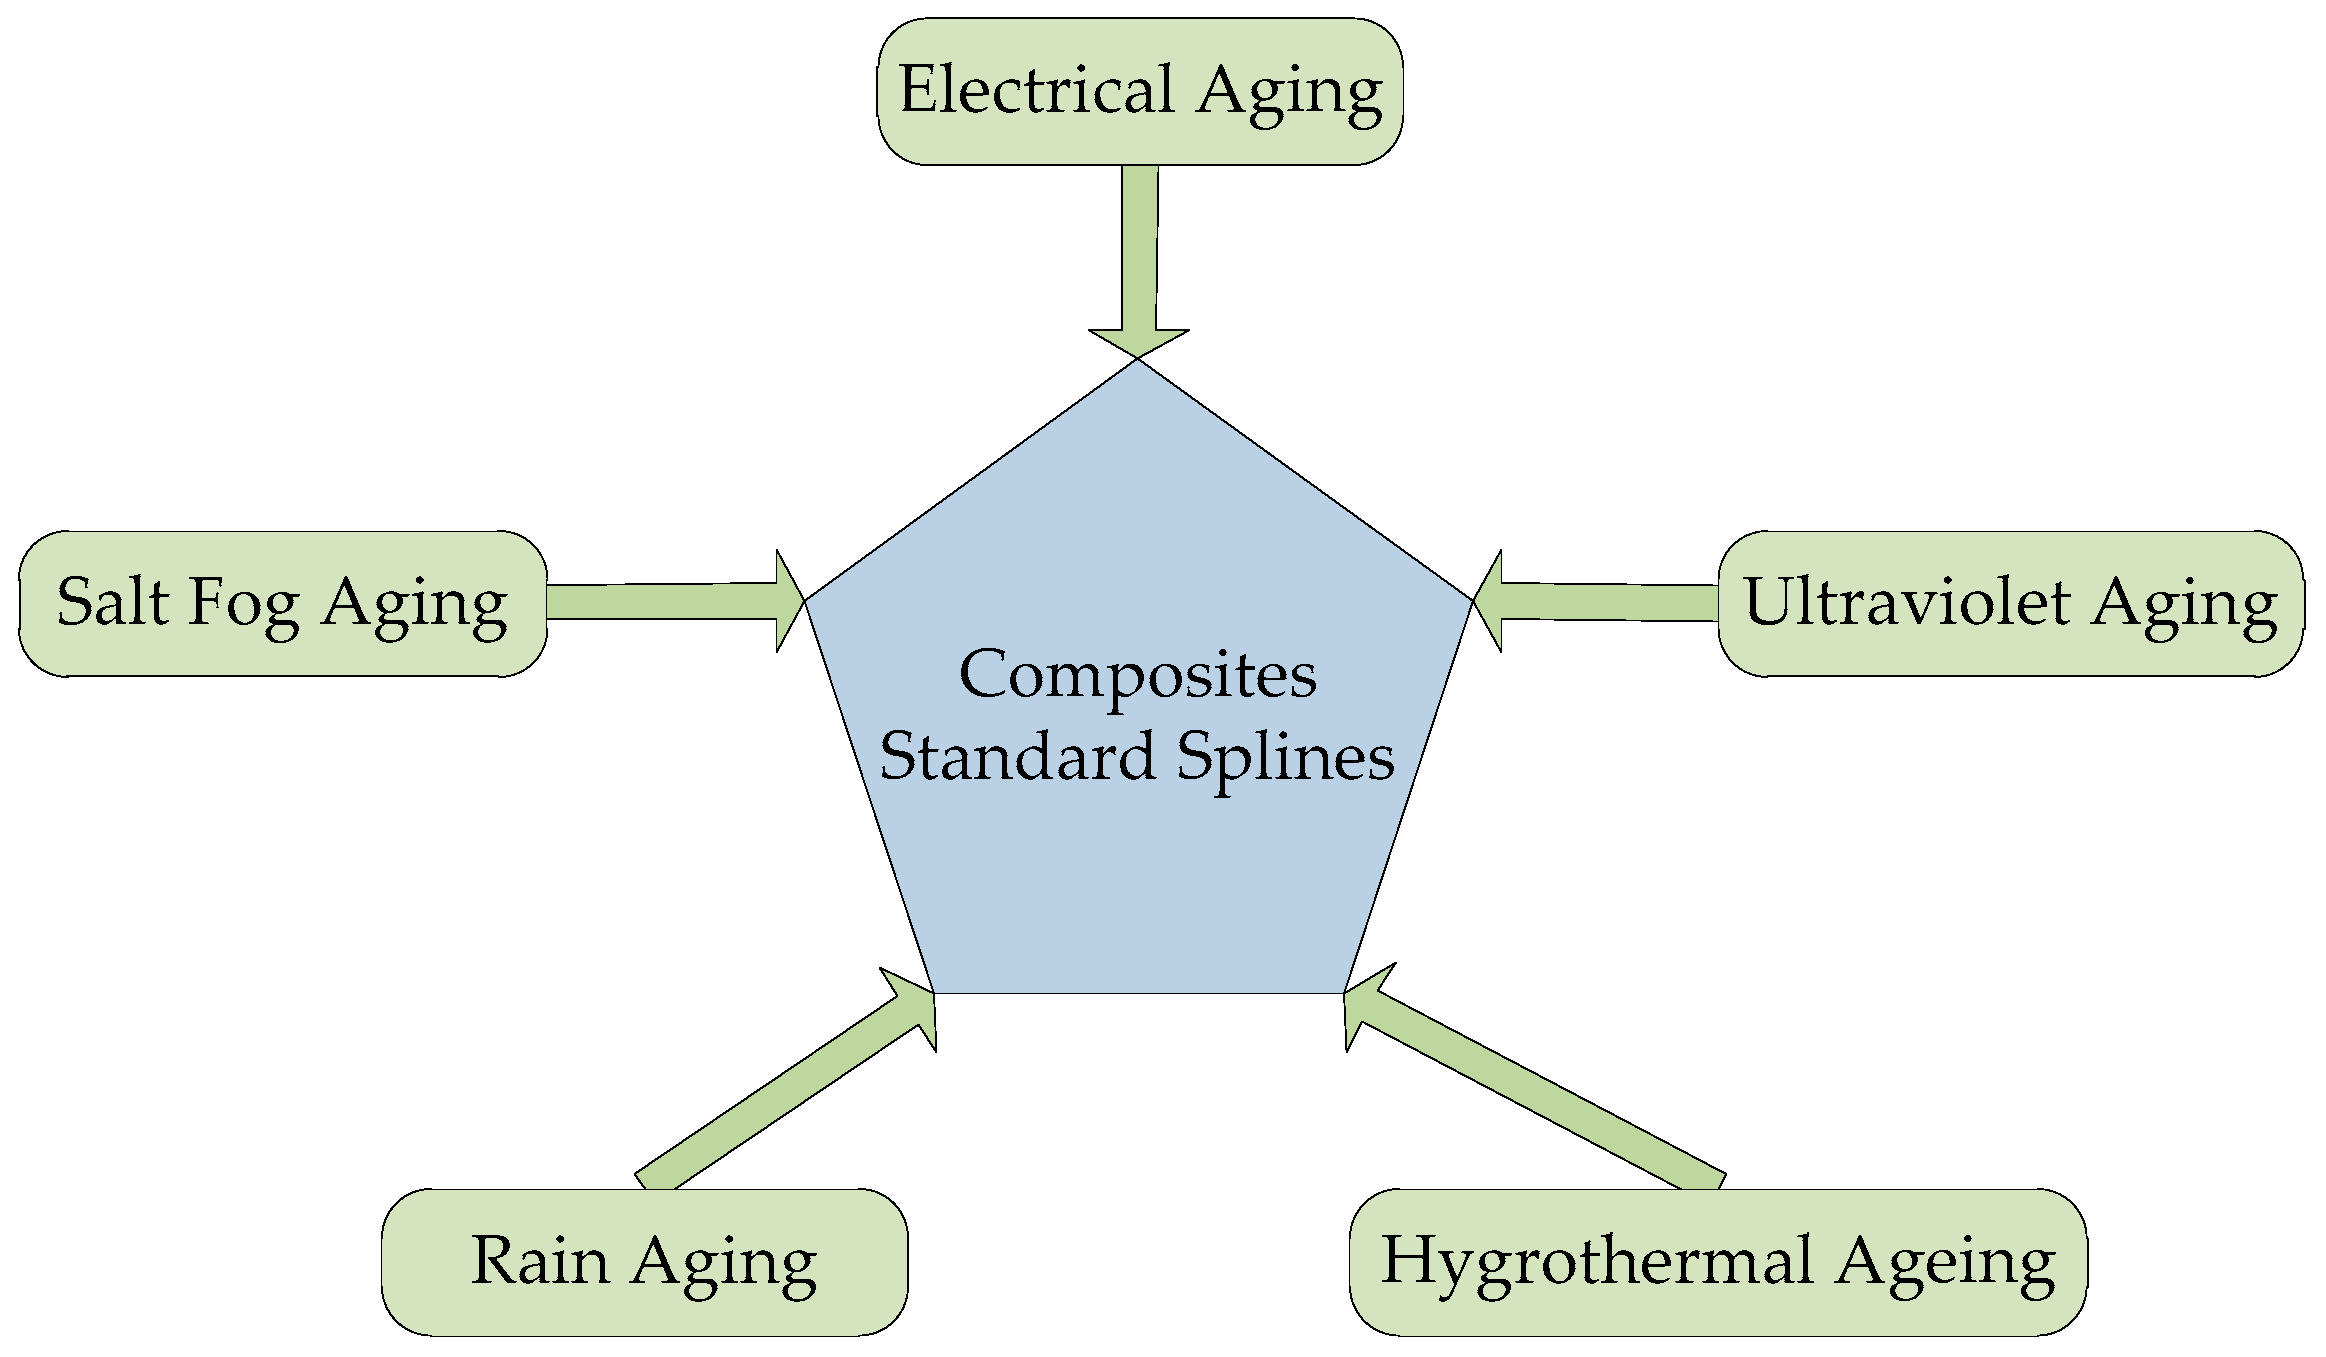
2.2. Expermental Setup and Procedure
- (1)
- Precise humidity control. Humidity range: 30% RH~98% RH. Humidity should reach 98% RH within 20 min. Relative humidity accuracy: +2~3%;
- (2)
- Precise temperature control. Temperature control range: −30~60 °C. Control accuracy tolerance: ±0.5 °C, closed-loop control used;
- (3)
- Rainfall and rainfall regulation system. Rainfall intensity range: 10 ± 5 mm/h~100 ± 20 mm/h.
- (4)
- Salt fog test equipment. Flow rate: 0.4 ± 0.1 kg/m3·h. NaCl volume: 2.5~10 kg/m3;
- (5)
- UV lamp irradiance: 50–100 W/m2;
- (6)
- Voltage and insulation requirement. The high AC voltage is transformed into the chamber through the high voltage bush. The test chamber can withstand 60 kV voltage.
2.3. Charaterization
2.3.1. Bending Test
2.3.2. Thermogravimetry Analysis
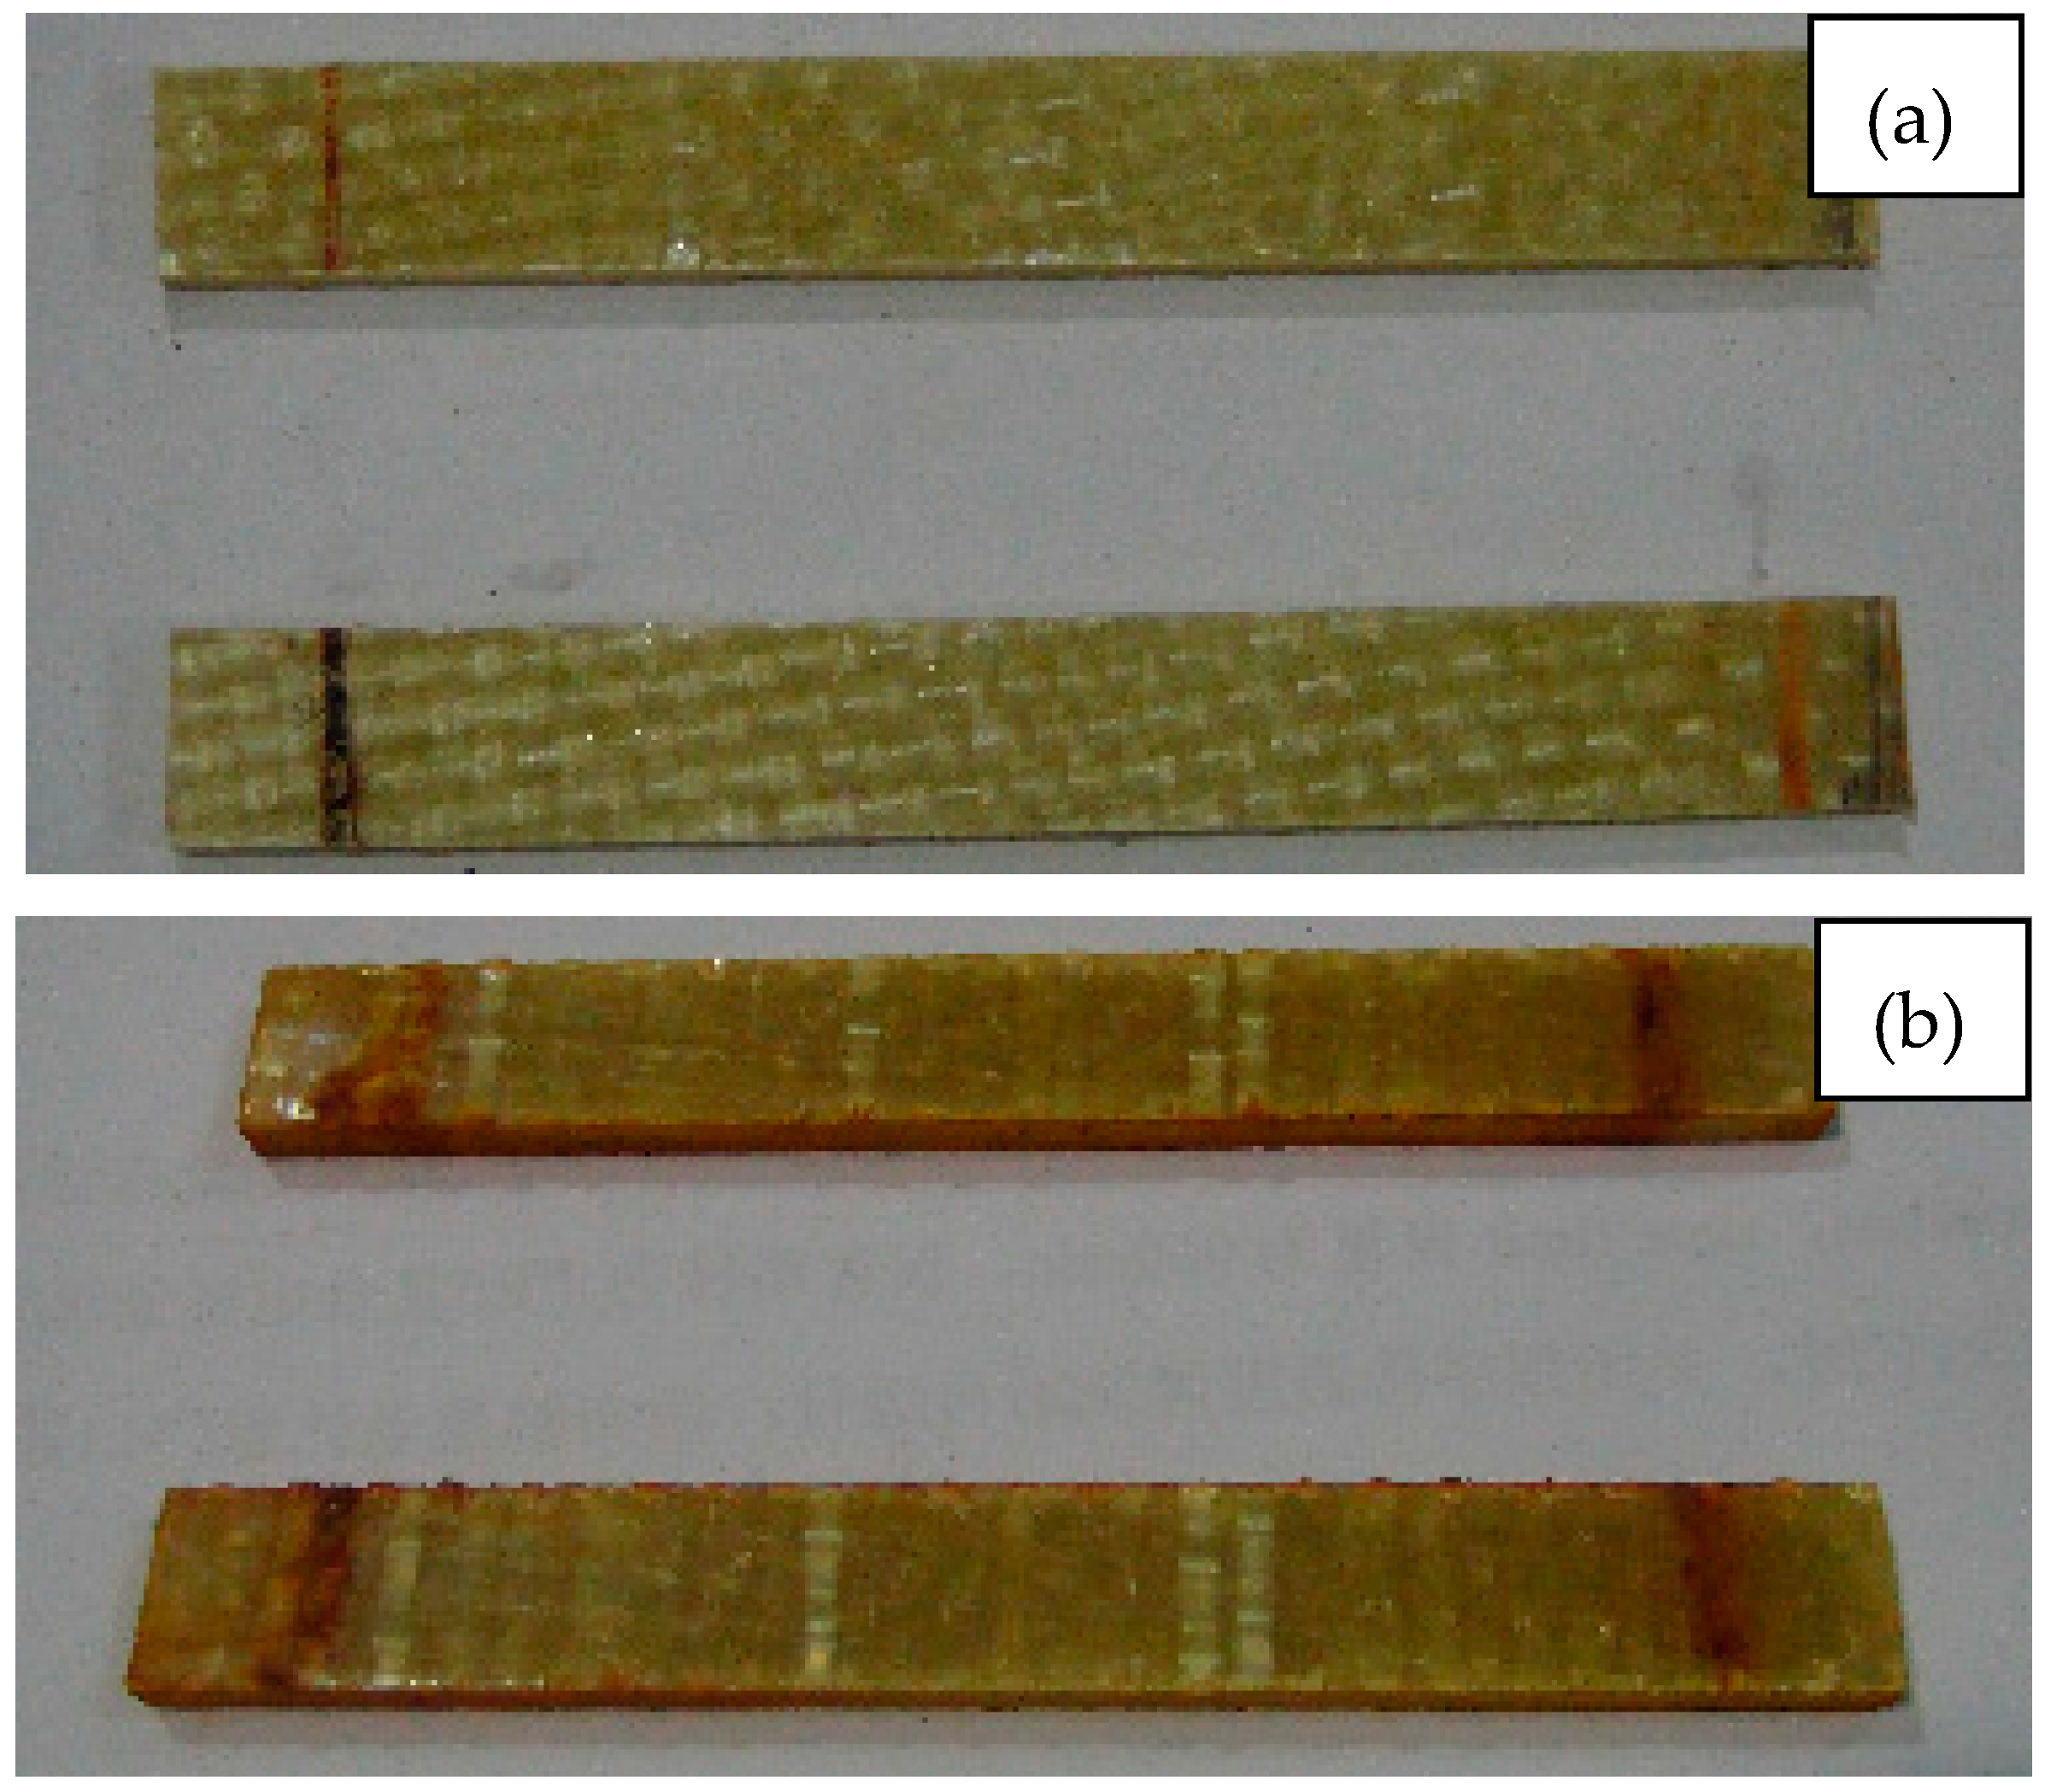
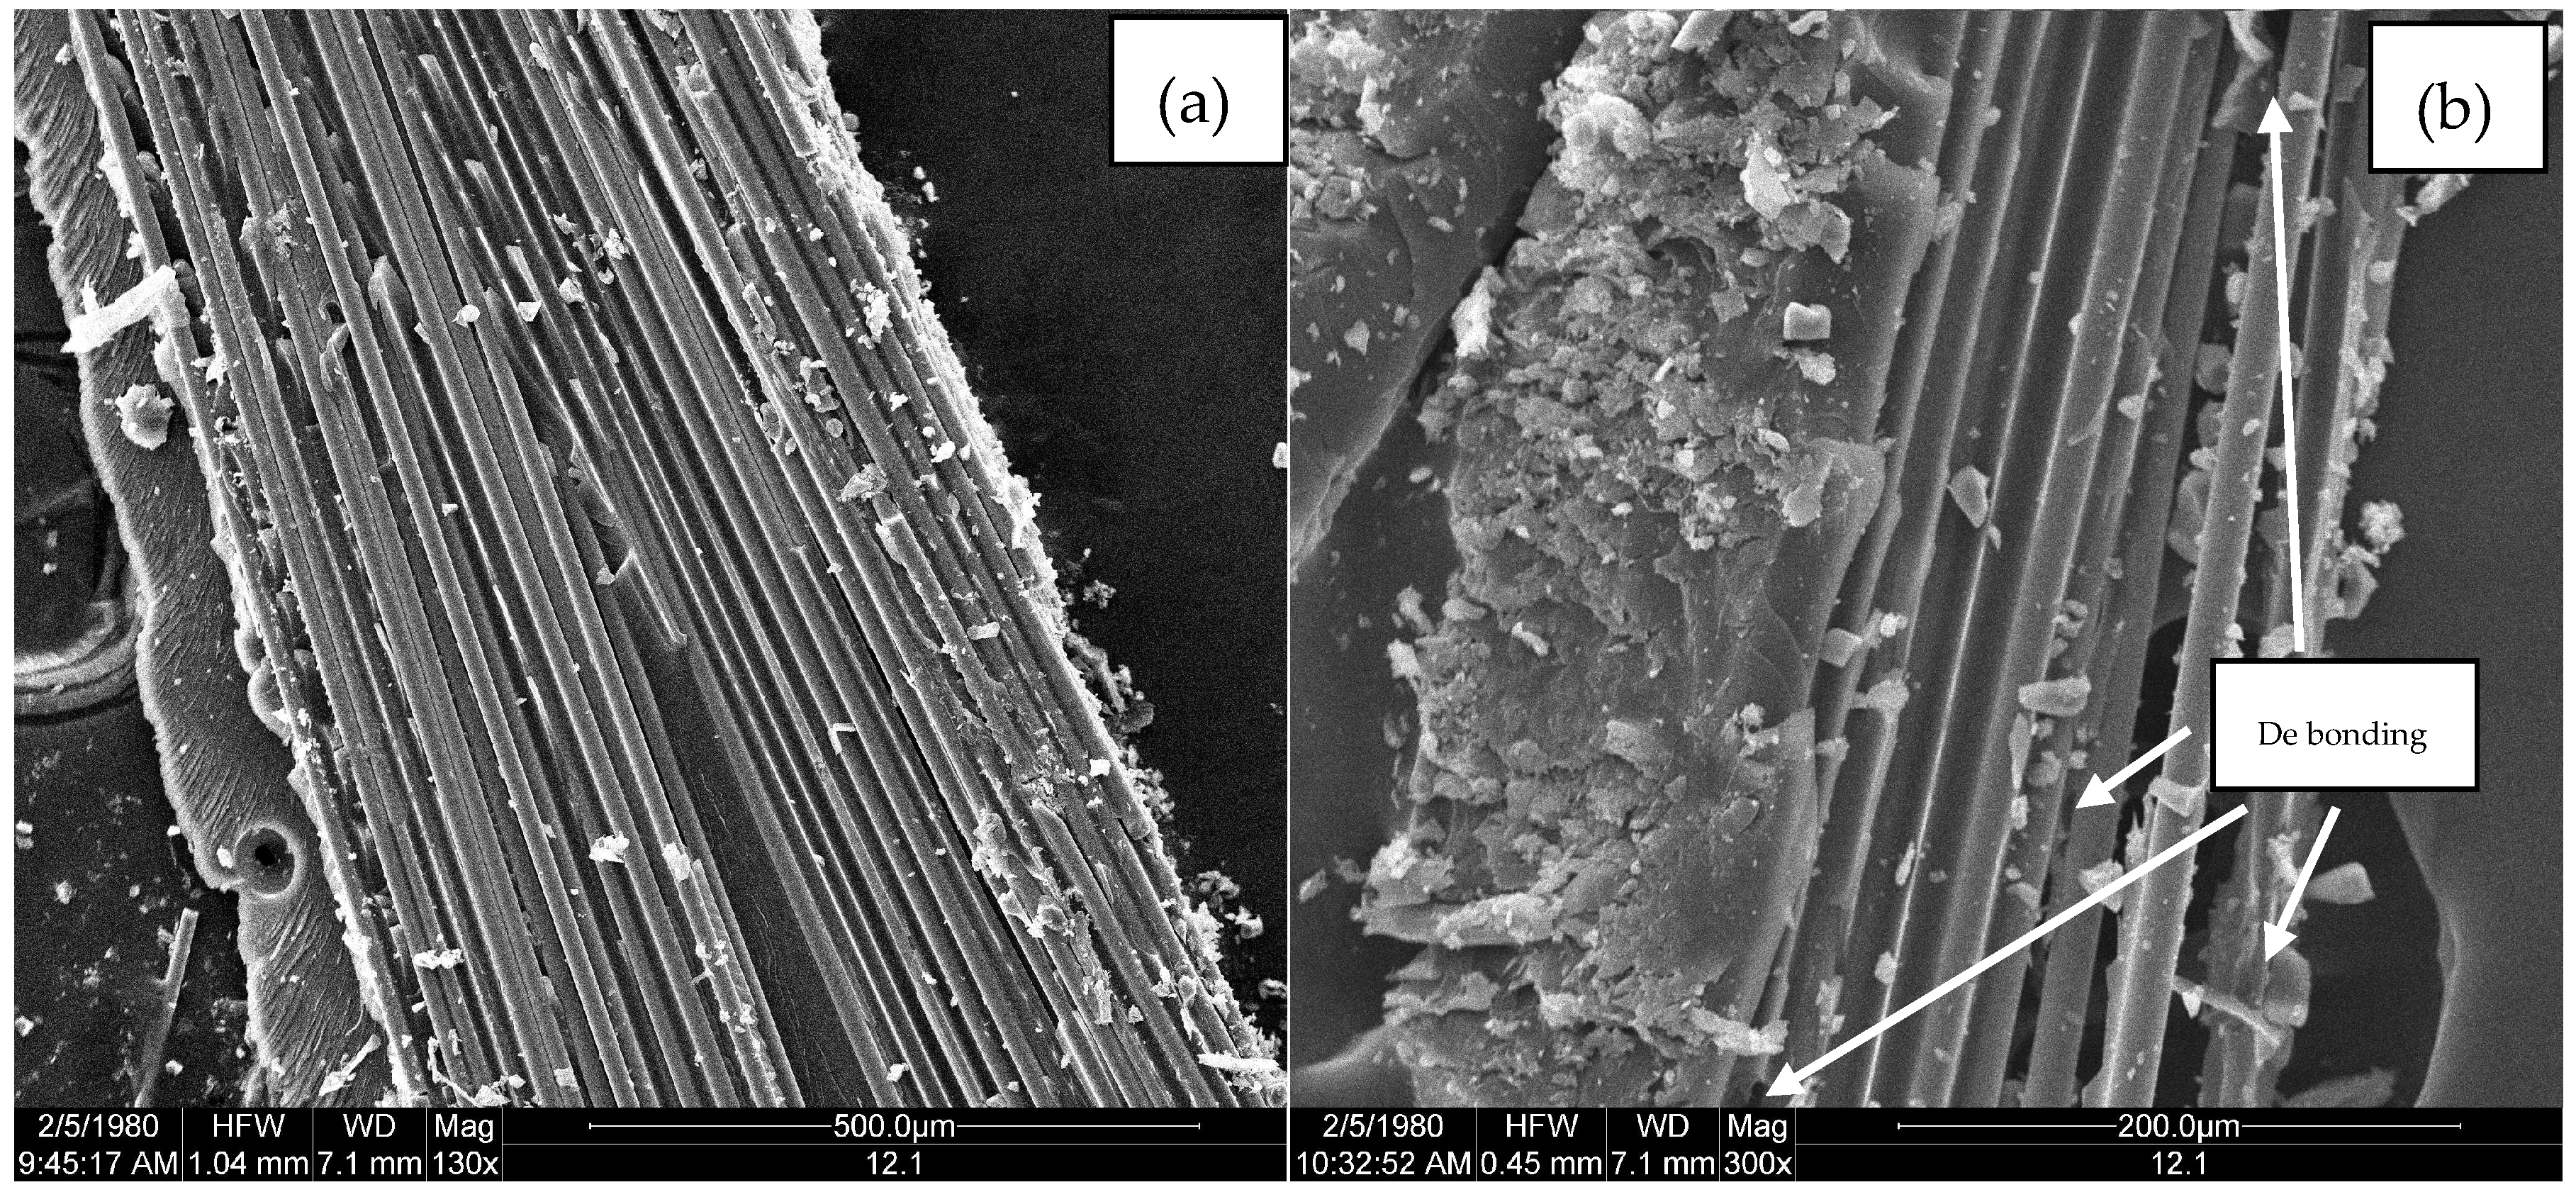
2.3.3. Surface Morphology Test
3. Results
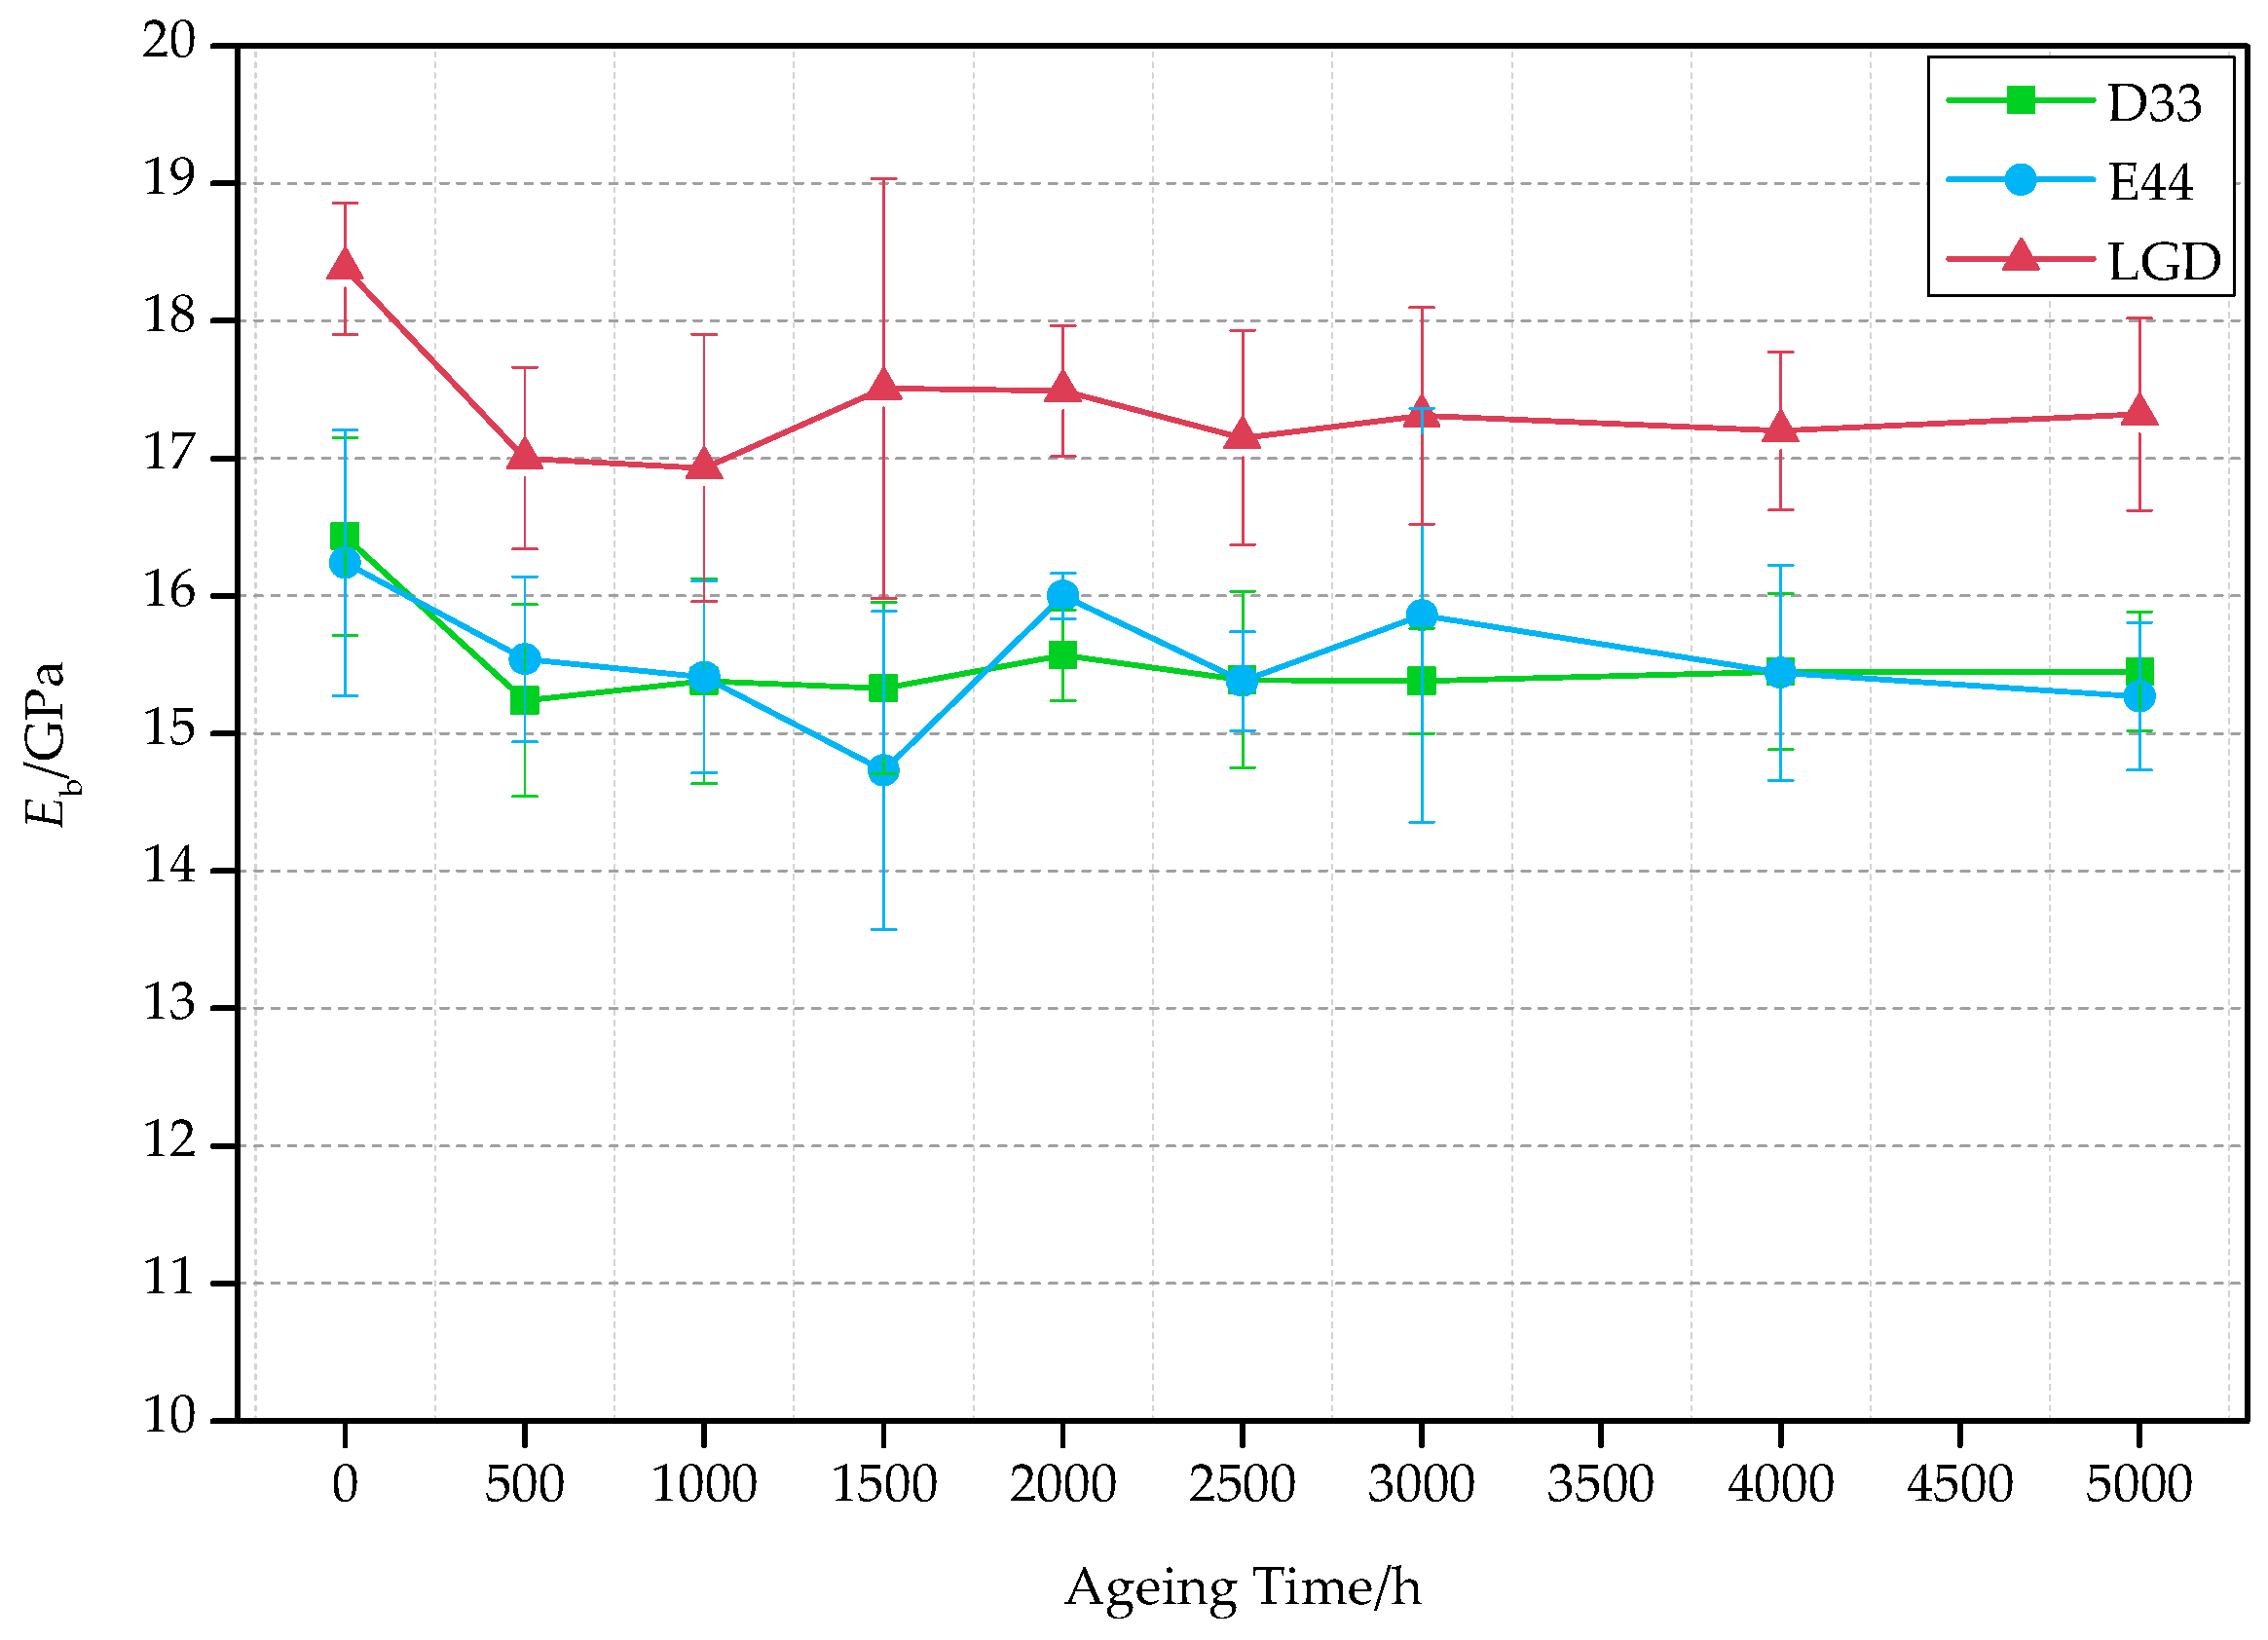
3.1. Bending Test
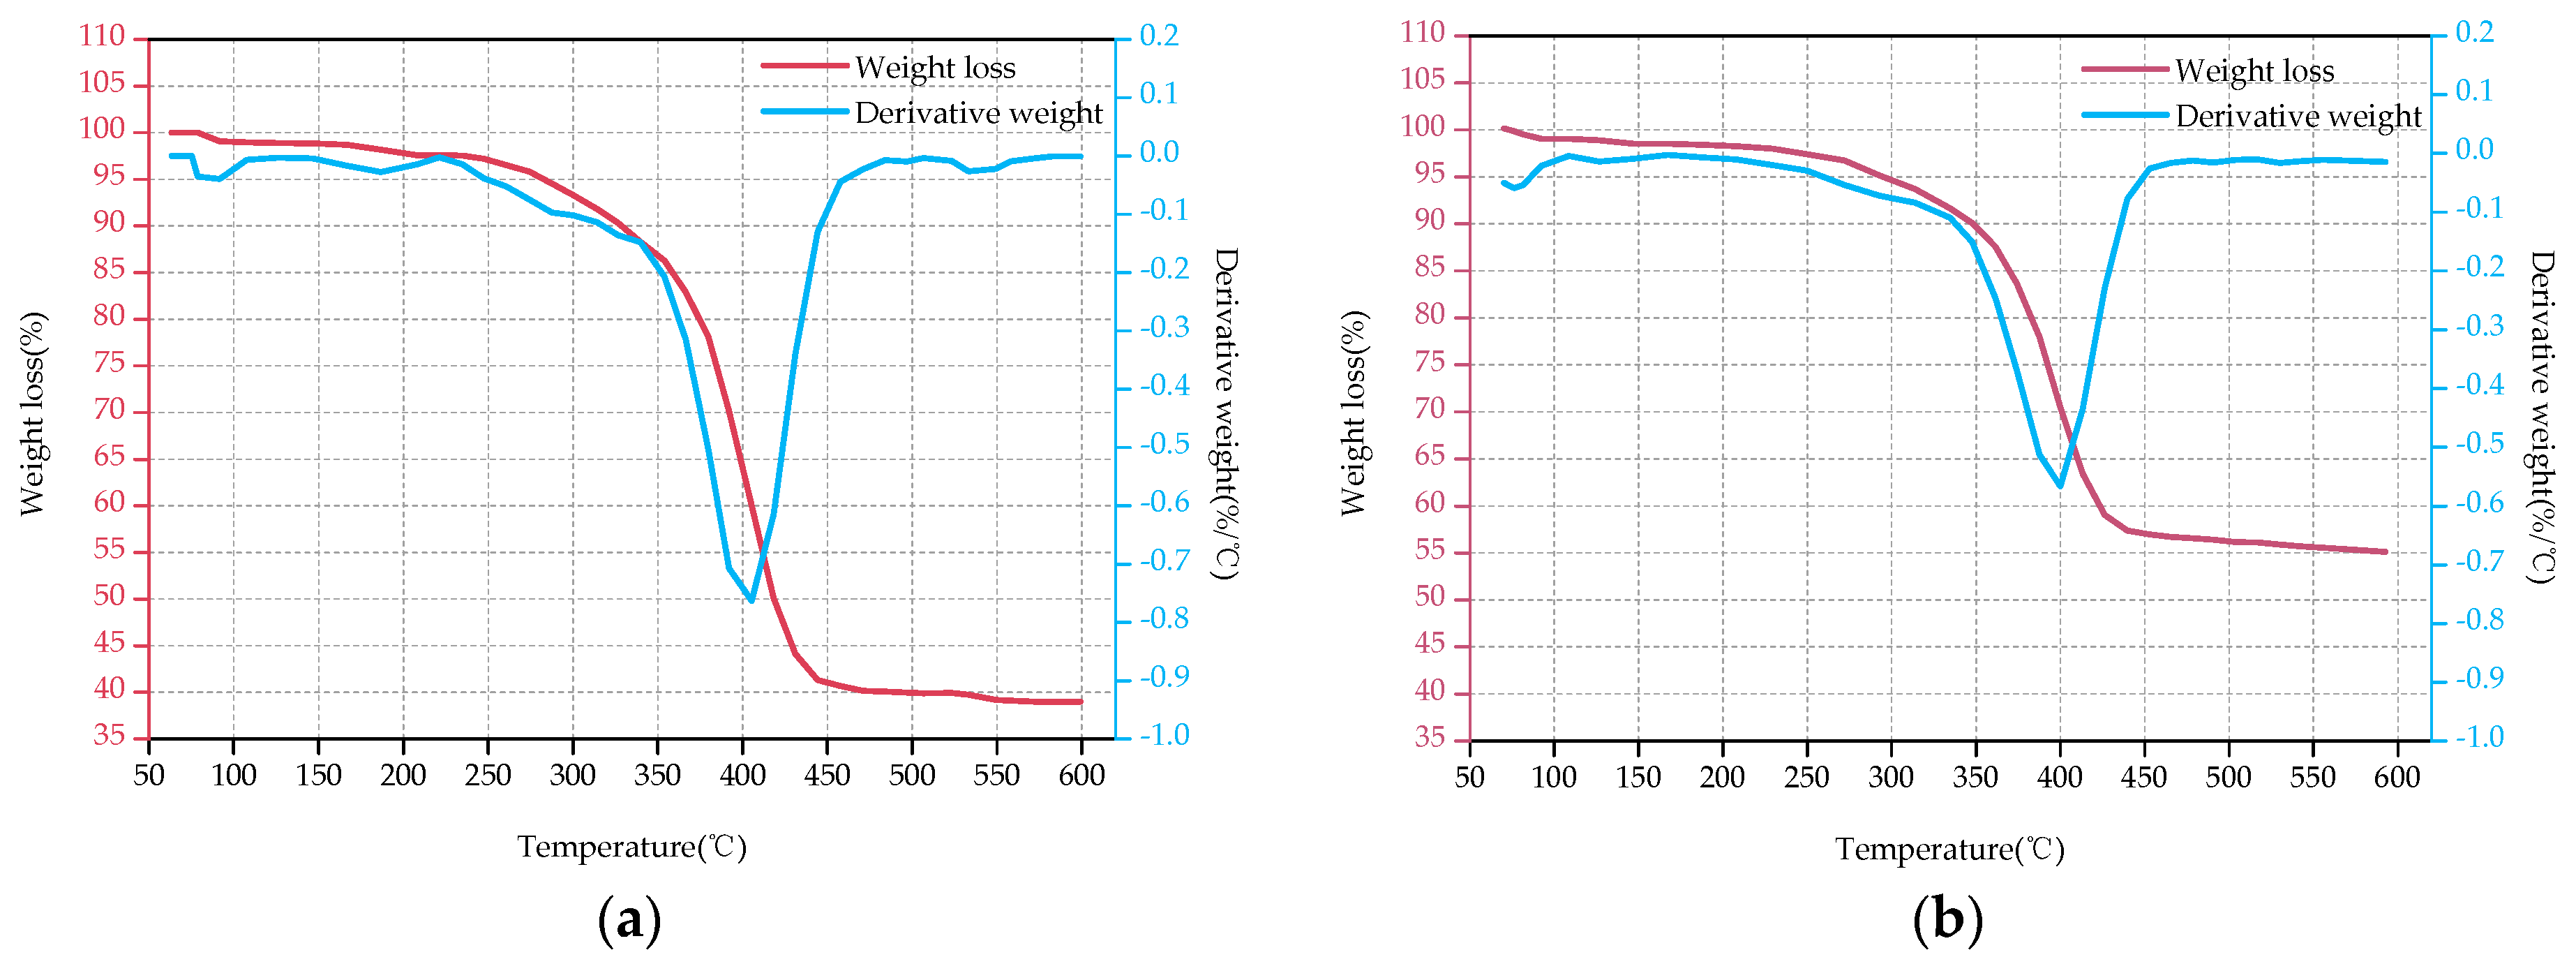
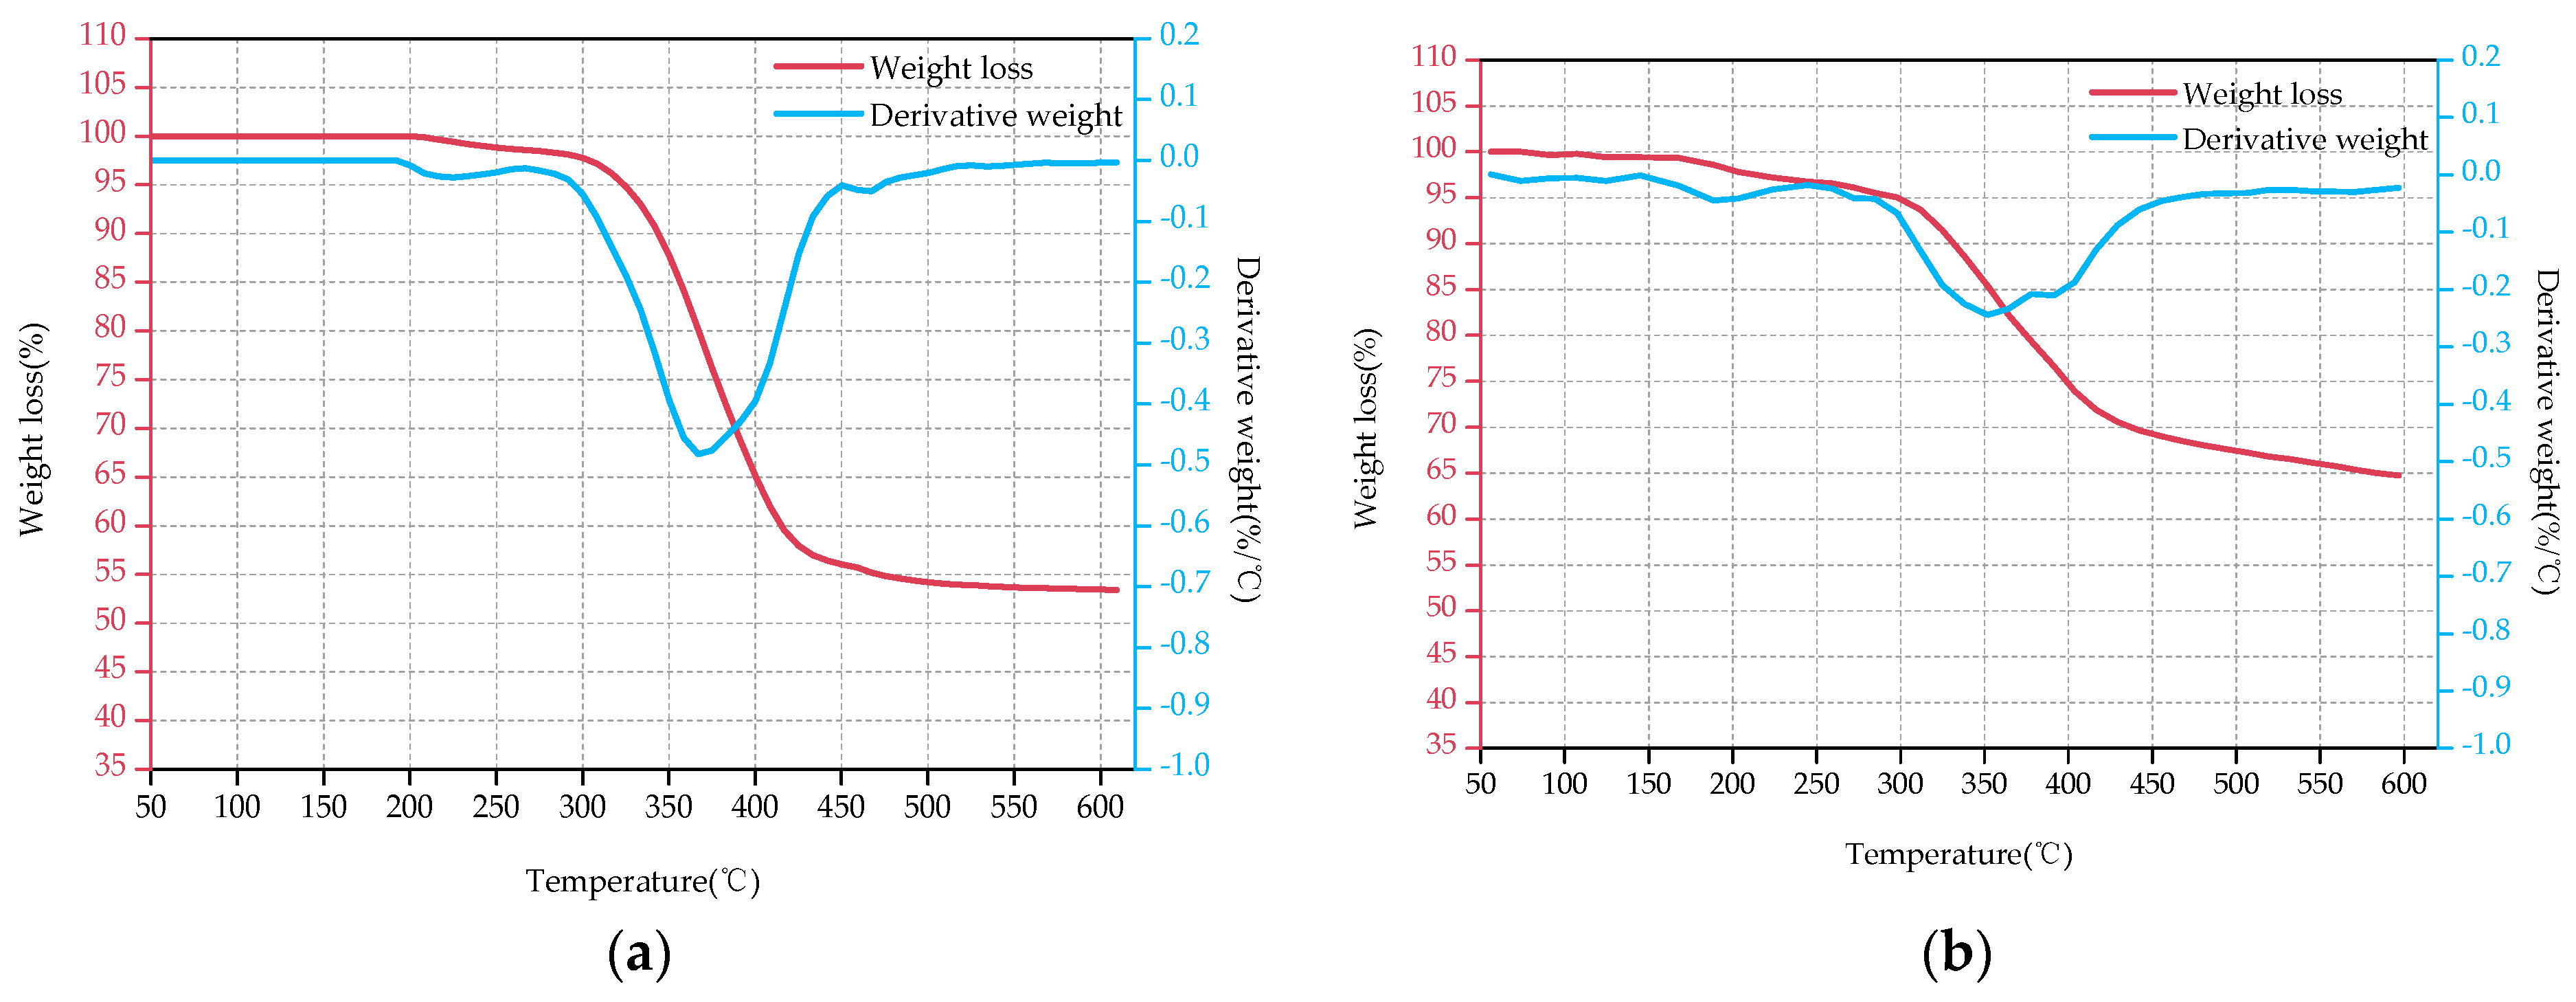
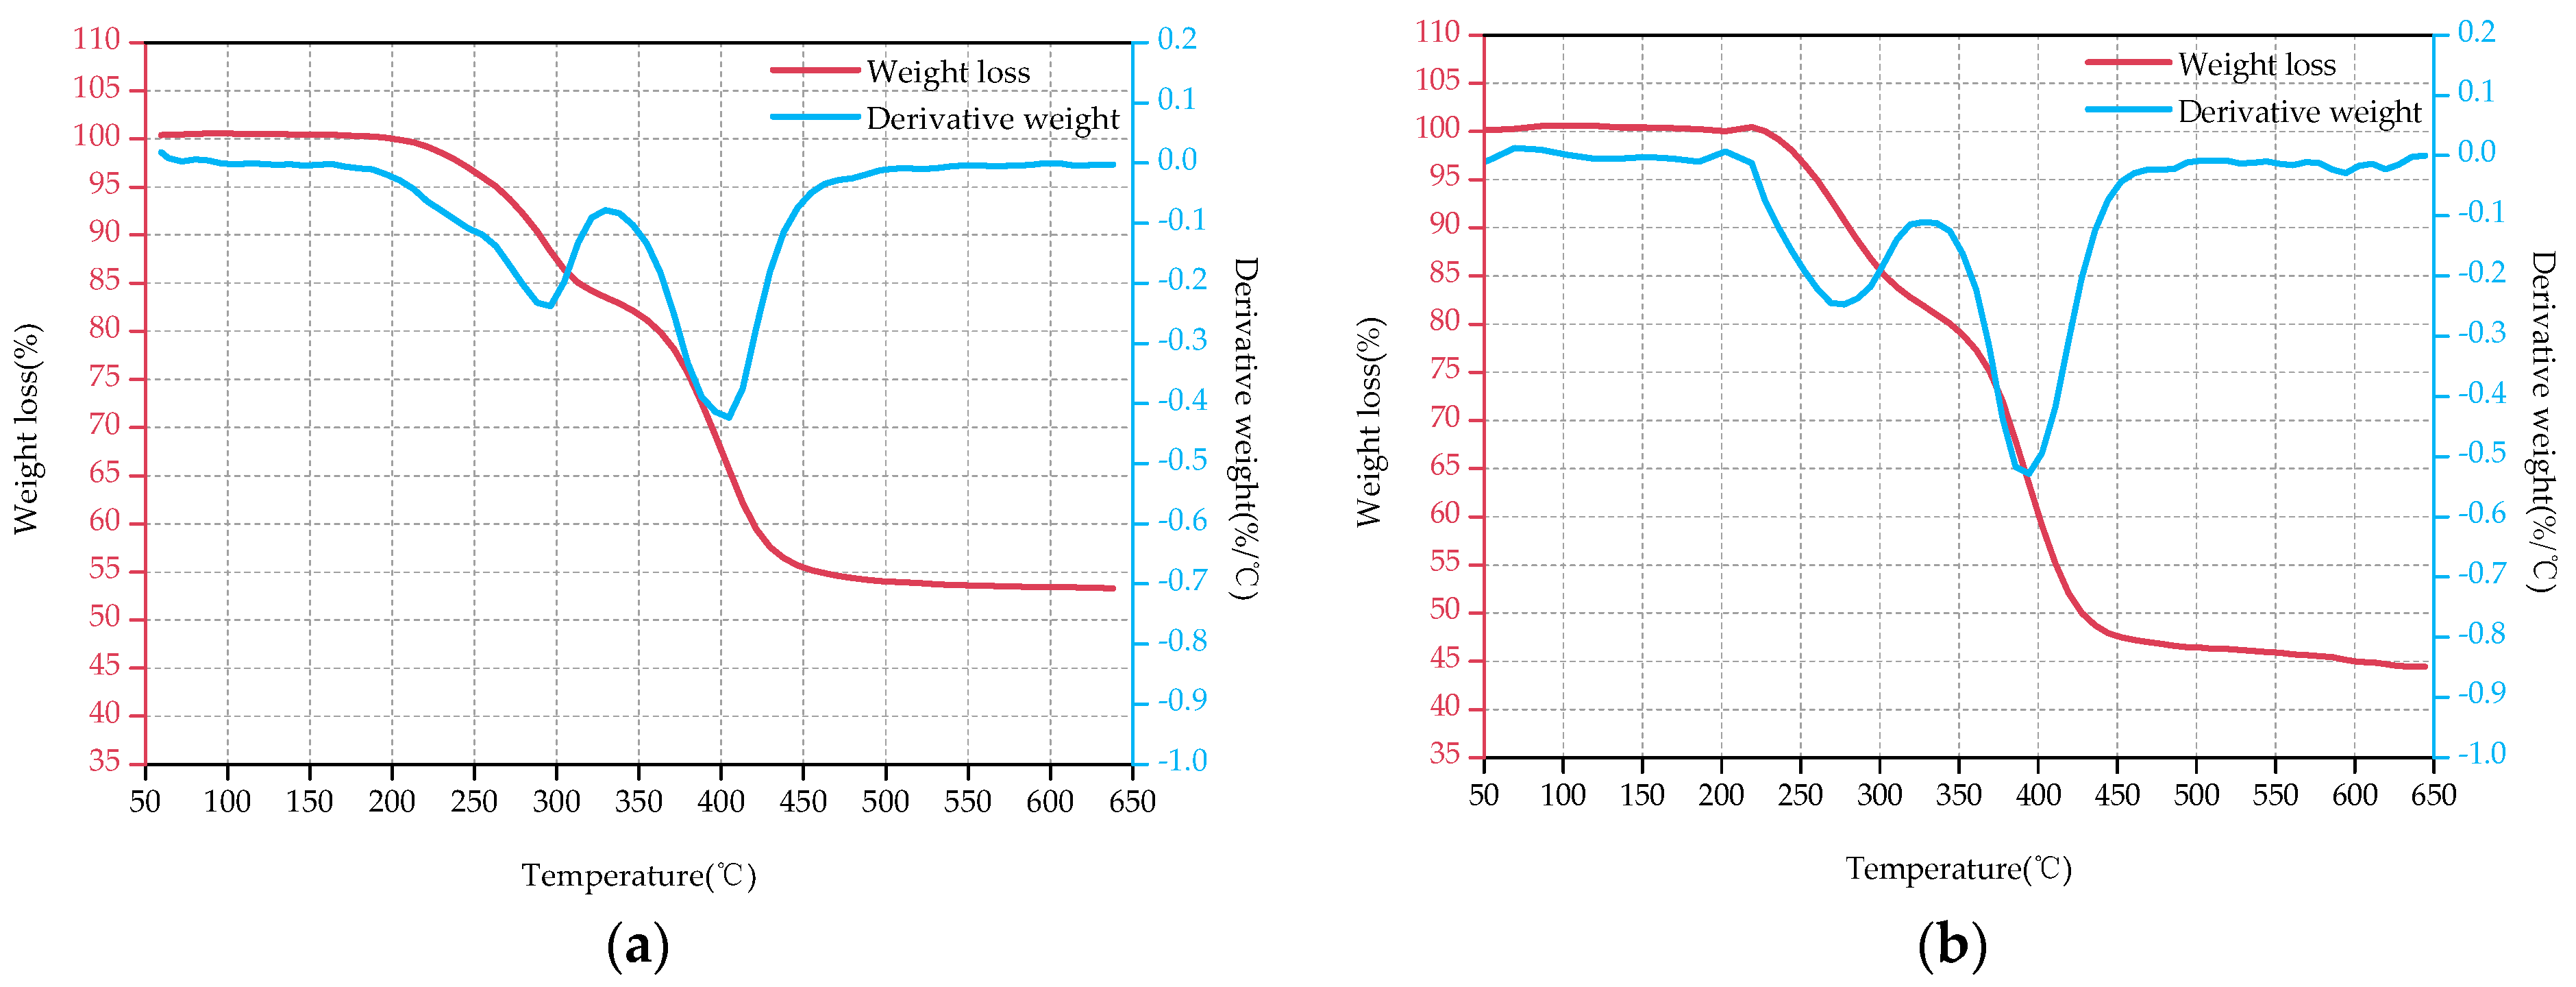
3.2. Thermogravimetric Analysis (TGA)
3.2.1. Basic Data from TGA
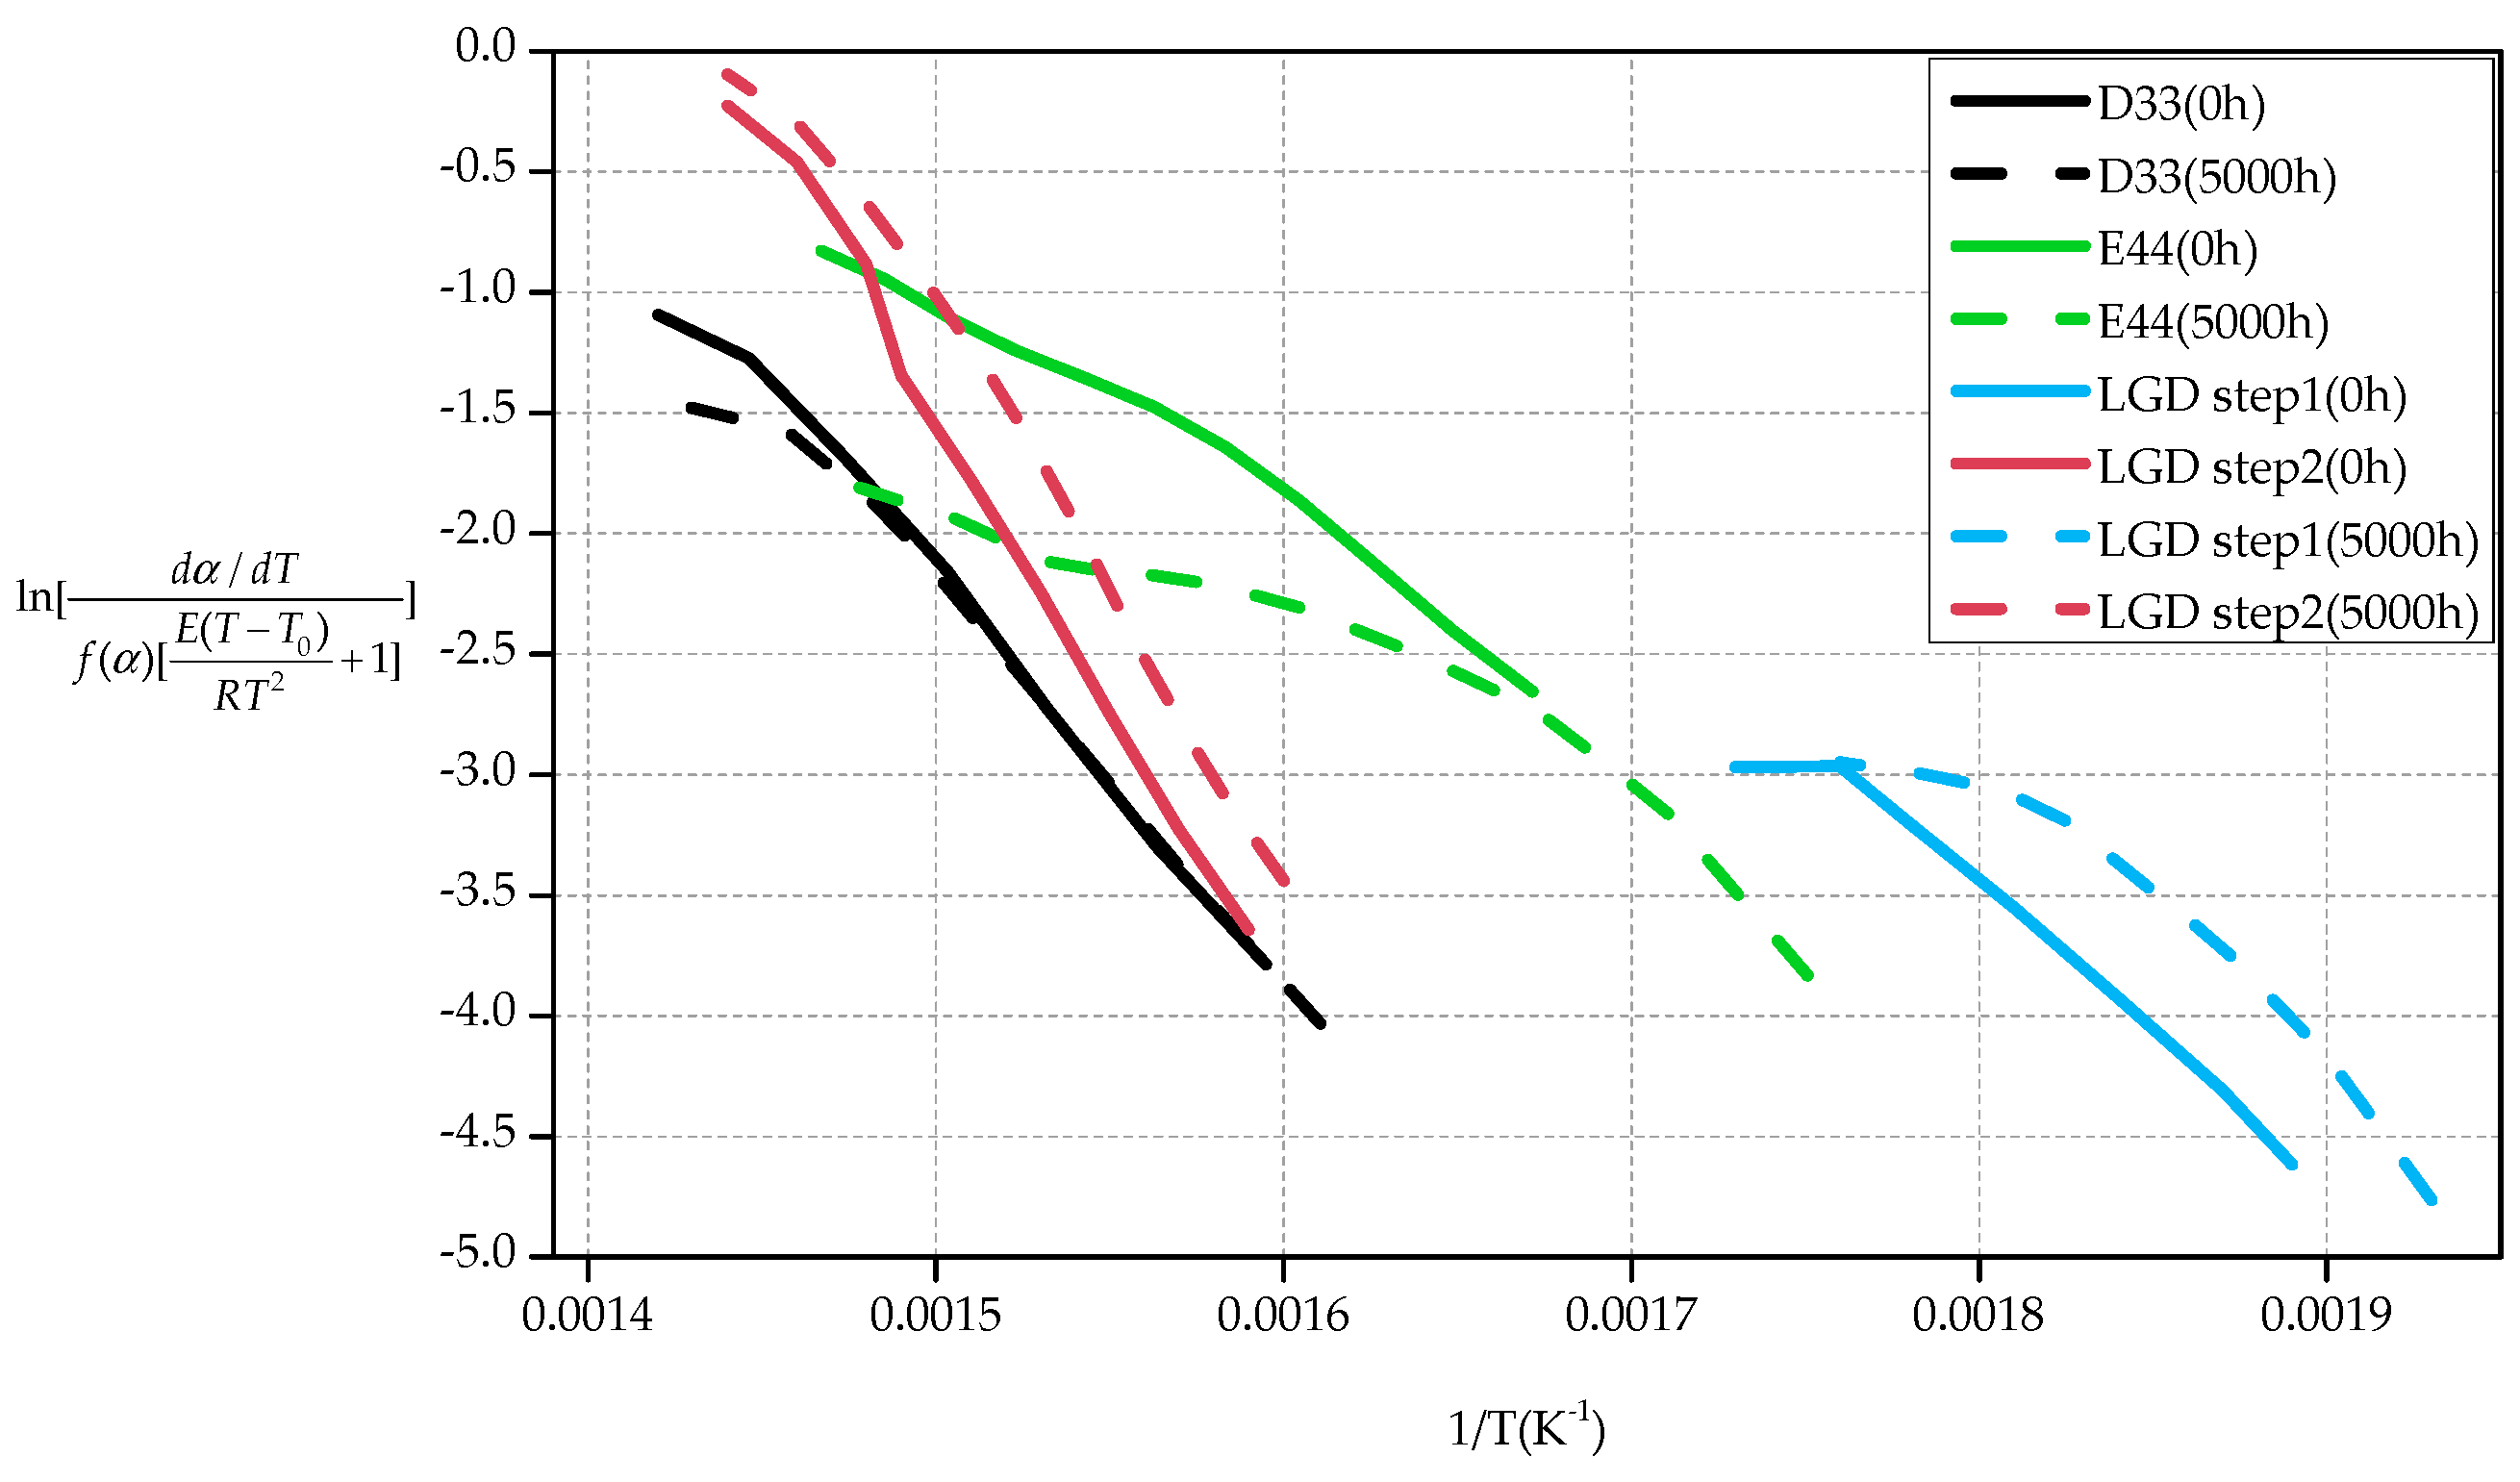
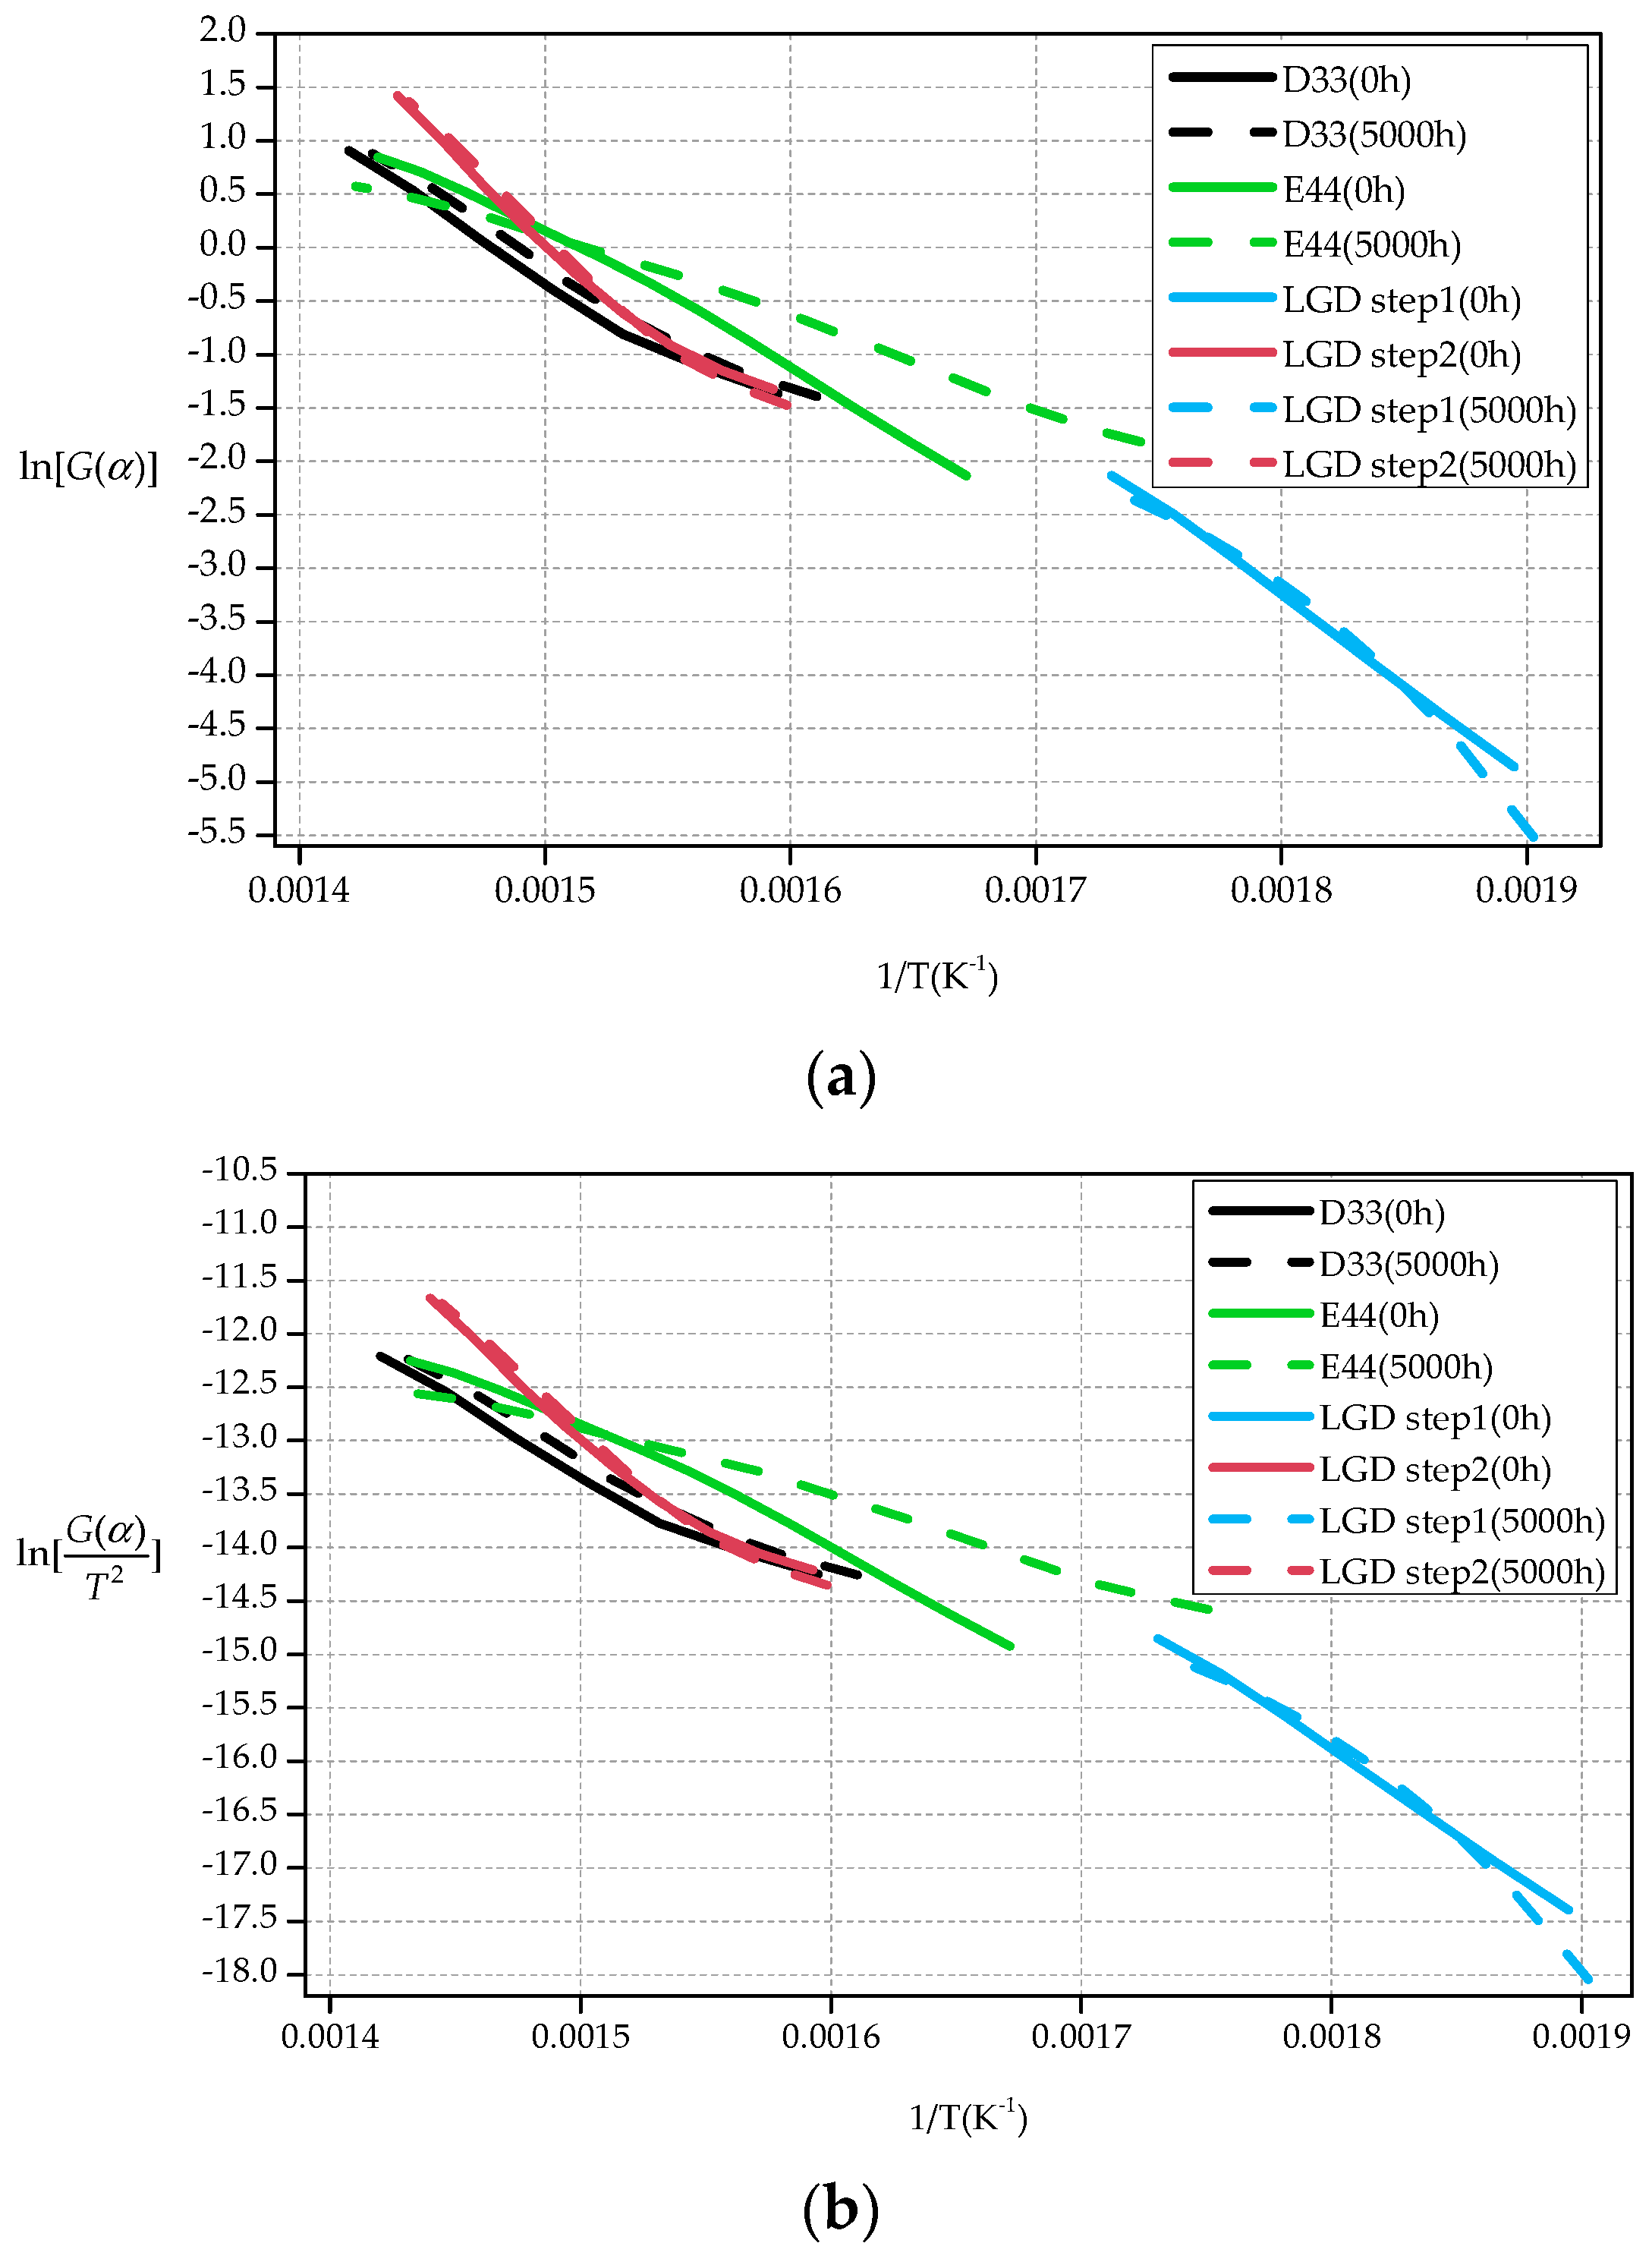
3.2.2. Calculation of Activation Energy (E)
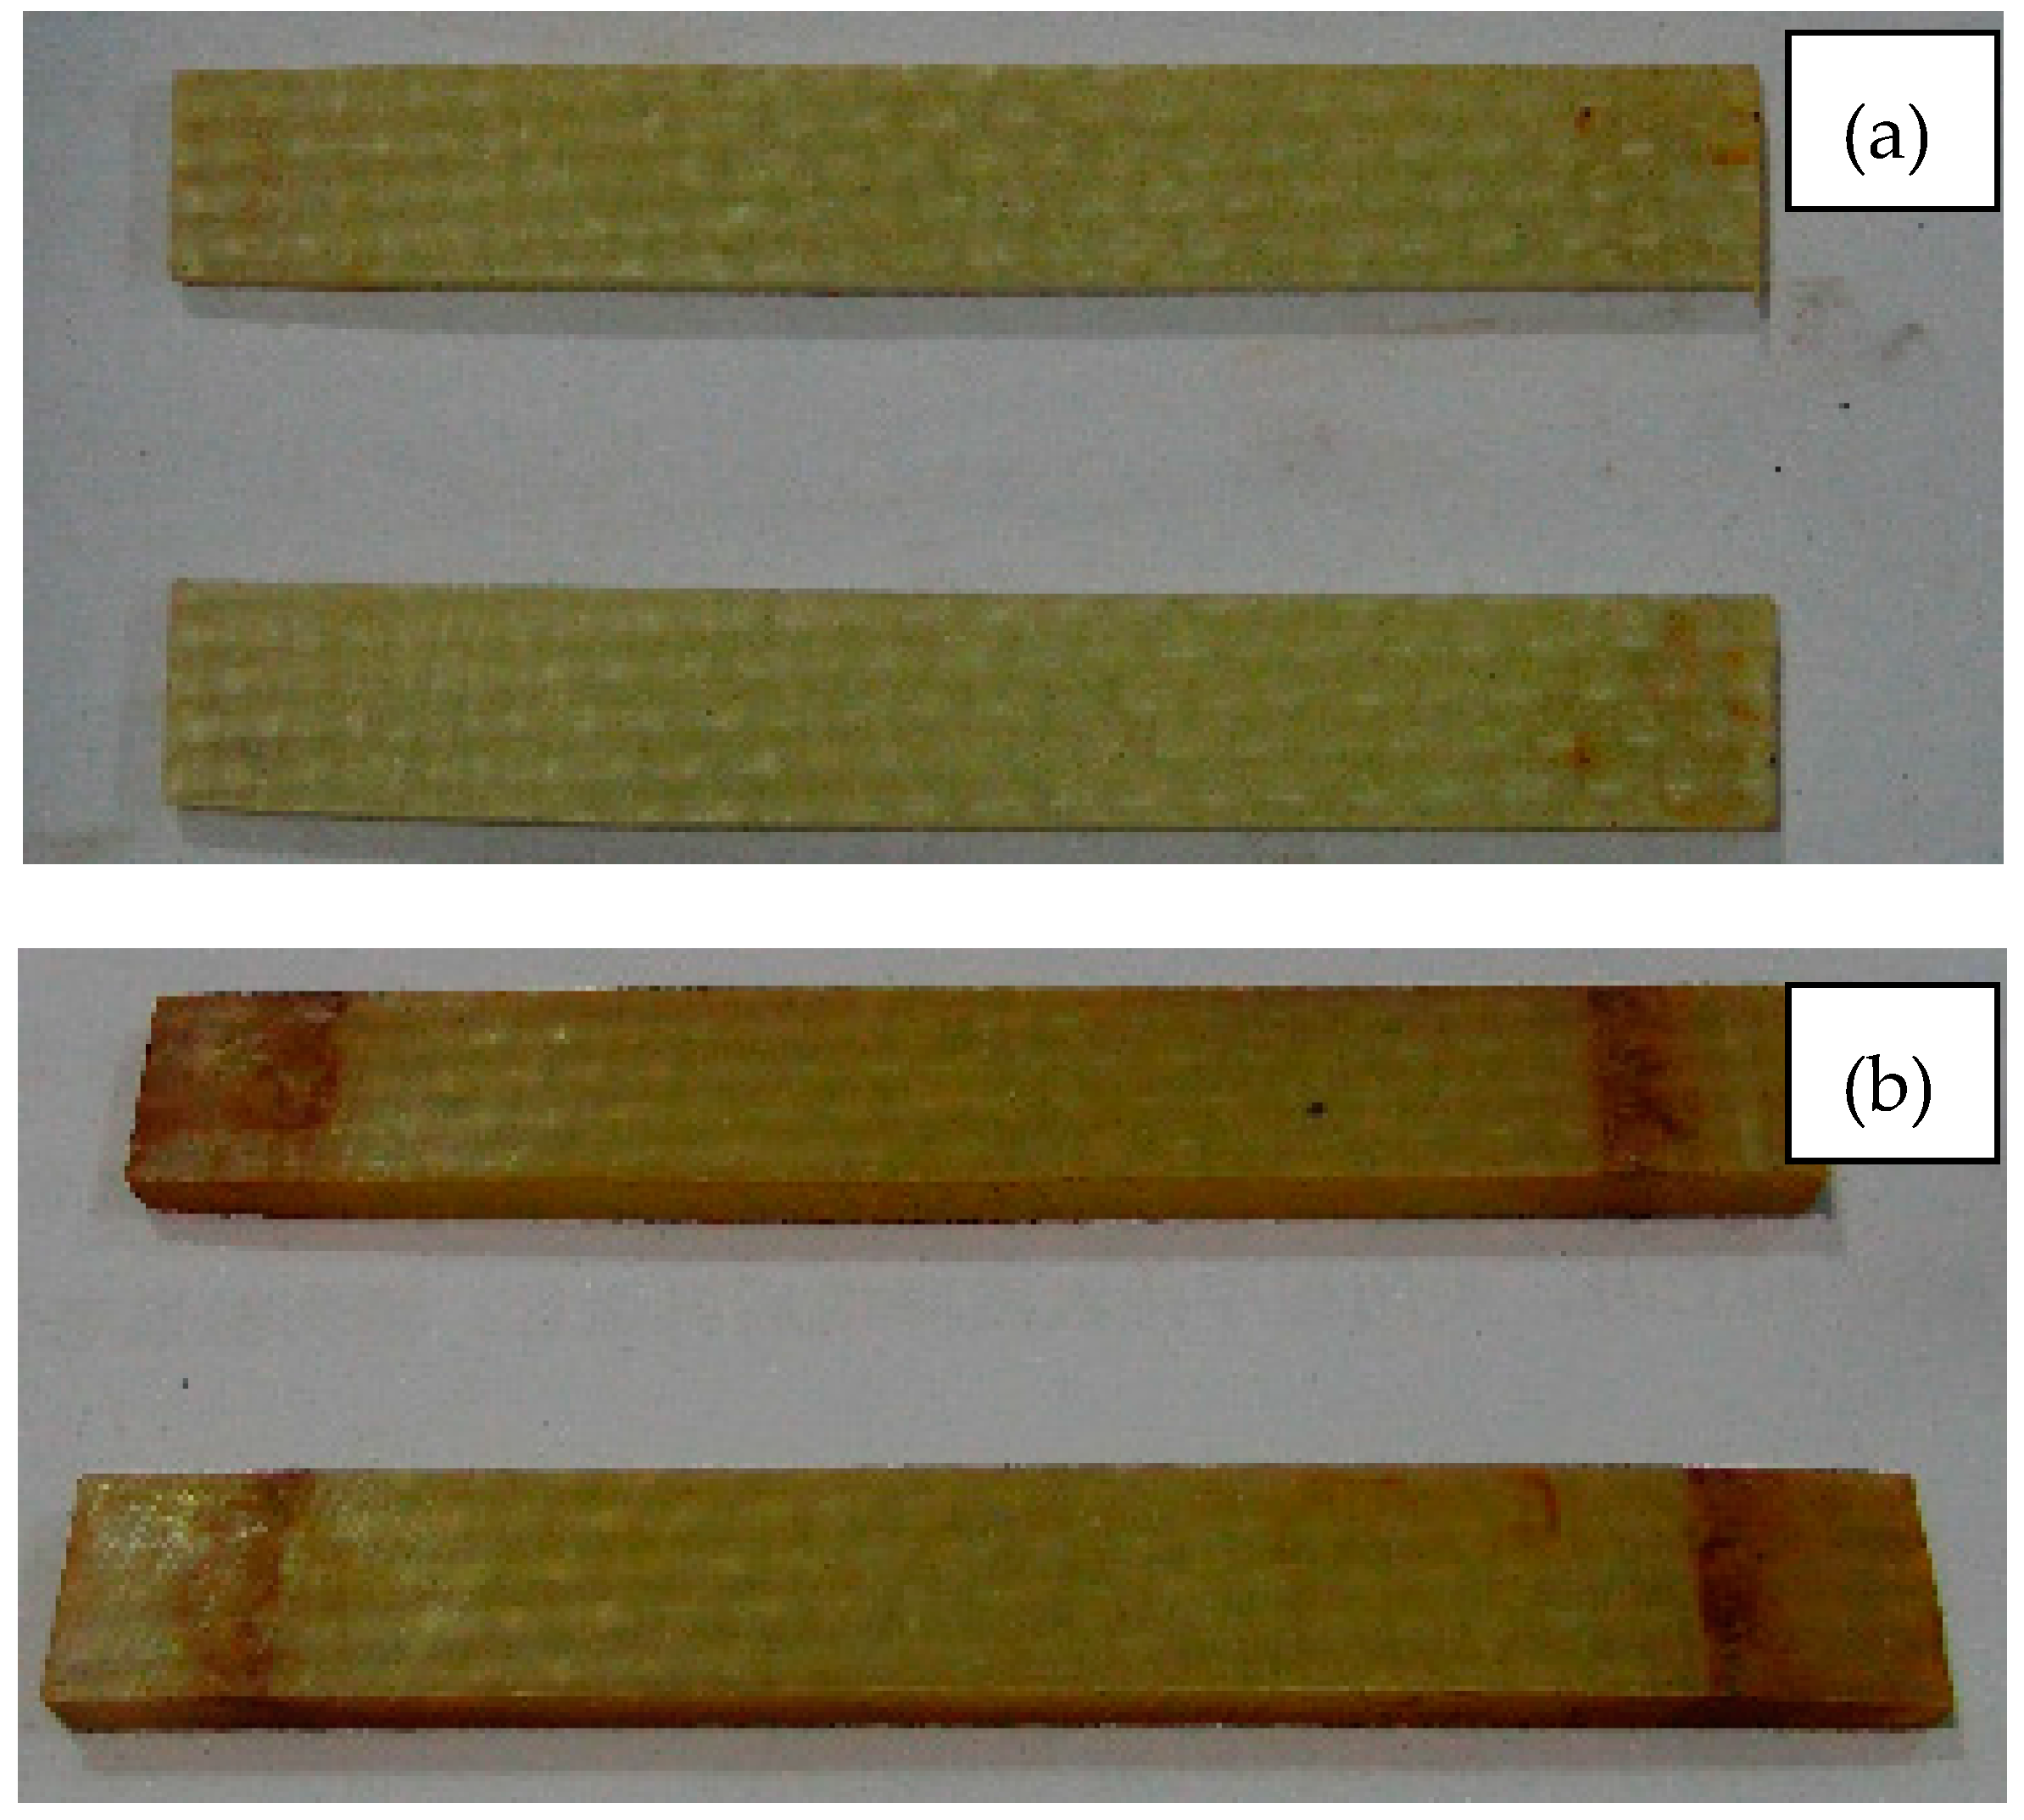
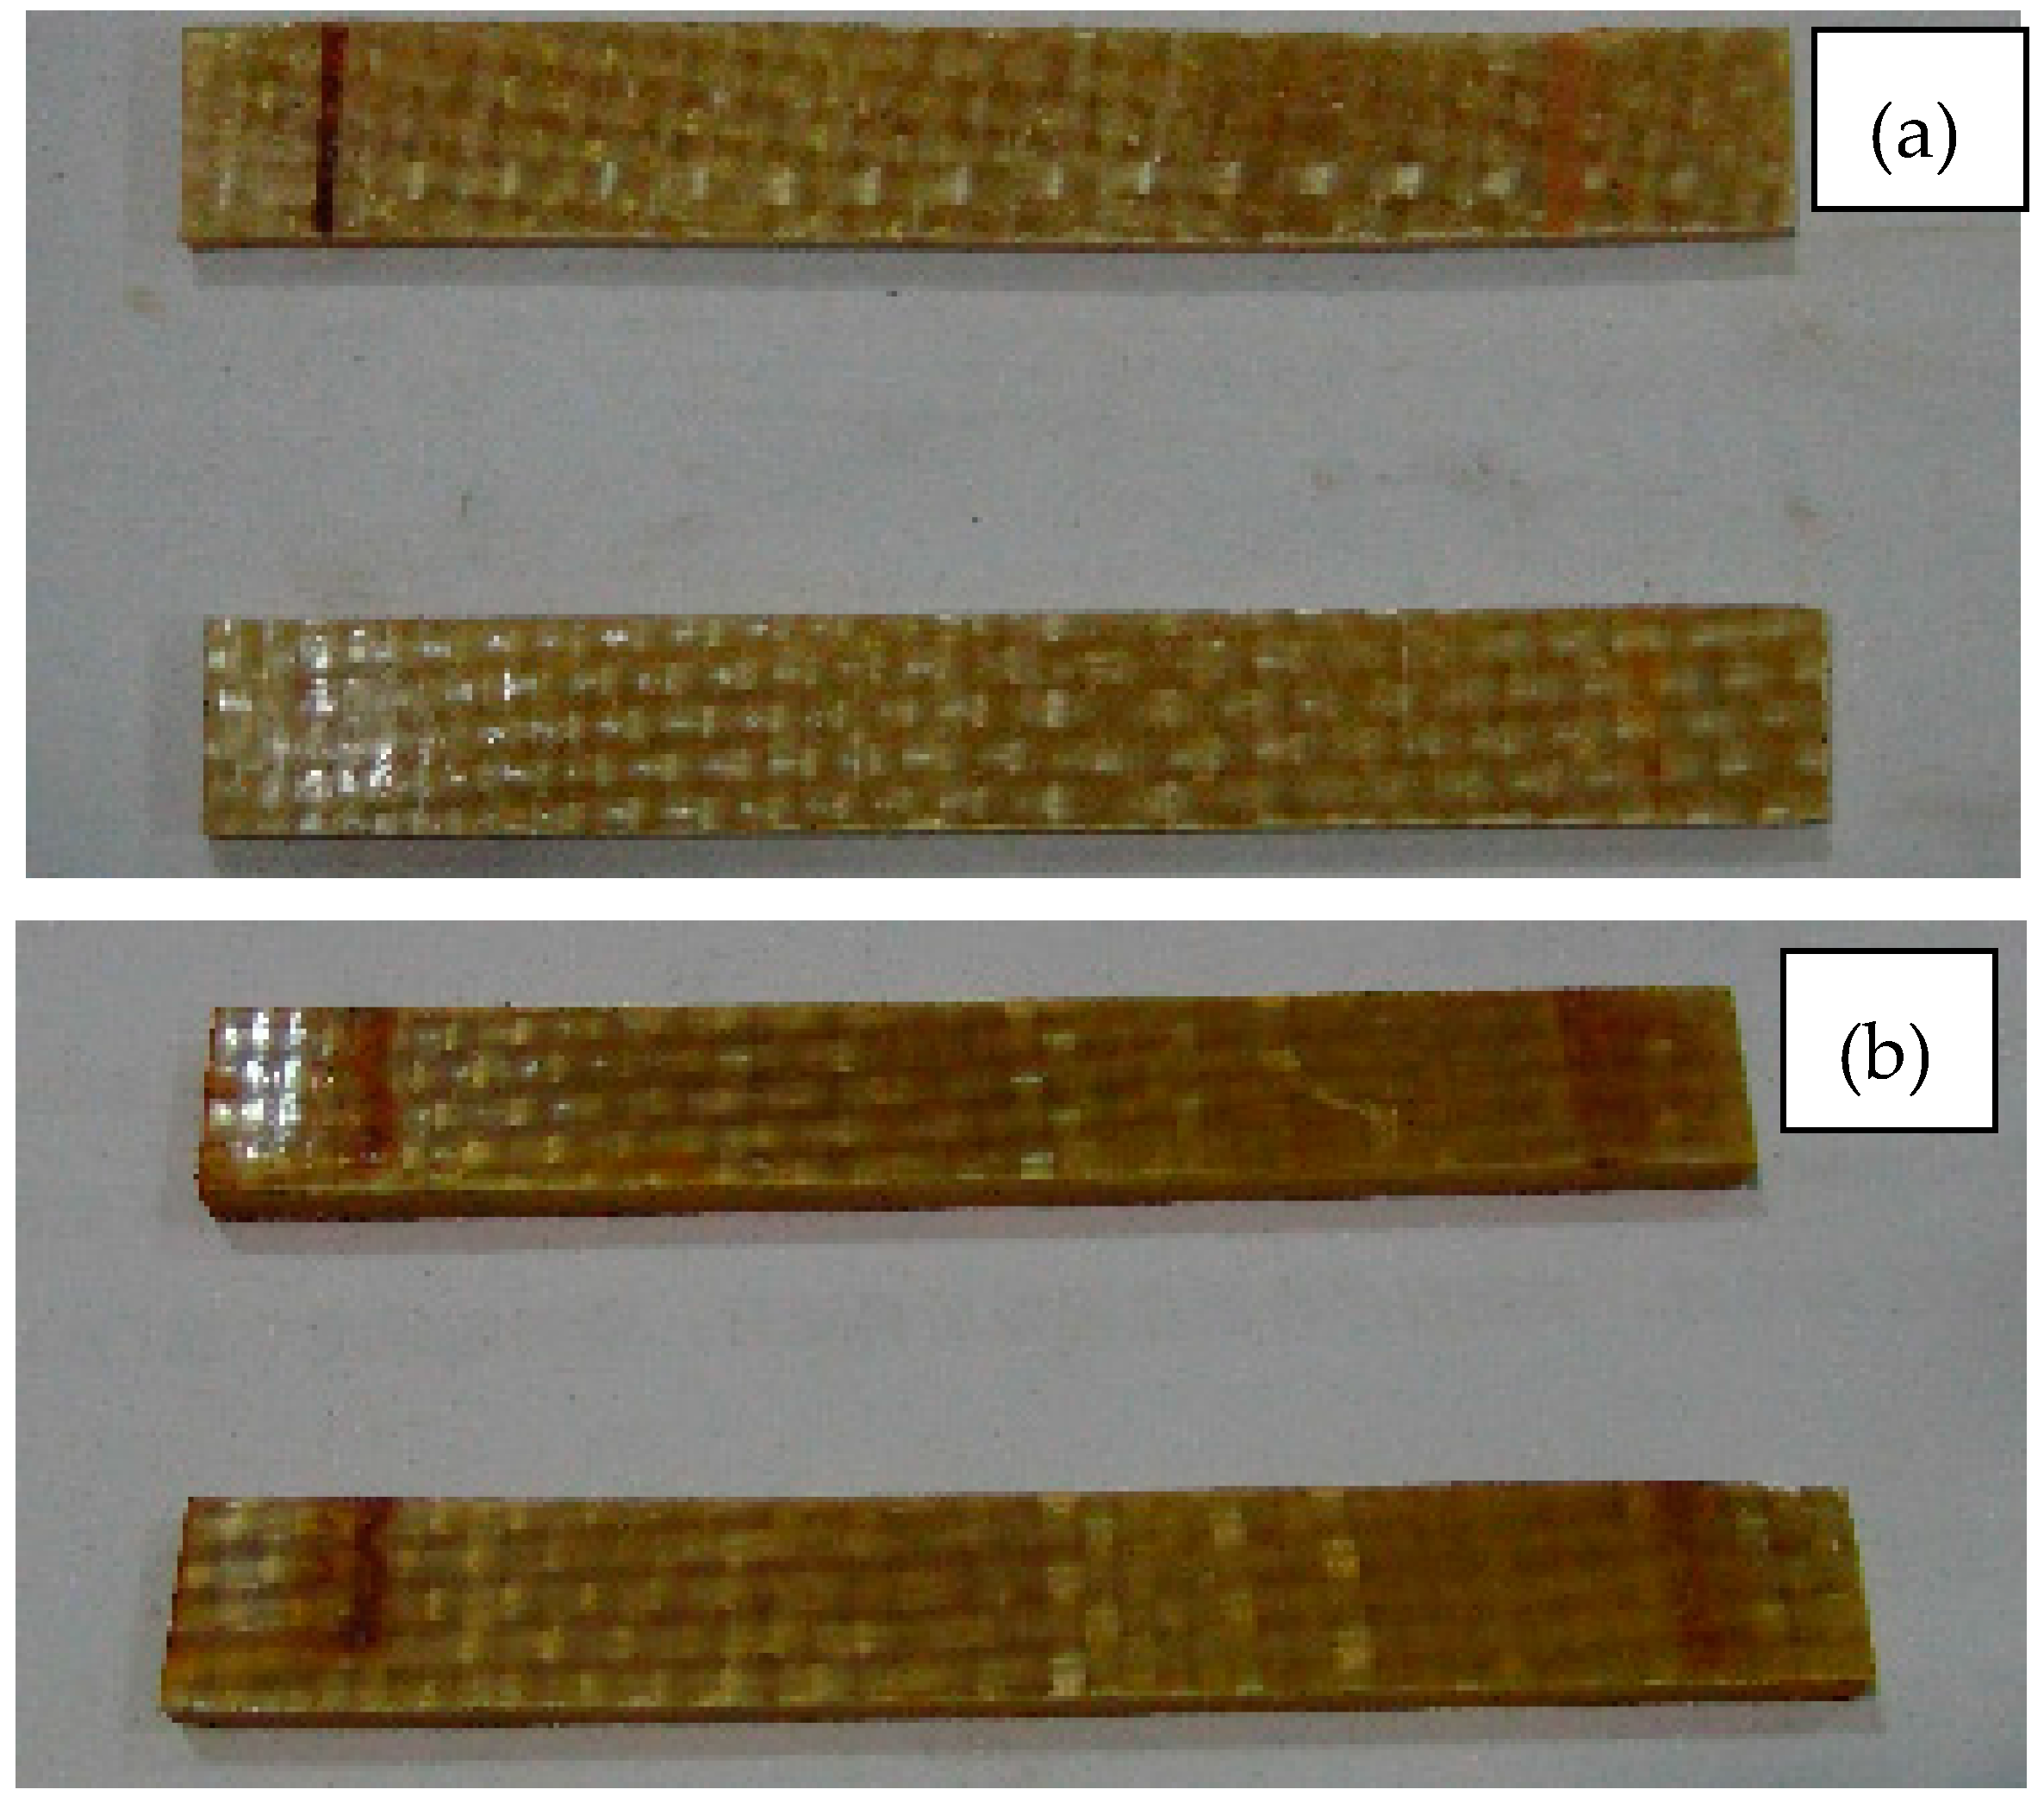
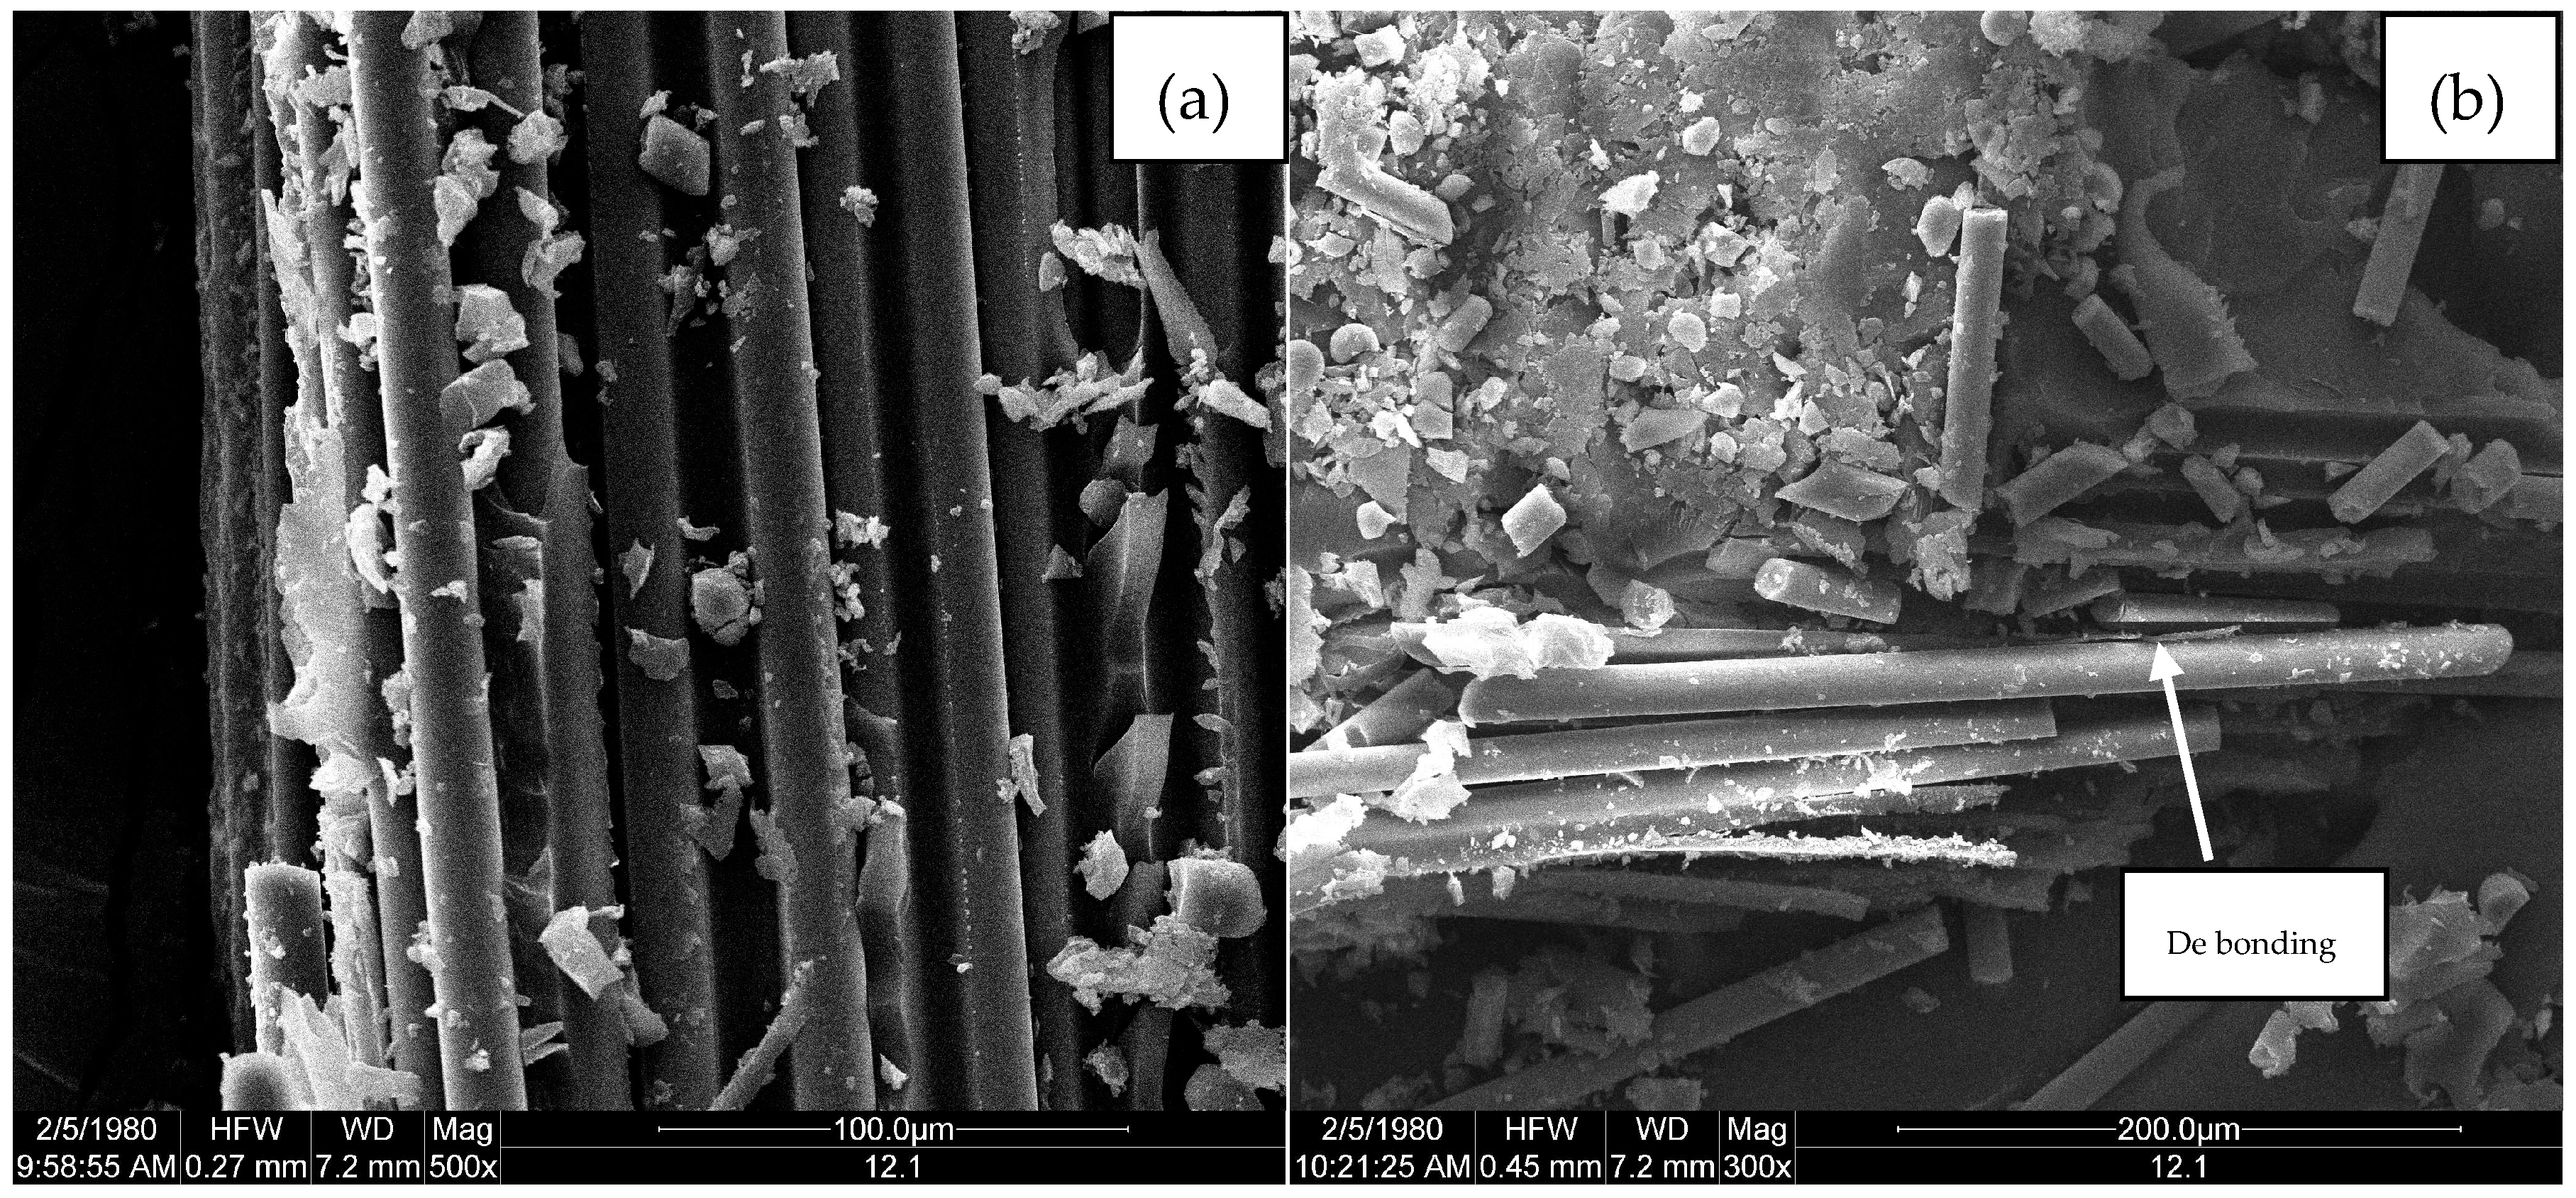
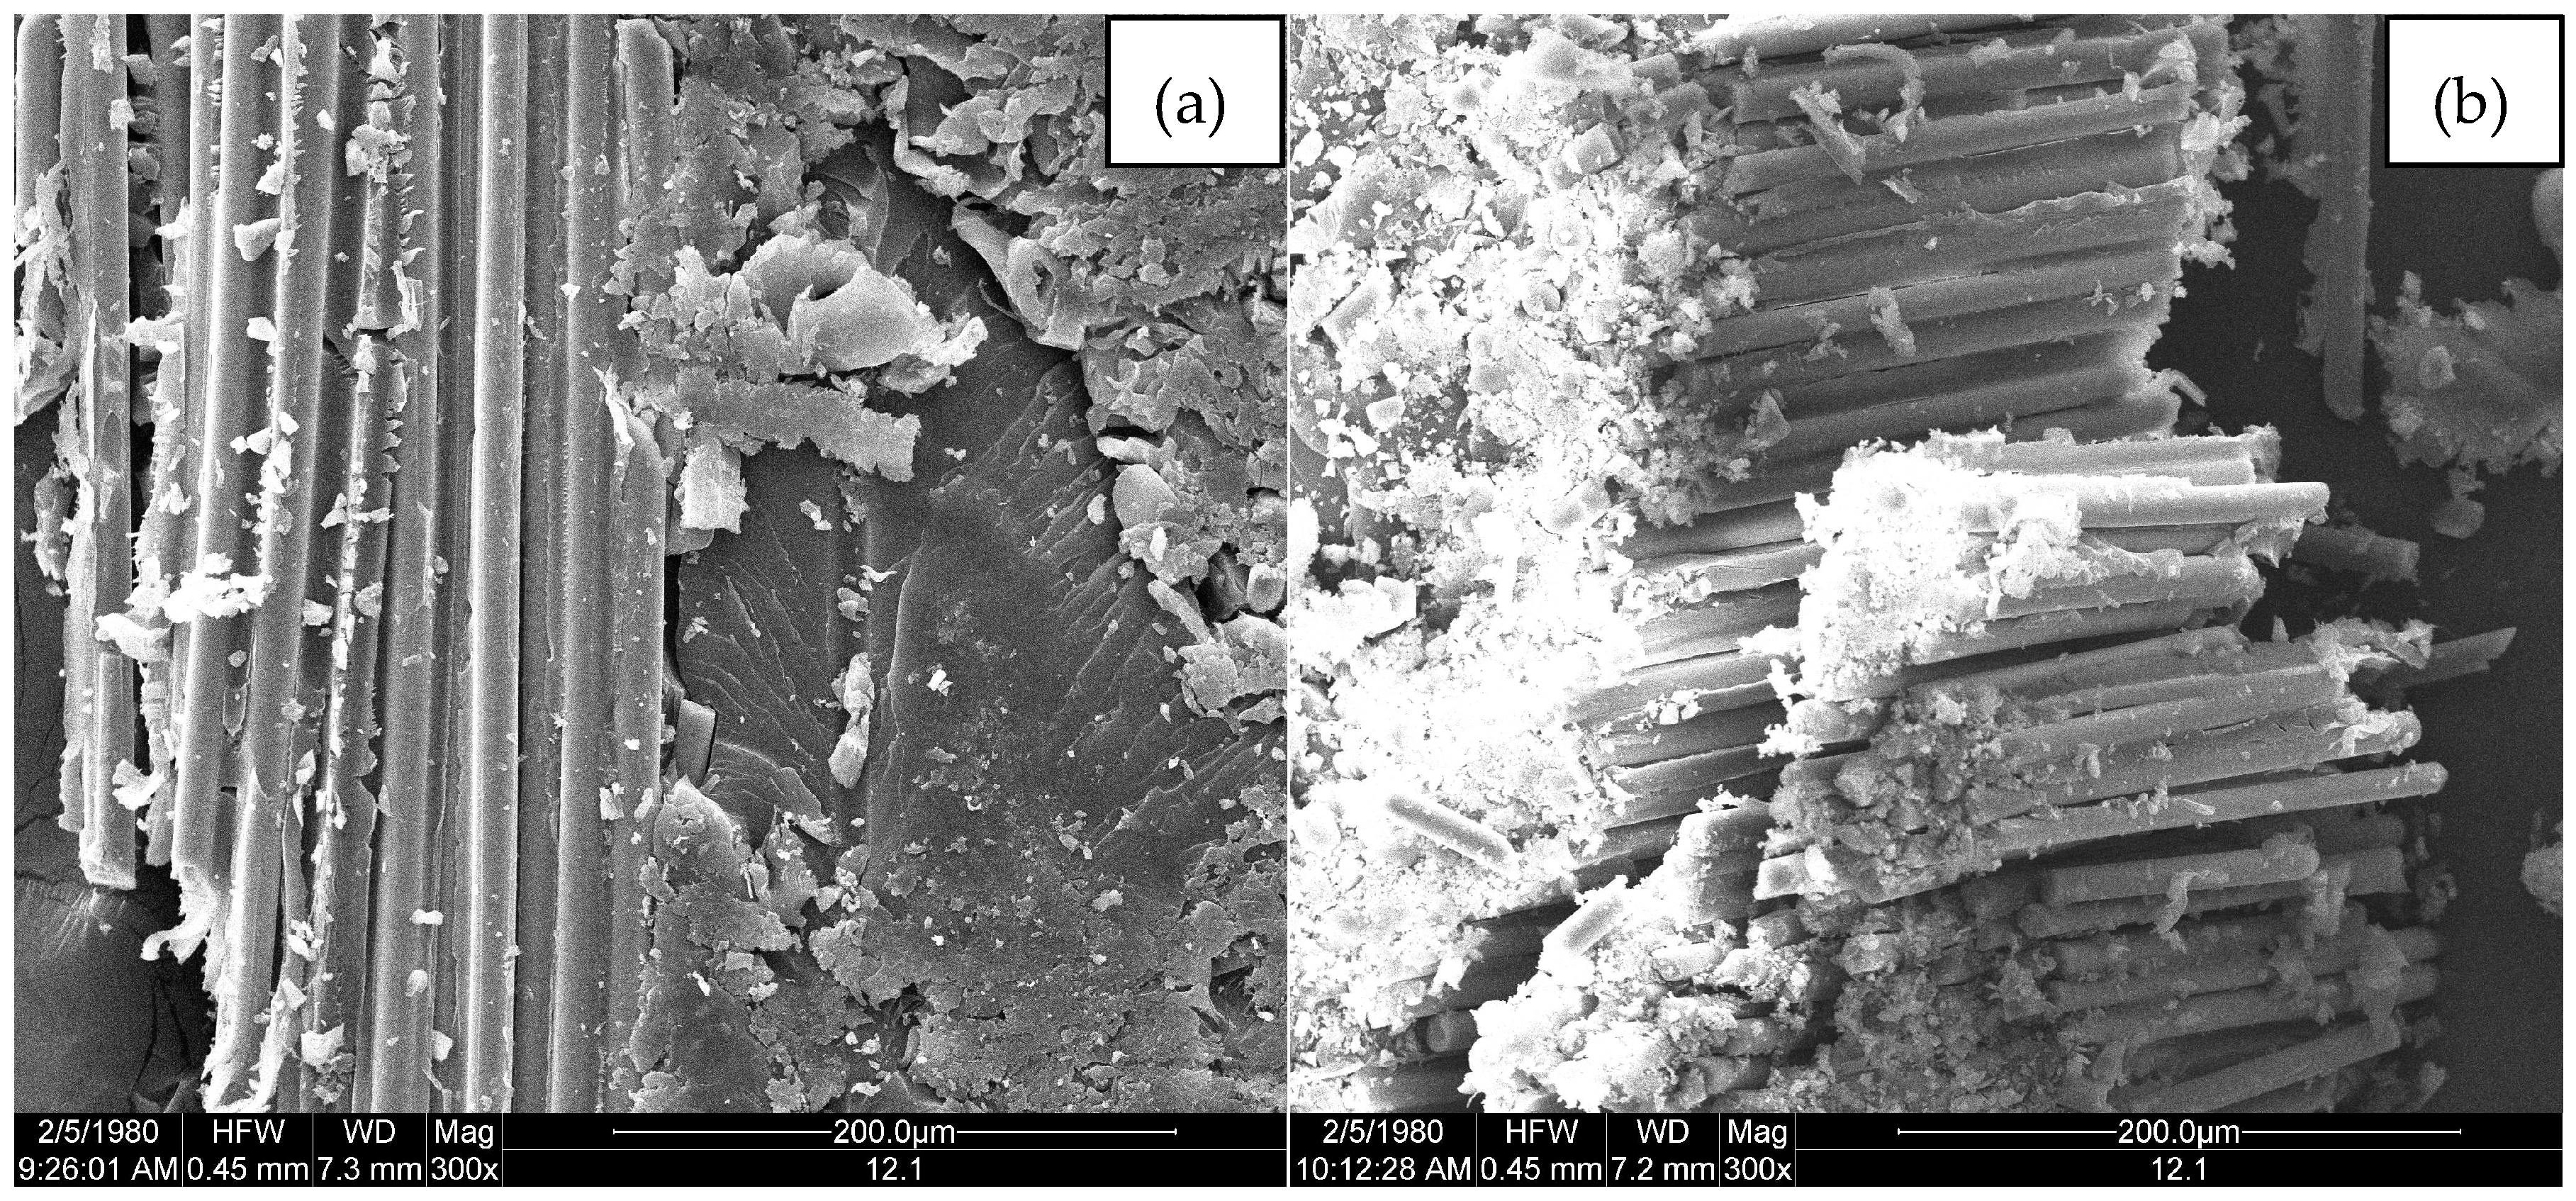
3.3. Surface Morphology
4. Discussion
5. Conclusions
Acknowledgments
Author Contributions
Conflicts of Interest
Appendix A

| Materials | LGD 0 h | LGD 5000 h | |||||||
|---|---|---|---|---|---|---|---|---|---|
| Step1 | Step2 | Step1 | Step2 | ||||||
| f(α) | Ea (kJ/mol) | R2 | Ea (kJ/mol) | R2 | Ea (kJ/mol) | R2 | Ea (kJ/mol) | R2 | |
| f(α) = 1/2 × (1 − α)[−ln(1 − α)]−1 | 96.39 | 0.9660 | 195.37 | 0.9977 | 97.93 | 0.9137 | 192.67 | 0.9912 | |
| f(α) = 2/3 × (1 − α)[−ln(1 − α)]−1/2 | 61.40 | 0.9267 | 157.05 | 0.9937 | 49.34 | 0.8451 | 152.59 | 0.9801 | |
| f(α) = 1/3 × (1 − α)[−ln(1 − α)]−2 | 166.37 | 0.9861 | 272.01 | 0.9974 | 150.48 | 0.8685 | 272.82 | 0.9966 | |
| f(α) = (1 − α)1/2[1 − (1 − α)1/2]−1 | 88.67 | 0.9517 | 137.40 | 0.9644 | 89.24 | 0.8913 | 134.39 | 0.9350 | |
| f(α) = 3/2 × [(1 − α)−1/3 − 1]−1 | 85.56 | 0.9497 | 144.42 | 0.9851 | 88.25 | 0.8883 | 144.01 | 0.9623 | |
| f(α) = 1 − α | - | - | - | - | - | - | - | - | |
References
- Wei, L. Current status and developing trends of glass fiber products at home and abroad. Fiber Glass 2005, 22, 61–66. [Google Scholar]
- Okamoto, H.; Ikeda, Y. Arc Resistance and Application of FRP to Arms in Overhead Power-Line Towers. IEEE Trans. Power Appar. Syst. 1967, PAS-86, 1098–1102. [Google Scholar] [CrossRef]
- Miller, M.F.; Hosford, G.S.; Boozer, J.F. Fiberglass distribution poles-a case study. IEEE Trans Power Deliv. 1995, 10, 497–503. [Google Scholar] [CrossRef]
- Awad, M.M.; Heggi, N.; Tahoun, F. The future of towers made of organic compound materials. In Proceedings of the International Middle-East, Power System Conference, Aswan, Egypt, 12–15 March 2008; pp. 200–202. [Google Scholar]
- Fang, D.; Han, J.; Cao, C. Advance in application of composite poles for power transmission. Fiber Glass 2008, 6, 31–35. [Google Scholar]
- Yi, H.U.; Liu, T.; Liu, K.; Deng, S.C.; Li, H.-M.; Hu, G.-S. Experimental Research on Performance of Composite Materials Pole of 110 kV Transmission Line. High Volt. Eng. 2011, 37, 801–808. [Google Scholar]
- Okamoto, H. Application of fiber glass plastics to over-head towers in Japan. In Proceedings of the IEEE Summer Power Meeting, New Orleans, LA, USA, 10–15 July 1966. [Google Scholar]
- Wu, X.; Hu, Q.; Pan, J.; Peng, J.; Ke, R.; He, C. Aging properties of composite material pole and its materials under multi-factor environment. High Volt. 2016, 42, 908–914. [Google Scholar]
- Xiong, W.U.; Qian, H.U.; Meng, F.Z. Synthesis and Properties of Polyurethane using as Glass Fiber Reinforced Polymer Transmission Poles and Cross Arms. China Plast. Ind. 2014, 42, 121–124. [Google Scholar]
- Wang, L.; Fang, Y.; Ma, Y.; Shao, J.; Wang, J.; Wu, X. Multi-factor Aging Performance of Composite Material Tower and Sample. High Volt. 2016, 2016, 3881–3887. [Google Scholar]
- Guo, Z.; Wang, L.; Fang, Y. Study on Improving Antifouling Property of Composite Material Tower Using Hydrophobic Coatings. Insul. Mater. 2016, 49, 34–39. [Google Scholar]
- Li, S.; Wang, L.; Fang, Y.; Song, B.; Guo, Z. Multi-factor Ageing Analysis and Life Evaluation on Composite Materials for Transmission Tower. Insul. Mater. 2016, 49, 80–84. [Google Scholar]
- IEC/TR 62730-2012 HV Polymeric Insulators for Indoor and Outdoor Use Tracking and Erosion Testing by Wheel Test and 5000 h Test; IEC: Geneva, Switzerland, 2012.
- Liu, H. Research and Application of Composite Transmission Poles and Towers. Fiber Compos. 2011, 1, 38–40. [Google Scholar]
- ISO 14125:1998 Fibre-Reinforced Plastic Composites—Determination of Flexural Properties; ISO: Geneva, Switzerland, 1998.
- Sullivan, R.M. A Coupled Solution Method for Predicting the Thermostructural Response of Decomposing, Expanding Polymeric Composites. J. Compos. Mater. 1993, 27, 408–434. [Google Scholar] [CrossRef]
- Henderson, J.B.; Wiebelt, J.A.; Tant, M.R. A Model for the Thermal Response of Polymer Composite Materials with Experimental Verification. J. Compos. Mater. 1985, 19, 579–595. [Google Scholar] [CrossRef]
- Chen, M.; Jiang, H.; Liu, Z. Determination of thermal decomposition kinetic parameters of glass-fiber/epoxy composite. High Power Laser Part. Beams 2010, 22, 1969–1972. [Google Scholar] [CrossRef]
- Guo, S.; He, J.; Luo, W.; Liu, F. Research on the Thermal Decomposition Reaction Kinetics and Mechanism of Pyridinol-Blocked Isophorone Diisocyanate. Materials 2016, 9, 110. [Google Scholar] [CrossRef]
- Huang, F.Y. Thermal Properties and Thermal Degradation of Cellulose Tri-Stearate (CTs). Polymers 2012, 4, 1012–1024. [Google Scholar] [CrossRef]
- Broido, A. A simple, sensitive graphical method of treating thermogravimetric analysis data. J. Polym. Sci. Part B Polym. Phys. 1969, 7, 1761–1773. [Google Scholar] [CrossRef]
- Bagchi, T.P.; Sen, P.K. Combined differential and integral method for analysis of non-isothermal kinetic data. Thermochim. Acta 1981, 51, 175–189. [Google Scholar] [CrossRef]
- Coats, A.W.; Redfern, J.P. Kinetic Parameters from Thermogravimetric Data. Lett. Nat. 1964, 201, 68–69. [Google Scholar] [CrossRef]
- Torre, L.; Kenny, J.M.; Maffezzoli, A.M. Degradation behaviour of a composite material for thermal protection systemsPart II Process simulation. J. Mater. Sci. 1998, 33, 3145–3149. [Google Scholar] [CrossRef]
- Park, H.S.; Kim, D.W.; Hwang, K.H.; Yoon, B.S.; Wu, J.P.; Park, J.W.; Hahm, H.S.; Im, W.B. Preparation and characterization of polyurethane flame-retardant coatings using pyrophosphoric lactone-modified polyesters/isophorone diisocyanate–isocyanurate. J. Appl. Polym. Sci. 2001, 80, 2316–2327. [Google Scholar] [CrossRef]
- Chattopadhyay, D.K.; Webster, D.C. Thermal stability and flame retardancy of polyurethanes. Prog. Polym. Sci. 2009, 34, 1068–1133. [Google Scholar] [CrossRef]
- Code for Design of Steel Structures; MOHURD: Beijing, China, 2016; GB 50017-2016.
- Code for Design of 110 kV~750 kV Overhead Transmission Line; MOHURD: Beijing, China, 2010; GB 50545-2010.
- Zhang, L.; Sun, Q.; Wang, H.C. Experimental Study on the Mechanical Properties of E-glass Fiber/Epoxy Composite Material. Electr. Power Constr. 2010, 31, 118–121. [Google Scholar]
- IEC 62217-2012 Polymeric HV Insulators for Indoor and Outdoor Use—General Definitions, Test Methods and Acceptance Criteria; IEC: Geneva, Switzerland, 2012.
- Zhang, P.; Long, Y.; Sun, Q.; Wang, H.; Zhao, X. Experimental Study on Ageing Resistance of Glass Fiber Reinforced Polymer in Transmission Tower. Electr. Power Constr. 2012, 33, 67–71. [Google Scholar]


| Sample Name | LGD | E44 | D33 |
|---|---|---|---|
| resin matrix | modified polyurethane resin | epoxy resin | modified unsaturated polyester resin |
| manufacturer | NARI (Wuhan, China) | Baling Petrochemical Co. Ltd. (Yueyang, China) | Ashland (Changzhou, China) Chemical Co. Ltd. |
| Resin’s specification | Self-developed by NARI | E-44 is 6101 epoxy resin, which is a general purpose resin | D33 is 197# unsaturated polyester resin, which is a general purpose resin |
| Specimen capacity | 12 | 12 | 12 |
| Resin’s Synthesis Method | By introducing propoxylated bisphenol A into unsaturated polyester segments, the hydroxy-terminated unsaturated polyester are synthesized; then the saturated polyester segments and the polyurethane segments are joined by chemical covalent bonds. | The conventional method is by the condensation reaction of BPA and ECH. | Polyester is synthesized from bisphenol A derivative and maleic anhydride. And then unsaturated polyester resin is made by polyester and styrene. |
| Humidification | ● | ● | |||||||||||||||||||||||
| Heating | ● | ● | ● | ● | ● | ||||||||||||||||||||
| Cooling | ● | ● | |||||||||||||||||||||||
| Rain | ● | ||||||||||||||||||||||||
| Salt fog | ● | ● | ● | ● | |||||||||||||||||||||
| Ultraviolet ray | ● | ● | ● | ● | ● | ● | ● | ||||||||||||||||||
| Electric field | ● | ● | ● | ● | ● | ● | ● | ● | ● | ● | ● | ● | |||||||||||||
| Time (hours) | 0 | 2 | 4 | 6 | 8 | 10 | 12 | 14 | 16 | 18 | 20 | 22 | 24 | ||||||||||||
| Time | D33 | E44 | LGD | |||
|---|---|---|---|---|---|---|
| Eb/GPa | Y/% | Eb/GPa | Y/% | Eb/GPa | Y/% | |
| 0 | 16.43 | 100.0 | 16.24 | 100.0 | 18.38 | 100.0 |
| 500 | 15.24 | 92.8 | 15.54 | 95.6 | 17.00 | 92.5 |
| 1000 | 15.38 | 93.6 | 15.41 | 94.8 | 16.93 | 92.1 |
| 1500 | 15.33 | 93.3 | 14.73 | 91.3 | 17.51 | 95.3 |
| 2000 | 15.57 | 94.8 | 16.00 | 98.5 | 17.49 | 95.2 |
| 2500 | 15.39 | 93.7 | 15.38 | 94.7 | 17.15 | 93.3 |
| 3000 | 15.38 | 93.6 | 15.86 | 97.7 | 17.31 | 94.2 |
| 4000 | 15.45 | 94.1 | 15.44 | 95.1 | 17.20 | 93.6 |
| 5000 | 15.45 | 94.1 | 15.27 | 94.0 | 17.32 | 94.2 |
| Time | LGD | E44 | D33 | |||
|---|---|---|---|---|---|---|
| Eb/GPa | Y/% | Eb/GPa | Y/% | Eb/GPa | Y/% | |
| 0 | 2.58 | 100.0 | 2.82 | 100.0 | 2.67 | 100.0 |
| 1000 | 2.80 | 108.5 | 2.62 | 92.9 | 2.61 | 97.8 |
| 2000 | 2.65 | 102.7 | 2.61 | 92.5 | 2.65 | 99.3 |
| 3000 | 2.65 | 102.7 | 2.56 | 90.8 | 2.61 | 97.8 |
| 4000 | 2.68 | 103.8 | 2.61 | 92.6 | 2.64 | 98.9 |
| 5000 | 2.63 | 101.9 | 2.60 | 92.2 | 2.64 | 98.9 |
| Time | D33 | E44 | LGD | |||
|---|---|---|---|---|---|---|
| f/MPa | Y/% | f/MPa | Y/% | f/MPa | Y/% | |
| 0 | 415.0 | 100.0 | 437.0 | 100.0 | 428.4 | 100.0 |
| 5000 | 401.5 | 96.7 | 405.5 | 92.8 | 419.5 | 97.9 |
| Matrrials | Ageing time/h | OT (°C) | DTGmax (°C) | T5% (°C) | FR (%) |
|---|---|---|---|---|---|
| D33 | 0 | 354 | 401 | 278 | 39.0 |
| 5000 | 348 | 400 | 297 | 55.0 | |
| E44 | 0 | 325 | 365 | 324 | 53.4 |
| 5000 | 290 | 352 | 298 | 64.6 | |
| LGD | 0 | 247 | 405 | 263 | 53.3 |
| 5000 | 243 | 394 | 259 | 44.5 |
| Materials | D33 | E44 | LGD1 | |||
|---|---|---|---|---|---|---|
| 0 h | 5000 h | 0 h | 5000 h | 0 h | 5000 h | |
| α | 0.015 | 0.021 | 0.022 | 0.018 | 0.018 | 0.014 |
| T0 (K) | 364.8 | 365.6 | 514.9 | 441.0 | 494.5 | 508.9 |
| Materials | D33 | E44 | |||||||
|---|---|---|---|---|---|---|---|---|---|
| 0 | 5000 | 0 | 5000 | ||||||
| Iteration | Ea (kJ/mol) | R2 | Ea (kJ/mol) | R2 | Ea (kJ/mol) | R2 | Ea (kJ/mol) | R2 | |
| 1 | 134.49 | 0.9880 | 124.53 | 0.9774 | 74.16 | 0.9795 | 54.66 | 0.8923 | |
| 2 | 134.35 | 0.9880 | 124.38 | 0.9774 | 72.68 | 0.9794 | 54.53 | 0.8920 | |
| 3 | 134.35 | 0.9880 | 124.38 | 0.9774 | 72.75 | 0.9794 | 54.53 | 0.8920 | |
| 4 | 72.75 | 0.9794 | |||||||
| Materials | LGD 0 h | LGD 5000 h | |||||||
|---|---|---|---|---|---|---|---|---|---|
| Step1 | Step2 | Step1 | Step2 | ||||||
| Iteration | Ea (kJ/mol) | R2 | Ea (kJ/mol) | R2 | Ea (kJ/mol) | R2 | Ea (kJ/mol) | R2 | |
| 1 | 96.39 | 0.9660 | 195.37 | 0.9977 | 97.93 | 0.9137 | 192.67 | 0.9912 | |
| 2 | 90.67 | 0.9643 | 193.11 | 0.9977 | 85.89 | 0.9094 | 189.81 | 0.9911 | |
| 3 | 91.17 | 0.9645 | 193.37 | 0.9976 | 88.30 | 0.9099 | 189.83 | 0.9911 | |
| 4 | 91.12 | 0.9645 | 193.12 | 0.9976 | 87.79 | 0.9098 | 189.83 | 0.9911 | |
| 5 | 91.13 | 0.9645 | 193.12 | 0.9976 | 87.90 | 0.9098 | |||
| 6 | 87.87 | 0.9098 | |||||||
| 7 | 87.87 | 0.9098 | |||||||
| Materials | Ageing time/h | Ea (kJ/mol) | R2 | f(α) |
|---|---|---|---|---|
| D33 | 0 | 111.52 | 0.9821 | f(α) = 1 − α |
| 5000 | 108.16 | 0.9837 | ||
| E44 | 0 | 105.00 | 0.9947 | |
| 5000 | 64.50 | 0.9962 | ||
| LGD step1 | 0 | 130.28 | 0.9880 | f(α) = 1/2 × (1 − α)[−ln(1−α)]−1 |
| 5000 | 146.09 | 0.9582 | ||
| LGD step2 | 0 | 153.28 | 0.9736 | |
| 5000 | 160.30 | 0.9794 |
| Materials | Aging time/h | Ea (kJ/mol) | R2 | f(α) |
|---|---|---|---|---|
| D33 | 0 | 100.50 | 0.9786 | f(α) = 1 − α |
| 5000 | 97.21 | 0.9805 | ||
| E44 | 0 | 94.26 | 0.9929 | |
| 5000 | 54.68 | 0.9913 | ||
| LGD step1 | 0 | 121.04 | 0.9859 | f(α) = 1/2 × (1 − α)[−ln(1 − α)]−1 |
| 5000 | 136.88 | 0.9522 | ||
| LGD step2 | 0 | 142.30 | 0.9699 | |
| 5000 | 149.36 | 0.9766 |
© 2017 by the authors. Licensee MDPI, Basel, Switzerland. This article is an open access article distributed under the terms and conditions of the Creative Commons Attribution (CC BY) license (http://creativecommons.org/licenses/by/4.0/).
Share and Cite
Shao, J.; Wang, J.; Long, M.; Li, J.; Ma, Y. 5000 h Multi-Factor Accelerated Aging Test of FRP Made Transmission Tower: Characterization, Thermal Decomposition and Reaction Kinetics Study. Polymers 2017, 9, 170. https://doi.org/10.3390/polym9050170
Shao J, Wang J, Long M, Li J, Ma Y. 5000 h Multi-Factor Accelerated Aging Test of FRP Made Transmission Tower: Characterization, Thermal Decomposition and Reaction Kinetics Study. Polymers. 2017; 9(5):170. https://doi.org/10.3390/polym9050170
Chicago/Turabian StyleShao, Jianwei, Junhua Wang, Mengjiao Long, Jiangui Li, and Yayun Ma. 2017. "5000 h Multi-Factor Accelerated Aging Test of FRP Made Transmission Tower: Characterization, Thermal Decomposition and Reaction Kinetics Study" Polymers 9, no. 5: 170. https://doi.org/10.3390/polym9050170