Effect of Drug Loading Method and Drug Physicochemical Properties on the Material and Drug Release Properties of Poly (Ethylene Oxide) Hydrogels for Transdermal Delivery


Abstract
:
1. Introduction
2. Materials and Methods
2.1. Materials
2.2. Synthesis of PEO Hydrogel Films
2.3. UV Irradiation of PEO Hydrogel Films
2.4. Drug Loading
2.4.1. Post-Loading
2.4.2. In Situ Loading
2.5. Scanning Electron Microscopy
2.6. Differential Scanning Calorimetry
2.7. Fourier Transform Infrared Spectroscopy
2.8. Swelling Measurements
Determination of Average Molecular Weight between Cross-Links, Cross-Linking Density, and Mesh Size
2.9. Tensile Testing
2.10. Measurement of Rheological Properties
2.11. In Vitro Drug Permeation Studies
2.11.1. pH Analysis
2.11.2. Release Medium
2.11.3. Drug Permeation Studies
- Zero-order kinetics [30]where F is the fraction of drug release at time t and K0 is the zero order release constant.
- Korsmeyer-Peppas Model [33]where is the fraction of drug release at time t, K3 is the release rate constant, and n is the release exponent. The different release mechanisms were characterized using the calculated n value. When n < 0.5, the diffusion mechanism is quasi-Fickian, n = 0.5 is Fickian diffusion, 0.45 < n < 1 refers to non-Fickian diffusion, n = 1 is case-II transport, and n > 1 refers to super case-II transport [34].
2.12. Statistical Analysis
3. Results and Discussion
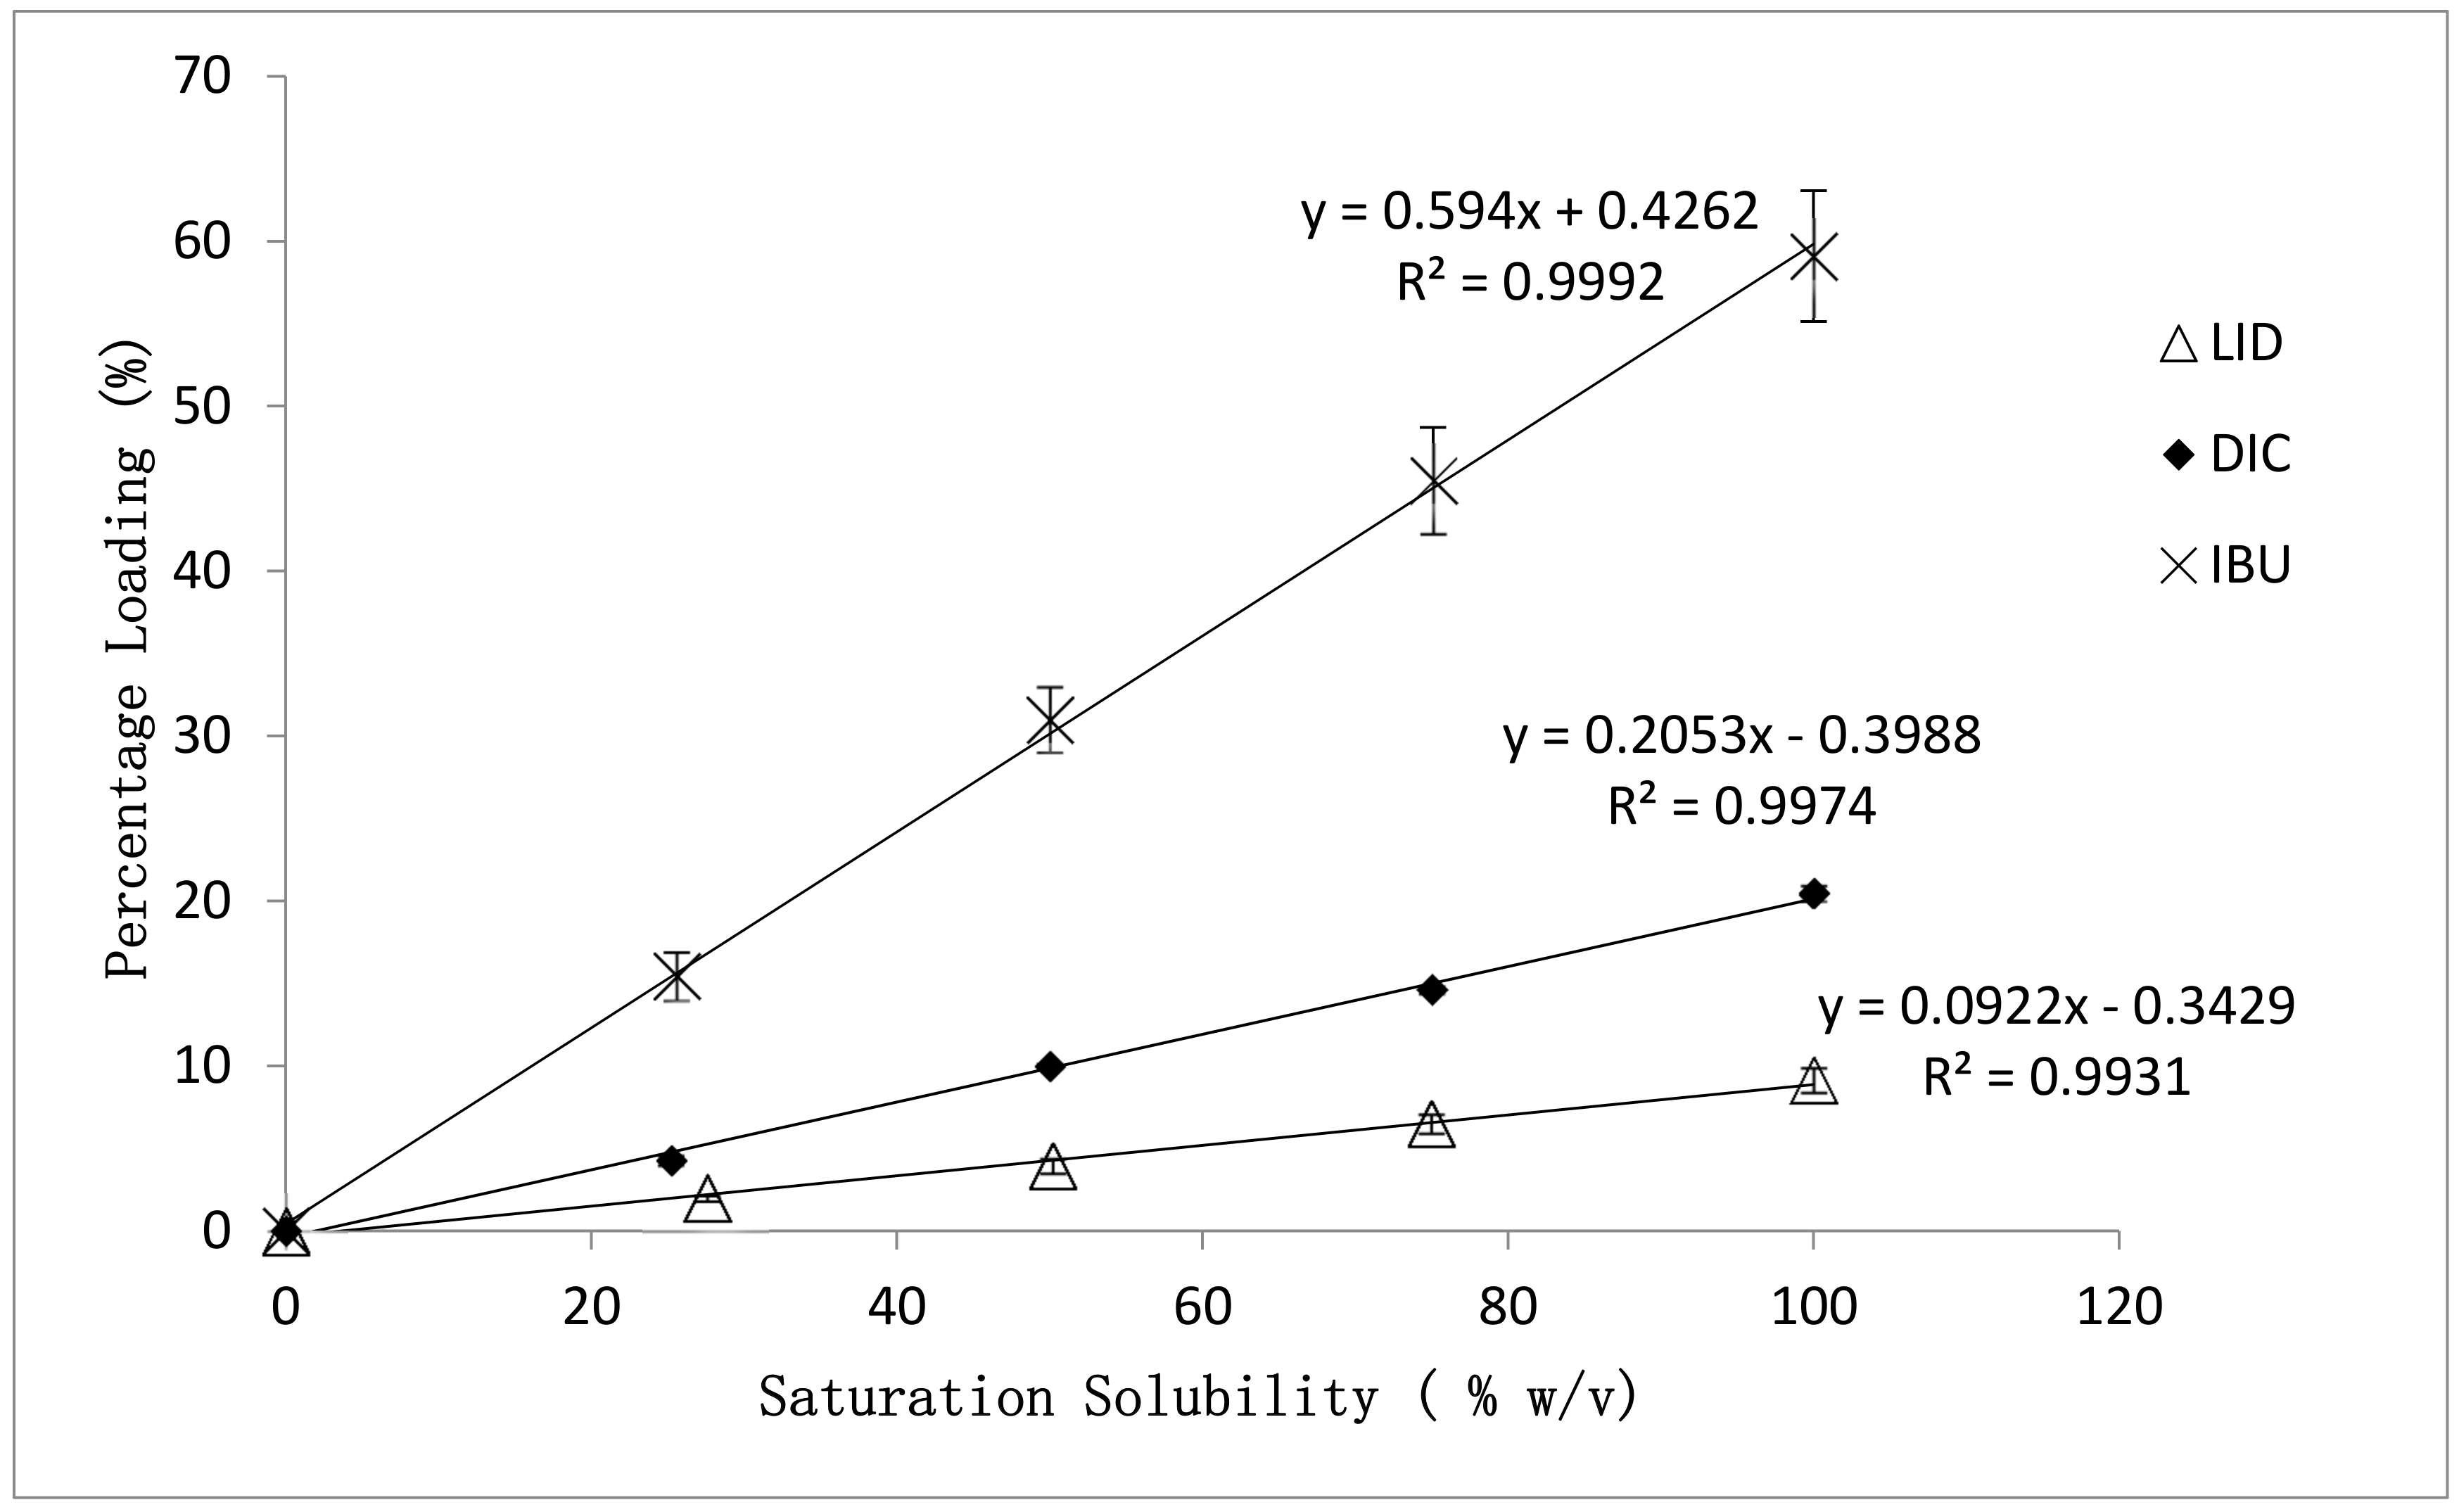
3.1. Effect of Drug Physicochemical Properties on the Percentage Loading of Post-Loaded Hydrogels
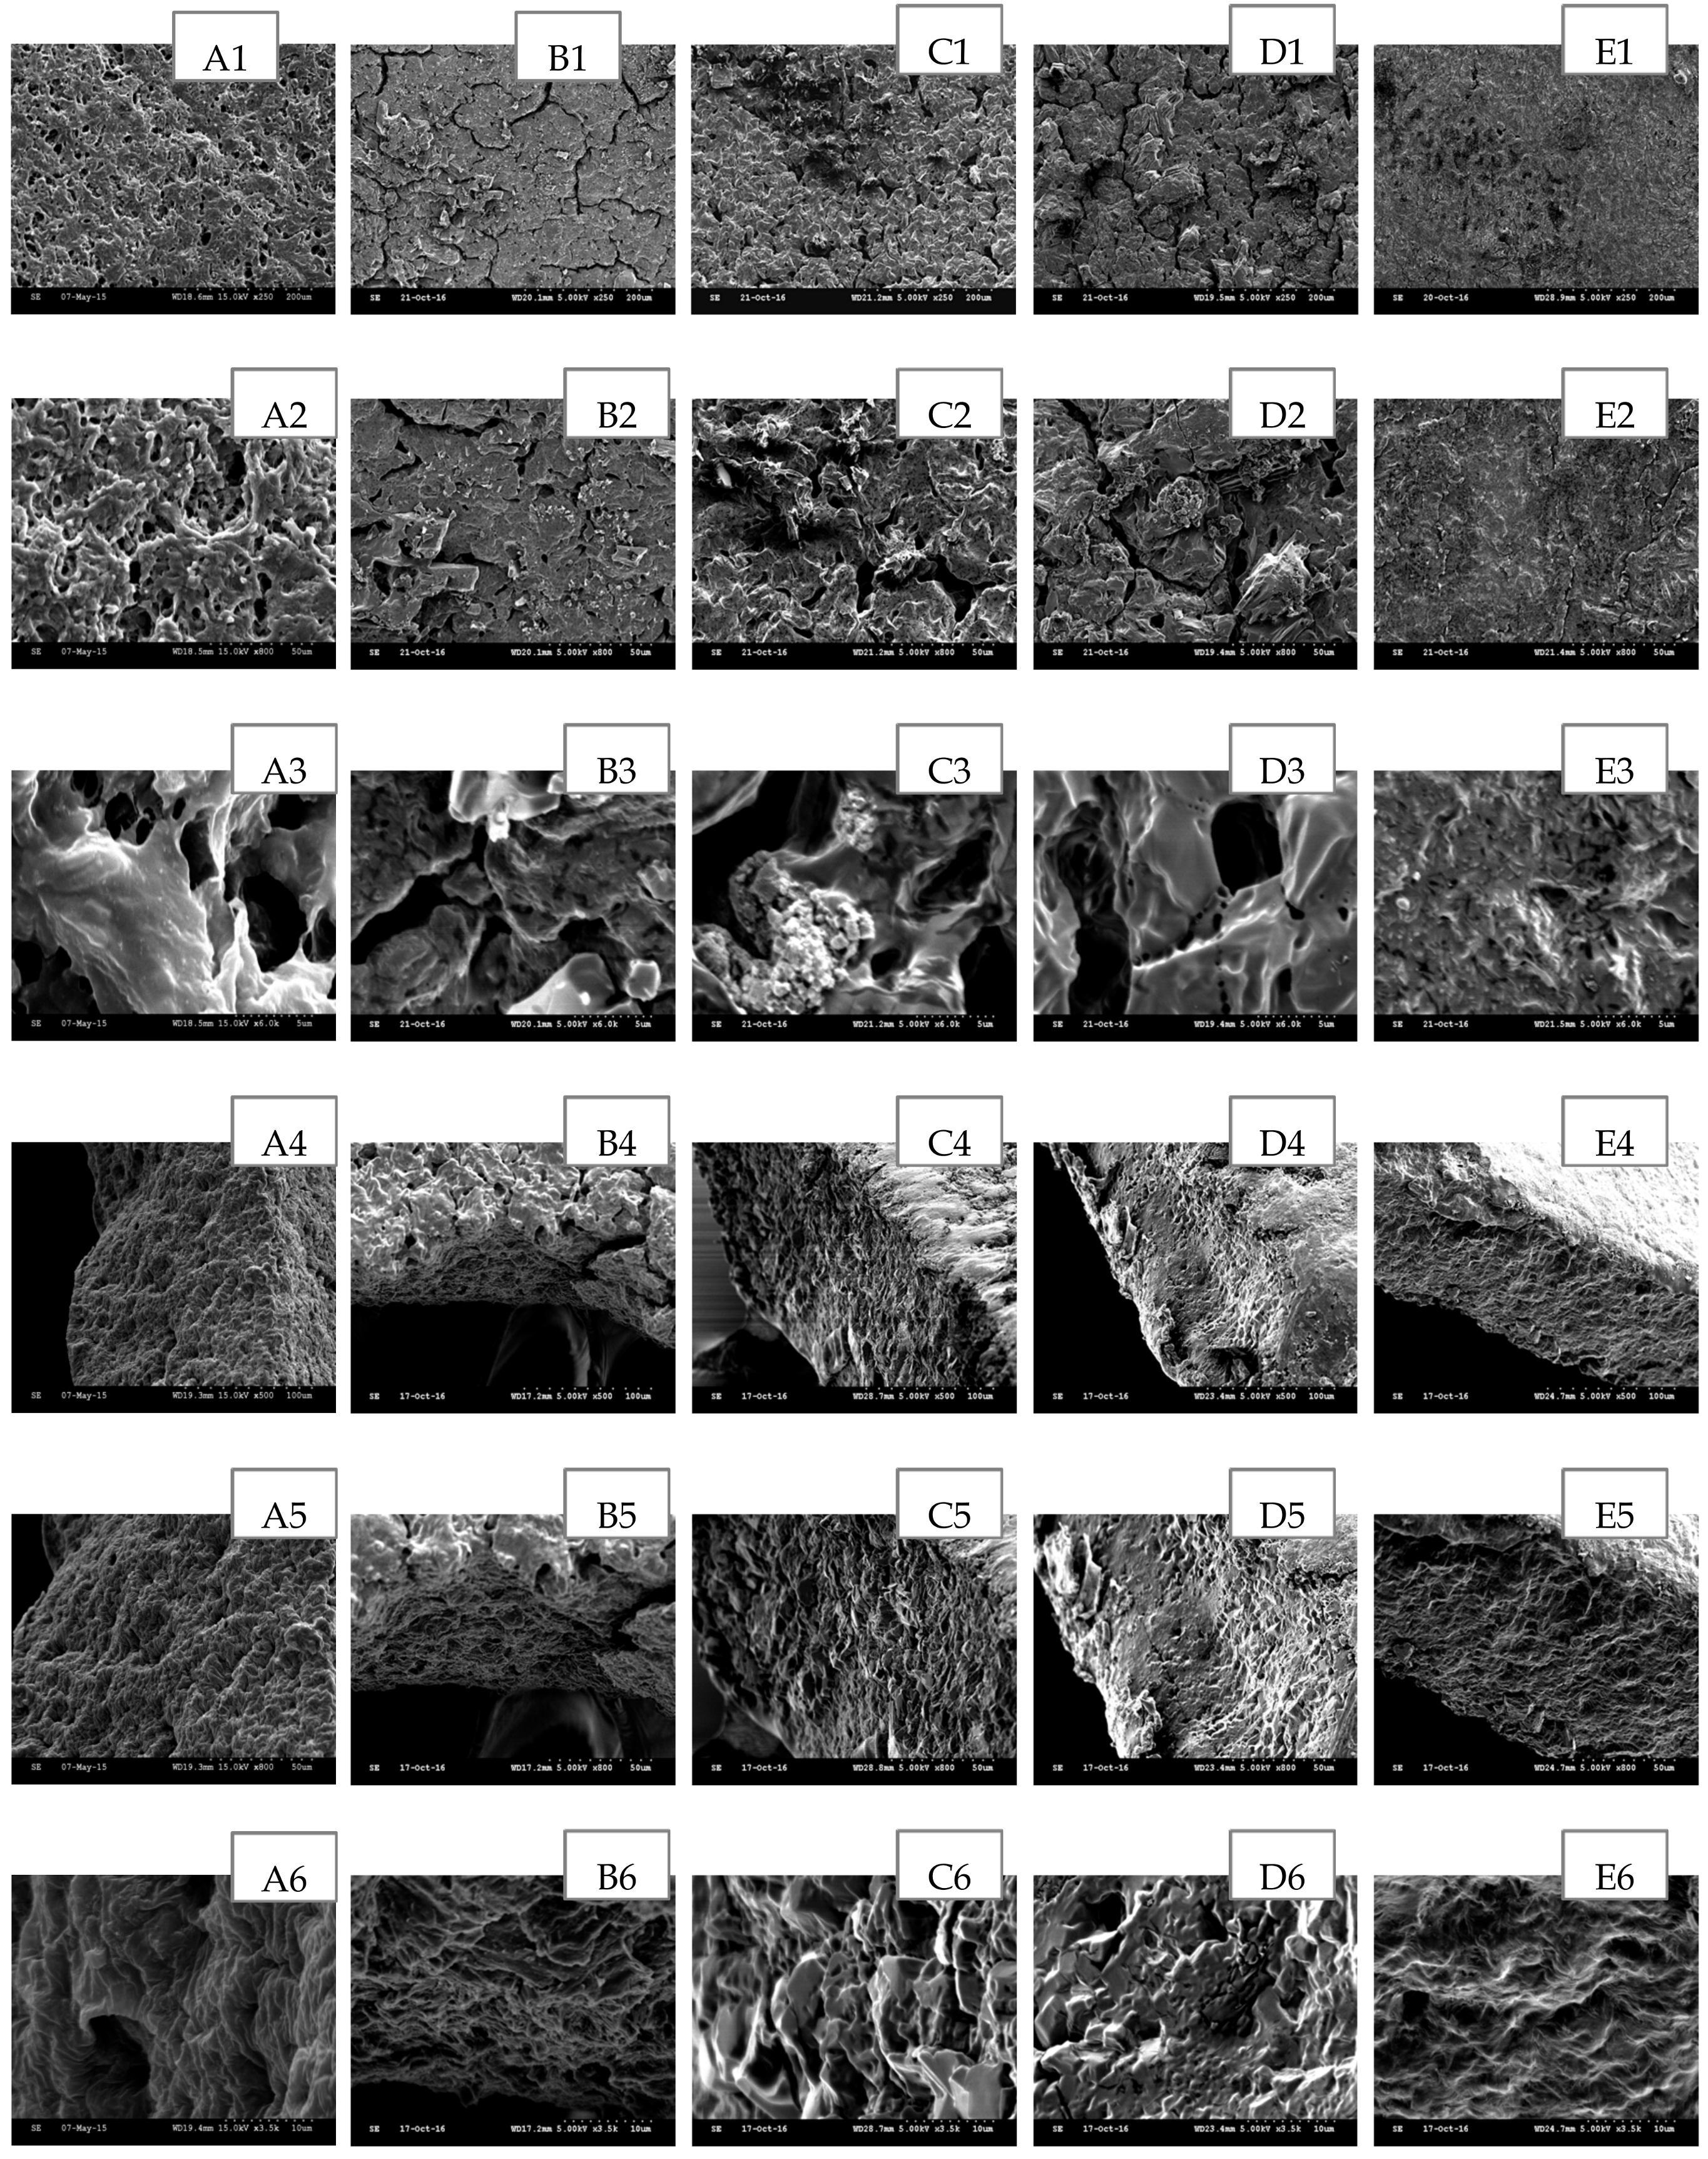
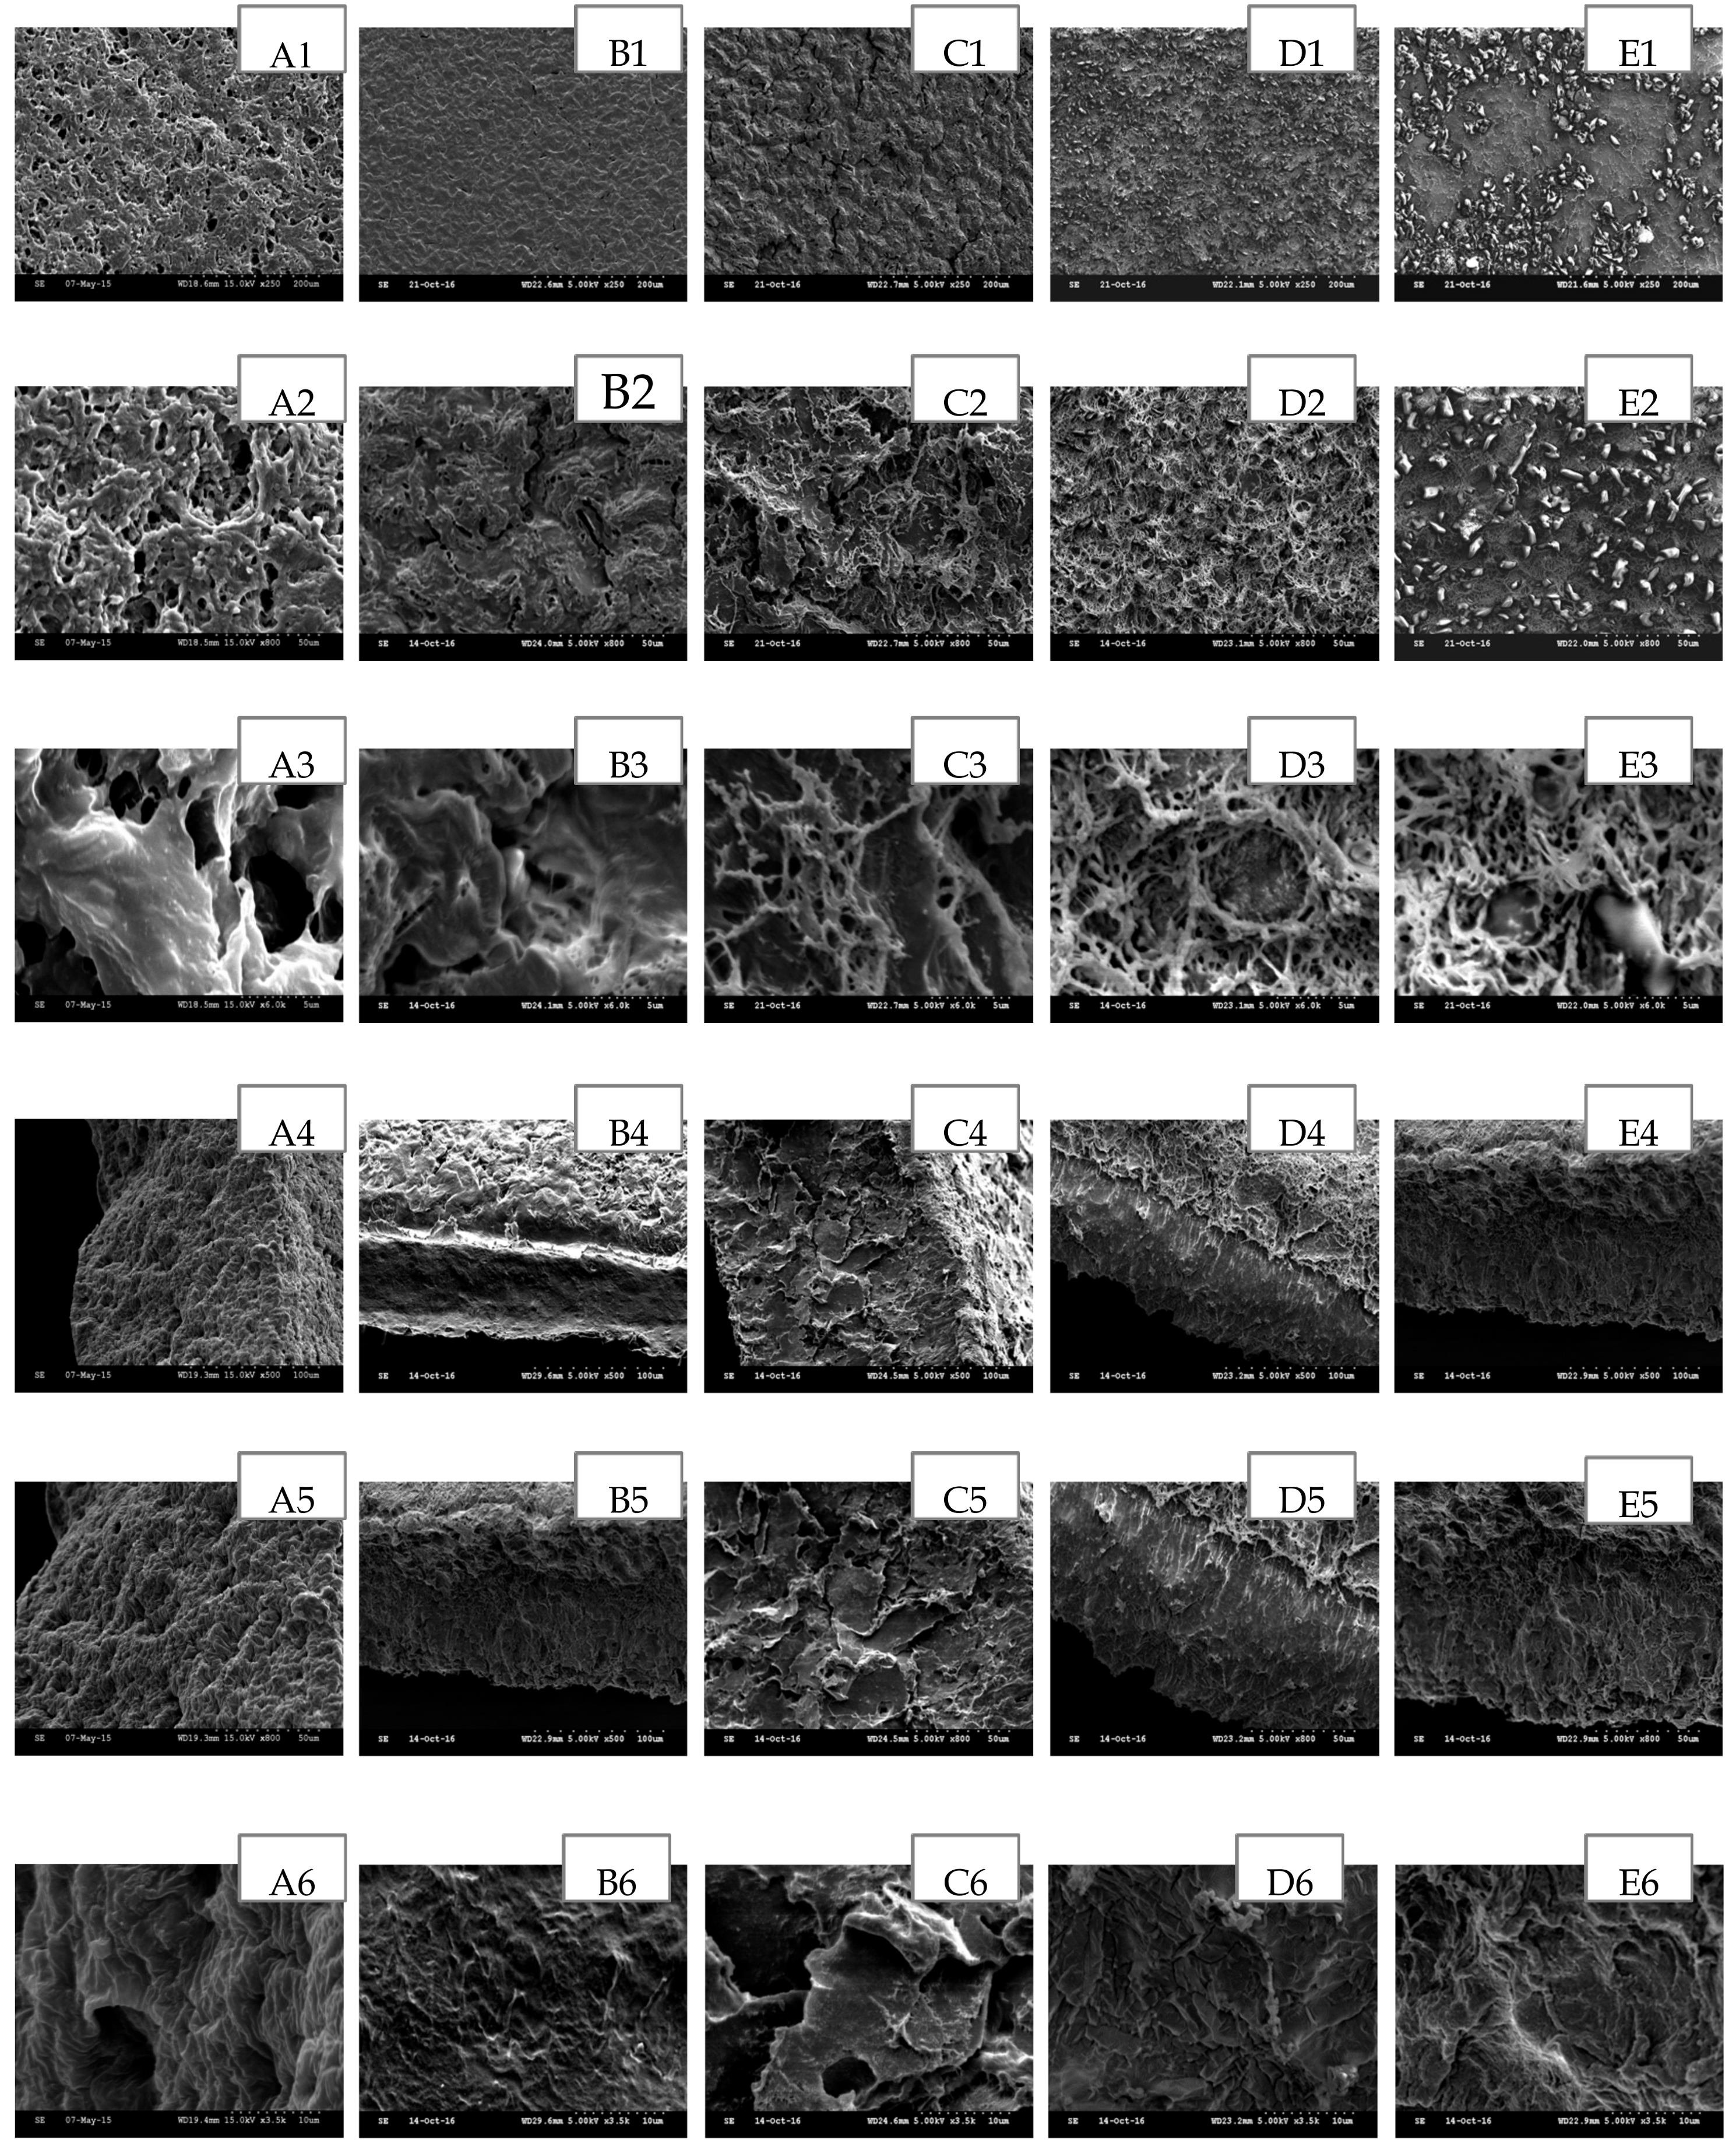
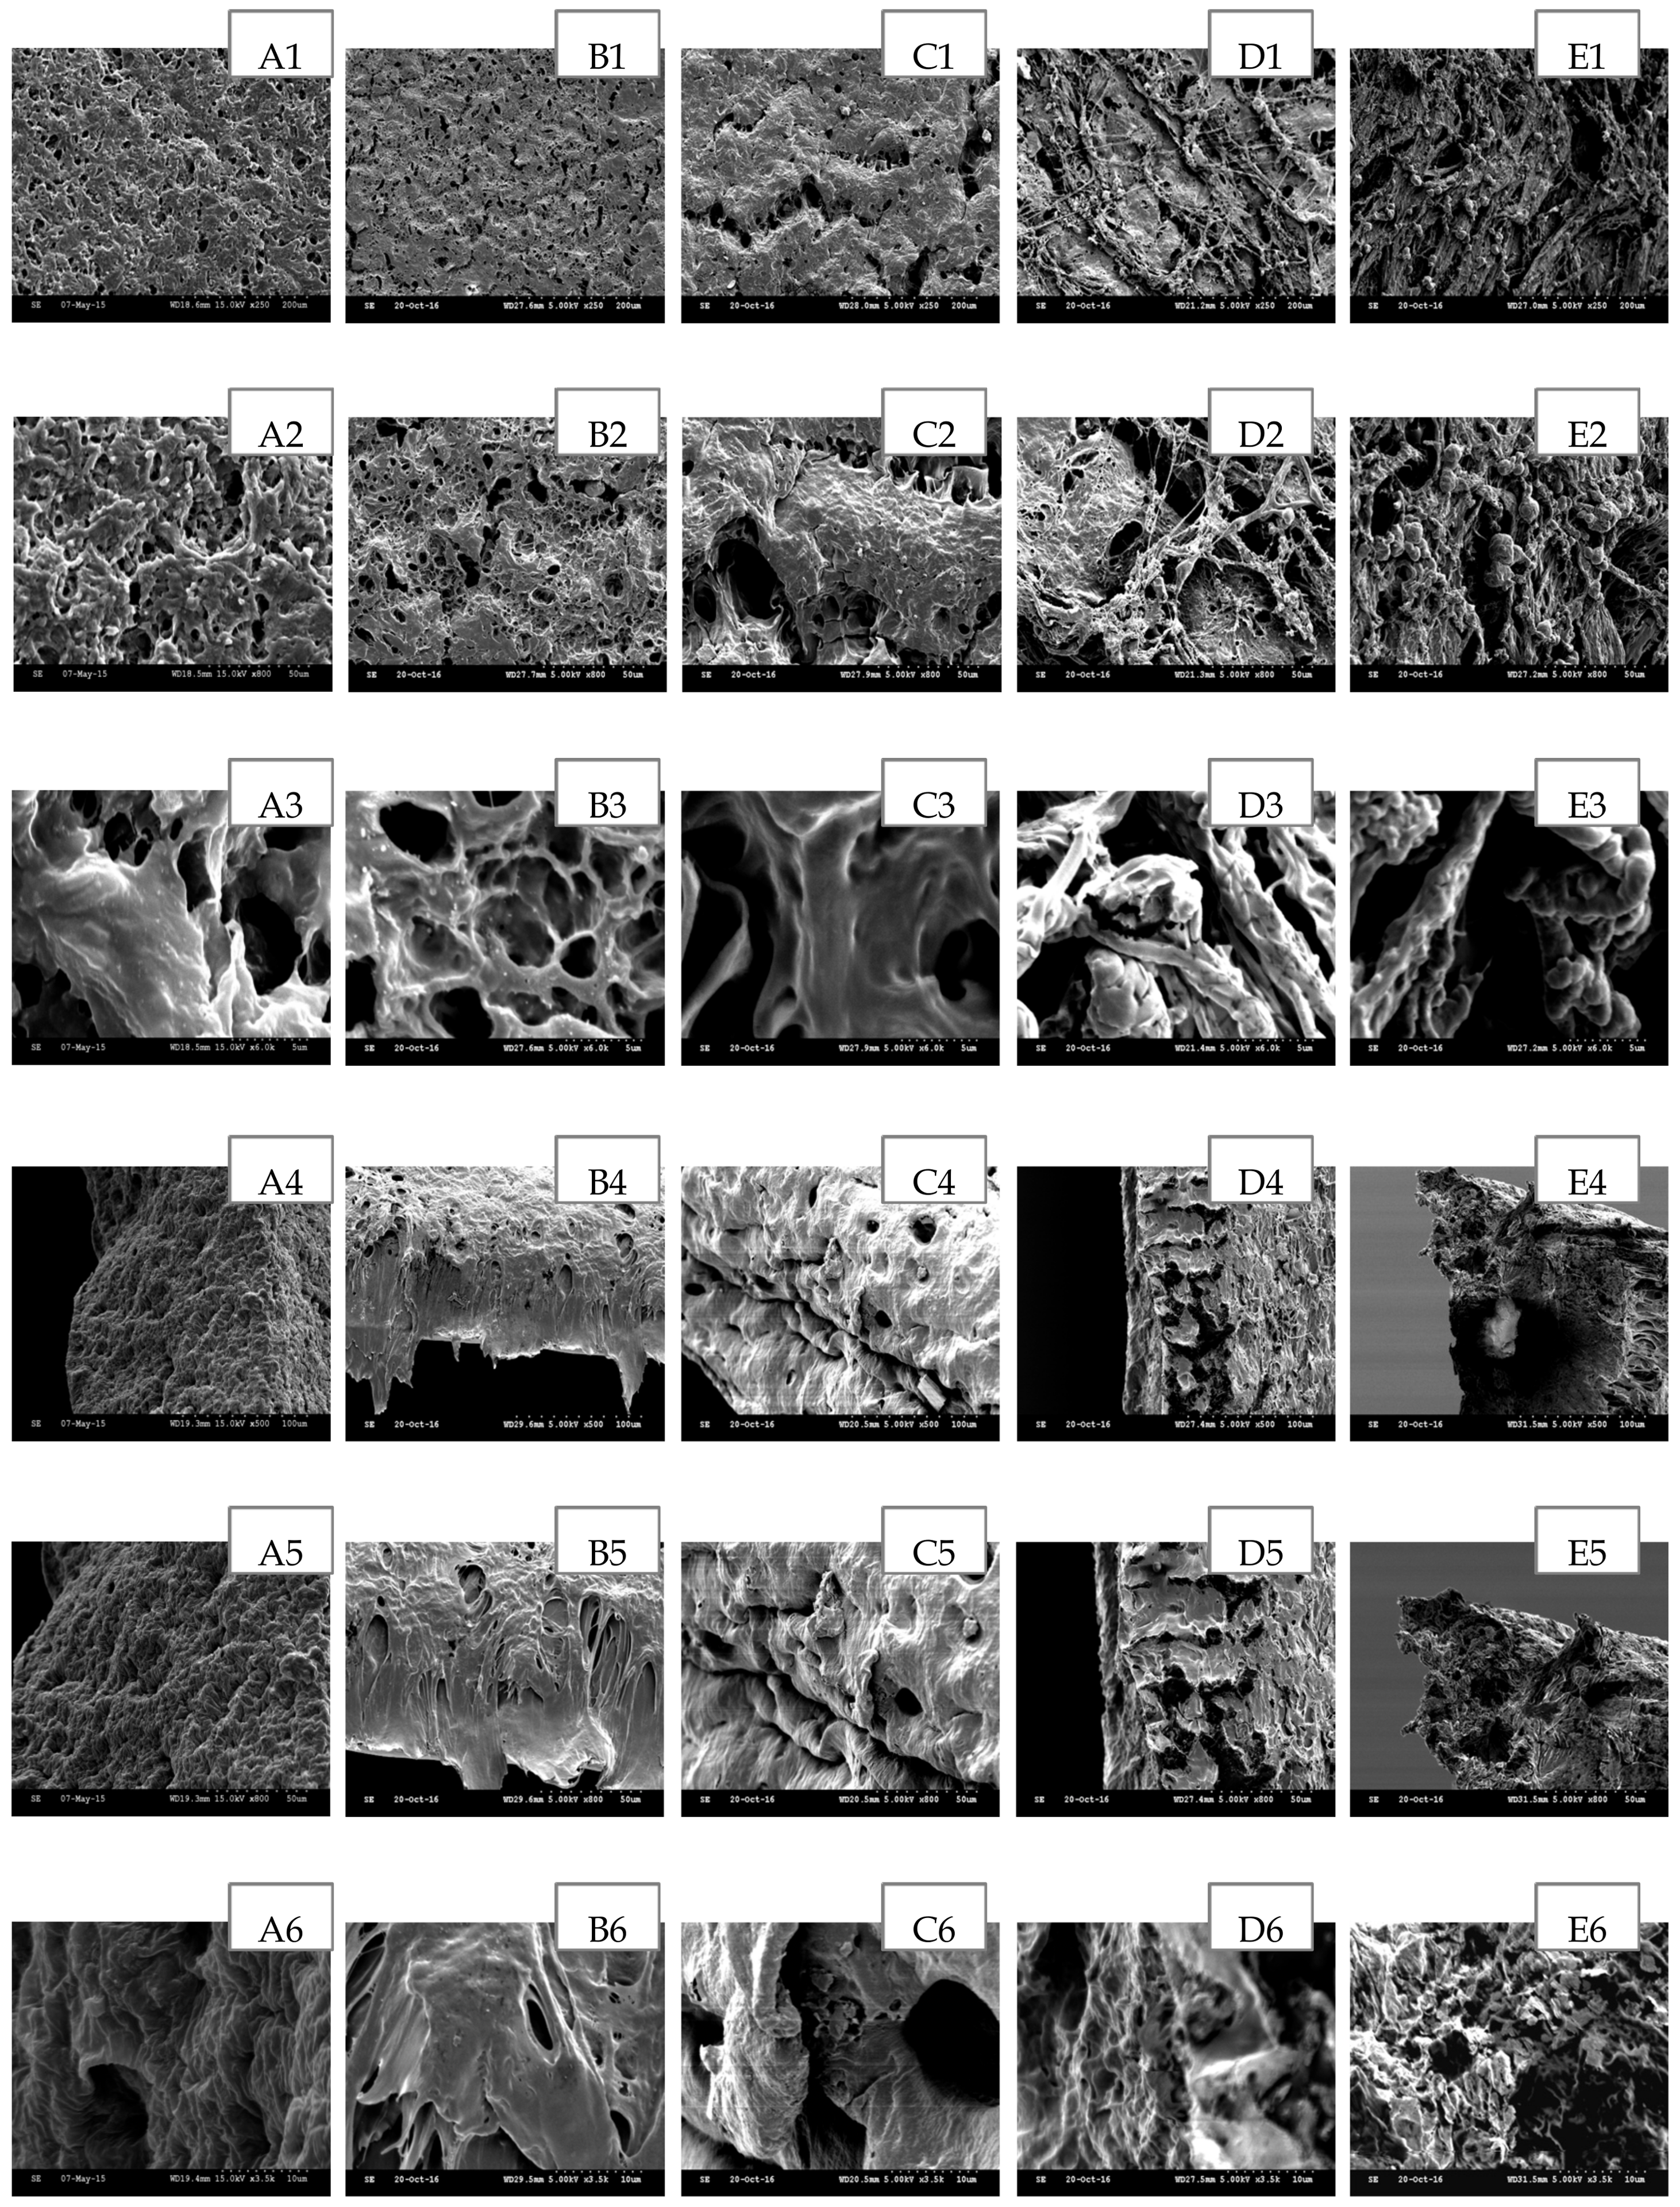
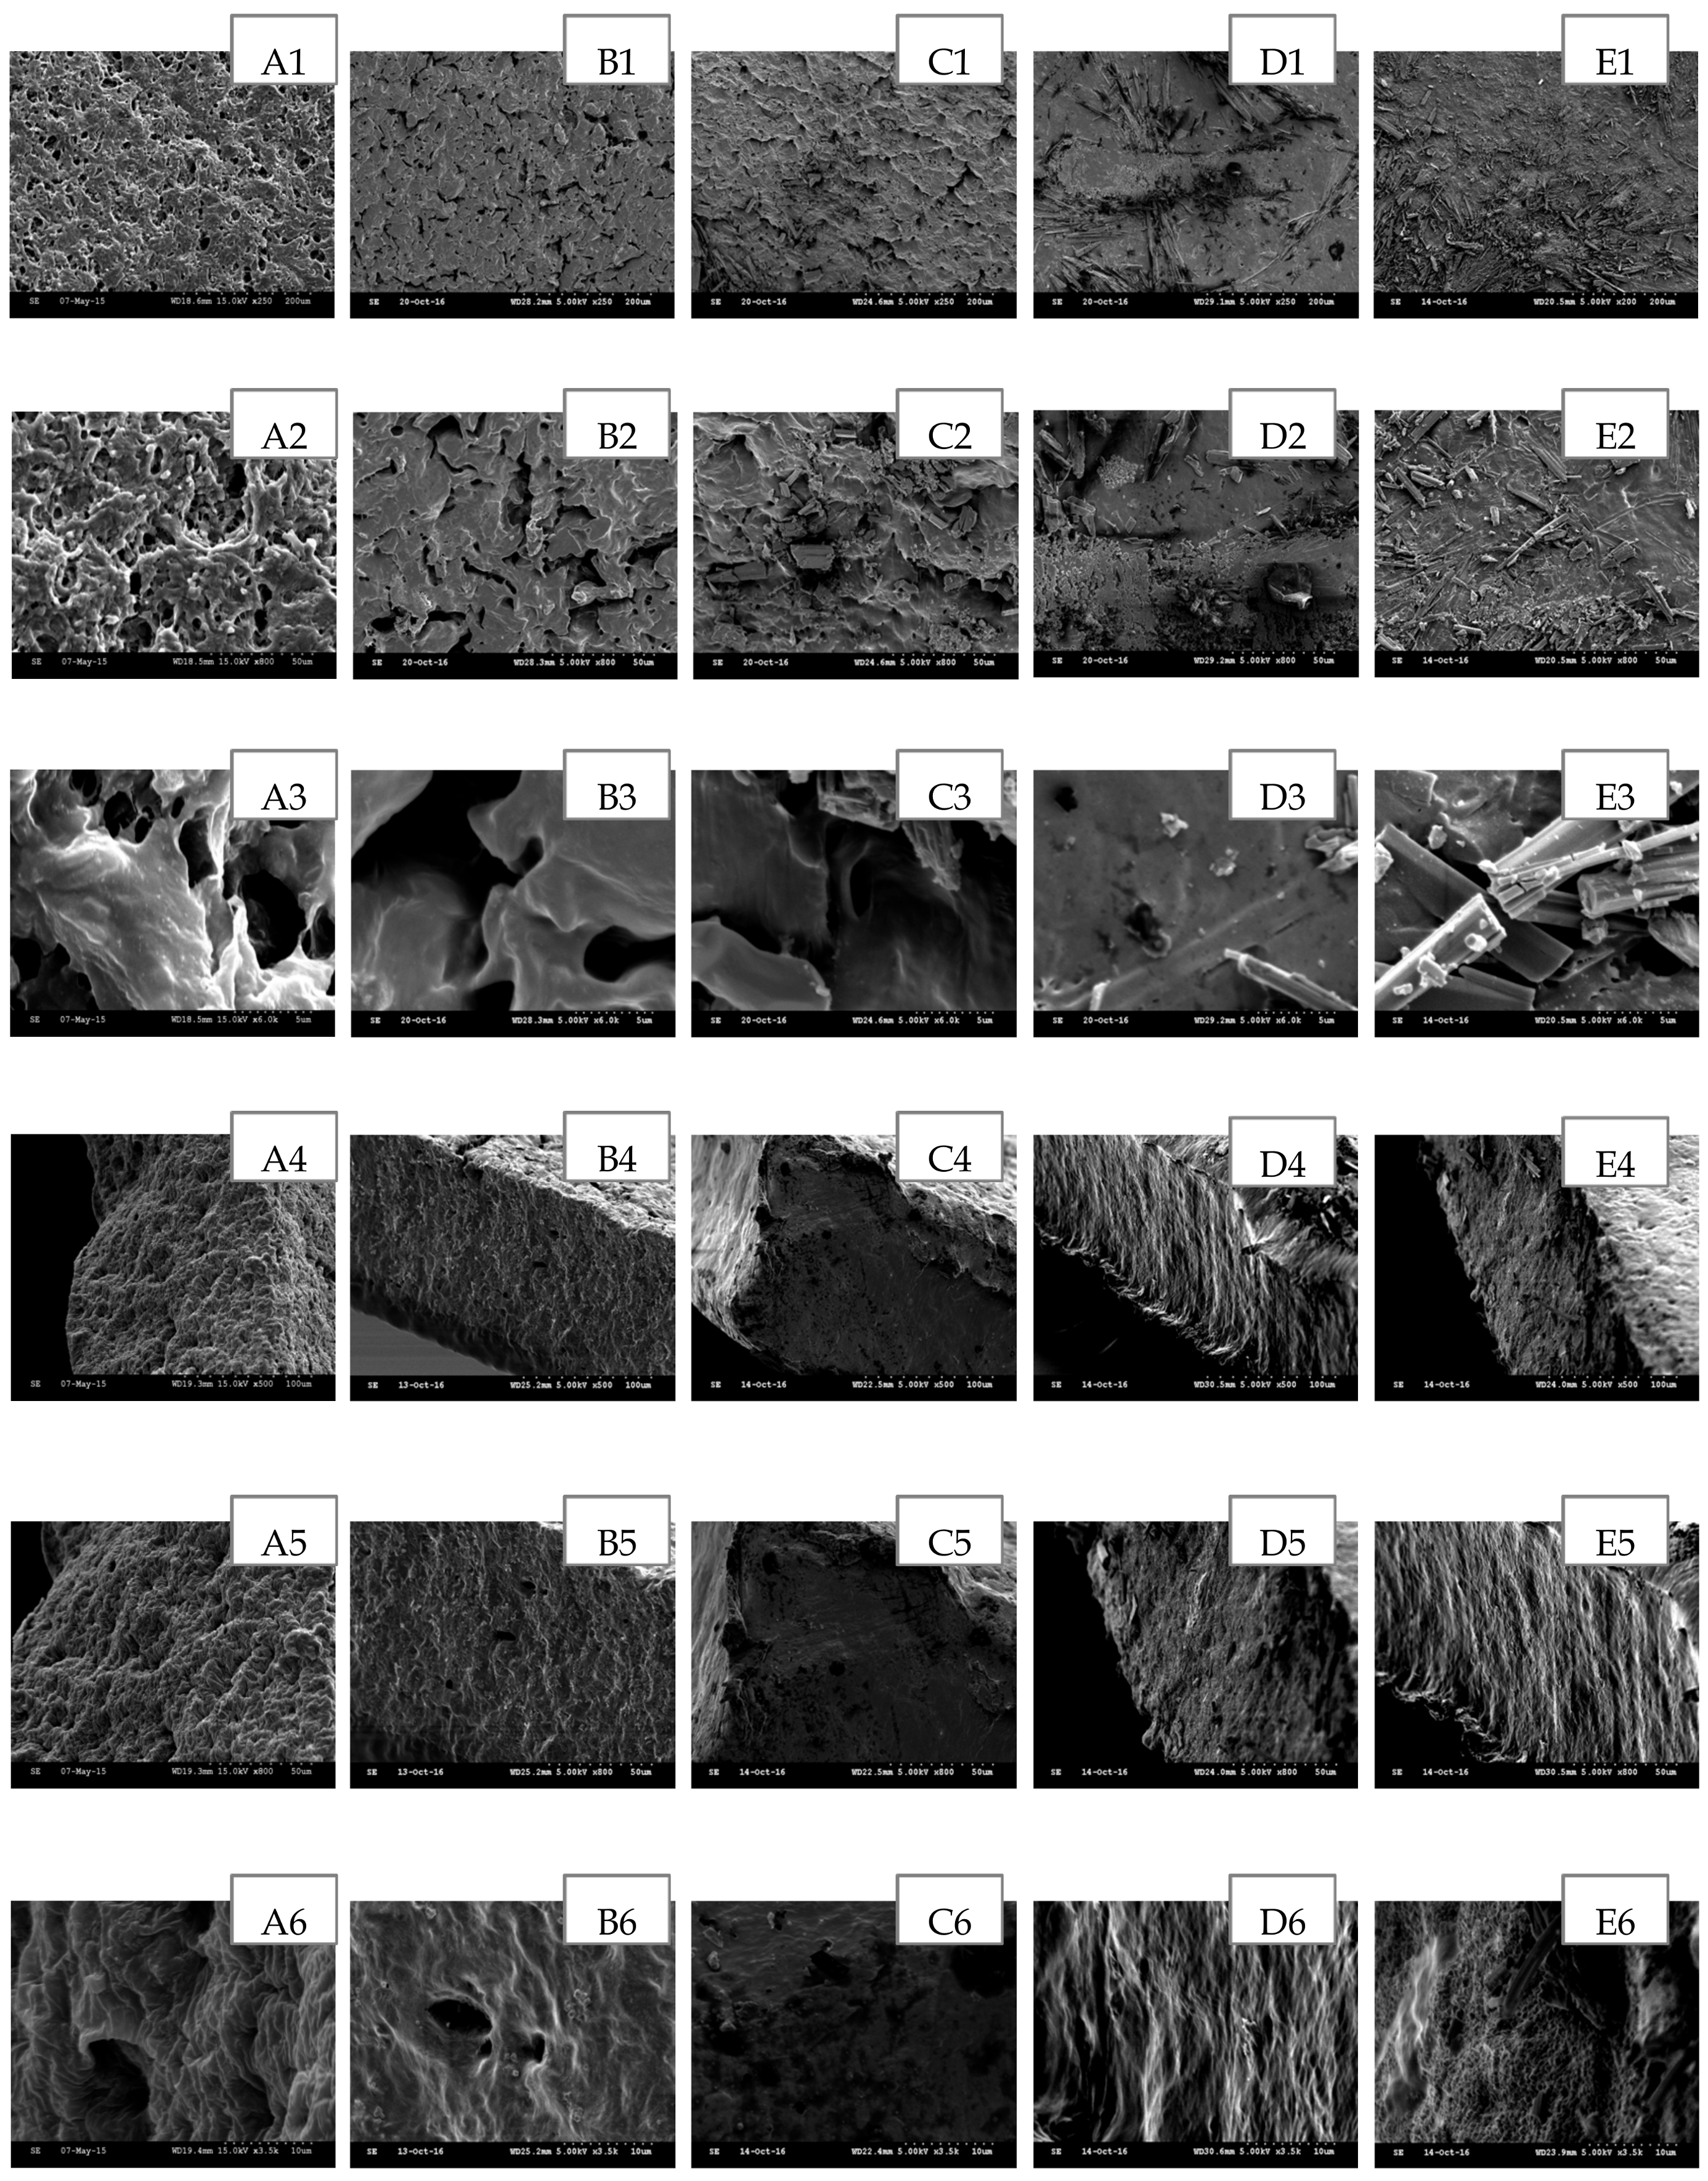
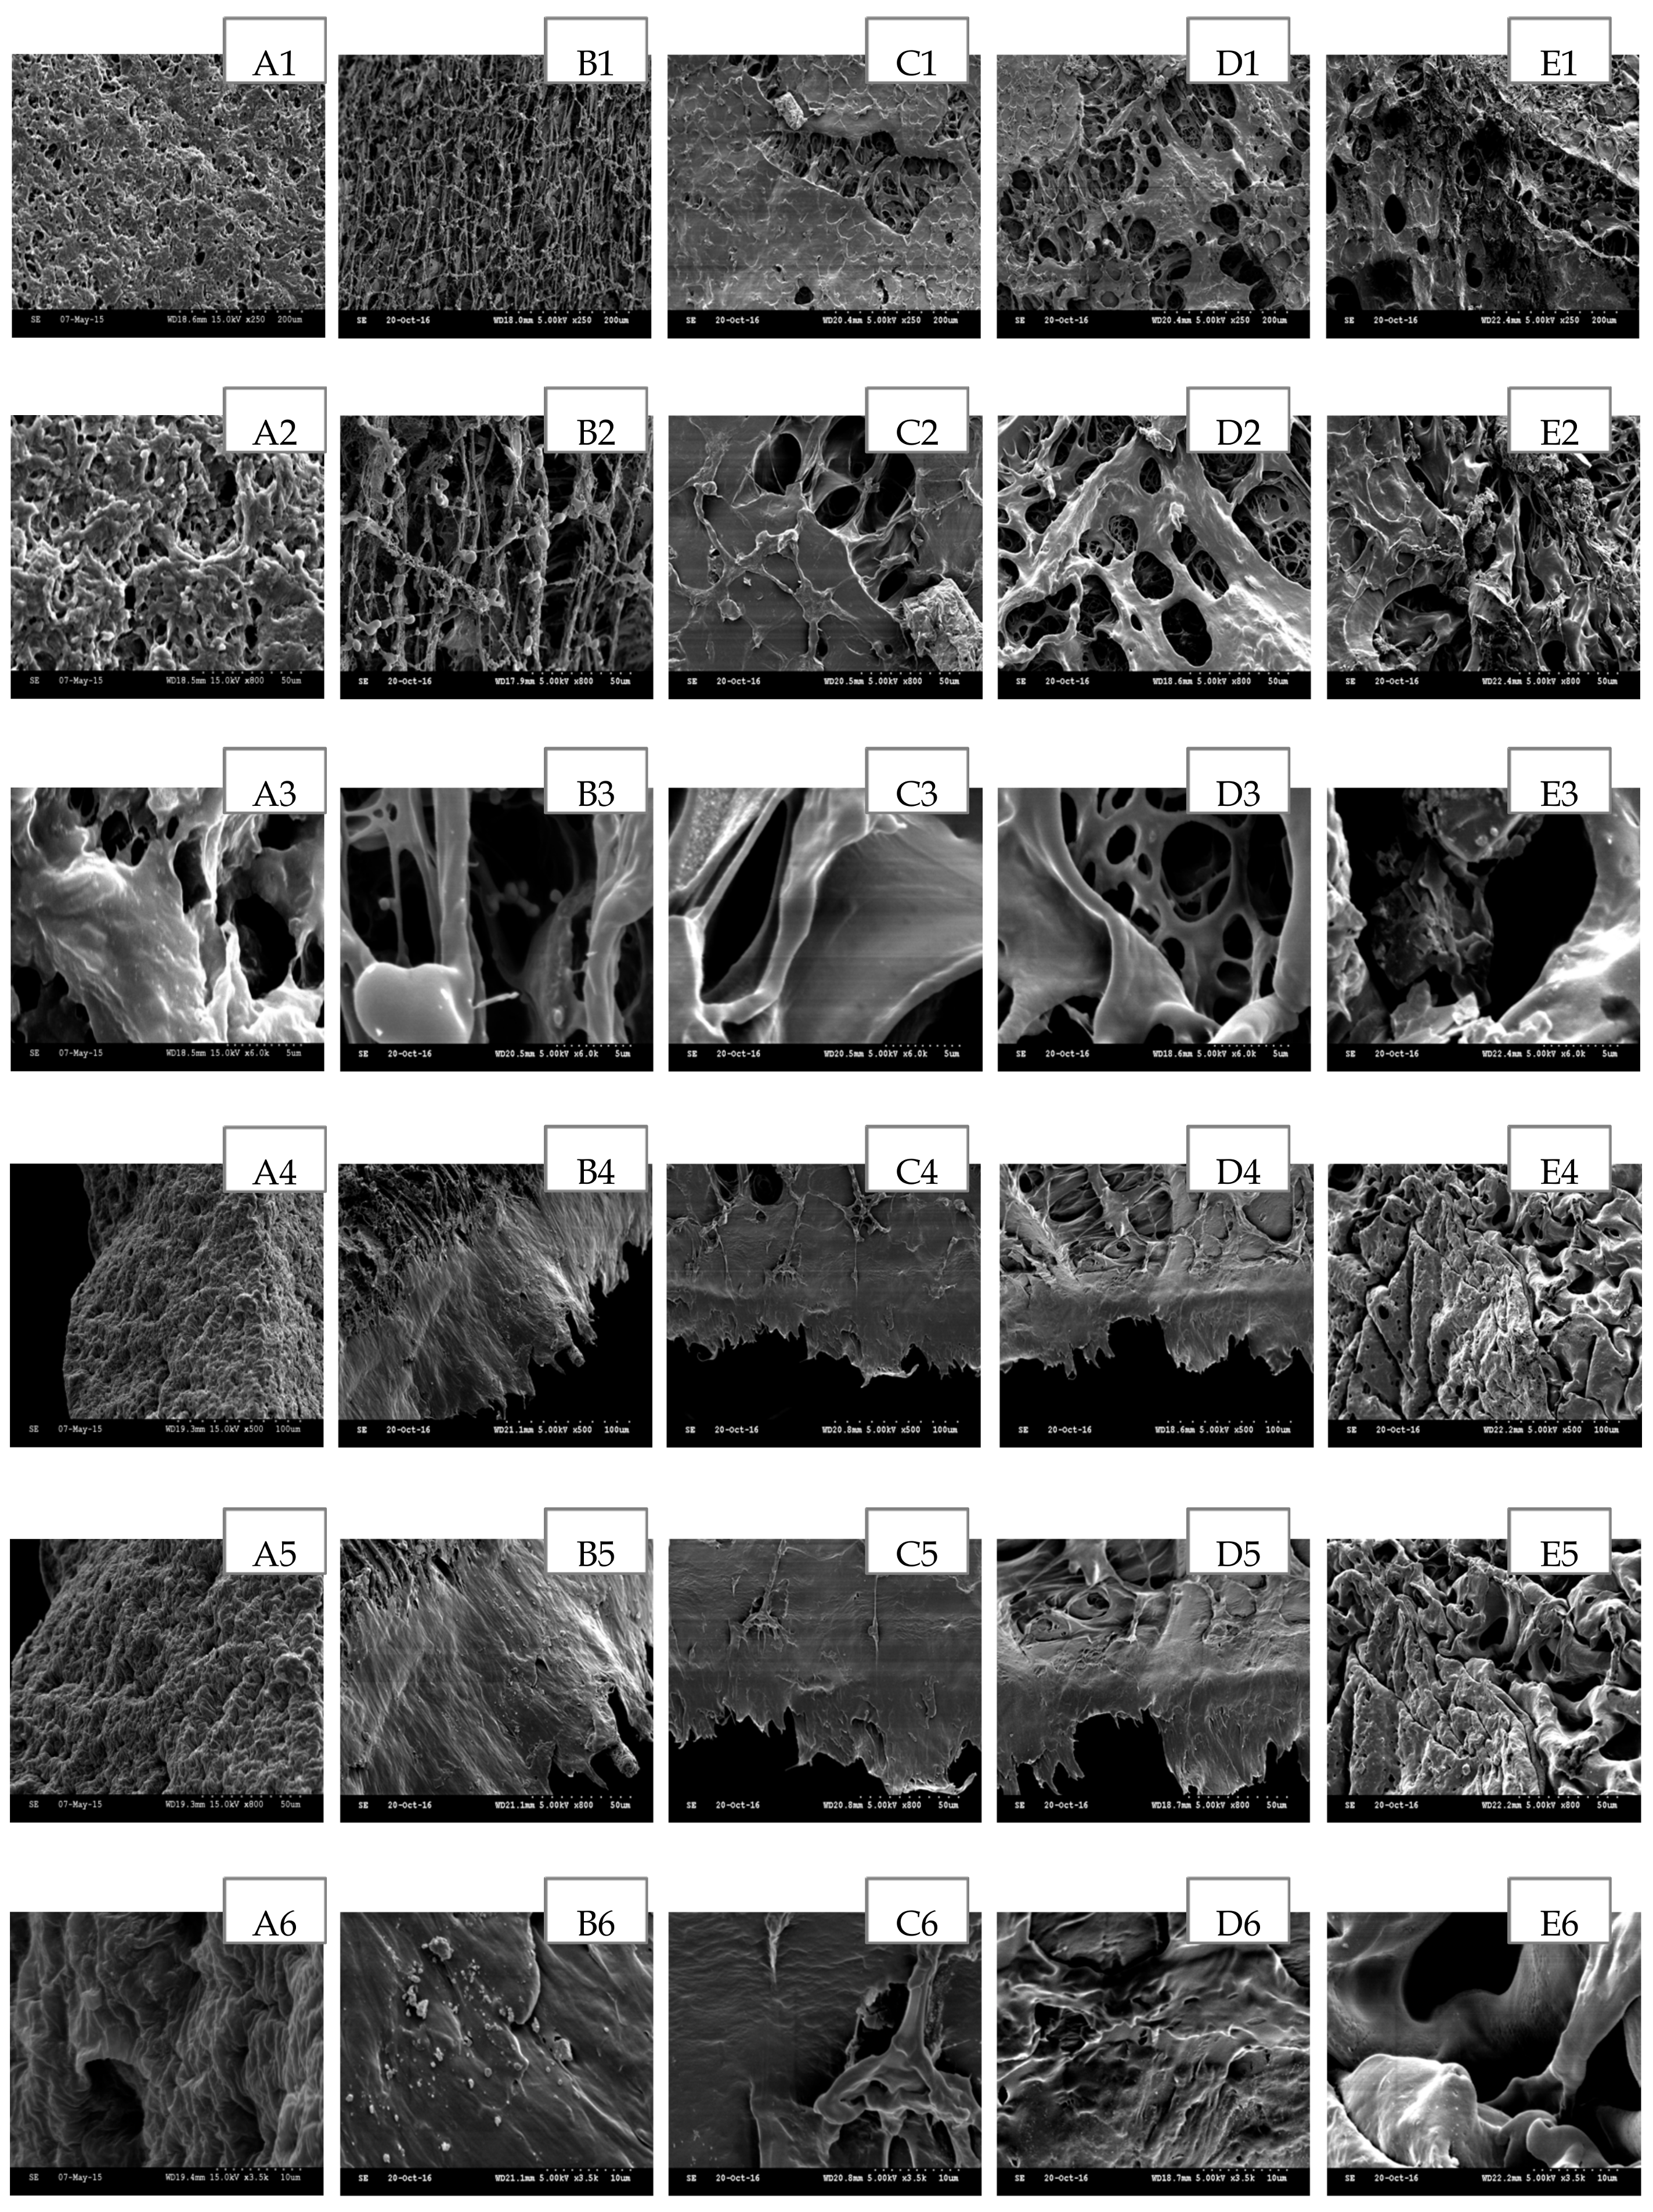
3.2. Effect of Loading Method and Drug Physicochemical Properties on the Morphology Characteristics
3.3. Effect of Drug Physicochemical Properties on the Swelling Properties of In Situ Loaded Hydrogels
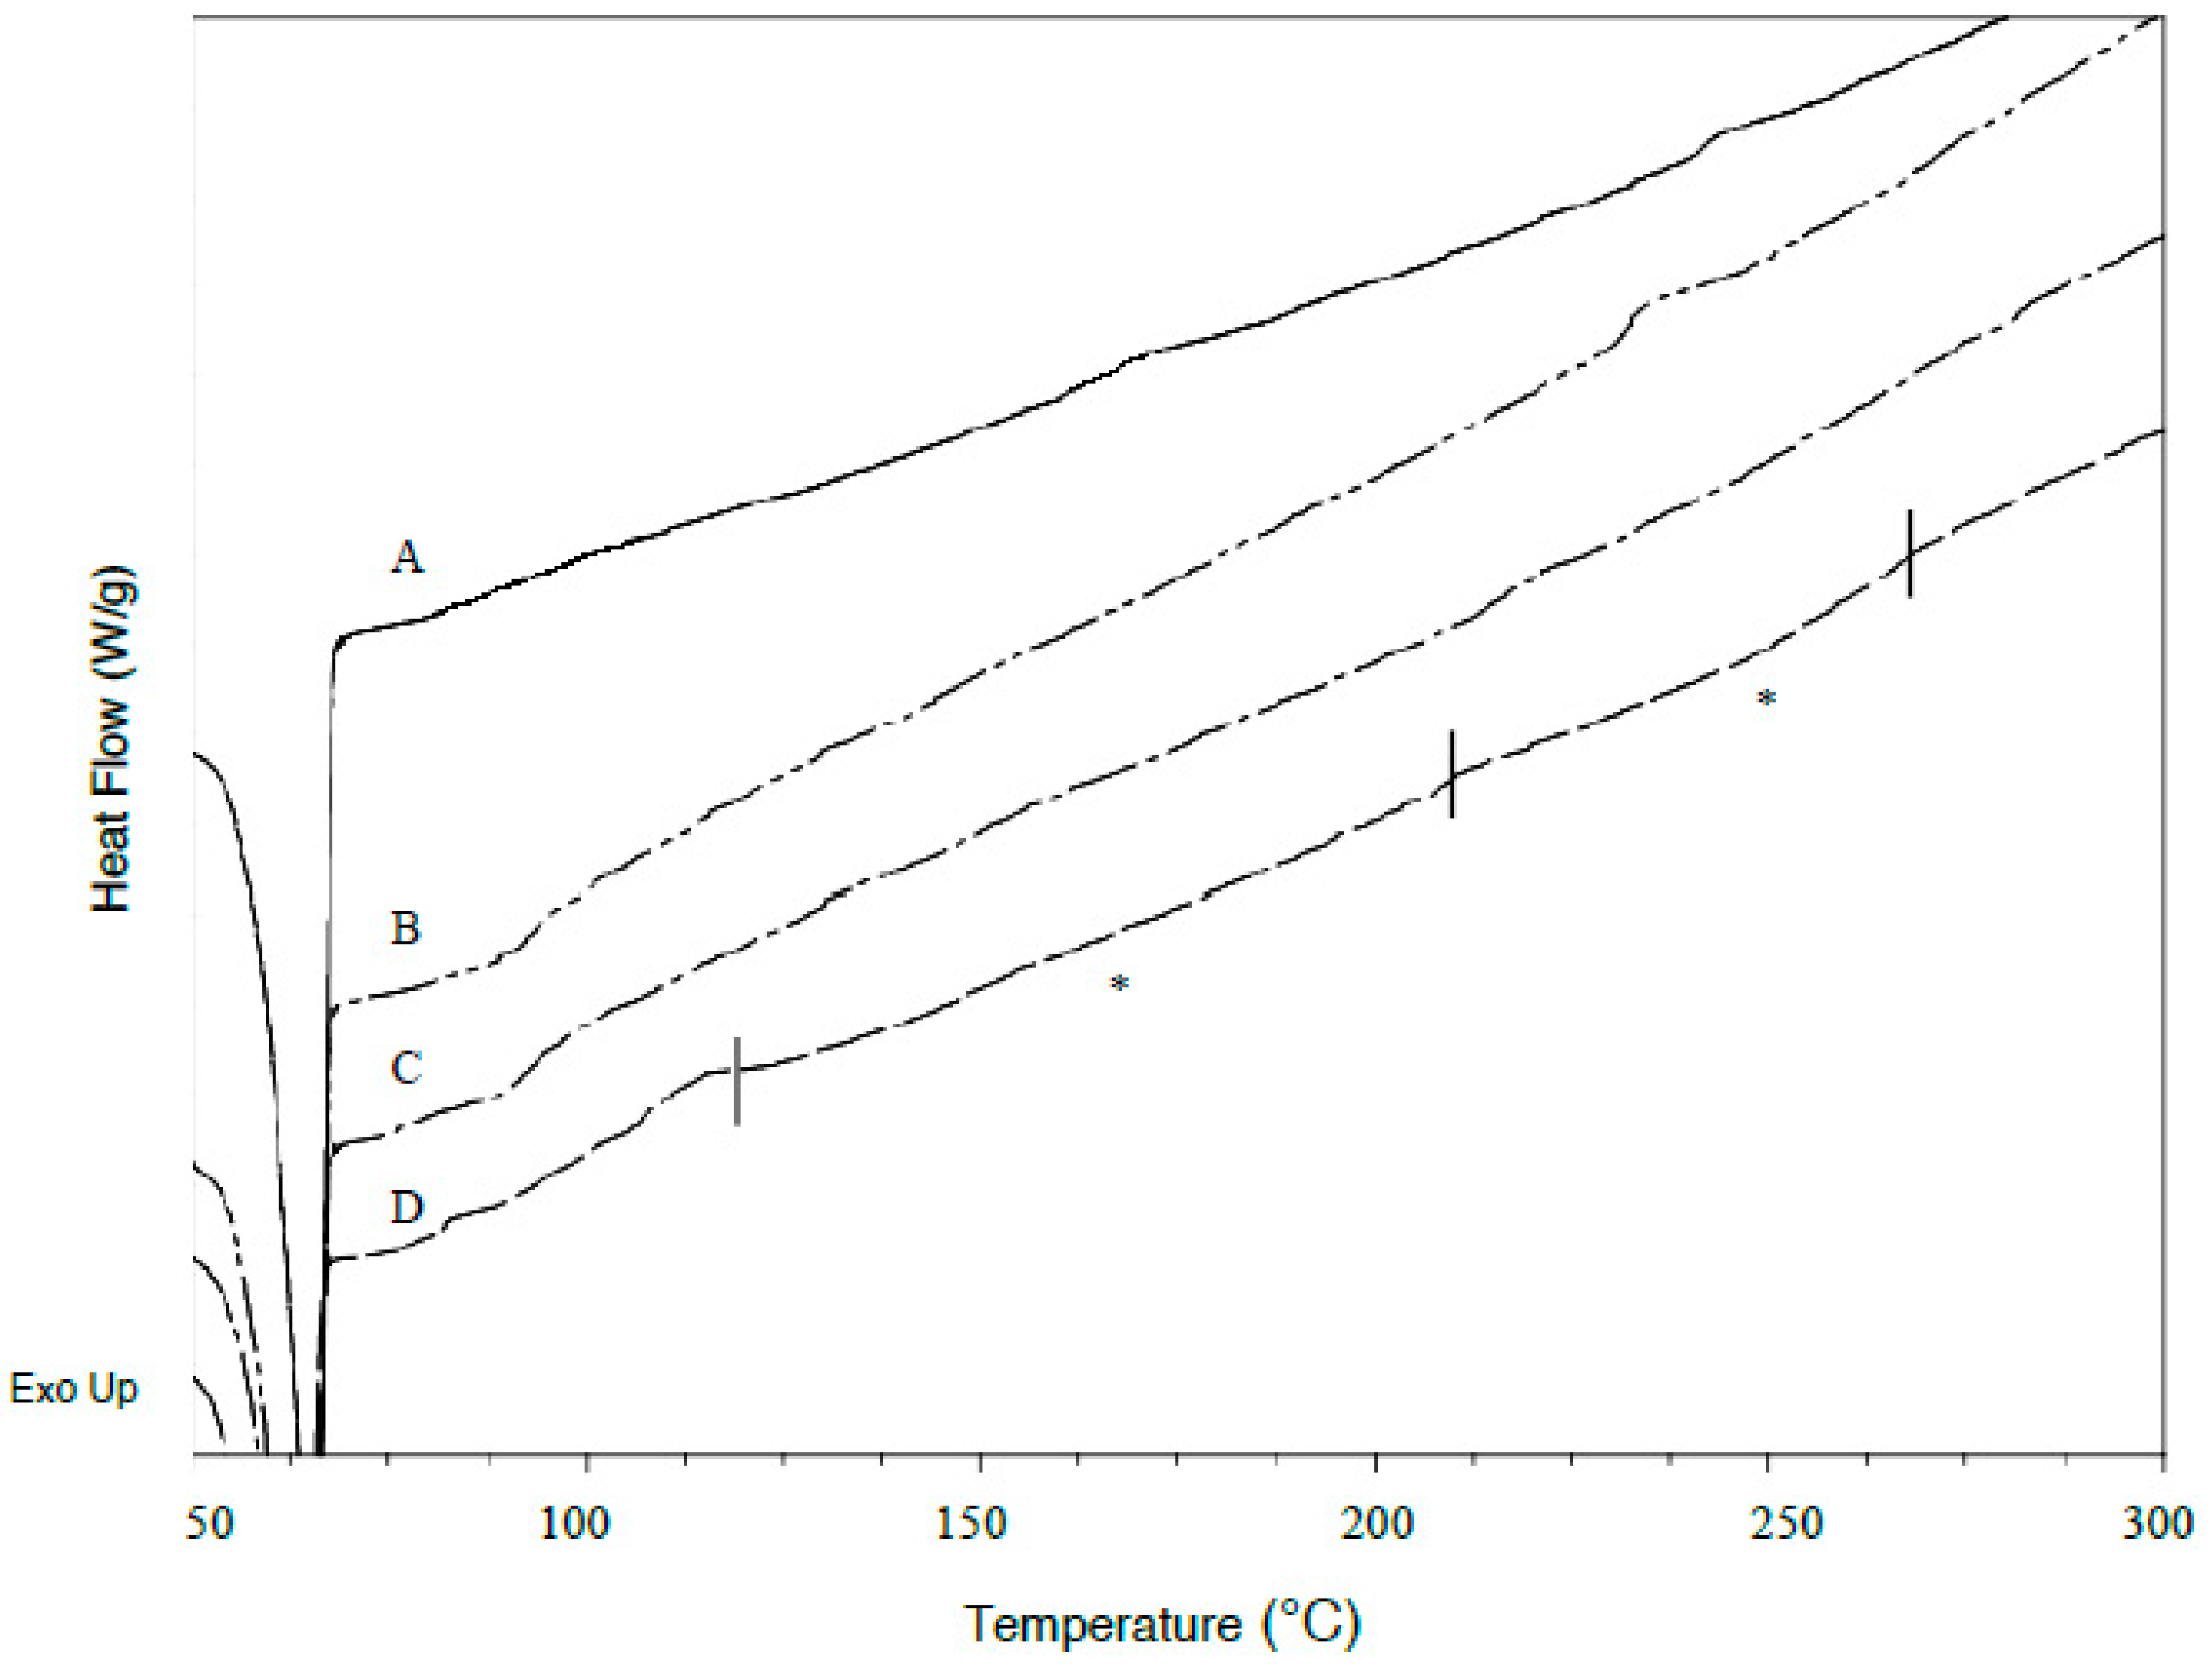
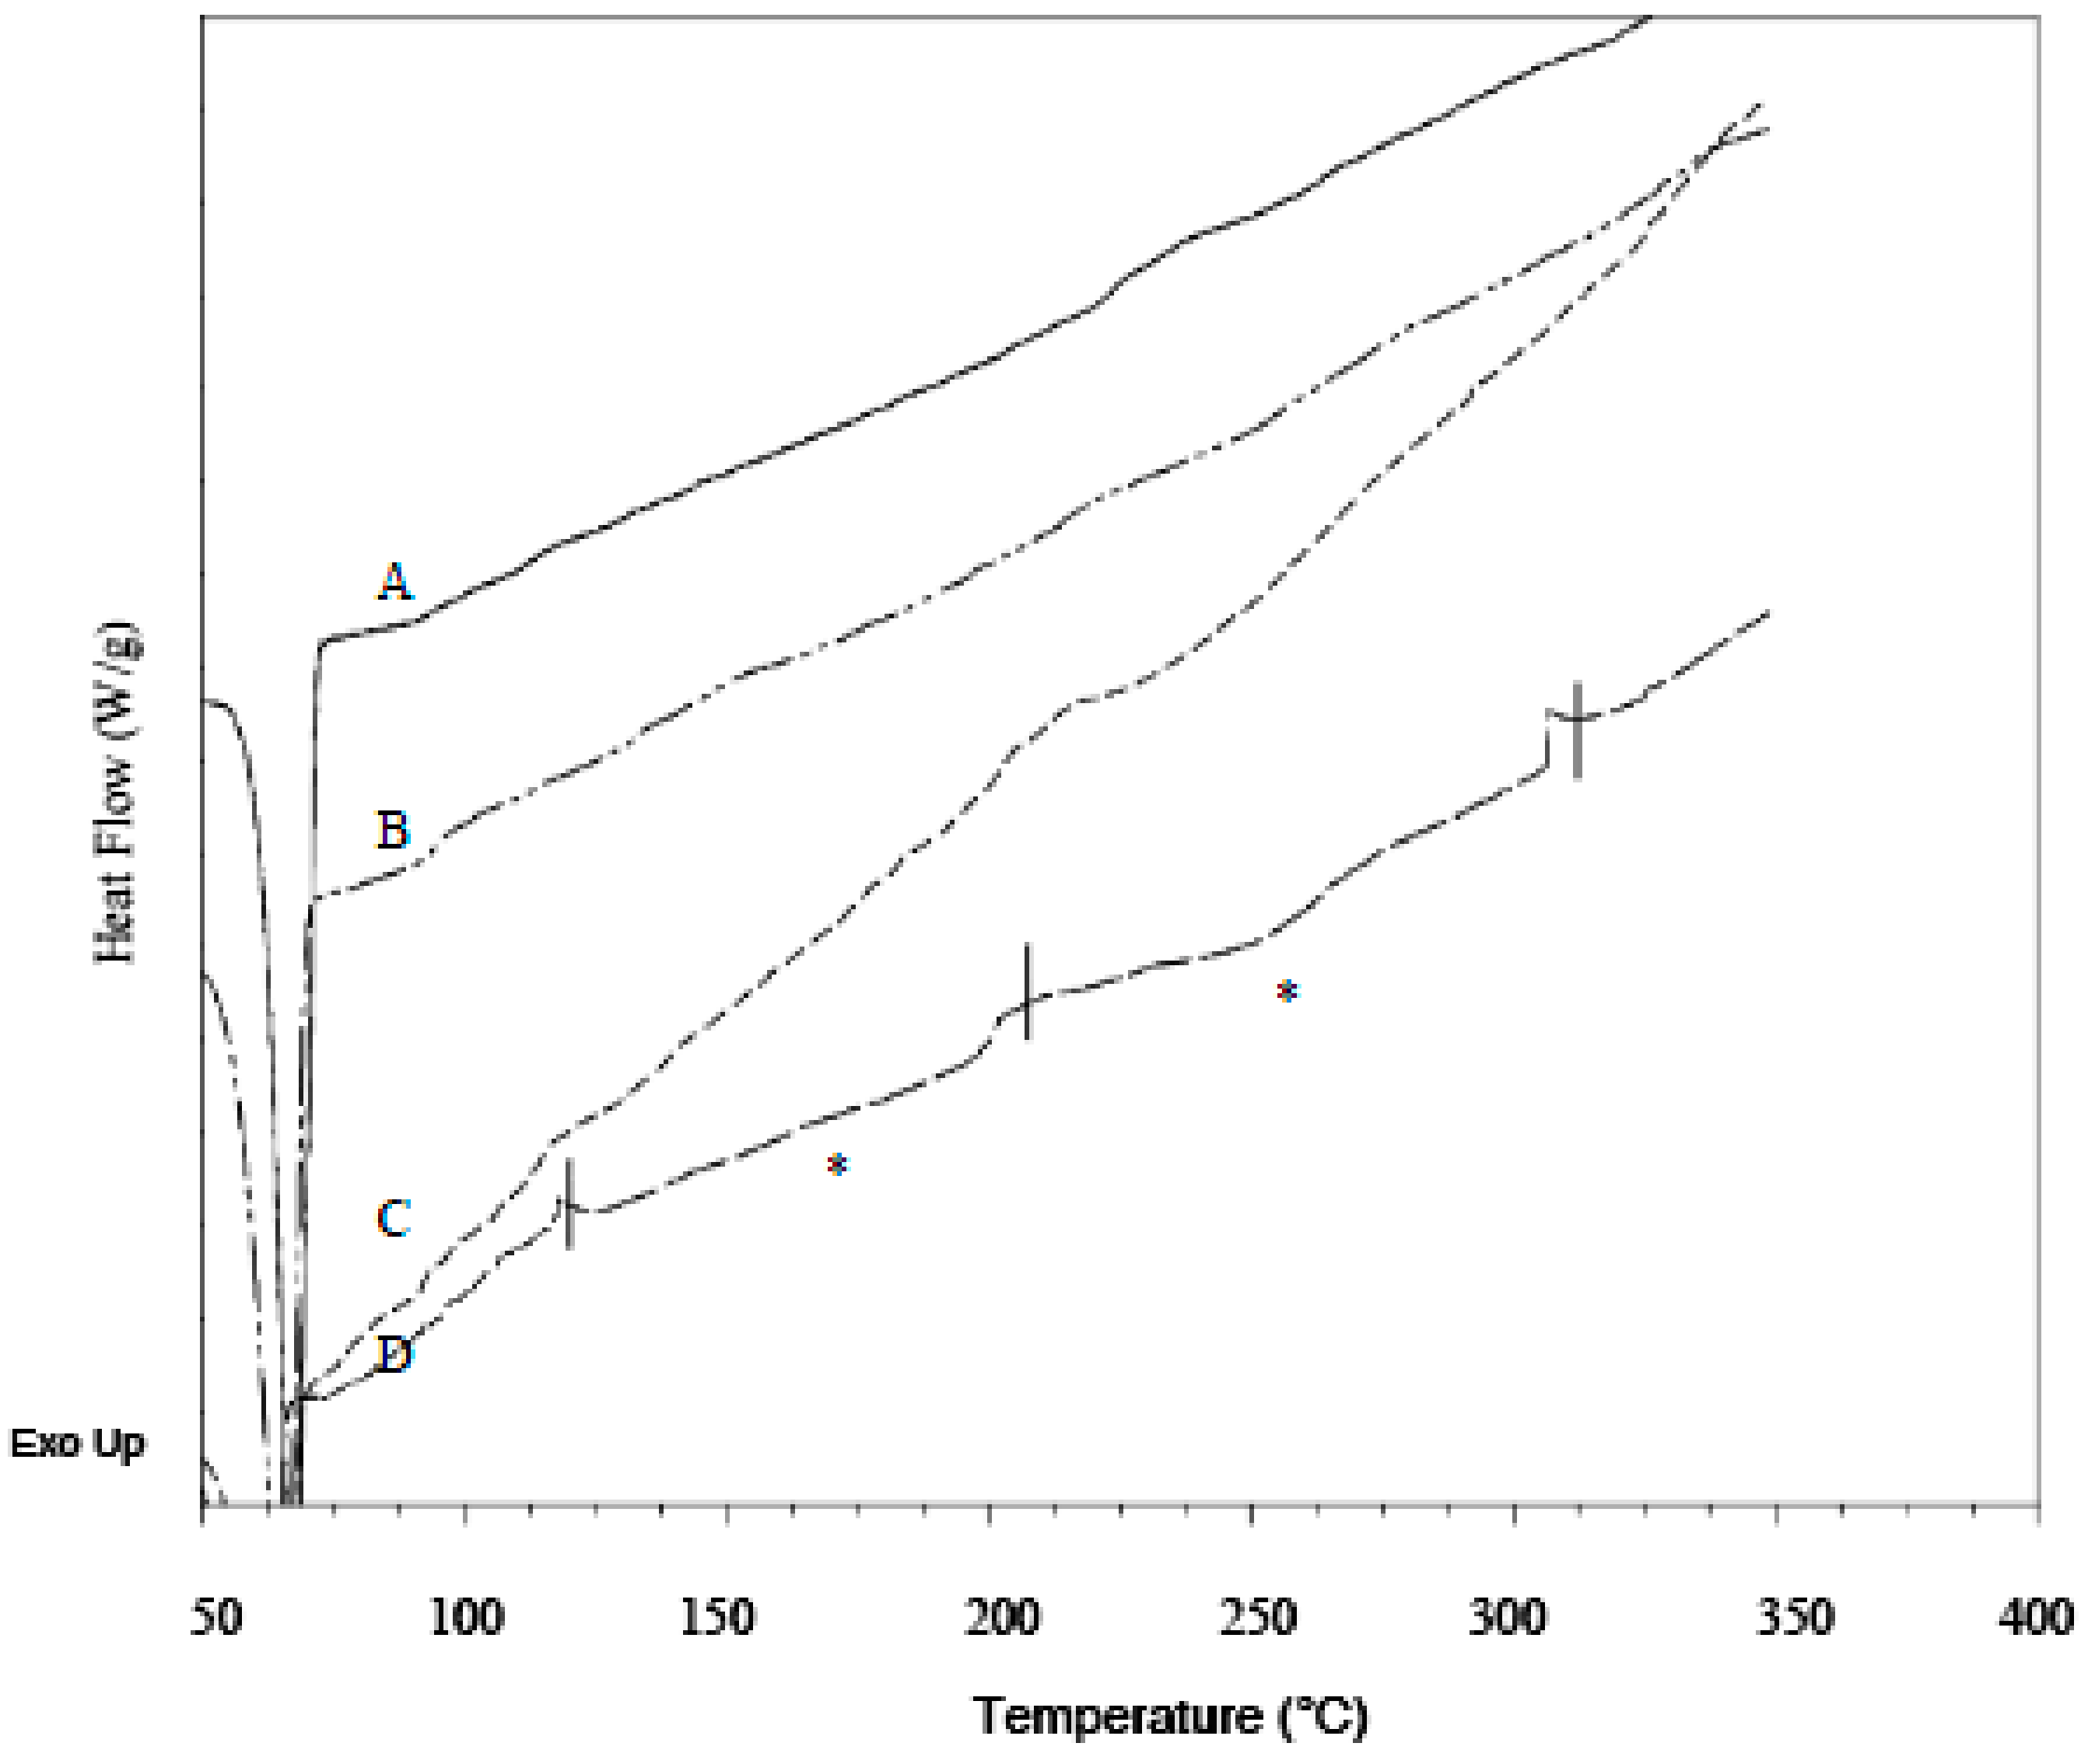
3.4. DSC Analysis
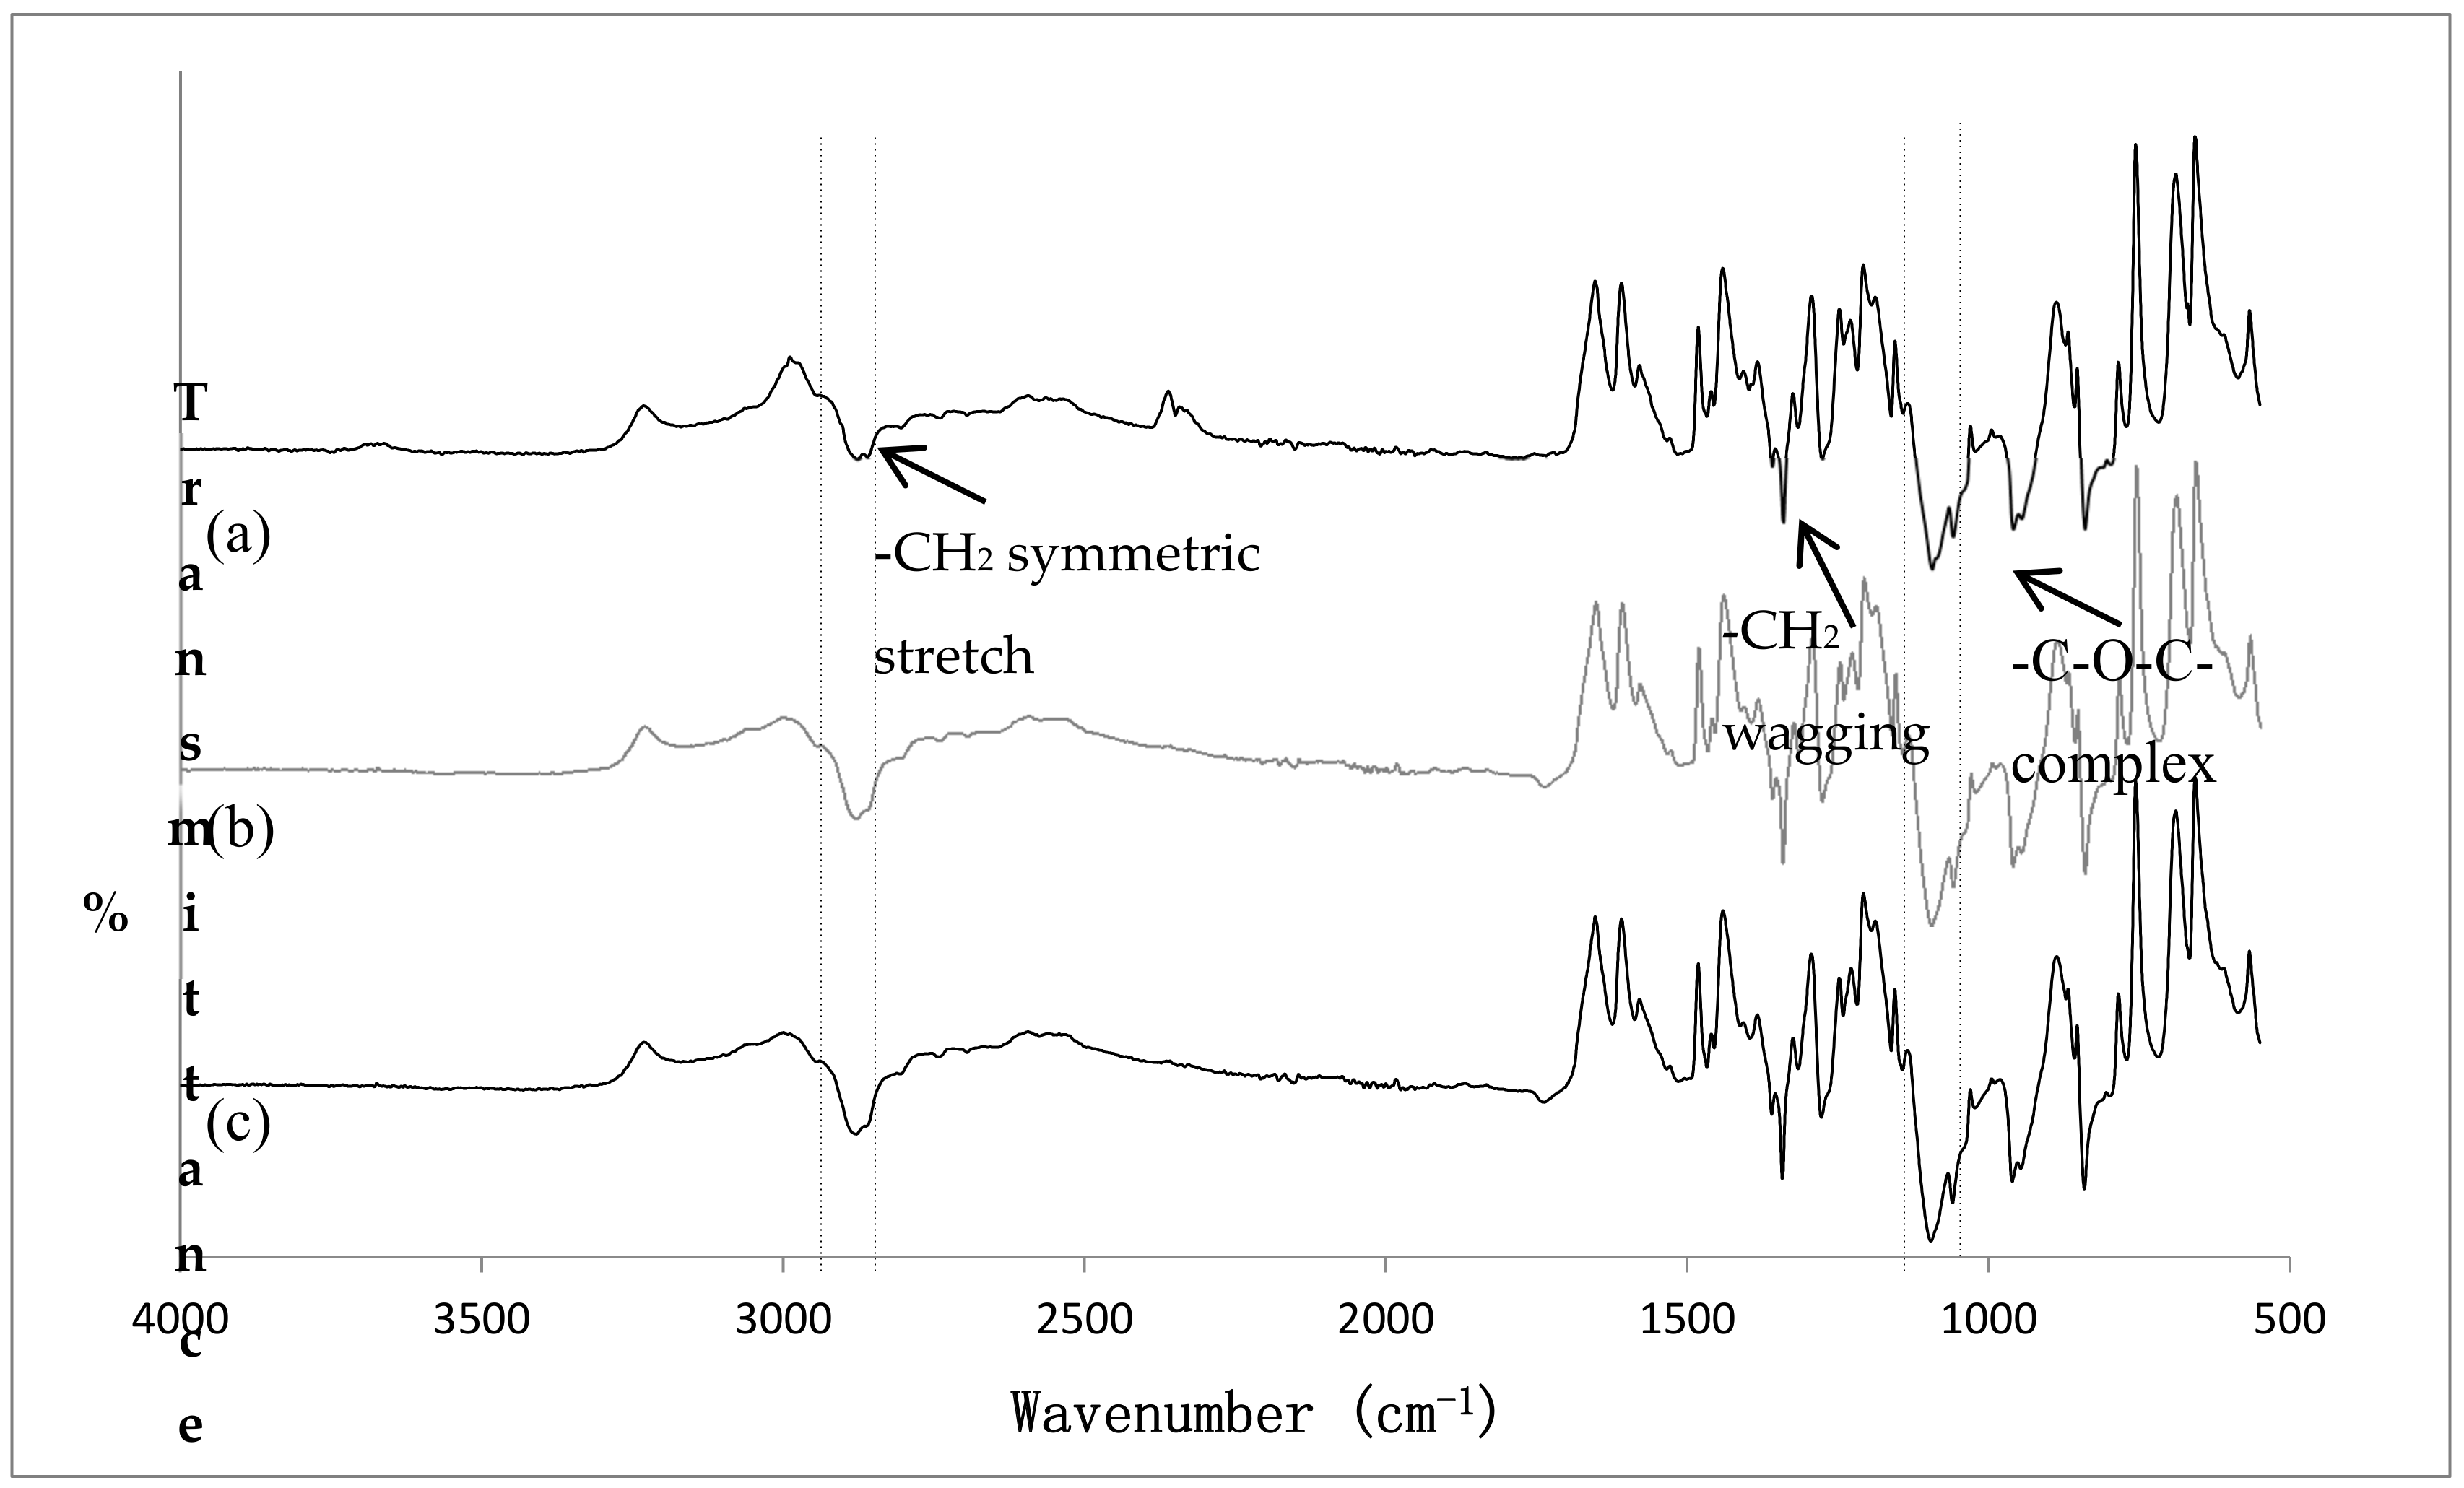
3.5. FT-IR Analysis
3.5.1. Chemical Identification
3.5.2. Effect of Loading Method and Drug Physicochemical Properties on the Drug-Polymer Compatibility
3.6. Effect of Loading Method and Drug Physicochemical Properties on the Mechanical Properties
3.7. Effect of Loading Method and Drug Physicochemical Properties on the Rheological Properties
3.8. Effect of Loading Method and Drug Physicochemical Properties on the Drug Release Behaviour via a Synthetic Membrane
3.8.1. pH and Drug Ionization
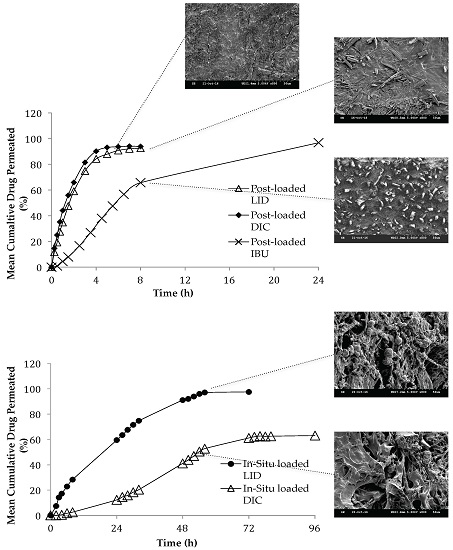
3.8.2. Effect of Loading Method and Drug Physicochemical Properties on the Permeation Studies
3.8.3. Effect of Loading Method and Drug Physicochemical Properties on the Release Kinetics
4. Conclusions
Supplementary Materials
Author Contributions
Conflicts of Interest
References
- Bodde, H.E.; Vanaalten, E.A.C.; Junginger, H.E. Hydrogel patches for transdermal drug delivery; in vivo water exchange and skin compatibility. J. Pharm. Pharmacol. 1989, 41, 152–155. [Google Scholar] [CrossRef] [PubMed]
- Mazzitelli, S.; Pagano, C.; Giusepponi, D.; Nastruzzi, C.; Peroli, L. Hydrogel blends with adjustable properties as patches for transdermal delivery. Int. J. Pharm. 2013, 454, 47–57. [Google Scholar] [CrossRef] [PubMed]
- Maji, P.; Gandhi, A.; Jana, S.; Maji, N. Preparation and characterization of maleic anhydride cross-linked chitosan-polyvinyl alcohol hydrogel matrix transdermal patch. J. PharmaSciTech 2013, 2, 62–67. [Google Scholar]
- Wong, R.S.H.; Ashton, M.; Dodou, K. Effect of crosslinking agent concentration on the properties of unmedicated hydrogels. Pharmaceutics 2015, 7, 305–319. [Google Scholar] [CrossRef] [PubMed]
- Doytcheva, M.; Dotcheva, D.; Stamenova, R.; Tsvetanov, C. UV-initiated crosslinking of poly (ethylene oxide) with pentaerythritol triacrylate in solid state. Macromol. Mater. Eng. 2001, 286, 30–33. [Google Scholar] [CrossRef]
- Wong, R.S.H.; Ashton, M.; Dodou, K. Analysis of residual crosslinking agent content in UV cross-linked poly (ethylene oxide) hydrogels for dermatological application by gas chromatography. J. Pharm. Anal. 2016, 6, 307–312. [Google Scholar] [CrossRef]
- Okyar, A.; Ozsoy, Y.; Gungor, S. Novel formulation approaches for dermal and transdermal delivery of non-steroidal anti-inflammatory drugs. In Rheumatoid Arthritis—Treatment, 1st ed.; Lemmey, A.B., Ed.; InTech: Rijeka, Croatia, 2012; pp. 26–46. ISBN 978-953-307-850-2. [Google Scholar]
- Voltarol Gel Patch-Summary of Product Characteristics. Available online: https://www.medicines.org.uk/emc/medicine/16903 (accessed on 30 April 2017).
- J63035 Lidocaine Hydrochloride Monohydrate, 98%. Available online: https://www.alfa.com/en/catalog/J63035/ (accessed on 30 April 2017).
- Sawant, P.D.; Luu, D.; Ye, R.; Buchta, R. Drug release from hydroethanolic gels. Effect of drug’s lipophilicity (logP), polymer-drug interactions and solvent lipophilicity. Int. J. Pharm. 2010, 396, 45–52. [Google Scholar] [CrossRef] [PubMed]
- Osol, A.; Hoover, J.E. Remington's Pharmaceutical Sciences, 16th ed.; Mack Publishing Co.: Easton, PA, USA, 1980. [Google Scholar]
- Balon, K.; Riebesehl, B.U.; Müller, B.W. Drug liposome partitioning as a tool for the prediction of human passive intestinal absorption. Pharm. Res. 1999, 16, 882–888. [Google Scholar] [CrossRef] [PubMed]
- Zhang, Y.; Geissen, S.U.; Gal, C. Carbamazepine and diclofenac: Removal in wastewater treatment plants and occurrence in water bodies. Chemosphere 2008, 73, 1151–1161. [Google Scholar] [CrossRef] [PubMed]
- 15307-79-6 (Diclofenac Sodium) Product Description. Available online: http://www.chemicalbook.com/ChemicalProductProperty_US_CB5474464.aspx (accessed on 30 April 2017).
- Ibuprofen. Available online: https://www.drugbank.ca/drugs/DB01050 (accessed on 30 April 2017).
- Ranjha, M.N.; Qureshi, U.T. Preparation and characterization of crosslinked acrylic acid/hydroxypropyl methyl cellulose hydrogels for drug delivery. Int. J. Pharm. Pharm. Sci. 2014, 6, 400–410. [Google Scholar]
- Peppas, N.A.; Bures, P.; Leobandung, W.; Ichikawa, H. Hydrogels in pharmaceutical formulations. Eur. J. Pharm. Biopharm. 2000, 50, 27–46. [Google Scholar] [CrossRef]
- Kong, Y.; Hay, J.N. The measurement of the crystalline of polymers by DSC. Polymer 2003, 43, 3873–3878. [Google Scholar] [CrossRef]
- Blaine, L.R. Determination of Polymer Crystallinity by DSC; TA Instruments: New Castle, DE, USA, 2011. [Google Scholar]
- Omidian, H.; Hashemi, S.A.; Askari, F.; Nafisi, S. Swelling and crosslink density measurements for hydrogels. Iran. J. Polym. Sci. Technol. 1994, 3, 115–119. [Google Scholar]
- Yoshii, F.; Zhanshan, Y.; Isobe, K.; Shinozaki, K.; Makuuchi, K. Electron beam cross-linked PEO and PEO/PVA hydrogels for wound dressing. Radiat. Phys. Chem. 1999, 55, 133–138. [Google Scholar] [CrossRef]
- Flory, P.J.; Rehner, J.R. Statistical mechanics of cross-linked polymer networks. II. Swelling. J. Chem. Phys. 1943, 11, 521–526. [Google Scholar] [CrossRef]
- Brandrup, J.; Immergut, E.H. Polymer Handbook, 3rd ed.; Wiley: New York, NY, USA, 1989. [Google Scholar]
- Gilbert, R.G.; Hess, M.; Jenkins, A.D.; Jones, R.G.; Kratochvil, P.; Stepto, R.F.T. Dispersity in polymer science (IUPAC recommendations 2009). Pure Appl. Chem. 2009, 81, 351–353. [Google Scholar]
- Stokes, J.R. Swirling Flow of Viscoelastic Fluids. Ph.D. Thesis, University of Melbourne, Melbourne, Australia, 1998. [Google Scholar]
- Peppas, N.A.; Huang, Y.; Torres-Lugo, M.; Ward, J.H.; Zhang, J. Physicochemical foundations and structural design of hydrogels in medicine and biology. Annu. Rev. Biomed. Eng. 2000, 2, 9–29. [Google Scholar] [CrossRef] [PubMed]
- Rixman, M.A.; Dean, D.; Ortiz, C. Nanoscale intermolecular interactions between human serum albumin and low density surfaces of poly (ethylene oxide). Langmuir 2003, 19, 9357–9372. [Google Scholar] [CrossRef]
- Peppas, N.A.; Barr-Howell, B.D. Characterization of the crosslinked structure of hydrogels. In Hydrogels in Medicine and Pharmacy, 1st ed.; Peppas, N.A., Ed.; CRC Press: Boca Raton, FL, USA, 1986; pp. 27–56. ISBN 0-8493-5548-6. [Google Scholar]
- Dodou, K.; Armstrong, A.; Kelly, I.; Wilkinson, S.; Carr, K.; Shattock, P.; Whiteley, P. Ex vivo studies for the passive transdermal delivery of low-dose naltrexone from a cream; detection of naltrexone and its active metabolite, 6β-naltrexol, using a novel Lc Q-ToF MS assay. Pharm. Dev. Technol. 2015, 20, 694–701. [Google Scholar] [CrossRef] [PubMed]
- Colombo, P. Swelling-controlled release in hydrogel matricesfor oral route. Adv. Drug. Deliv. Rev. 1993, 11, 37–57. [Google Scholar] [CrossRef]
- Doelker, E. Water-swollen cellulose derivatives in pharmacy. In Hydrogels in Medicine and Pharmacy, 1st ed.; Peppas, N.A., Ed.; CRC Press: Boca Raton, FL, USA, 1986; pp. 115–160. ISBN 0-8493-5548-6. [Google Scholar]
- Brannon-Peppas, L. Preparation and characterization of crosslinked hydrophilic networks. In Absorbent Polymer Technology, 1st ed.; Brannon-Peppas, L., Ed.; Elsevier: Amsterdam, The Netherlands, 1990; Volume 8, pp. 67–102. ISBN 0-444-88654-0. [Google Scholar]
- Brannon-Peppas, L.; Peppas, N.A. The equilibrium swelling behavior of porous and non porous hydrogels. In Absorbent Polymer Technology, 1st ed.; Brannon-Peppas, L., Ed.; Elsevier: Amsterdam, The Netherlands, 1990; pp. 45–66. ISBN 0-444-88654-0. [Google Scholar]
- Najib, N.; Sulaiman, M. The kinetics of drug release from ethyl cellulose solid dispersions. Drug Dev. Ind. Pharm. 1985, 11, 2169–2189. [Google Scholar] [CrossRef]
- Aikawa, K.; Matsumoto, K.; Uda, H.; Tanaka, S.; Shimamura, H.; Aramaki, Y.; Tsuchiya, S. Hydrogel formation of the pH response polymer polyvinylacetal diethylaminoacetate (AEA). Int. J. Pharm. 1998, 167, 97–104. [Google Scholar] [CrossRef]
- Shah, K.R.; Chaudhary, S.A.; Mehta, T.A. Polyox (polyethylene oxide) multifunctional polymer in novel drug delivery system. Int. J. Pharma. Sci. Drug Res. 2014, 6, 96–101. [Google Scholar]
- Mao, H. Nanoporous Polymer with Functionalized 1-d and 3-d Channels from Ordered Block Copolymer Templates. Ph.D. Thesis, University of Minnesota, Minneapolis, MN, USA, 2006. [Google Scholar]
- Zoppi, R.A.; Duek, E.A.R.; Coraca, D.C.; Barros, P.P. Preparation and characterization of poly (l-lactic acid) and poly (ethylene oxide) blends. Matter. Res. 2001, 4, 117–125. [Google Scholar] [CrossRef]
- Lai, W.; Liau, W. Study of miscibility and crystallization behavior of poly (ethylene oxide)/poly (vinyl alcohol) blends. J. Appl. Polm. Sci. 2004, 92, 1562–1568. [Google Scholar] [CrossRef]
- Gooch, J.W. Encyclopedic Dictionary of Polymers, 2nd ed.; Springer: New York, NY, USA, 2010; ISBN 978-1-4419-6246-1. [Google Scholar]
- Wojnarowska, W.; Grzybowska, K.; Hawelek, K.; Swiety-Pospiech, A.; Masiewicz, E.; Paluch, M.; Sawicki, W.; Chmielewska, A.; Bujak, P.; Markowski, J. Molecular dynamic studies on the water mixtures of pharmaceutically important ionic liquid lidocaine HCL. Mol. Pharm. 2012, 9, 1250–1261. [Google Scholar] [CrossRef] [PubMed]
- O’Niel, M.J.; Smith, A.; Heckelman, P.E.; Budavari, S. The Merck Index: An Encyclopedia of Chemicals, Drugs, and Biologicals, 14th ed.; Merck & Co.: Kenilworth, NJ, USA, 2006. [Google Scholar]
- Yosihara, T.; Tadokoro, H.; Murahashi, S. Normal vibrations of the polymer molecules of helical conformation. IV. polyethylene oxide and polyethylene-d4 oxide. J. Chem. Phys. 1962, 41, 2902–2911. [Google Scholar] [CrossRef]
- Calabro, E.; Magazu, S. Demicellization of polyethylene oxide in water solution under static magnetic field exposure studied by FTIR spectroscopy. Adv. Phys. Chem. 2013, 2013, 1–8. [Google Scholar] [CrossRef]
- Zhou, J.; Ke, F.; Tong, Y.; Li, Z.; Liang, D. Solution of behavior of copolymers with poly (ethylene oxide) as the “hydrophobic”. Soft Matter 2001, 7, 9956–9961. [Google Scholar] [CrossRef]
- Shang, J.; Hong, K.; Wang, T.; Zhu, D.; Shen, J. Dielectric and mechanical investigations on the hydrophillicity and hydrophobicity of polyethylene oxide modified on a silicon surface. Langmuir 2016, 32, 11395–11404. [Google Scholar] [CrossRef] [PubMed]
- Li, X.; Hsu, S.L. An analysis of the crystallization behavior of poly (ethylene oxide)/poly (methyl methacrylate) blends by spectroscopic and calorimetric techniques. J. Polym. Sci. B Polym. Phys. 1984, 22, 1331–1342. [Google Scholar] [CrossRef]
- Pucic, I.; Jurkin, T. FTIR assessment of poly (ethylene oxide) irradiated in solid state, melt and aqueous solution. Radiat. Phys. Chem. 2012, 81, 1426–1429. [Google Scholar] [CrossRef]
- Pavia, D.L.; Lampman, G.M.; Kriz, G.S.; Vyvyan, J.R. Introduction to Spectroscopy, 4th ed.; Brooks/Cole: Belmont, CA, USA, 2009. [Google Scholar]
- Lopez-Artíguez, M.; Camean, A.; Repetto, M. Unequivocal identification of several common adulterants and dluents in street samples of cocaine by infrared spectroscopy. J. Forensic Sci. 1995, 40, 602–610. [Google Scholar] [CrossRef]
- Neville, G.A.; Regnier, Z.R. Hydrogen bonding in lidocaine salts. I. The NH stretching band and its dependence on the associated anion. Can. J. Chem. 1969, 47, 4229–4236. [Google Scholar] [CrossRef]
- Bratu, I.; Astilean, S.; Ionesc, C.; Indrea, E.; Huvenne, J.P.; Legrand, P. FT-IR and X-ray spectroscopic investigations of Na-diclofenac-cyclodextrins interactions. Spectrochim. Acta A Mol. Biomol. Spectrosc. 1998, 54, 191–196. [Google Scholar] [CrossRef]
- Nokhodchi, A.; Amire, O.; Jelvehgari, M. Physico-mechanical and dissolution behaviours of ibuprofen crystals crystallized in the presence of various additives. Daru 2010, 18, 74–83. [Google Scholar] [PubMed]
- Anand, B.D.; Ramesh, P. Development and characterization of biodegradable chitosan films for local delivery of paclitaxel. AAPS. J. 2004, 6, 88–99. [Google Scholar]
- Hsieh, S.; Liu, Y.; Beck, D.; Suchan, M.; Li, I. Temperature dependence of molecular packing in self-assembled monolayer films. In Surfactants in Tribology, 2nd ed.; Biresaw, G., Mittal, K.L., Eds.; CRC Press: Boca Raton, FL, USA, 2011; pp. 103–116. ISBN 9781439840641. [Google Scholar]
- Kumar, P.; Mohan, C.; Kanamsrinivasan Uma Shankar, M.; Gulati, M. Physiochemical characterization and release rate studies of solid dispersions of ketoconazole with pluronic F127 and PVP K-30. Iran. J. Pharm. Res. 2011, 10, 685–694. [Google Scholar] [PubMed]
- Wolff, H.M.; Irsan; Dodou, K. Investigation of the viscoelastic performance of pressure sensitive adhesive in drug-in-adhesive type transdermal films. Pharm. Res. 2014, 31, 2186–2202. [Google Scholar] [CrossRef] [PubMed]
- Yuan, B.; Liu, X.Y.; Li, J.L.; Xu, H.Y. Volume confinement induced microstructural transitions and property enhancements of supramolecular soft materials. Soft Matter 2011, 7, 1708–1713. [Google Scholar] [CrossRef]
- Gupta, K.M.; Barnes, S.R.; Tangaro, R.A.; Roberts, M.C.; Owern, D.H.; Katz, D.F.; Kiser, P.F. Temperature and pH sensitive hydrogels: An approach towards smart semen-triggered vaginal microbicidal vehicles. J. Pharm. Sci. 2006, 96, 670–681. [Google Scholar] [CrossRef] [PubMed]
- Pramod, K.; Shanavas, S.; Baby, J.N. Rheology profiling of a hydrogel drug delivery vehicle. J. Chem. Pharm. Res. 2015, 7, 818–825. [Google Scholar]
- Vecchia, B.E.; Bunge, A.L. Skin absorption databases and predictive equations. In Transdermal Drug Delivery, 2nd ed.; Guy, R., Hadgraft, J., Eds.; Marcel Dekker: New York, NY, USA, 2003; pp. 57–141. ISBN 978-0-8247-0861-0. [Google Scholar]
- Amnuaikit, T.; Maneenuan, D.; Boonme, P. Evaluation of caffeine gels on physicochemical characteristics and in vivo efficacy in reducing puffy eyes. J. Appl. Pharm. Sci. 2011, 1, 56–59. [Google Scholar]
- Rossi, R.; Luckham, P.F.; Tadros, T.F. Influences of non-ionic polymers on the rheological behavior of Na+-montmorillonite clay suspensions-1 nonylphenol-polypropylene oxide-polyethylene oxide copolymers. Colloids Surf. A Physicochem. Eng. Asp. 2002, 201, 85–100. [Google Scholar] [CrossRef]
- 3M™ CoTran™ 9702 Membrane. Available online: https://solutions.3m.com/3MContentRetrievalAPI/BlobServlet?locale=en_WW&lmd=1219086383000&assetId=1114279697868&assetType=MMM_Image&blobAttribute=ImageFile (accessed on 31 January 2017).
- Redding, B.K. Systems and Methods for Enhancing the Delivery of Compounds to Skin Pores Using Ultrasonic Waveforms. U.S. Patent US20140114234 A1, 24 April 2014. [Google Scholar]
- Silva, C.L.; Topgaards, D.; Kocherbitov, V.; Sousa, J.J.S.; Pais, A.A.C.C.; Sparr, E. Stratum corneum hydration: Phase transformations and mobility in stratum corneum, extracted lipids and isolated corneocytes. Biochim. Biophys. Acta Biomembr. 2007, 1768, 2647–2659. [Google Scholar] [CrossRef] [PubMed]
- Trommer, H.; Neubert, R.H.H. Overcoming the stratum corneum: The modulation of skin penetration. Skin Pharmacol. Physiol. 2006, 19, 106–121. [Google Scholar] [CrossRef] [PubMed]
- Khazaeinia, T.; Jamali, F. A comparison of gastrointestinal permeability induced by diclofenac-phospholipid complex with diclofenac acid and its sodium salt. J. Pharm. Pharm. Sci. 2003, 6, 352–359. [Google Scholar] [PubMed]
- Durairaj, C.; Kim, S.J.; Edelhauser, H.F.; Shah, J.C.; Kompella, U.B. Influence of dosage form on the intravitreal pharmacokinetics of diclofenac. Investig. Ophthalmol. Vis. Sci. 2009, 50, 4887–4897. [Google Scholar] [CrossRef] [PubMed]
- Qiao, M.X.; Chen, D.W.; Ma, X.C.; Liu, Y.J. Injectable biodegradable temperature-responsive PLGA–PEG–PLGA copolymers: Synthesis and effect of copolymer composition on the drug release from the copolymer-based hydrogels. Int. J. Pharm. 2005, 294, 103–112. [Google Scholar] [CrossRef] [PubMed]
- Jeong, B.; Bae, Y.H.; Kim, S.W. Drug release from biodegradable injectable thermosensitive hydrogel of PEG-PLGA-PEG triblock copolymers. J. Control. Release 2000, 63, 155–163. [Google Scholar] [CrossRef]
- Carbinatto, F.M.; de Castro, A.D.; Evangelista, R.C.; Cury, B.S.F. Insights into the swelling process and drug release mechanisms from cross-linked pectin/high amylose starch matrices. Asian J. Pharm. Sci. 2014, 9, 27–34. [Google Scholar] [CrossRef]
- Motoyama, K.; Tanida, Y.; Hata, K.; Hayashi, T.; Higashi, T.; Ishitsuka, Y.; Kondo, Y.; Irie, T.; Kaneko, S.; Arima, H. Potential use of a megamolecular polysachharide sacran as a hydrogel-based sustained release system. Chem. Pharm. Bull. 2014, 62, 636–641. [Google Scholar] [CrossRef] [PubMed]
- Jin, L.; Lu, P.; You, H.; Chen, Q.; Dong, J. Vitamin B12 diffusion and binding in crosslinked poly (acrylic acid)s and poly (acrylic acid co-n-vinyl pyrrolidinone)s. Int. J. Pharm. 2009, 371, 82–88. [Google Scholar] [CrossRef] [PubMed]


| Model drug | Molecular structure | Solubility in water | Log P | pKa | Melting point |
|---|---|---|---|---|---|
| LID |  | Water Soluble (50 mg/mL) [9] | Less than or equal to zero [10] | 7.86 [11] | 75–79 °C [9] |
| DIC |  | Water Soluble (20 mg/mL) a | 0.70 [12] | 4.15 [13] | 288–290 °C [14] |
| IBU |  | Slightly Soluble (21 mg/L at 25 °C) [15] | 3.97 [15] | 4.91 [15] | 75–77.5 °C [15] |
| DSC heat/cool/heat temperature | Sample type |
|---|---|
| −80 °C/100 °C/−80 °C | Pure PEO, unmedicated PEO xerogel, LID, IBU, LID xerogels (post-loaded and in situ loaded), IBU xerogel (post-loaded) |
| −80 °C/350 °C/−80 °C | Unmedicated PEO xerogel, DIC, DIC xerogels (post-loaded and in situ loaded) |
| PEO (Mw = 1000,000 g/mol) hydrogel cross-linked with 5% w/w PETRA | |||||||||
|---|---|---|---|---|---|---|---|---|---|
| Independent parameter | Unmedicated | LID (% w/w) | DIC (% w/w) | ||||||
| 1.12 | 3.57 | 6.30 | 9.93 | 3.17 | 8.37 | 13.12 | 20.26 | ||
| Dependent parameters | |||||||||
| Thickness of dry film (µm) | 200 | 200 | 200 | 200 | 200 | 200 | 200 | 200 | 200 |
| Thickness of swollen film (µm) | 320 | 320 | 320 | 340 | 345 | 355 | 380 | 420 | 485 |
| Equilibrium Swelling (%) | 199.84 (±9.24) | 203.37 (±2.34) | 255.11 * (±9.22) | 288.55 * (±6.46) | 306.14 * (±8.79) | 399.48 * (±9.94) | 514.71 * (±19.43) | 583.15 * (±41.51) | 736.07 * (±84.93) |
| Gel Fraction (%) | 85.84 (±1.65) | 82.03 * (±0.31) | 81.51 * (±0.98) | 80.52 * (±1.01) | 79.54 * (±0.42) | 76.34 * (±1.72) | 71.24 * (±4.56) | 62.16 * (±5.81) | 57.26 * (±7.34) |
| Average Molecular Weight Between Cross-links, (g/mol) | 734.48 (±62.36) | 756.54 (±57.15) | 1187.03 * (±84.17) | 1508.77 * (±68.17) | 1710.96 * (±136.21) | 2921.48 * (±179.43) | 4856.94 * (±363.97) | 6243.55* (±886.04) | 9927.18 * (±2424.43) |
| Cross-link Density, × 10−4 (mol/cm3) | 16.45 (±1.56) | 15.87 (±0.36) | 10.16 * (±0.77) | 7.92 * (±0.36) | 7.05 * (±0.50) | 4.12 * (±0.26) | 2.48 * (±0.19) | 1.96 * (±0.27) | 1.26 * (±0.22) |
| Mesh Size, ξ (nm) | 2.73 (±0.08) | 2.76 (±0.04) | 3.65 * (±0.06) | 4.26 * (±0.12) | 4.60 * (±0.13) | 6.45 * (±0.25) | 8.93 * (±0.43) | 10.49 * (±0.96) | 14.14 * (±2.12) |
| Sample | Drug concentration (%w/w) | Tm (Cycle 3) (°C) | (J/g) | XC (%) |
|---|---|---|---|---|
| Unmedicated | - | 63.1 (±0.9) | 103.7 (±3.4) | 52.7 (±1.7) |
| Unmedicated (350 °C) | - | 57.0 (±0.5) | 145.5 (±1.9) | 73.9 (±0.9) |
| Unmedicated (EtOH) | - | 61.9 (±1.3) | 97.7 (±0.9) | 49.6 (±0.5) |
| Post-loaded LID | 1.18 | 62.3 (±0.5) | 103.0 (±4.5) | 52.3 (±2.3) |
| 3.64 | 64.4 (±0.4) | 95.2 (±3.3) * | 48.4 (±1.7) * | |
| 6.31 | 63.9 (±0.5) | 90.3 (±1.4) * | 45.9 (±0.7) * | |
| 9.75 | 62.9 (±0.9) | 87.3 (±2.1) * | 44.4 (±1.1) * | |
| Post-loaded DIC | 3.28 | 58.5 (±0.2) | 136.6 (±2.4) * | 69.4 (±1.2) * |
| 8.39 | 56.4 (±0.2) * | 115.8 (±1.9) * | 58.8 (±0.9) * | |
| 13.62 | 55.6 (±0.2) * | 112.1 (±4.0) * | 56.9 (±2.1) * | |
| 20.68 | 54.3 (±0.3) * | 105.9 (±2.3) * | 53.8 (±1.2) * | |
| Post-loaded IBU | 15.44 | 60.2 (±0.2) | 75.6 (±2.7) * | 38.4 (±1.4) * |
| 31.01 | 55.3 (±0.1) * | 61.3 (±3.0) * | 31.1 (±1.5) * | |
| 45.48 | 51.3 (±2.1) * | 49.8 (±5.0) * | 25.3 (±2.5) * | |
| 59.09 | 51.0 (±5.1) * | 46.7 (±5.9) * | 23.8 (±3.0) * | |
| In situ Loaded LID | 1.12 | 64.6 (±0.8) | 100.1 (±3.7) | 50.9 (±1.9) |
| 3.57 | 64.6 (±0.5) | 102.3 (±3.8) | 52.3 (±1.9) | |
| 6.3 | 64.5 (±0.2) | 103.2 (±0.3) | 52.4 (±0.1) | |
| 9.93 | 64.2 (±0.5) | 98.9 (±1.1) | 50.2 (±0.6) | |
| In situ Loaded DIC | 3.17 | 57.0 (±0.5) | 139.0 (±7.8) | 70.6(±3.9) |
| 8.37 | 56.0 (±1.8) | 133.7 (±5.4) * | 68.0 (±2.7) * | |
| 13.12 | 55.4 (±0.5) * | 119.0 (±0.2) * | 60.5 (±1.0) * | |
| 20.26 | 52.6 (±0.4) * | 99.8 (±2.6) * | 50.7 (±1.3) * |
| Sample | Drug concentration (% w/w) | Tensile strength (MPa) | Percentage elongation (%) | Young’s modulus (MPa) |
|---|---|---|---|---|
| Unmedicated | - | 1.25 (±0.05) | 19.84 (±2.75) | 7.87 (±0.30) |
| Unmedicated (EtOH) | - | 1.21 (±0.13) | 19.86 (±2.94) | 7.61 (±0.11) |
| Post-loaded LID | 1.18 | 1.20 (±0.09) | 20.23 (±2.03) | 7.41 (±0.53) |
| 3.64 | 1.25 (±0.08) | 20.05 (±2.42) | 7.79 (±0.58) | |
| 6.31 | 1.31 (±0.11) | 21.75 (±1.79) | 7.52 (±0.46) | |
| 9.75 | 1.32 (±0.07) | 22.64 (±1.44) | 7.28 (±0.47) | |
| Post-loaded DIC | 3.28 | 1.20 (±0.07) | 20.49 (±1.09) | 7.31 (±0.51) |
| 8.39 | 1.15 (±0.11) | 21.27 (±1.89) | 6.75 (±0.59) * | |
| 13.62 | 1.12 (±0.10) | 22.39 (±2.36) | 6.24 (±0.42) * | |
| 20.68 | 1.08 (±0.11) * | 22.74 (±1.96) | 5.93 (±0.21) * | |
| Post-loaded IBU | 15.44 | 1.20 (±0.08) | 20.12 (±1.01) | 7.45 (±0.48) |
| 31.01 | 1.19 (±0.05) | 21.87 (±2.10) | 6.80 (±0.55) * | |
| 45.48 | 1.17 (±0.05) | 22.36 (±2.42) | 6.54 (±0.57) * | |
| 59.09 | 1.15 (±0.03) | 23.95 (±2.97) | 6.00 (±0.71) * | |
| In situ Loaded LID | 1.12 | 1.14 (± 0.14) | 22.18 (±2.61) | 6.42 (±0.24) * |
| 3.57 | 0.82 (±0.02) * | 26.37 (±2.70) * | 3.88 (±0.16) * | |
| 6.3 | 0.56 (±0.03) * | 32.53 (±3.28) * | 2.15 (±0.25) * | |
| 9.93 | 0.50 (±0.04) * | 40.01 (±3.05) * | 1.56 (±0.18) * | |
| In situ Loaded DIC | 3.17 | 0.19 (±0.03) * | 24.13 (±3.49) * | 0.98 (±0.04) * |
| 8.37 | 0.14 (±0.02) * | 35.30 (±5.60) * | 0.50 (±0.03) * | |
| 13.12 | 0.10 (±0.02) * | 43.39 (±8.39) * | 0.29 (±0.04) * | |
| 20.26 | 0.05 (±0.02) * | 54.68 (±7.80) * | 0.11 (±0.04) * |
| Sample | Drug concentration (% w/w) | Elastic modulus, G’ 104 (Pa) | Viscous modulus, G” 104 (Pa) | Critical strain () | Complex viscosity at frequency = 10 Hz, η* 103 (Pa·s) |
|---|---|---|---|---|---|
| Unmedicated | - | 9.27 (±0.12) | 1.04 (±0.33) | 1.68 | 1.57 (±0.21) |
| Unmedicated (EtOH) | - | 9.03 (±0.10) | 1.14 (±0.29) | 1.58 | 1.65 (±0.18) |
| Post-loaded LID | 1.18 | 9.40 (±0.14) | 1.05 (±0.08) | 1.59 | 1.57 (±0.05) |
| 3.64 | 10.52 (±0.19) * | 1.15 (±0.15) | 0.99 | 1.67 (±0.17) | |
| 6.31 | 10.71 (±0.16) * | 1.18 (±0.07) | 0.67 | 1.69 (±0.08) | |
| 9.75 | 11.54 (±0.22) * | 1.26 (±0.07) | 0.4 | 1.78 (±0.12) | |
| Post-loaded DIC | 3.28 | 9.89 (±0.22) * | 1.11 (±0.29) | 1.58 | 1.63 (±0.12) |
| 8.39 | 11.79 (±0.03) * | 1.33 (±0.33) | 1.25 | 1.83 (±0.06) | |
| 13.62 | 14.44 (±0.23) * | 1.41 (±0.30) | 0.84 | 1.97 (±0.25) | |
| 20.68 | 17.16 (±0.21) * | 1.64 (±0.27) * | 0.53 | 2.06 (±0.29) | |
| Post-loaded IBU | 15.44 | 10.97 (±0.38) * | 1.16 (±0.41) | 1.26 | 1.69 (±0.16) |
| 31.01 | 12.18 (±0.45) * | 1.87 (±0.17) * | 1 | 2.25 (±0.33) * | |
| 45.48 | 17.65 (±0.71) * | 3.12 (±0.42) * | 0.62 | 3.02 (±0.45) * | |
| 59.09 | 20.54 (±0.48) * | 4.32 (±0.19) * | 0.31 | 3.69 (±0.31) * | |
| In situ Loaded LID | 1.12 | 10.20 (± 0.13) * | 1.13 (±0.33) | 0.79 | 1.64 (±0.04) |
| 3.57 | 24.35 (±0.23) * | 1.54 (±0.20) | 0.63 | 3.58 (±0.09) * | |
| 6.3 | 28.62 (±0.30) * | 1.59 (±0.27) | 0.63 | 4.87 (±0.15) * | |
| 9.93 | 39.22 (±0.14) * | 1.75 (±0.19) * | 0.5 | 6.34 (±0.34) * | |
| In situ Loaded DIC | 3.17 | 0.42 (±0.13) * | 0.03 (±0.01) * | 0.63 | 0.04 (±0.01) * |
| 8.37 | - | - | - | - | |
| 13.12 | - | - | - | - | |
| 20.26 | - | - | - | - |
| Sample | Drug concentration (% w/w) | Apparent pH | Drug ionization in film (%) | Drug ionization in phosphate buffer pH 7.2 (%) |
|---|---|---|---|---|
| Unmedicated | - | 5.61 (±0.01) | - | - |
| Unmedicated (EtOH) | - | 5.61 (±0.00) | - | - |
| Post-loaded LID | 9.75 | 5.80 (±0.00) * | 99.14 | 82.05 |
| Post-loaded DIC | 20.68 | 6.71 (±0.00) * | 0.27 | 0.09 |
| Post-loaded IBU | 59.09 | 4.66 (±0.01) * | - | - |
| In situ Loaded LID | 9.93 | 6.34 (±0.01) * | 97.07 | 82.05 |
| In situ Loaded DIC | 20.26 | 6.75 (±0.01) * | 0.25 | 0.09 |
| Formulation | Drug concentration (% w/w) | Mean total percentage drug release from UV measurements (%) | Mean total percentage drug release based on weight measurements (%) |
|---|---|---|---|
| Post-loaded LID | 9.75 | 92.60 (±2.26) | 93.77 (±0.24) |
| Post-loaded DIC | 20.68 | 93.90 (±2.27) | 94.52 (±0.59) |
| Post-loaded IBU | 59.09 | 96.82 (±2.95) | 99.60 (±0.62) |
| In situ Loaded LID | 9.93 | 97.53 (±1.08) | 98.45 (±0.12) |
| In situ Loaded DIC | 20.26 | 63.04 (±2.18) * | 120.75 (±2.32) * |
| Formulation | Drug concentration (% w/w) | Zero order | First order | Higuchi model | Korsmeyer-peppas model | |||||
|---|---|---|---|---|---|---|---|---|---|---|
| R2 | K0 | R2 | K1 | R2 | K2 | R2 | K3 | n | ||
| Post-loaded LID | 9.75 | 0.961 | 13.016 | 0.962 | 1.511 | 0.961 | 13.016 | 0.999 | 1.536 | 0.788 |
| Post-loaded DIC | 20.68 | 0.958 | 15.349 | 0.966 | 1.595 | 0.958 | 15.349 | 0.995 | 1.621 | 0.733 |
| Post-loaded IBU | 59.09 | 0.993 | 3.343 | 0.986 | 0.575 | 0.995 | 4.571 | 0.989 | 0.006 | 0.015 |
| In situ Loaded LID | 9.93 | 0.994 | 8.099 | 0.987 | 0.744 | 0.994 | 8.099 | 0.970 | 0.908 | 0.786 |
| In situ Loaded DIC | 20.26 | 0.956 | 6.3498 | 0.982 | 1.398 | 0.962 | 6.774 | 0.981 | 1.403 | 1.811 |
© 2017 by the authors. Licensee MDPI, Basel, Switzerland. This article is an open access article distributed under the terms and conditions of the Creative Commons Attribution (CC BY) license (http://creativecommons.org/licenses/by/4.0/).
Share and Cite
Wong, R.S.H.; Dodou, K. Effect of Drug Loading Method and Drug Physicochemical Properties on the Material and Drug Release Properties of Poly (Ethylene Oxide) Hydrogels for Transdermal Delivery. Polymers 2017, 9, 286. https://doi.org/10.3390/polym9070286
Wong RSH, Dodou K. Effect of Drug Loading Method and Drug Physicochemical Properties on the Material and Drug Release Properties of Poly (Ethylene Oxide) Hydrogels for Transdermal Delivery. Polymers. 2017; 9(7):286. https://doi.org/10.3390/polym9070286
Chicago/Turabian StyleWong, Rachel Shet Hui, and Kalliopi Dodou. 2017. "Effect of Drug Loading Method and Drug Physicochemical Properties on the Material and Drug Release Properties of Poly (Ethylene Oxide) Hydrogels for Transdermal Delivery" Polymers 9, no. 7: 286. https://doi.org/10.3390/polym9070286