Article

Optimization of 3D Surfaces of Dextran with Different Molecule Weights for Real-Time Detection of Biomolecular Interactions by a QCM Biosensor

1
Shaanxi Key Laboratory of Natural Products & Chemical Biology, College of Chemistry & Pharmacy, Northwest A&F University, Yangling 712100, China
2
Attana AB, SE-11419 Stockholm, Sweden
*
Author to whom correspondence should be addressed.
These authors contributed equally to this work.
Polymers 2017, 9(9), 409; https://doi.org/10.3390/polym9090409
Submission received: 15 August 2017 / Revised: 25 August 2017 / Accepted: 29 August 2017 / Published: 1 September 2017
(This article belongs to the Special Issue Polymer Based Bio-Sensors)

Abstract

:
Quartz crystal microbalance (QCM) has been extensively applied in real-time and label-free biomolecular interaction studies. However, the sensitive detection by QCM technology remains challenging, mainly due to the limited surface immobilization capacity. Here, a three-dimensional (3D) carboxymethyl dextran coated gold sensor chip surface was successfully fabricated with dextran of different molecular weight (100, 500 and 2000 kDa, respectively). To evaluate the 3D carboxymethyl dextran surface immobilization capacity, the 3D surface was used for studying antigen–antibody interactions on the QCM biosensor. The results showed that the protein immobilization capacity of the 3D carboxymethyl dextran (2000 kDa) surface exceeded more than 4 times the capacity of the 2D carboxyl surface, and 2 times the capacity of the traditional 3D carboxymethyl dextran (500 kDa) surface. Furthermore, the kinetic and affinity properties of antigen–antibody interactions were performed. Most notably, the optimized 3D carboxymethyl dextran (2000 kDa) surface could be used for small molecule detection, where the binding of biotinylated oligo (0.67 kDa) reached 8.1 Hz. The results confirmed that a 3D carboxymethyl dextran (2000 kDa) surface can be exploited for sensitive detection of low molecular weight analytes, which have great potential applications for characterizing the interactions between small molecule drugs and proteins.

Graphical Abstract

1. Introduction

A number of techniques have been employed for the recognition of intermolecular interactions, such as nuclear magnetic resonance (NMR) [1,2,3], X-ray crystallography [4,5], fluorescence spectroscopy [6,7], mass spectrometry [8,9], enzyme-linked lectin assays (ELLAs) [10], ultraviolet (UV)/visible spectroscopy [11,12], surface plasmon resonance (SPR) [13,14,15,16], and quartz crystal microbalance (QCM) [17,18,19]. Several of these tools are often limited in their sensitivity and are difficult to modify for various applications [18]. In contrast, the mass-sensitive biosensor systems, including SPR and QCM, which are known to possess real-time and label-free attributes, have established utility in multiple areas in recent years [20,21]. Both SPR and QCM analytic processes involve attaching one interacting component to the surface of a sensor chip, and then passing a sample containing other interaction partners over the surface. A range of interactions and various binding events occurring on the surface of the sensor chip make the sensor chip an important role in biosensor systems, thus further investigations of optimized sensor chip surfaces leading to versatile performances are of great importance [22].
Surface modification plays a significant role in detecting and characterizing diverse interactions on the sensor chip surface [23]. With different surface modifications, the sensor chips can be tailored to improve adhesion, protein interactions, and cell interactions [24]. There are a wide variety of surface modification approaches suitable for QCM sensor chips. Examples of the sensor chips include polystyrene sensor chips, silicon dioxide sensor chips, gold sensor chips, biotin sensor chips, and carboxyl sensor chips, all of which are 2D sensor chips. In order to achieve high capacity, 3D sensor chips are utilized due to a large amount of available sites. There are several different types of 3D surface reported based on label-free biosensors, including polycarboxylates, surface initiated polymerization, supermolecules, nanoparticles, and vesicles [25,26,27,28,29,30]. For instance, Frasconi and coworkers developed a polycarboxylate-hydrogel-based 3D surface which was used for the real-time detection of cortisol and saliva samples based on SPR technology [25]; Zhu and coworkers reported a 3D SPR imaging sensor chip which was fabricated with carboxylated poly(OEGMA-co-HEMA) brushes on the gold surface by surface induced polymerization for diagnosis of Alzheimer’s Disease [26]; Zhao and coworkers reported a 3D-carbene chip for immobilizing various biomolecules by SPR technology [27]; Wang and coworkers demonstrated a 3D supramolecular co-assembly polyrotaxane (PRX) structure surface for detecting peptide interactions by SPR technology, in which more active sites on the surface could increase the immobilization density of molecules [28]; Mao and coworkers reported streptavidin-coated ferrofluid nanoparticles for detection of Escherichia coli O157:H7 based on a DNA sensor by QCM technology [29]; Mahon and coworkers demonstrated a 3D glycovesicle surface for detection of the carbohydrate–lectin multivalent biorecognition by QCM technology [30]. The carboxymethyl dextran coated sensor chip surface has attracted our attention for a broader range of applications because it has been used as a template for fabricating 3D surfaces [31].
The 3D carboxymethyl dextran surface with the molecular weight of 500 kDa was first introduced by BIAcore [32], and has been successfully applied in biospecific interaction analysis by SPR technology for a long time [33,34,35,36]. The SPR technology features good sensitivity, for instance, an analyte with low molecular weight of 0.18 kDa could be detected on a carboxymethyl dextran coated surface by SPR [32]. Due to the fact that SPR detection depends on the change in refractive index at the interface of sensor chips, the evanescent wave that is used to measure binding of analyte decays at a distance of about 200 nm away from the sensor chip surface [37]. However, the QCM technology is based on the piezoelectric effect, capable of detecting subtle mass changes in the nanogram range [38], which has been proven to be a powerful and universal tool for the detection of various biospecific interactions [17,39]. The vast majority of reported literatures involving QCM are focused on detections of biomacromolecule interactions such as protein–protein or protein–carbohydrate interactions on 2D surfaces. Few studies reported the application of 3D carboxymethyl dextran surfaces using QCM technology, where their studies focused on biomacromolecule interactions. For instance, Dubiel and coworkers reported the detection and kinetic analysis of Etanercept–protein interactions utilizing a 3D carboxymethyl dextran surface by QCM technology [40]. To the best of our knowledge, there are no reports for the investigation of 3D sensor chip surfaces with dextran of different molecular weights based on QCM technology.
Herein, for the first time, the 3D carboxymethyl dextran sensor chips were successfully fabricated with dextran of different molecular weights (100, 500, and 2000 kDa). To evaluate the chip surface immobilization capacity, the 2D and 3D sensor chip surfaces were used for studying antigen–antibody interactions on the QCM biosensor. Both the immobilization capacity and the binding activity of 2D and 3D surfaces with dextran of different molecular weights were evaluated. Furthermore, the 2D and 3D surfaces with dextran of different molecular weights were also applied in the kinetic study of antigen–antibody interactions. Most notably, the 3D carboxymethyl dextran sensor chip surfaces were used for small molecule detection, which demonstrated the sensitive and label-free detection of a small molecule analyte binding to protein by utilizing a 3D carboxymethyl dextran surface on the QCM biosensor. We believe the optimized 3D carboxymethyl dextran sensor chip could greatly facilitate the application of QCM in characterizing the interactions between small molecule drugs and proteins.

2. Materials and Methods

2.1. Materials

16-mercaptohexadecan-1-ol was supplied by ProChimia (Sopot, Poland). Tween® 20, streptavidin, epichlorohydrin, diethylene glycol dimethyl ether, bromoacetic acid, sodium hydroxide, Dextran T-100 (Mw ≈ 100 kDa), Dextran T-2000 (Mw ≈ 2000 kDa), and 2-[4-(2-hydroxy ethyl)piperazin-1-yl]ethanesulfonic acid (HEPES) were obtained from Sigma-Aldrich (St. Louis, MO, USA). Dextran T-500 (Mw ≈ 500 kDa) was purchased from Pharmacia (Stockholm, Sweden). 1-ethyl-3-(3dimethyl-aminopropyl) carbodiimine hydrochloride (EDC), N-HydroxySuccinimide (NHS), N-hydroxysulfosuccinimide (sulfo-NHS), ethanolamine (1 M, pH 8.5), and biotinylated oligo (nicotinamide adenine dinucleotide) were obtained from Attana (Stockholm, Sweden). Myoglobin was obtained from BiosPacific Inc. (Emeryville, CA, USA). Anti-h myoglobin 7005 SPTN-1 was obtained from Medix Biochemica (Espoo, Finland). Other chemicals used were of analytical grade from local suppliers, and used without further purification.
The Attana gold sensor chips and LNB-Carboxyl sensor chips were used in this study. The Attana gold sensor chip was used in basic research and allows modification of the surface for fabrication of the 3D carboxymethyl dextran sensor chips. The LNB-Carboxyl sensor chip features low non-specific binding, thus is one of Attana’s most versatile surfaces for studying molecular interactions.
To carry out the experiments, the Attana Cell A200 QCM biosensor (Attana AB, Stockholm, Sweden) was used, which was operated in a continuous flow mode (Figure 1). The running buffer is continuously flowing through the flow cell over the sensor surface. When the six-way valve is on “load position”, the connection of six-way valve is 1 to 6, 4 to 5, 2 to 3, as shown in the upper left of Figure 1. At this point, the sample of used ligands or analytes which were prepared in the buffer is injected to the sample loop, and the volume of sample loop is 50 μL. After the sample loop was filled with fluid, the excess fluid overflowed to the waste. And then the valve was switched to “injection position”, the connection of six-way valve is 1 to 2, 3 to 4, 5 to 6, as shown in the bottom left of Figure 1. At this moment, the sample in the sample loop is transported to the sensor surface with the continuous flow [41,42]. Bound samples were released from the surface by injections of low pH buffer. Association/disassociation of samples to the surface was monitored by frequency logging, and the frequency shifts were recorded by the Attester® software (Attana AB). All experiments were carried out at room temperature.

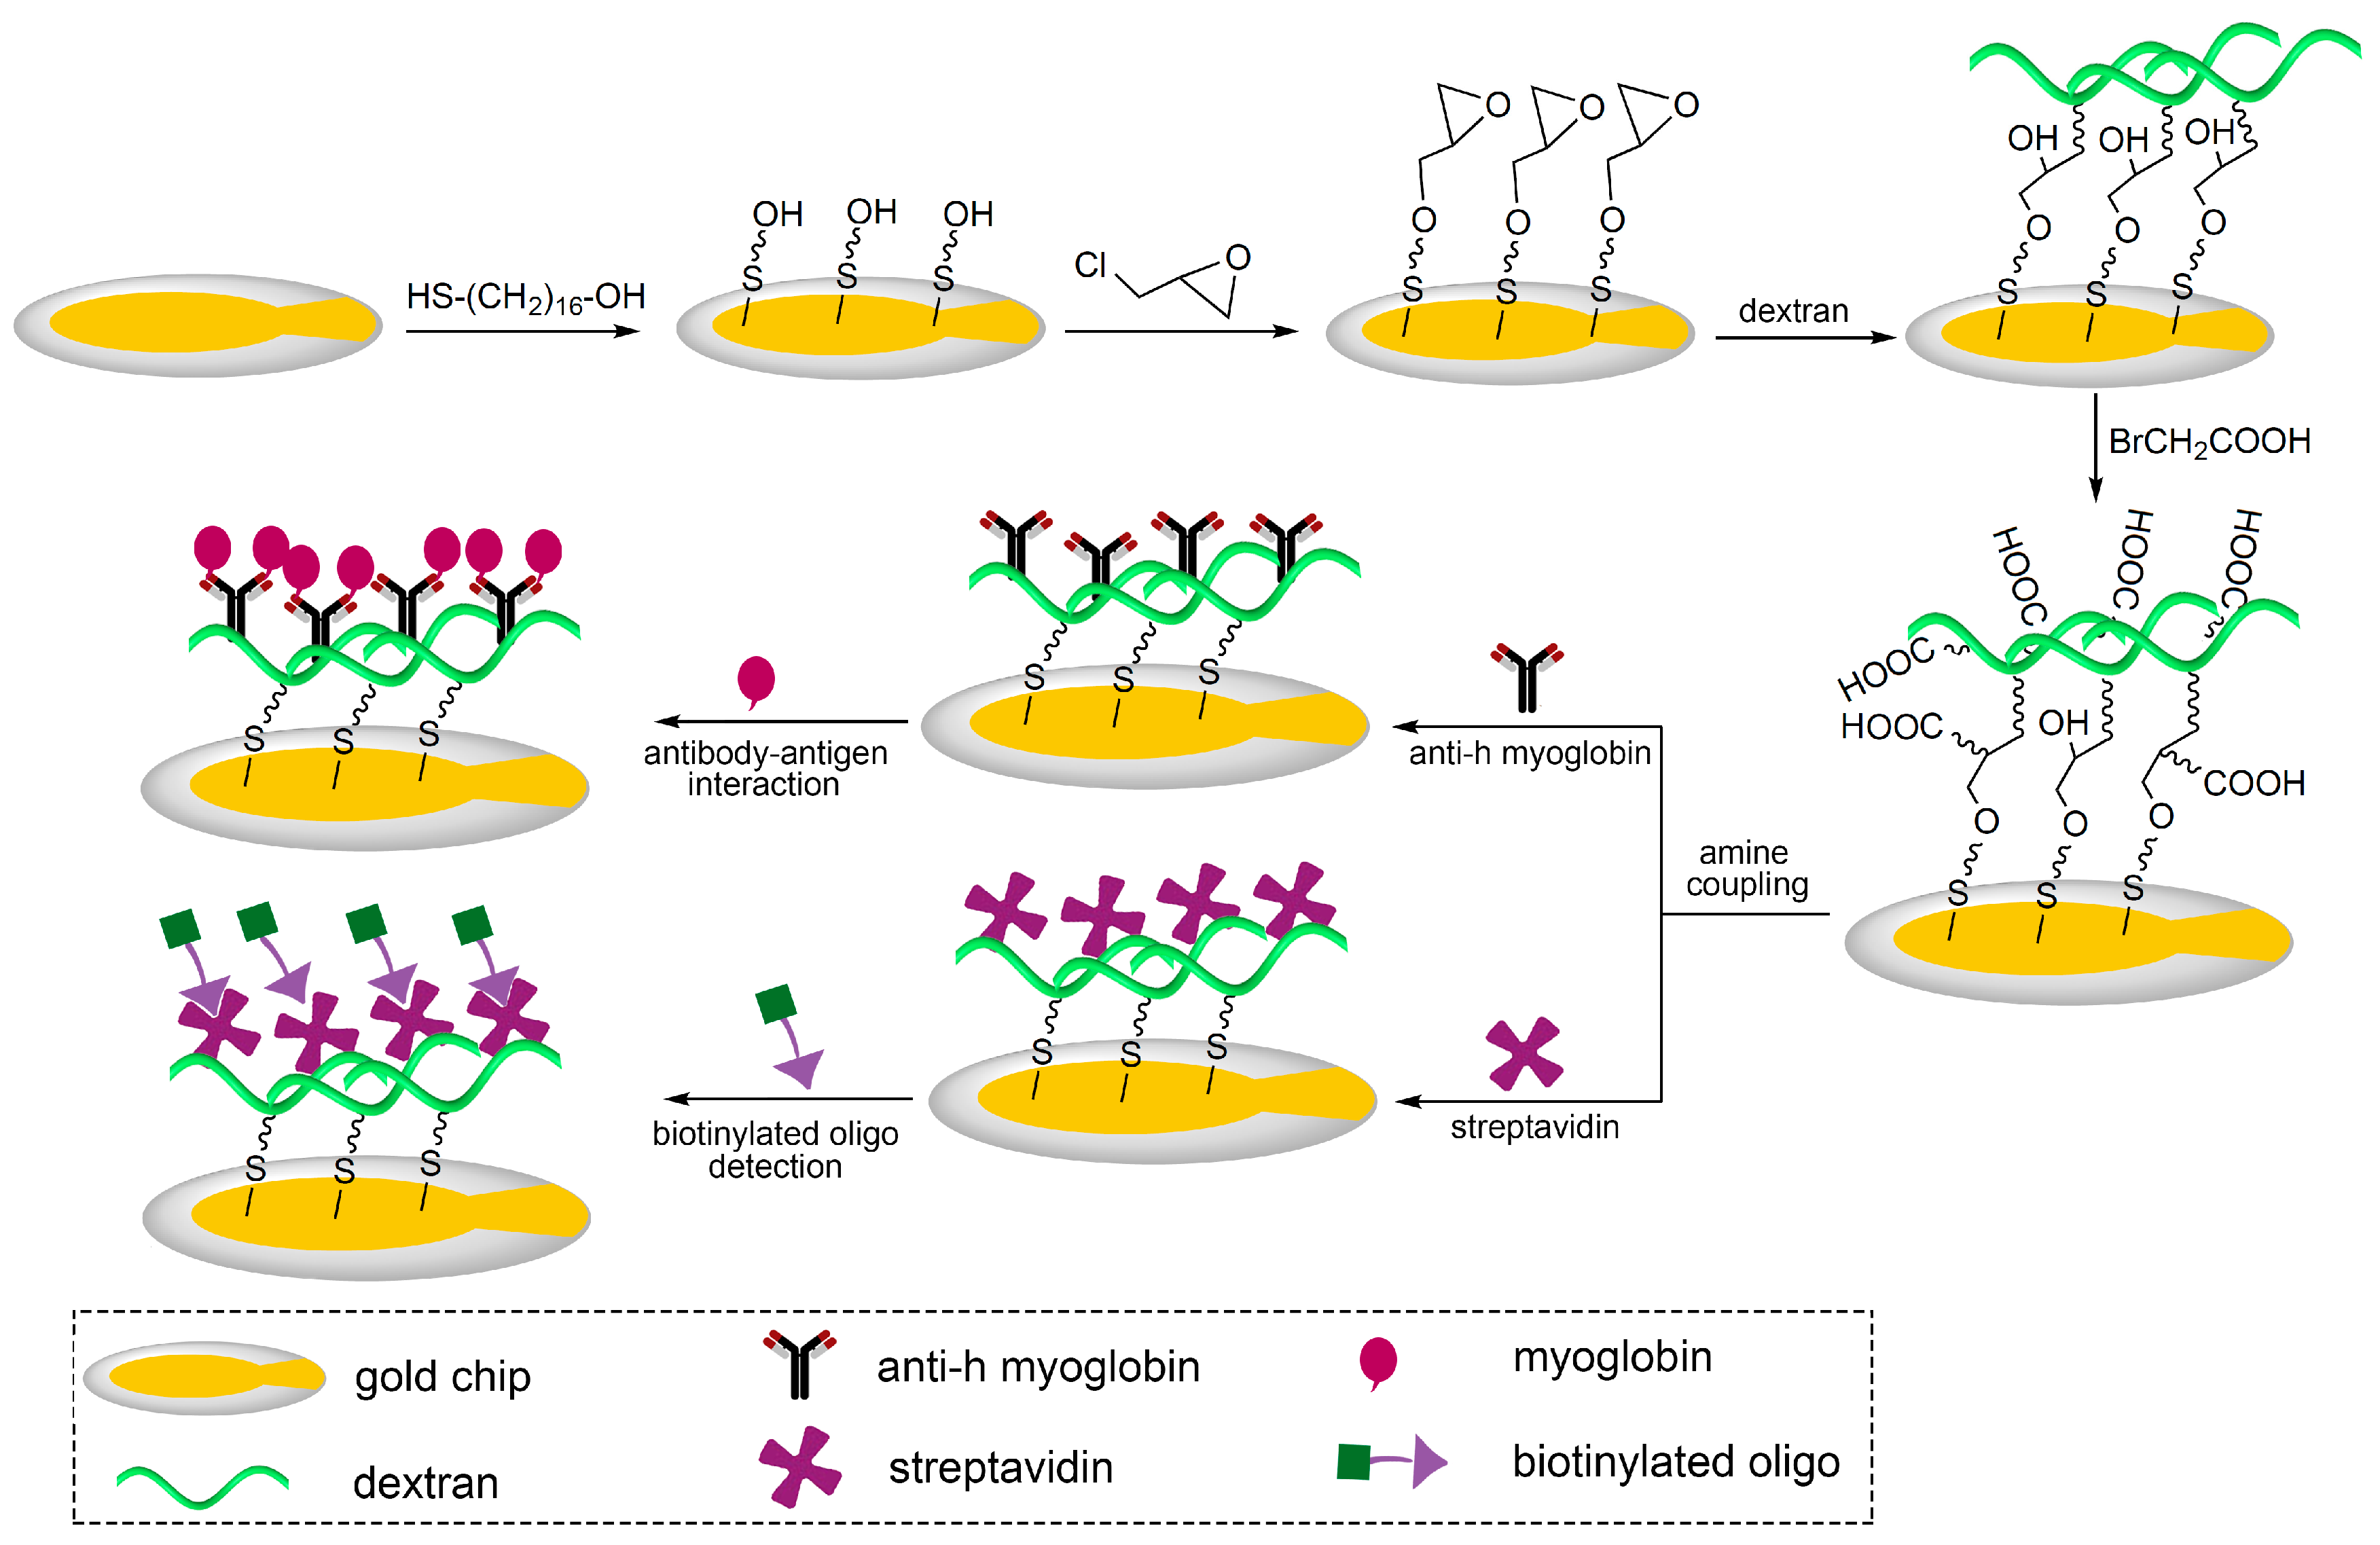
2.2. Fabrication of the 3D Carboxymethyl Dextran Sensor Chip with Different Molecular Weight Dextran

The 3D carboxymethyl dextran sensor chip was fabricated according to the protocol published by Löfås and Johnsson [32]. The gold sensor chip surfaces were cleaned in a 1:1:5 (v/v/v) solution of H2O2 (30%), NH3 (25%), and ultrapure water for 15 min at 85 °C, and thoroughly rinsed with ultrapure water and ultra-sonicated in 99.5% ethanol for 10 min, and dried under nitrogen flow. The cleaned gold sensor chip surfaces were immersed in a 1 mM solution of HS–(CH2)16–OH in 99.5% ethanol at room temperature for 16 h, and were rinsed with ethanol and ultrapure water. The surfaces were then reacted with a 0.6 M epichlorohydrin solution in a 1:1 mixture of 0.4 M sodium hydroxide and diglyme on the shaking-table for 4 h at room temperature. After thoroughly washing with ultrapure water three times, the resulting surfaces were immersed in a dextran solution (5.0 g dextran 100 kDa, 500 kDa, and 2000 kDa in 25 mL 0.4 M sodium hydroxide) and incubated on shaking-table for 26 h at room temperature. The surfaces were then rinsed with ultrapure water three times. Further carboxylation on the surfaces was done by reaction with 1 M bromoacetic acid in 2 M sodium hydroxide at room temperature for 16 h. The 3D carboxymethyl dextran matrix surfaces were finally rinsed and then dried with nitrogen directly. The chips were stored in nitrogen, protected from contaminations and dust, at 0–8 °C.

2.3. Immobilization of Protein on the Sensor Surface

The 2D carboxyl surface or 3D carboxymethyl dextran surface was first inserted to the QCM sensor system and allowed to stabilize at a flow rate of 100 μL/min in HEPES-buffered saline running buffer (10 mM HEPES, 150 mM NaCl, 0.005% Tween® 20, pH 7.4). When the baseline was stable (baseline drift <0.2 Hz/min), the flow rate was lowered to 5 μL/min.
To immobilize Anti-h myoglobin 7005, the chip surface was activated twice with a 1:1 mixture of 0.4 M EDC and 0.1 M NHS or sulfo-NHS for a period of 10 min each. Anti-h myoglobin 7005 dissolved in 10 mM acetic acid buffer, pH 4.5 at a concentration of 50 μg/mL, was thereafter injected three times over the activated chip surface. To deactivate any remaining NHS esters, two injections of 1 M ethanolamine pH 8.5 were performed for a period of 10 min each.

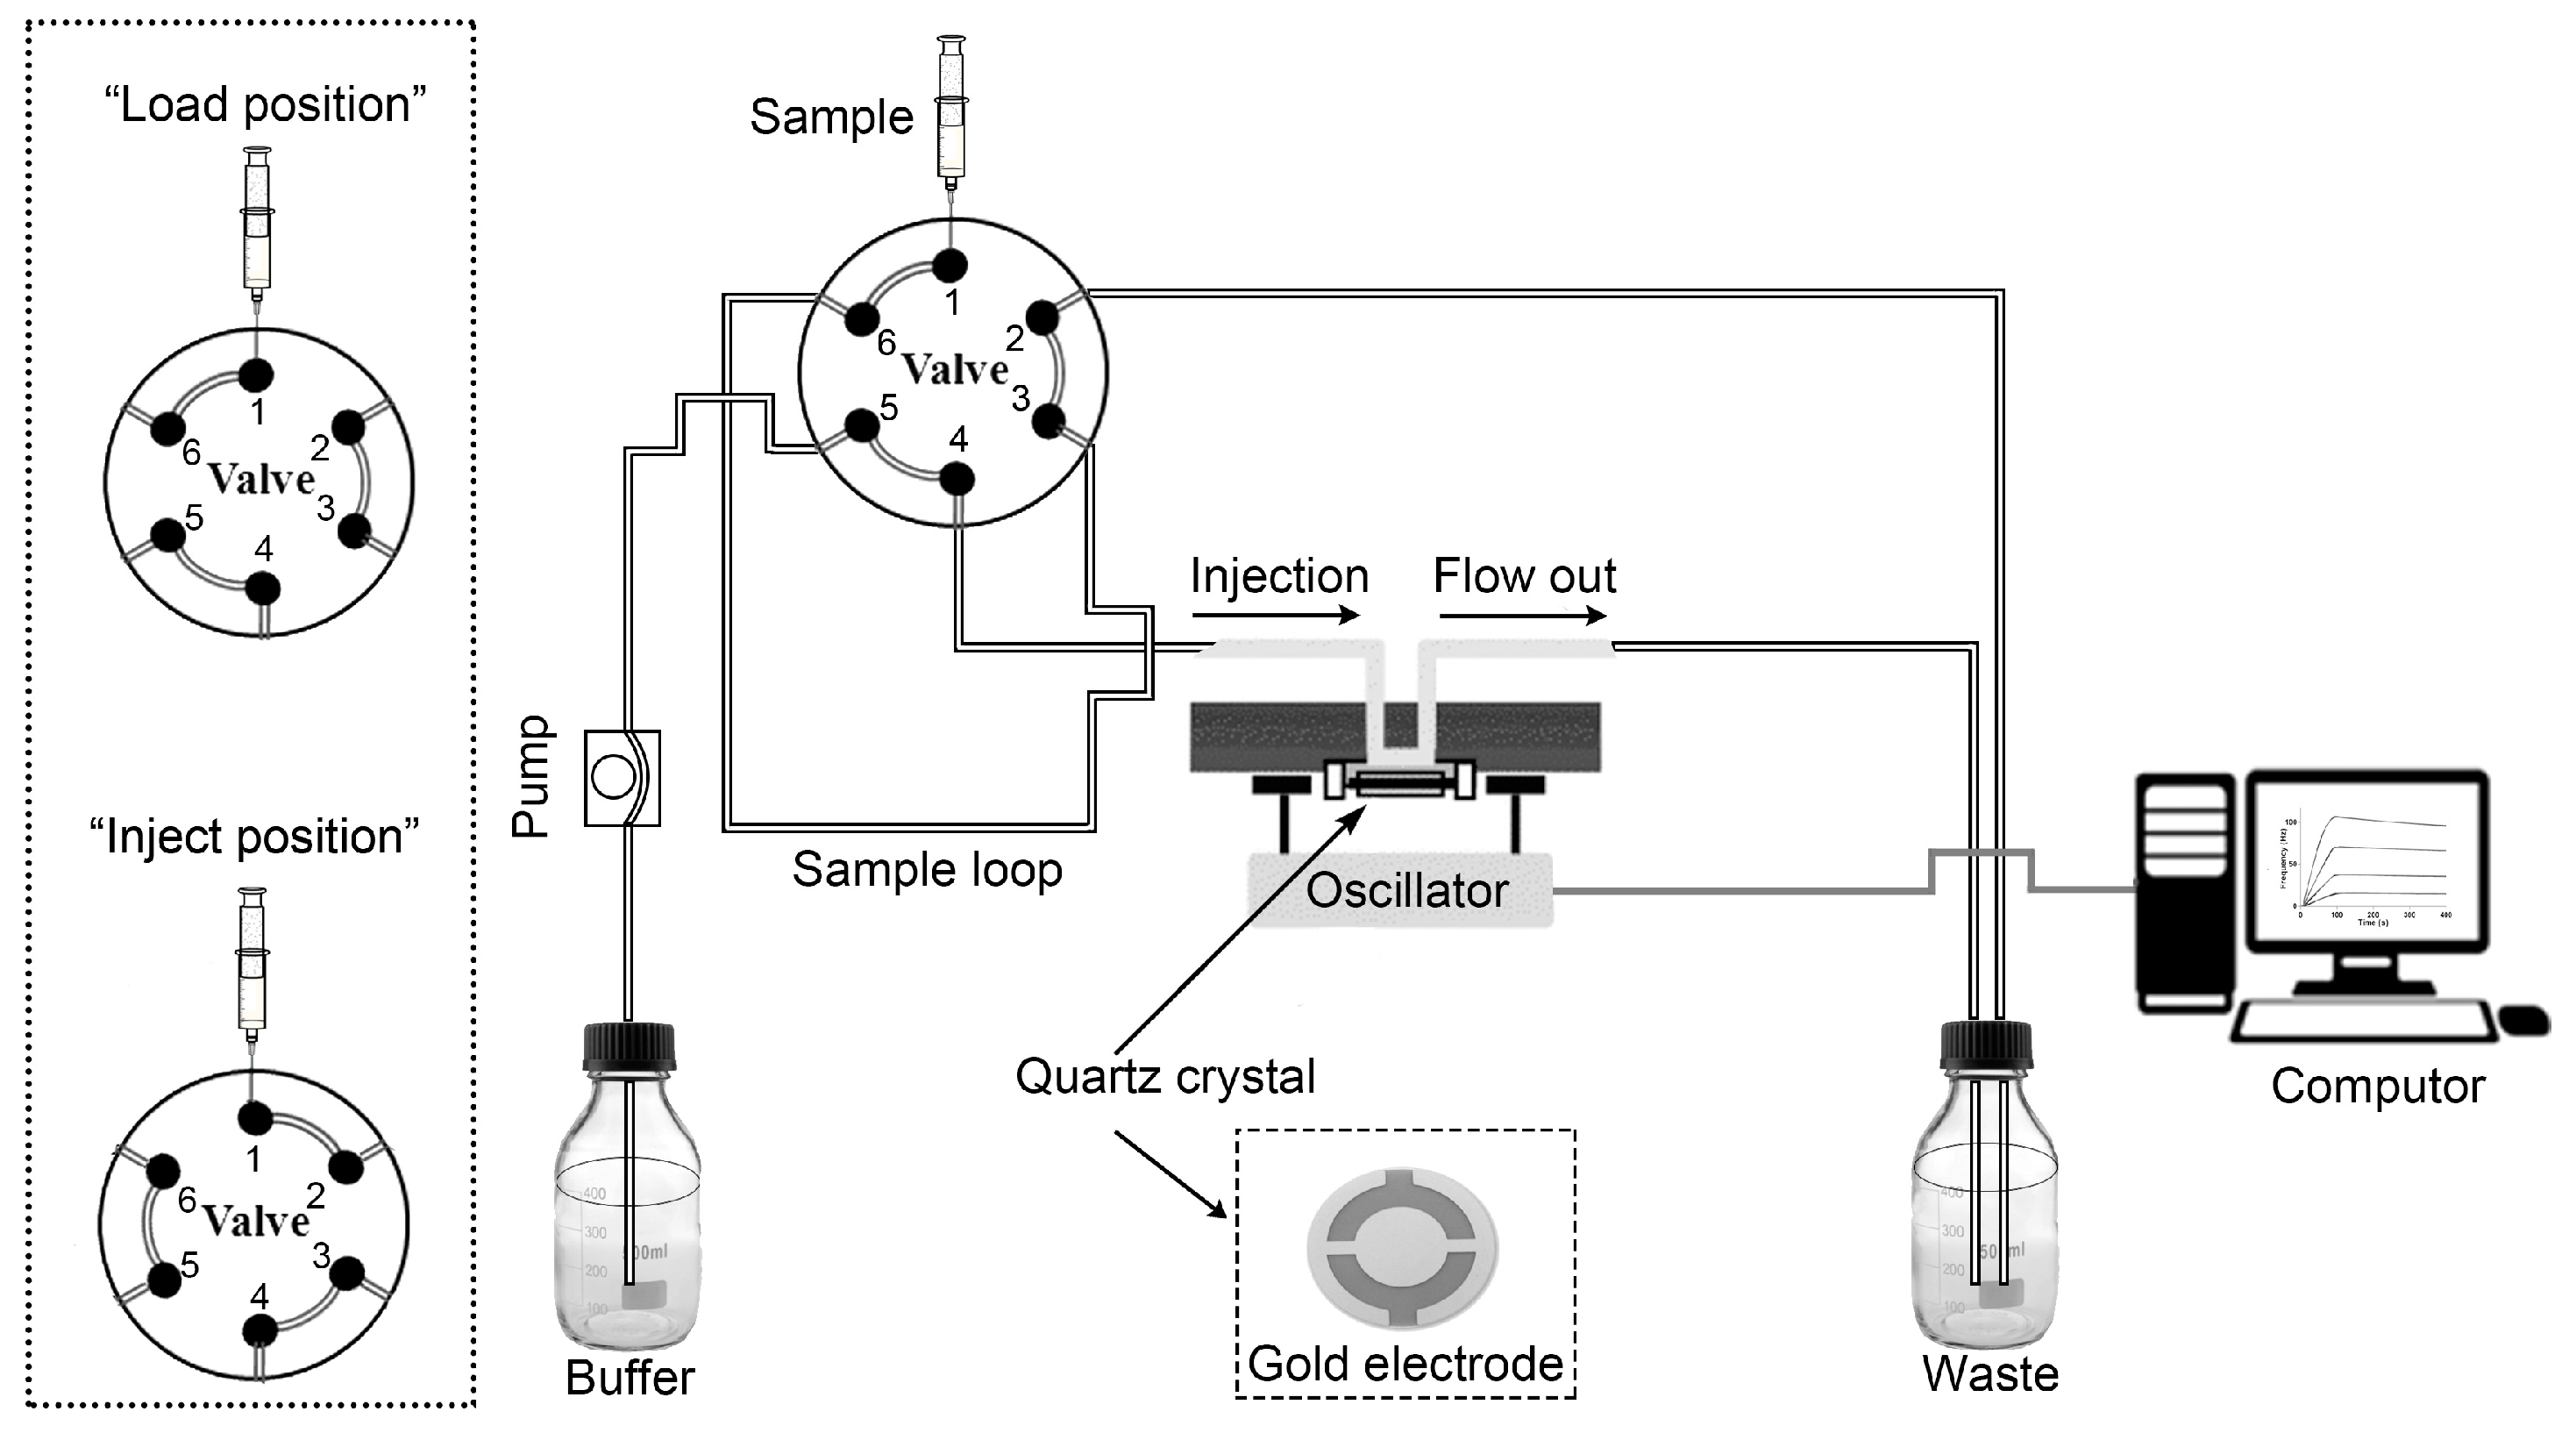
2.4. Protein–Protein Interactions and Kinetic Characterization with QCM

To study the interaction of Anti-h myoglobin 7005 with its interacting protein, the flow rate was set to 25 µL/min. The interacting protein myoglobin was diluted in running buffer at a series of concentration and injected over the chip surface. Regeneration was performed by 0.1 M glycine pH 1.5 to remove the interacting protein. The binding of the two proteins was monitored for a period of 85 s for association and 300 s for dissociation. The frequency shifts (Δf) were recorded with the Attester software and could be loaded directly from Attester Evaluation software. The data was then analyzed by the software ClampXP, which is a biosensor kinetic data analysis program developed to interpret interaction kinetics by fitting data to appropriate models. ClampXP performs a number of interaction analysis with the fit of a theoretical 1:1 interaction model that are influenced by mass transport limitation [43]. The fitted data sets were used to interpret the kinetics of macromolecular interactions, such as the association rate constant: kon, the dissociation rate constant koff, and the affinity constant KD, which characterize the kinetics of the interaction.

2.5. Detection of Low Molecular Weight Oligo by QCM

The 3D carboxymethyl dextran sensor chip surface was first inserted to the QCM instrument and allowed to stabilize at a flow rate of 100 μL/min in HEPES-buffered saline running buffer. When the baseline was stable (baseline drift <0.2 Hz/min), the flow rate was set to 5 μL/min. The sensor chip surface was activated twice with a reagent mixture of EDC and NHS at final concentrations of 0.2 M and 0.05 M twice for a period of 10 min each. Subsequent to surface activation, streptavidin diluted in 10 mM acetic acid buffer, pH 4.5 at a concentration of 50 μg/mL, was injected three times over the activated surface. To deactivate remaining NHS esters on the surface, two injections of 1 M ethanolamine pH 8.5 was performed with a contact time of 10 min each. The surface was allowed to stabilize until drift was less than 1 Hz over 10 min. HEPES-buffered saline running buffer was injected over the surface as blank for 600 s, waiting at least 600 s after injection. Then the biotinylated oligo was dissolved in running buffer at 10 μM and injected over the surface for a contact time of 600 s.

3. Results and Discussion

The 3D carboxymethyl dextran sensor chip surfaces were fabricated with dextran of different molecular weights as shown in Figure 2. In this work, the interaction between the immobilized protein and its receptor was monitored using a QCM biosensor. The immobilization capacity and the binding activity of the 3D surfaces (100, 500, and 2000 kDa) were compared, and the 3D carboxymethyl dextran surface with the molecular weight of 2000 kDa resulted in the highest sensitivity for enhanced surface capacity. Most notably, the 3D carboxymethyl dextran (2000 kDa) surface provided the QCM biosensor accessibility to acquire adequate response signals even probing detections of low molecule weight samples.

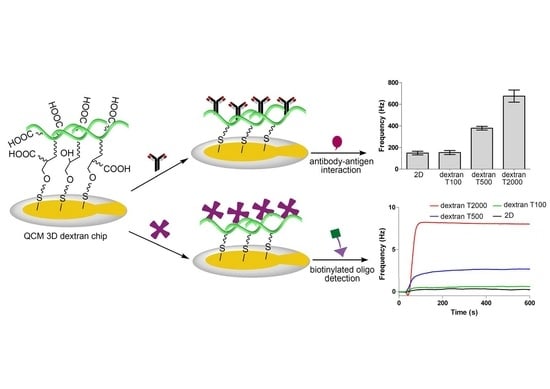
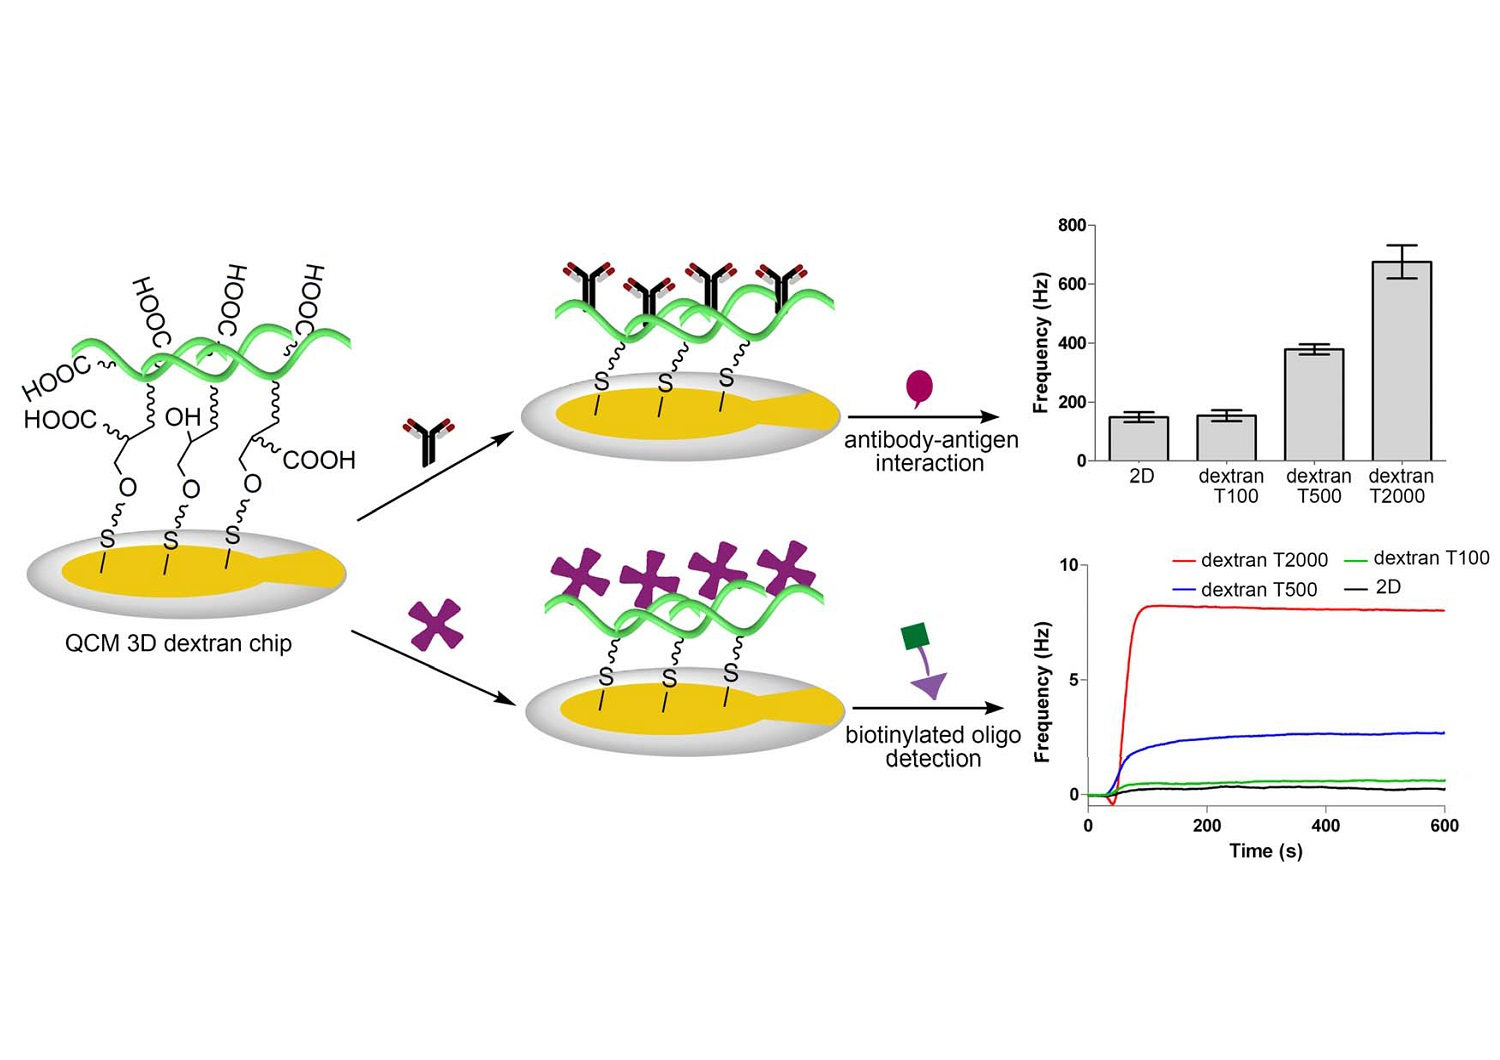
3.1. Comparison of Immobilization and Binding Capacity on 2D and 3D Surfaces

In our experiments, the comparisons of the immobilization of Anti-h myoglobin protein via amine coupling on 2D and 3D carboxymethyl dextran surfaces were carried out by QCM. For the 2D chip surface, the carboxyl surface was activated with EDC/sulfo–NHS [44], and for the 3D surface, the surface was activated with EDC/NHS [45]. Subsequently, Anti-h myoglobin 7005 was dissolved in acetic acid buffer (pH 4.5) at 50 μg/mL for three injections through the activated sensor chip surface at 5 μL/min. Remaining active groups on the surface were deactivated by 1 M ethanolamine at pH 8.5. The typical example of the immobilization sensorgram on 3D carboxymethyl dextran surface (2000 kDa) is shown in Figure 3. To test the binding capacity, the interaction protein myoglobin was diluted in the running buffer of 4 µg/mL at 25 μL/min. Compared to the 2D surface, the flexible dextran chain illustrates higher immobilization and binding capacity. In particular, the 3D carboxymethyl dextran surface of 2000 kDa, exhibited the greatest immobilization and binding capacity among the three 3D surfaces modified with different molecular weight dextran.
As shown in Figure 4a, the frequency shift (149 Hz) was obtained from immobilization of Anti-h myo 7005 on the 2D surface, and the frequency shifts of 155, 375, and 697 Hz were obtained from immobilization of Anti-h myo 7005 on the 3D carboxymethyl dextran (100, 500, and 2000 kDa) surface. The frequency illustrated the binding capacity of the immobilized protein, that is the higher the frequency, the greater number of events detected. The protein immobilization capacity of the 3D (100 kDa) surface was nearly the same as the 2D surface. Interestingly, the protein immobilization capacity of the 3D (500 kDa) surface exceeded more than 2 times the capacity of the 2D chip surface. Significantly, the protein immobilization capacity of the 3D (2000 kDa) surface exceeded more than 4 times the capacity of the 2D surface. Such a remarkable enhancement in immobilization capacity allowed the QCM to detect adequate response signals during the binding of myoglobin. The signals of myoglobin binding on 2D and 3D surfaces are shown in Figure 4b. The 3D surface (2000 kDa) captured about 100 Hz of the myoglobin, which is approximately 3 times than that of the 2D surface, and the 3D surface (500 kDa) captured about 60 Hz of the myoglobin, which is twice as much as that obtained on the 2D surface.

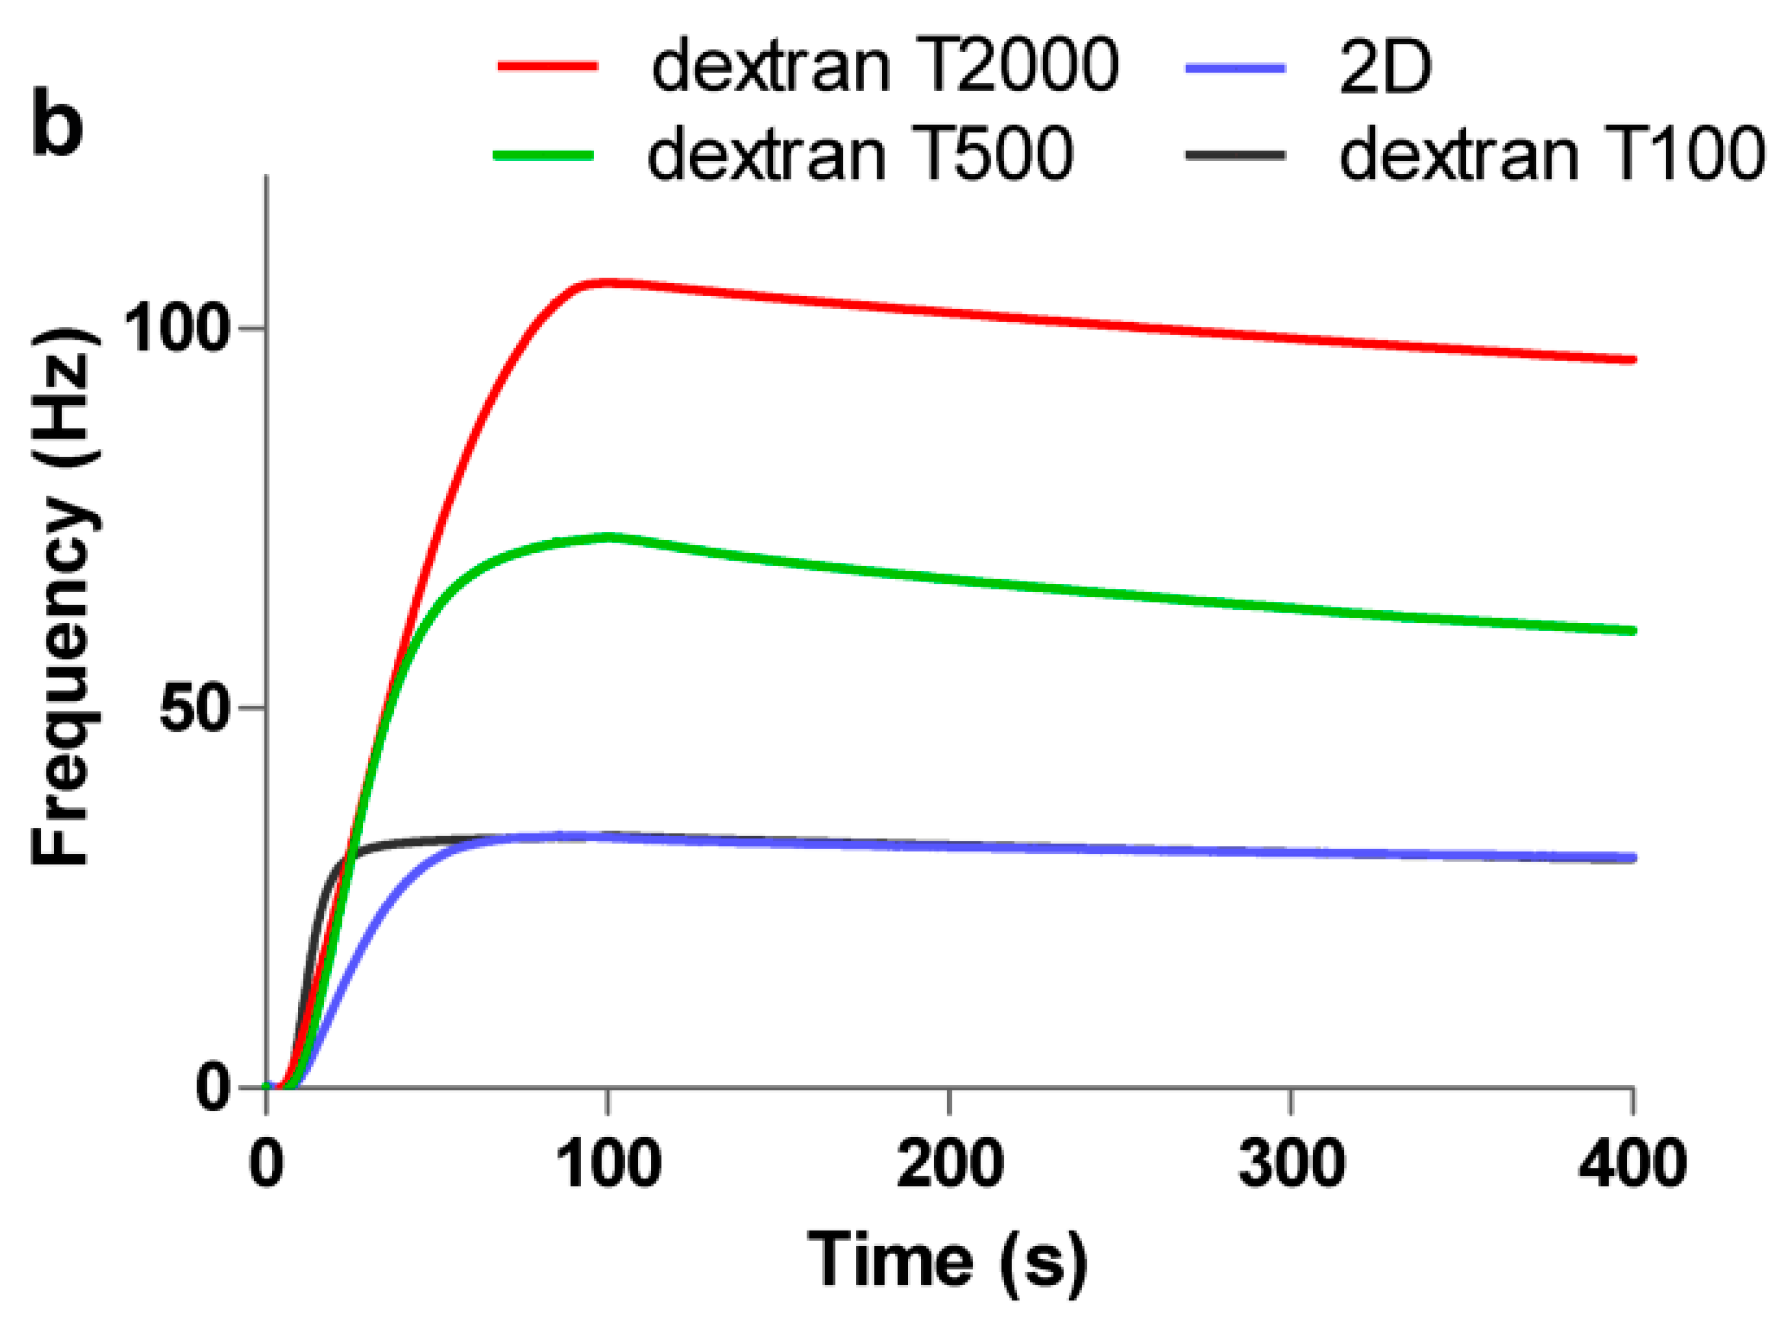
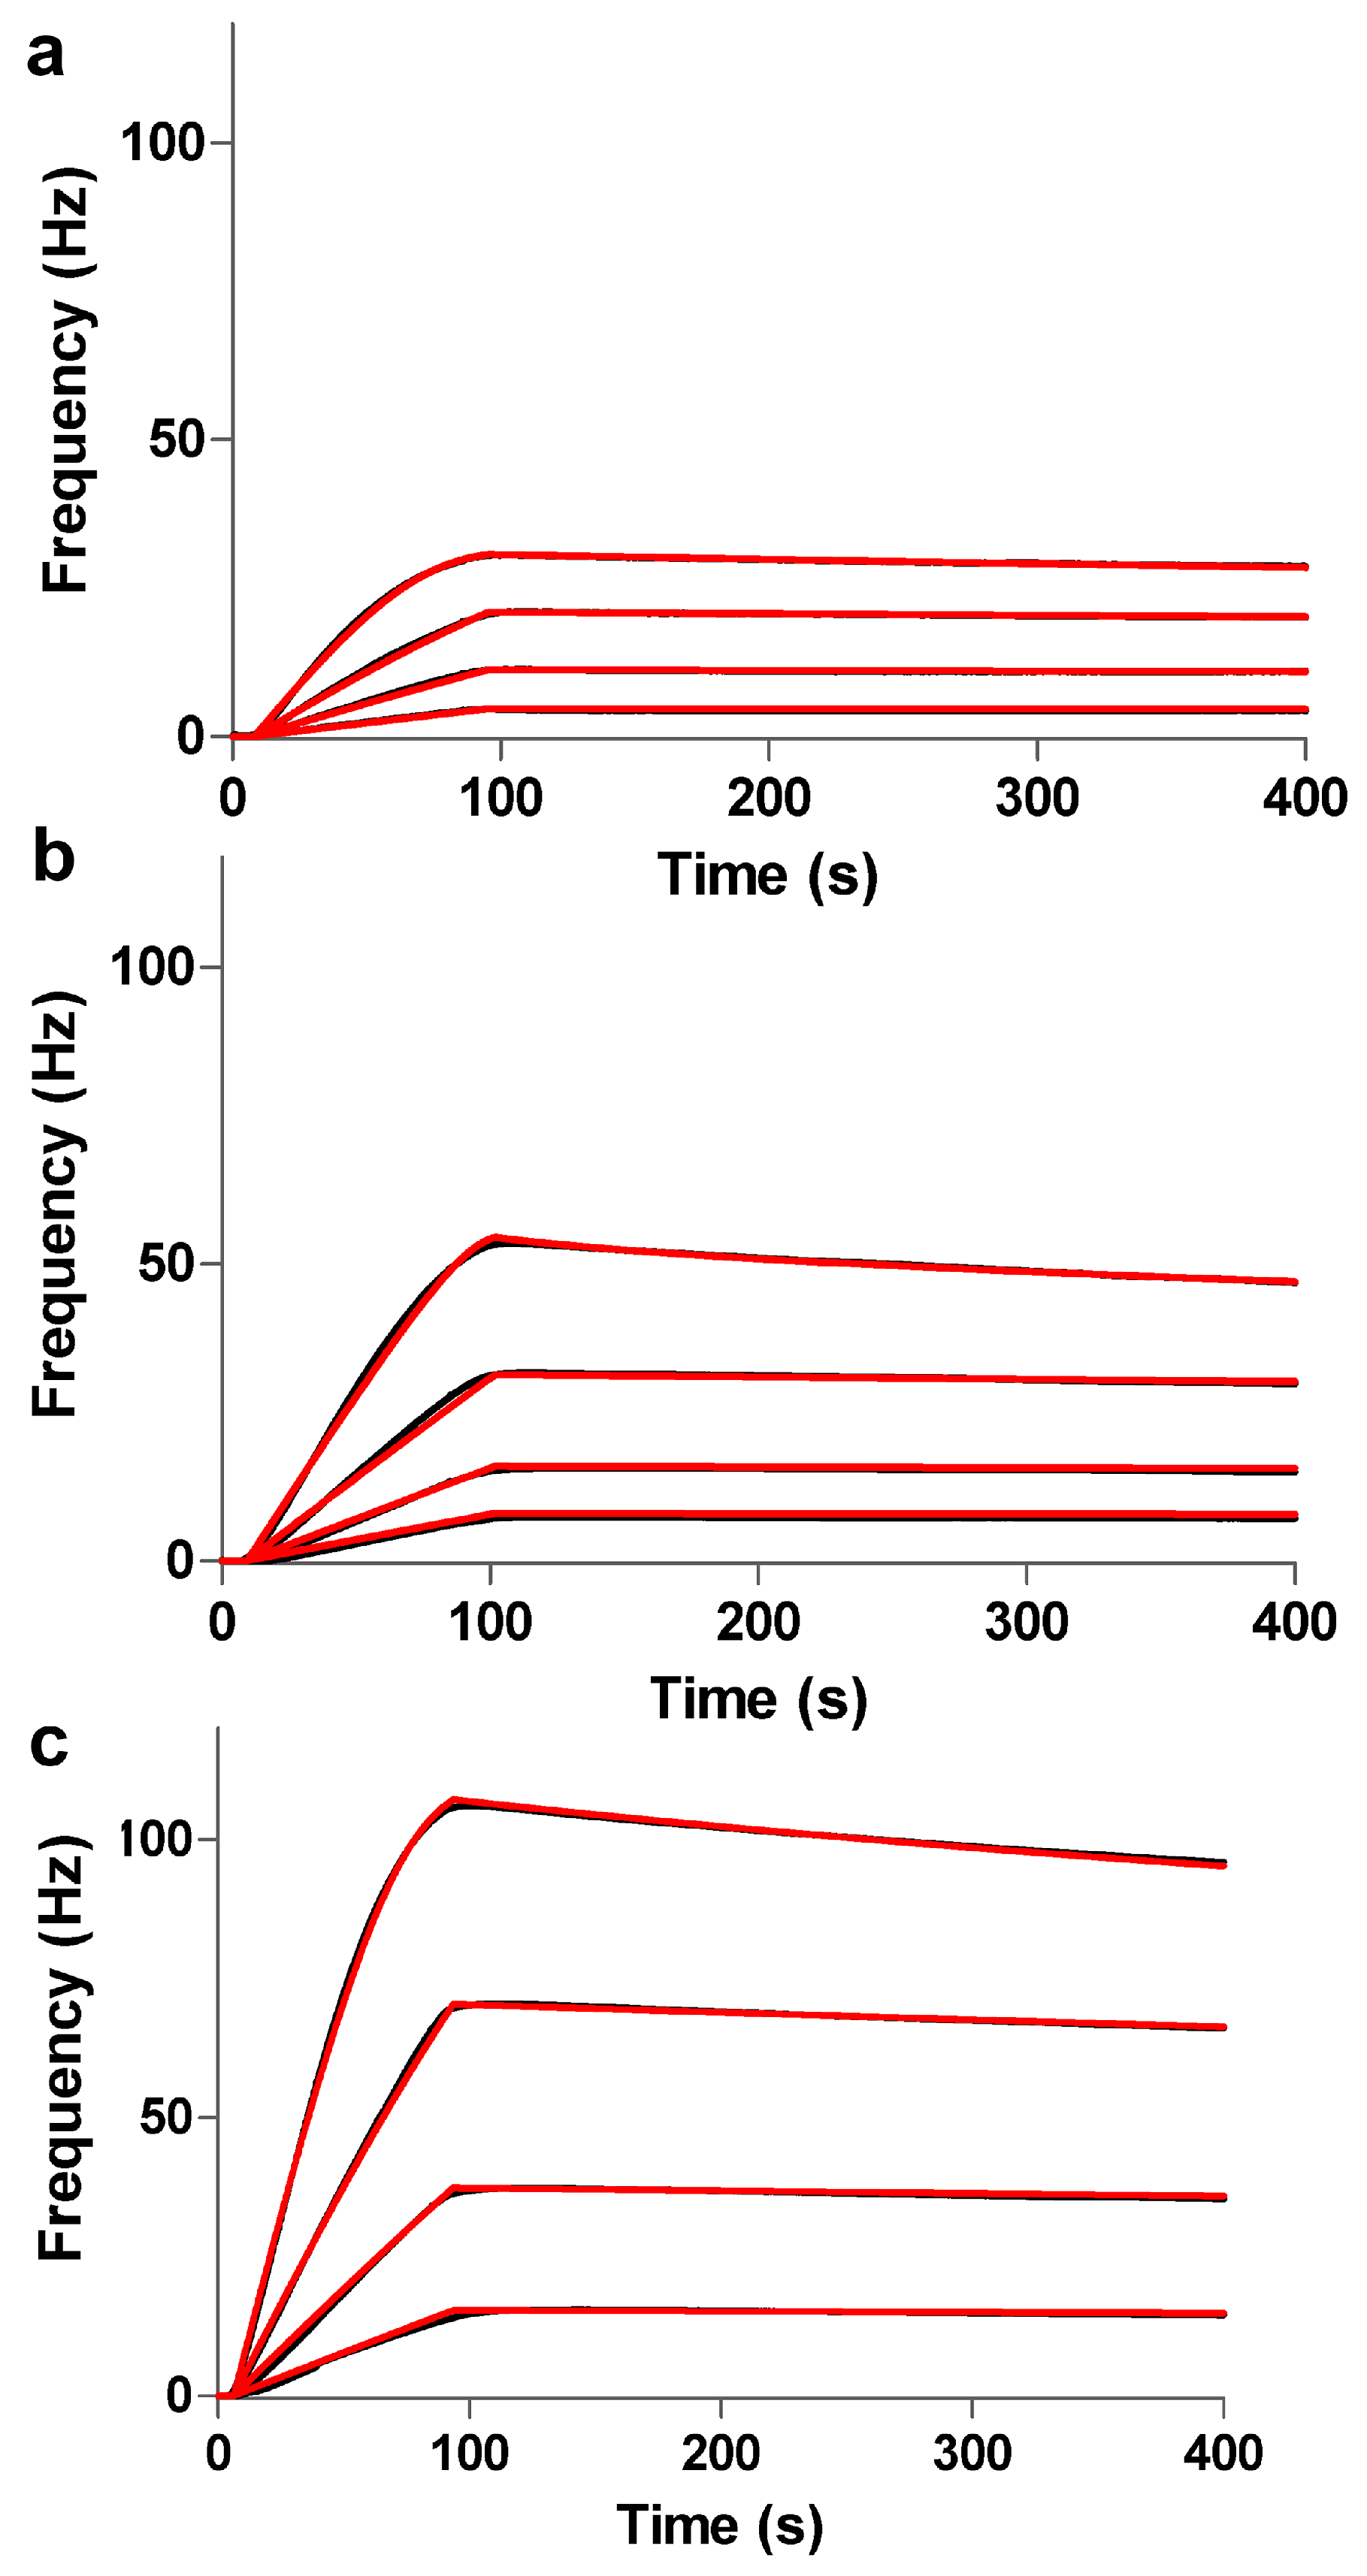
3.2. Interaction and Kinetic Studies

The interactions between Anti-h myoglobin 7005 and myoglobin were evaluated using the Attana Cell A200 QCM biosensor. To study the kinetic and affinity properties of the interaction between the captured Anti-h myoglobin 7005 and its interacting protein myoglobin on the different surfaces, myoglobin was diluted in the running buffer and then injected over the surface at a series of concentrations from 0.03 µM to 0.24 µM. The interaction between Anti-h myoglobin 7005 and myoglobin was monitored for 85 s for association and for 300 s for dissociation. The surface was regenerated via 0.1 M glycine (pH 1.5) injection, which removed the interacting protein myoglobin after each cycle, and the measured responses are presented in Figure 5 along with the theoretical 1:1 fit produced by the ClampXP software. The frequency shift (149 Hz) was obtained from immobilization of Anti-h myo 7005 on the 2D surface, and myoglobin at 0.03, 0.06, 0.12, and 0.24 µM were injected over the surface, giving the resultant kon = 8.31 × 10⁵ M−1·s−1, koff = 9.71 × 10⁻⁴ s−1 and KD = 1.17 nM, which is displayed in Figure 5a. The immobilization frequency of Anti-h myo 7005 was recorded with maximum frequency shifts of 375 Hz on the 3D carboxymethyl dextran (500 kDa) surface, and myoglobin at 0.03, 0.06, 0.12, and 0.24 µM were injected over the surface, giving the resultant kon = 5.80 × 10⁵ M−1·s−1, koff = 7.16 × 10⁻⁴ s−1 and KD =1.23 nM, which is displayed in Figure 5b. The frequency shift (697 Hz) was obtained from immobilization of Anti-h myo 7005 on the 3D carboxymethyl dextran (2000 kDa) surface, and myoglobin at 0.03, 0.06, 0.12, and 0.24 µM were injected over the surface, giving the resultant kon = 4.17 × 10⁵ M−1·s−1, koff = 5.21 × 10⁻⁴ s−1 and KD = 1.25 nM, which is displayed in Figure 5c. Furthermore, the 3D surface also produced different binding characteristics compared to the 2D surface, revealing that both the association and dissociation rates on the 3D surface are slower than that on the 2D surface. We hypothesize that the lower association rate on the 3D surface is mainly due to mass transfer limitation and steric hindrance effects as the protein required a finite time to fully penetrate the dextran matrix. The lower dissociation rate may be due to the larger number of binding sites on the 3D surface [31].

3.3. Regeneration and Stability of the Sensing Surface

Surface regeneration is one of the significant factors in the study of biomolecule interactions. Successful surface regeneration for cyclic use would make the sensor chips more cost effective and the experiments less time-consuming. The protein Anti-h myo 7005 diluted in acetic acid buffer pH 4.5 at a concentration of 50 μg/mL was conjugated to the 3D carboxymethyl dextran (2000 kDa) surface by amine coupling, then myoglobin dissolved in the running buffer was injected over the surface. Surface regeneration was performed by removing the bound protein for the next analysis cycle. The surface was successfully regenerated when all of the remaining bound protein had been desorbed from the surface. A typical sensorgram is displayed in Figure 6a, in which two injections of myoglobin at 2 μg/mL were performed successively within the regeneration step, including one injection of 0.1 M glycine pH 1.5 for 30 s, in between. The reproducibility of the surface was examined by running 10 repeats of the myoglobin injection at the same concentration and monitoring the binding curve to verify their similarity. The results are presented in Figure 6b. The standard deviation of the baseline value does not exceed 0.4% of the immobilization level of myoglobin after 10 cycles. The 3D carboxymethyl dextran surface (2000 kDa) was capable of being used for several cycles of analyses without any significant change in baseline. All the measurements were performed at a flow rate of 25 μL/min. The results indicated good reversibility and reproducibility of the 3D carboxymethyl dextran (2000 kDa) surface.

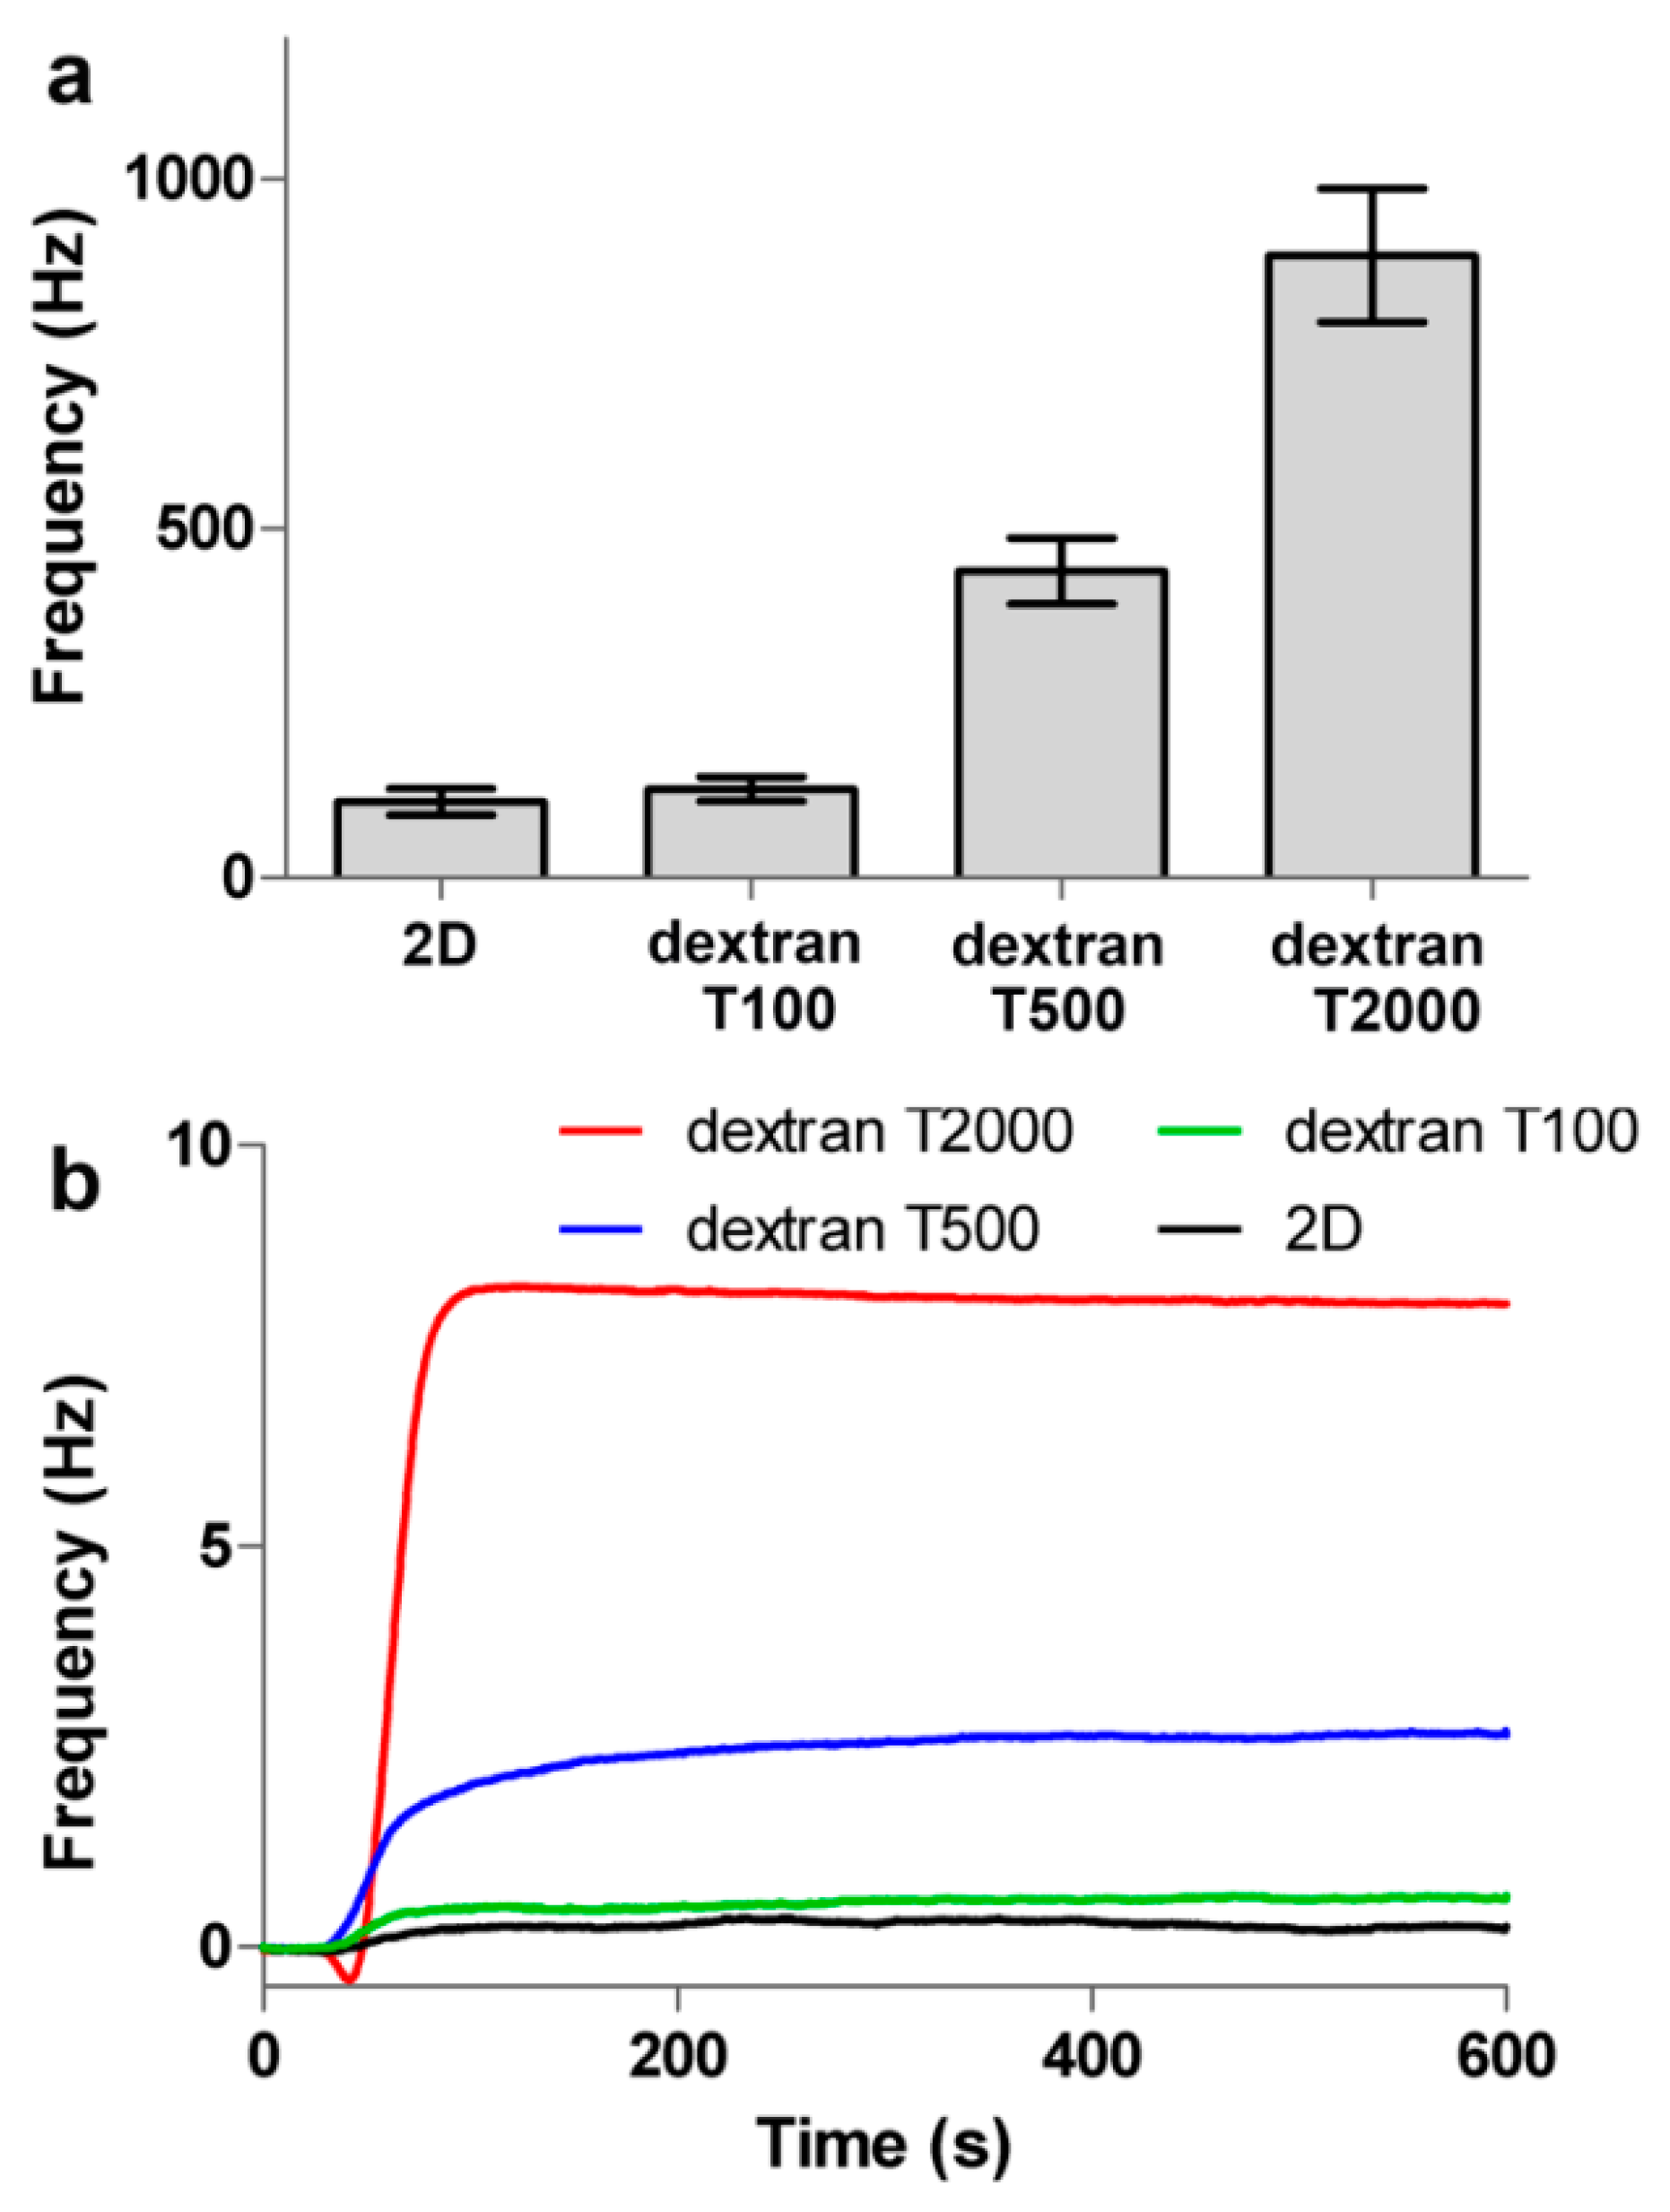
3.4. Evaluating Sensitivity of the Surface

In order to investigate the influence of the dextran with different molecular weights on the sensitivity of sensor chip surface, the 2D carboxyl surface and 3D carboxymethyl dextran surfaces (100, 500, and 2000 kDa) were all used for small molecule detection. For small molecule detection using QCM, sufficient protein immobilization on the surface should be considered. Thus, after activation of the surface by 0.2 M EDC and 0.05 M NHS for a period of 20 min at 5 μL/min, streptavidin diluted in acetic acid buffer pH 4.5 at a concentration of 50 μg/mL was conjugated to the sensor chip surface by amine coupling. The typical example of the immobilization sensorgram on 3D carboxymethyl dextran surface (2000 kDa) is shown in Figure 7. Compared to the 2D surface, the 3D surface exhibited increased immobilization capacity. As shown in Figure 8a, the frequency shift (110 Hz) was obtained from immobilization of streptavidin on the 2D surface, and the frequency shifts of 125, 430, and 900 Hz were obtained from immobilization of streptavidin on the 3D carboxymethyl dextran (100, 500, and 2000 kDa) surface, respectively. Then, the biotinylated oligo was dissolved in running buffer at a concentration of 10 μM and injected over the surface for a contact time of 600 s, and the running buffer was injected over 600 s over the surface as a reference before every injection of the biotinylated oligo. While no response was observed on 2D surface and 3D carboxymethyl dextran (100 kDa) surface, 2.5 Hz of the biotinylated oligo was bound to the streptavidin on the 3D carboxymethyl dextran (500 kDa) sensor chip surface, and 8.1 Hz of the biotinylated oligo was bound to the streptavidin on the 3D carboxymethyl dextran (2000 kDa) sensor chip surface, which are presented in Figure 8b. The result confirmed that 2D and 3D carboxymethyl dextran (100 kDa) surfaces were not capable of detecting small molecular binding events, while the 3D carboxymethyl dextran (500 and 2000 kDa) allowed QCM to detect adequate response signals when probing small molecule binding events.

4. Conclusions

In this paper, 3D carboxymethyl dextran surfaces were successfully fabricated with dextran of different molecular weight (100, 500, and 2000 kDa). To evaluate their surface immobilization capacity, each surface was used for studying antigen–antibody interactions on the QCM biosensor. Advantageous protein immobilization capacity of the 3D (2000 kDa) surface has been confirmed, showing that the immobilization capacity was improved more than 4 times compared to a 2D surface, and more than 2 times compared to a traditional 3D carboxymethyl dextran (500 kDa) surface. Furthermore, interactions between proteins were detected on the 2D surface and different 3D surfaces, providing more in-depth information about binding kinetics and affinity. The optimized 3D surface (2000 kDa) is able to completely regenerate for several cycles, providing stable immobilization and good reproducibility. Most notably, the 3D carboxymethyl dextran (2000 kDa) surface could be used for small molecule detection, where the binding signal of biotinylated oligo reached 8.1 Hz, while no response was observed on 2D surface. As we know, the detection of small molecular weight analytes with QCM technology is a restriction, and this study will enhance the application in various fields using QCM technology. These inspiring results confirm that the 3D carboxymethyl dextran (2000 kDa) surface demonstrated great potential as a promising platform in characterizing the interactions between small molecule drugs and proteins, which may have further impacts on the discovery of drugs.

Acknowledgments

This study was supported by the National Nature Science Foundation of China (Nos. 21572181 and 31270861) and the Project of Science and Technology of Social Development in Shaanxi Province (2016SF-029).

Author Contributions

Siyu Song and Yuchao Lu conceived and designed the experiments, performed the majority of the experimental work and wrote the manuscript; Xueming Li participated in developing the analytical method and the interpretation of QCM data; Shoupeng Cao performed the part of the experimental work; Yuxin Pei performed the small part of the experimental work; Teodor Aastrup participated in developing the analytical method; Zhichao Pei supervised the work presented in this paper and revised the manuscript.

Conflicts of Interest

The authors declare no conflict of interest.

References

  1. Takahashi, H.; Nakanishi, T.; Kami, K.; Arata, Y.; Shimada, I. A novel nmr method for determining the interfaces of large protein-protein complexes. Nat. Struct. Biol. 2000, 7, 220–223. [Google Scholar] [CrossRef] [PubMed]
  2. Takeuchi, K.; Wagner, G. Nmr studies of protein interactions. Curr. Opin. Struct. Biol. 2006, 16, 109–117. [Google Scholar] [CrossRef] [PubMed]
  3. Carlomagno, T.; Blommers, M.J.J.; Meiler, J.; Jahnke, W.; Schupp, T.; Petersen, F.; Schinzer, D.; Altmann, K.H.; Griesinger, C. The high-resolution solution structure of epothilone a bound to tubulin: An understanding of the structure-activity relationships for a powerful class of antitumor agents. Angew. Chem. Int. Ed. 2003, 42, 2511–2515. [Google Scholar] [CrossRef] [PubMed]
  4. Harada, S.; Hiromori, Y.; Nakamura, S.; Kawahara, K.; Fukakusa, S.; Maruno, T.; Noda, M.; Uchiyama, S.; Fukui, K.; Nishikawa, J.; et al. Structural basis for ppar gamma transactivation by endocrine-disrupting organotin compounds. Sci. Rep. 2015, 5, 8520. [Google Scholar] [CrossRef] [PubMed]
  5. Dominguez, C.; Boelens, R.; Bonvin, A. Haddock: A protein-protein docking approach based on biochemical or biophysical information. J. Am. Chem. Soc. 2003, 125, 1731–1737. [Google Scholar] [CrossRef] [PubMed]
  6. Arroyo-Maya, I.J.; Campos-Teran, J.; Hernandez-Arana, A.; McClements, D.J. Characterization of flavonoid-protein interactions using fluorescence spectroscopy: Binding of pelargonidin to dairy proteins. Food Chem. 2016, 213, 431–439. [Google Scholar] [CrossRef] [PubMed]
  7. Zhang, Y.Z.; Zhou, B.; Liu, Y.X.; Zhou, C.X.; Ding, X.L.; Liu, Y. Fluorescence study on the interaction of bovine serum albumin with p-aminoazobenzene. J. Fluoresc. 2008, 18, 109–118. [Google Scholar] [CrossRef] [PubMed]
  8. Glish, G.L.; Vachet, R.W. The basics of mass spectrometry in the twenty-first century. Nat. Rev. Drug Discov. 2003, 2, 140–150. [Google Scholar] [CrossRef] [PubMed]
  9. Li, R.L.; Lin, C.W.; Shao, Y.L.; Chang, C.W.; Yao, F.K.; Kowal, M.D.; Wang, H.S.; Yeung, M.T.; Huang, S.C.; Kaner, R.B. Characterization of aniline tetramer by maldi tof mass spectrometry upon oxidative and reductive cycling. Polymers 2016, 8, 401. [Google Scholar] [CrossRef]
  10. Lee, C.S.; Muthusamy, A.; Abdul-Rahman, P.S.; Bhavanandan, V.P.; Hashim, O.H. An improved lectin-based method for the detection of mucin-type O-glycans in biological samples. Analyst 2013, 138, 3522–3529. [Google Scholar] [CrossRef] [PubMed]
  11. Pan, X.R.; Liu, R.T.; Qin, P.F.; Wang, L.; Zhao, X.C. Spectroscopic studies on the interaction of acid yellow with bovine serum albumin. J. Lumin. 2010, 130, 611–617. [Google Scholar] [CrossRef]
  12. Citartan, M.; Gopinath, S.C.B.; Tominaga, J.; Chen, Y.; Tang, T.H. Use of UV–Vis–NIR spectroscopy to monitor label-free interaction between molecular recognition elements and erythropoietin on a gold-coated polycarbonate platform. Talanta 2014, 126, 103–109. [Google Scholar] [CrossRef] [PubMed]
  13. Christau, S.; Thurandt, S.; Yenice, Z.; von Klitzing, R. Stimuli-responsive polyelectrolyte brushes as a matrix for the attachment of gold nanoparticles: The effect of brush thickness on particle distribution. Polymers 2014, 6, 1877–1896. [Google Scholar] [CrossRef]
  14. Homola, J. Surface plasmon resonance sensors for detection of chemical and biological species. Chem. Rev. 2008, 108, 462–493. [Google Scholar] [CrossRef] [PubMed]
  15. Smith, E.A.; Thomas, W.D.; Kiessling, L.L.; Corn, R.M. Surface plasmon resonance imaging studies of protein–carbohydrate interactions. J. Am. Chem. Soc. 2003, 125, 6140–6148. [Google Scholar] [CrossRef] [PubMed]
  16. Green, R.J.; Frazier, R.A.; Shakesheff, K.M.; Davies, M.C.; Roberts, C.J.; Tendler, S.J.B. Surface plasmon resonance analysis of dynamic biological interactions with biomaterials. Biomaterials 2000, 21, 1823–1835. [Google Scholar] [CrossRef]
  17. Cooper, M.A.; Singleton, V.T. A survey of the 2001 to 2005 quartz crystal microbalance biosensor literature: Applications of acoustic physics to the analysis of biomolecular interactions. J. Mol. Recognit. 2007, 20, 154–184. [Google Scholar] [CrossRef] [PubMed]
  18. Cheng, C.I.; Chang, Y.P.; Chu, Y.H. Biomolecular interactions and tools for their recognition: Focus on the quartz crystal microbalance and its diverse surface chemistries and applications. Chem. Soc. Rev. 2012, 41, 1947–1971. [Google Scholar] [CrossRef] [PubMed]
  19. Li, X.M.; Pei, Y.X.; Zhang, R.N.; Shuai, Q.; Wang, F.; Aastrup, T.; Pei, Z.C. A suspension-cell biosensor for real-time determination of binding kinetics of protein-carbohydrate interactions on cancer cell surfaces. Chem. Commun. 2013, 49, 9908–9910. [Google Scholar] [CrossRef] [PubMed]
  20. Becker, B.; Cooper, M.A. A survey of the 2006–2009 quartz crystal microbalance biosensor literature. J. Mol. Recognit. 2011, 24, 754–787. [Google Scholar] [CrossRef] [PubMed]
  21. Homola, J.; Yee, S.S.; Gauglitz, G. Surface plasmon resonance sensors: Review. Sens. Actuators B 1999, 54, 3–15. [Google Scholar] [CrossRef]
  22. Pei, Y.X.; Yu, H.; Pei, Z.C.; Theurer, M.; Ammer, C.; Andre, S.; Gabius, H.J.; Yan, M.D.; Ramstrom, O. Photoderivatized polymer thin films at quartz crystal microbalance surfaces: Sensors for carbohydrate-protein interactions. Anal. Chem. 2007, 79, 6897–6902. [Google Scholar] [CrossRef] [PubMed]
  23. Kanoh, N.; Kyo, M.; Inamori, K.; Ando, A.; Asami, A.; Nakao, A.; Osada, H. Spr imaging of photo-cross-linked small-molecule arrays on gold. Anal. Chem. 2006, 78, 2226–2230. [Google Scholar] [CrossRef] [PubMed]
  24. Pei, Z.; Saint-Guirons, J.; Kack, C.; Ingemarsson, B.; Aastrup, T. Real-time analysis of the carbohydrates on cell surfaces using a qcm biosensor: A lectin-based approach. Biosens. Bioelectron. 2012, 35, 200–205. [Google Scholar] [CrossRef] [PubMed]
  25. Frasconi, M.; Mazzarino, M.; Botre, F.; Mazzei, F. Surface plasmon resonance immunosensor for cortisol and cortisone determination. Anal. Bioanal. Chem. 2009, 394, 2151–2159. [Google Scholar] [CrossRef] [PubMed]
  26. Zhu, L.; Zhao, Z.J.; Cheng, P.; He, Z.H.; Cheng, Z.Q.; Peng, J.X.; Wang, H.Y.; Wang, C.; Yang, Y.L.; Hu, Z.Y. Antibody-mimetic peptoid nanosheet for label-free serum-based diagnosis of alzheimer’s disease. Adv. Mater. 2017, 29, 1700057. [Google Scholar] [CrossRef] [PubMed]
  27. Zhao, S.; Yang, M.; Zhou, W.; Zhang, B.; Cheng, Z. Kinetic and high-throughput profiling of epigenetic interactions by 3D-carbene chip-based surface plasmon resonance imaging technology. Proc. Natl. Acad. Sci. USA 2017, 114, E7245–E7254. [Google Scholar] [CrossRef] [PubMed]
  28. Wang, Y.M.; Wang, C.X.; Cheng, Z.Q.; Zhang, D.D.; Li, S.P.; Song, L.H.; Zhou, W.F.; Yang, M.; Wang, Z.Y.; Zheng, Z.; et al. Spri determination of inter-peptide interaction by using 3D supramolecular co-assembly polyrotaxane film. Biosens. Bioelectron. 2015, 66, 338–344. [Google Scholar] [CrossRef] [PubMed]
  29. Mao, X.L.; Yang, L.J.; Su, X.L.; Li, Y.B. A nanoparticle amplification based quartz crystal microbalance DNA sensor for detection of escherichia coli O157: H7. Biosens. Bioelectron. 2006, 21, 1178–1185. [Google Scholar] [CrossRef] [PubMed]
  30. Mahon, E.; Aastrup, T.; Barboiu, M. Dynamic glycovesicle systems for amplified qcm detection of carbohydrate-lectin multivalent biorecognition. Chem. Commun. 2010, 46, 2441–2443. [Google Scholar] [CrossRef] [PubMed]
  31. Li, S.P.; Yang, M.; Zhou, W.F.; Johnston, T.G.; Wang, R.; Zhu, J.S. Dextran hydrogel coated surface plasmon resonance imaging (spri) sensor for sensitive and label-free detection of small molecule drugs. Appl. Surf. Sci. 2015, 355, 570–576. [Google Scholar] [CrossRef]
  32. Löfås, S.; Johnsson, B. A novel hydrogel matrix on gold surfaces in surface plasmon resonance sensors for fast and efficient covalent immobilization of ligands. J. Chem. Soc. Chem. Commun. 1990, 1526–1528. [Google Scholar] [CrossRef]
  33. Johnsson, B.; Lofas, S.; Lindquist, G. Immobilization of proteins to a carboxymethyldextran-modified gold surface for biospecific interaction analysis in surface plasmon resonance sensors. Anal. Biochem. 1991, 198, 268–277. [Google Scholar] [CrossRef]
  34. Lofas, S.; Johnsson, B.; Edstrom, A.; Hansson, A.; Lindquist, G.; Hillgren, R.M.M.; Stigh, L. Methods for site controlled coupling to carboxymethyldextran surfaces in surface-plasmon resonance sensors. Biosens. Bioelectron. 1995, 10, 813–822. [Google Scholar] [CrossRef]
  35. Mohseni, S.; Moghadam, T.T.; Dabirmanesh, B.; Jabbari, S.; Khajeh, K. Development of a label-free spr sensor for detection of matrixmetalloproteinase-9 by antibody immobilization on carboxymethyldextran chip. Biosens. Bioelectron. 2016, 81, 510–516. [Google Scholar] [CrossRef] [PubMed]
  36. Jabbari, S.; Dabirmanesh, B.; Arab, S.S.; Amanlou, M.; Daneshjou, S.; Gholami, S.; Khajeh, K. A novel enzyme based spr-biosensor to detect bromocriptine as an ergoline derivative drug. Sens. Actuators B 2017, 240, 519–527. [Google Scholar] [CrossRef]
  37. Yang, N.; Su, X.; Tjong, V.; Knoll, W. Evaluation of two- and three-dimensional streptavidin binding platforms for surface plasmon resonance spectroscopy studies of DNA hybridization and protein-DNA binding. Biosens. Bioelectron. 2007, 22, 2700–2706. [Google Scholar] [CrossRef] [PubMed]
  38. Marx, K.A. Quartz crystal microbalance: A useful tool for studying thin polymer films and complex biomolecular systems at the solution-surface interface. Biomacromolecules 2003, 4, 1099–1120. [Google Scholar] [CrossRef] [PubMed]
  39. Pei, Z.; Anderson, H.; Aastrup, T.; Ramstrom, O. Study of real-time lectin-carbohydrate interactions on the surface of a quartz crystal microbalance. Biosens. Bioelectron. 2005, 21, 60–66. [Google Scholar] [CrossRef] [PubMed]
  40. Dubiel, E.A.; Martin, B.; Vigier, S.; Vermette, P. Real-time label-free detection and kinetic analysis of etanercept-protein a interactions using quartz crystal microbalance. Colloids Surf. B 2017, 149, 312–321. [Google Scholar] [CrossRef] [PubMed]
  41. Pei, Z.; Anderson, H.; Myrskog, A.; Duner, G.; Ingemarsson, B.; Aastrup, T. Optimizing immobilization on two-dimensional carboxyl surface: Ph dependence of antibody orientation and antigen binding capacity. Anal. Biochem. 2010, 398, 161–168. [Google Scholar] [CrossRef] [PubMed]
  42. Li, X.M.; Song, S.Y.; Shuai, Q.; Pei, Y.H.; Aastrup, T.; Pei, Y.X.; Pei, Z.C. Real-time and label-free analysis of binding thermodynamics of carbohydrate-protein interactions on unfixed cancer cell surfaces using a qcm biosensor. Sci. Rep. 2015, 5, 14066. [Google Scholar] [CrossRef] [PubMed]
  43. Myszka, D.G.; Morton, T.A. Clamp: A biosensor kinetic data analysis program. Trends Biochem. Sci. 1998, 23, 149–150. [Google Scholar] [CrossRef]
  44. Li, X.M.; Song, S.Y.; Pei, Y.X.; Dong, H.; Aastrup, T.; Pei, Z.C. Oriented and reversible immobilization of his-tagged proteins on two- and three-dimensional surfaces for study of protein-protein interactions by a qcm biosensor. Sens. Actuators B 2016, 224, 814–822. [Google Scholar] [CrossRef]
  45. Cui, X.Q.; Yang, F.; Sha, Y.F.; Yang, X.R. Real-time immunoassay of ferritin using surface plasmon resonance biosensor. Talanta 2003, 60, 53–61. [Google Scholar] [CrossRef]
Figure 1. The flow-through system of the Attana QCM biosensor instrument.
Polymers 09 00409 g001
Figure 2. Schematic illustration of 3D carboxymethyl dextran sensor chip surfaces for real-time detection of biomolecular interactions by a QCM biosensor.
Polymers 09 00409 g002
Figure 3. Typical sensorgram of Anti-h myoglobin 7005 immobilization via amine coupling on 3D carboxymethyl dextran surface (2000 kDa). (1) activation by EDC and NHS; (2) coupling of Anti-h myoglobin 7005; (3) deactivation with ethanolamine.
Polymers 09 00409 g003
Figure 4. (a) The frequency response of Anti-h myoglobin 7005 to immobilized, Anti-h myoglobin 7005 at 50 μg/mL was introduced onto the different surfaces; (b) Comparison of the binding of myoglobin on different surfaces, myoglobin at 4 μg/mL was injected to the 2D and 3D surfaces respectively. All experiments were performed under the same conditions.
Polymers 09 00409 g004aPolymers 09 00409 g004b
Figure 5. (a) Kinetic evaluation of the interaction on the 2D surface, myoglobin at 0.03, 0.06, 0.12, and 0.24 µM, was injected over the surface, respectively; (b) Kinetic evaluation on the 3D carboxymethyl dextran (500 kDa) surface, myoglobin at 0.03, 0.06, 0.12, and 0.24 µM, was injected over the surface, respectively; (c) Kinetic evaluation on the 3D carboxymethyl dextran (2000 kDa) surface, myoglobin at 0.03, 0.06, 0.12, and 0.24 µM, was injected over the surface, respectively. In Figure 5a–c, the measured responses are presented in black lines, the theoretical 1:1 fit generated by the ClampXP software are overlaid in red lines.
Polymers 09 00409 g005
Figure 6. (a) Binding of myoglobin to the immobilized 3D carboxymethyl dextran (2000 kDa) surface and subsequent release of the bound myoglobin via injection of low pH buffer (0.1 M glycine, pH 1.5). (1) binding of myoglobin; (2) regeneration with 0.1 M glycine. The 3D surface was completely regenerated after one injection of the glycine solution for 30 s; (b) the reproducibility of the surface was examined by running 10 repeats of the myoglobin.
Polymers 09 00409 g006
Figure 7. Procedure for immobilizing streptavidin via amine coupling on 3D carboxymethyl dextran (2000 kDa) surface; (1) activation by EDC and NHS; (2) coupling of streptavidin; (3) deactivation with ethanolamine.
Polymers 09 00409 g007
Figure 8. (a) The frequency response of streptavidin immobilized onto different surfaces; (b) Comparison of the binding of biotinylated oligo on different surfaces, biotinylated oligo at a concentration of 10 μM was injected to the 2D and 3D surfaces, respectively. The measured responses on 3D carboxymethyl dextran (2000 kDa) surface are presented as a red line, and the measured responses on 3D carboxymethyl dextran (500 kDa) surface are shown as the blue line. All experiments were performed under the same conditions.
Polymers 09 00409 g008

