Effects of Graphene Oxide and Chemically-Reduced Graphene Oxide on the Dynamic Mechanical Properties of Epoxy Amine Composites


Abstract
:
1. Introduction
2. Materials and Methods
2.1. Materials
2.2. Sample Preparation
2.2.1. Synthesis of GO and rGO
2.2.2. Preparation of Modified Epoxy Amine Composites
2.3. Characterization Methods
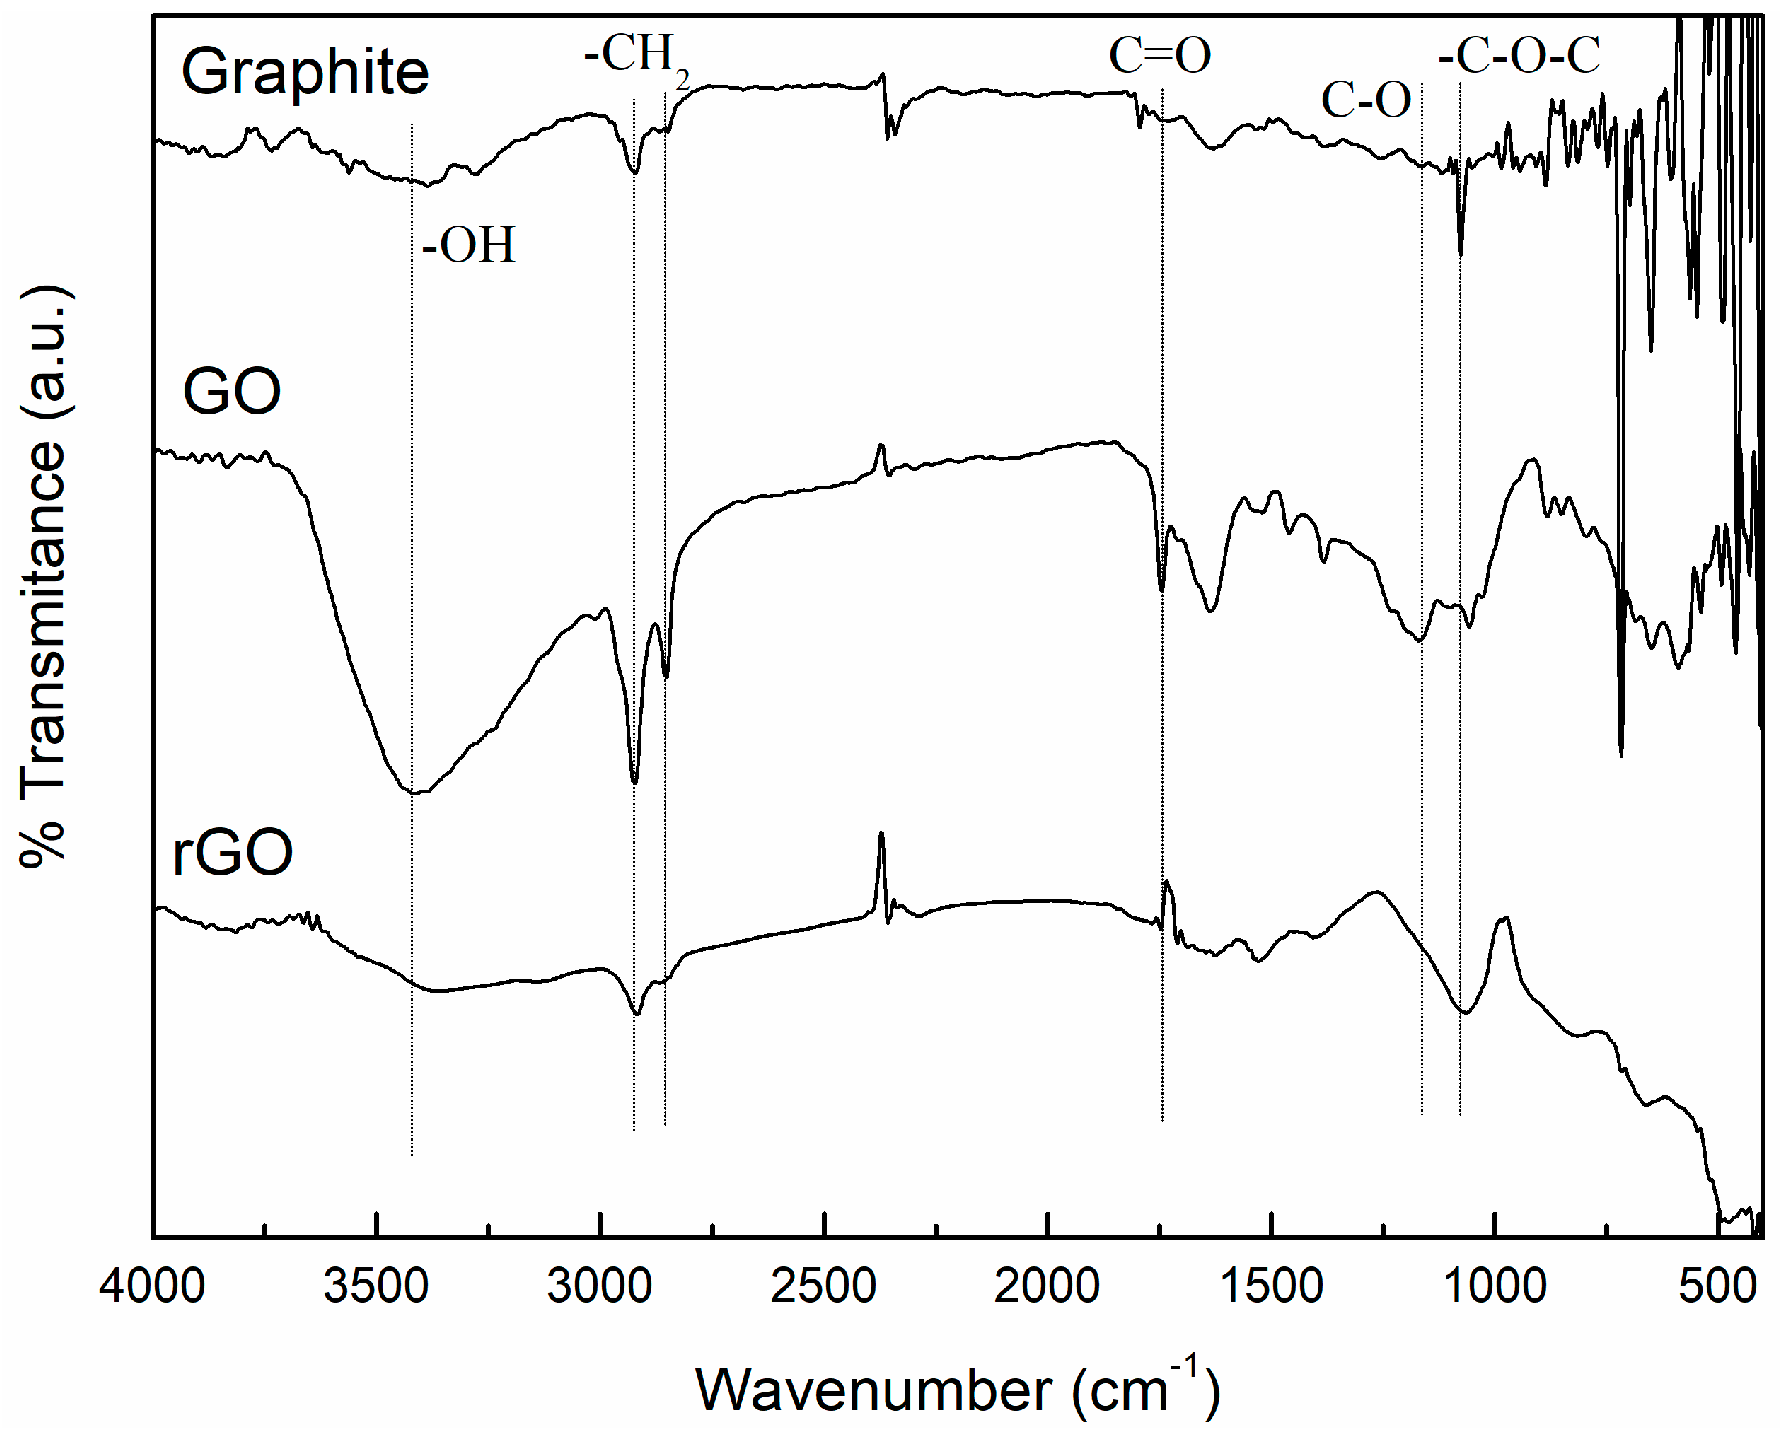
2.3.1. Fourier Transform Infrared Spectroscopy (FTIR)
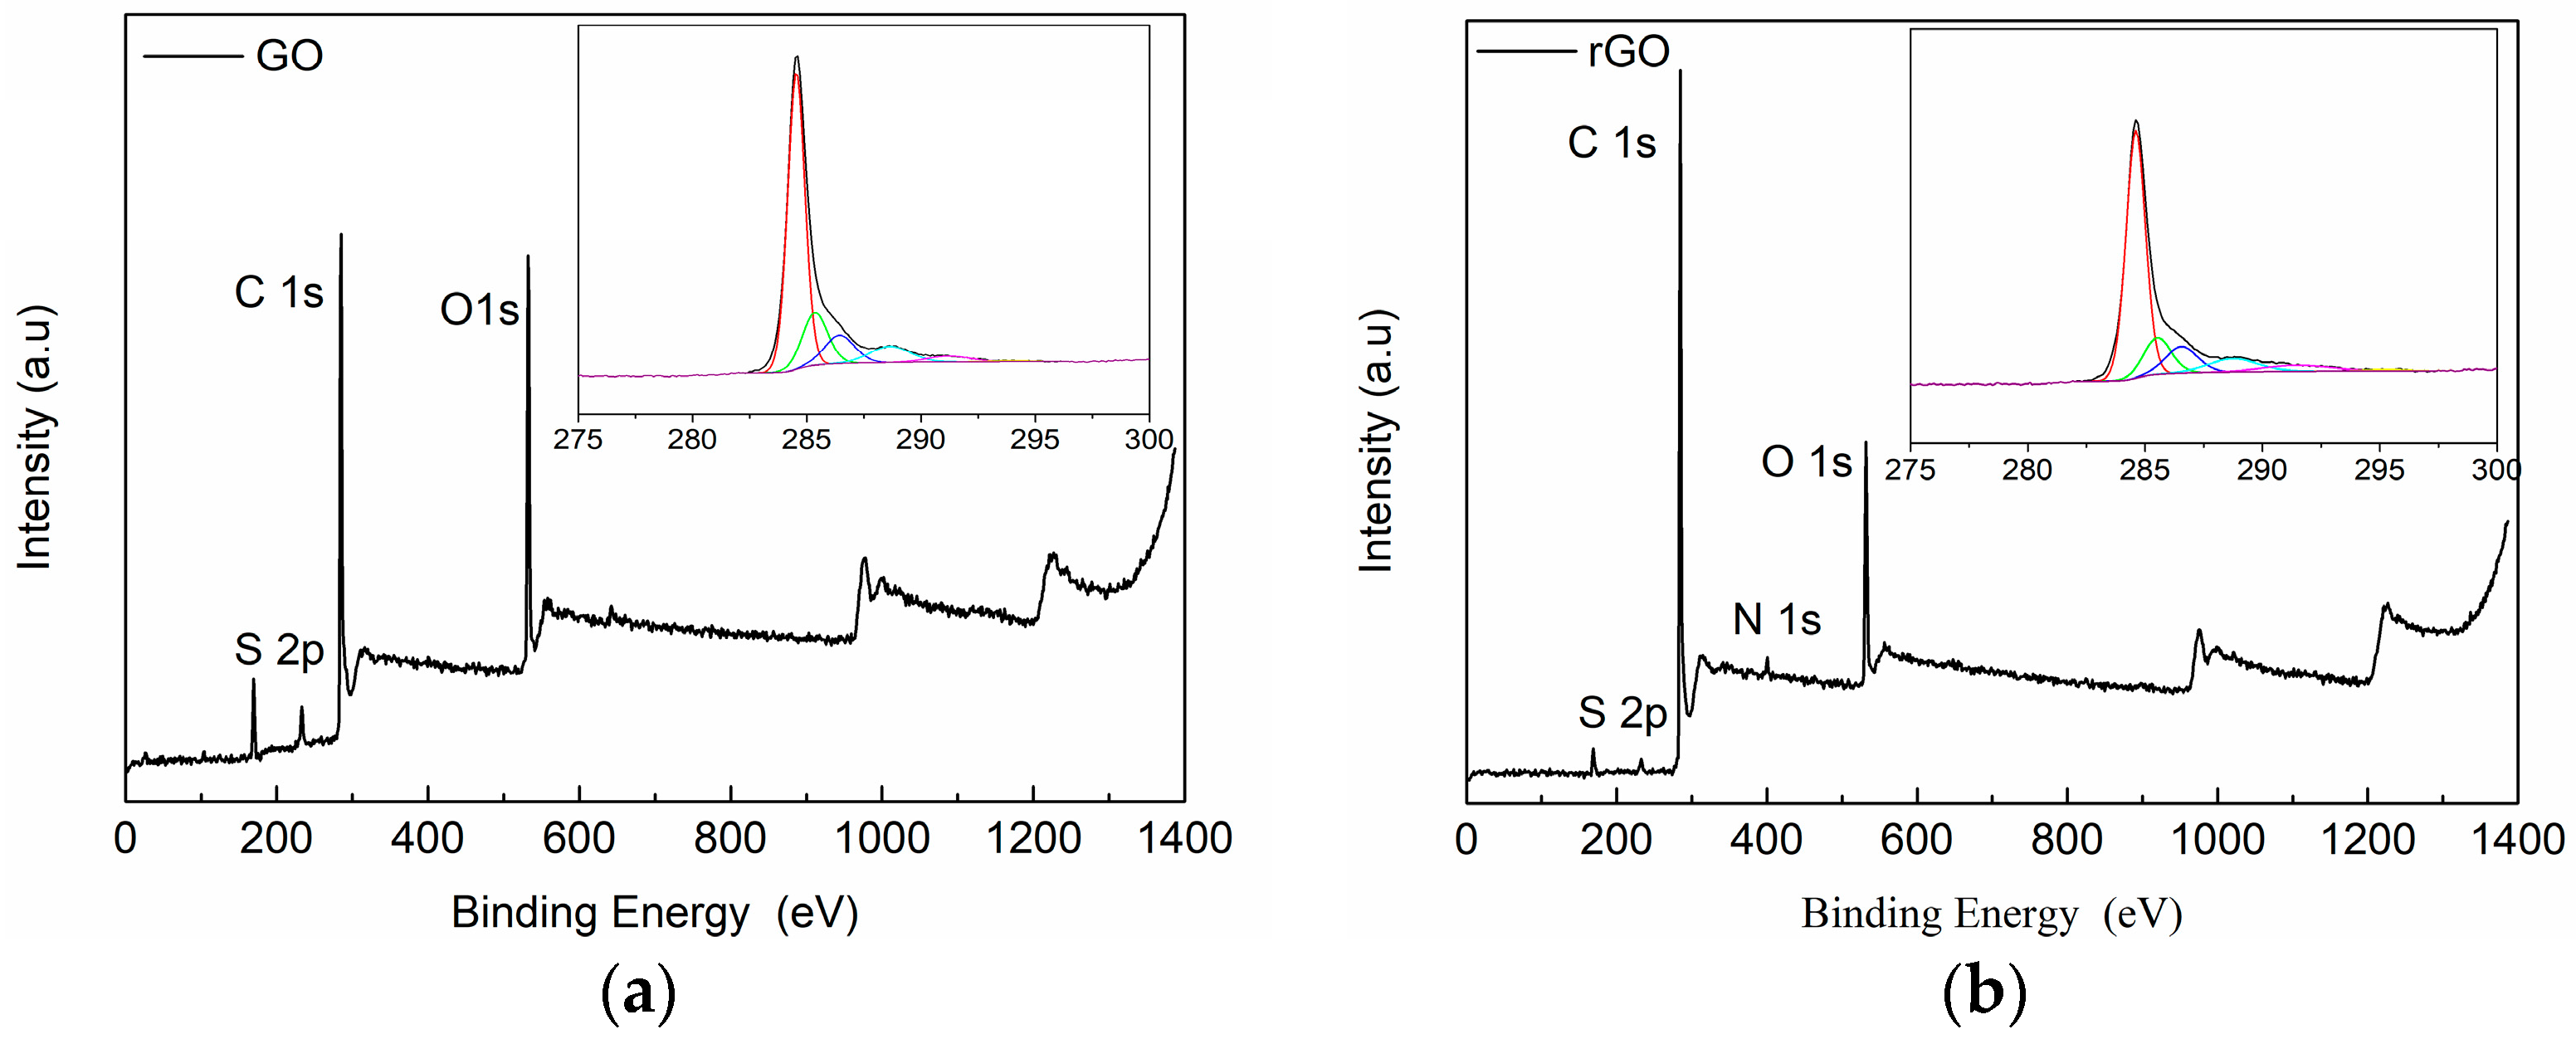
2.3.2. X-ray Photoelectron Spectroscopy (XPS)
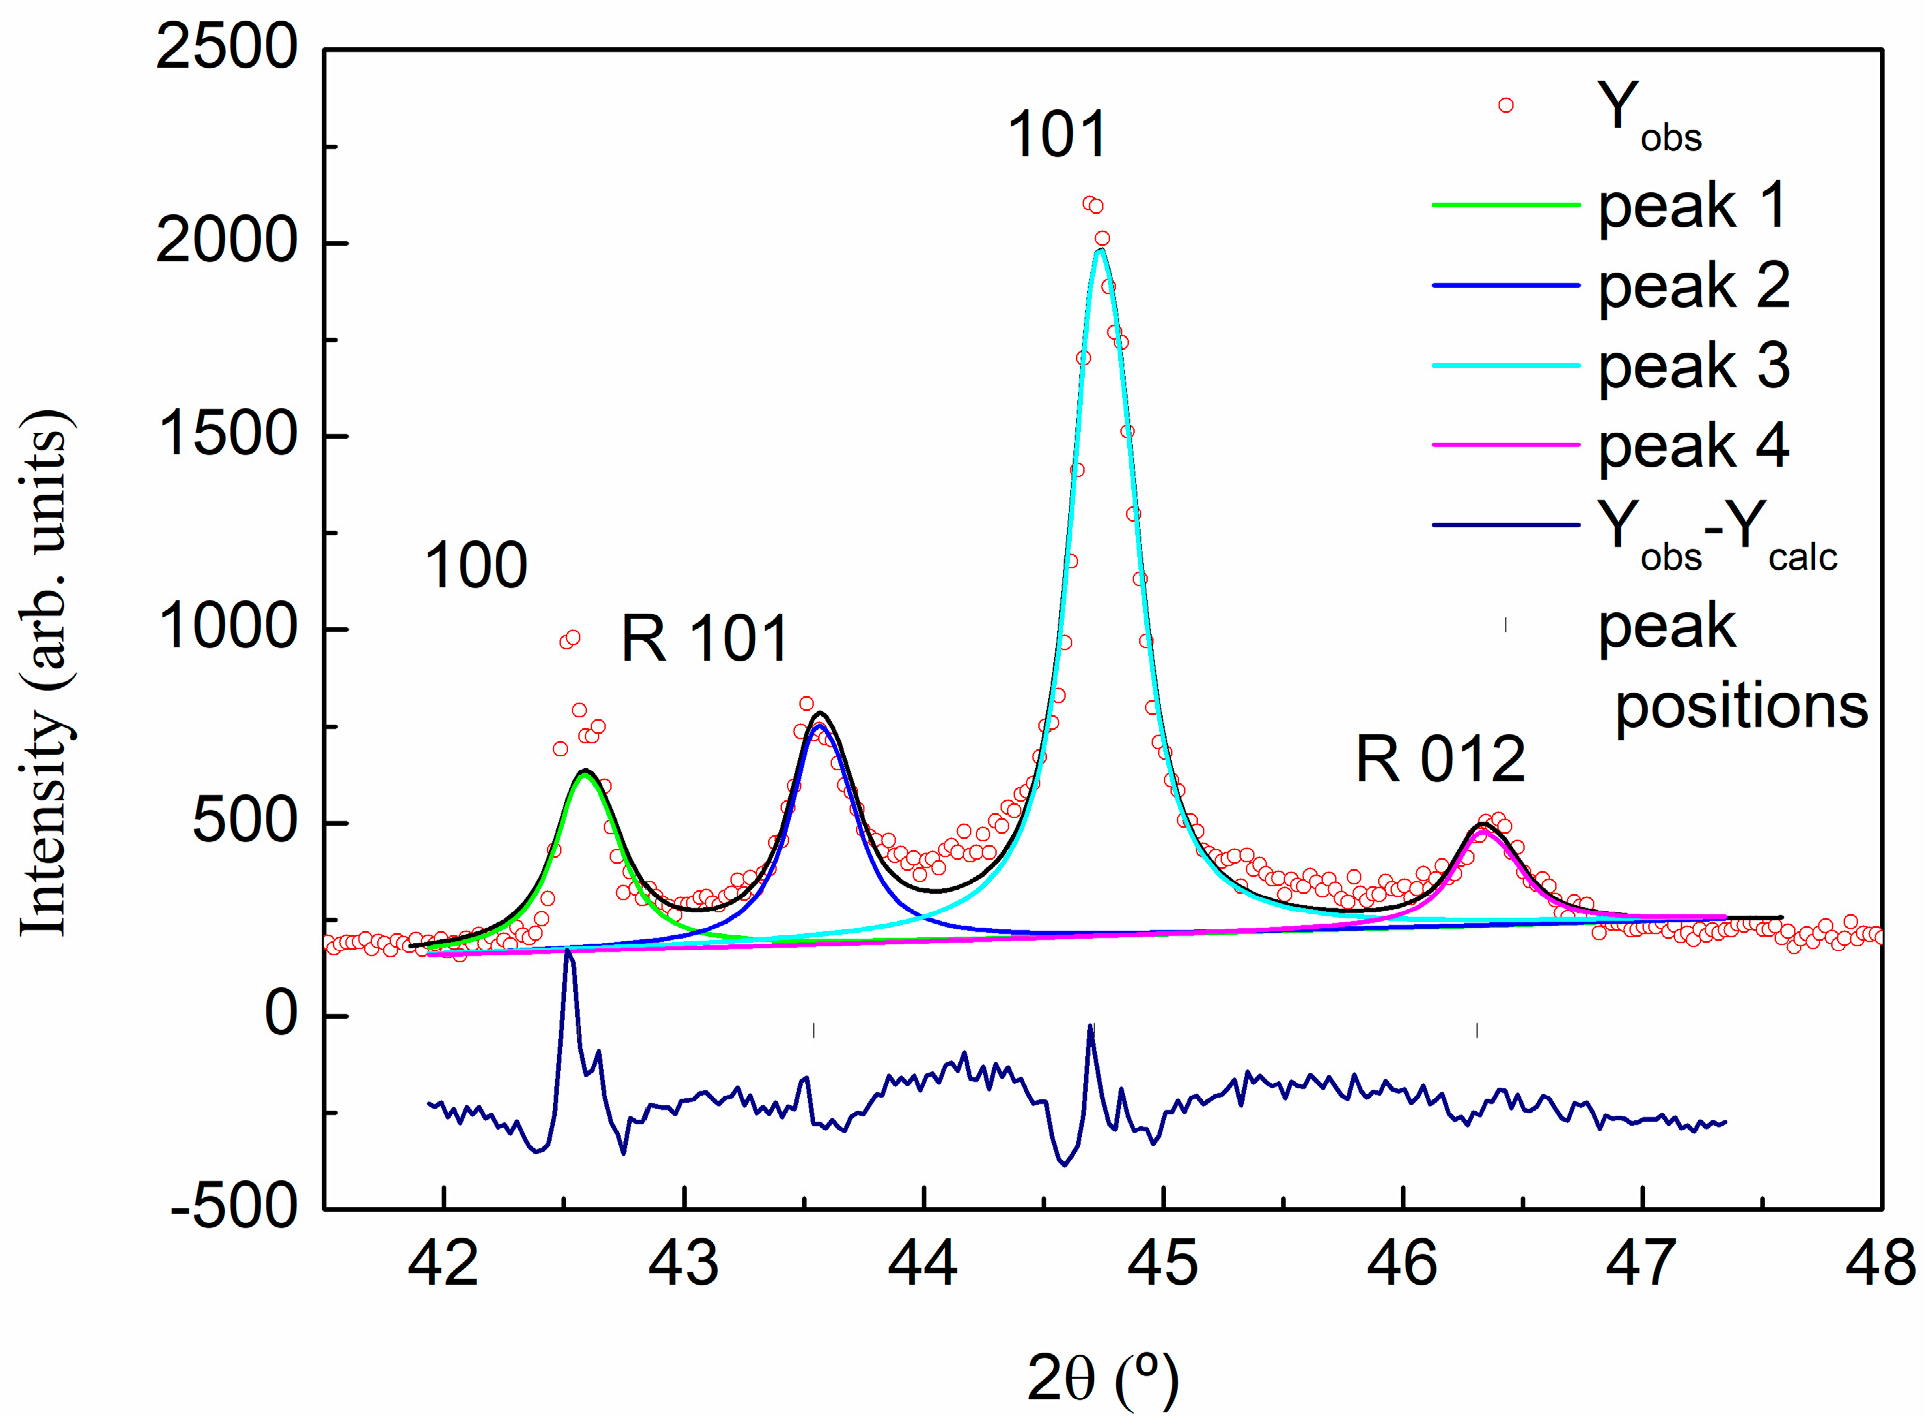
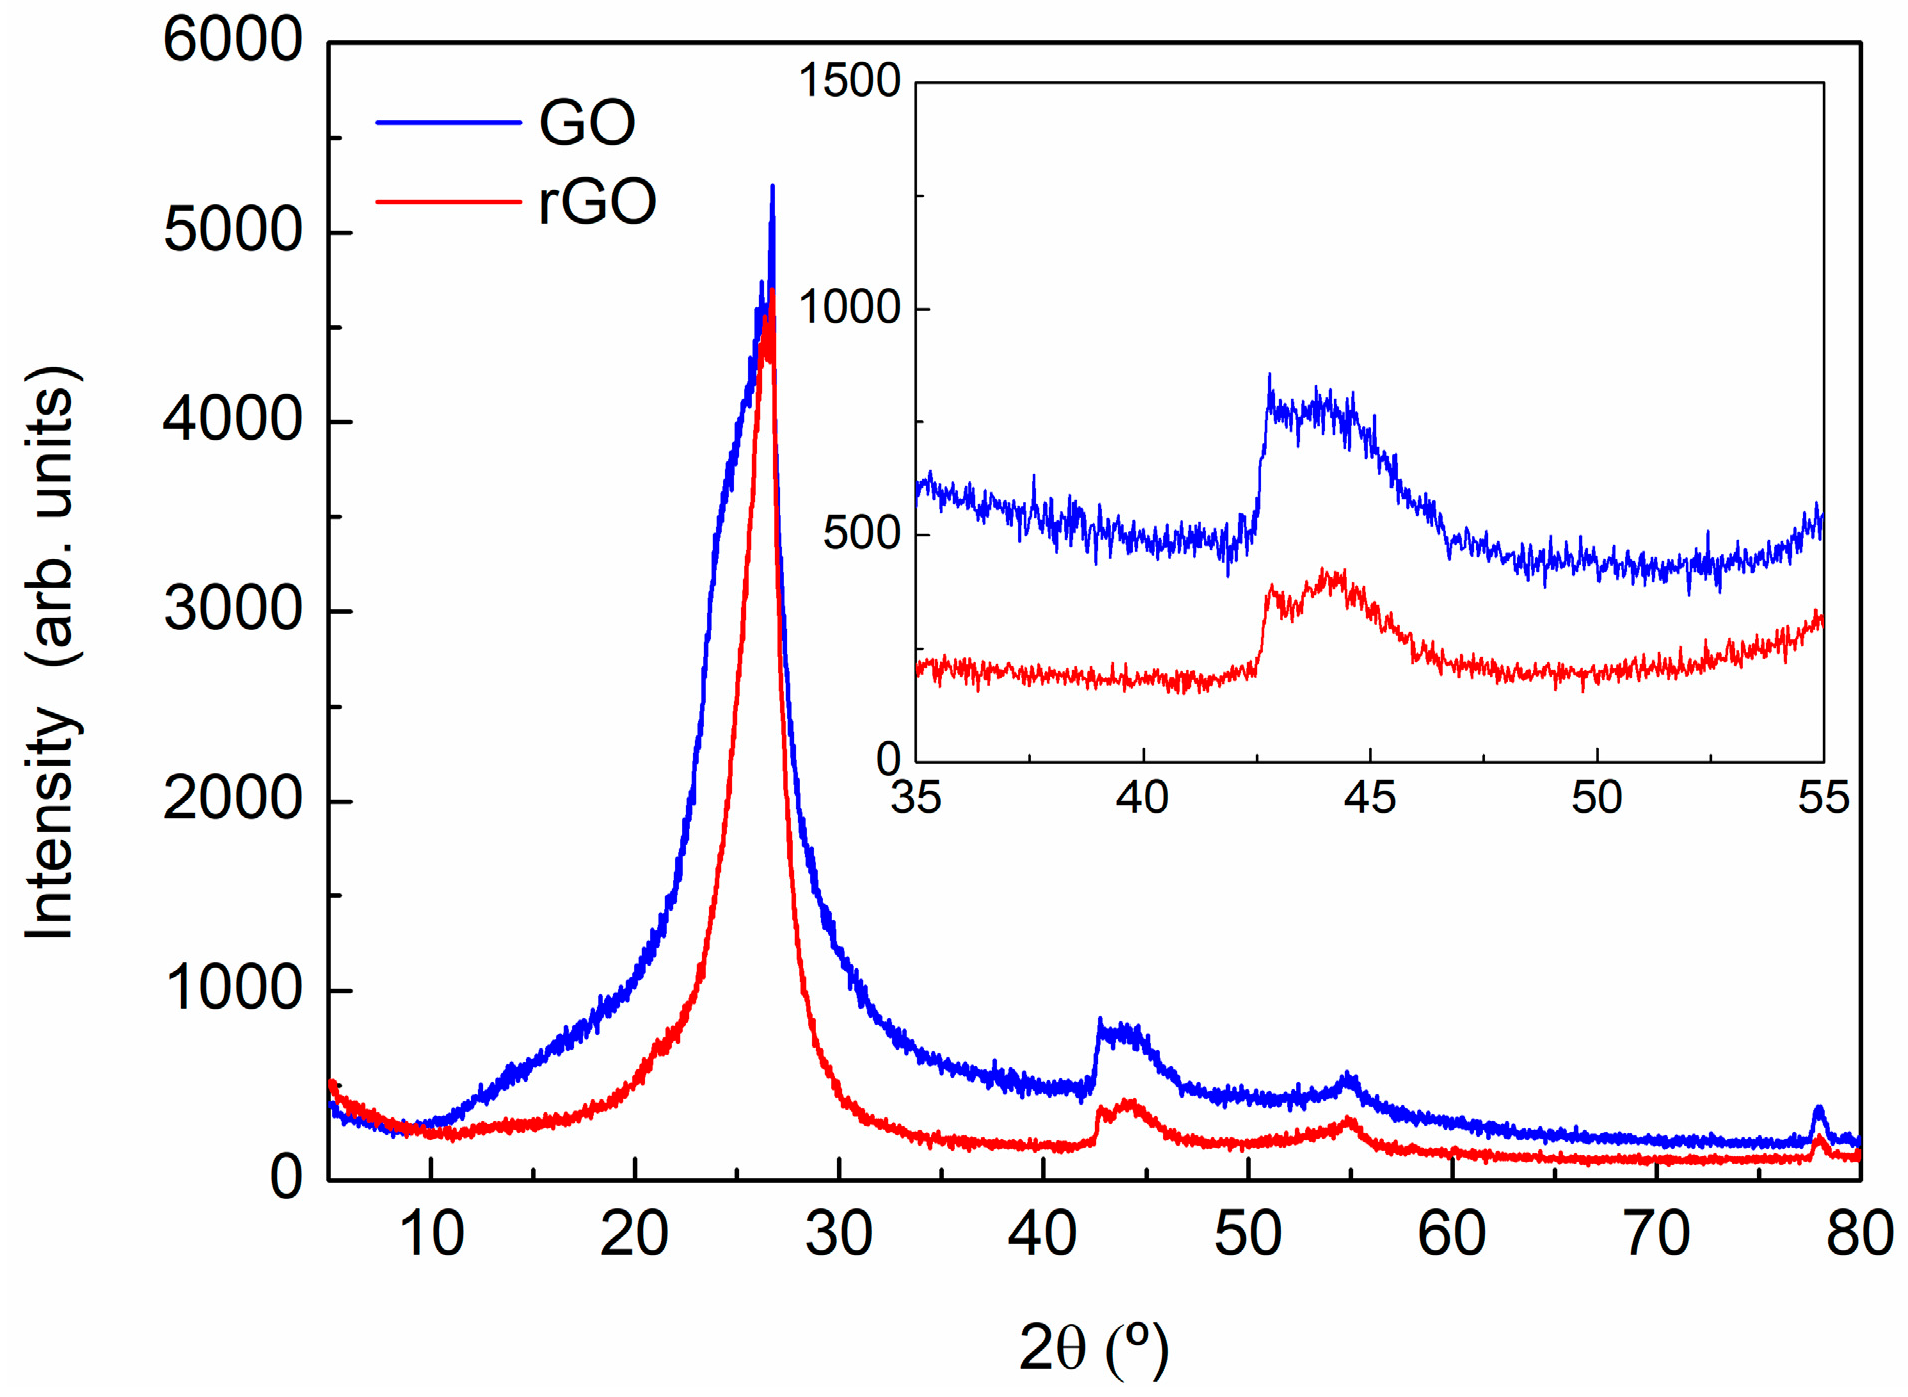
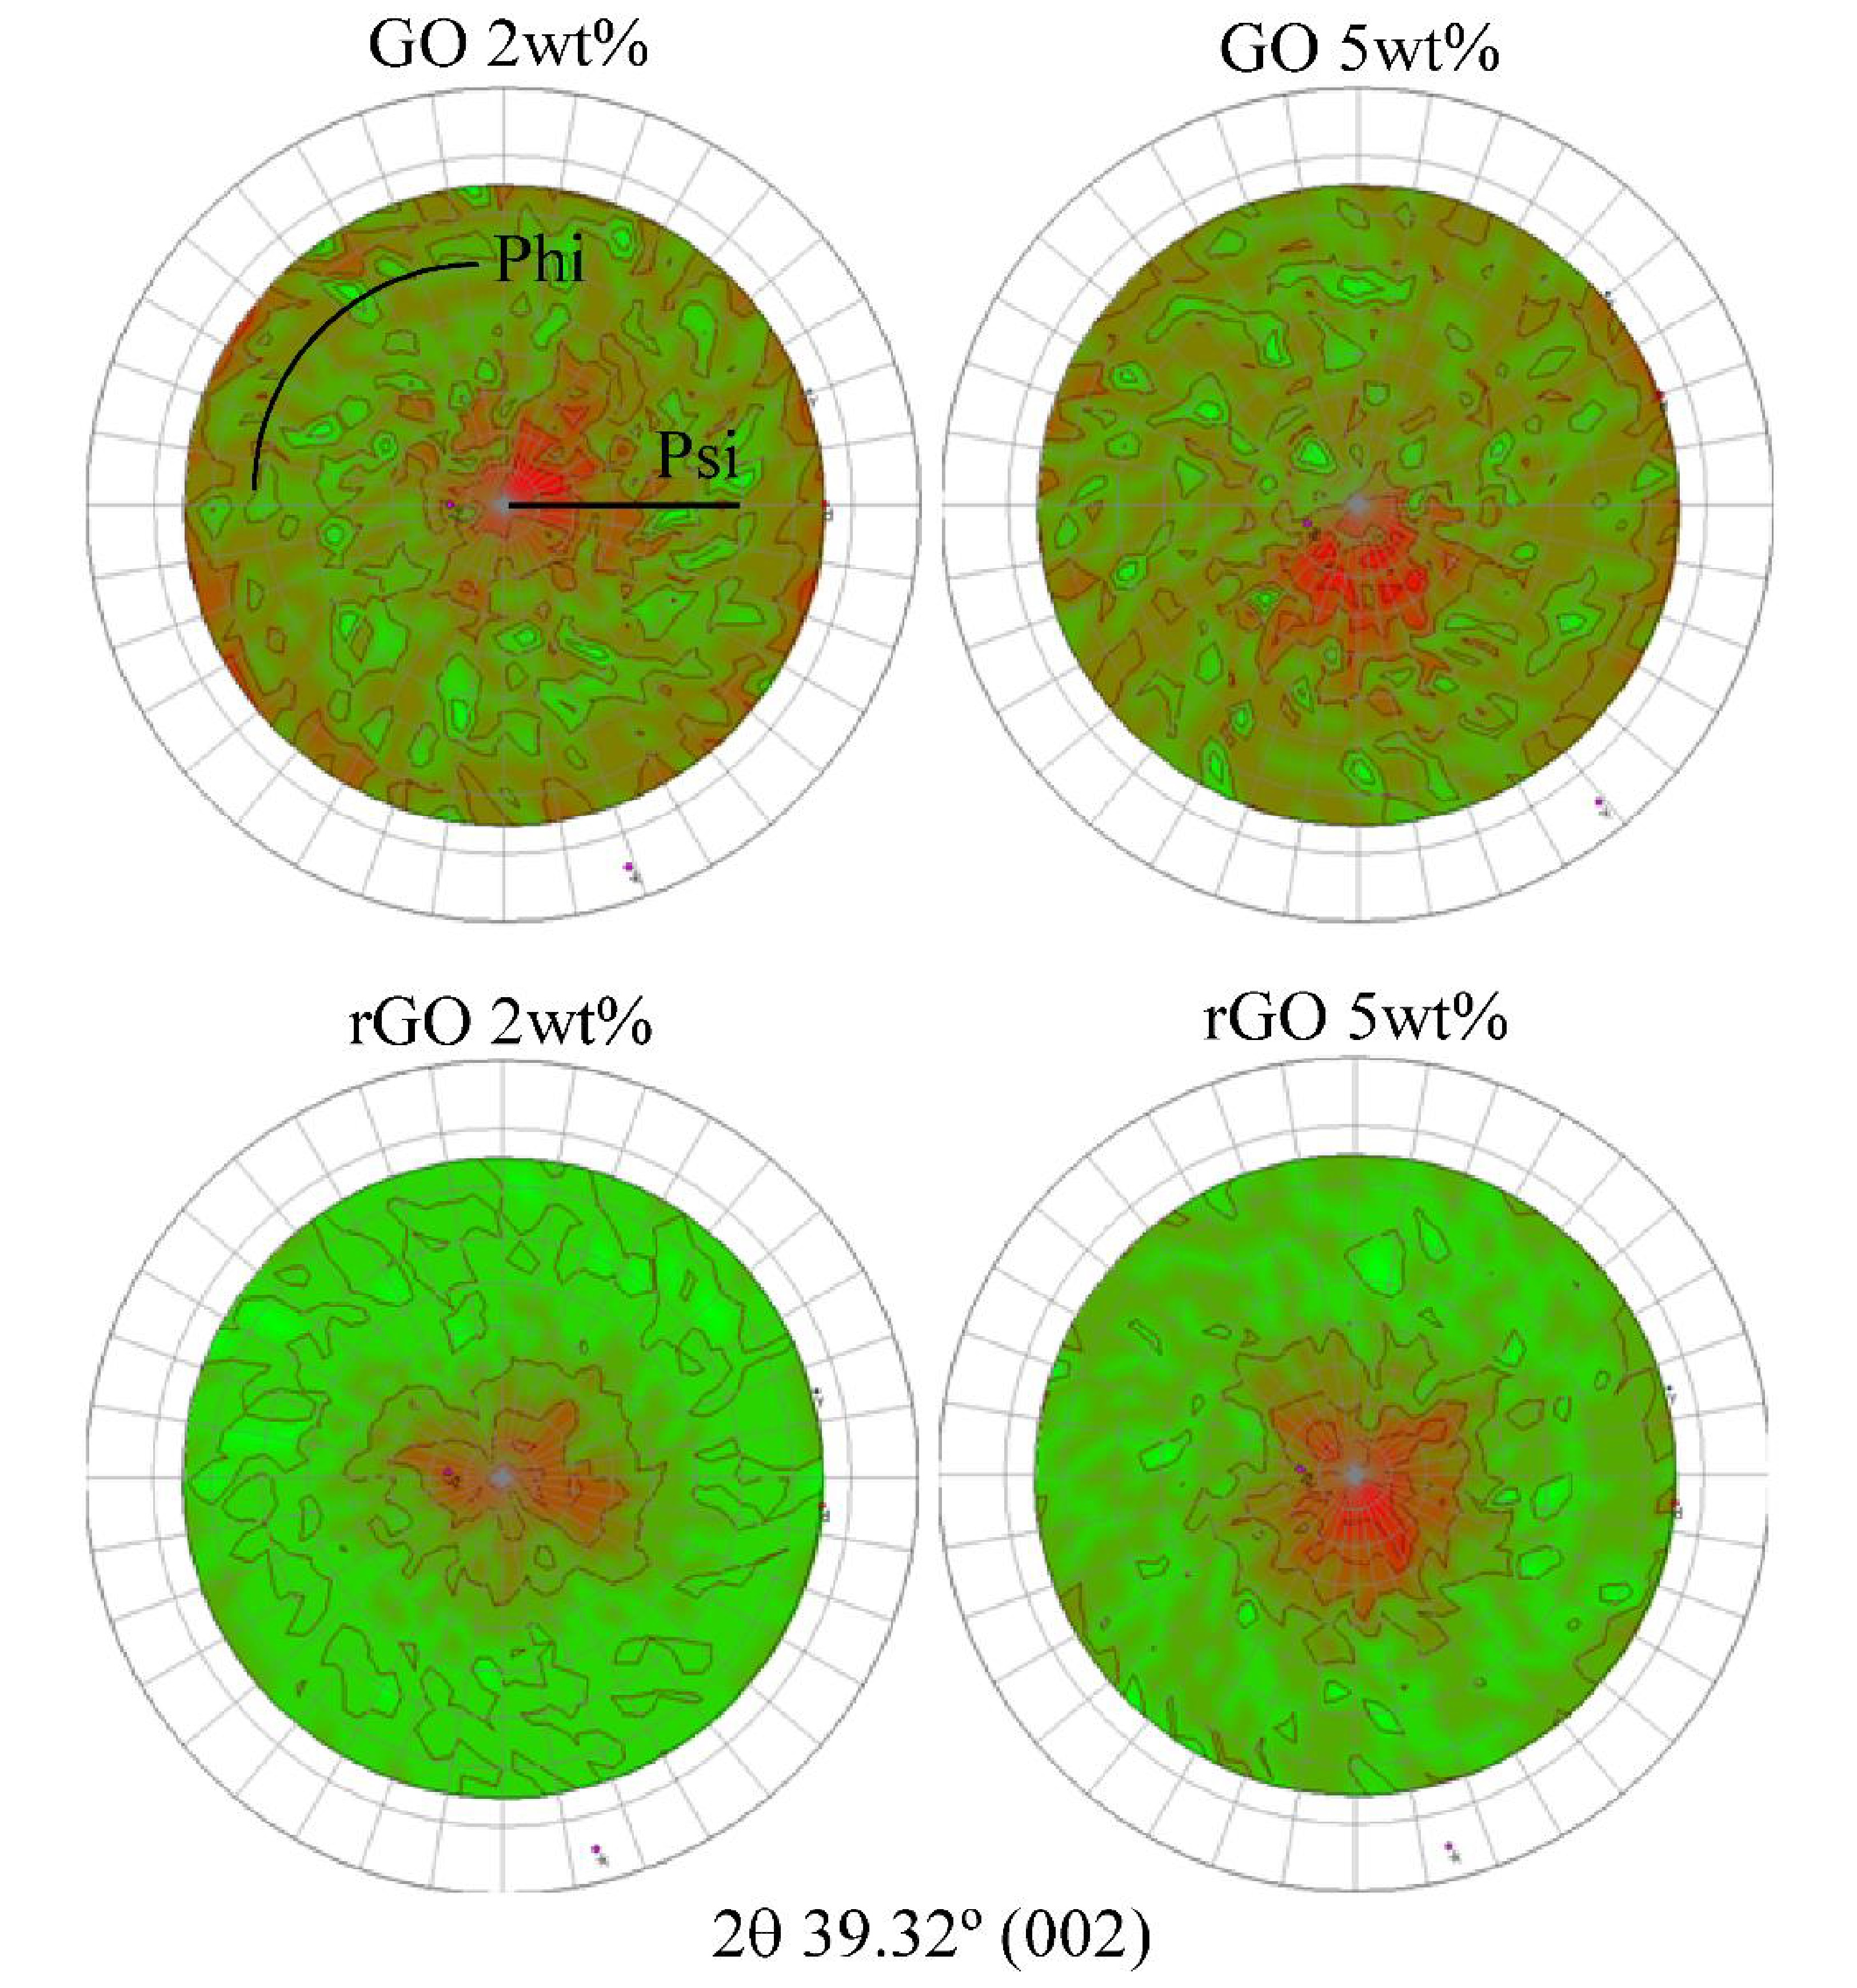
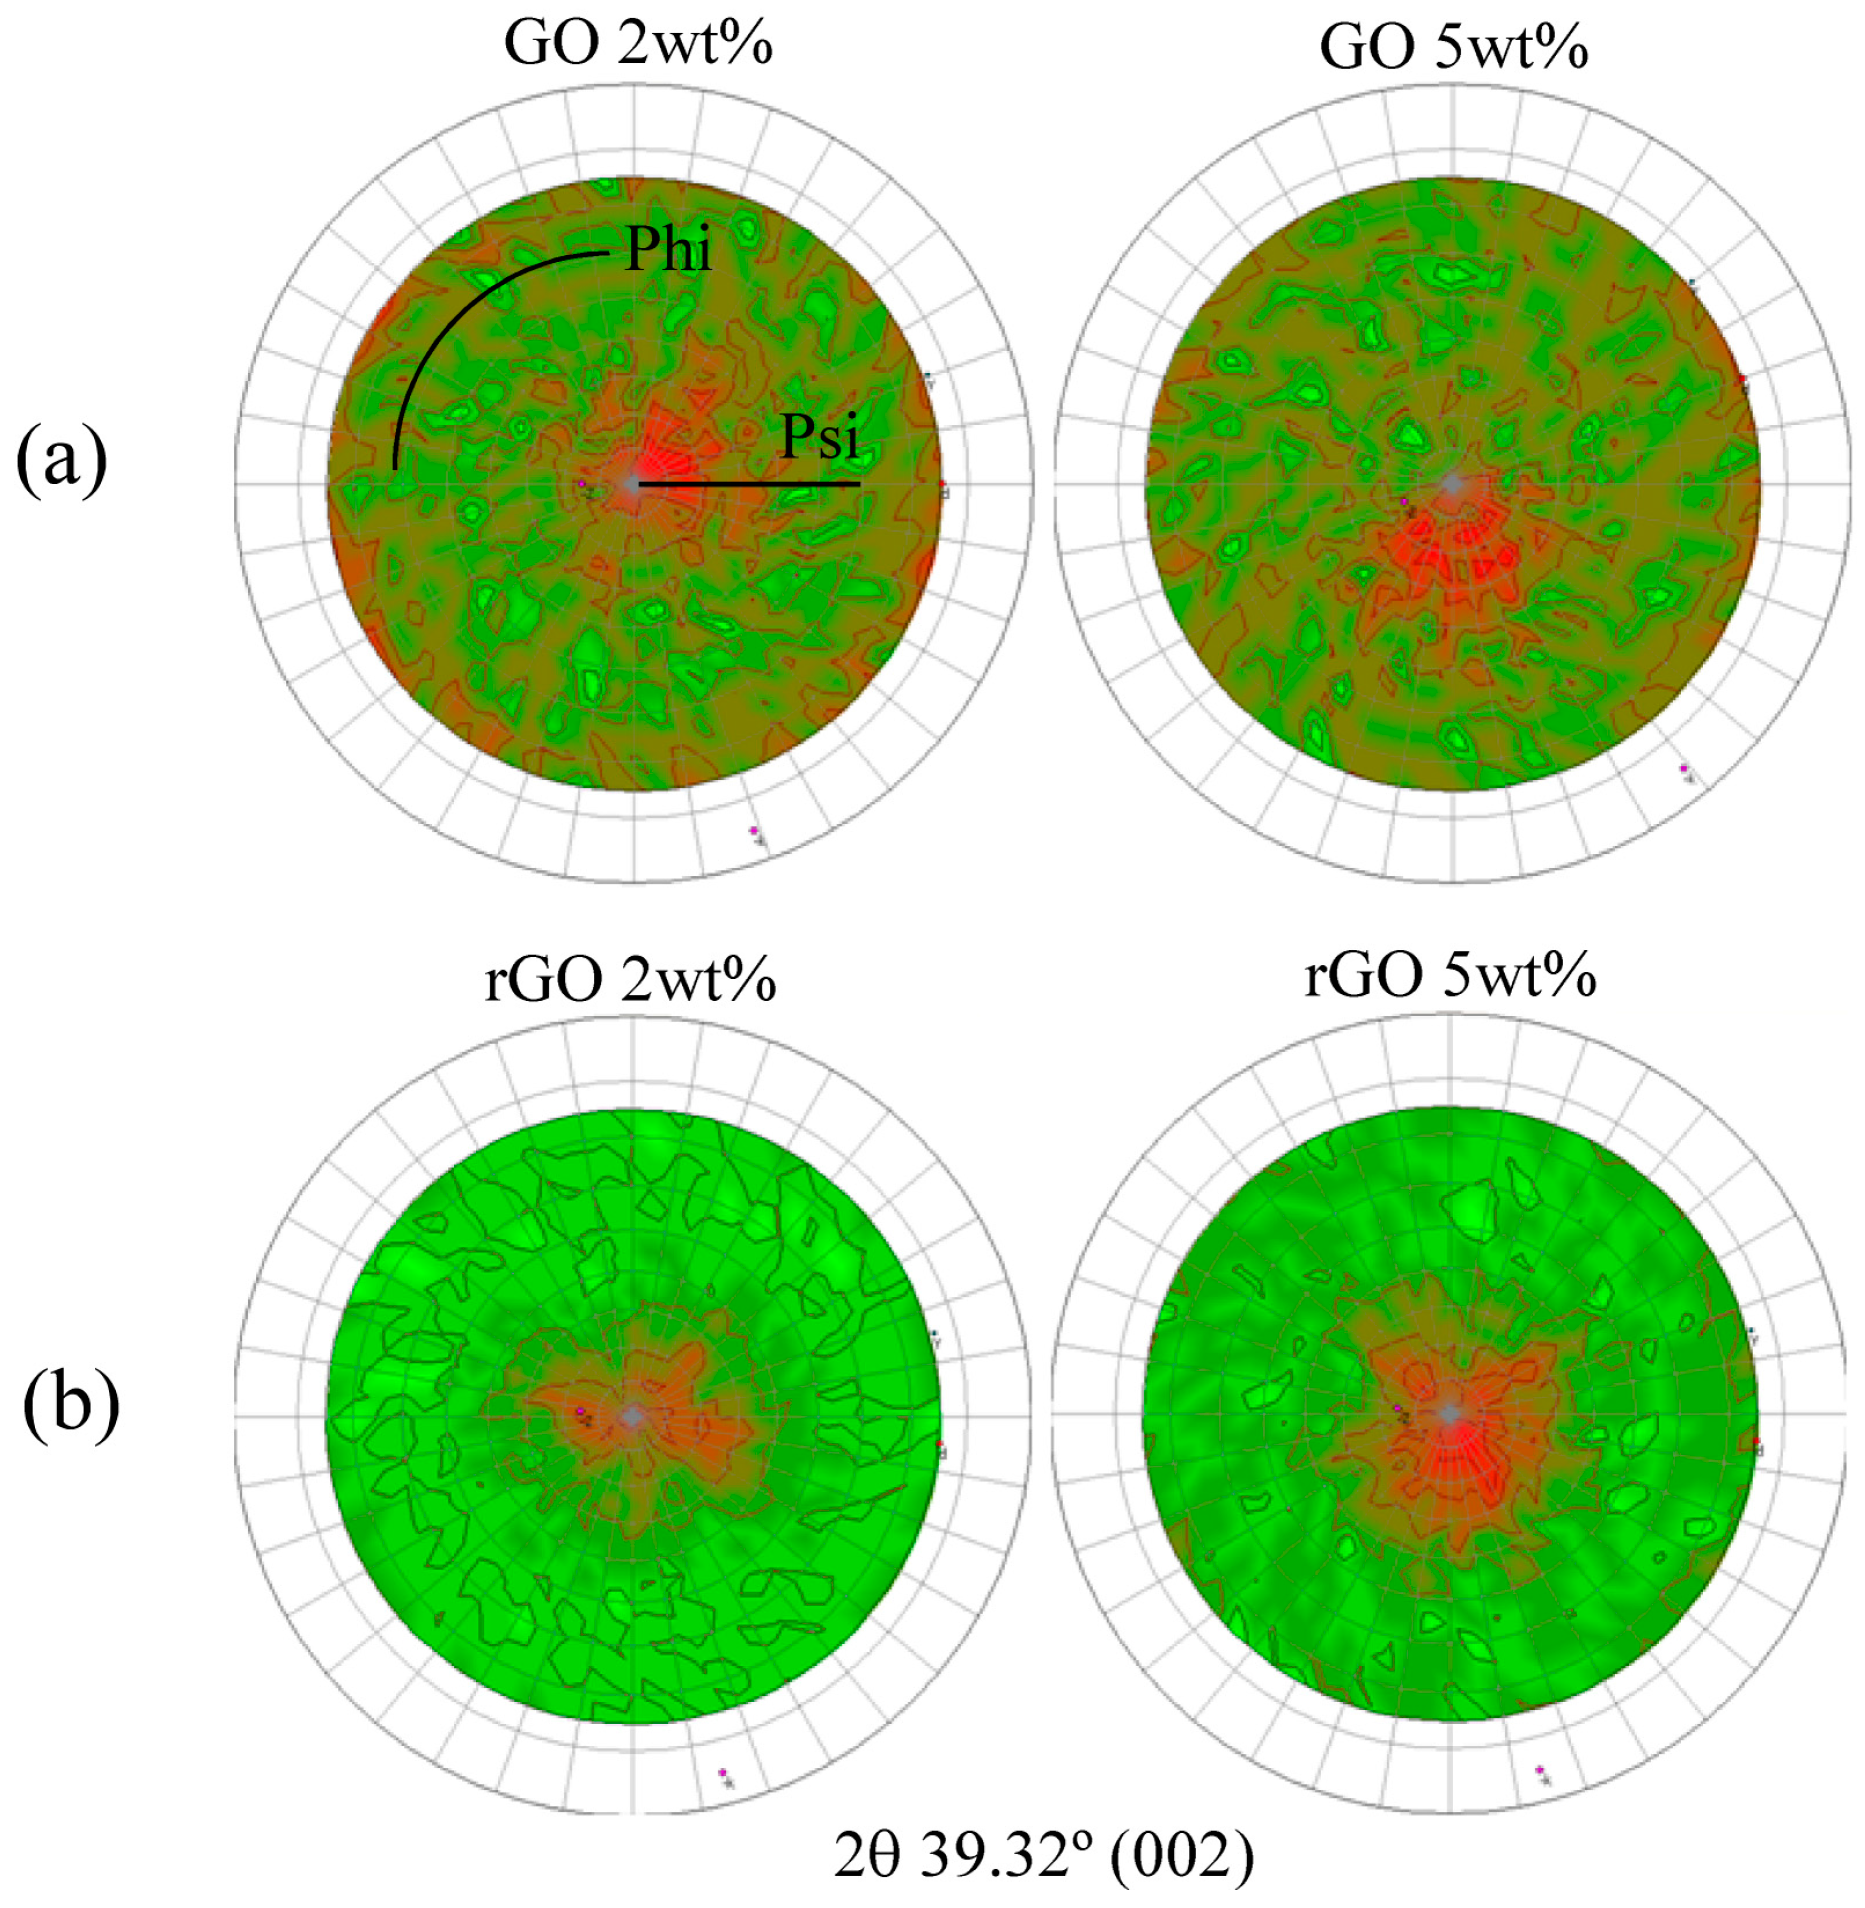
2.3.3. X-ray Powder Diffraction (XRD)
2.3.4. Transmission Electron Microscopy (TEM)
2.3.5. Dynamic Mechanical Thermal Analysis (DMTA)
3. Results and Discussion
3.1. Characterization of Carbon Based Nanoadditives
3.2. Characterization of GO- and rGO-Based Epoxy Composites
4. Conclusions
Acknowledgments
Author Contributions
Conflicts of Interest
References
- Ryu, S.H.; Sin, J.H.; Shanmugharaj, A.M. Study on the effect of hexamethylene diamine functionalized graphene oxide on the curing kinetics of epoxy nanocomposites. Eur. Polym. J. 2014, 52, 88–97. [Google Scholar] [CrossRef]
- Zhang, W.; Srivastava, I.; Zhu, Y.F.; Picu, C.R.; Koratkar, N.A. Heterogeneity in epoxy nanocomposites initiates crazing: Significant improvements in fatigue resistance and toughening. Small 2009, 5, 1403–1407. [Google Scholar] [CrossRef] [PubMed]
- Li, L.; Zeng, Z.; Zou, H.; Liang, M. Curing characteristics of an epoxy resin in the presence of functional graphite oxide with amine-rich surface. Thermochim. Acta 2015, 614, 76–84. [Google Scholar] [CrossRef]
- Kim, H.; Abdala, A.A.; MacOsko, C.W. Graphene/polymer nanocomposites. Macromolecules 2010, 43, 6515–6530. [Google Scholar] [CrossRef]
- Chen, J.; Taylor, A.C. Epoxy modified with triblock copolymers: Morphology, mechanical properties and fracture mechanisms. J. Mater. Sci. 2012, 47, 4546–4560. [Google Scholar] [CrossRef]
- Tang, L.C.; Zhang, H.; Sprenger, S.; Ye, L.; Zhang, Z. Fracture mechanisms of epoxy-based ternary composites filled with rigid-soft particles. Compos. Sci. Technol. 2012, 72, 558–565. [Google Scholar] [CrossRef]
- Johnsen, B.B.; Kinloch, A.J.; Mohammed, R.D.; Taylor, A.C.; Sprenger, S. Toughening mechanisms of nanoparticle-modified epoxy polymers. Polymer 2007, 48, 530–541. [Google Scholar] [CrossRef]
- Karimi, B.; Ramezanzadeh, B. A comparative study on the effects of ultrathin luminescent graphene oxide quantum dot (GOQD) and graphene oxide (GO) nanosheets on the interfacial interactions and mechanical properties of an epoxy composite. J. Colloid Interface Sci. 2017, 493, 62–76. [Google Scholar] [CrossRef] [PubMed]
- Lionetto, F.; Calò, E.; Di Benedetto, F.; Pisignano, D.; Maffezzoli, A. A methodology to orient carbon nanotubes in a thermosetting matrix. Compos. Sci. Technol. 2014, 96, 47–55. [Google Scholar] [CrossRef]
- Coleman, J.N.; Khan, U.; Blau, W.J.; Gun’ko, Y.K. Small but strong: A review of the mechanical properties of carbon nanotube-polymer composites. Carbon 2006, 44, 1624–1652. [Google Scholar] [CrossRef]
- Shadlou, S.; Alishahi, E.; Ayatollahi, M.R. Fracture behavior of epoxy nanocomposites reinforced with different carbon nano-reinforcements. Compos. Struct. 2013, 95, 577–581. [Google Scholar] [CrossRef]
- Potts, J.R.; Dreyer, D.R.; Bielawski, C.W.; Ruoff, R.S. Graphene-based polymer nanocomposites. Polymer 2011, 52, 5–25. [Google Scholar] [CrossRef]
- Saleem, H.; Edathil, A.; Ncube, T.; Pokhrel, J.; Khoori, S.; Abraham, A.; Mittal, V. Mechanical and Thermal Properties of Thermoset-Graphene Nanocomposites. Macromol. Mater. Eng. 2016, 301, 231–259. [Google Scholar] [CrossRef]
- Marra, F.; D’Aloia, A.; Tamburrano, A.; Ochando, I.; De Bellis, G.; Ellis, G.; Sarto, M. Electromagnetic and Dynamic Mechanical Properties of Epoxy and Vinylester-Based Composites Filled with Graphene Nanoplatelets. Polymers 2016, 8, 272. [Google Scholar] [CrossRef]
- Zhu, Y.; Murali, S.; Cai, W.; Li, X.; Suk, J.W.; Potts, J.R.; Ruoff, R.S. Graphene and graphene oxide: Synthesis, properties, and applications. Adv. Mater. 2010, 22, 3906–3924. [Google Scholar] [CrossRef] [PubMed]
- Ribeiro, H.; Da Silva, W.M.; Neves, J.C.; Calado, H.D.; Paniago, R.; Seara, L.M.; das Mercês Camarano, D.; Silva, G.G. Multifunctional nanocomposites based on tetraethylenepentamine-modified graphene oxide/epoxy. Polym. Test. 2015, 43, 182–192. [Google Scholar] [CrossRef]
- Sutter, P.W.; Flege, J.-I.; Sutter, E.A. Epitaxial graphene on ruthenium. Nat. Mater. 2088, 7, 406–411. [Google Scholar] [CrossRef] [PubMed]
- Domun, N.; Hadavinia, H.; Zhang, T.; Sainsbury, T.; Liaghat, G.H.; Vahid, S. Improving the fracture toughness and the strength of epoxy using nanomaterials—A review of the current status. Nanoscale 2015, 7, 10294–10329. [Google Scholar] [CrossRef] [PubMed]
- Kuilla, T.; Bhadra, S.; Yao, D.; Kim, N.H.; Bose, S.; Lee, J.H. Recent advances in graphene based polymer composites. Prog. Polym. Sci. 2010, 35, 1350–1375. [Google Scholar] [CrossRef]
- Mcallister, M.J.; Li, J.; Adamson, D.H.; Schniepp, H.C.; Abdala, A.A.; Liu, J.; Herrera-alonso, O.M.; Milius, D.L.; Car, R.; Prud, R.K.; et al. An Expansion of Graphite. Society 2007, 19, 4396–4404. [Google Scholar]
- Bourlinos, A.B.; Gournis, D.; Petridis, D. Graphite Oxide: Chemical Reduction to Graphite and Surface Modification with Primary Aliphatic Amines and Amino Acids. Society 2003, 19, 6050–6055. [Google Scholar] [CrossRef]
- Suresh Kumar, S.M.; Subramanian, K. Enhancement in Mechanical, Thermal, and Dielectric Properties of Functionalized Graphene Oxide Reinforced Epoxy Composites. Adv. Polym. Technol. 2016, 1–10. [Google Scholar] [CrossRef]
- Olowojoba, G.B.; Eslava, S.; Gutierrez, E.S.; Kinloch, A.J.; Mattevi, C.; Rocha, V.G.; Taylor, A.C. In situ thermally reduced graphene oxide/epoxy composites: Thermal and mechanical properties. Appl. Nanosci. 2016, 6, 1015–1022. [Google Scholar] [CrossRef]
- Ahmadi-Moghadam, B.; Sharafimasooleh, M.; Shadlou, S.; Taheri, F. Effect of functionalization of graphene nanoplatelets on the mechanical response of graphene/epoxy composites. Mater. Des. 2015, 66, 142–149. [Google Scholar] [CrossRef]
- Galpaya, D.G.D.; Fernando, J.F.S.; Rintoul, L.; Motta, N.; Waclawik, E.R.; Yan, C.; George, G.A. The effect of graphene oxide and its oxidized debris on the cure chemistry and interphase structure of epoxy nanocomposites. Polymer 2015, 71, 122–134. [Google Scholar] [CrossRef] [Green Version]
- Wei, J.; Atif, R.; Vo, T.; Inam, F. Graphene Nanoplatelets in Epoxy System: Dispersion, Reaggregation, and Mechanical Properties of Nanocomposites. J. Nanomater. 2015, 16, 374. [Google Scholar] [CrossRef]
- Galpaya, D.; Wang, M.; George, G.; Motta, N.; Waclawik, E.; Yan, C. Preparation of graphene oxide/epoxy nanocomposites with significantly improved mechanical properties. J. Appl. Phys. 2014, 116, 053518. [Google Scholar] [CrossRef]
- Hu, X.; Qi, R.; Zhu, J.; Lu, J.; Luo, Y.; Jin, J.; Jiang, P. Preparation and properties of dopamine reduced graphene oxide and its composites of epoxy. J. Appl. Polym. Sci. 2014, 131, 1–9. [Google Scholar] [CrossRef]
- Liu, T.; Zhao, Z.; Tjiu, W.W.; Lv, J.; Wei, C. Preparation and characterization of epoxy nanocomposites containing surface-modified graphene oxide. J. Appl. Polym. Sci. 2014, 131, 2–7. [Google Scholar] [CrossRef]
- Gao, W. The chemistry of graphene oxide. In Graphene Oxide: Reduction Recipes, Spectroscopy, and Applications; Springer International Publishing: Basel, Switzerland, 2015; pp. 61–95. [Google Scholar]
- Hu, Y.; Shen, J.; Li, N.; Ma, H.; Shi, M.; Yan, B.; Huang, W.; Wang, W.; Ye, M. Comparison of the thermal properties between composites reinforced by raw and amino-functionalized carbon materials. Compos. Sci. Technol. 2010, 70, 2176–2182. [Google Scholar] [CrossRef]
- Kuila, T.; Bose, S.; Mishra, A.K.; Khanra, P.; Kim, N.H.; Lee, J.H. Chemical functionalization of graphene and its applications. Prog. Mater. Sci. 2012, 57, 1061–1105. [Google Scholar] [CrossRef]
- Rourke, J.P.; Pandey, P.A.; Moore, J.J.; Bates, M.; Kinloch, I.A.; Young, R.J.; Wilson, N.R. The real graphene oxide revealed: Stripping the oxidative debris from the graphene-like sheets. Angew. Chem. Int. Ed. 2011, 50, 3173–3177. [Google Scholar] [CrossRef] [PubMed]
- Monteserín, C.; Blanco, M.; Aranzabe, E.; Aranzabe, A.; Vilas, J.L. Effects of graphene oxide and chemically reduced graphene oxide on the curing kinetics of epoxy amine composites. J. Appl. Polym. Sci. 2017, 44803, 12–16. [Google Scholar] [CrossRef]
- Nethravathi, C.; Rajamathi, M. Chemically modified graphene sheets produced by the solvothermal reduction of colloidal dispersions of graphite oxide. Carbon 2008, 46, 1994–1998. [Google Scholar] [CrossRef]
- He, G.; Chen, H.; Zhu, J.; Bei, F.; Sun, X.; Wang, X. Synthesis and characterization of graphene paper with controllable properties via chemical reduction. J. Mater. Chem. 2011, 21, 14631–14638. [Google Scholar] [CrossRef]
- Park, S.; An, J.; Potts, J.R.; Velamakanni, A.; Murali, S.; Ruoff, R.S. Hydrazine-reduction of graphite- and graphene oxide. Carbon 2011, 49, 3019–3023. [Google Scholar] [CrossRef]
- Naebe, M.; Wang, J.; Amini, A.; Khayyam, H.; Hameed, N.; Li, L.H.; Chen, Y.; Fox, B. Mechanical property and structure of covalent functionalised graphene/epoxy nanocomposites. Sci. Rep. 2014, 4, 4375. [Google Scholar] [CrossRef] [PubMed]


| Cycle | Name | GO | rGO | ||||||
|---|---|---|---|---|---|---|---|---|---|
| Position | Area | % Conc. | at % rel. | Position | Area | % Conc. | at % rel. | ||
| C | C–C, C–H | 284.6 | 22,413.7 | 42.651 | 69.5 | 284.5 | 26,100.5 | 50.2 | 81.4 |
| C1s | 285.5 | 4721.1 | 8.984 | 285.4 | 6893.5 | 13.3 | |||
| C–O | 286.6 | 4015.9 | 7.642 | 286.4 | 4427.9 | 8.5 | |||
| O–C=O | 288.8 | 3121 | 5.939 | 288.6 | 3383.1 | 6.5 | |||
| C1s, sat | 291.5 | 1945.4 | 3.702 | 291.2 | 1292 | 2.5 | |||
| C1s, sat | 295.3 | 292.8 | 0.557 | 294.1 | 235.2 | 0.5 | |||
| O | O1s | 532.1 | 23,890.1 | 15.515 | 25.2 | 531.7 | 13,405.1 | 8.8 | 15.6 |
| O1s | 533.5 | 14,881.1 | 9.664 | 533.2 | 10,363.7 | 6.8 | |||
| S | S2p3/2 | 169.1 | 3146.3 | 3.564 | 5.3 | 168.7 | 1015.1 | 1.162 | 1.7 |
| S2p1/2 | 170.3 | 1573.5 | 1.782 | 169.9 | 507.7 | 0.6 | |||
| N | N1s | 400.6 | 1168.8 | 1.249 | 1.2 | ||||
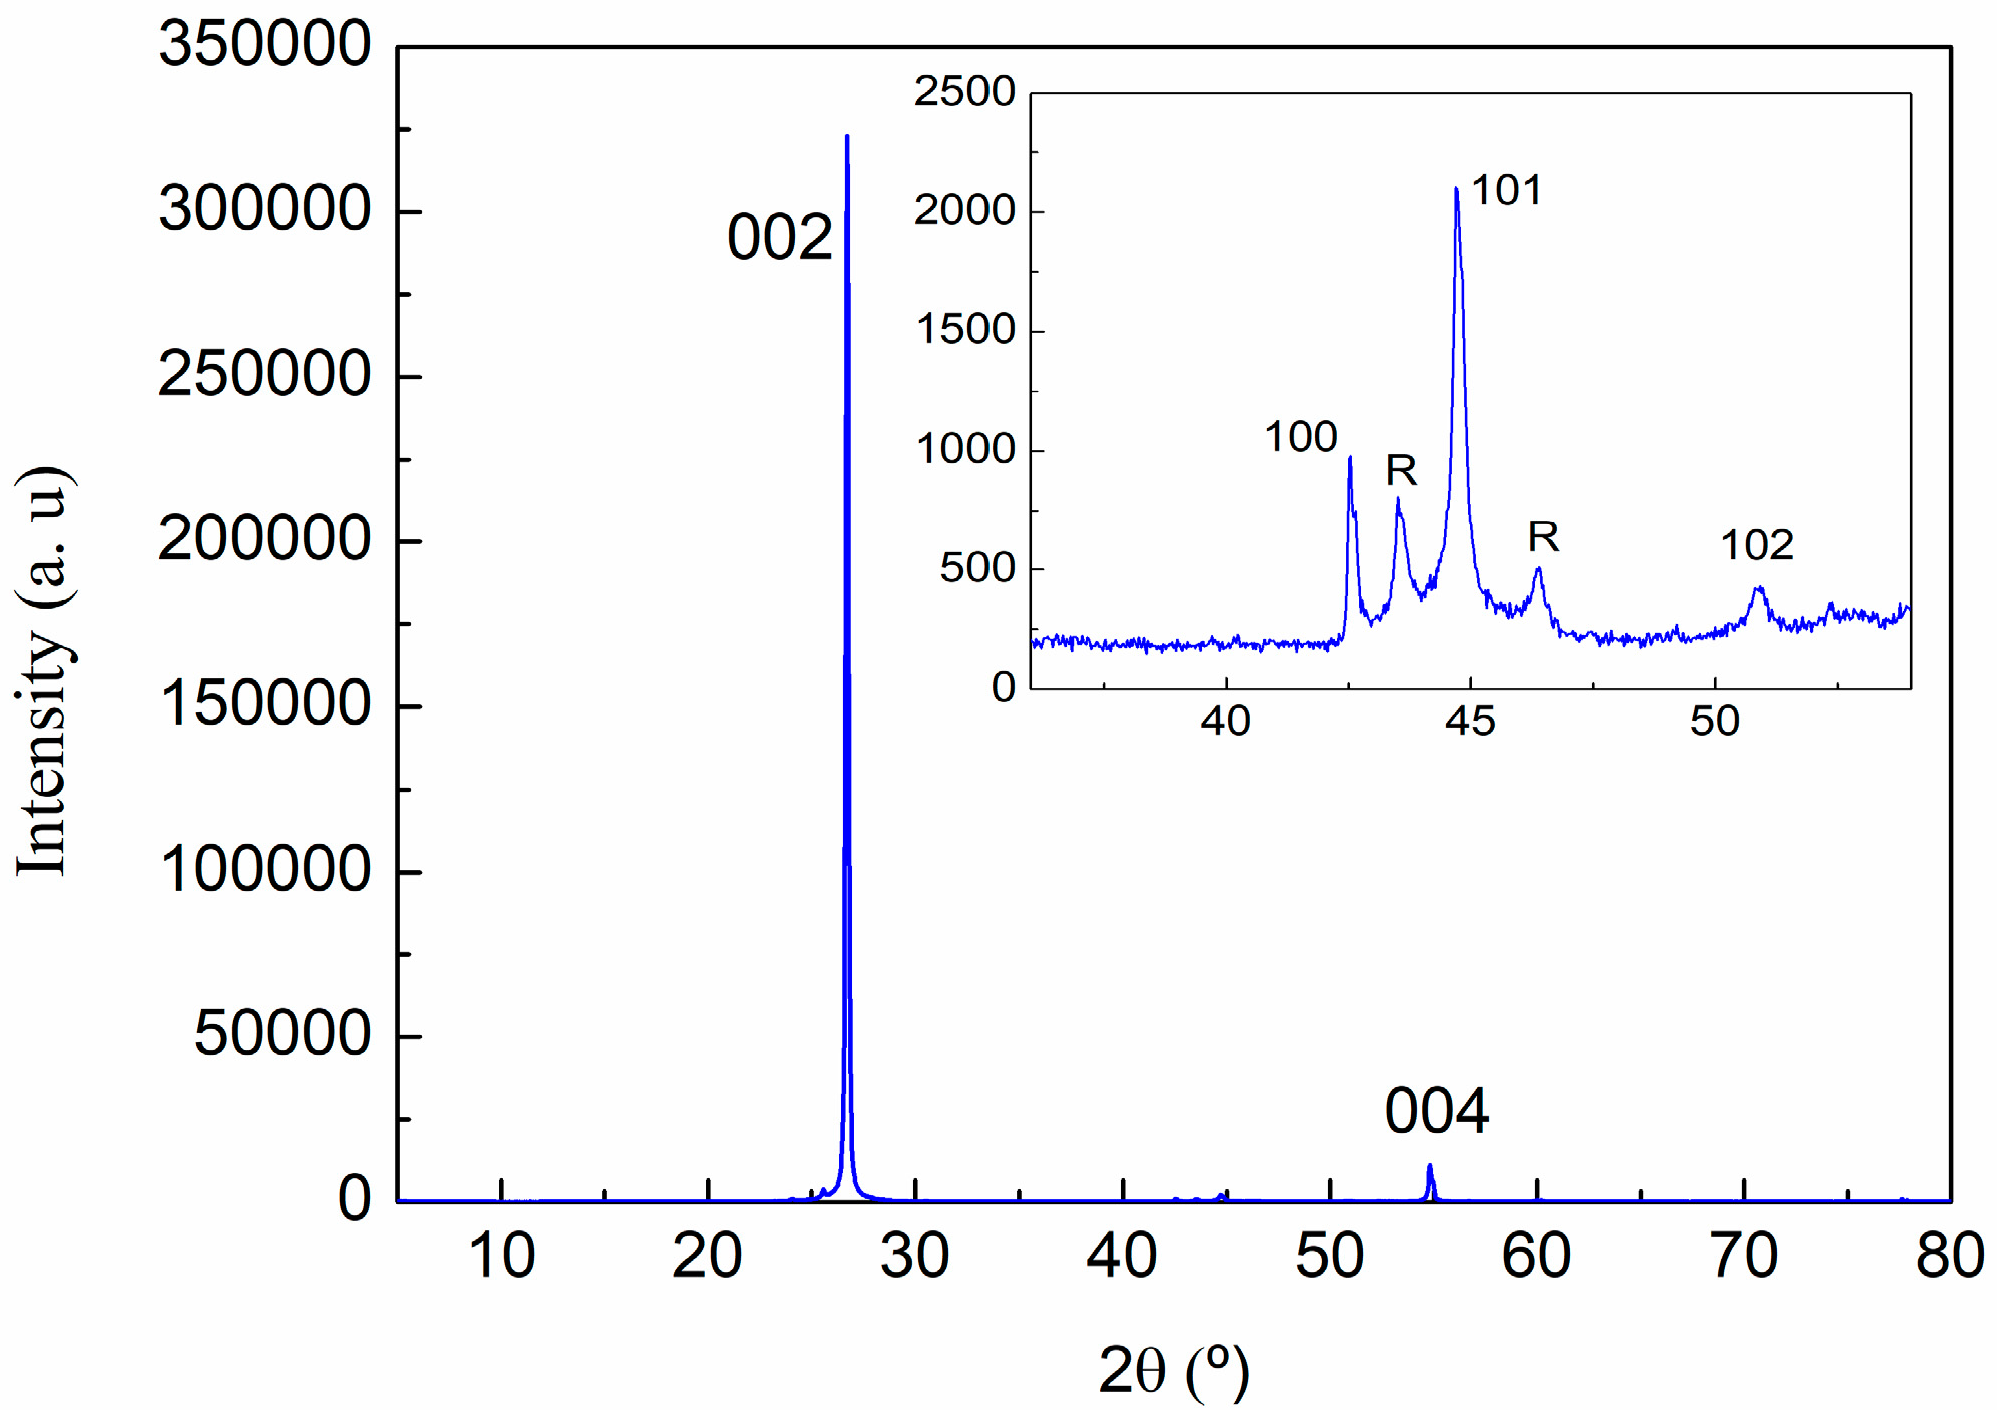
| (hkl) | 2θ (°) | d (A) | Lattice (A) | |
|---|---|---|---|---|
| c | (002) | 26.70 | 3.336 | 6.67 |
| (004) | 54.82 | 1.673 | 6.69 | |
| a | (110) | 77.65 | 1.229 | 2.46 |
| R | R(101) | 43.573 | 2.075 | |
| R(012) | 46.346 | 1.958 |
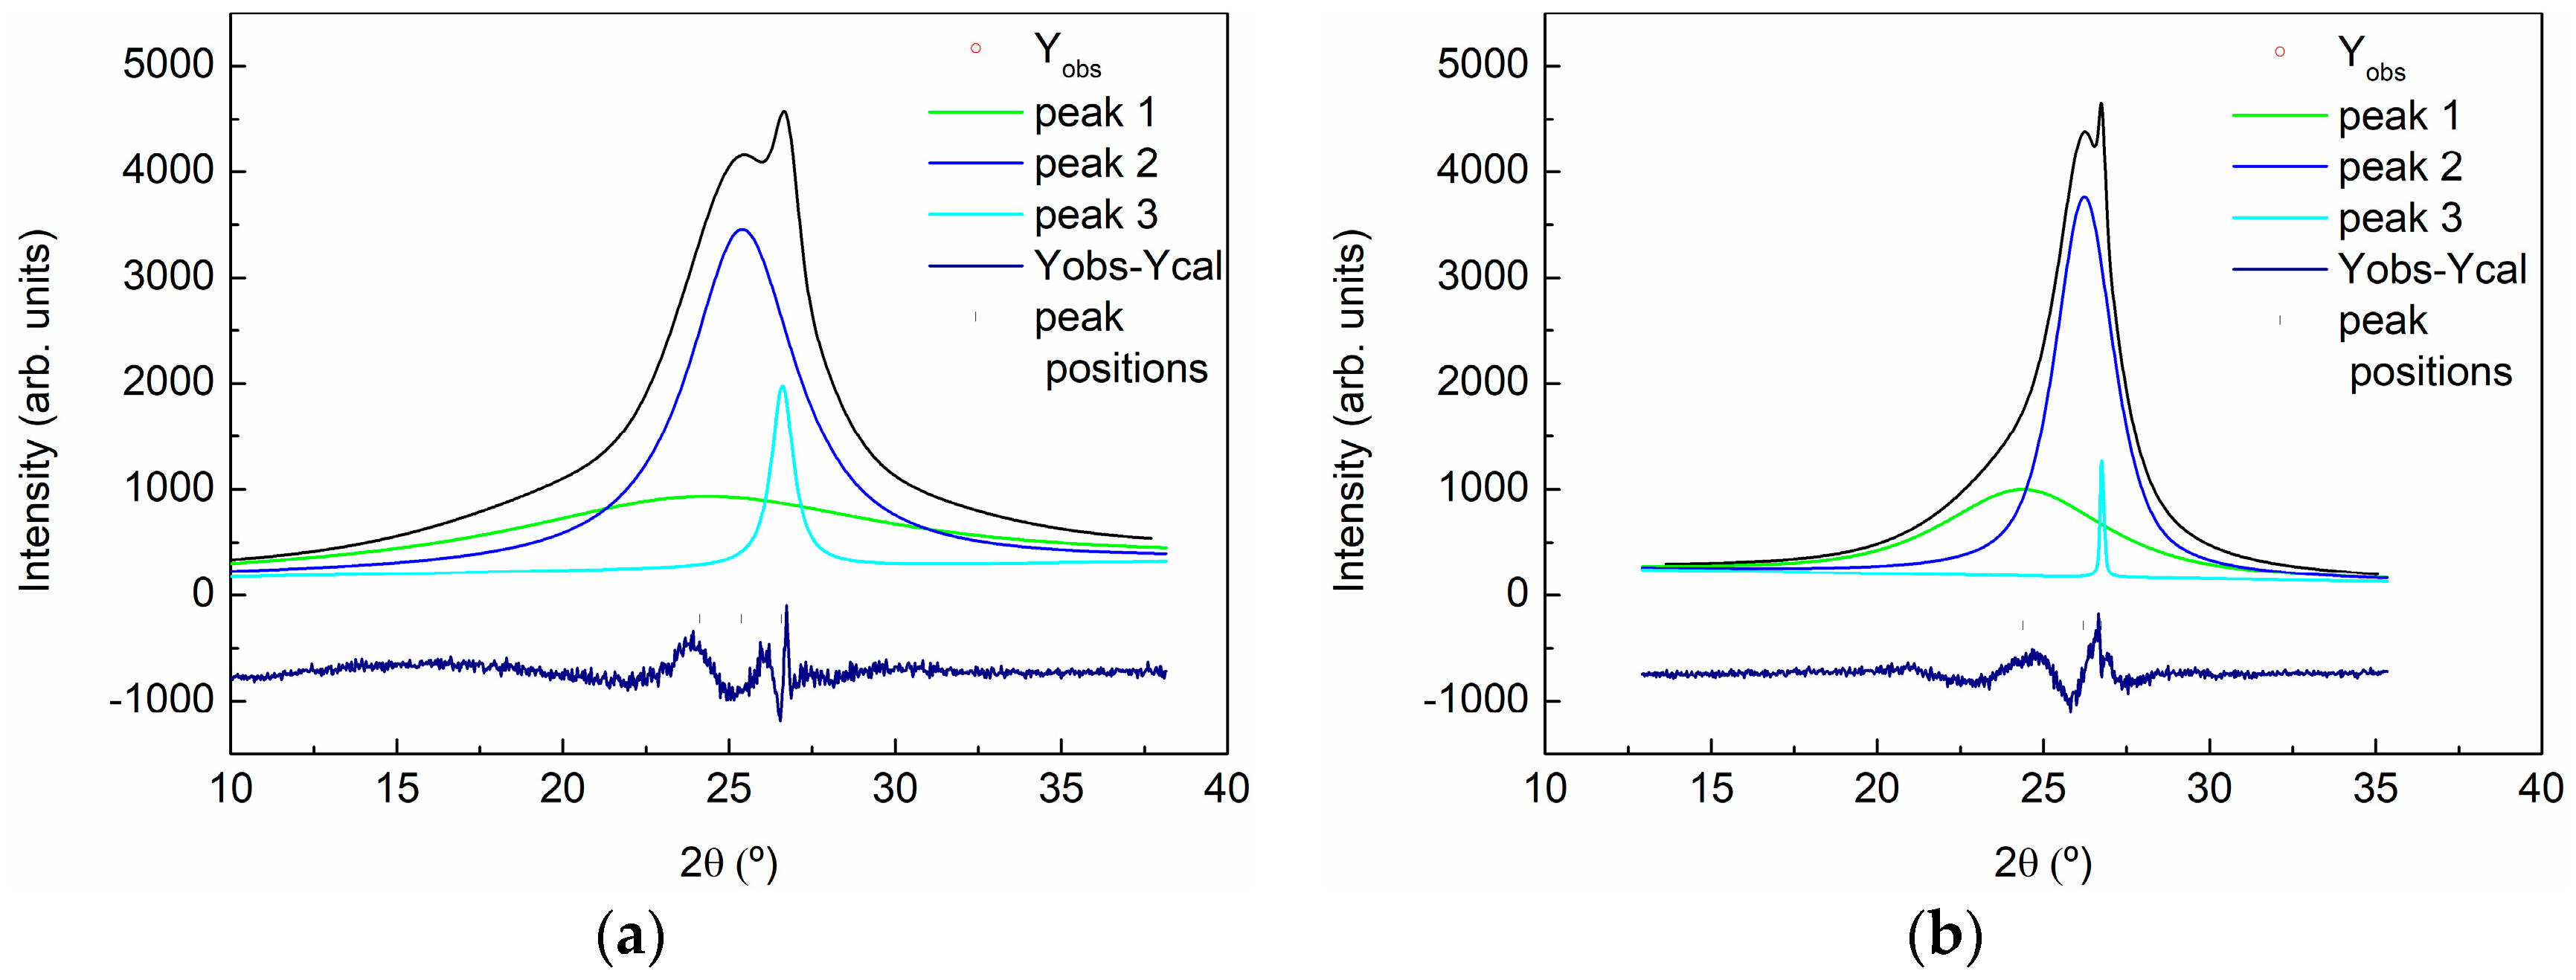
| Sample | 2θ (°) | d (A) | Lattice (A) | FWHM | Dispersion | % |
|---|---|---|---|---|---|---|
| GO | 24.440 | 3.64 | 7.28 | 13 | - | 52 |
| 25.425 | 3.50 | 7.00 | 4 | 3.03–4.14 | 43 | |
| 26.528 | 3.36 | 6.72 | 0.8 | 3.26–3.46 | 5 | |
| rGO | 24.530 | 3.62 | 7.24 | 6 | 2.92–4.79 | 41 |
| 26.233 | 3.39 | 6.78 | 2 | 3.15–3.67 | 57 | |
| 26.528 | 3.36 | 6.72 | 0.8 | 3.26–3.46 | <2 |
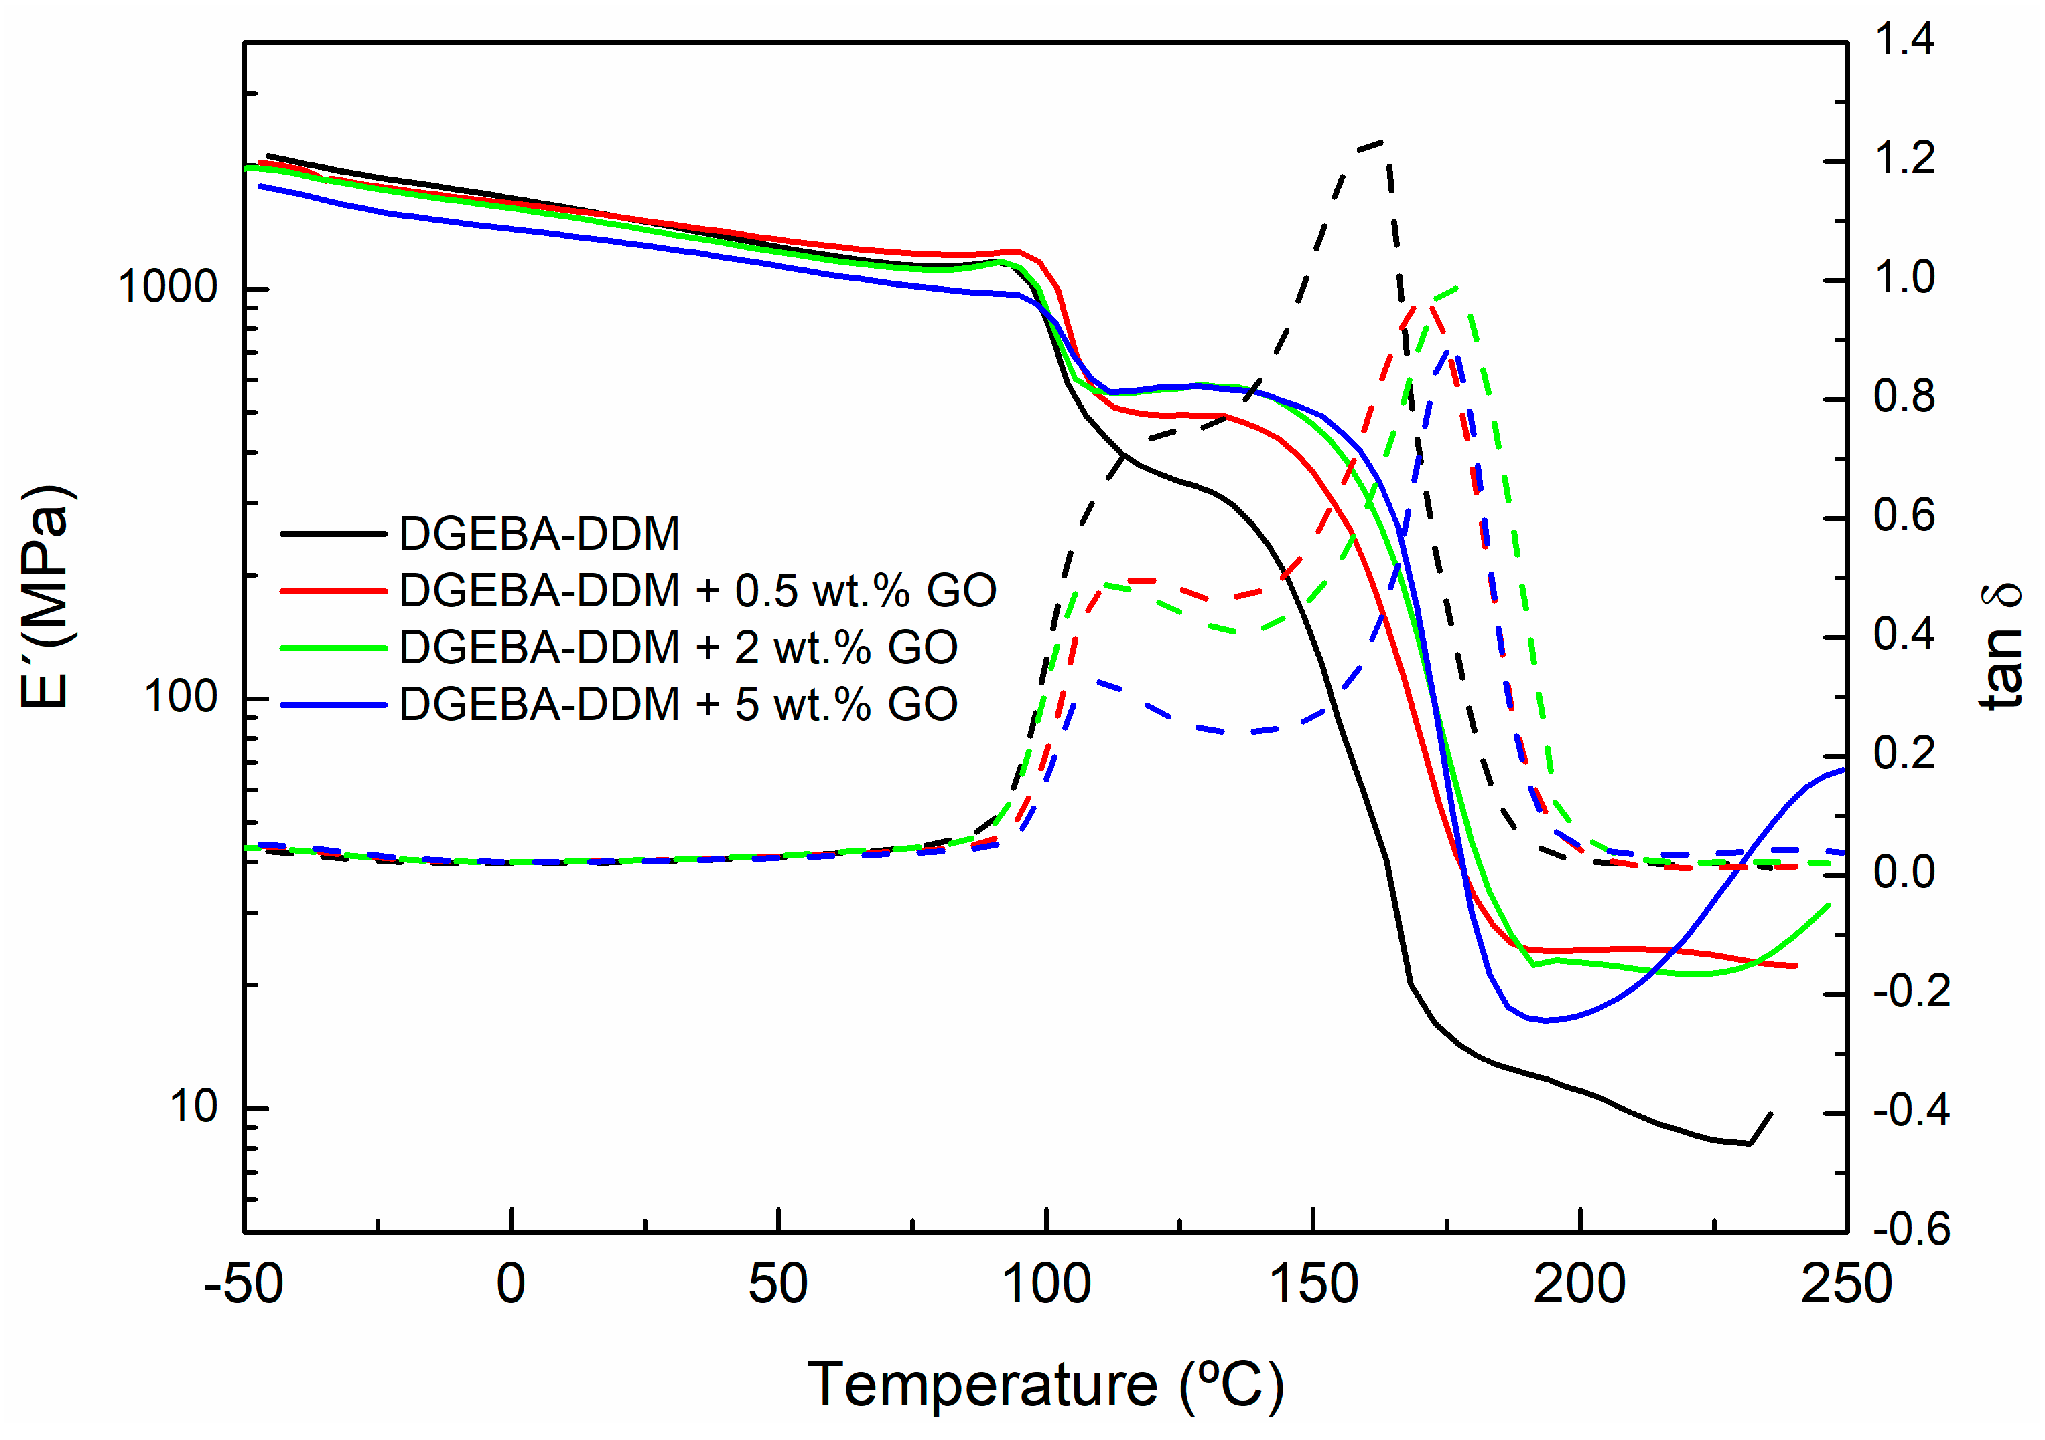
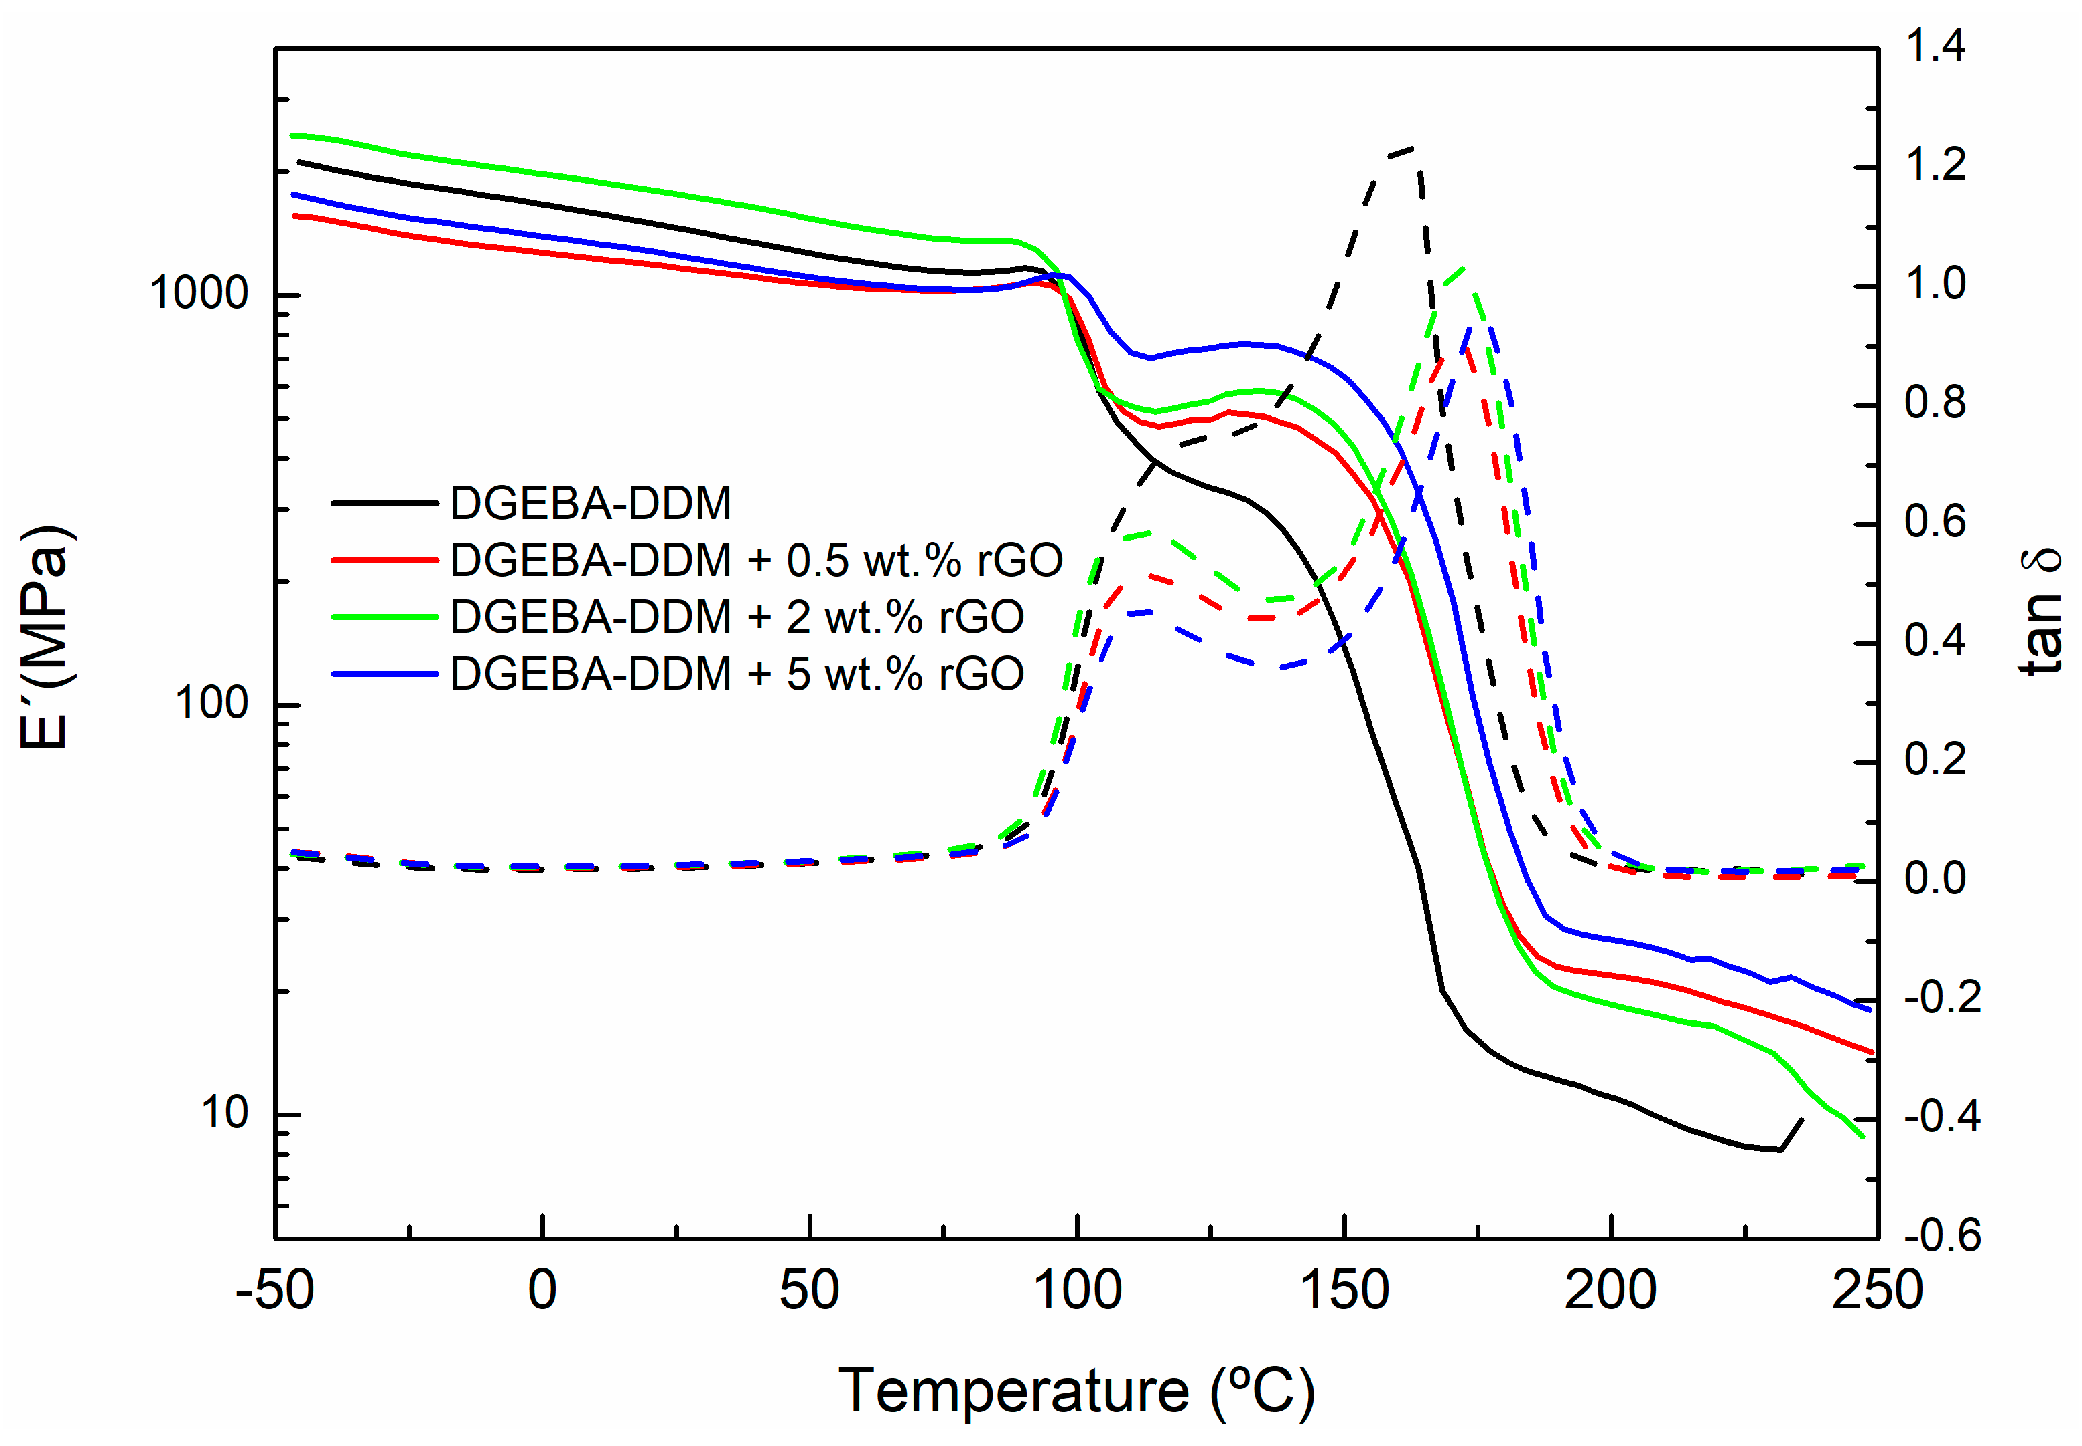
| Sample | Peak 1 (°C) | Peak 2 (°C) Tg∞ |
|---|---|---|
| DGEBA-DDM | 110.8 | 154.9 |
| DGEBA-DDM + 0.5 wt % GO | 112.7 | 170.2 |
| DGEBA-DDM + 2 wt % GO | 105.4 | 176.3 |
| DGEBA-DDM + 5 wt % GO | 112.0 | 176.3 |
| DGEBA-DDM + 0.5 wt % rGO | 105.2 | 162.4 |
| DGEBA-DDM + 2 wt % rGO | 107.8 | 162.4 |
| DGEBA-DDM + 5 wt % rGO | 113.7 | 173.9 |
© 2017 by the authors. Licensee MDPI, Basel, Switzerland. This article is an open access article distributed under the terms and conditions of the Creative Commons Attribution (CC BY) license (http://creativecommons.org/licenses/by/4.0/).
Share and Cite
Monteserín, C.; Blanco, M.; Aranzabe, E.; Aranzabe, A.; Laza, J.M.; Larrañaga-Varga, A.; Vilas, J.L. Effects of Graphene Oxide and Chemically-Reduced Graphene Oxide on the Dynamic Mechanical Properties of Epoxy Amine Composites. Polymers 2017, 9, 449. https://doi.org/10.3390/polym9090449
Monteserín C, Blanco M, Aranzabe E, Aranzabe A, Laza JM, Larrañaga-Varga A, Vilas JL. Effects of Graphene Oxide and Chemically-Reduced Graphene Oxide on the Dynamic Mechanical Properties of Epoxy Amine Composites. Polymers. 2017; 9(9):449. https://doi.org/10.3390/polym9090449
Chicago/Turabian StyleMonteserín, Cristina, Miren Blanco, Estibaliz Aranzabe, Ana Aranzabe, Jose Manuel Laza, Aitor Larrañaga-Varga, and Jose Luis Vilas. 2017. "Effects of Graphene Oxide and Chemically-Reduced Graphene Oxide on the Dynamic Mechanical Properties of Epoxy Amine Composites" Polymers 9, no. 9: 449. https://doi.org/10.3390/polym9090449