Sustainable Phosphorus Measures: Strategies and Technologies for Achieving Phosphorus Security

Abstract
:1. Introduction
- Increase number of people fed per tonne phosphorus input, or, reduce total phosphorus demand while maintaining food/agricultural output;
- Reduce dependence on phosphorus imports (to reduce vulnerability to geopolitical dynamics and thereby increasing long-term access to phosphorus);
- Ensure healthy soils (no phosphorus-deficiency, no phosphorus accumulation, balanced nutrition and presence of organic matter);
- Ensure farmers needs are met (e.g., maintaining or increasing productivity; ensuring access to phosphorus fertilisers);
- Reduce losses and wastage where avoidable;
- Reduce eutrophication and pollution by preventing phosphorus from the food system from entering waterways.


| GOALS: Phosphorus security | ACTIONS: sustainable phosphorus measures | ||||
|---|---|---|---|---|---|
| Reconsider profile of agriculture * | Diversify P sources ** | Reconsider diets towards P-efficient foods | Increase phosphorus use efficiency | Increase recycling of phosphorus | |
| Increase number of people fed per tonne P input, or reduce total P demand while maintaining food/agricultural output | ★ | ★ | ★ | ||
| Reduce dependence on P imports | ★ | ★ | ★ | ★ | ★ |
| Ensure healthy soils | ★ | ★ | |||
| Ensure farmers needs are met | ★ | ★ | ★ | ||
| Reduce losses and wastage | ★ | ★ | ★ | ||
| Reduce eutrophication & pollution | ★ | ★ | |||
2. Classifying Sustainable Phosphorus Measures
2.1. Supply Measures
| Sector | SUPPLY MEASURE (S) | DEMAND MEASURE (D) | ||
|---|---|---|---|---|
| Recycling (S1) | New source (S2) | Efficiency (D1) | Reduce demand (D2) | |
| Mining (M) | MS1.1—mine tailings h | MS2.1—phosphate rock h | MD1.1—reduce avoidable losses | MD2.1—(all other measures) |
| Fertilizer (F) | FS1.1—phosphogypsum h | FS2.1—algae, seaweed | FD1.1—reduce avoidable losses | FD2.1—(AD2, LD2, PD2) |
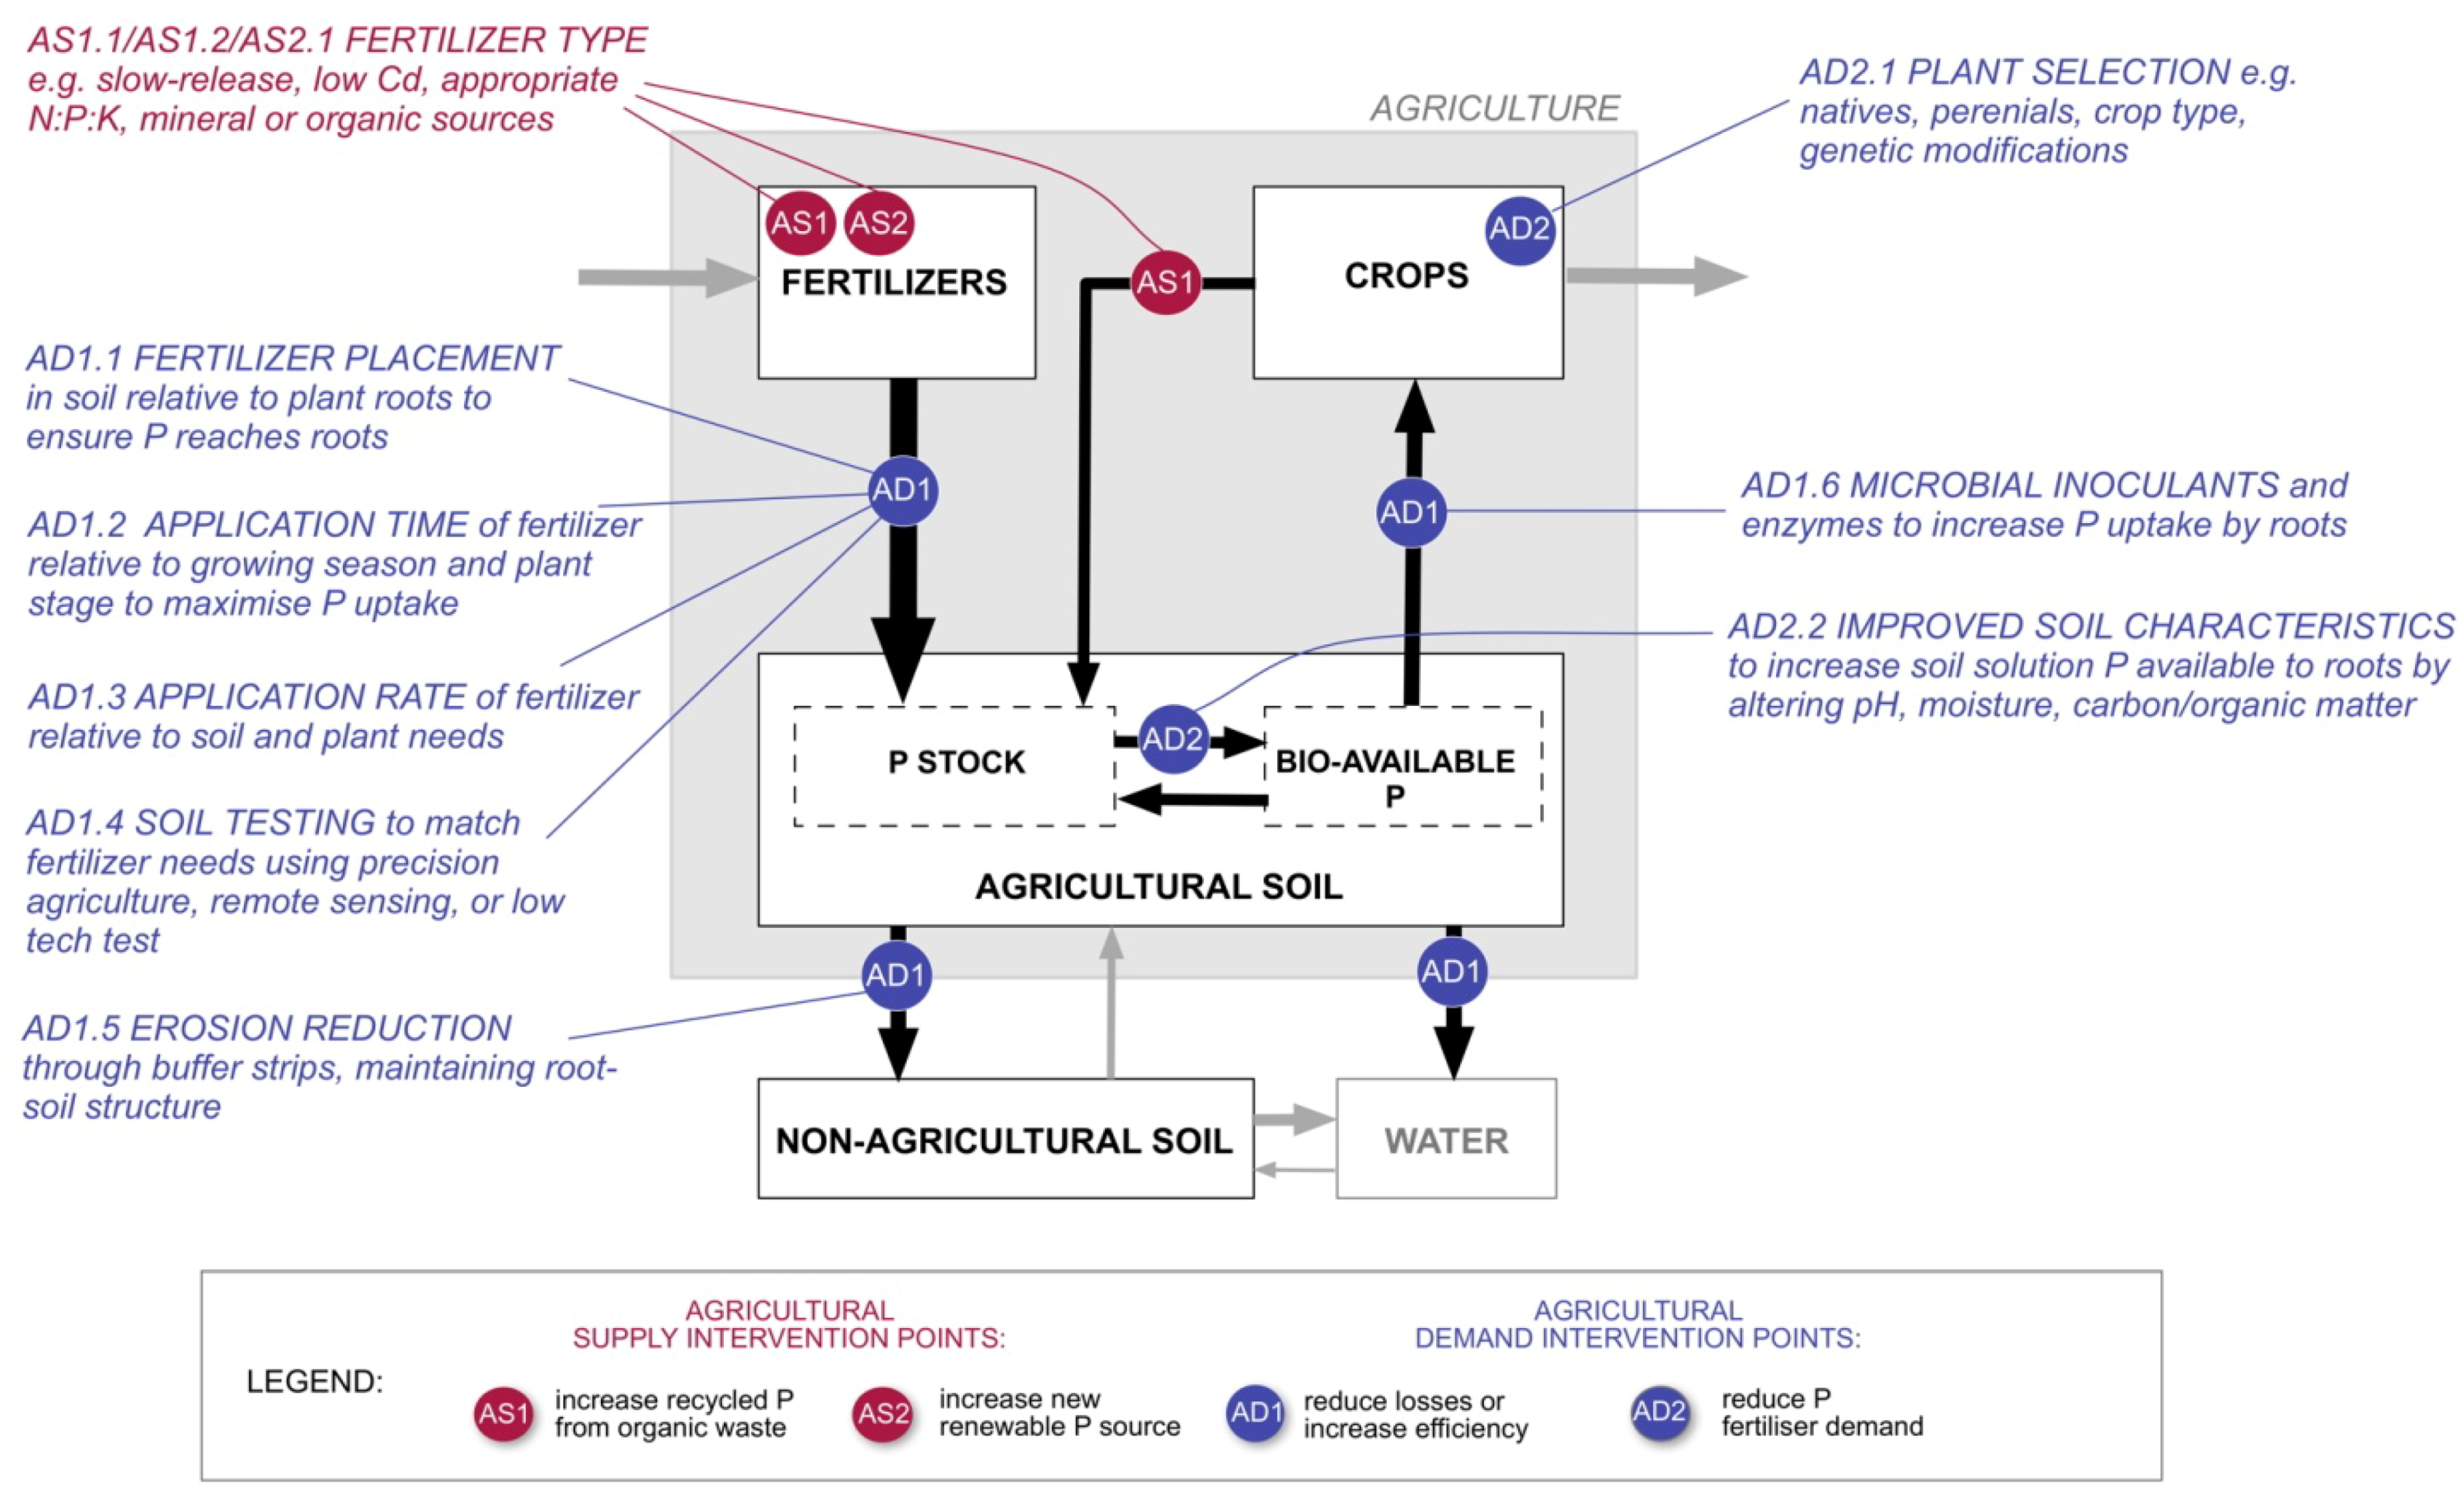
| Agriculture (A) | AS1.1—crop waste b,d,e AS1.2—(LS1, PS1, WS1) | AS2.1—(FS2) AS2.2—green manure | AD1.1—fertilizer placement AD1.2—application time AD1.3—application rate AD1.4—soil testing AD1.5—erosion reduction AD1.6—microbial inoculants | AD2.1—plant selection AD2.2—improved soil characteristics |
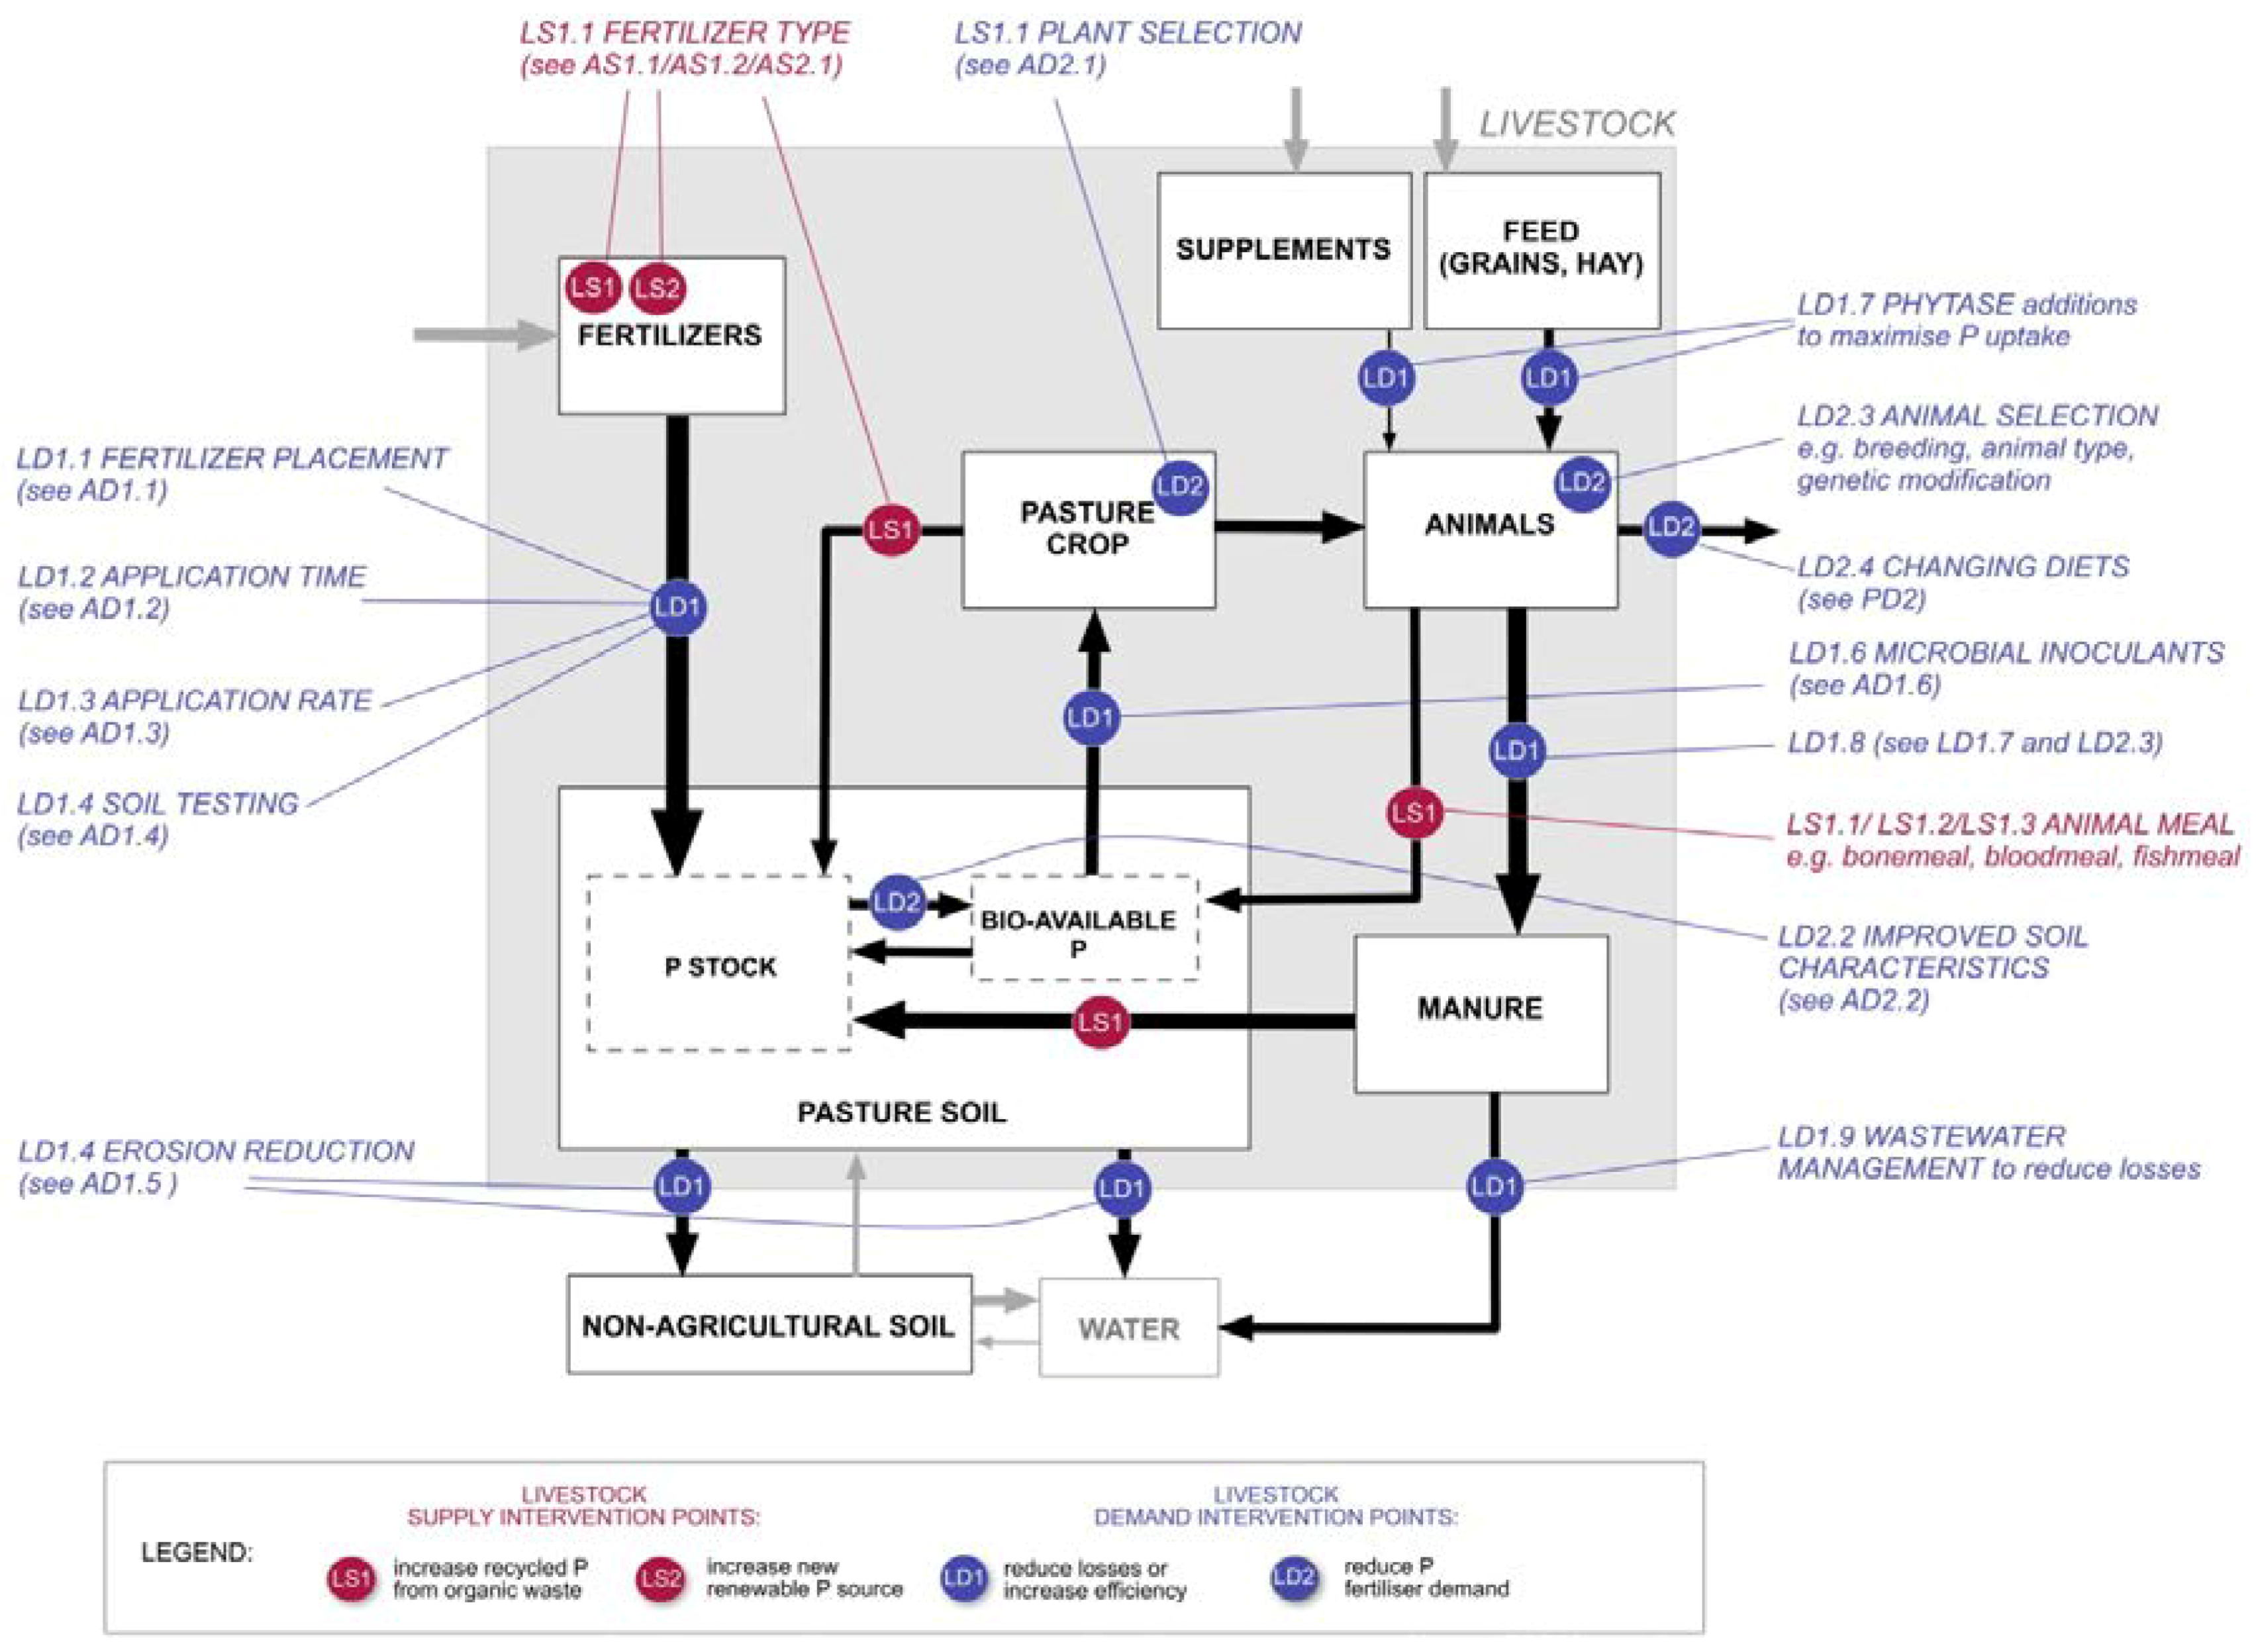
| Livestock & Fisheries (L) | LS1.1—manure a,b,f LS1.2—bone a,d LS1.3—blood a LS1.4—fish a | LS2.1—phosphate rock (supplements) h | LD1.1—fertilizer placement LD1.2—application time LD1.3—application rate LD1.4—soil testing LD1.5—erosion reduction LD1.6—microbial inoculants LD1.7—phytase enrichment LD1.8—manure P reduction LD1.9—wastewater management | LD2.1—plant selection LD2.2—improved soil characteristics LD2.3—animal selection LD2.4—changing diets |
| Food production (P) | PS1.1—food production waste PS1.2—cooked food waste | PS2.1—phosphate rock (additives) h | PD1.1—reduce avoidable losses PD1.2—producing food closer to demand PD1.3—consumer food planning/preparation | PD2.1—reduce P-intensive diets PD2.2—reduce per capita overconsumption PD2.3—healthy bodies PD2.4—minimize use of P additives |
| Wastewater & human excreta (W) | WS1.1—urine a,c WS1.2—faeces b,c,d,h WS1.3—greywater c, h WS1.4—untreated wastewater a WS1.5—treated effluent a WS1.6—struvite c WS1.7—biosolids a.b.f.h WS1.8—sludge ash d | N/A | WD1.1—repairing cracked pipes WD1.2—minimizing sewer overflows WD1.3—soil management WD1.4—avoid dumping biosolids in water WD1.5—reduce spreading biosolids on non-ag land | N/A |
2.2. Demand Measures
- reducing avoidable losses and wastage, such as food spoilage during food processing and distribution). Schroder et al. [17] present a typology of phosphorus losses, differentiating between permanent and temporary losses and hence sustainable management responses;
- increasing efficiency, such as phosphorus uptake by crop roots; or
- reducing the total phosphorus demand through changing diets towards food that require less phosphorus input per nutritional output (i.e., reversing current trends towards meat and dairy as emerging economies like China and India increase in affluence [25] and reduce the already high rate of meat and dairy consumption in developed countries).
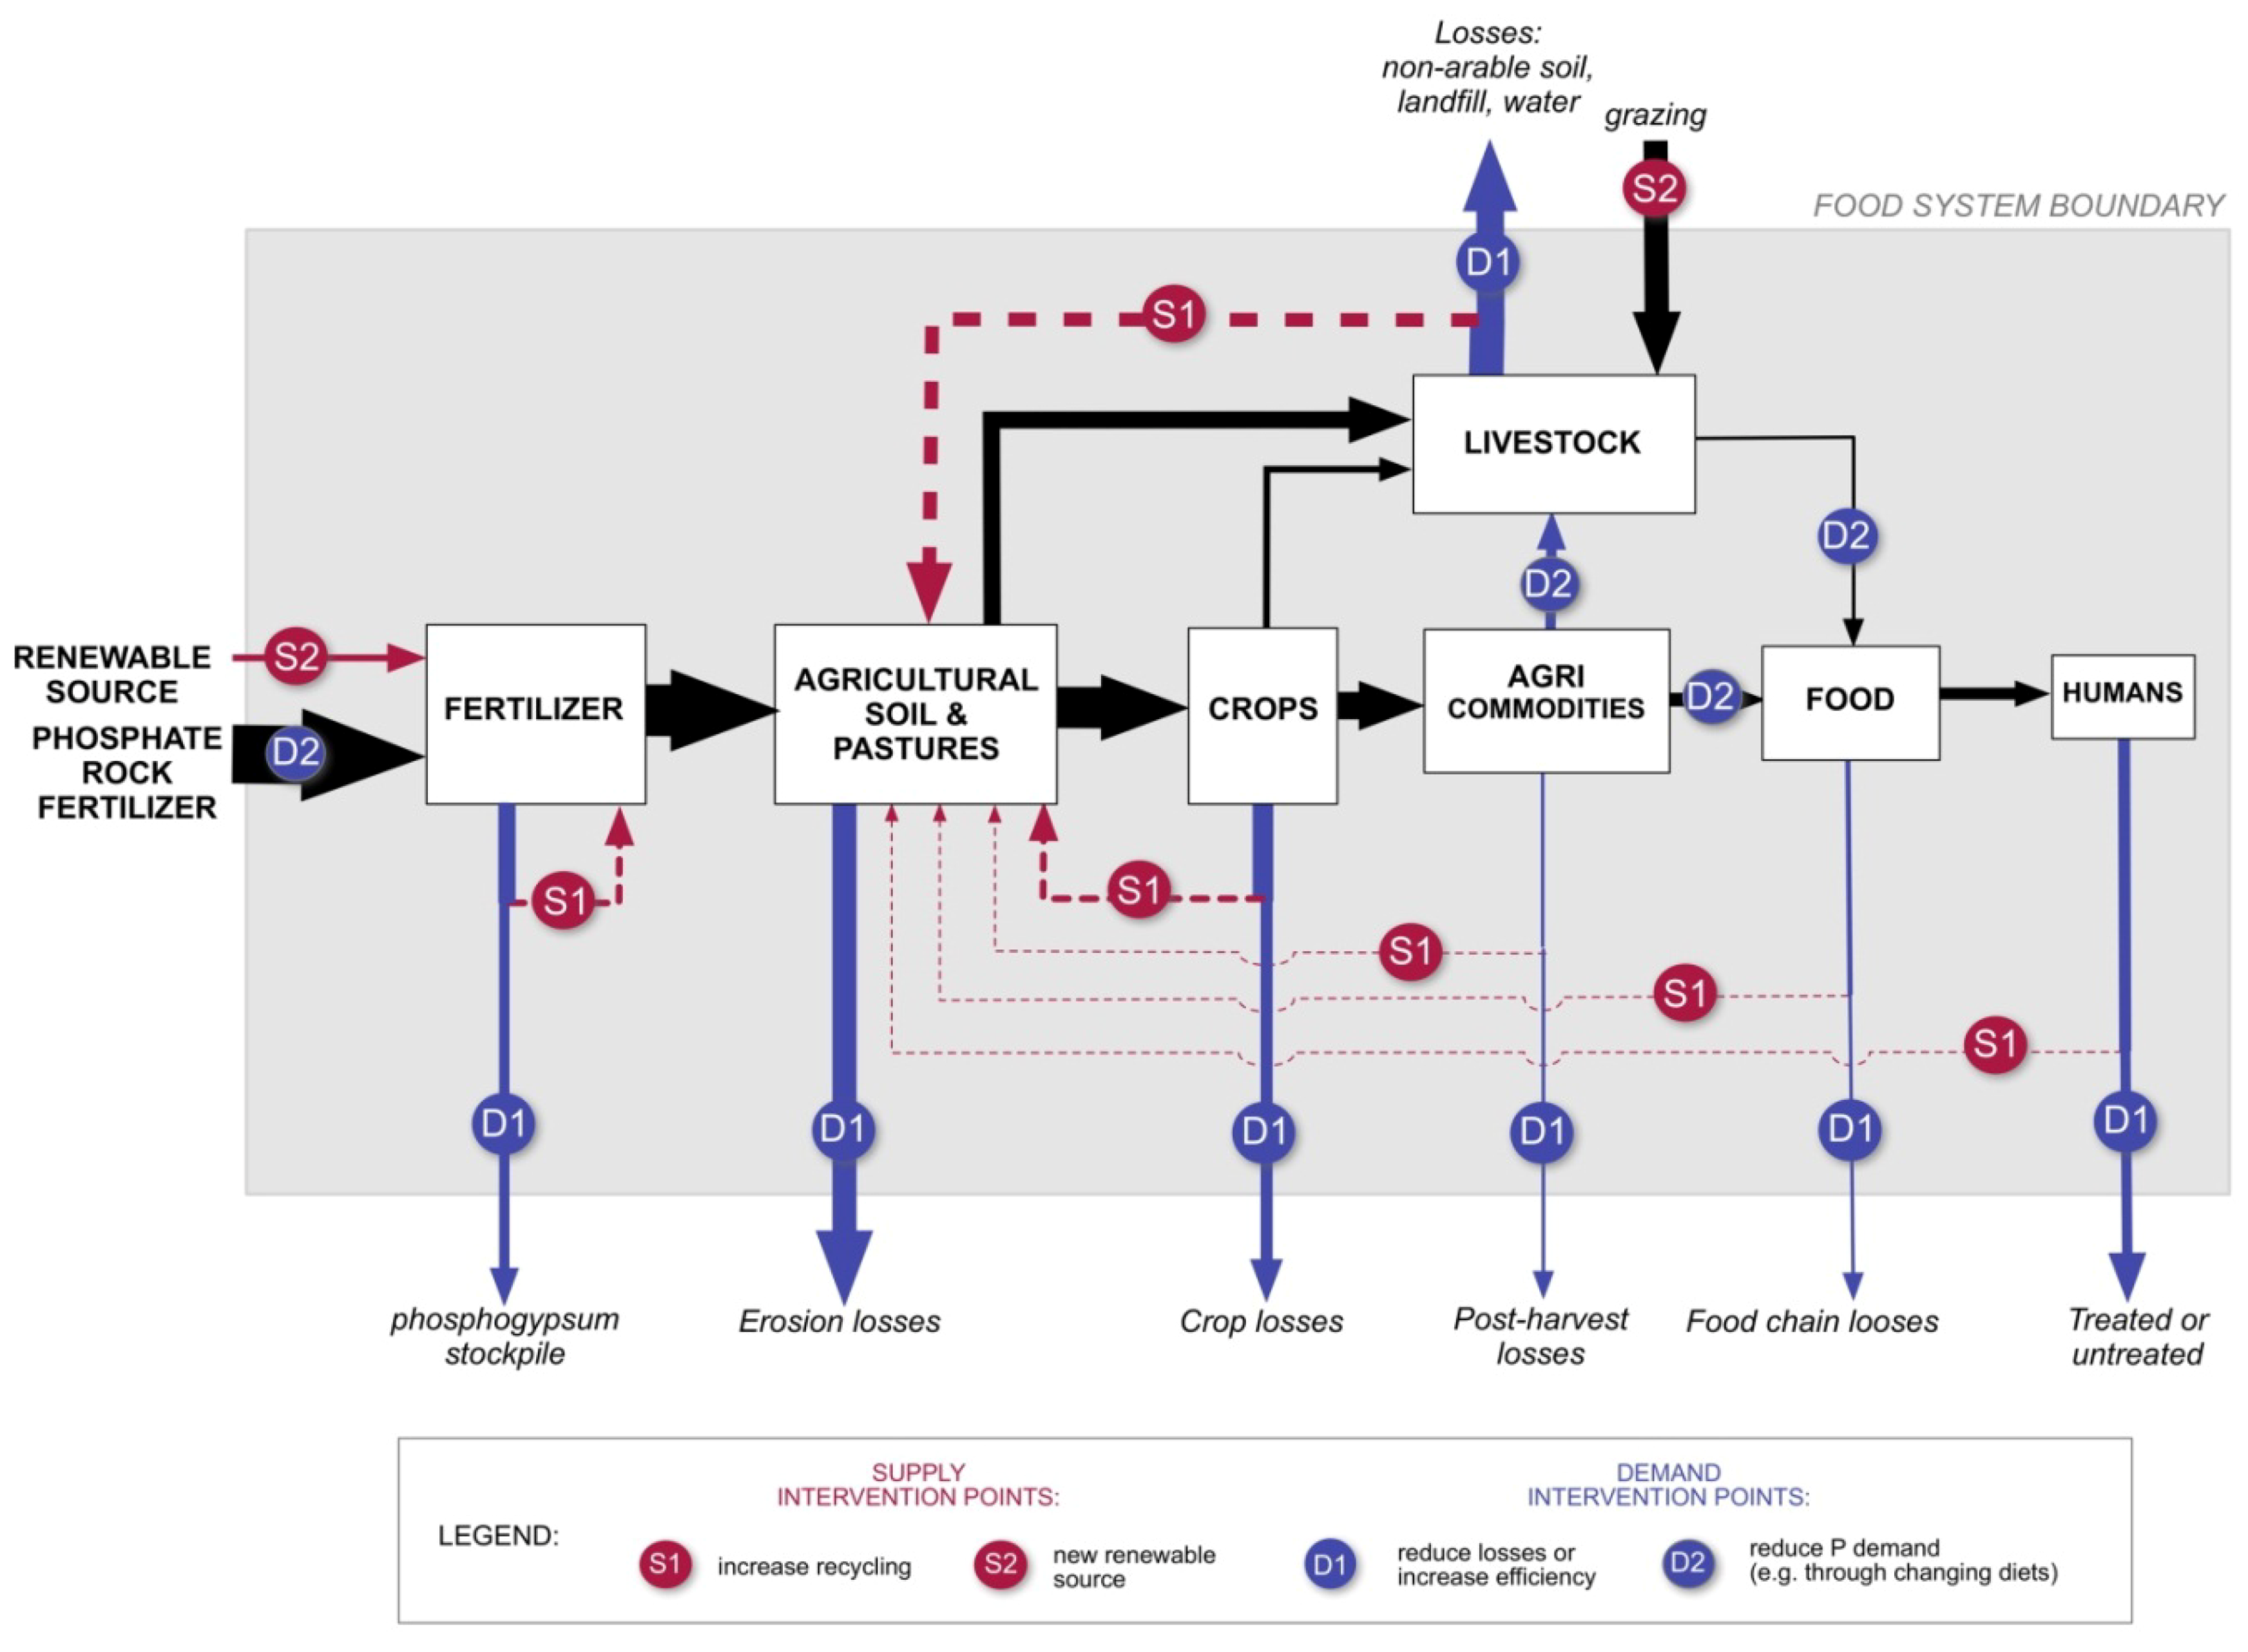
2.3. A Systems Approach

3. Sustainable Phosphorus Measures by Sector
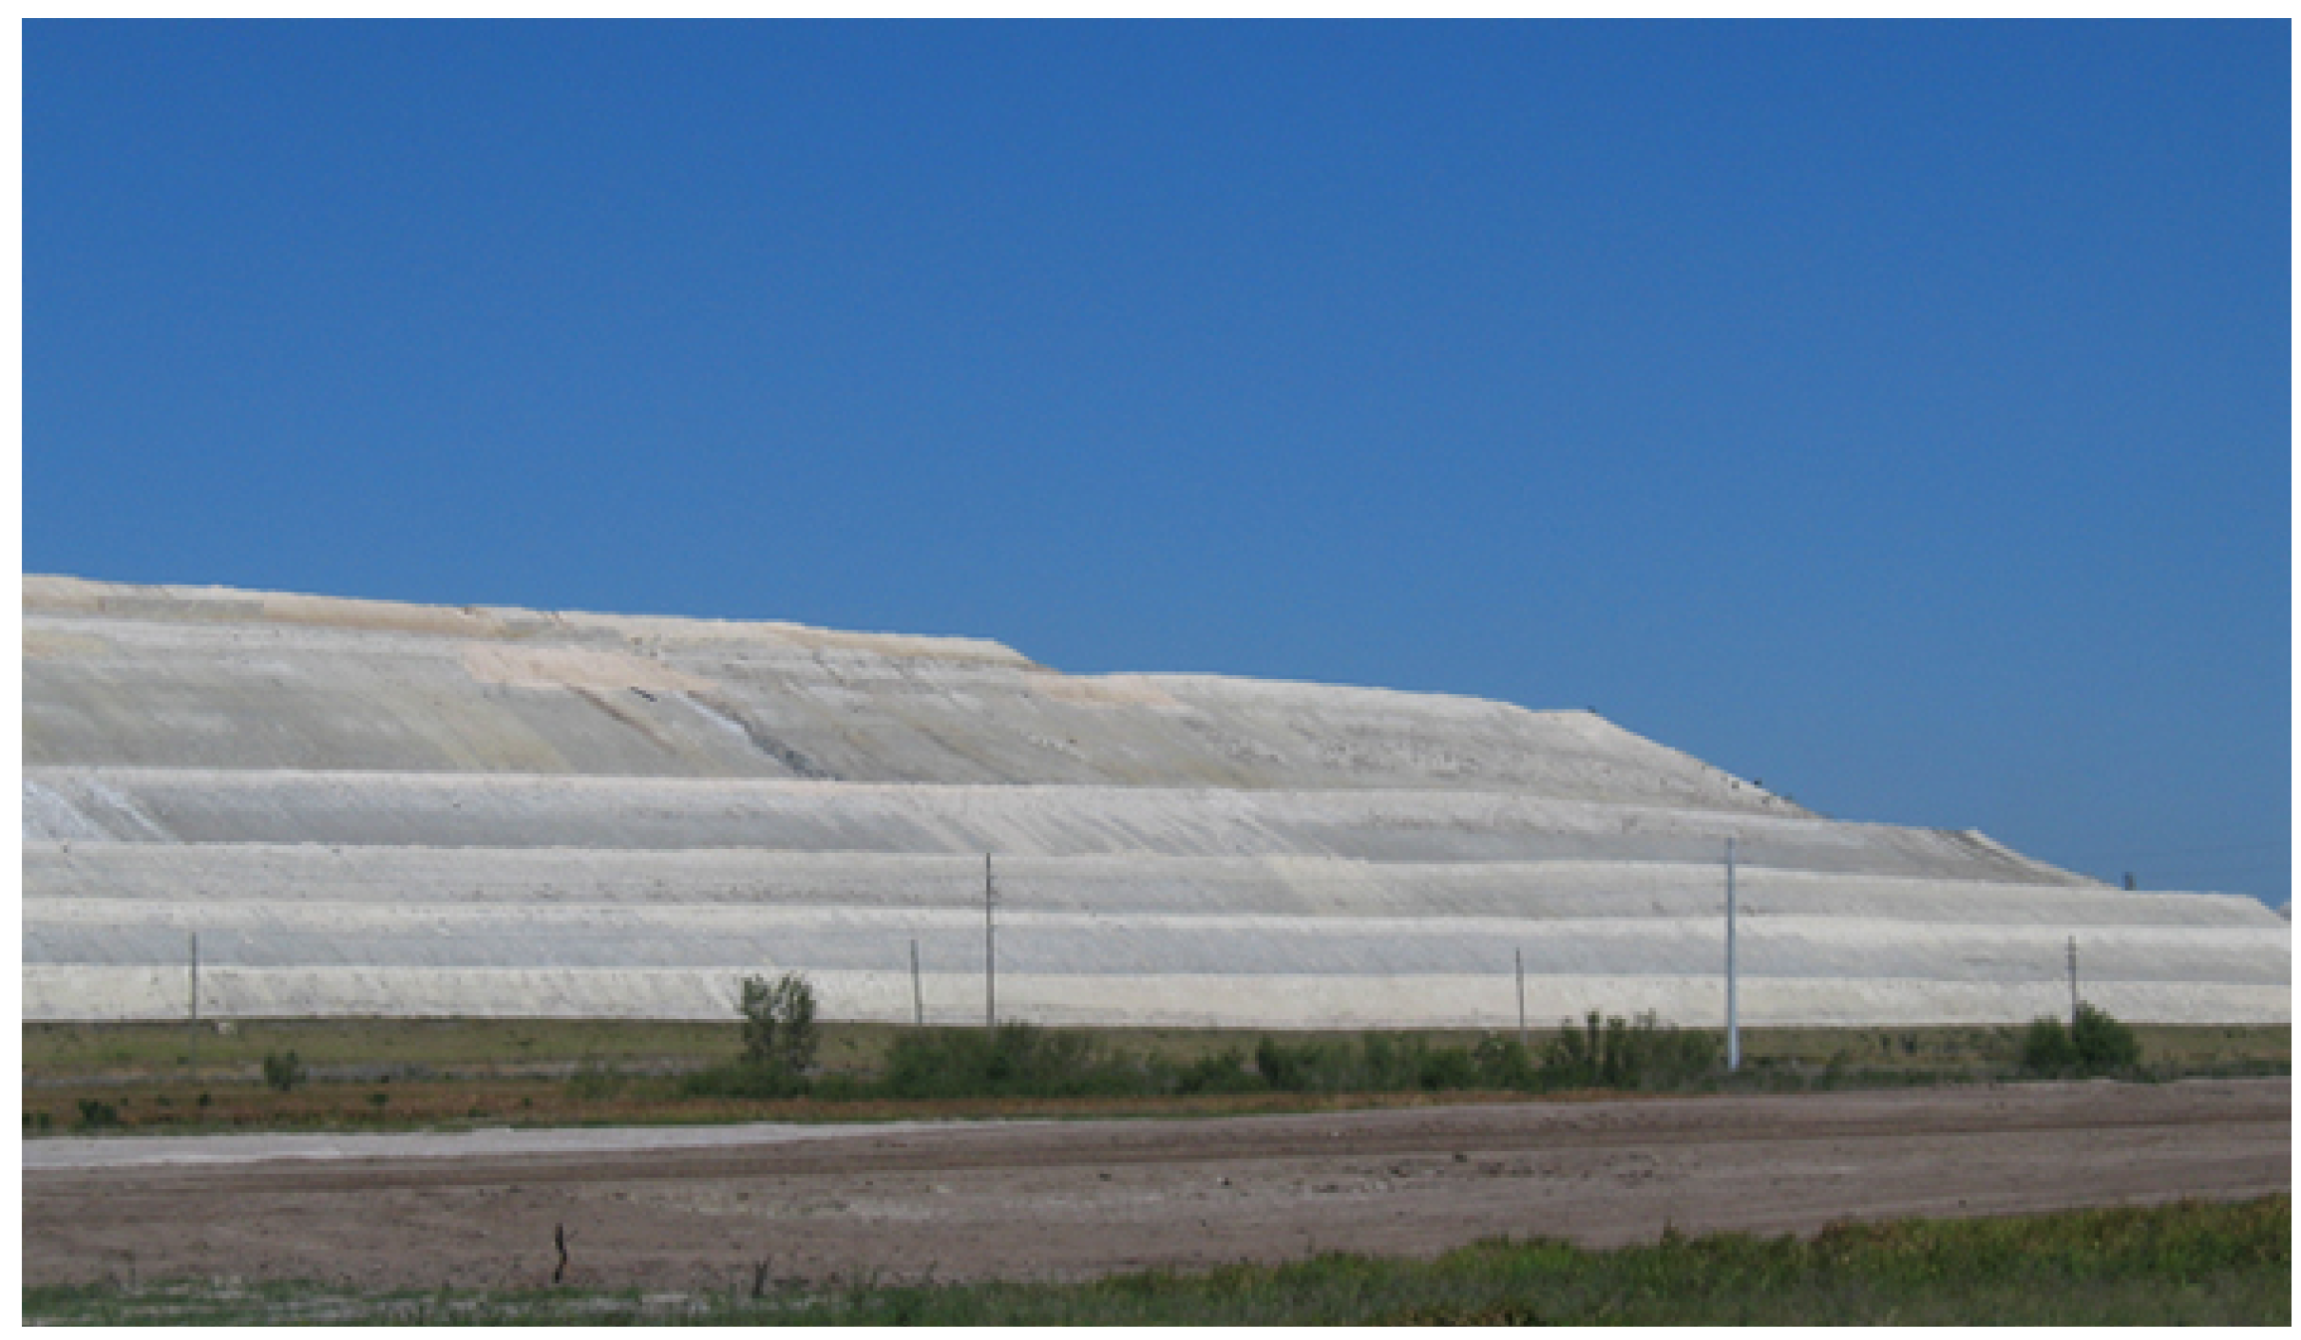
3.1. Mining Sector
- Minimizing local environmental impacts, such as pollution/breaching of tailings dams;
- Investing in efficient technologies, such as for cadmium removal;
- Corporate social responsibility, particularly in the disputed region of Western Sahara. While ownership of the region is disputed, Morocco currently occupies Western Sahara and controls that region’s extensive phosphate rock reserves in defiance of UN resolutions [34,35]. Trading with Moroccan authorities for Western Sahara’s phosphate rock is condemned by the UN, and importing phosphate rock via Morocco has been boycotted by several Scandinavian firms [36];
- Contribution of the industry to mitigating downstream impacts, in accordance with the principles and frameworks of Extended Producer Responsibility.
3.2. Fertilizer Sector
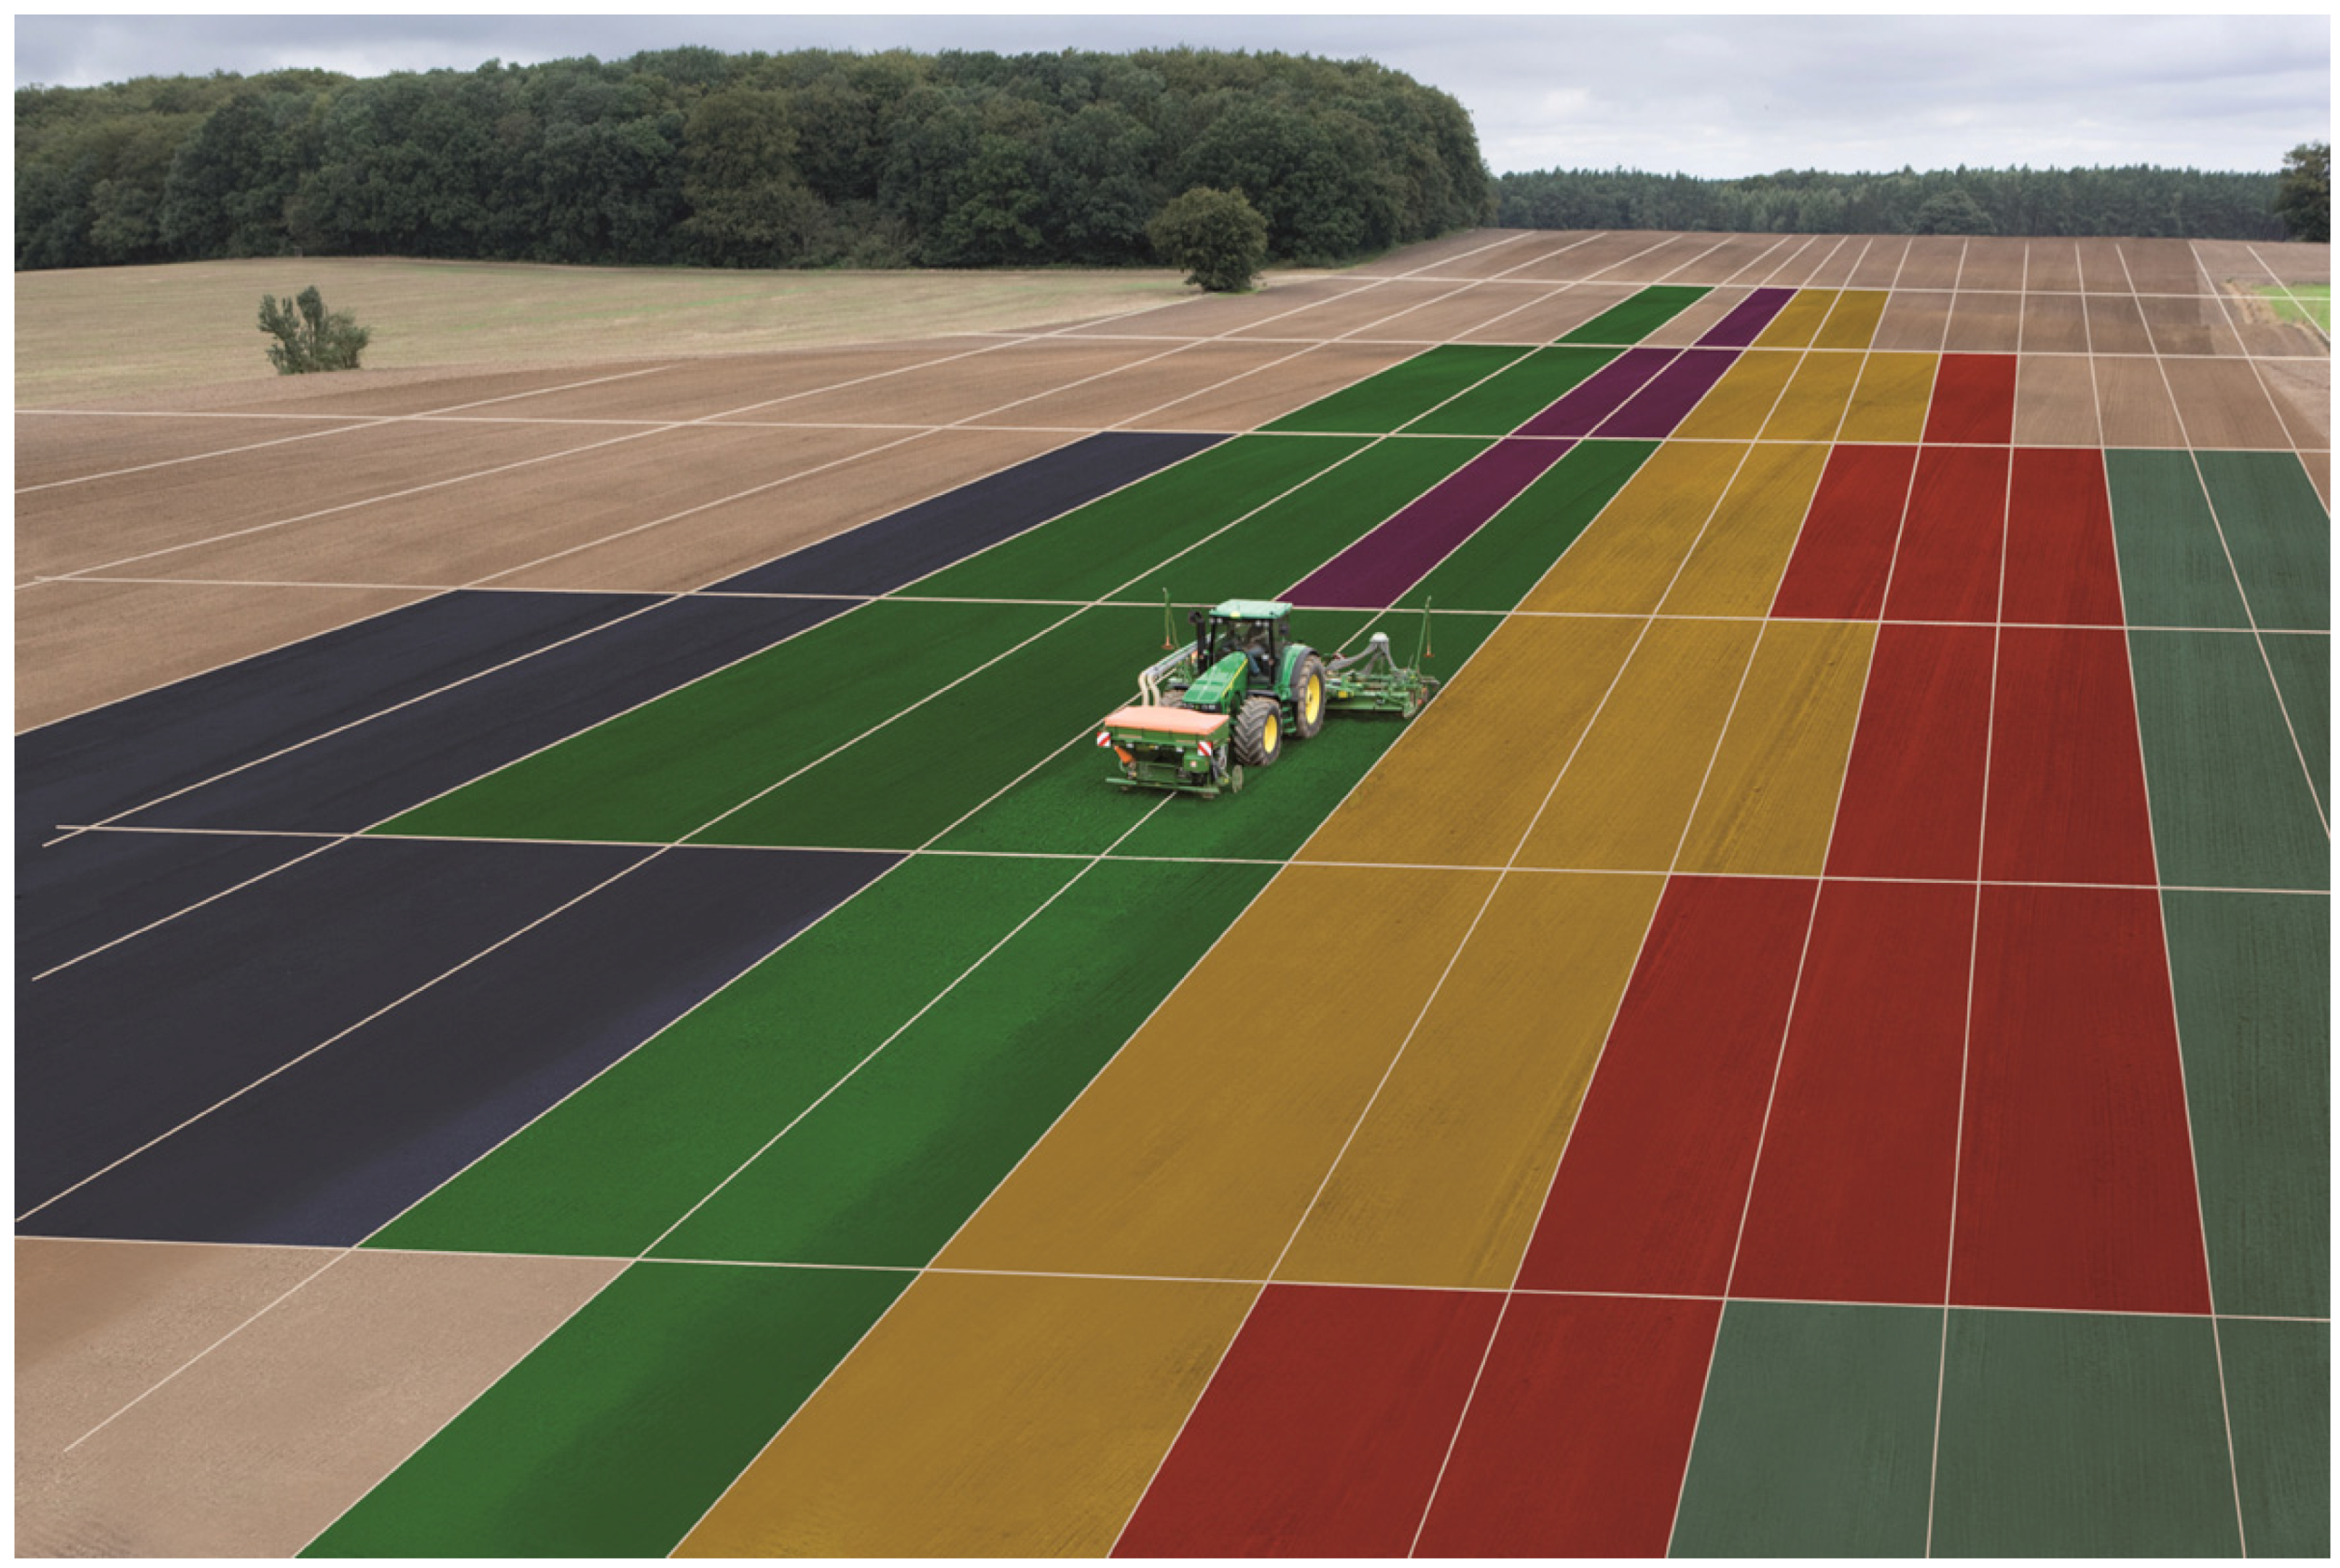
3.3. Agricultural Sector
- fertilizer selection to optimize the bioavailability of phosphorus (AS1.1, AS1.2, AS2.1);
- fertilizer use to maximize plant root’s opportunity to take up the phosphorus (AD1.1-AD1.4);
- crop selection to maximize plants ability to access more soil phosphorus or yield more crop per phosphorus accessed (AD2.1); and
- soil management to (a) ensure soil phosphorus is in solution and hence readily available to plant roots when they need it (AD1.6, AD2.2) and (b) to minimize permanent loss of soil phosphorus via wind and water erosion (AD1.5).

3.4. Livestock Sector

3.5. Food Production and Consumption Sector
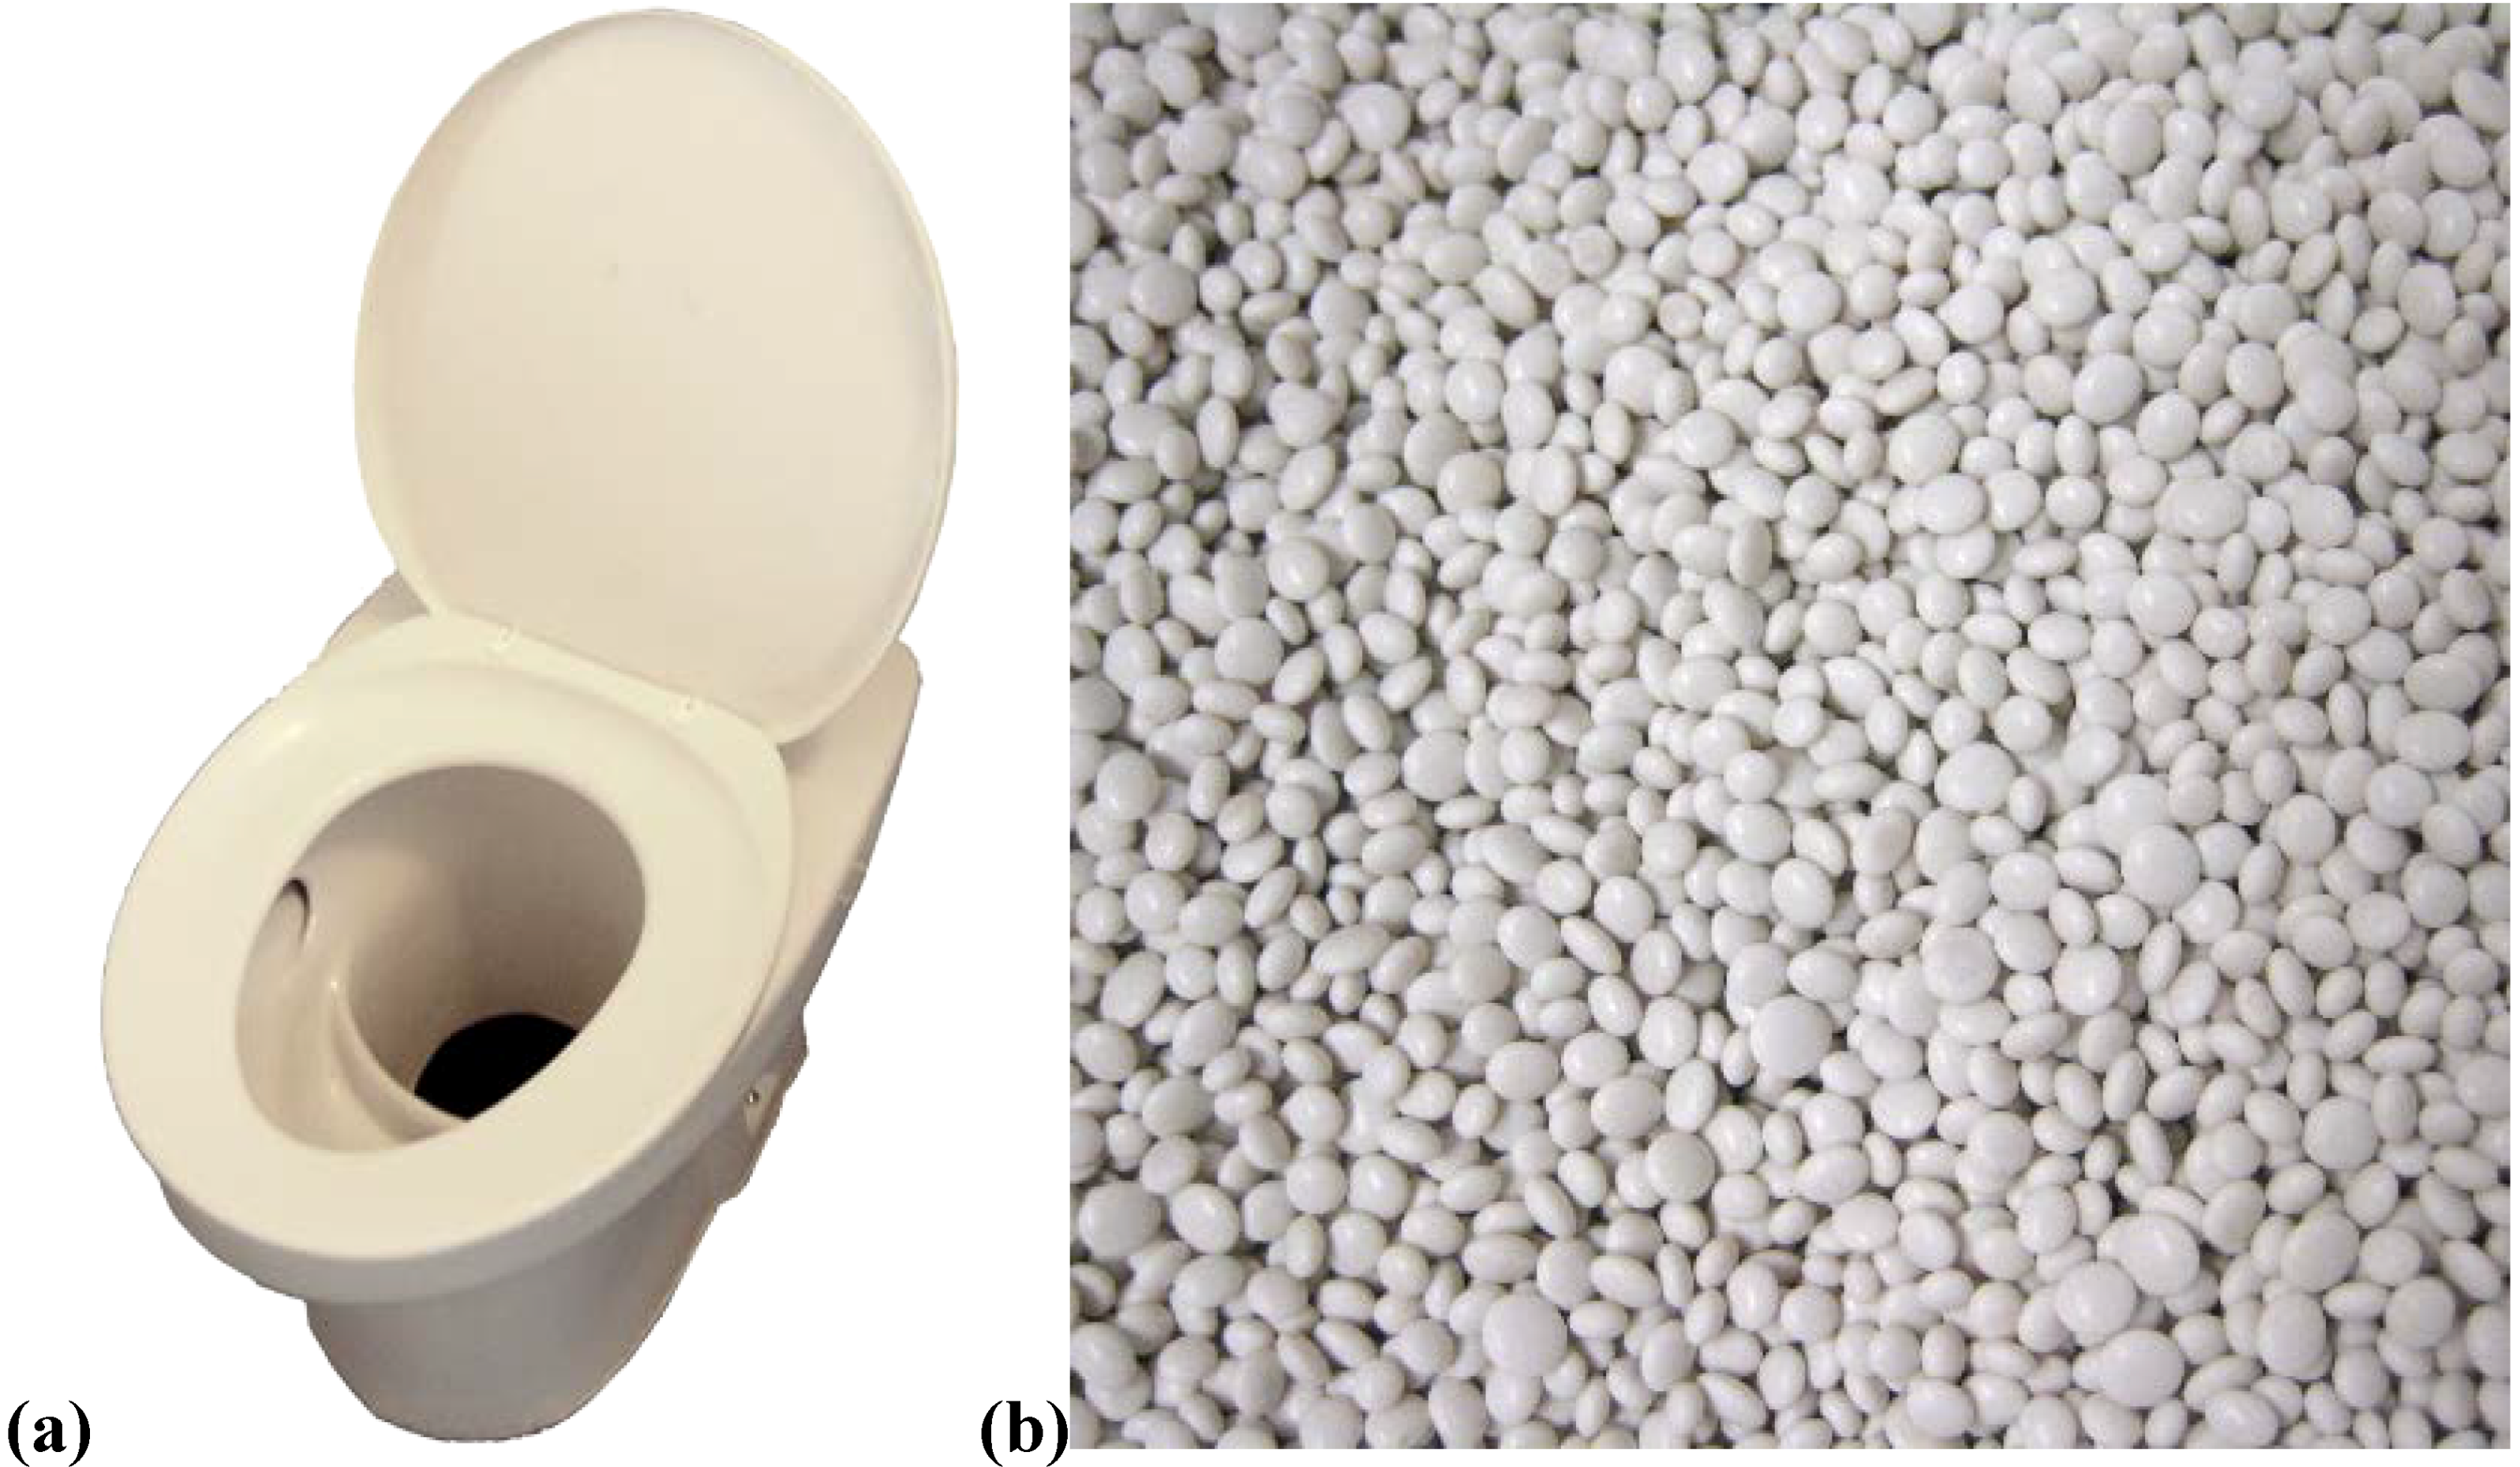
3.6. The Wastewater and Sanitation Sector
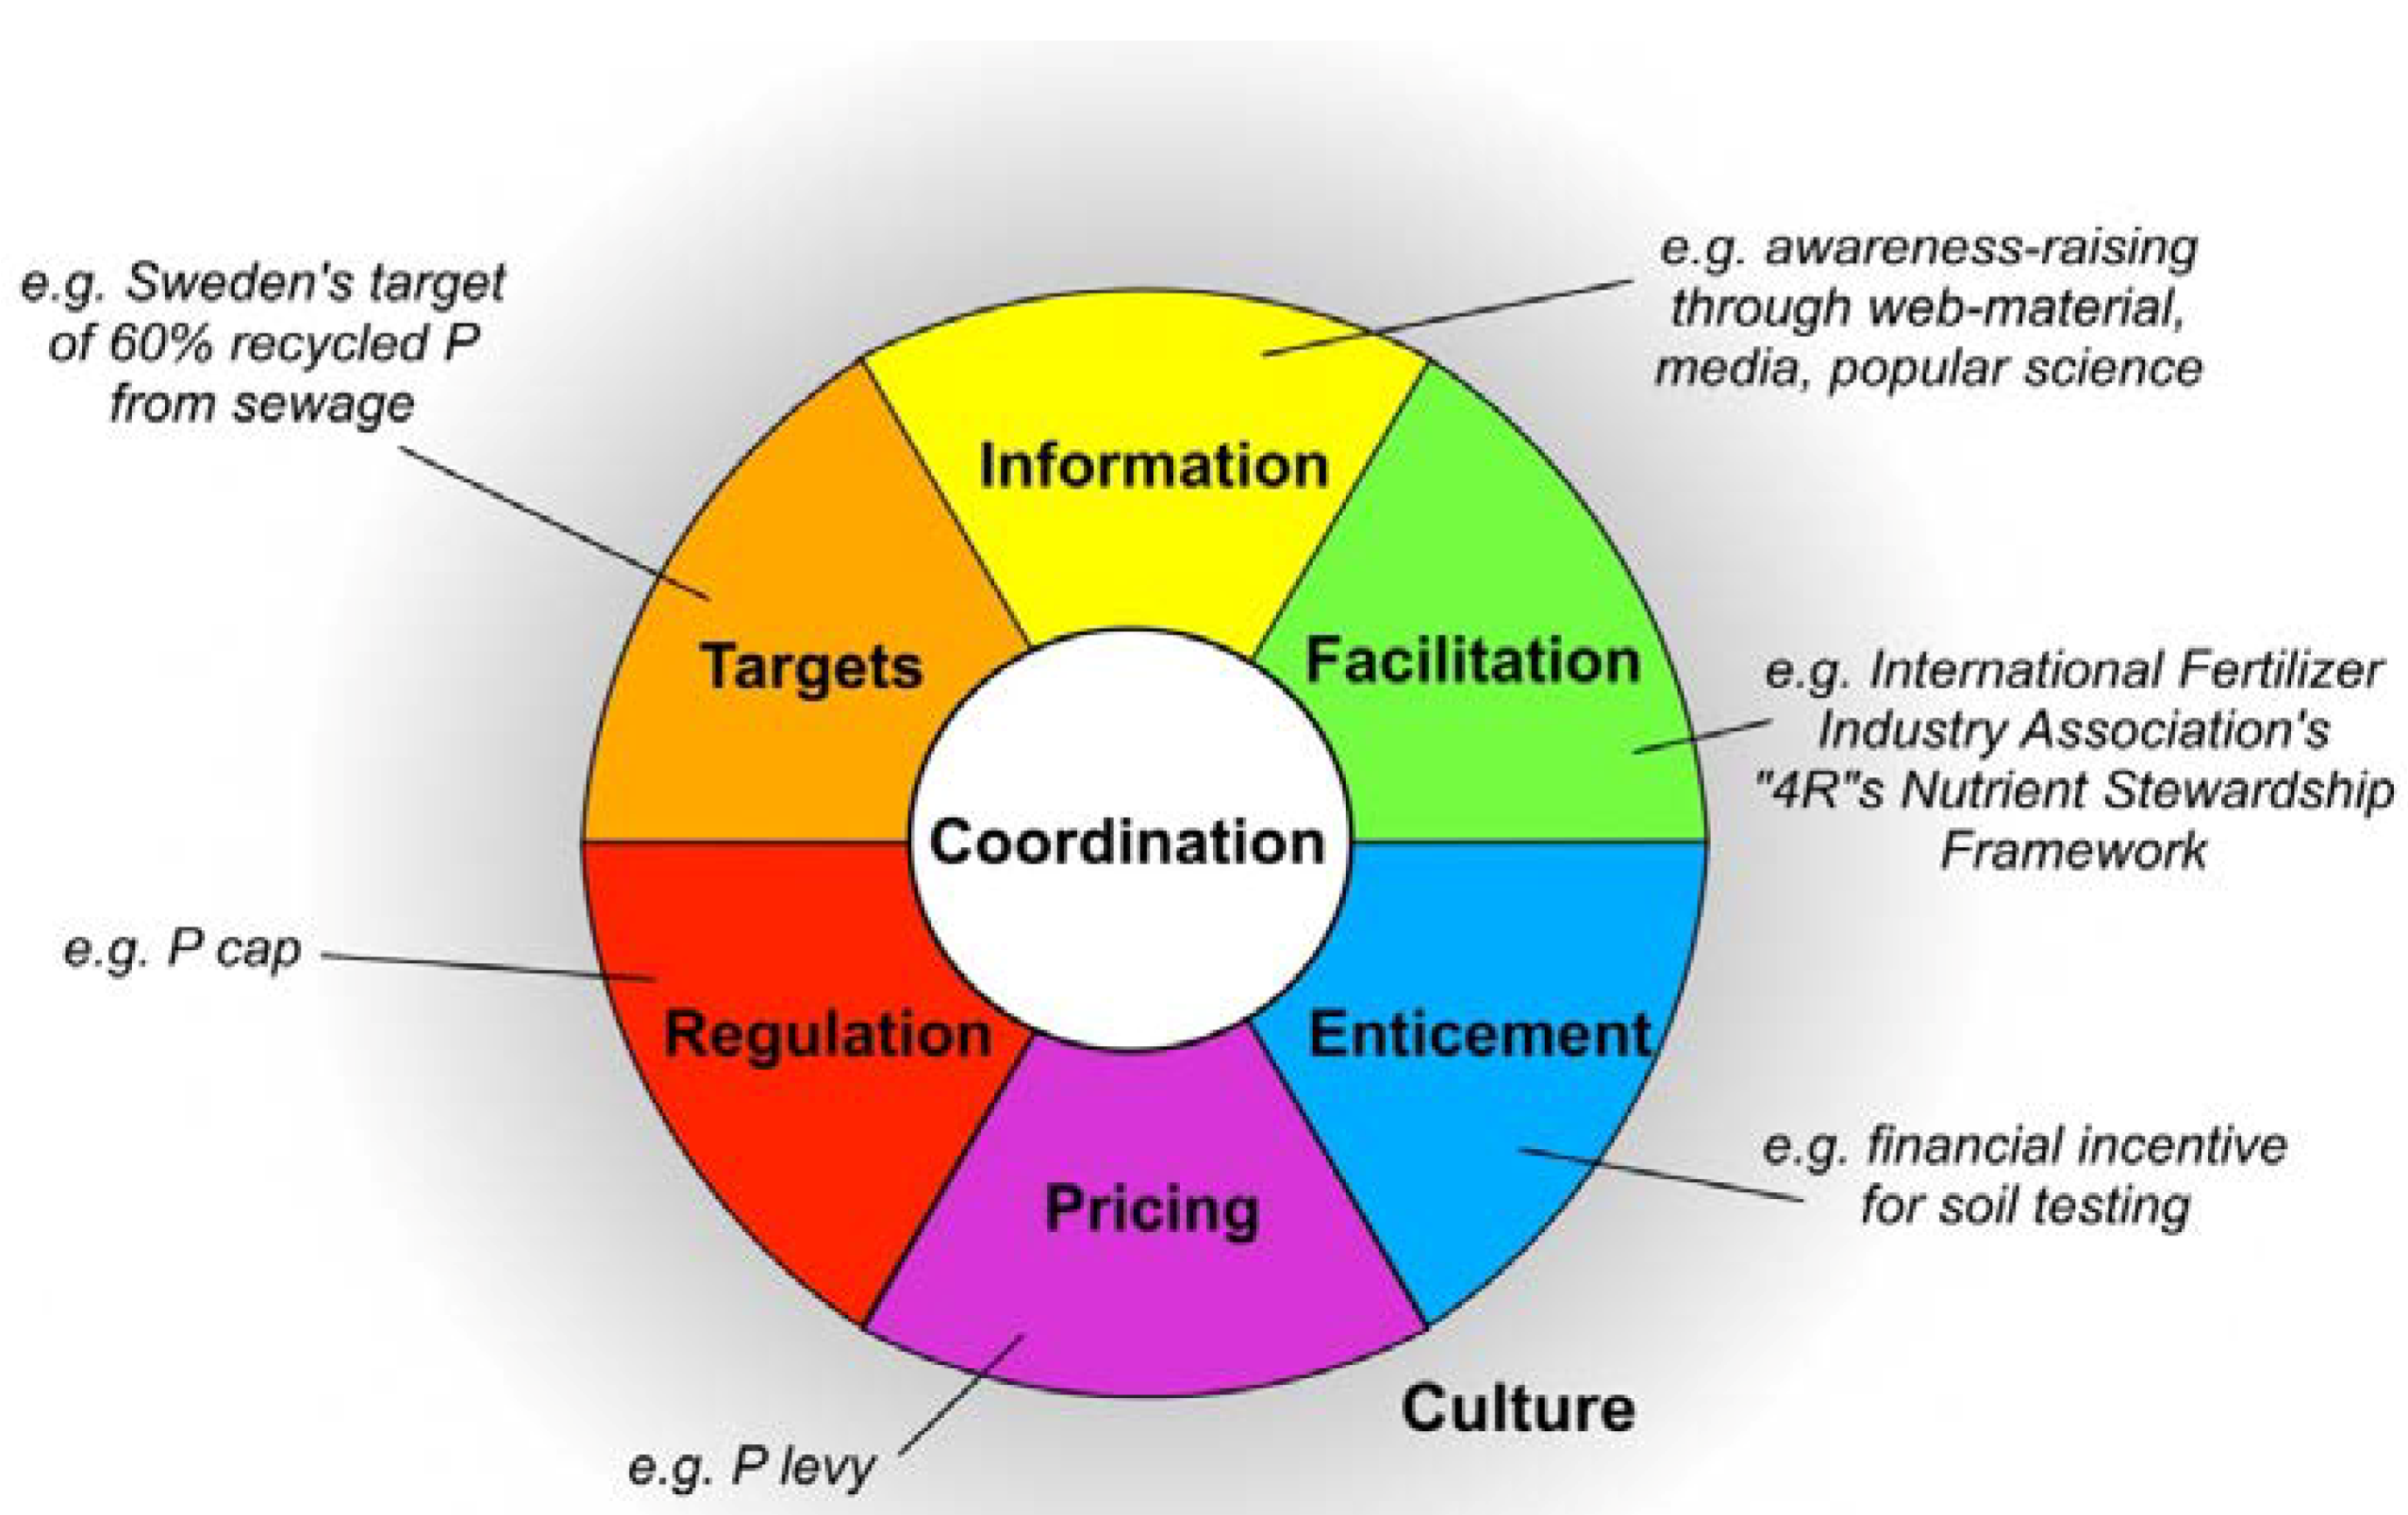
4. Developing Integrated Sustainable Phosphorus Options
- Regulatory instruments, such as targets (e.g., recovery of phosphorus from excreta or manure, etc.); limits (e.g., discharge limits on phosphorus to sensitive waterways) or bans;
- Economic instruments such as taxes (e.g., phosphorus tax) or trading schemes (e.g., phosphorus trading scheme in a catchment);
- Communicative or educational instruments such as stakeholder engagement processes and outreach (e.g., workshops, seminars); developing stakeholder-specific resource material.
- Identify objectives and drivers, by seeking agreement amongst the key stakeholder regarding the key drivers and objectives, as these will influence the most suitable measures (e.g., pollution prevention, desire for renewable phosphorus fertilizers, farmer productivity) [24].
- Identify a baseline, or Business-as-Usual demand trajectory, sometimes called a reference case, which can explicitly show targets, and from which the impact of options can be compared [21].
- Identify and categorise the most comprehensive range of measures that could meet the objectives, and assess the P savings or yield associated with the measures.
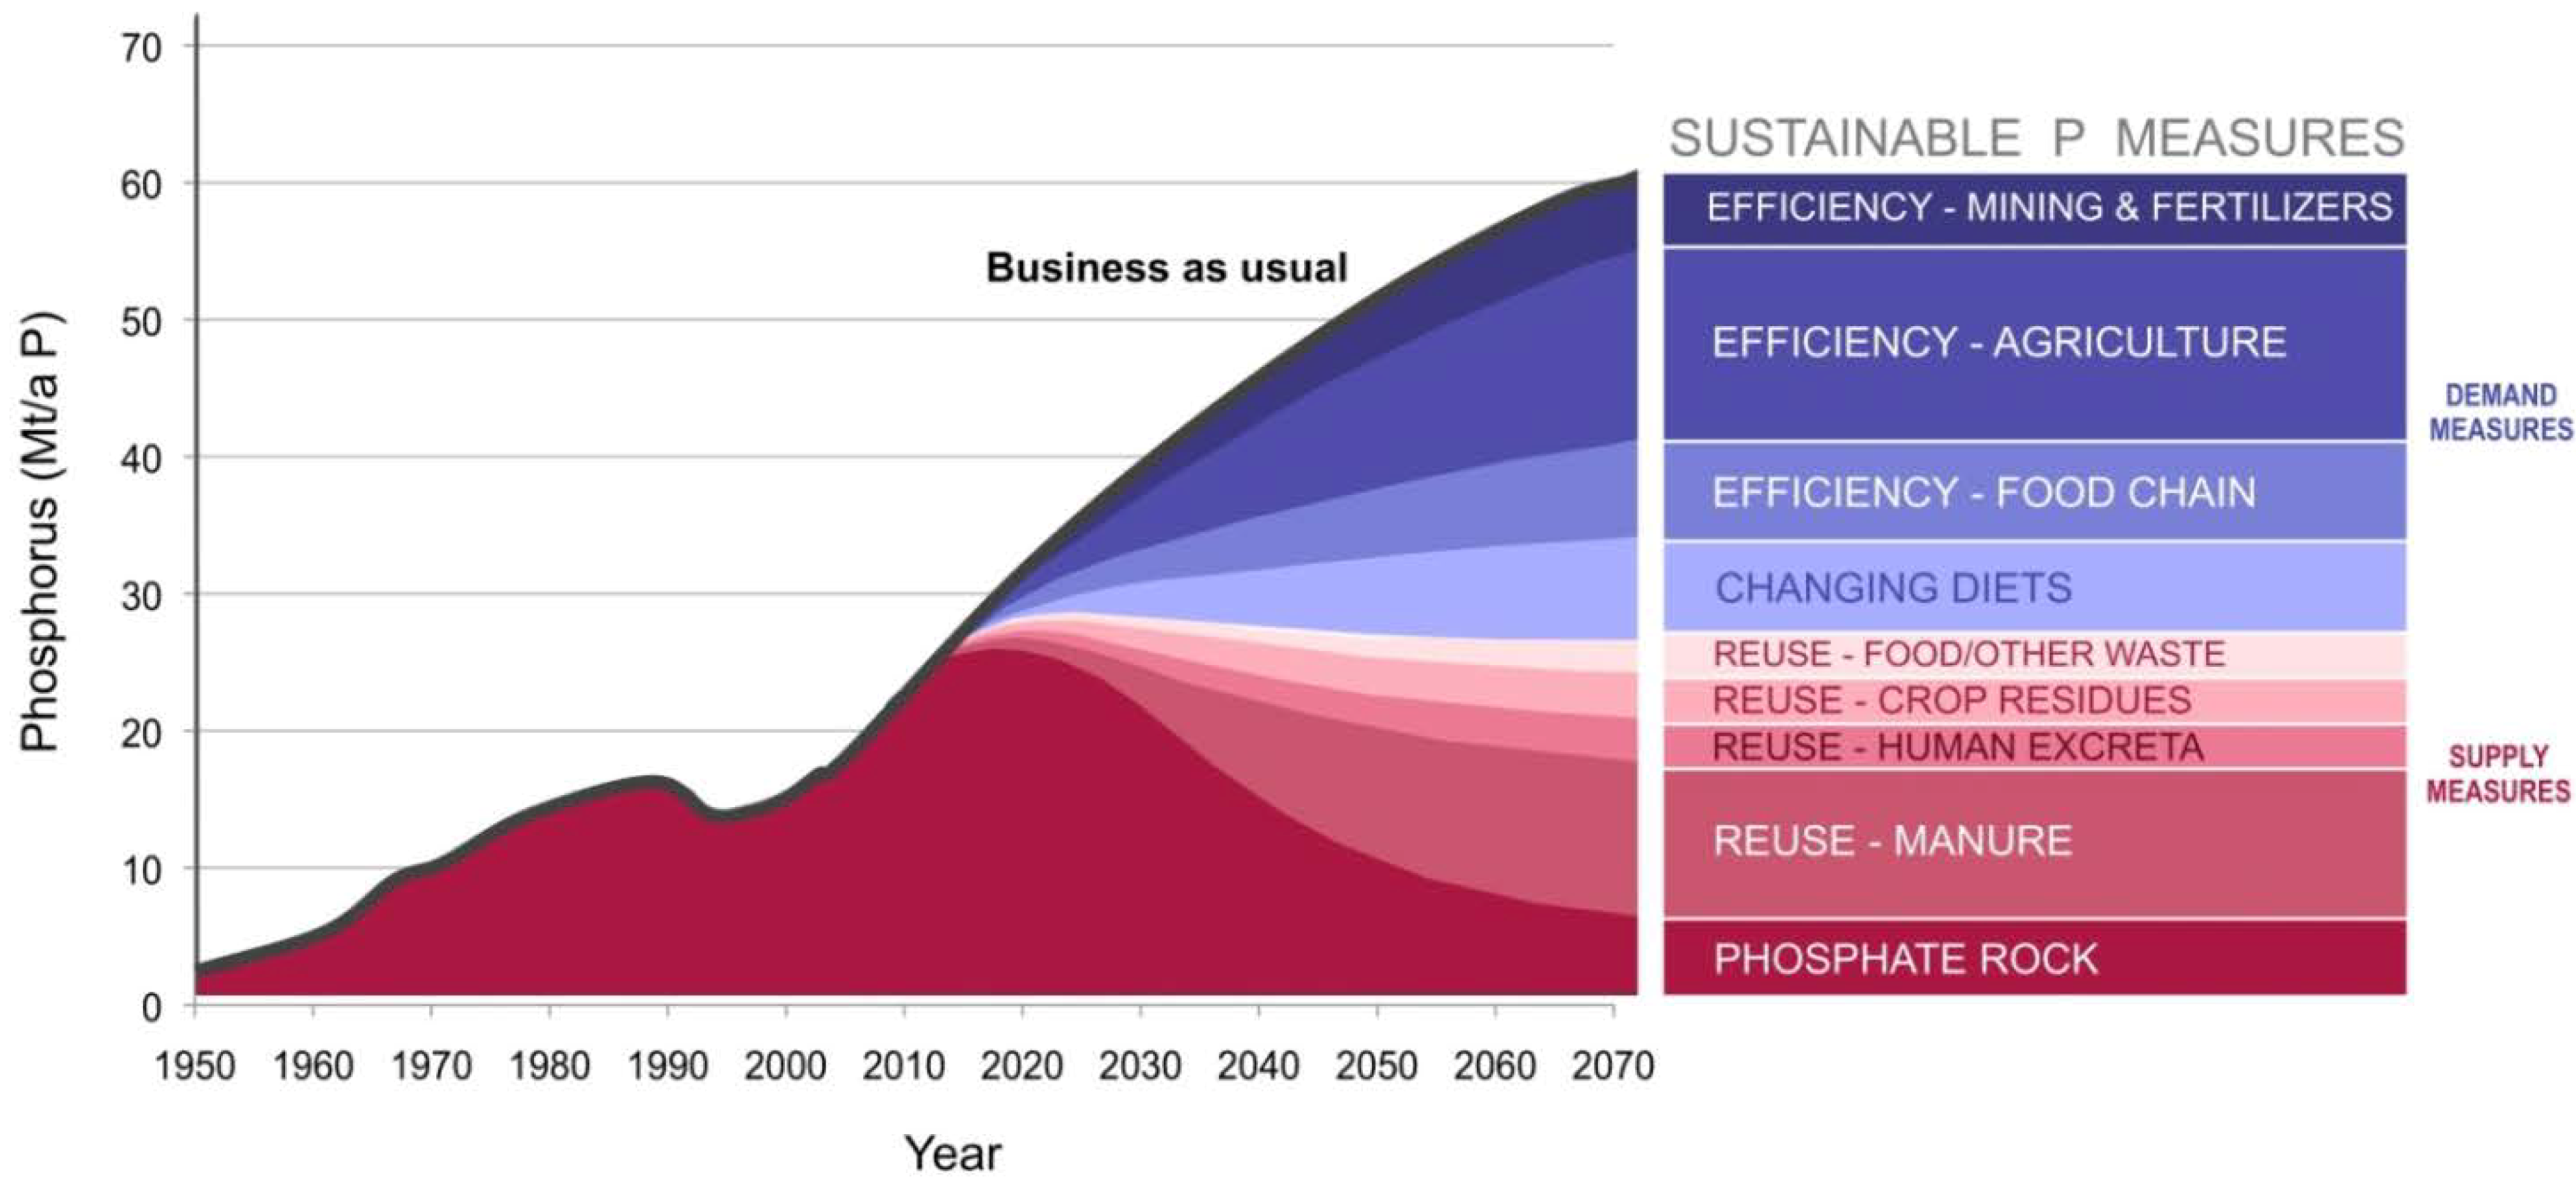
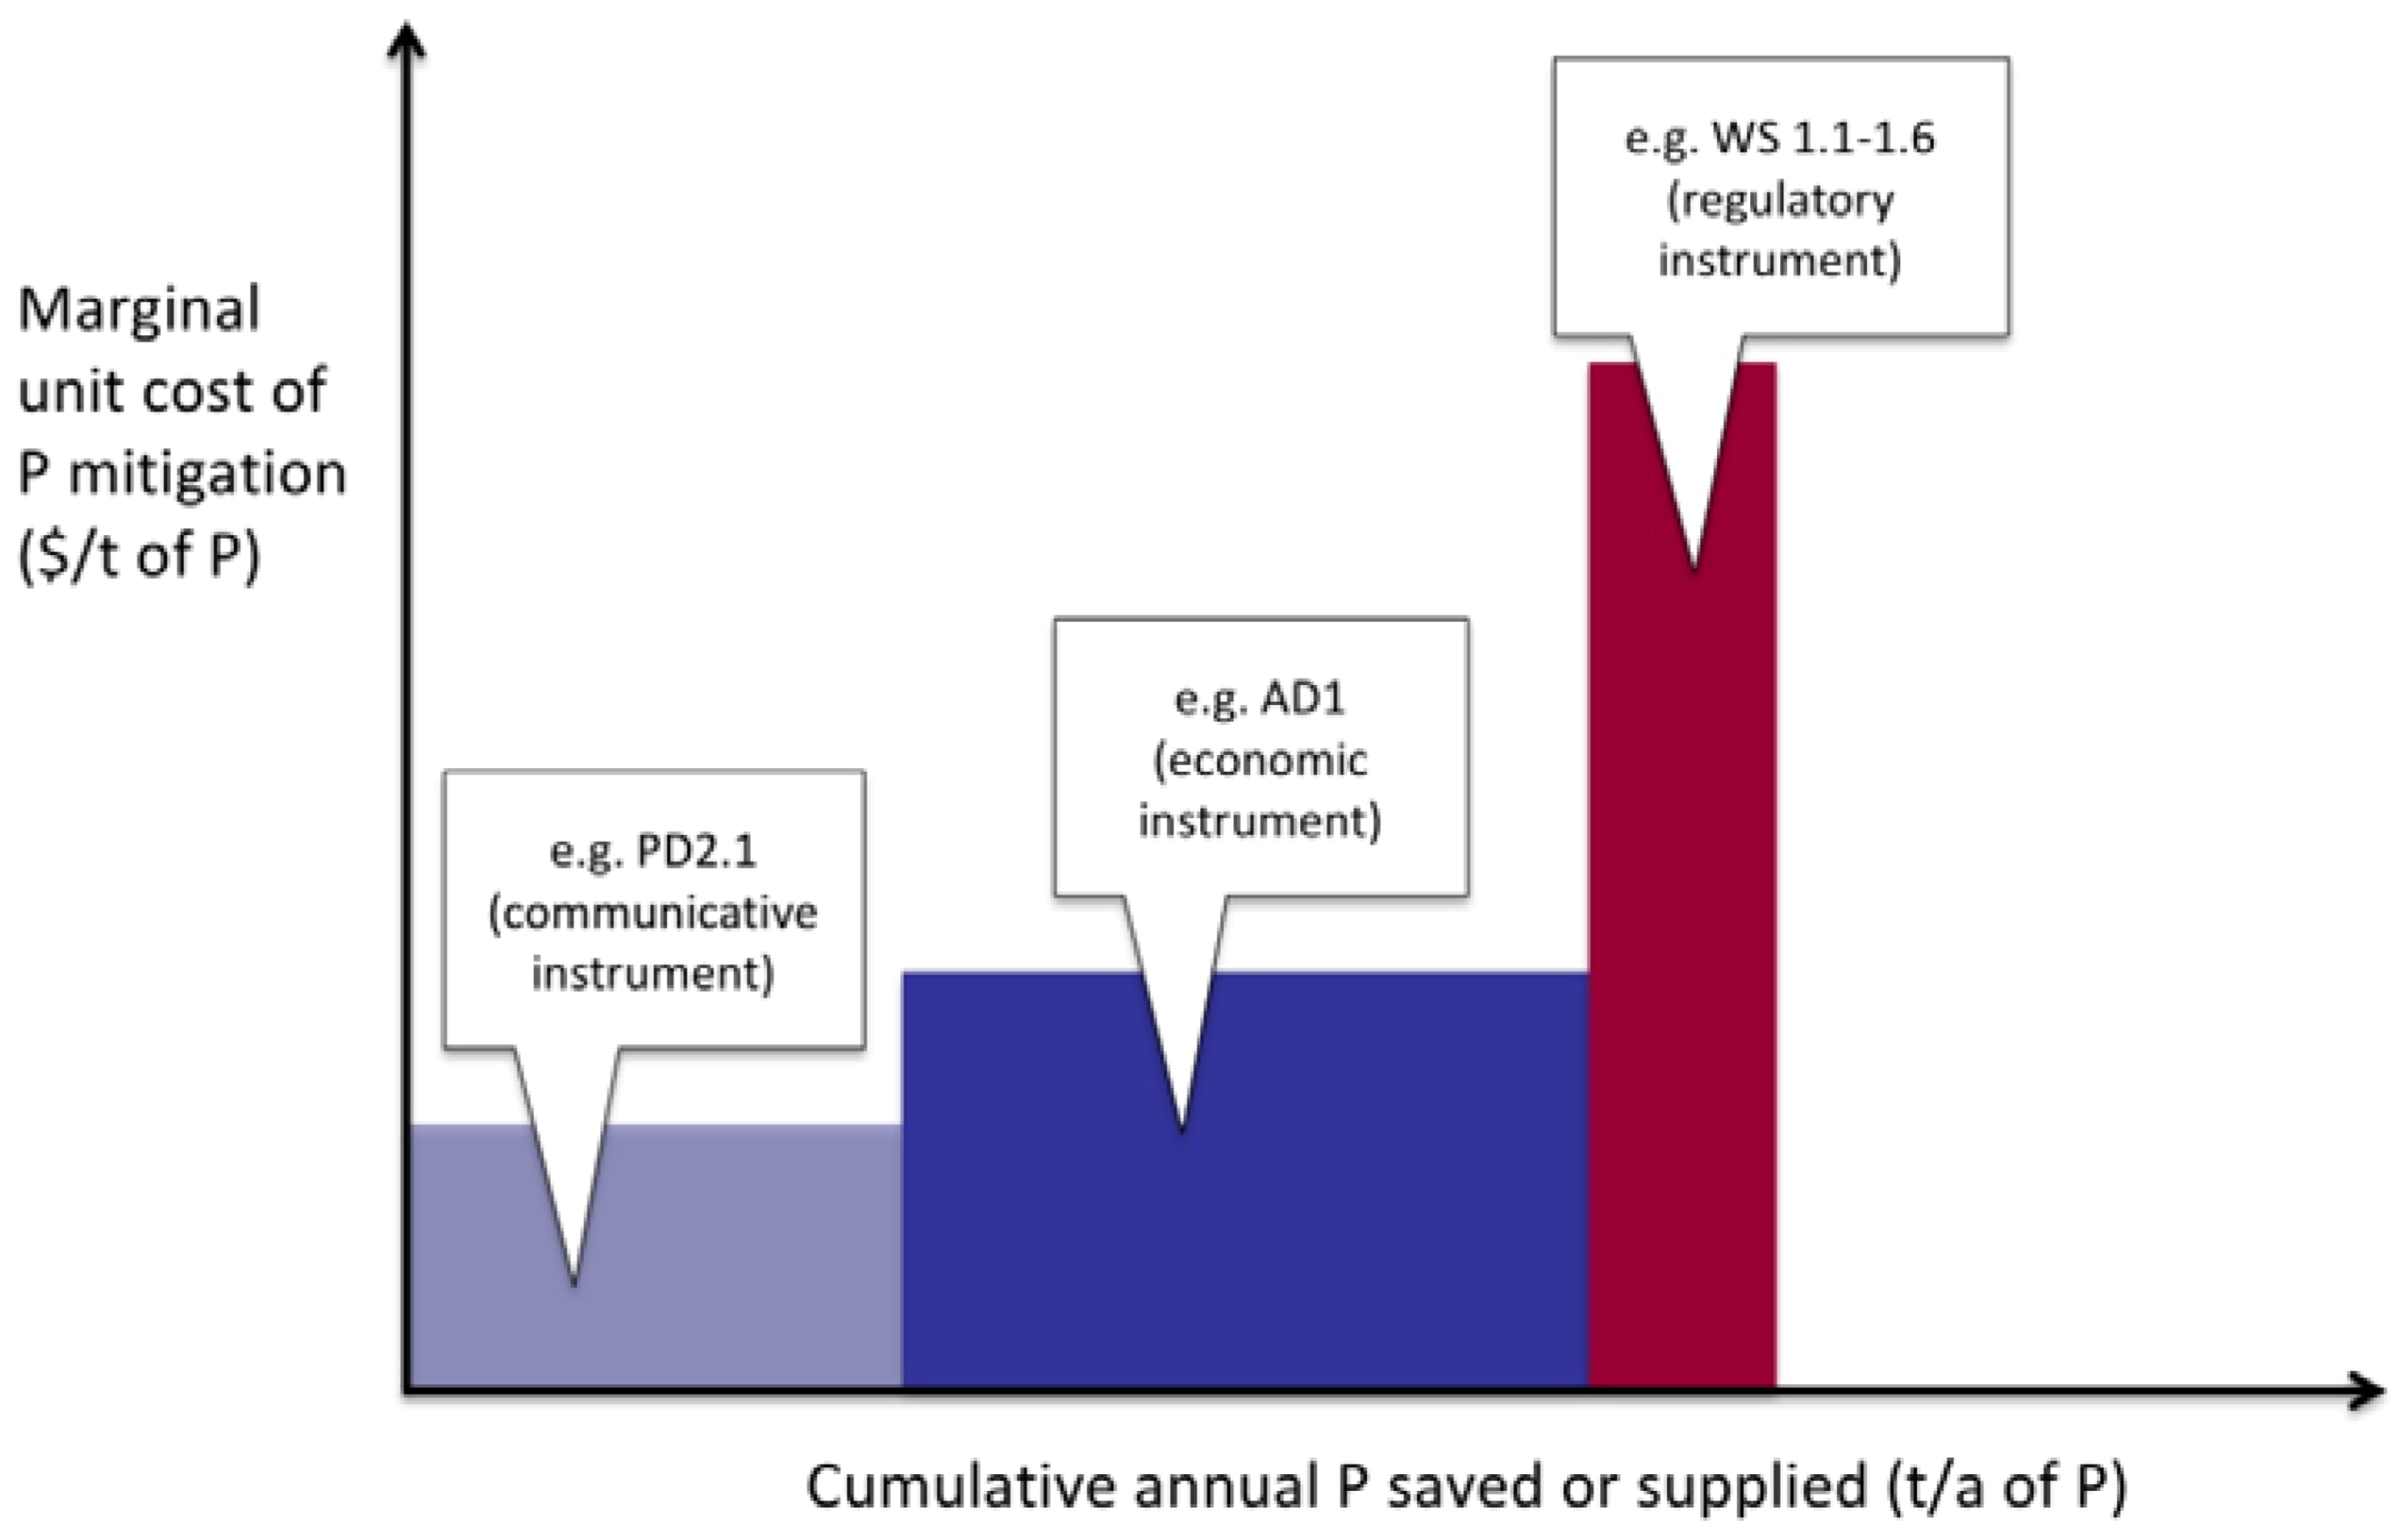
- Estimate the annual amount of phosphorus saved (e.g., in “negatonnes per annum” in the case of efficiency options) or supplied (in the case of recycling options) for the selected options and represent these graphically in a “supply curve” (such as Figure 9).
- Based on the cost-effectiveness of options, construct a realistic and achievable portfolio of options for implementation, based on the complementarity of different options, and taking into account other parameters beyond unit cost, such as risk, environmental impact or benefit, or even spread across sectors.
- initiating dialogue and consensus building between stakeholders;
- Facilitating or initiating a coordinated response to phosphorus scarcity, including independent research;
- Identifying key national policy priorities;
- Embedding knowledge of phosphorus sustainability issues into relevant educational curriculum, including practical aspects such as school garden that may be fertilized from organic waste produced from urine-diverting toilets and/or food and landscape waste compost.
5. Conclusions
References
- Johnston, A.E. Soil and Plant Phosphate; International Fertilizer Industry Association (IFA): Paris, France, 2000. [Google Scholar]
- IFPRI, Green Revolution: Curse or Blessing? International Food Policy Research Institute: Washington, DC, USA, 2002.
- Cordell, D.; Drangert, J.-O.; White, S. The story of phosphorus: Global food security and food for thought. Glob. Environ. Chang. 2009, 19, 292–305. [Google Scholar] [CrossRef]
- Cordell, D.; White, S.; Lindström, T. Peak phosphorus: The crunch time for humanity? Sustain. Rev. 2011, 2, 1. [Google Scholar]
- Smit, A.L.; Bindraban, P.S.; Schröder, J.J.; Conijn, J.G.; van der Meer, H.G. Phosphorus in Agriculture: Global Resources, Trends and Developments; Technical Report to the Steering Committee Technology Assessment of the Ministry of Agriculture, Nature and Food Quality: Wageningen, The Netherlands, 2009. [Google Scholar]
- Cordell, D.; White, S. Peak phosphorus: Clarifying the key issues of a vigorous debate about long-term phosphorus security. Sustainability 2011, 3, 2027–2049. [Google Scholar] [CrossRef]
- Van Vuuren, D.P.; Bouwman, A.F.; Beusen, A.H.W. Phosphorus demand for the 1970-2100 period: A scenario analysis of resource depletion. Glob. Environ. Chang. 2010, 20, 428–439. [Google Scholar] [CrossRef]
- Van Kauwenbergh, S. World Phosphate Reserves and Resources; International Fertilizer Development Centre (IFDC): Washington, DC, USA, 2010. [Google Scholar]
- Bekunda, M.; Cordell, D.; Corman, J.; Rosemarin, A.; Salcedo, I.; Syers, K.; Lougheed, T. Phosphorus & Food Production, UNEP Yearbook: Emerging Issues in Our Global Environment,2011; United Nations Environment Programme (UNEP): Paris, France, 2011. Available online: http://www.unep.org/yearbook/2011 (accessed on 21 January 2013).
- World Bank. Commodity Price Data (Pink Sheet), Prospects for the Global Economy; World Bank: Washington, DC, USA, 2009. Available online: http://go.worldbank.org/5AT3JHWYU0 (accessed on 21 January 2013).
- Cordell, D. The Story of Phosphorus: Sustainability Implications of Global Phosphorus Scarcity for Food Security. Ph.D. Thesis, Linköping University, Linköping, Sweden, 2010. [Google Scholar]
- Kochian, L.V. Rooting for more phosphorus. Nature 2012, 488, 466–467. [Google Scholar] [CrossRef]
- Jasinski, S.M. Phosphate Rock, Mineral Commodity Summaries; US Geological Survey: Reston, VA, USA, 2012. [Google Scholar]
- Gilbert, N. The disappearing nutrient. Nature 2009, 461, 716–718. [Google Scholar]
- Childers, D.L.; Corman, J.; Edwards, M.; Elser, J.J. Sustainability challenges of phosphorus and food: Solutions from closing the human phosphorus cycle. BioScience 2011, 61, 117–124. [Google Scholar] [CrossRef]
- Smil, V. Phosphorus: Global Transfers. In Encyclopedia of Global Environmental Change 3 “Causes and Consequences of Global Environmental Change”; Douglas, I., Ed.; John Wiley & Sons Ltd: London, UK, 2002; pp. 536–542. [Google Scholar]
- Schröder, J.J.; Cordell, D.; Smit, A.L.; Rosemarin, A. Sustainable Use of Phosphorus; Technical Report Report 357 for Plant Research International; Wageningen University and Research Centre: Wageningen, The Netherlands, 2010. [Google Scholar]
- Syers, K.; Johnston, A.E.; Curtin, D. Efficiency of Soil and Fertilizer Phosphorus Use: Reconciling Changing Concepts of Soils Phosphorus Behaviour with Agronomic Information; FAO Fertilizer and Plant Nutrition Bulletin 18: Food and Agriculture Organization of the United Nations: Rome, Italy, 2008. [Google Scholar]
- Von Weizsacker, E.U. Factor Four: Doubling Wealth, Halving Resource Use—A Report to the Club of Rome; Earthscan: London, UK, 1998. [Google Scholar]
- Dunstan, C.; Jane, D.; Langham, E.; Boronyak, L.; Rutovitz, J. Institutional Barriers to Intelligent Grid; Working Paper 4.1 for Institute for Sustainable Futures; University of Technology Sydney: Sydney, Australia, 2011. Available online: http://igrid.net.au/resources/index.html#project4 (accessed on 21 January 2013).
- Cordell, D.; Neset, T.-S.S.; White, S.; Drangert, J.-O. Preferred future phosphorus scenarios: A framework for meeting long-term phosphorus needs for global food demand. In. In Proceedings of International Conference on Nutrient Recovery from Wastewater Streams Vancouver, Vancouver, Canada, 10–13 May 2009; Mavinic, D., Ashley, K., Koch, F., Eds.; IWA Publishing: London, UK, 2009. [Google Scholar]
- Cordell, D.; Jackson, M.; White, S. Phosphorus flows through the australian food system: Identifying intervention points as a roadmap to phosphorus security. Environ. Sci. Policy 2013, in press. [Google Scholar]
- Edwards, M. Green Algae Strategy: End Oil Imports and Engineer Sustainable Food and Fuel; Green Independence: Tempe, AZ, USA, 2008. [Google Scholar]
- Cordell, D.; Rosemarin, A.; Schröder, J.J.; Smit, A.L. Towards global phosphorus security: A systems framework for phosphorus recovery and reuse options. Chemosphere 2011, 84, 747–758. [Google Scholar] [CrossRef]
- WHO/FAO, Diet, Nutrition and the Prevention of Chronic Diseases: Report of a Joint WHO/FAO Expert Consultation; Technical Report Series 916 for WHO: Geneva, Switzerland, 2002.
- Prud’Homme, M. World phosphate rock flows, losses and uses. In Proceedings of Phosphates 2010 International Conference, Brussels, Begium, 22–24 March 2010; International Fertiliser Industry Association: Brussels, Belgium, 2010. [Google Scholar]
- Pellerin, S. Designing Phosphorus Cycle at Country Scale. Presented at European Scientific workshop, Bordeaux, France, 5-6 July; 2011. Available online: http://www.bordeaux-aquitaine.inra.fr/tcem_eng/seminaires_et_colloques/colloques/designing_phosphorus_cycle_at_country_scale (accessed on Day Month Year).
- Neset, T.-S.S.; Cordell, D. Global phosphorus scarcity: Identifying synergies for a sustainable future. Sci. Food Agric. 2012, 92, 2–6. [Google Scholar] [CrossRef]
- UNEP, Environmental Aspects of Phosphate and Potash Mining; United Nations Environment Programme (UNEP) and International Fertilizer Industry Association (IFA): Paris, France, 2001.
- Cordell, D.; Neset, T.-S.S.; Prior, T. The phosphorus mass balance: Identifying “hotspots” in the food system as a roadmap to phosphorus security. Curr. Opin. Biotechnol. 2012, 23, 839–845. [Google Scholar] [CrossRef]
- Jasinski, S.M. Phosphate Rock, Mineral Commodity Summaries; US Geological Survey: Reston, VA, USA, 2009. Available online: http://minerals.usgs.gov/minerals/pubs/commodity/phosphate_rock/mcs-2009-phosp.pdf (accessed on 21 January 2013).
- Jung, A. Phosphates Fertilizer Outlook, British Sulphur Consultants. In Proceedings of Phosphates 2010 International Conference, Brussels, Belgium, 22–24 March 2010.
- Drummond, A. Minemakers: Targeting Phosphate Production from Two Continents. In Proceedings of Phosphates 2010 International Conference, Brussels, Belgium, 22–24 March 2010.
- Corell, H. Letter Dated 29 January 2002 from the Under-Secretary-General for Legal Affairs, the Legal Counsel, Addressed to the President of the Security Council. Personal communication, 12 February 2002. [Google Scholar]
- Smith, J.J.P. The plundering of the Sahara: Corporate Criminal and Civil Liability for the Taking of Natural Resources from Western Sahara. 2011. Available online: http://www.arso.org/PlunderingoftheaharaSmith.pdf (accessed on 21 January 2013).
- Hagen, E. The Role of Natural Resources in the Western Sahara Conflict, and the Interests Involved. In Proceedings of International Conference on Multilateralism and International Law, with Western Sahara as a Case Study, Pretoria, South Africa, 4–5 December 2008.
- Wissa, A.E.Z. Phosphogypsum Disposal and the Environment; Ardaman & Associates, Inc.: Orlando, FL, USA, 2003. Available online: http://www.fipr.state.fl.us/pondwatercd/phosphogypsum_disposal.htm (accessed on 21 January 2013).
- IPGWG, Guide Principles for Safe, Sustainable Uses of Phosphogypsum; International Phosphogypsum Working Group (IPGWG): Marrakech, Morocco, 2010.
- EU Parliament Resolution on a Resource-Efficient Europe. EU Web site. 2012. Available online: http://www.europarl.europa.eu/plenary/en/texts-adopted.html (accessed on 21 January 2013).
- IFA, Fertilizer Best Management Practices: General Principles, Strategy for Their Adpotion and Voluntary Initatives vs. Regulations; International Fertilizer Industry Association: Paris, France, 2007.
- FIFA, Fertcare Handbook; Fertilizer Industry Federation of Australia, Canberra, Canada, 2006.
- Smaling, E.; Toure, M.; Ridder, N.D.; Sanginga, N.; Breman, H. Fertilizer Use and the Environment in Africa: Friends or Foes? In Proceedings of the African Fertilizer Summit, Abuja, Nigeria, 9–13 June 2006.
- Marion Dumas, E.F.; Scholz, R.W. Modeling biogeochemical processes of phosphorus for global food supply. Chemosphere 2011, 84, 798–805. [Google Scholar]
- Schröder, J.J.; Smit, A.L.; Cordell, D.; Rosemarin, A. Improved phosphorus use efficiency in agriculture: A key requirement for its sustainable use. Chemosphere 2011, 84, 822–831. [Google Scholar] [CrossRef]
- Smaling, E.M.A.; Nandwa, S.M.; Janssen, B.H. Soil fertility in africa is at stake. In Replenishing Soil Fertility in Africa; Buresh, R.J., Sanchez, P.A., Calhoun, F., Eds.; Soil Science Society of America (SSSA) and American Society of Agronomy: Madison, WI, USA, 1997. [Google Scholar]
- IFA Data. International Fertilizer Industry Association Web site. 2009. Available online: http://www.fertilizer.org/ifa/ifadata/search (accessed on 21 January 2013).
- FAO, Plant Nutrition for Food Security: A Guide for Integrated Nutrient Management; FAO Fertilizer and Plant Nutrition Bulletin 16 for Food and Agriculture Organization of the United Nations: Rome, Italy, 2006.
- FAO, Soaring Food Prices: Facts, Perspectives, Impacts and Actions Required. In Proceedings of High-level Conference on World Food Security: The Challenges of Climate Change and Bioenergy; Rome, Italy: 3-5 June 2008.
- IFA, The Global “4R” Nutrient Stewardship Framework—Developing Fertilizer Best Management Practices for Delivering Economic, Social and Environmental Benefits; Technical Report by the IFA Task Force on Fertilizer Best Management Practices, International Fertilizer Industry Association: Paris, France, 2009.
- FAO. Organic Agriculture and Food Availability. In Proceedings of International Conference on Organic Agriculture and Food Security, Rome, Italy, 3–5 May 2007; Food and Agriculture Organisation of the United Nations: Rome, Italy, 2007.
- Holmgren, D. Permaculture: Principles and Pathways beyond Sustainability; Holmgren Design Services: Hepburn, Australia, 2003. [Google Scholar]
- García-Torres, L.; Benites, J.; Martinez-Vilela, A.; Holgado-Cabrera, A. Conservation Agriculture: Environment, Farmers Experiences, Innovations, Socio-Economy, Policy; Springer: Brussels, Belgium, 2003. [Google Scholar]
- Jönsson, H.; Stintzing, A.R.; Vinnerås, B.; Salomon, E. Guidelines on the Use of Urine and Faeces in Crop Production; Stockholm Environment Institute: Stockholm, Sweden, 2004. [Google Scholar]
- Precision Agriculture. Variable Rate Applications. Precision Agriculture Web site. 2012. Available online: http://www.precisionagriculture.com.au/variable-rate-applications.php (accessed on 21 January 2013).
- Richardson, A.E.; Hocking, P.J.; Simpson, R.J.; George, T.S. Plant mechanisms to optimise access to soil phosphorus. Crop Pasture Sci. 2009, 60, 124–143. [Google Scholar] [CrossRef]
- Gamuyao, R.; Chin, J.H.; Pariasca-Tanaka, J.; Pesaresi, P.; Catausan, S.; Dalid, C.; Slamet-Loedin, I.; Tecson-Mendoza, E.M.; Wissuwa, M.; Heuer, S. The protein kinase Pstol1 from traditional riceconfers tolerance of phosphorus deficiency. Nature 2012, 488, 535–541. [Google Scholar]
- Cornish, P. Research directions: Improving plant uptake of soil phosphorus, and reducing dependency on input of phosphorus fertiliser. Crop Pasture Sci. 2009, 60, 190–196. [Google Scholar] [CrossRef]
- Simpson, R.; Oberson, A.; Culvenor, R.A.; Ryan, M.; Veneklaas, E.; Lambers, H.; Lynch, J.; Ryan, P.; Delhaize, E.; Smith, A.; et al. Strategies and agronomic interventions to improve the phosphorus-use efficiency of farming systems. Plant Soil 2011, 349, 89–120. [Google Scholar] [CrossRef]
- Weaver, D.M.; Wong, M.T.F. Scope to improve phosphorus (P) management and balance efficiency of crop and pasture soils with contrasting p status and buffering indices. Plant Soil 2011, 349, 37–54. [Google Scholar] [CrossRef]
- McLaughlin, M.J.; McBeath, T.M.; Smernik, R.; Stacey, S.P.; Ajiboye, B.; Guppy, C. The chemical nature of P-accumulation in agricultural soils—Implications for fertiliser management and design: An Australian perspective. Plant Soil 2011, 349, 69–87. [Google Scholar]
- McIvor, J.G.; Guppy, C.; Probert, M.E. Phosphorus requirements of tropical grazing systems: The Northern Australian experience. Plant Soil 2011, 349, 55–67. [Google Scholar] [CrossRef]
- Smaling, E.M.A.; Fresco, L.O.; de Jager, A. Classifying, monitoring and improving soil nutrient stocks and flows in african agriculture. AMBIO 1996, 25, 492–496. [Google Scholar]
- Nierenberg, D. Happier Meals: Rethinking the Global Meat Industry; Technical Report No. 171 for Worldwatch Institute: Washington, DC, USA, 2005. [Google Scholar]
- FAO, Livestock’s Long Shadow: Environmental Issues and Options; UN Food & Agricultural Organisation: Rome, Italy, 2006.
- Afinah, S.; Yazid, A.M.; Anis Shobririn, M.H.; Shuhaimi, M. Phytase: Application in food industry: Review article. Int. Food Res. J. 2010, 17, 13–21. [Google Scholar]
- Forsberg, C.W.; Phillips, J.P.; Golovan, S.P.; Fan, M.Z.; Meidinger, R.G.; Ajakaiye, A.; Hilborn, D.; Hacker, R.R. The enviropig physiology, performance, and contribution to nutrient management advances in a regulated environment: The leading edge of change in the pork industry. J. Anim. Sci. 2003, 8, 68–77. [Google Scholar]
- Critical Knowledge Collective, Enviropig Questions Enviropig: Helpful or Harmful? Critical Knowledge Collective: Guelph, Canada, 2010.
- Fealy, R.; Schröder, J.J. Assesssment of Manure Transport Distances and Their Impact on Economic and Energy Cost; International Fertiliser Society: York, UK, 2008. [Google Scholar]
- RegenAg & MasHummus. How to Make Soluble Phosphorus. RegenAg Web site. 2012. Available online: http://regenag.com/web/ (accessed on 21 January 2013).
- Lundqvist, J.; de Fraiture, C.; Molden, D. Saving Water: From Field to Fork—Curbing Losses and Wastage in the Food Chain, SIWI Policy Brief; Stockholm International Water Institute: Stockholm, Sweden, 2008. [Google Scholar]
- Smil, V. Feeding the World: A Challenge for the 21st Century; The MIT Press: Cambridge, MA, USA, 2000. [Google Scholar]
- WRAP, The Food We Waste; Technical Report version 2 for Waste & Resources Action Programme: Banbury, UK, 2008.
- Zero Waste Australia. From Paddock to Plate, from Plate to Paddock. Senate Inquiry into the Management of Australia’s Waste Streams Web site. 2008. Available online: http://www.aph.gov.au/Parliamentary_Business/Committees/Senate_Committees?url=eca_ctte/completed_inquiries/2008-10/aust_waste_streams/submissions/sublist.htm (accessed on 21 January 2013).
- FAO, Urban and Peri-urban Agriculture; Food and Agriculture Organization of the United Nations: Rome, Italy, 1999.
- Baker, D.; Fear, J.; Denniss, R. What a Waste: An Analysis of Household Expenditure on Food; The Australia Institute: City, Australia, 2009. [Google Scholar]
- Love Food Hate Waste Web site. Available online: http://www.lovefoodhatewaste.com (accessed on 14 January 2013).
- Australia NSW Government Web site. Available online: http://www.lovefoodhatewaste.nsw.gov.au (accessed on 14 January 2013).
- Watson, E. Is Phosphorus the New Trans Fat? FNCE. 15 October 2012. Available online: http://www.foodnavigator-usa.com/Science/FNCE-hot-topic-Is-phosphorus-the-new-trans-fat (accessed on 21 January 2013).
- FAO, More People than Ever Are Victims of Hunger; Food and Agriculture Organization of the United Nations: Rome, Italy, 2009.
- WHO. Obesity and Overweight, Fact Sheet Number 311; World Health Organisation Global Strategy on Diet, Physical Activity and Health: Geneva, Switzerland, 2006. Available online: http://www.who.int/mediacentre/factsheets/fs311/en/index.html (accessed on 21 January 2013).
- De Fraiture, C. Future Water Requirements for Food—Three Scenarios, International Water Management Institute (IWMI). In Presented at SIWI Seminar: Water for Food, Bio-fuels or Ecosystems, Stockholm, Sweden, 12–18 August 2007.
- WWF. Living Planet Report; World Wide Fund For Nature: Cambridge, UK, 2004. Available online: http://assets.panda.org/downloads/lpr2004.pdf (accessed on 21 January 2013).
- Smil, V. Policy for Improved Efficiency in the Food Chain. In Presented at SIWI Seminar: Water for Food, Bio-fuels or Ecosystems, Stockholm, Sweden, 12–18 August 2007.
- Food Ethics Council, Food Distribution: An Ethical Agenda; Food Ethics Council: Brighton, UK, 2008.
- FAO, The State of Food Security in the World, Monitoring Progress towards the World Food Summit and Millennium Development Goals; Food and Agricultural Organisation: Rome, Italy, 2004.
- Narayanan, R. Food for though: Perspectives from an asian producer. In Proceedings of Phosphates 2010 International Conference, Brussels, Begium, 22–24 March 2010; Aditya Birla Chemicals: Brussels, Belgium, 2010. [Google Scholar]
- Neset, T.-S.S.; Andersson, L. Environmental Impact of Food Production and Consumption—From Phosphorus Leakage and Resource Depletion to Recycling. In Water for Food; Förare, J., Ed.; The Swedish Research Council Formas: Stockholm, Sweden, 2008; pp. 99–108. [Google Scholar]
- Tilley, E. Phosphorus and Sanitation. In Phosphorus and Global Food Security: A Synthesis; Neset, T.-S.S., Cordell, D., Eds.; Global Phosphorus Research Initiative, Linköping University: Linköping, Sweden, 2010. [Google Scholar]
- FAO Food for the Cities Homepage. Available online: http://www.fao.org/fcit/index.asp (accessed on 12 October 2012).
- Tangsubkul, N.; Moore, S.; Waite, T.D. Incorporating phosphorus management considerations into wastewater management practice. Environ. Sci. Policy 2005, 8, 1–15. [Google Scholar] [CrossRef]
- Jönsson, H. Urine Separation—Swedish Experiences; SLU, Swedish University of Agricultural Sciences: Uppsala, Sweden, 2001. [Google Scholar]
- Kvarnström, E.; Emilsson, K.; Stintzing, A.R.; Johansson, M.; Jönsson, H.; af Petersens, E.; Schönning, C.; Christensen, J.; Hellström, D.; Qvarnström, L.; et al. Urine Diversion: One Step towards Sustainable Sanitation; Stockholm Environment Institute: Stockholm, Sweden, 2006. [Google Scholar]
- Ashley, K.; Cordell, D.; Mavinic, D. A brief history of phosphorus: From the philosophers stone to nutrient recovery and re-use. Chemosphere 2011, 84, 737–746. [Google Scholar] [CrossRef]
- Esrey, S.; Andersson, I.; Hillers, A.; Sawyer, R. Closing the Loop: Ecological Sanitation for Food Security; UNDP & SIDA: Mexico City, Mexico, 2001. [Google Scholar]
- Richert, A.; Gensch, R.; Jönsson, H.; Stenström, T.-A.; Dagerskog, L. Practical Guidance on the Use of Urine in Crop Production; Stockholm Environment Institute: Stockholm, Sweden, 2010. [Google Scholar]
- Drangert, J.-O. Fighting the urine blindness to provide more sanitation options. Water SA 1998, 24, 157–164. [Google Scholar]
- Gumbo, B.; Savenije, H.H.G. Inventory of Phosphorus Fluxes and Storage in an Urban-Shed: Options for Local Nutrient Recycling; Internet Dialogue on Ecological Sanitation: Delft, The Netherlands, 2001. [Google Scholar]
- Dagerskog, L.; Bonzi, M. Opening minds and closing loops—Productive sanitation initiatives in Burkina Faso and Niger. Sustain. Sanit. Pract. 2010, 3, 4–11. [Google Scholar]
- Willetts, J.R.; Carrard, N.R.; Retamal, M.L.; Nam, N.D.G.; Paddon, M.; Thuy, D.X.; Trung, N.H.; Mitchell, C.A. Cost Effectiveness and Sustainability of Sanitation Options: A Case Study of South Can Tho; Technical Report; Institute for Sustainable Futures, UTS: Sydney, Australia, 2010; pp. 1–49. [Google Scholar]
- Münch, E.; Schöpe, A.; Rüd, S. Ecosan—Recycling Oriented Wastewater Management and Sanitation Systems; GTZ: Eschborn, Germany, 2009. [Google Scholar]
- Johansson, M.; Kvarnström, E. A review of Sanitation Regulatory Frameworks; Stockholm Enviornment Institute (SEI): Stockholm, Sweden, 2005. [Google Scholar]
- Tilley, E.; Lüthi, C.; Morel, A.; Zurbrügg, C.; Schertenleib, R. Compendium of Sanitation Systems and Technologies; Eawag/Sandec: Zurich, Switzerland, 2008. [Google Scholar]
- Kirchmann, H.; Pettersson, S. Human urine—Chemical composition and fertilizer use efficiency. Fertil. Res. 1995, 40, 149–154. [Google Scholar] [CrossRef]
- Raschid-Sally, L.; Jayakody, P. Drivers and Characteristics of Wastewater Agriculture in Developing Countries—Results from a Global Assessment; International Water Management Institute: Battaramulla, Sri Lanka, 2008. [Google Scholar]
- World Bank, Water Resources and Environment Technical Note F.3 Wastewater Reuse Series; Davis, R.; Rafik Hirji, R. (Eds.) World Bank: Washington, DC, USA, 2005.
- WHO, Guidelines for the Safe Use of Wastewater, Excreta and Greywater Volume 4: Excreta and Greywater Use in Agriculture; World Health Organisation: Geneva, Switzerland, 2006.
- European Commission, Disposal and Recycling Routes for Sewage Sludge Part 3—Scientific and Technical Report; European Commission: Luxembourg City, Luxembourg, 2001.
- Schipper, W.J.; Korving, L. Full-scale Plant Test Using Sewage Sludge Ash as Raw Material for Phosphorus Production. In Proceedings of International Conference on Nutrient Recovery from Wastewater Streams, Vancouver, Canada, 10–13 May 2009; Ashley, K., Mavinic, D., Koch, F., Eds.; IWA Publishing: London, UK, 2009. [Google Scholar]
- SCOPE. Struvite: Its Role in Phosphorus Recovery and Recycling. In Proceedings of International Conference, Bedford, UK, 17–18 June 2004; Cranfield University: Bedford, UK, 2004.
- Britton, A.; Prasad, R.; Balzer, B.; Cubbage, L. Pilot Testing and Economic Evaluation of Struvite Recovery from Dewatering Centrate at HRSD’s Nansemond WWTP. In Proceedings of International Conference on Nutrient Recovery from Wastewater Streams, Vancouver, Canada, 10–13 May 2009; Ashley, K., Mavinic, D., Koch, F., Eds.; IWA Publishing: London, UK, 2009. [Google Scholar]
- Mavinic, D.; Ashley, K.; Koch, F. Proceedings of the International Conference on Nutrient Recovery from Wastewater Streams Vancouver 2009; IWA Publishing: London, UK, 2009.
- Shua, L.; Schneidera, P.; Jegatheesana, V.; Johnsonb, J. An economic evaluation of phosphorus recovery as struvite from digester supernatant. Bioresour. Technol. 2005, 97, 2211–2216. [Google Scholar]
- White, S.; Fane, S.A.; Giurco, D.; Turner, A.J. Putting the economics in its place: Decision-making in an uncertain environment. In Deliberative Ecological Economics; Zografos, C., Howarth, R., Eds.; Oxford University Press: Oxford, UK, 2008; pp. 80–106. [Google Scholar]
- Dunstan, C.; Langham, E.; Ison, N. 20 Policy Tools for Developing Distributed Energy; Institute for Sustainable Futures: Sydney, Australia, 2009. [Google Scholar]
- Turner, A.J.; Willetts, J.R.; Fane, S.A.; Giurco, D.; Chong, J.; Kazaglis, A.; White, S. Guide to Demand Management and Integrated Resource Planning; Water Services Association of Australia (WSAA): Sydney, Australia, 2010; pp. 1–174. [Google Scholar]
- GPRI, Blueprint for Phophorus Security, Draft; Global Phosphorus Research Initiative: Sydney, Australia, 2012.
- Childers, D.L.; Caple, Z.; Carlielle-Marquet, C.; Cordell, D.; Gerhart, V.; Iwaniec, D.; White, S. Chapter 9: Future Scenarios for the Sustainable Use of Global Phosphorus Resources. In Phosphorus, Food, and Our Future; Wyant, K.A., Corman, J.R., Elser., J.J., Eds.; Oxford University Press: New York, NY, USA, 2013; in press. [Google Scholar]
© 2013 by the authors; licensee MDPI, Basel, Switzerland. This article is an open access article distributed under the terms and conditions of the Creative Commons Attribution license (http://creativecommons.org/licenses/by/3.0/).
Share and Cite
Cordell, D.; White, S. Sustainable Phosphorus Measures: Strategies and Technologies for Achieving Phosphorus Security. Agronomy 2013, 3, 86-116. https://doi.org/10.3390/agronomy3010086
Cordell D, White S. Sustainable Phosphorus Measures: Strategies and Technologies for Achieving Phosphorus Security. Agronomy. 2013; 3(1):86-116. https://doi.org/10.3390/agronomy3010086
Chicago/Turabian StyleCordell, Dana, and Stuart White. 2013. "Sustainable Phosphorus Measures: Strategies and Technologies for Achieving Phosphorus Security" Agronomy 3, no. 1: 86-116. https://doi.org/10.3390/agronomy3010086