Article

Screening for Barley Waterlogging Tolerance in Nordic Barley Cultivars (Hordeum vulgare L.) Using Chlorophyll Fluorescence on Hydroponically-Grown Plants

by
Nils-Ove Bertholdsson
Department of Plant Breeding, Swedish University of Agricultural Sciences, P.O. Box 101, 230 53 Alnarp, Sweden
Agronomy 2013, 3(2), 376-390; https://doi.org/10.3390/agronomy3020376
Submission received: 29 March 2013 / Revised: 11 April 2013 / Accepted: 22 April 2013 / Published: 25 April 2013

Abstract

:
Waterlogging can reduce crop yield by 20%–50% or more, and lack of efficient selection methods is an obstacle in plant breeding. The methods currently used are mainly indices based on germination ability in Petri dishes and leaf chlorosis in plants grown in waterlogged soils. Cultivation in oxygen-depleted nutrient solution is the ultimate waterlogging system. Therefore methods based on root growth inhibition and on fluorescence in plant material hydroponically grown in oxygen-depleted solution were evaluated against data on biomass accumulation in waterlogged soils. Both traits were correlated with waterlogging tolerance in soil, but since it was easier to measure fluorescence, this method was further evaluated. A selection of F2 plants with high and low fluorescence revealed a small but significant screening effect in F3 plants. A test of 175 Nordic cultivars showed large variations in chlorophyll fluorescence in leaves from oxygen-stressed seedlings, indicating that adaptation to waterlogging has gradually improved over the past 40–50 years with the introduction of new cultivars onto the market. However, precipitation also increased during the period and new cultivars may have inadvertently been adapted to this while breeding barley for grain yield. The results suggest that the hydroponic method can be used for screening barley populations, breeding lines or phenotyping of populations in developing markers for quantitative trait loci.

1. Introduction

Barley (Hordeum vulgare L.) is more susceptible to waterlogging stress than other cereals [1] and waterlogging is a limiting factor in barley production worldwide. In China and Japan, improved tolerance to waterlogging is one of the major objectives in barley breeding programmes [2], and with expected climate change its importance will also increase in northern Europe [3]. Today waterlogging is reported to reduce grain yield by 20%–25% or more, depending on stage of development [1]. As with other abiotic stresses, barley adaptation to waterlogging is a complex trait. However, there is currently no useful and efficient selection method of screening for this trait, which is an obstacle in breeding programmes. There are several recent reviews of the area [1,2,4,5] and thus only some basic information of importance for the present study is mentioned here.
The timing and duration of waterlogging vary with soil type, frequency of heavy rainfall and risk of flooding. Waterlogging is a state in which excess water in the root zone affects the oxygen concentration in the soil, resulting in an energy crisis in roots [4] and reducing plant growth at any growth stage [1]. During short-term waterlogging, differences in constitutive root porosity (i.e., more aerenchyma) are probably the main reason why cereals differ in tolerance, but anoxia tolerance could also have an impact [1,4,6]. The plant may also escape stress by resorting to low metabolic activity during the stress period and showing rapid recovery ability when the soil is drained. During long-term waterlogging, ethanolic fermentation and various recovery mechanisms may also take place [1,7,8]. One important feature among wetland species is a barrier to radial oxygen losses (ROL), but this seems to be of less importance in wheat and barley [6,8]. Even short-term waterlogging in wheat has long-term effects on growth and physiology of the plant due to death of root apices and impaired root and shoot growth [9].
Adaptation of barley to waterlogging at the germination stage has been studied in Japan [10] and Australia [2], and extensive screening of barley germplasm for this trait has been carried out in China and Japan [1]. The main methods used are indices based on leaf chlorosis [11] and germination ability [10]. Pang et al. [7] suggest the use of photosynthetic rate or total chlorophyll for selection of parental genotypes and chlorophyll fluorescence when screening large numbers of breeding lines. However, there are no reports on the heritability of these traits and their use in practical breeding. Li et al. [12] used indices of leaf chlorosis, plant survival and plant biomass reduction to identify quantitative trait loci (QTL) associated with waterlogging in barley and found seven such QTL. Some of these QTL affected multiple adaptation to waterlogging-related traits, e.g. by reducing leaf chlorosis and increasing plant biomass under waterlogging stress. In a recent study, Zhou [2] concluded that accurate phenotyping is crucial for identifying better QTL.
Most studies to date have been performed using waterlogged soils, but the use of hydroponics could be an interesting alternative. Cultivation in oxygen-depleted nutrient solution is the ultimate waterlogging system and can be carefully controlled, unlike the soil system. However, there are few studies using hydroponically grown plants or plants grown in stagnant water (gels) or with sand as substrate [13]. The aim of the present study was therefore to use hydroponically-grown material to identify useful selection criteria at the seedling stage for adaptation of barley to waterlogging. Two traits of particular interest are root growth and chlorophyll fluorescence, both of which can easily be observed in hydroponically-grown seedlings. The root system is the first plant part that is directly exposed to the stress and the plant responds to waterlogging with reduced root growth [14]. An even faster response to waterlogging is apparent as changes in leaf chlorophyll fluorescence caused by abiotic stresses [15,16]. Measurement of leaf chlorophyll fluorescence also offers the possibility of non-destructive selection of plants.
Specific objectives of the study were: (1) to develop a screening method for barley adaptation to waterlogging based on hydroponically-grown seedlings; (2) to evaluate the method by screening a segregating population; and (3) to characterise barley cultivars released in the Nordic and Baltic countries over more than 100 years in order to identify useful genetic resources for breeding waterlogging-tolerant accessions.

2. Experimental Section

A preliminary test conducted with 10 barley cultivars submitted to official variety testing in Sweden between 1996 and 2001 revealed 40% differences in adaptation to waterlogging [17]. These cultivars and two more recent cultivars were therefore selected as reference material in different studies to develop a screening method for waterlogging tolerance. For the evaluation of selection efficiency, a F2 population from the cross cv. Henni × cv. Gustav was used. For the screening of possible sources of adaptation to waterlogging, a collection of 175 Nordic and Baltic cultivars released in the last 100+ years was used [18], complemented with some new cultivars. Initially the reference material was studied in waterlogged soil and in stagnant nutrient solution to determine which of the two traits (root growth or chlorophyll fluorescence) was most suitable for use in screening of waterlogging tolerance.

2.1. Soil Studies

The reference material was sown in cylindrical pots (diameter 10 cm, height 20 cm) filled with fertilised peat mould with Leca (NPK 180/90/195 g m3 + Micro©) (Weibulls Horto, Hammenhög, Sweden). The drainage holes in the base of half the pots were sealed with adhesive tape to allow waterlogging. Five seeds were planted in each of four replicate pots and thinned out to four after germination. At sowing, 150 mL water were added to the pots, which were randomly positioned with the four replicate pots on separate trolleys in a growth chamber with 16 h artificial light (150 µmol m−2s−1 in the range 400–700 nm) for 12 days at 18/15 °C day/night temperature. After 12 days, all pots were given 150 mL nutrient solution (Rika-S NPK 84/12/56 g L−1 +Micro©, diluted 1:400 (Weibulls Horto, Hammenhög, Sweden) and pots with sealed holes were given additional water until the soil was fully saturated (55%–57% water content; Theta Probe type ML1, Delta T Devices, Cambridge, UK). Control pots were kept at 25%–33% water content. After 18 days of stress, the control and oxygen-stressed plants were cut and dried at 70 °C for one week. The study was repeated twice and a waterlogging tolerance index was calculated as the mean seedling weight of oxygen-stressed plants relative to mean seedling weight of control plants × 100. The values obtained were used as reference values for waterlogging tolerance (WLT) when optimising the hydroponic methods.

2.2. Hydroponics

A previously developed hydroponic system [18] was used to study seedling root and shoot growth of the reference material. The seeds were sown on strips of corrugated paper suspended in frames in 25-litre containers with a balanced phosphate-buffered complete 2 mM nitrogen nutrient solution (pH = 6.5) [19]. Each strip was 3.5 cm wide and the ridges and furrows were flattened out at the lower two-thirds with a clothes iron to prevent the seeds falling down and to facilitate mounting in the frames. The ends of the flattened part were cut so that the strip could hang down between plastic rulers lying on the frame and fixed in place by masking tape. Similar strips of filter paper, but 10 cm wide, were suspended alongside the corrugated strips as wicks. After sowing, the strips were sprayed with a detergent (Lissapol, 0.5%, Syngenta, Copenhagen, Denmark) and covered with filter paper strips partly hanging down into the solution until the seeds had germinated. The cultivars were arranged in a randomised complete block design, with four replicates of six plants, and repeated twice. The plants in the first strip at each end of the frame and the first plant in each strip were border plants. The containers were placed in a growth chamber with 16 h artificial light (150 µmol m−2s−1 in the range 400–700 nm) at 18/15 °C day/night temperature. Containers with fully aerated (control) and non-aerated (oxygen-stressed/waterlogged) nutrient solution were used. Aerated solution was obtained by bubbling air through the nutrient solution. Both the control and oxygen-stressed containers were aerated from day 4 to 7, but after day 7 only the controls were aerated. The nutrient solution was renewed after one week and then at 4-day intervals until the end of the experiment. After 12 days of stress, the length of the longest seminal root (Root length) in all plants, as well as the pooled dry weight of roots (Root weight), shoots (Shoot weight) and whole plants (Plant weight), were analysed.

2.3. Chlorophyll Fluorescence

Measurements were made with a pulsed amplitude modulation (PAM) portable MINI-PAM fluorometer with Leaf-Clip Holder 2030-B attached (WALZ, GmbH, Germany). Six plants each of two replicates per treatment, were measured for quantum yield (QY) as (M-F)/M)), where F is fluorescence yield at various light intensities and M is maximum fluorescence yield during a saturation light pulse. To facilitate the measurements fully light-illuminated leaves were used, which was possible since only QY and not quenching coefficients were of interest [20]. In all measurements cv Henni was used as an internal standard and QY is presented relative to Henni when not all cultivars could be analysed in the same container. During the development of the method, F was evaluated at five light intensities: ambient light giving a PAR reading of 89 µmol m−2s−1 with the built-in sensor, ambient light closer to the light source giving a PAR reading of 125 µmol m−2s−1, light from an external LED lamp giving 400 µmol m−2s−1, 5 sec of actinic light from the internal lamp giving a PAR reading of 275 µmol m−2s−1 and 5 sec of actinic light giving a PAR reading of 376 µmol m−2s−1. The last three intensities are a combination of ambient and external or internal lamp. The material was grown in the same hydroponic system as the plants for studies of root and shoot growth. The plants were subjected to stress by removing the aerating device after 10 days. The PAM measurements were made after 0 and until 9 days of stress. The seedling was removed from the corrugated paper prior the measurement and the first leaf of the plant was clipped on to the leaf holder at the middle of the leaf and upper side up. The clip holder was fixed to a table to give standard conditions during measurements. For the measurement at 275 and 378 µmol m−2s−1, the first leaf was cut off and placed horizontally in ambient light of 155 µmol m−2s−1 for 5 min prior to measurements. When the measurements were made immediately after removing the plant from the hydroponic container, QY was lower, with higher standard deviation. After only one minute with the leaves lying on the table, QY stabilised at a higher value and remained there for at least 20 min, and the standard error was also reduced. In the final method, leaves were cut off and placed horizontally in ambient light of 155 µmol m−2s−1 for 5 min for light-adaptation and then measured with 5 sec of extra light of 378 ± 20 µmol m−2s−1. It was important that the part of the leaf being measured did not curl away from the light but stayed fully illuminated.
During the development of the method, 2 × 6 plants were measured in each test run. In the selection of plants from the segregation population cv. Henni × cv. Gustav, two hydroponic frames were filled with 500 F2 seeds from the population. Twenty plants with high and low QY were selected and planted in pots and tested again in the next generation as breeding lines with 4 × 6 plants per line. In the study of Nordic cultivars, the cultivars were divided into sub-sets of 11 cultivars + cv. Henni as an internal check to calculate relative QY (QYrel). Relative values were used since in repeated tests of the reference material, QYrel varied less than QY. Each sub-set was tested in a single hydroponic tank with a randomised block design with four blocks and six plants per block. Some cultivars were tested two or three times if they showed a particularly high or low QY.

2.4. Statistical Analysis

The soil and hydroponic experiments were arranged as randomised split-plot designs with treatment as main plot and varieties as subplots. Data for growth parameters in pots and hydroponics with oxygen-stressed and non-stressed treatments were analysed by analysis of variance (ANOVA) with the general linear model (GLM) in the Statgraphics Plus (Manugistics, Inc, Rockville, MD, USA) software. Differences between treatments for all measurements were compared using the t-test (P < 0.05) and 2 × standard errors of means are presented in the diagrams. The number of observations varied with parameter studied and is shown in each table or diagram. Regression and correlation analyses were performed between mean values of parameters with physiological relevance. Although the measurements of fluorescence were carried out in standardised environment, some very low values deviated more than others and were excluded if the studentised residual was greater than 2.5. Box-and-whisker plots were used to illustrate how QYrel changed by introducing new cultivars grouped by decades or half-decades in the Nordic countries.

3. Results

3.1. Growth Reduction in Waterlogged Soil

The seedling shoot weight of the reference material was reduced during 18 days of waterlogging by on average 29% (P < 0.001). However, the growth reduction varied with cultivar (P < 0.01 for treatment × cultivar). Cultivars Cecilia and Pongo were most affected, with a growth reduction of 37.6% and 37.1%, respectively (P < 0.001), and cvs. Henni and Otira were least affected, with a non-significant reduction of 16.3% and 14.8%, respectively (Table 1). Cv. Pongo and particularly cv. Cecilia also showed yellowing leaves, while cvs. Henni and Otira were still green. The relative growth reduction in soil (WLT) is used from here on as the reference for adaptation to waterlogging and to identify possible other traits that could be used for screening of waterlogging tolerance.
Table 1. Shoot dry weight of 12 barley cultivars grown in pots with (Stress) and without (Control) 19 days of waterlogging, seminal root length of hydroponically grown plants with (Control) and without aerated (Stress) nutrient solution for 14 days, and fluorescence (Quantum yield measured at 376 (µmol m−2s−1) of the first leaf of hydroponically-grown plants with (Control) and without aerated (Stress) nutrient solution during four days prior to fluorescence measurements. Each shoot weight value is the mean of five replicate plants, root length is the mean of 8 plants and QY is the mean of 4 × 6 plants. Rel = Stress/Control×100. Rel for shoot weight is the reference measure of waterlogging tolerance (WLT).
CultivarShoot weight (mg )Root length (mm)Quantum yield
ControlStressRel(%) ControlStressRel(%) ControlStressRel(%)
Alexis32721265.815597630.4180.36487.2
Baronesse349246 72.0175107610.4710.43291.8
Cecilia35622262.417099590.4080.37291.4
Barke35624468.415589580.3880.38398.8
Henni29424583.7164127780.4620.44095.2
Scarlett29720569.818092510.4390.39489.8
Meltan28821175.318096530.4560.41390.6
Otira31826085.2150124830.4550.43996.3
Pongo28617362.913898720.4180.38592.2
Optic32622870.7184101550.4500.39186.8
Gustav26218270.6173101580.4820.41686.2
Quench32621569.1191102540.4590.42191.8
SEM10.813.24.53.92.02.0 0.0060.0061.56
Treatment*** *** ***
Cultivarns*************
T x C** *** ***
ns, *, ** and *** indicate non-significant (P > 0.05) or significant at P < 0.05, P < 0.01 and P < 0.001, respectively.

3.2. Seedling Root Growth in Oxygen-Depleted Nutrient Solution

Shoot and root weight of hydroponically grown plants were analysed, but since seminal root length was strongly correlated with WLT and QY, only the results for this parameter are presented here. The length of the longest seminal root was decreased by between 17% and 49% by non-aeration (P < 0.001) (Table 1). As found for shoot growth in waterlogged soil, cvs. Henni and Otira were less affected (22% and 17% decrease, respectively). Most affected was cv. Scarlet (49% decrease) followed by cv. Meltan (47%). In absolute figures, cvs. Henni and Otira had the longest seminal roots under hypoxia and cvs. Barke and Scarlett the shortest. Seminal root length was highly correlated with WLT (r = 0.81, P < 0.01) under stress, but not correlated at all when aerated (r = 0.01, non-significant) (Table 2).
Table 2. Correlations between characteristics of 12 cultivar seedlings (reference material) grown in aerated (Control) and non-aerated (Stress) hydroponic nutrient solution and a waterlogging tolerance (WLT) index, calculated as the shoot weight of waterlogged plants relative to that of control plants.
WLTSWcSWsRLcRLsRLs/RLc
Shoot weight control (SWc)−0.241.00
Shoot weight stress (SWs)0.61*0.61*1.00
Root length control (RLc)0.010.030.021.00
Root length stress (RLs)0.81**−0.130.53−0.161.00
RLs/RLc0.55−0.110.34−0.72**0.80**1.00
QY control (QYc)0.56−0.510.010.490.510.05
QYstress (QYs)0.82***−0.280.410.210.75**0.40
QYs/QYc0.340.360.60*−0.430.320.49
*, **, *** indicate correlations significantly different from zero at P < 0.05, P < 0.01 and P < 0.001, respectively. Degrees of freedom = 10. QY was measured at 376 (µmol m−2s−1).

3.3. Quantum Yield of Seedlings Grown in Oxygen-Depleted Solution

The correlation between WLT and QY at ambient light intensity of hypoxia-stressed plants increased with number of days without aeration, but remained non-significant. With light intensities above ambient, the correlations improved and reached significance already after 3–5 days. After a longer stress period, the correlation coefficient decreased again (Figure 1).
Several ways to increase light intensity above ambient were tested and the best results were obtained when the internal lamp was used. To avoid overheating, only 5 sec of light were given, to increase the light intensity to 275 µmol m−2s−1 and 376 µmol m−2s−1. In the study of the reference material, leaves from 12 plants were measured. However, when 24 leaves adapted to the same light intensity prior to measurement were used the correlation with WLT was stronger (r = 0.82, P < 0.01) (Table 2). The values obtained in these ways were also positively correlated with RLs (r = 0.84, P < 0.01) (Table 2) and grain yield from official variety testing in Sweden (r = 0.83, P < 0.01) (Figure 2). The correlation between grain yield and WLT was r = 0.73, P < 0.05 (not shown in any table or diagram).
Figure 1. Correlation coefficients after increasing days with oxygen stress between quantum yield and a waterlogging tolerance index (WLT) of the reference material calculated as the growth reduction in pots with and without waterlogging. The different curves show the coefficients obtained with 376, 125 and 89 µmol m−2s−1 during the fluorescence measurements. The data are fitted to second order polynomials (p-values of models were 0.0046, 0.0005 and 0.0060, respectively). The plants were 10 days old at day 0. N = 12 for the daily regression and light intensity analyses.
Agronomy 03 00376 g001
Figure 2. Relationship between mean relative quantum yield at 376 (µmol m−2s−1) (QYrel, Henni = 100) of plants grown in oxygen-depleted nutrient solution for 4 to 5 days and grain yield of 10 cultivars from the reference material with comparable yield data from Swedish official variety testing during five years in Sweden. Bars indicate 2 × standard error (SE).
Agronomy 03 00376 g002

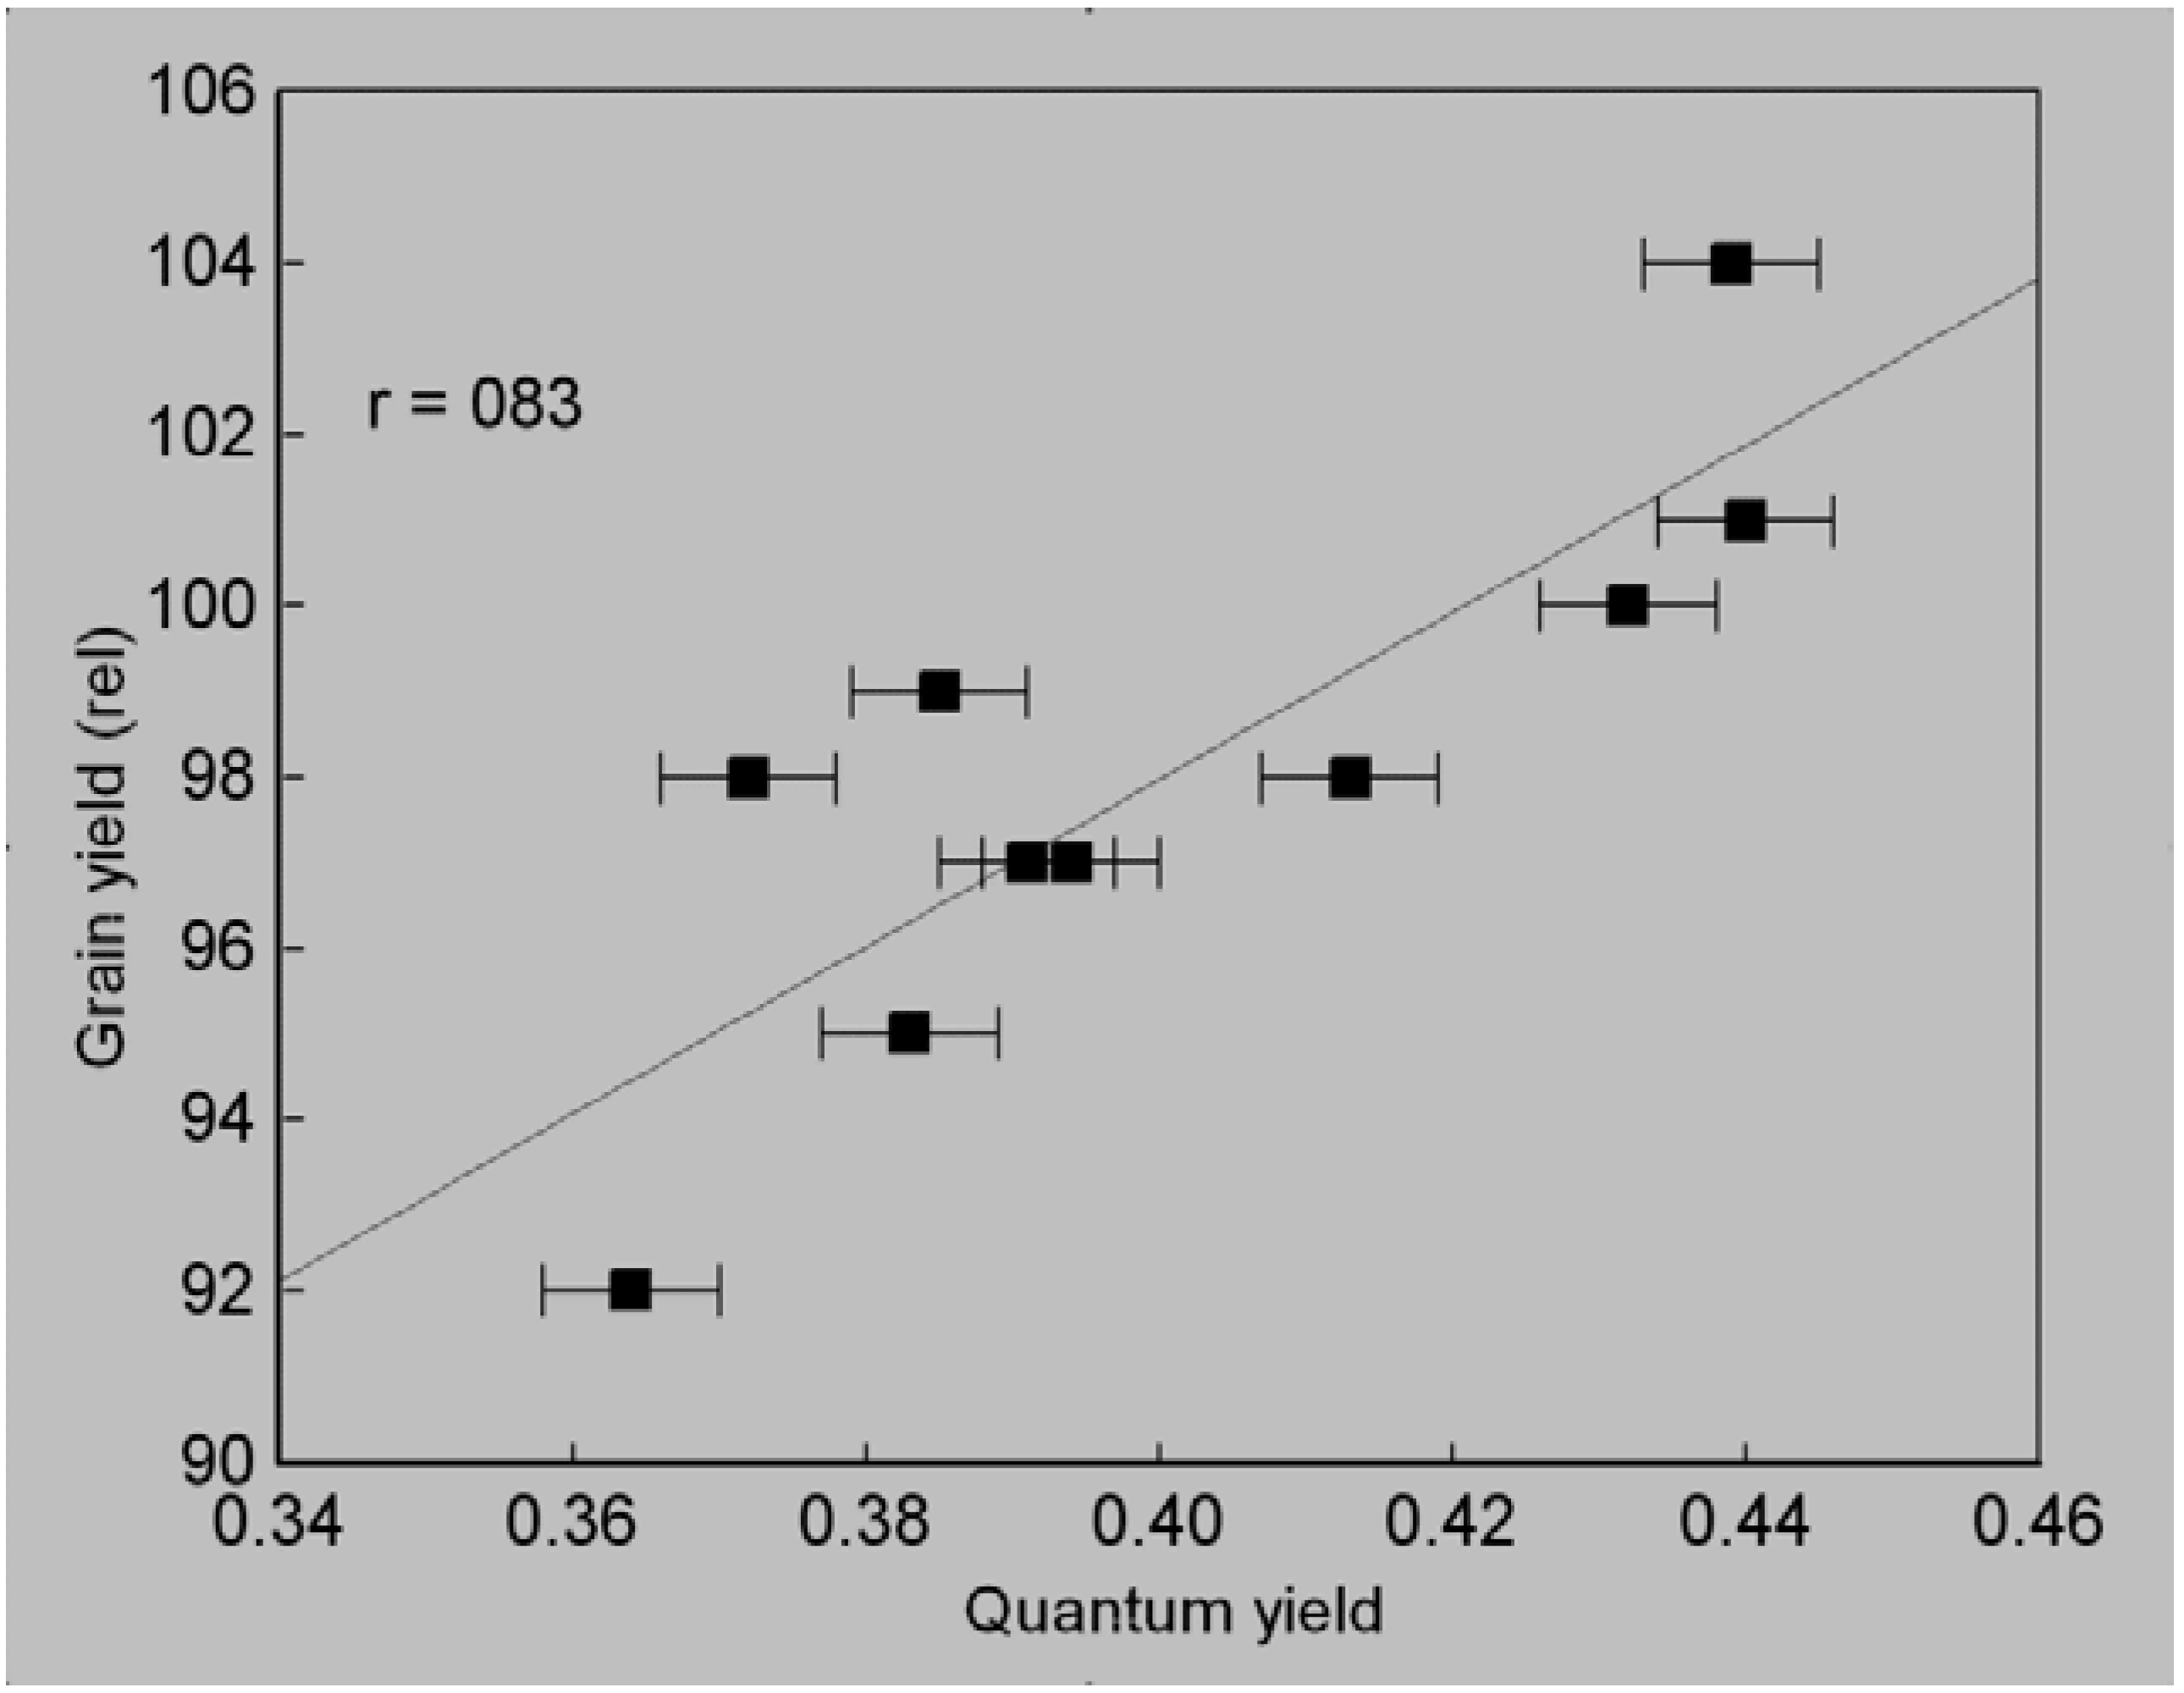
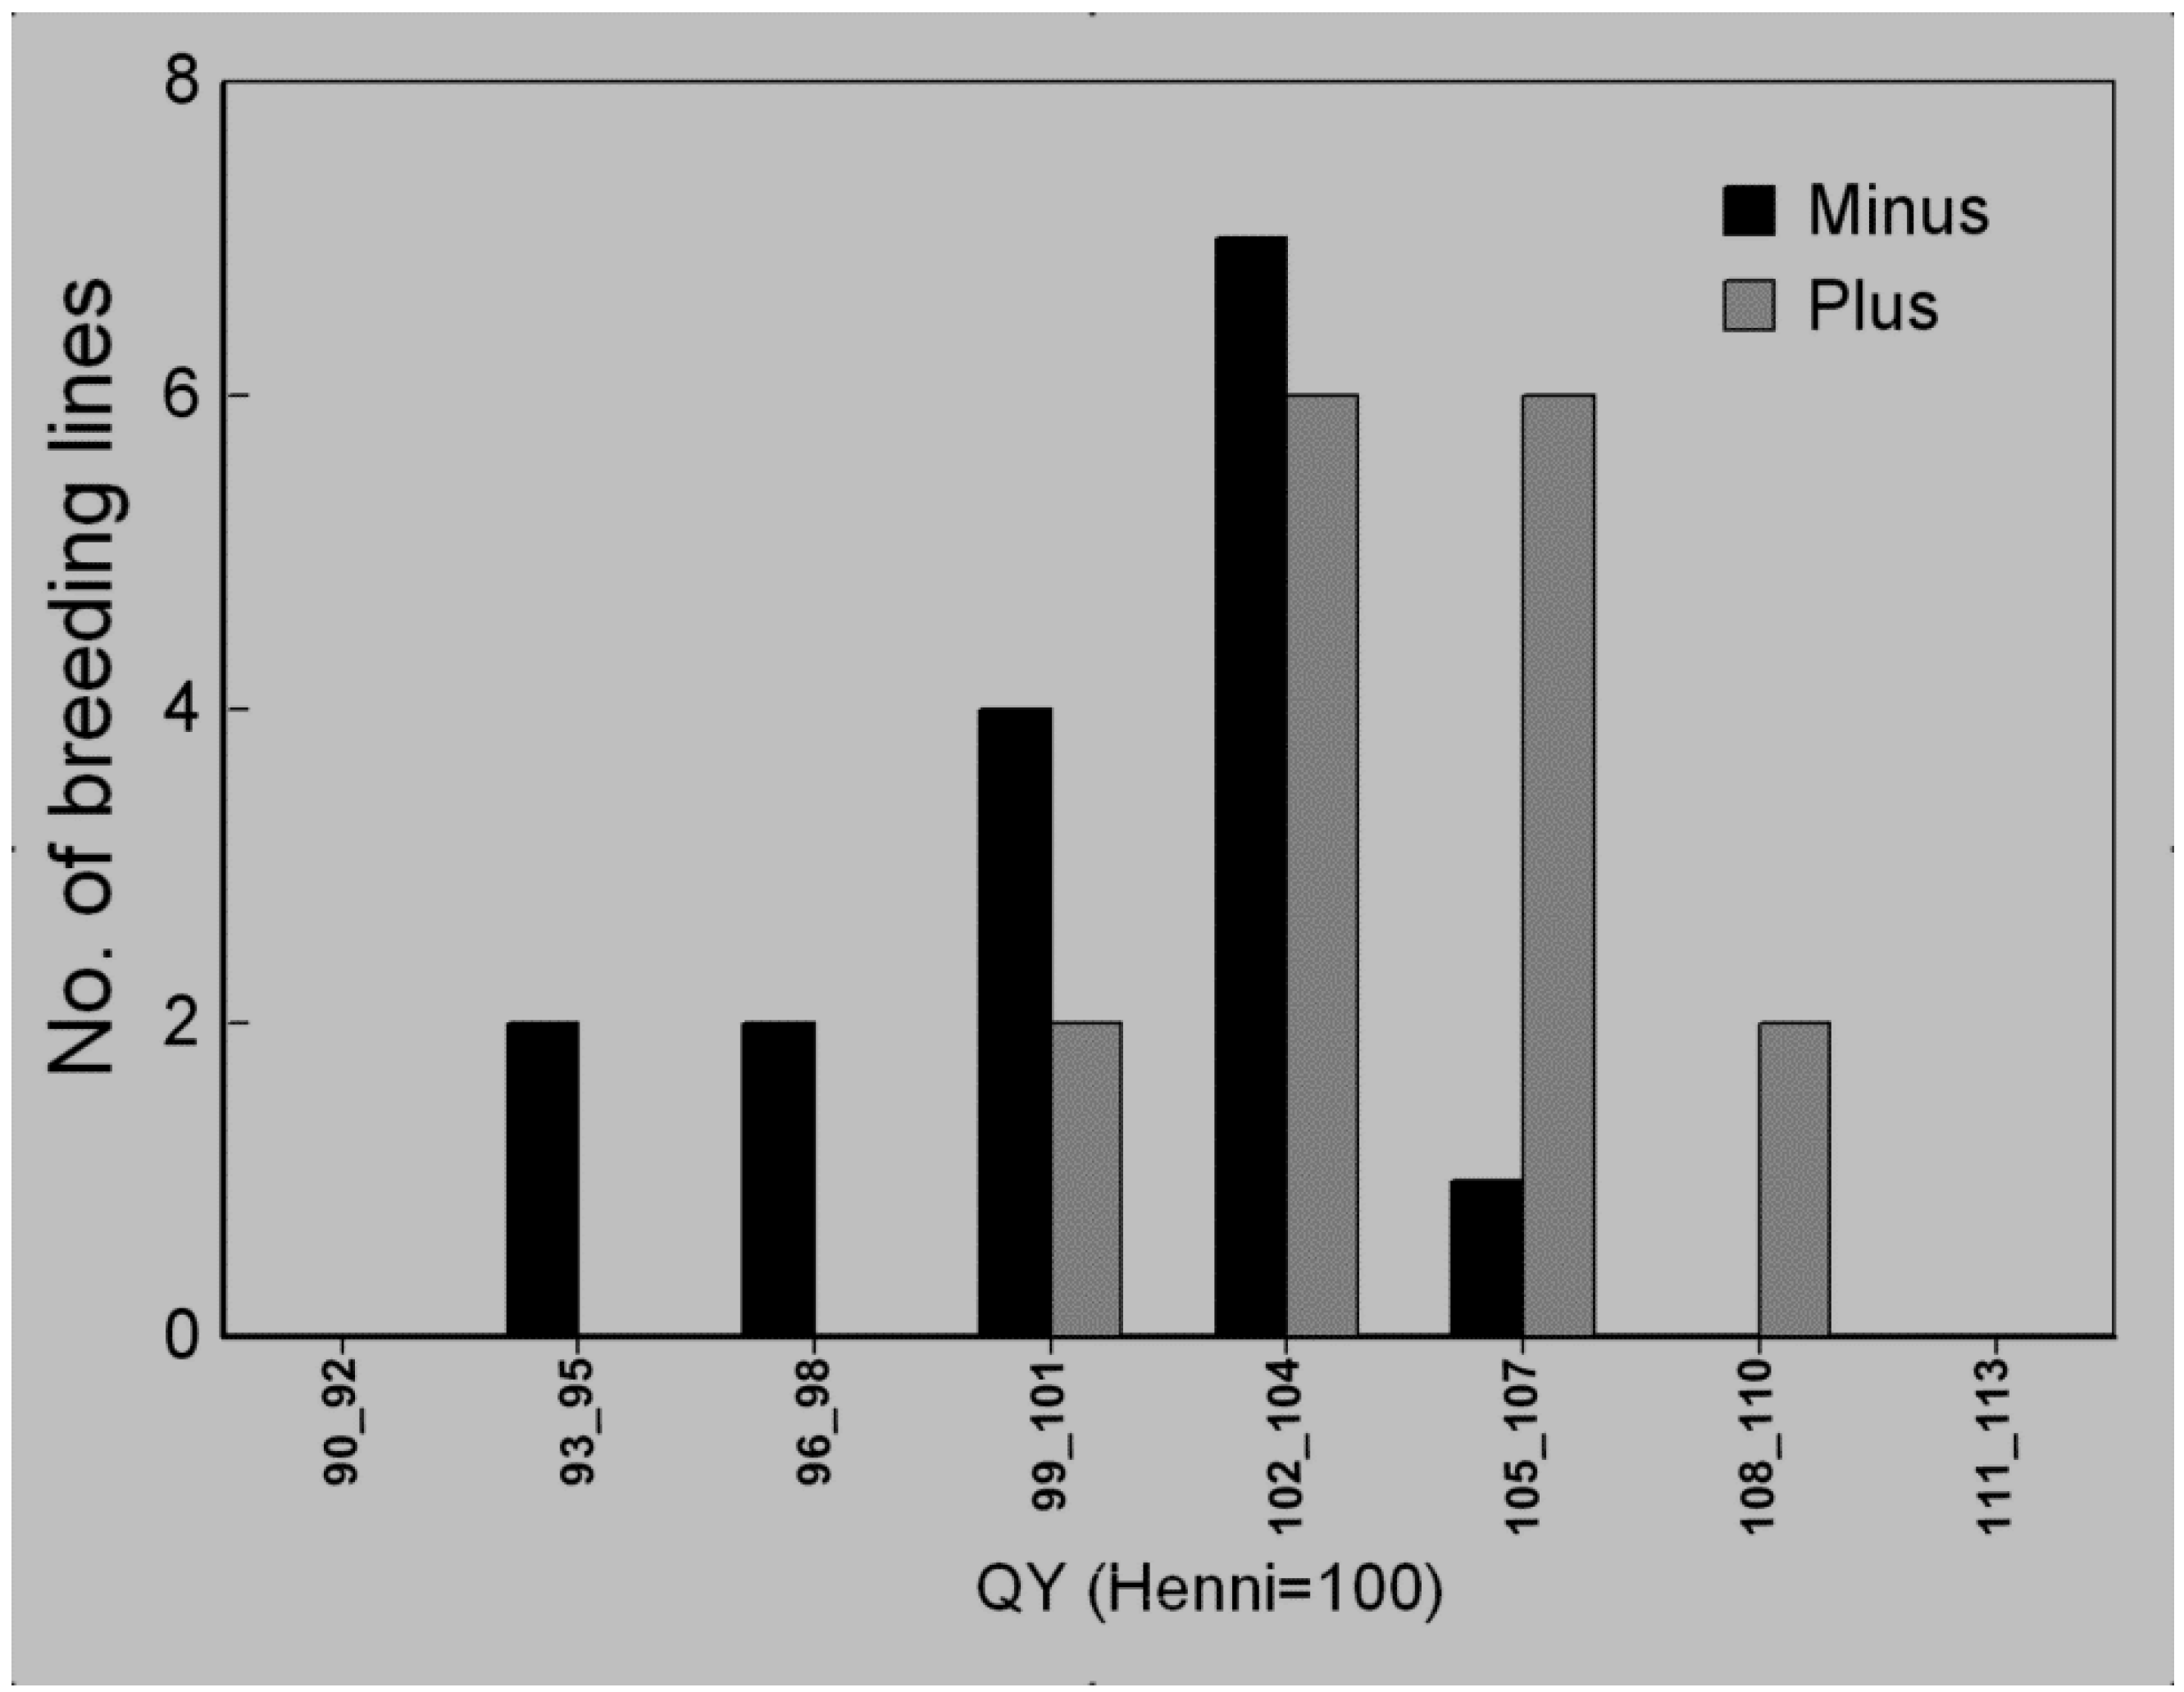
3.4. Selection Efficiency of Quantum Yield

Of 20 selected plants with high and low QY from a cv. Henni (QYrel = 100) × cv. Gustav (QYrel = 95) cross, only 16 of each selection produced enough F3 seeds for testing chlorophyll fluorescence. The mean QYrel of the plus and minus selection were 104.7 and 100.9, respectively, which were significantly different from each other (P < 0.001). A mean selection effect of 3.8 % is not much, but the parents only differed by 5%. Of the 16 lines selected to be high only two lines showed low QY and among those selected to be low thirteen showed low QY (Figure 3). However, since there is no absolute relationship between QY and WLT the study should be followed up with water logging studies in soils to confirm these results.
Figure 3. Frequency distribution of quantum yield (QY, Henni = 100) of F3 breeding lines from a plus and minus selection of single F2 plants from a cross between cv. Henni (QYrel = 100) and cv. Gustav (QYrel = 95). Standard error (SE) = 0.006, n = 24.
Agronomy 03 00376 g003

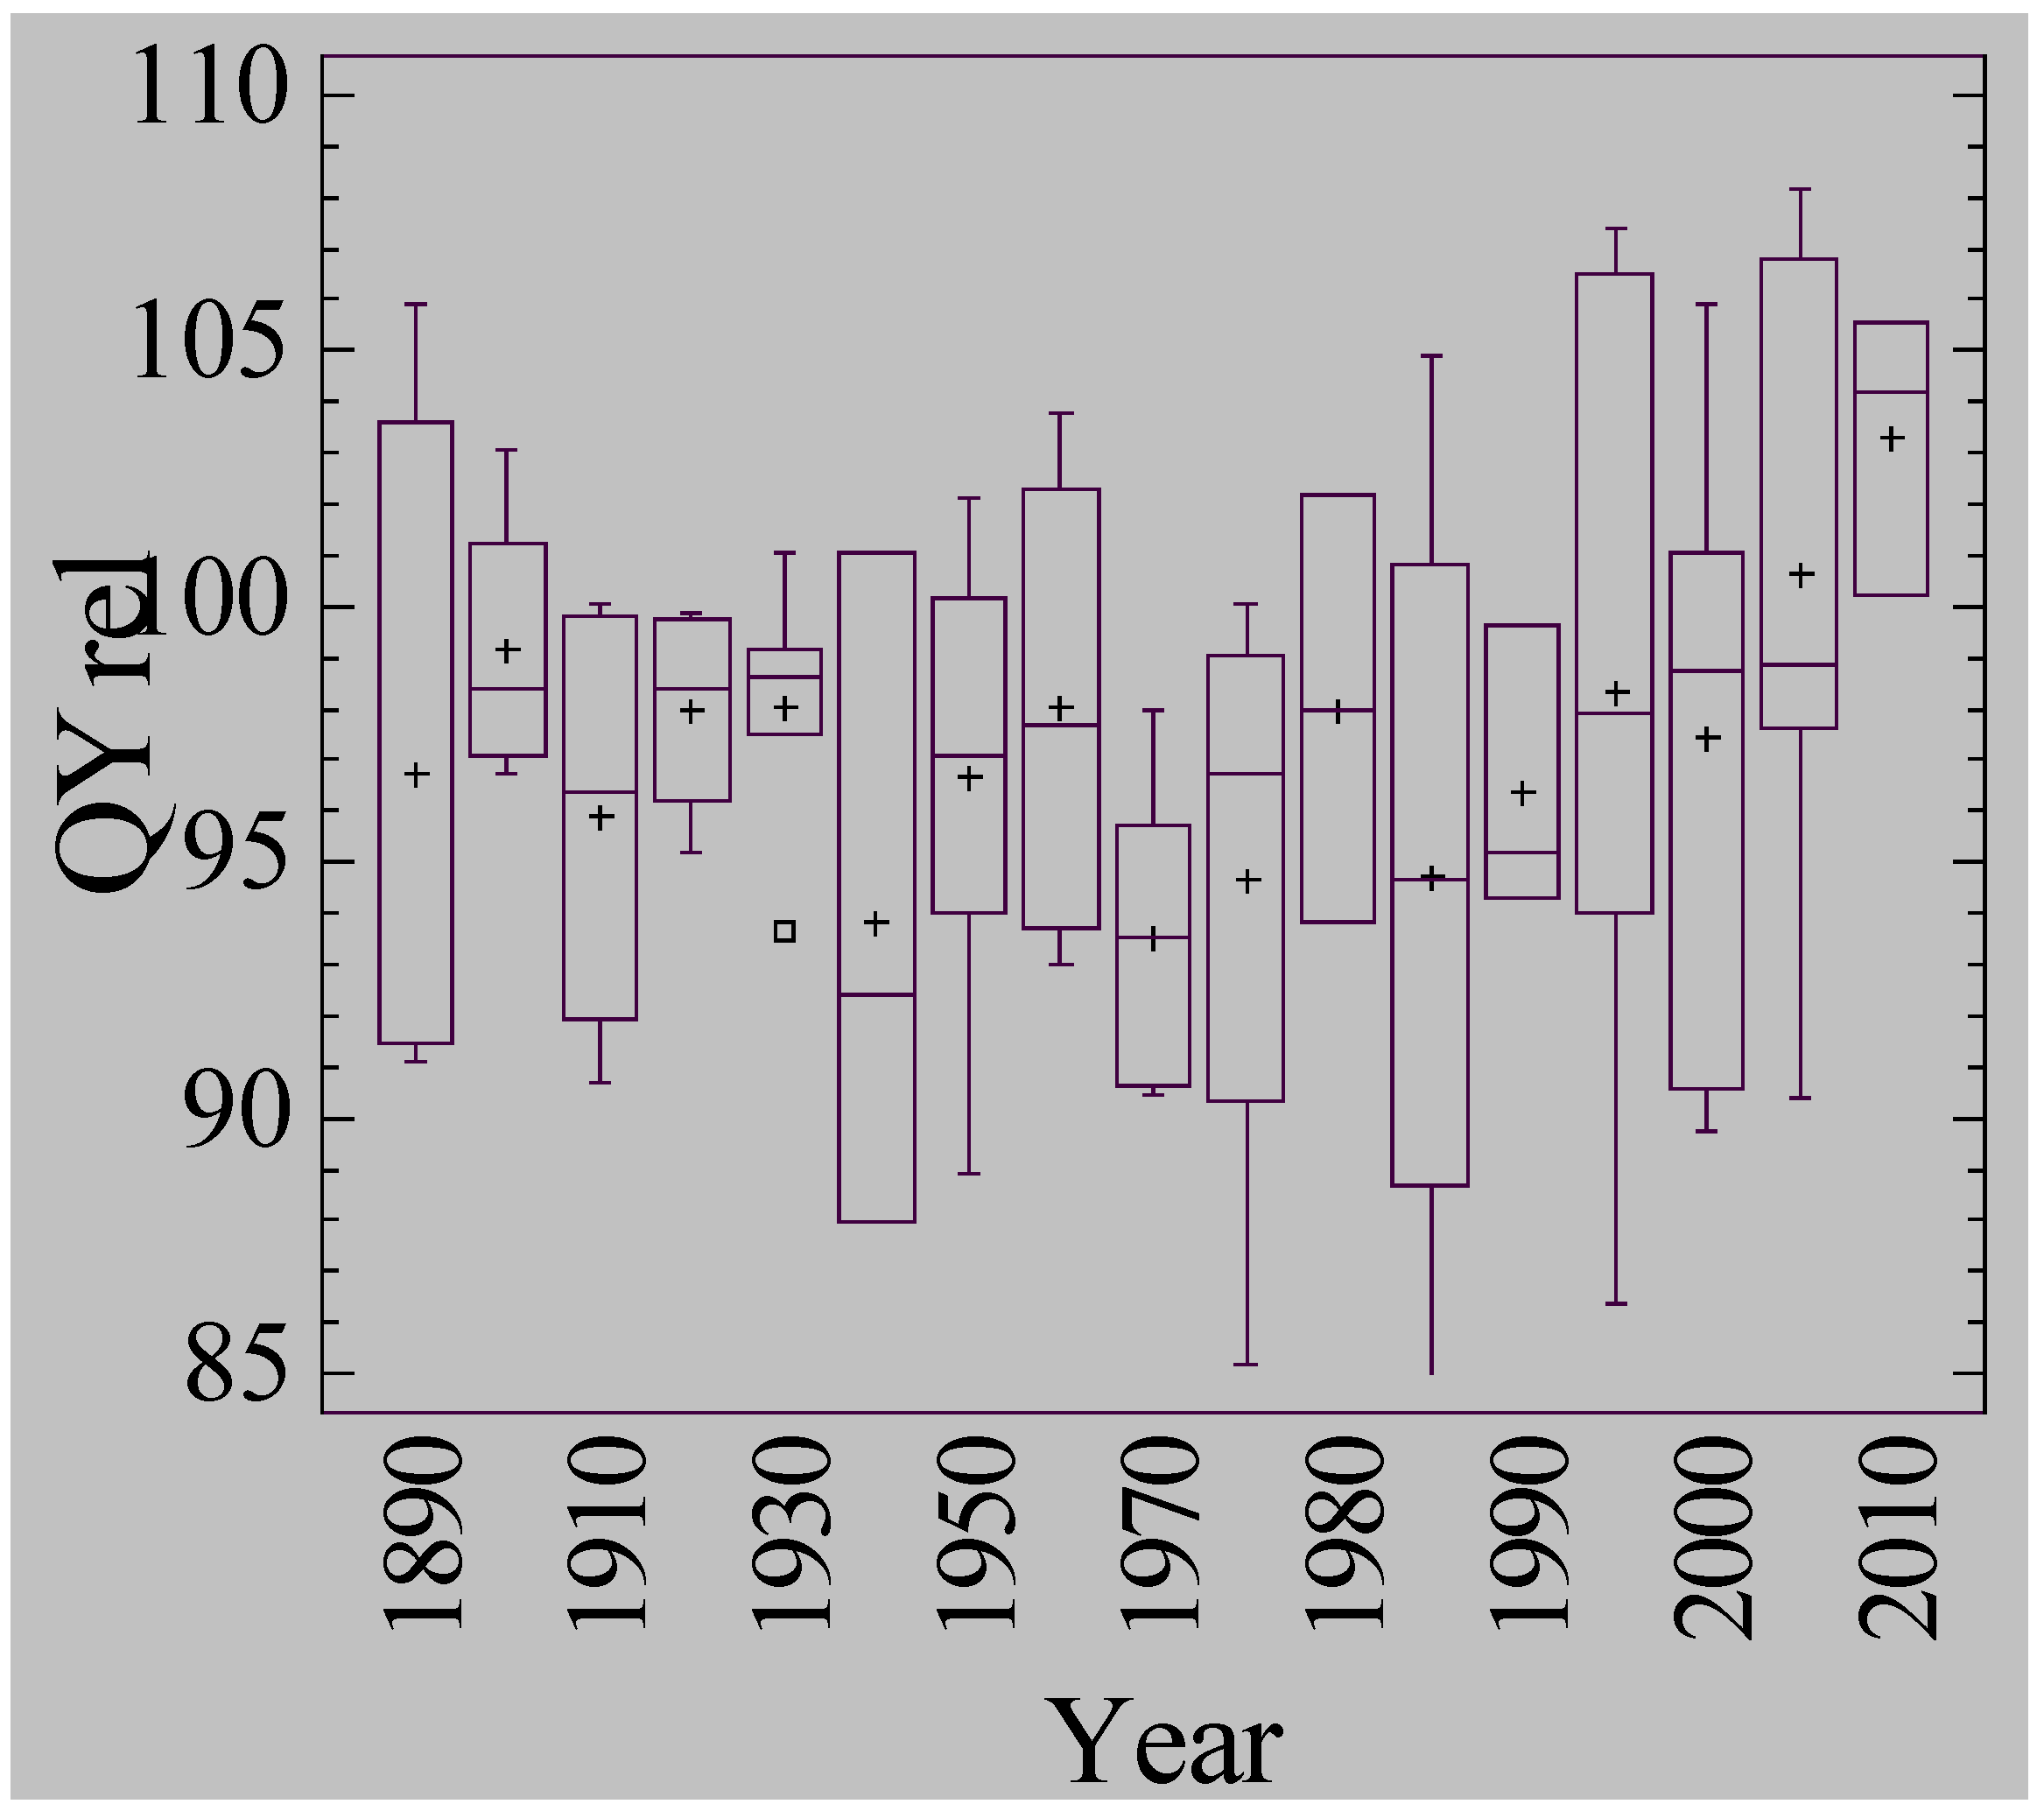
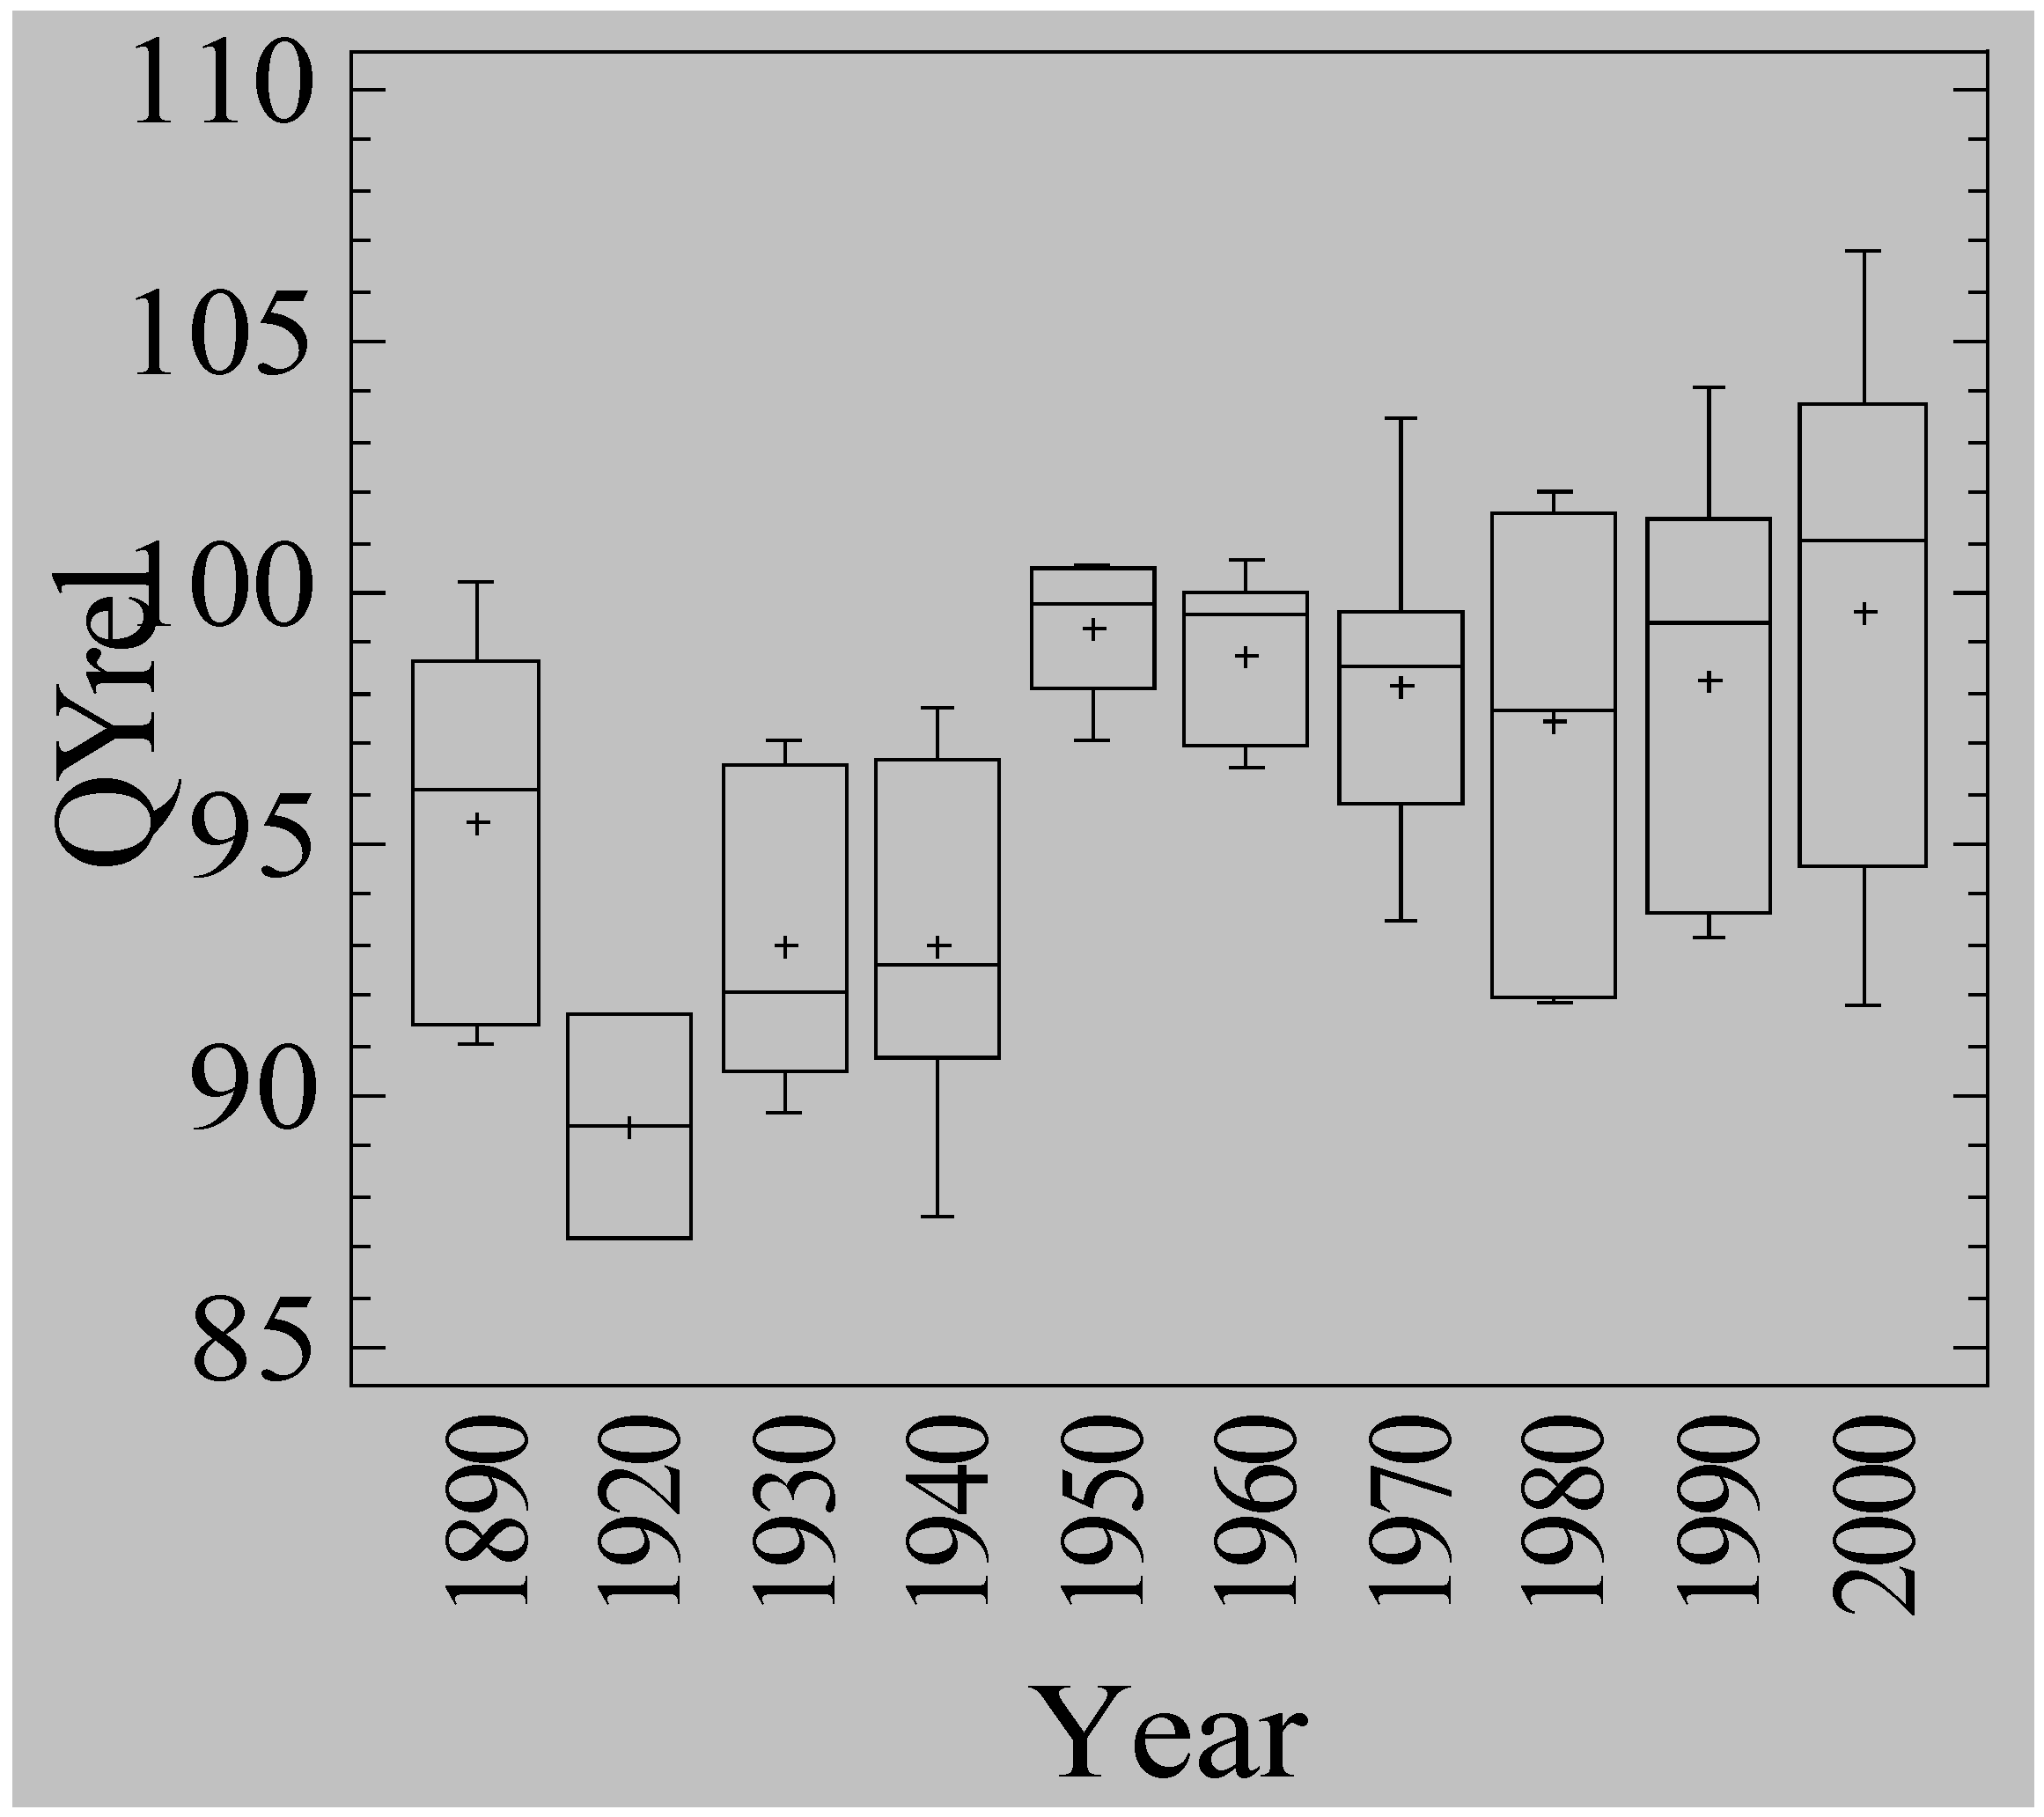
3.5. Waterlogging Tolerance of Nordic Barley Cultivars

With the introduction of new, in most cases six-row, barley cultivars in Norway and Finland, there has been an increasing trend in QY, although the fluctuation is large (Figure 4). Most landraces (introduced before 1900) showed lower QYrel than the standard cv. Henni and the very first cultivars were also less tolerant than more recent cultivars in general. A sub-set of 11 Norwegian cultivars (every second) was also studied in both well-aerated nutrient solution and oxygen-depleted nutrient solution. While the cultivars under stress showed a significantly increasing trend in QY, the trend was non-significant in well-aerated solution (r = 0.74, P < 0.01 compared with r = 0.31, non-significant) (Figure 5). Swedish and Danish cultivars had a negative trend until the 1960s, after which the trend was similar to that of cultivars from Norway and Finland (Figure 6). Among the landraces, Norwegian and Finnish types showed all low QY, while there were both low and high QY types among Swedish and Danish landraces. The changes in QYrel with time of introduction of cultivars from Estonia and Latvia are not presented here, but followed similar trends as in Sweden and Denmark.
Figure 4. Relative quantum yield (cv. Henni = 100) of oxygen-stressed plants of 15 two-row and 49 six-row old and new cultivars from the Norwegian and Finish barley breeding programmes. The cultivars are grouped in decades and presented as box-and-whisker plots. The vertical line inside the box is the median value and + the mean value. The year of introduction of landraces was set to 1890.
Agronomy 03 00376 g004
Figure 5. Relative quantum yield (cv. Henni = 100) of oxygen-stressed plants and non-oxygen-stressed plants six-row Norwegian cultivars (every second six-row Norwegian cultivar presented in Figure 4). Bars= 2 × SE.
Agronomy 03 00376 g005
Figure 6. Relative quantum yield (cv. Henni = 100) of oxygen-stressed plants from 70 two-row and 10 six-row old and new cultivars of Swedish and Danish barley. Some newer cultivars are from other parts of Europe but approved for cultivation in Sweden and Denmark at the time indicated by year of introduction. The cultivars are grouped in decades (after 1970 as half-decades) and presented as box-and-whisker plots. The vertical line inside the box is the median value and + the mean value. The year of introduction of landraces was set to 1890, since the first cultivars were introduced in 1900.
Agronomy 03 00376 g006

4. Discussion

There is a little, if any, direct screening for abiotic stresses in general, and waterlogging tolerance (WLT) in particular, in plant breeding of barley cultivars for temperate and maritime areas of Europe. Stress tolerance is obtained indirectly by testing, at best, advanced breeding lines in multi-environmental trials and finally by approval of cultivars with the highest mean grain yield in variety testing. A trait-based selection method, either for root growth or for chlorophyll fluorescence, to improve WLT would probably be more successful than just breeding for yield. The risk of discarding interesting genotypes on the way would be reduced and it would be possible to introgress special alleles for high WLT. The method used must also be cost-effective and the use of seedlings and hydroponics would allow testing of many plants in a limited space under controlled conditions.
In this study, both the seminal root length and chlorophyll fluorescence of waterlogged plants were positively correlated with WLT of the reference material and could hence be used for phenotyping and screening purposes without making comparisons with unstressed plants. Both would allow screening of single plants in segregating populations. One disadvantage of using the root growth of seedlings as a method is that seed size and seed vitality could have an influence and it is thus important that the seeds used are carefully selected [18]. The use of chlorophyll fluorescence is therefore a more interesting alternative, even if the correlation with WLT was similar for root growth. Fluorescence measurements are very quick and easy, but must follow a certain protocol. In this study no dark adaptation was used and instead all measurements were standardised by using detached leaves subjected to similar ambient light intensity prior to measurements, which were made at higher light intensities than ambient. With a limited time of acclimatisation and probably other within-plant variations, the standard deviation was high (around 5.5%). Thus, it was necessary to use at least 12 plants, or even better 24 plants, to get a reliable quantum yield (QY) value. This sample size is similar to that used in other studies in citrus [21], tomato [16] and lucerne [22].
The QY of unstressed plants of the reference material was initially not significantly correlated with WLT, but 3–5 days after interrupted aeration the QY changed and correlated significantly with WLT. Such quick responses are reported for aerenchyma development in tomato [16] and wheat [23], but changes in metabolic pathways may also play a role [24]. In this study there was a maximum effect after 4–5 days, whereas Pang et al. [7] reported maximum effects on QY in dark-adapted leaves after 2–3 weeks of waterlogging. They used different soils and this might have increased the response time. In our study, longer periods of waterlogging tended to reduce the correlation with WLT, especially if higher light intensity than ambient was used. The simple hydroponic system used did not permit studies over several weeks, but after three or more weeks there is a risk of competition, nutrient deficiency and other factors affecting the results.
While individual fluorescence measurements showed rather high fluctuations, the results of the +/− selection indicate that fluorescence can be used for screening single plants. With the use of hydroponics, a large number of plants can be screened and selected plants can be transferred to a soil medium. Zhou et al. [2] showed that WLT was mainly controlled by additive genes and had high heritability, and hence is suitable for screening in early generations. In their study leaf chlorosis was used, a symptom observed later than chlorophyll fluorescence changes.
The correlation between WLT and QY was higher for waterlogged plants than the correlation between WLT and QY of stressed/non-stressed plants. This is positive, since it is possible to select single plants from a segregating population or, if breeding lines are evaluated, test twice the number of genotypes. Of course, there is a risk that QY is high for reasons other than genotype and the selection may then have nothing to do with WLT. It is therefore important to follow up selected genotypes with studies in waterlogged soil and with non-waterlogged controls. If dark-adapted plants had been used there would not have been this risk, since QY of unstressed plants is fairly constant [16,22]. In this study, QY of non-stressed plants was lower than that of dark-adapted plants and also showed a positive but non-significant correlation with WLT in some cases. The reason for this could be that the plants were stressed by other factors in the hydroponic system, even if the solution was aerated. However, the results for the Norwegian cultivars with and without aeration confirm that the increased fluorescence of plants growth in oxygen-depleted solution is related to oxygen stress and not only to an improved genotype in general.
Both WLT and QY are positively correlated with grain yield. Thus, there is no conflict between WLT, high QY and grain yield, as also indicated by an inadvertent improvement in WLT by breeding for yield in the Nordic countries. Hence, trait-based selection could be done without any negative effects on grain yield. In fact grain yield would be improved, probably more efficiently, since a wide variety of cultivars could be evaluated and further used as parents [25].
The fluorescence method could also be used in the search for QTL. Some of the QTL involved in adaptation to waterlogging have been identified [12,26], but their efficiency may depend on the method used [27]. The use of fluorescence and hydroponics could hence improve the accuracy of searches for new QTL for introgressing into barley with the aim of creating new cultivars with enhanced adaptation to waterlogging.

5. Conclusions

The use of hydroponics is a simple and efficient way to simulate waterlogging stress of seedlings by interrupting the aeration of the nutrient solution. After only four days in oxygen-depleted nutrient solution, leaf chlorophyll fluorescence was affected and was correlated with a waterlogging tolerance index calculated from the weight of oxygen-stressed and unstressed pot-grown plants. A study of Nordic cultivars revealed a general trend for improved waterlogging tolerance during the last 50 years of barley breeding.

Acknowledgments

The author thanks the Swedish Farmers’ Foundation for Agricultural Research (SLF) for funding this study, Lantmännen AB for providing seeds, and Ingegerd Nilsson for technical assistance.

References and Notes

  1. Setter, T.L.; Waters, I. Review of prospects for germplasm improvement for waterlogging tolerance in wheat, barley and oats. Plant Soil 2003, 253, 1–34. [Google Scholar] [CrossRef]
  2. Zhou, M.X.; Li, H.B.; Mendham, N.J. Combining ability of waterlogging tolerance in barley. Crop Sci. 2007, 47, 278–284. [Google Scholar] [CrossRef]
  3. Kjellstrom, E.; Nikulin, G.; Hansson, U.; Strandberg, G.; Ullerstig, A. 21st century changes in the European climate: Uncertainties derived from an ensemble of regional climate model simulations. Tellus Ser. A Dyn. Meteorol. Oceanogr. 2011, 63, 24–40. [Google Scholar] [CrossRef]
  4. Colmer, T.D.; Voesenek, L.A.C.J. Flooding tolerance: Suites of plant traits in variable environments. Funct. Plant Biol. 2009, 36, 665–681. [Google Scholar] [CrossRef]
  5. Ahmed, F.; Rafii, M.Y.; Ismail, M.R.; Juraimi, A.S.; Rahim, H.A.; Asfaliza, R.A.; Latif, M.A. Waterlogging tolerance of crops: Breeding, mechanism of tolerance, molecular approaches, and future prospects. BioMed. Res. Int. 2013. [Google Scholar] [CrossRef]
  6. Garthwaite, A.J.; von Bothmer, R.; Colmer, T.D. Diversity in root aeration traits associated with waterlogging tolerance in the genus Hordeum. Funct. Plant Biol. 2003, 30, 875–889. [Google Scholar] [CrossRef]
  7. Pang, J.Y.; Zhou, M.X.; Mendham, N.; Shabala, S. Growth and physiological responses of six barley genotypes to waterlogging and subsequent recovery. Aust. J. Agric. Res. 2004, 55, 895–906. [Google Scholar] [CrossRef]
  8. Malik, A.I.; Islam, A.K.M. R.; Colmer, T.D. Transfer of the barrier to radial oxygen loss in roots of Hordeum marinum to wheat (Triticum aestivum): Evaluation of four H-marinum-wheat amphiploids. New Phytol. 2011, 190, 499–508. [Google Scholar] [CrossRef]
  9. Malik, A.I.; Colmer, T.D.; Lambers, T.L.; Setter, H.T.L.; Schortemeyer, M. Short-term waterlogging has long-term effects on the growth and physiology of wheat. New Phytol. 2002, 153, 225–236. [Google Scholar] [CrossRef]
  10. Takeda, K.; Fukuyama, T. Tolerance to pre-germination flooding in the world collection of barley varieties. Barley Genet. 1987, V, 735–740. [Google Scholar]
  11. Hamachi, Y.; Yoshino, M.; Furusho, M.; Yoshida, T. Index of screening for wet endurance in malting barley. Jpn J. Breed. 1990, 40, 361–366. [Google Scholar]
  12. Li, H.; Vaillancourt, R.; Mendham, N.; Zhou, M. Comparative mapping of quantitative trait loci associated with waterlogging tolerance in barley (Hordeum vulgare L.). BMC Genomics 2008, 9, 401. [Google Scholar]
  13. Striker, G. Visiting the methodological aspects of flooding experiments: Quantitative evidence from agricultural and ecophysiological studies. J. Agron. Crop Sci. 2008, 194, 249–255. [Google Scholar] [CrossRef]
  14. Qiu, F.Z.; Zheng, Z.L.; Xu, S.Z. Mapping of QTL associated with waterlogging tolerance during the seedling stage in maize. Ann. Bot. 2007, 99, 1067–108. [Google Scholar] [CrossRef]
  15. Maxwell, K.; Johnson, G.N. Chlorophyll fluorescence—A practical guide. J. Exp. Bot. 2000, 51, 659–668. [Google Scholar] [CrossRef]
  16. Else, M.A.; JJanowiak, F.; Atkinson, C.J.; Jackson, M.B. Root signals and stomatal closure in relation to photosynthesis, chlorophyll a fluorescence and adventitious rooting of flooded tomato plants. Ann. Bot. 2009, 103, 313–323. [Google Scholar]
  17. Bertholdsson, N.-O. Pre-studies of water- and drought tolerance in Barley. unpublished.
  18. Bertholdsson, N.-O.; Kolodinska Brantestam, A. Breeding for improved yield in Nordic barley germplasms and its effects on early vigour, straw length and harvest index. Eur. J. Agron. 2009, 30, 266–274. [Google Scholar] [CrossRef]
  19. Larsson, S. A simple, rapid and non-destructive method useful for drought resistance breeding in oats (Avena sativa L.). Zeitschrift für Pflanzenzüchtung 1982, 89, 206–221. [Google Scholar]
  20. Walz, H. Photosynthesis yield analyzer MINI-PAM. In Handbook of Operation, 2nd ed; Heinz Walz GmbH: Effeltrich, Germany, 1999. [Google Scholar]
  21. Arbona, V.; López-Climent, M.F.; Pérez-Clemente, R.M.; Gómez-Cadenas, A. Maintenance of a high photosynthetic performance is linked to flooding tolerance in citrus. Environ. Exp. Bot. 2009, 66, 135–142. [Google Scholar] [CrossRef]
  22. Smethurst, C.F.; Shabala, S. Screening methods for waterlogging tolerance in lucerne: Comparative analysis of waterlogging effects on chlorophyll fluorescence, photosynthesis, biomass and chlorophyll content. Funct. Plant Biol. 2003, 30, 335–343. [Google Scholar] [CrossRef]
  23. Hague, M.E.; Oyanagi, A.; Kawaguchi, K. Aerenchyma formation in the seminal roots of Japanese wheat cultivars in relatin to growth under waterlogged conditions. Plant Product. Sci. 2012, 15, 164–173. [Google Scholar] [CrossRef]
  24. Vartapetian, B. Plant anaerobic stress as a novel trend in ecological physiology, biochemistry, and molecular biology: 2. Further development of the problem. Russian J. Plant Physiol. 2006, 53, 711–738. [Google Scholar] [CrossRef]
  25. Lynch, J.P. Roots of the second green revolution. Aust. J. Bot. 2007, 55, 493–512. [Google Scholar] [CrossRef]
  26. Xue, D.; Zhou, M.; Zhang, X.; Chen, S.; Wie, K.; Chen, S.; Wie, K.; Zeng, F.; Mao, Y.; Wu, F.; Zhang, G. Identification of QTLs for yield and yield components of barley under different growth conditions. J. Zhejiang Univ. Sci. B. 2011, 11, 169–176. [Google Scholar]
  27. Zhou, M. Accurate phenotyping reveals better QTL for waterlogging tolerance in barley. Plant Breed. 2011, 130, 203–208. [Google Scholar] [CrossRef]

