Root Characteristics of Perennial Warm-Season Grasslands Managed for Grazing and Biomass Production


Abstract
:1. Introduction
2. Materials and Methods

| Depth (cm) | pH | Sand | Silt | Clay | Texture | SBD, Grazed | SBD, Exclosure |
|---|---|---|---|---|---|---|---|
| 0–5 | 6.08 | 51.2 | 31.1 | 17.8 | Loam | 1.00 | 1.01 |
| 5–10 | 6.10 | 46.7 | 34.9 | 18.5 | Loam | 1.38 | 1.48 |
| 10–20 | 6.31 | 47.2 | 32.9 | 20.0 | Loam | 1.34 | 1.37 |
| 20–30 | 6.50 | 41.2 | 35.6 | 23.3 | Loam | 1.48 | 1.51 |
| 30–40 | 6.52 | 38.7 | 34.4 | 27.0 | Clay Loam | 1.51 | 1.42 |
2.1. Vegetation
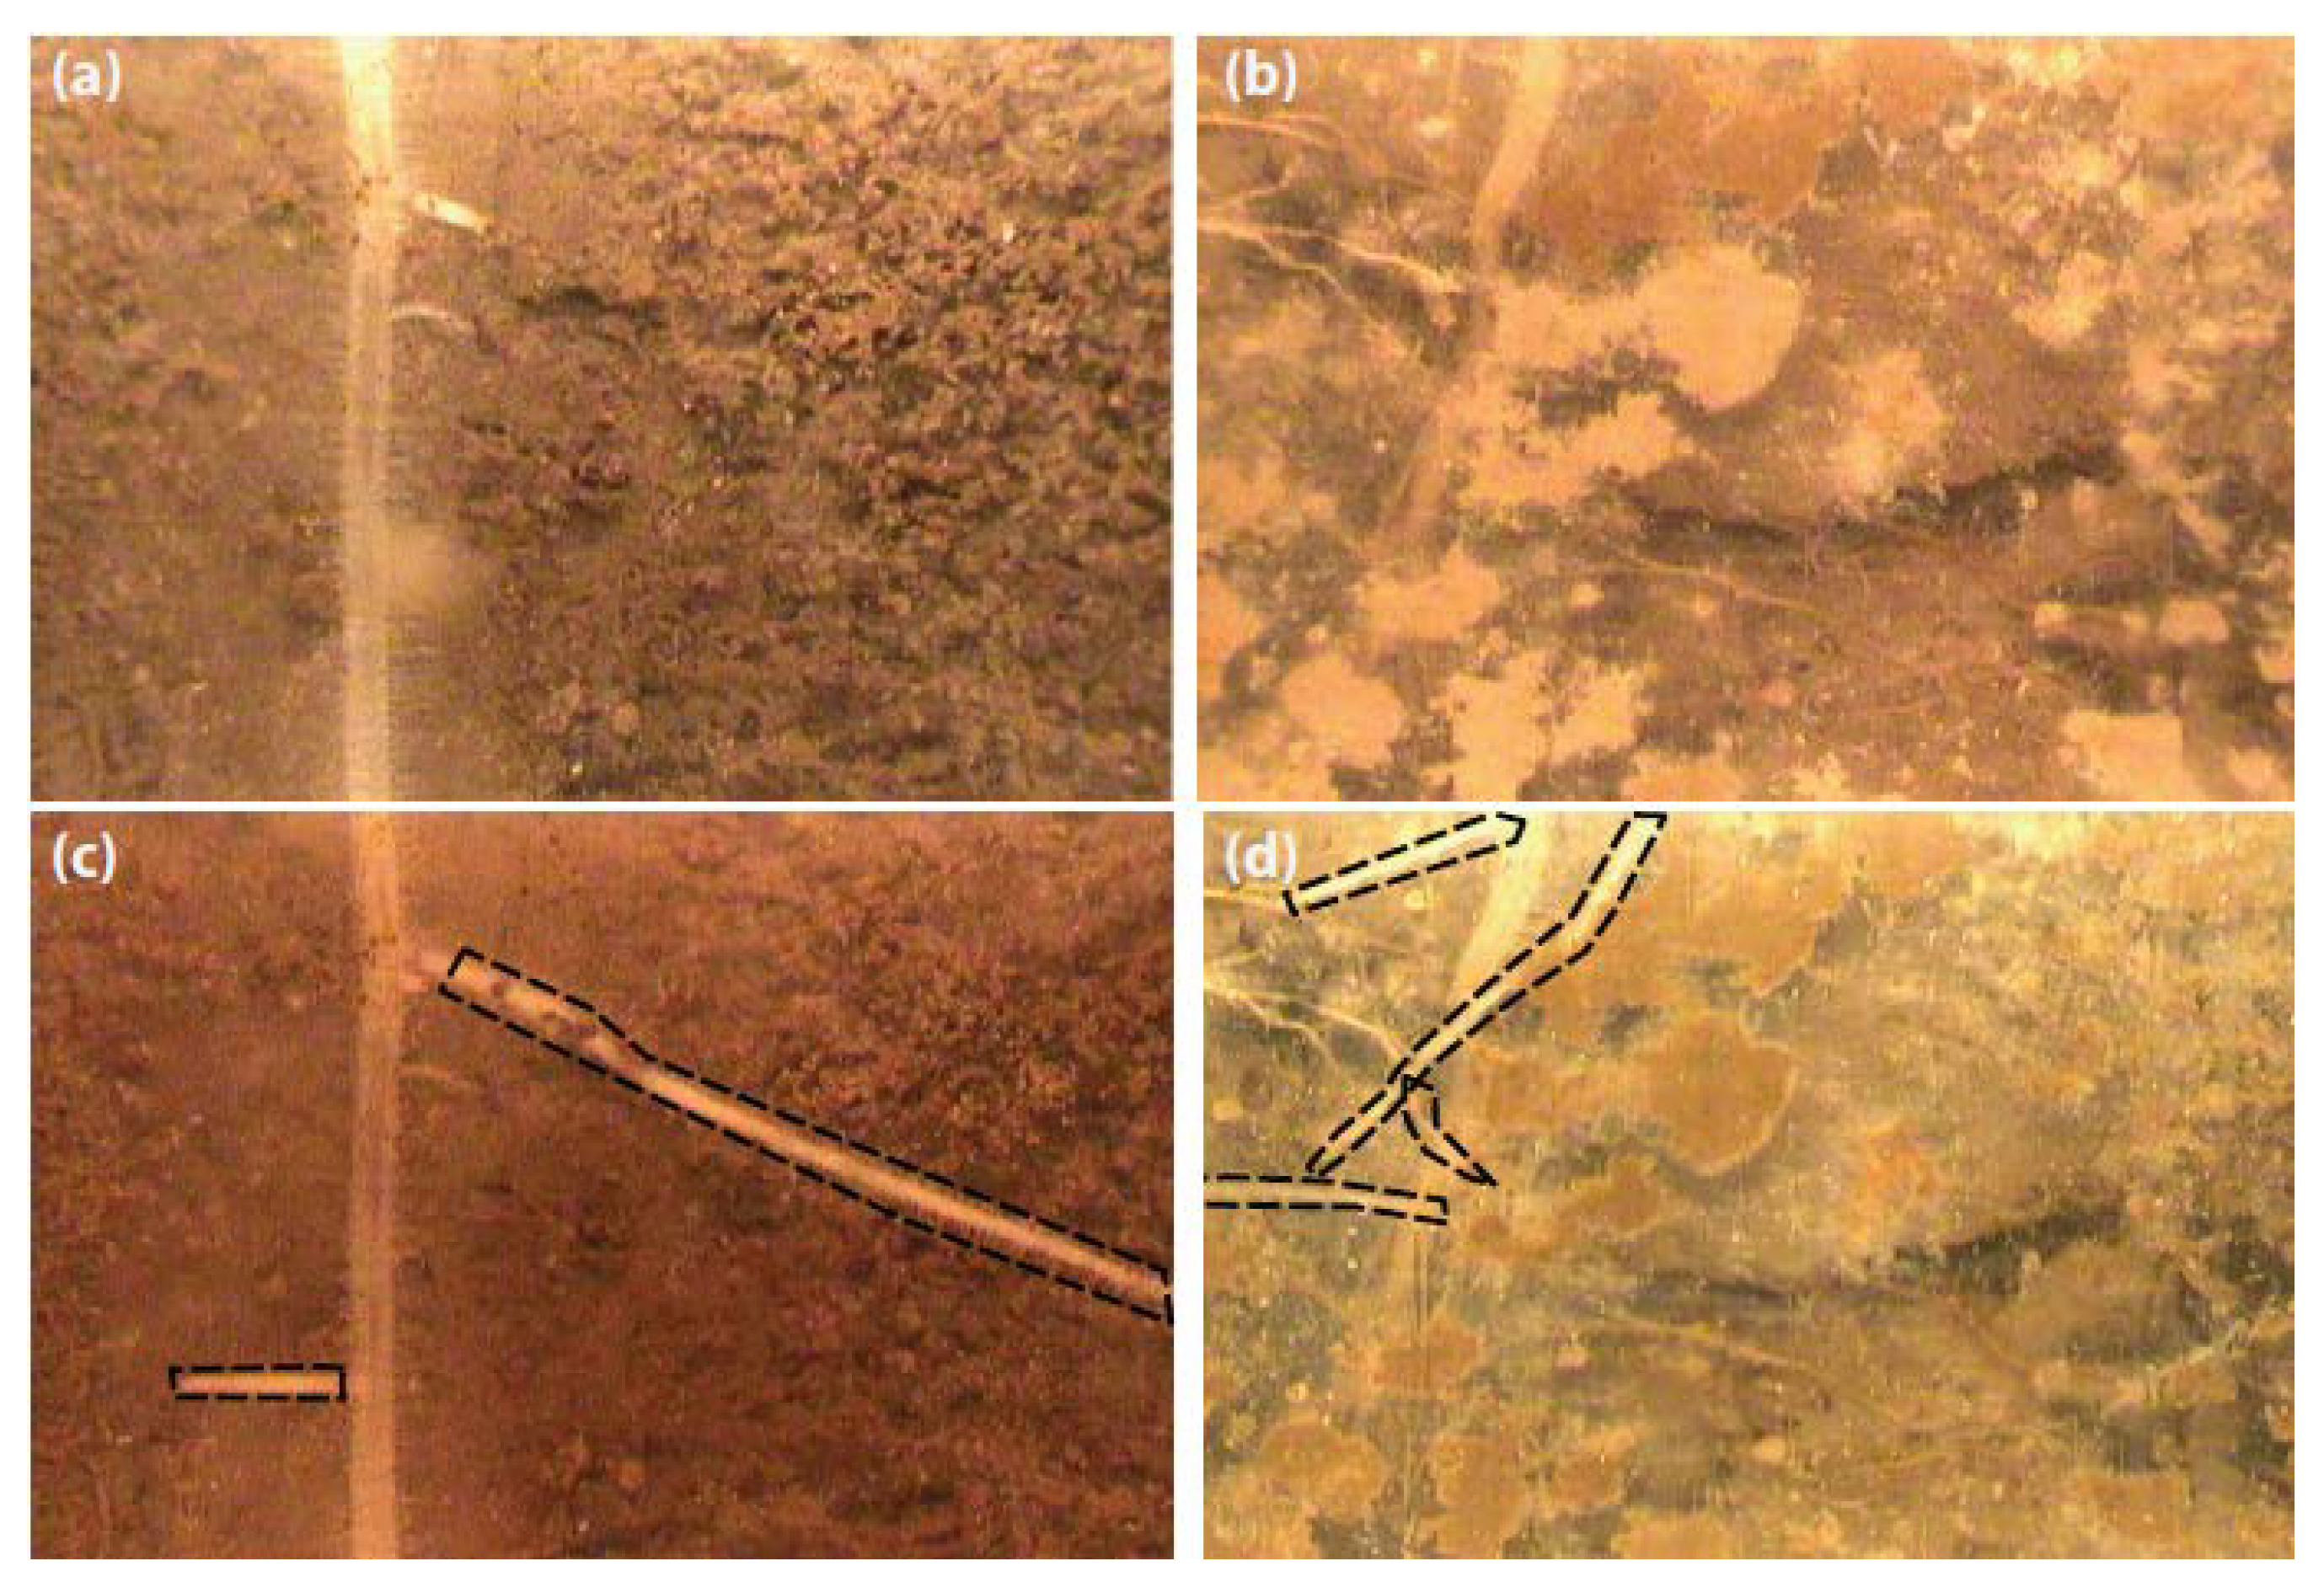
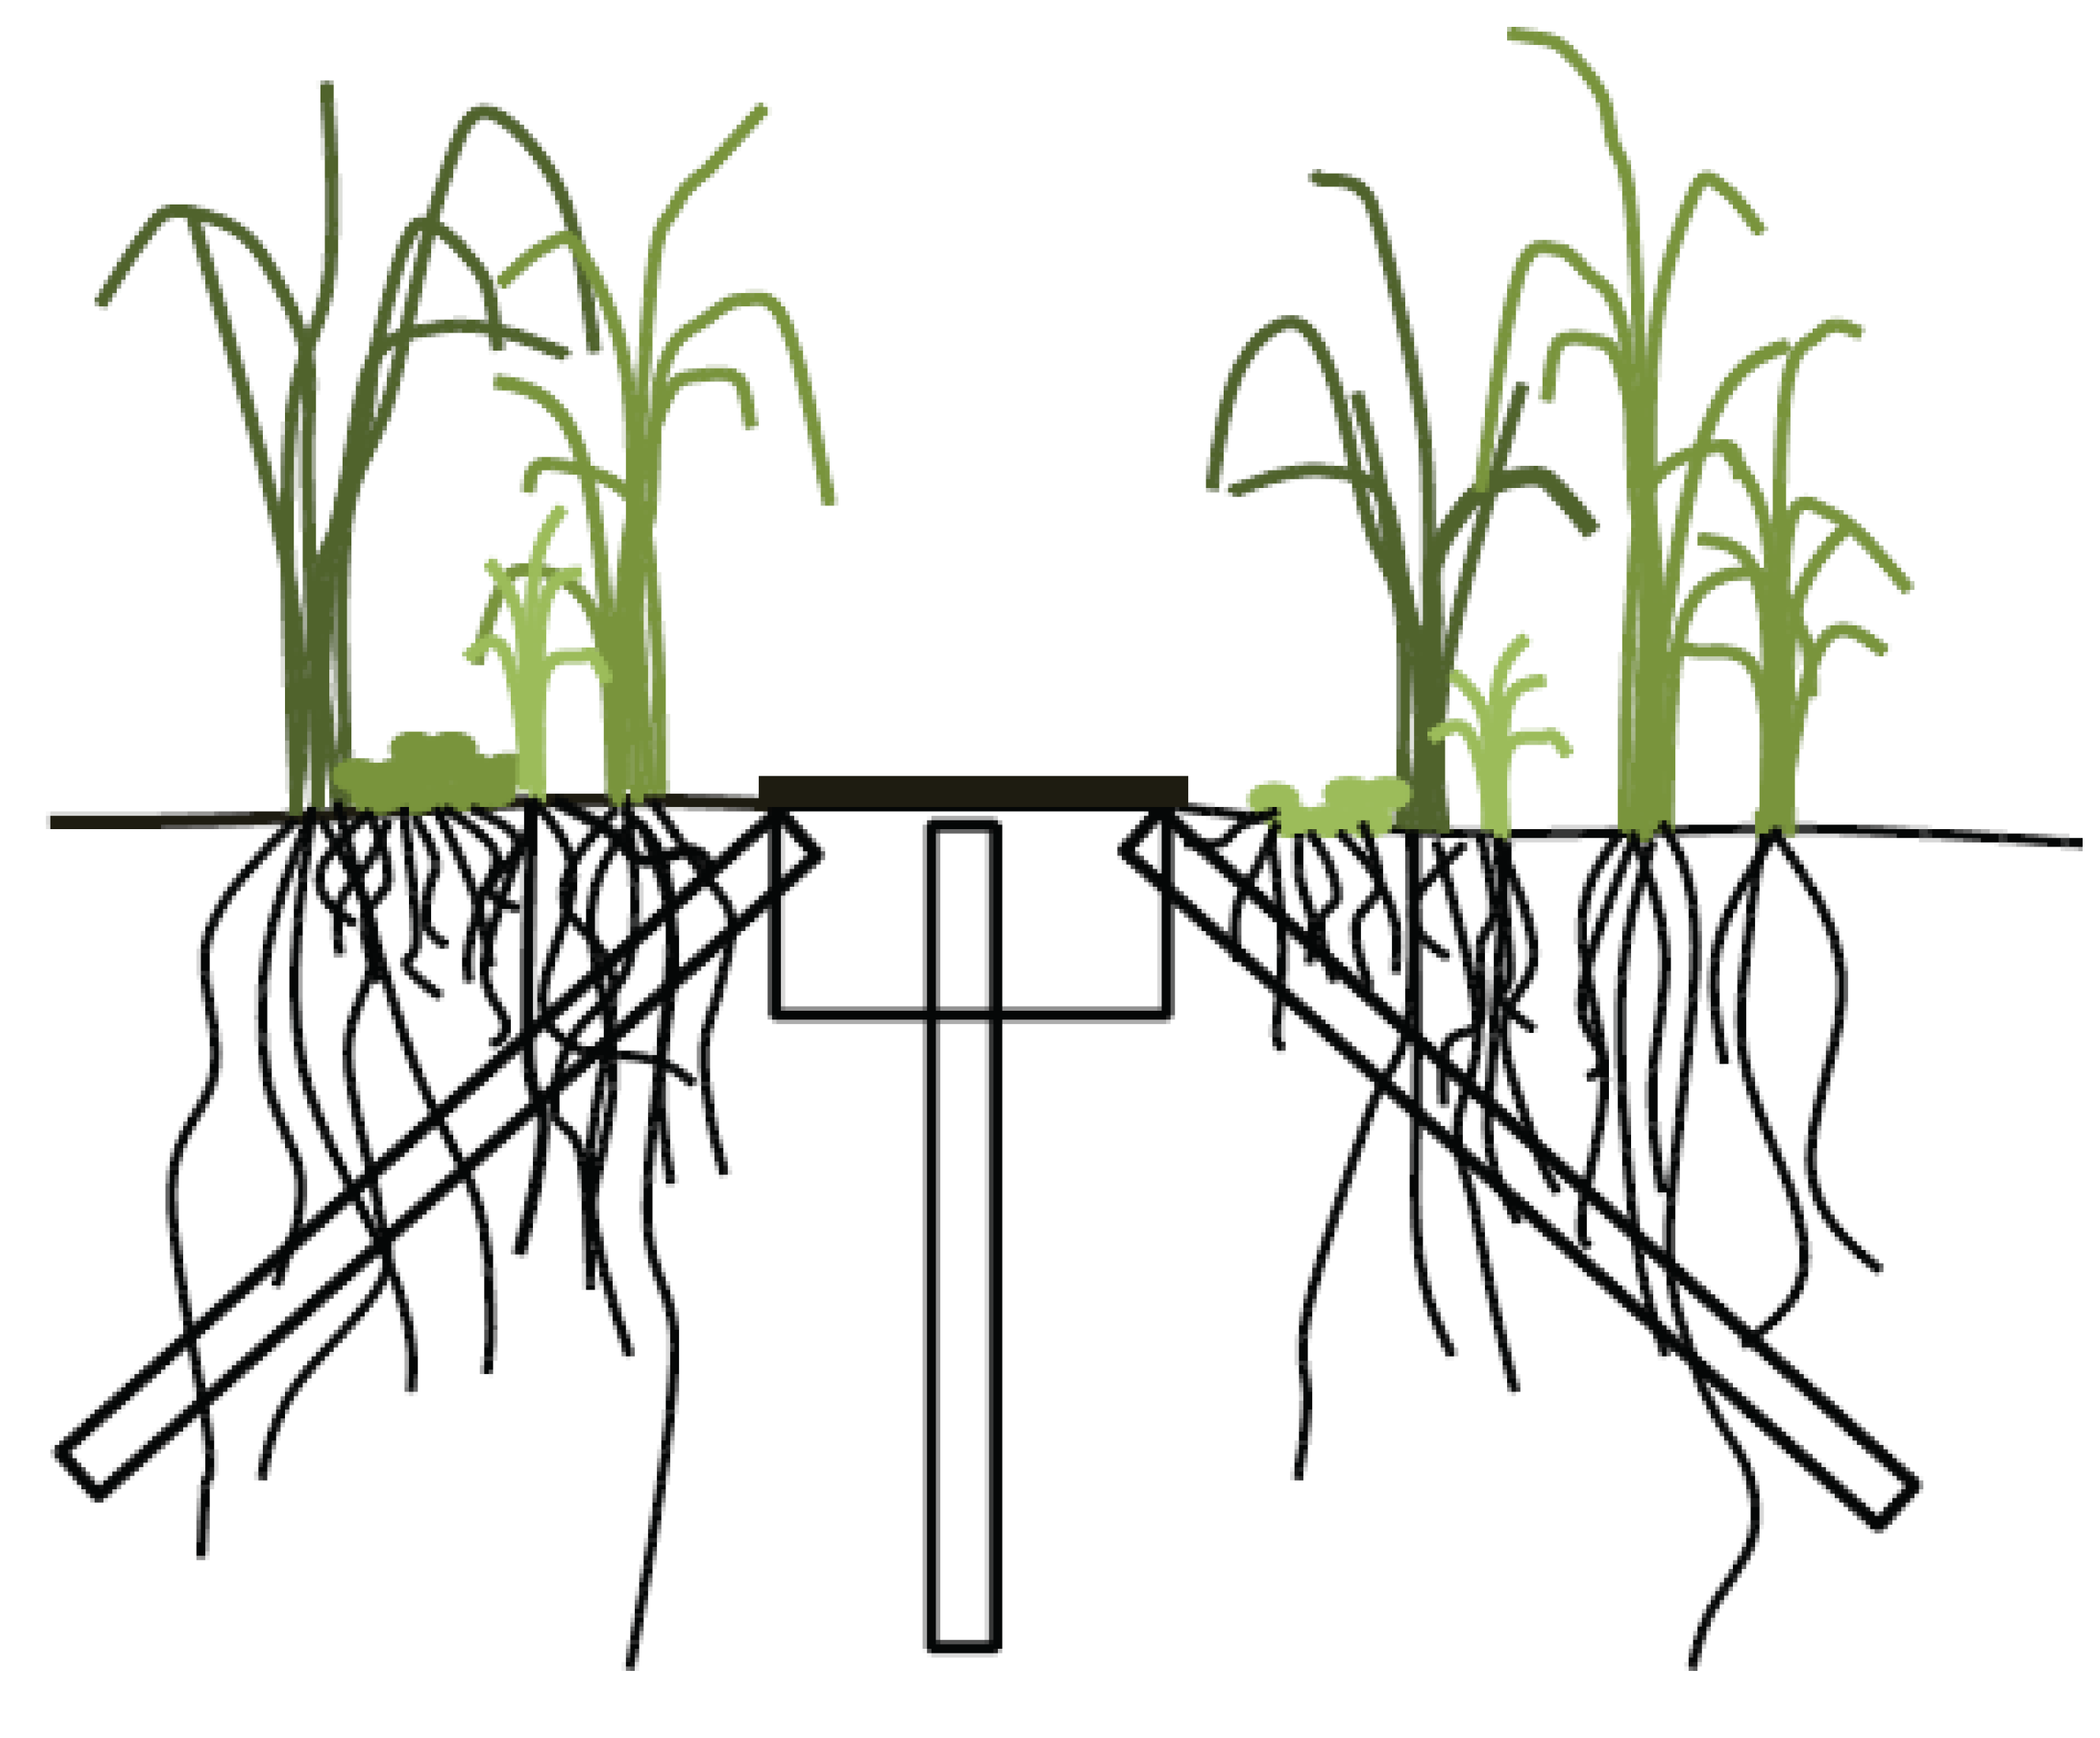
2.2. Minirhizotron Installation and Image Capture

2.3. Data Analysis
3. Results
3.1. Weather
| Historic Averages | 2008 | 2009 | 2010 | 2011 | 2012 | |||||||
|---|---|---|---|---|---|---|---|---|---|---|---|---|
| Month | Temp † (°C) | Precip (cm) | Temp (°C) | Precip (cm) | Temp (°C) | Precip (cm) | Temp (°C) | Precip (cm) | Temp (°C) | Precip (cm) | Temp (°C) | Precip (cm) |
| March | 5.7 | 8.5 | 6.7 | 5.1 | 6.2 | 8.6 | 6.5 | 6.5 | 6.3 | 11.7 | 10.7 | 7.2 |
| April | 10.6 | 7.8 | 11.6 | 9.7 | 11.5 | 6.8 | 12.8 | 3.4 | 13.1 | 12.8 | 11.9 | 7.8 |
| May | 15.6 | 10.2 | 15.0 | 5.3 | 16.4 | 18.9 | 17.6 | 6.3 | 16.5 | 16.1 | 18.1 | 8.7 |
| June | 19.7 | 10.0 | 20.9 | 5.6 | 20.9 | 9.2 | 22.6 | 3.7 | 21.5 | 2.7 | 20.1 | 5.4 |
| July | 21.9 | 9.4 | 21.2 | 14.1 | 20.2 | 9.4 | 23.6 | 6.1 | 23.5 | 11.2 | 23.5 | 9.9 |
| August | 21.2 | 7.2 | 19.7 | 7.1 | 21.4 | 7.4 | 22.9 | 8.8 | 22.0 | 4.4 | 21.3 | 7.2 |
| September | 17.7 | 7.9 | 18.0 | 3.4 | 17.4 | 6.9 | 18.5 | 8.3 | 17.9 | 10.3 | 17.3 | 7.3 |
| Aver Temp | 16.1 | -- | 16.2 | -- | 16.3 | -- | 17.8 | -- | 17.3 | -- | 17.6 | -- |
| Total Precip | -- | 61.0 | -- | 50.3 | -- | 67.2 | -- | 43.1 | -- | 69.2 | -- | 53.5 |
3.2. Vegetation
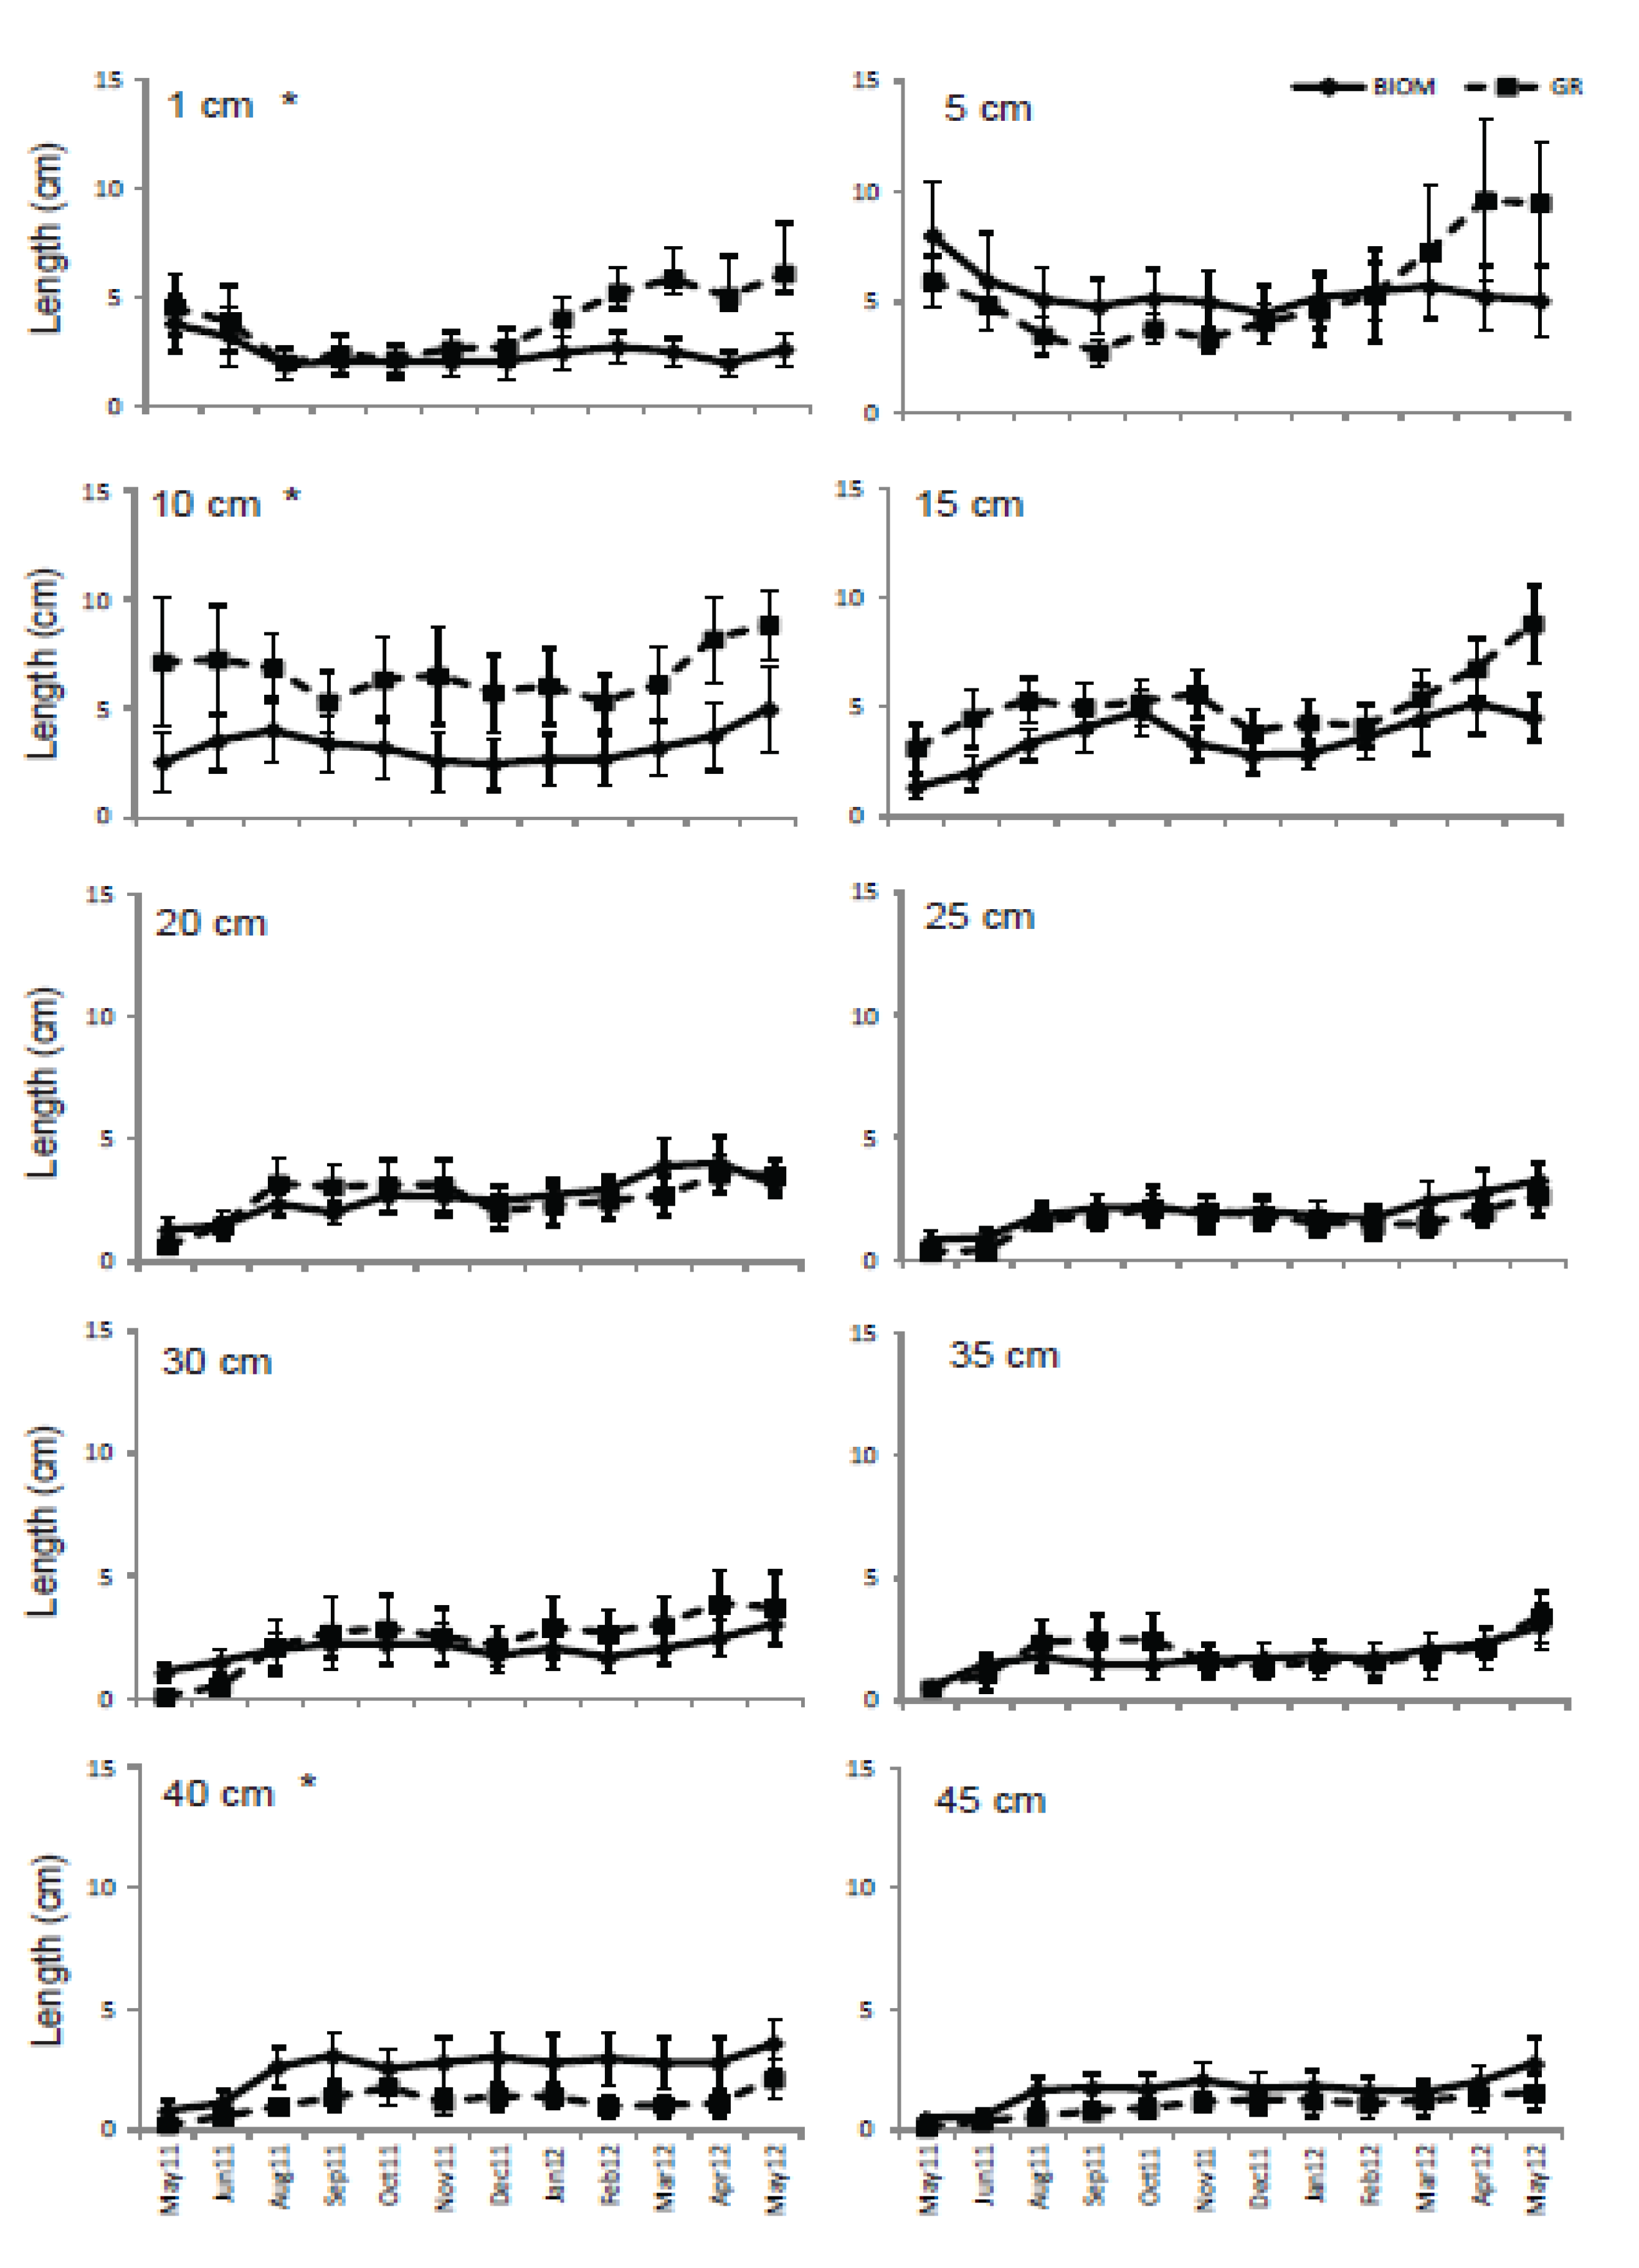
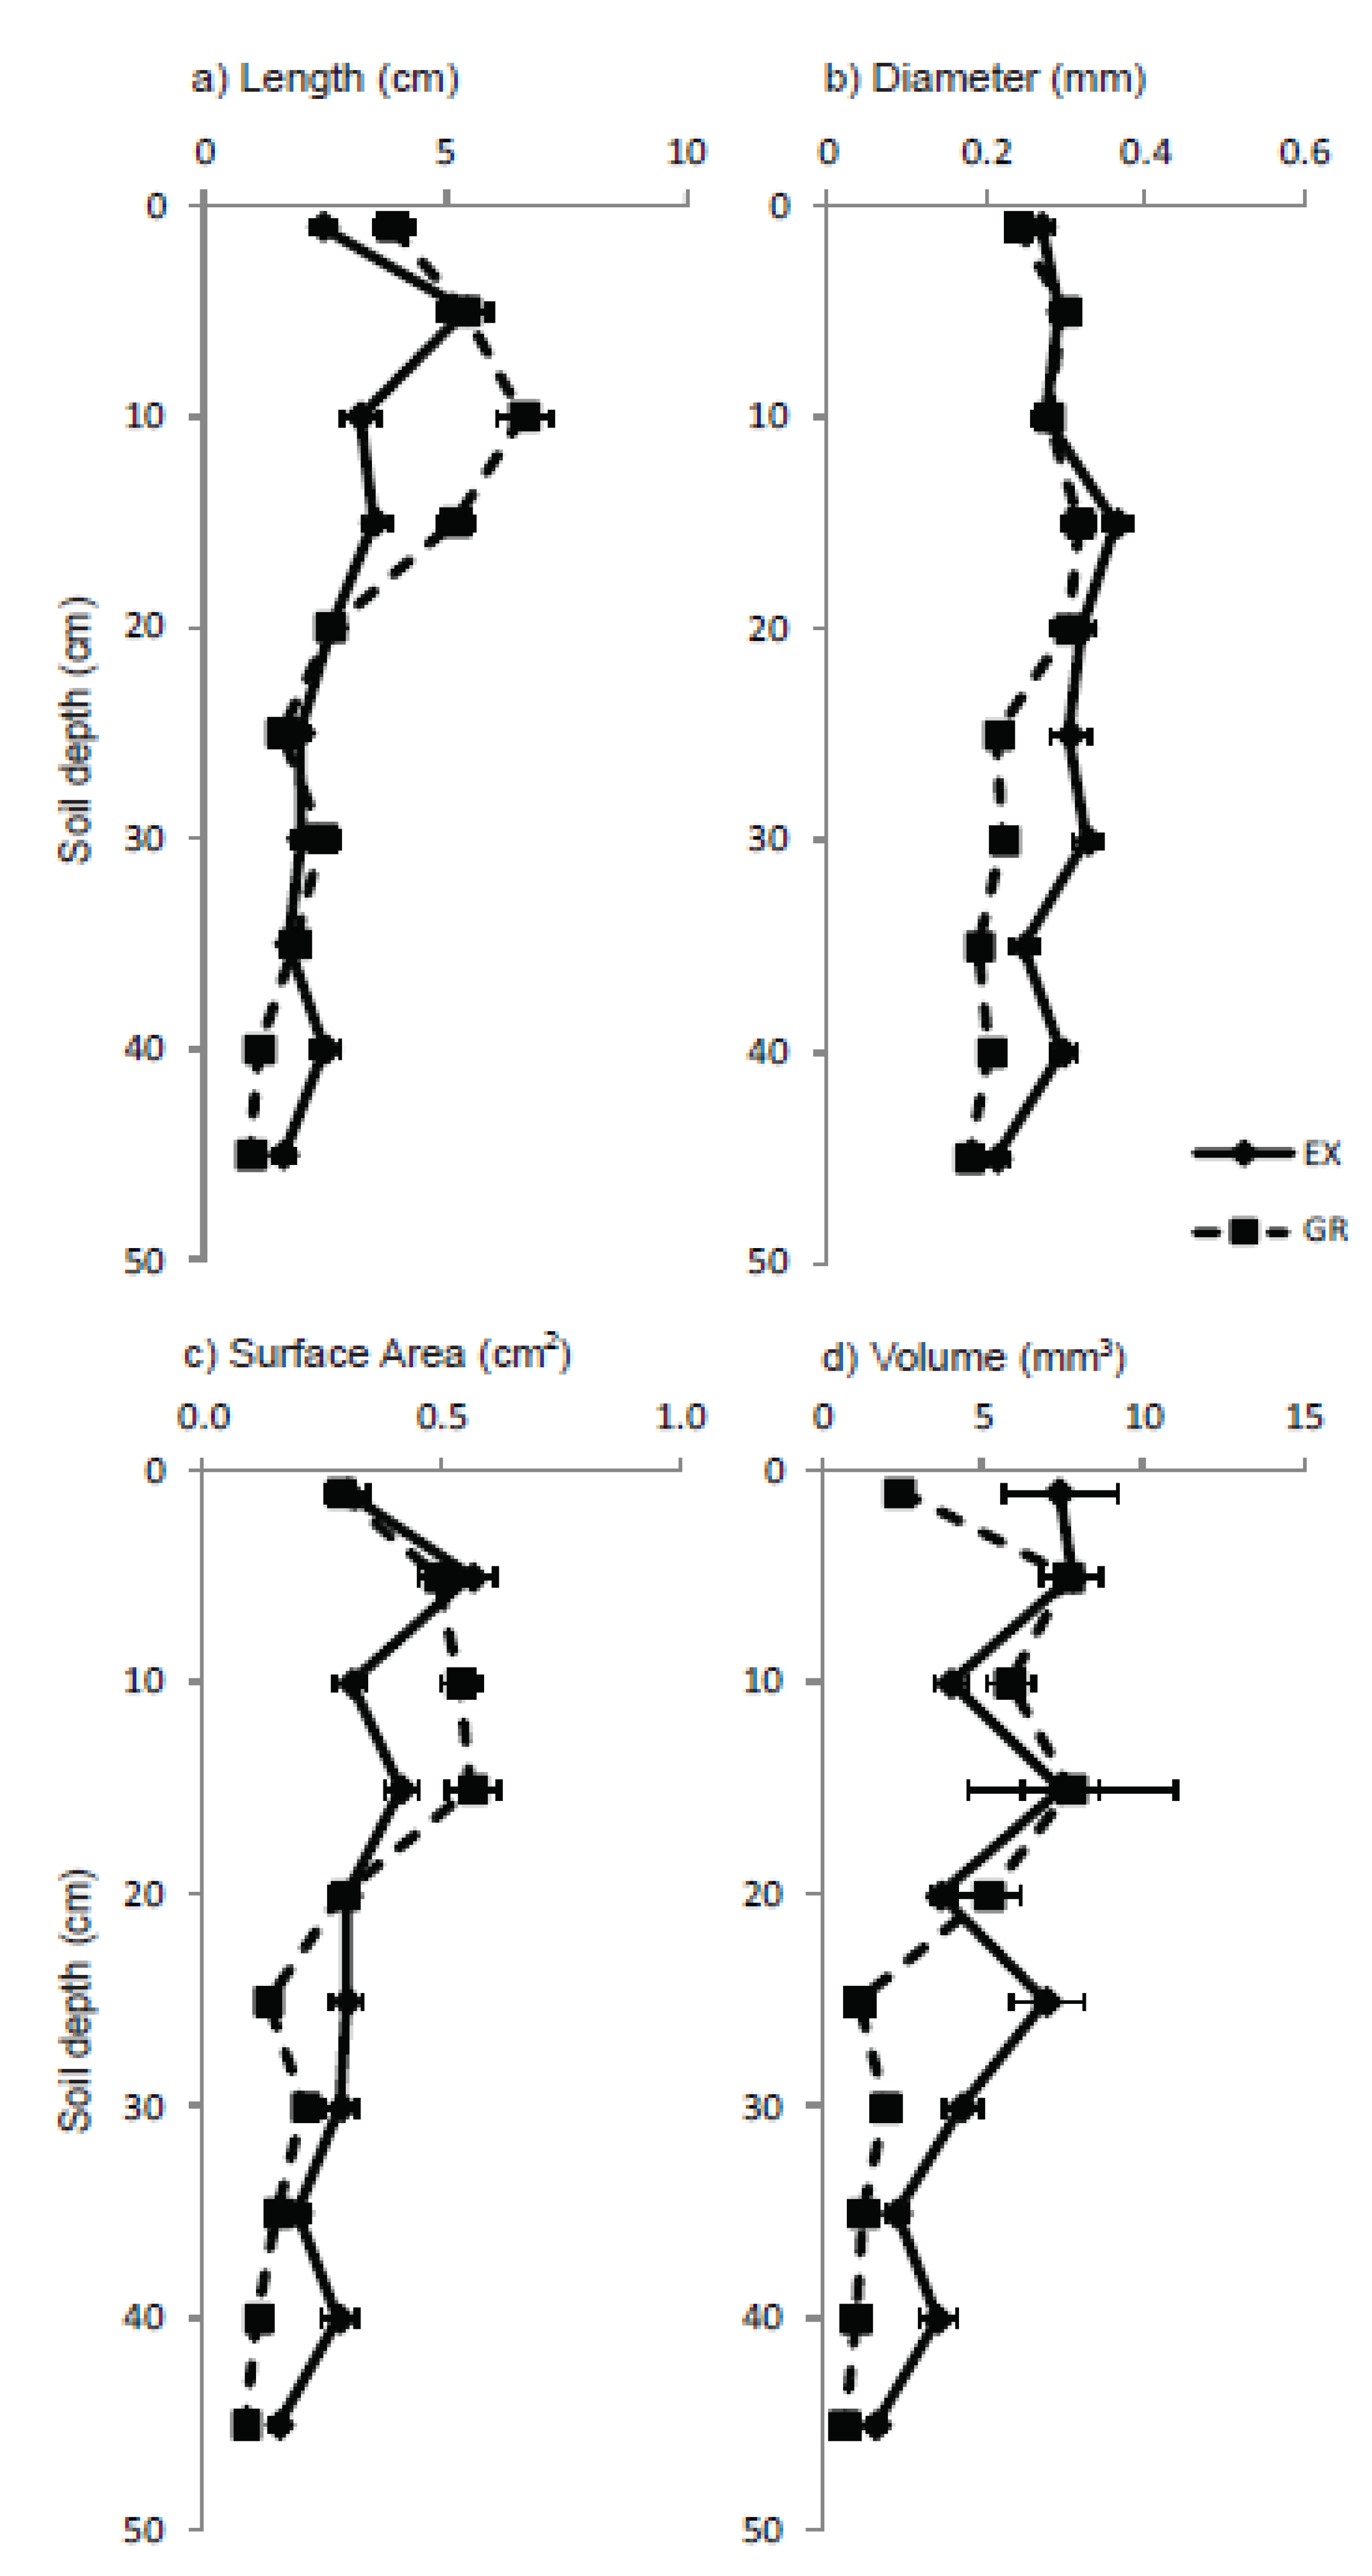
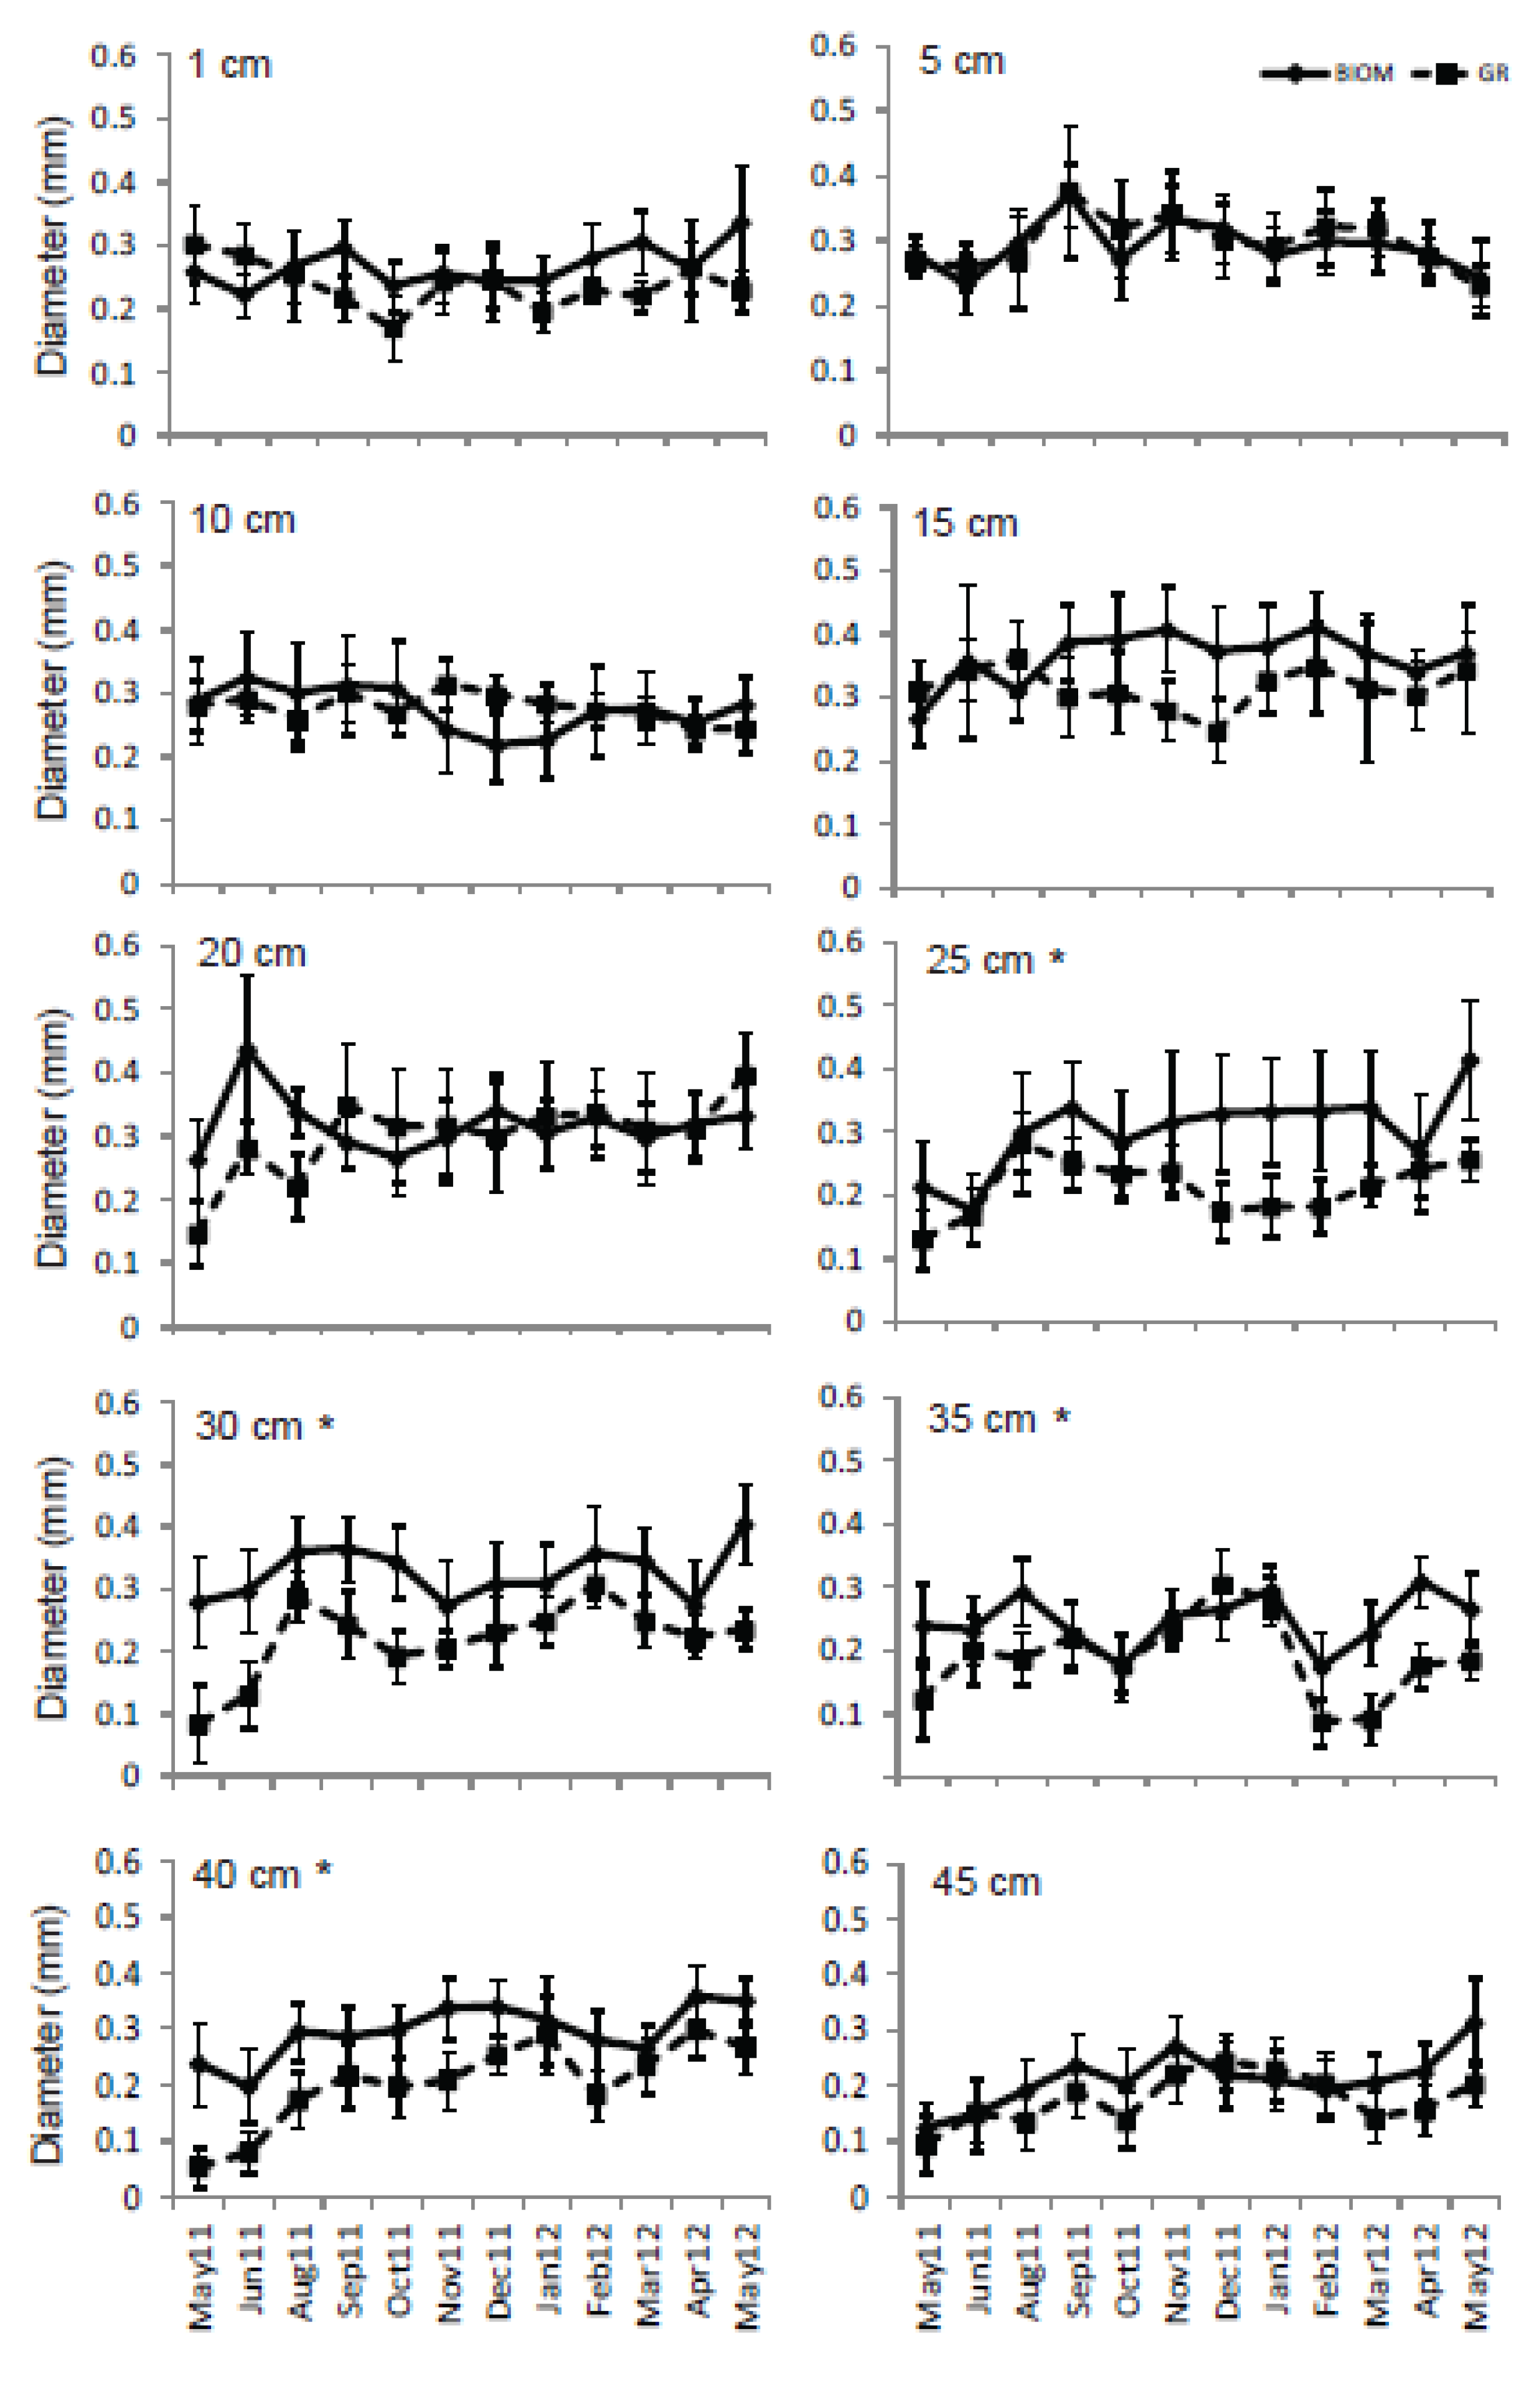
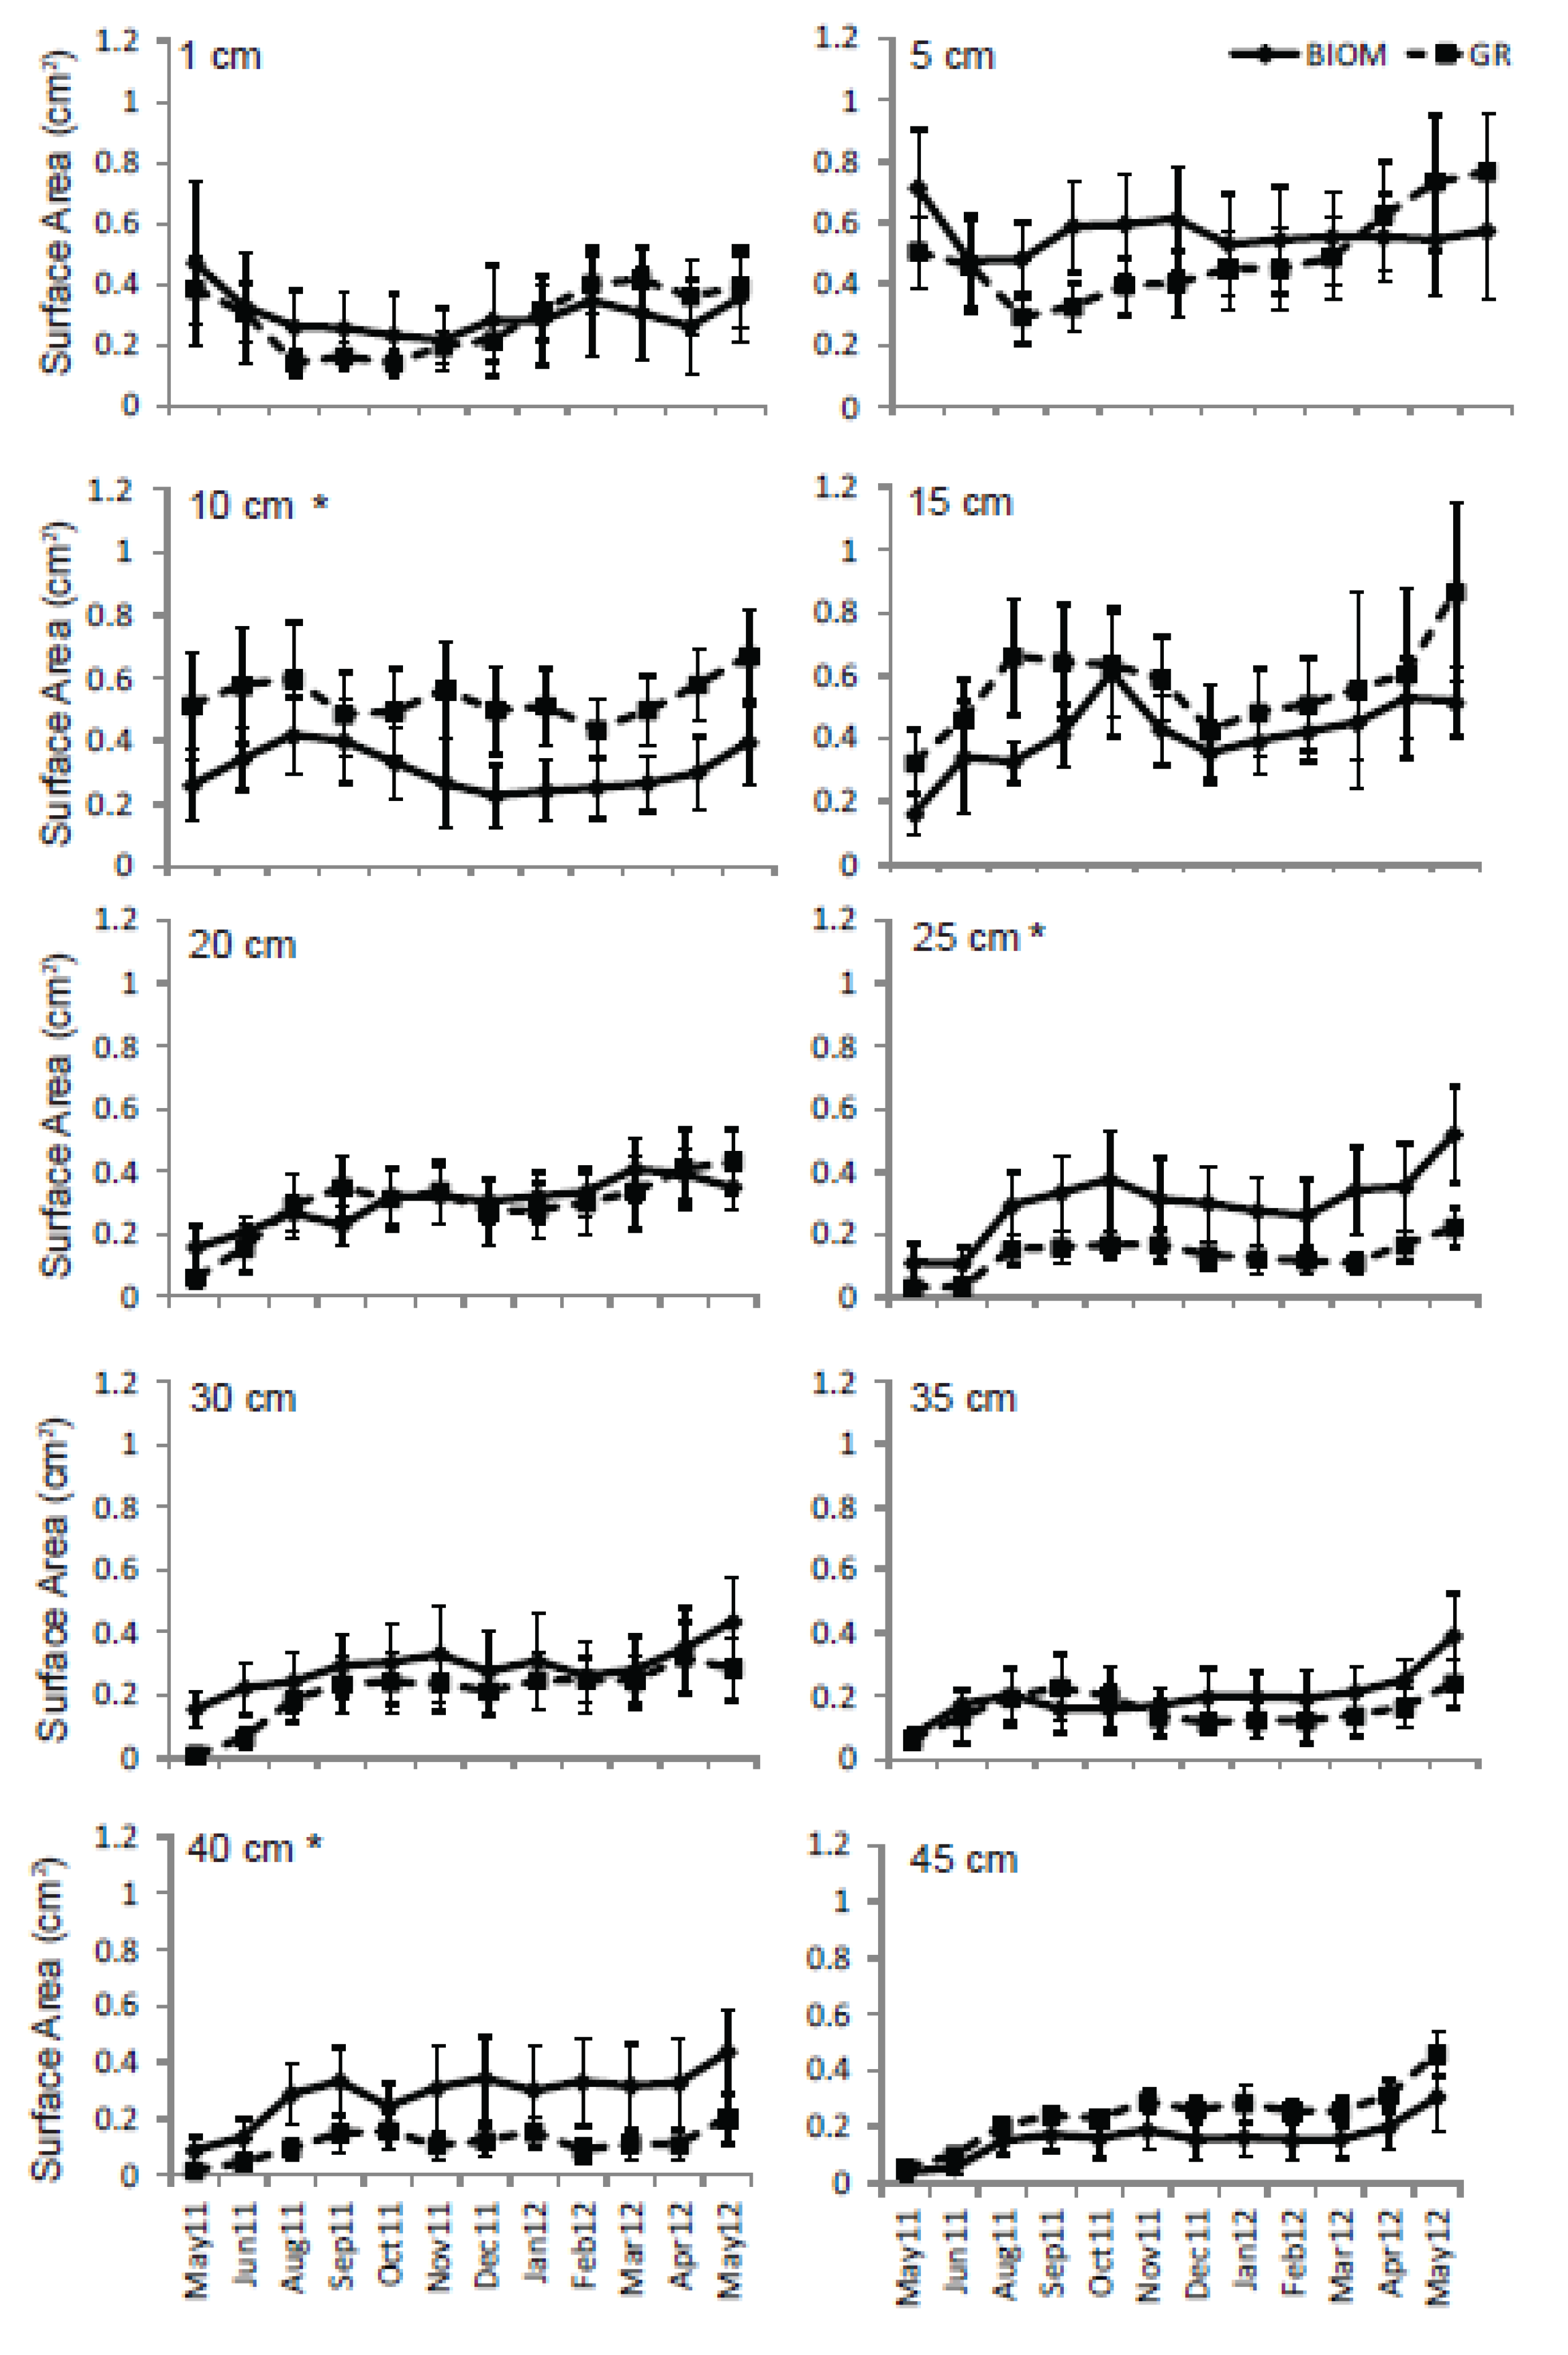
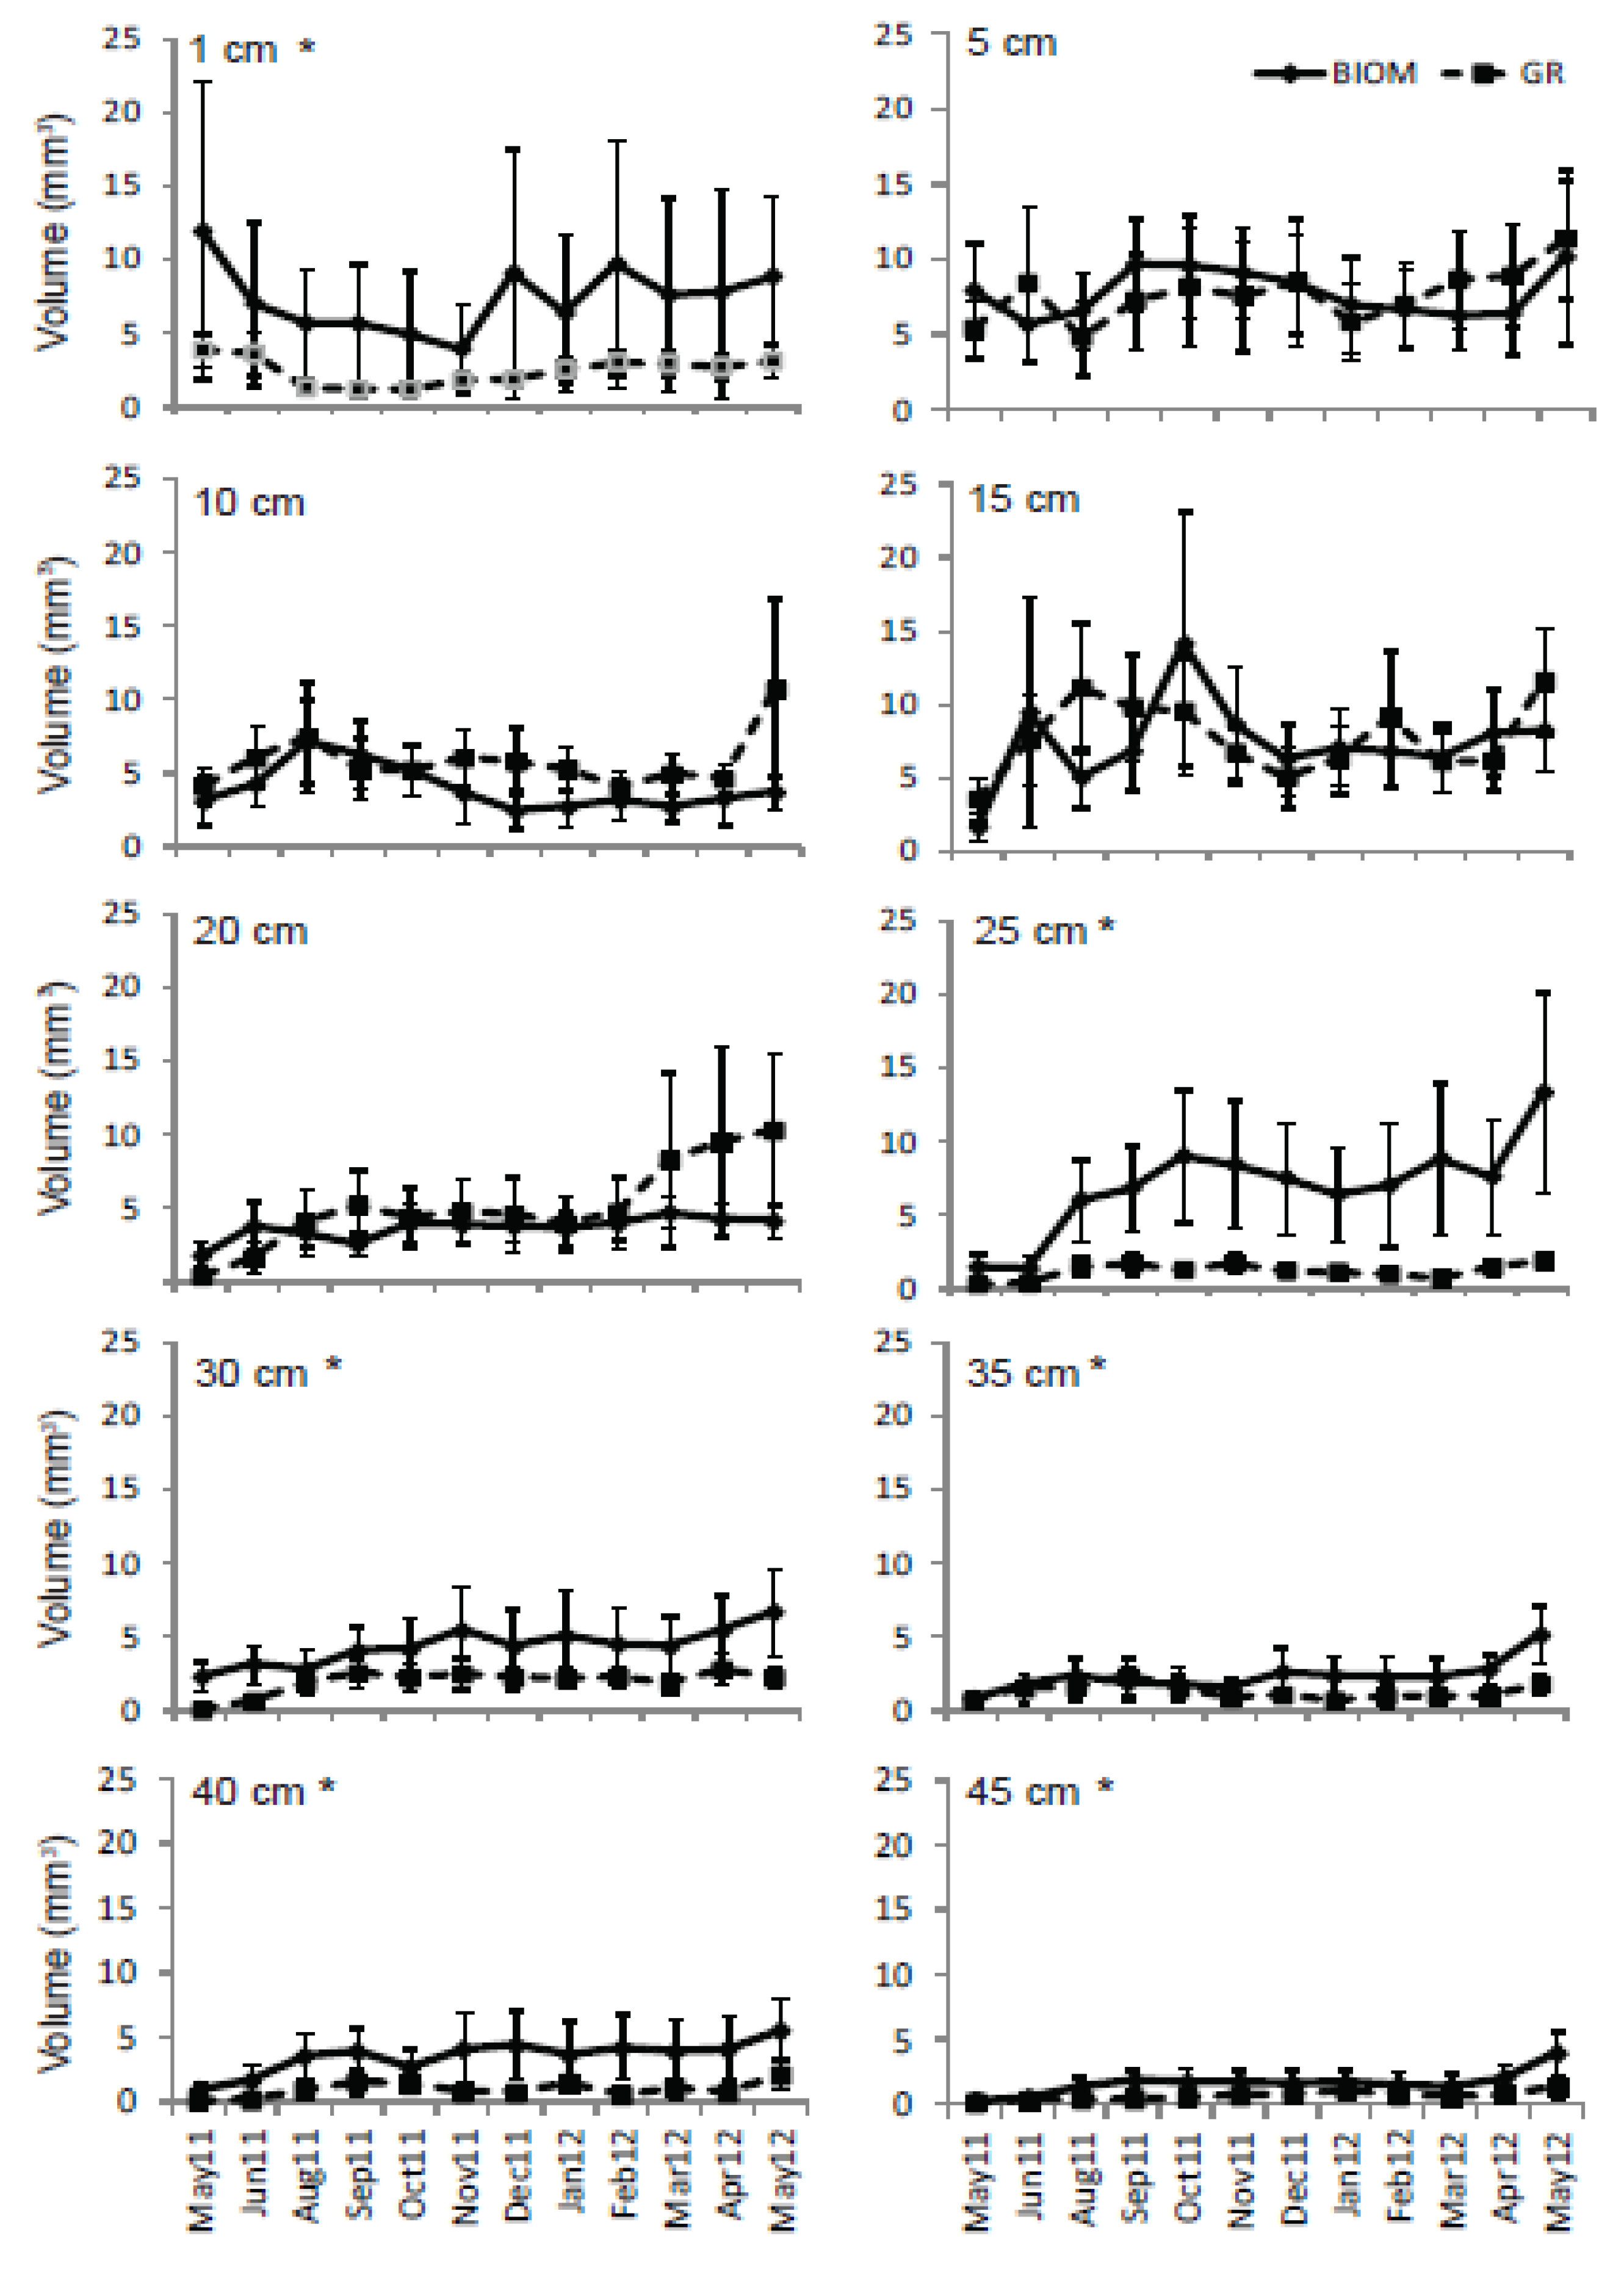
3.3. Roots

4. Discussion
5. Conclusions
Acknowledgements
Conflict of Interest
References
- Jackson, R.; Canadell, J.; Ehleringer, J.; Mooney, H.; Sala, O.; Schulze, E. A global analysis of root distributions for terrestrial biomes. Oecologia 1996, 108, 389–411. [Google Scholar] [CrossRef]
- Jobbágy, E.G.; Jackson, R.B. The vertical distribution of soil organic carbon and its relation to climate and vegetation. Ecol. Appl. 2000, 10, 423–436. [Google Scholar] [CrossRef]
- Davis, S.C.; Anderson-Teixeira, K.J.; DeLucia, E.H. Life-cycle analysis and the ecology of biofuels. Trends Plant Sci. 2009, 14, 140–146. [Google Scholar] [CrossRef]
- Liebig, M.A.; Johnson, H.A.; Hanson, J.D.; Frank, A.B. Soil carbon under switchgrass stands and cultivated cropland. Biomass Bioenergy 2005, 28, 347–354. [Google Scholar] [CrossRef]
- Tracy, B.F.; Maughan, M.; Post, N.; Faulkner, D.B. Integrating annual and perennial warm-season grasses in a temperate grazing system. Crop Sci. 2010, 50, 2171–2177. [Google Scholar] [CrossRef]
- Reid, R.L.; Jung, G.A.; Allinson, D. Nutritive Quality of Warm Season Grasses in the Northeast; West Virginia University, Agricultural and Forestry Experiment Station: Morgantown, WV, USA, 1988. [Google Scholar]
- Detling, J.K.; Dyer, M.I.; Winn, D.T. Net photosynthesis, root respiration, and regrowth of Bouteloua gracilis following simulated grazing. Oecologia 1979, 41, 127–134. [Google Scholar] [CrossRef]
- Crider, F.J. Root-Growth Stoppage Resulting from Defoliation of Grass; USDA Technical Bulletin No. 1102; USDA: Washington, WA, USA, 1955.
- Schuster, J.L. Root development of native plants under three grazing intensities. Ecology 1964, 45, 63–70. [Google Scholar] [CrossRef]
- Milchunas, D.G.; Lauenroth, W.K. Quantitative effects of grazing on vegetation and soils over a global range of environments. Ecol. Monogr. 1993, 63, 327–366. [Google Scholar] [CrossRef]
- McNaughton, S.; Banyikwa, F.; McNaughton, M. Root biomass and productivity in a grazing ecosystem: The Serengeti. Ecology 1998, 79, 587–592. [Google Scholar] [CrossRef]
- Frank, D.; Kuns, M.; Guido, D. Consumer control of grassland plant production. Ecology 2002, 83, 602–606. [Google Scholar] [CrossRef]
- Dunn, J.H.; Engel, R.E. Effect of defoliation and root-pruning on early root growth from Merion Kentucky bluegrass sods and seedlings. Agron. J. 1971, 63, 659–663. [Google Scholar] [CrossRef]
- Schuman, G.E.; Reeder, J.D.; Manley, J.T.; Hart, R.H.; Manley, W.A. Impact of grazing management on the carbon and nitrogen balance of a mixed-grass rangeland. Ecol. Appl. 1999, 9, 65–71. [Google Scholar] [CrossRef]
- Bai, Y.; Wu, J.; Clark, C.M.; Pan, Q.; Zhang, L.; Chen, S.; Wang, Q.; Han, X. Grazing alters ecosystem functioning and C:N:P stoichiometry of grasslands along a regional precipitation gradient. J. Appl. Ecol. 2012, 49, 1204–1215. [Google Scholar] [CrossRef]
- Kitchen, D.J.; Blair, J.M.; Callaham, M.A., Jr. Annual fire and mowing alter biomass, depth distribution, and C and N content of roots and soil in tallgrass prairie. Plant Soil 2009, 323, 235–247. [Google Scholar] [CrossRef]
- Pucheta, E.; Bonamici, I.; Cabido, M.; Diaz, S. Below-ground biomass and productivity of a grazed site and a neighbouring ungrazed exclosure in a grassland in central Argentina. Austral Ecol. 2004, 29, 201–208. [Google Scholar] [CrossRef]
- Gill, R.; Burke, I.; Lauenroth, W.; Milchunas, D. Longevity and turnover of roots in the shortgrass steppe: Influence of diameter and depth. Plant Ecol. 2002, 159, 241–251. [Google Scholar] [CrossRef]
- Tjoelker, M.G.; Craine, J.M.; Wedin, D.; Reich, P.B.; Tilman, D. Linking leaf and root trait syndromes among 39 grassland and savannah species. New Phytol. 2005, 167, 493–508. [Google Scholar] [CrossRef]
- Soil Survey Staff, United States Department of Agriculture. Official soil series descriptions. Available online: http://soils.usda.gov/technical/classification/osd/index.html (accessed on 17 December 2012).
- Johnson, M.G.; Tingey, D.T.; Phillips, D.L.; Storm, M.J. Advancing fine root research with minirhizotrons. Environ. Exp. Bot. 2001, 45, 263–289. [Google Scholar] [CrossRef]
- Jackson, R.B.; Mooney, H.A.; Schulze, E. A global budget for fine root biomass, surface area, and nutrient contents. Proc. Natl. Acad. Sci. USA 1997, 94, 7362–7366. [Google Scholar] [CrossRef]
- Greenwood, K.L.; Hutchinson, K.J. Root characteristics of temperate pasture in New South Wales after grazing at three stocking rates for 30 years. Grass Forage Sci. 1998, 53, 120–128. [Google Scholar]
- Oesterheld, M. Effect of defoliation intensity on aboveground and belowground relative growth rates. Oecologia 1992, 92, 313–316. [Google Scholar] [CrossRef]
- Høgh-Jensen, H.; Schjoerring, J.K. Rhizodeposition of nitrogen by red clover, white clover and ryegrass leys. Soil Biol. Biochem. 2001, 33, 439–448. [Google Scholar] [CrossRef]
- Weaver, J.E.; Darland, R.W. Soil-root relationships of certain native grasses in various soil types. Ecol. Monogr. 1949, 19, 303–338. [Google Scholar] [CrossRef]
- Frank, A.; Berdahl, J.; Hanson, J.; Liebig, M.; Johnson, H. Biomass and carbon partitioning in switchgrass. Crop Sci. 2004, 44, 1391–1396. [Google Scholar] [CrossRef]
- Skinner, R.H.; Comas, L.H. Root distribution of temperate forage species subjected to water and nitrogen stress. Crop Sci. 2010, 50, 2178–2185. [Google Scholar] [CrossRef]
- Mousel, E.M.; Schacht, W.H.; Zanner, C.W.; Moser, L.E. Effects of summer grazing strategies on organic reserves and root characteristics of big bluestem. Crop Sci. 2005, 45, 2008–2014. [Google Scholar] [CrossRef]
- Eissenstat, D.M. Costs and benefits of constructing roots of small diameter. J. Plant Nutr. 1992, 15, 763–782. [Google Scholar] [CrossRef]
- Picon-Cochard, C.; Pilon, R.; Tarroux, E.; Pagès, L.; Robertson, J.; Dawson, L. Effect of species, root branching order and season on the root traits of 13 perennial grass species. Plant Soil 2012, 353, 47–57. [Google Scholar] [CrossRef]
- McNaughton, S. Compensatory plant growth as a response to herbivory. Oikos 1983, 40, 329–336. [Google Scholar] [CrossRef]
© 2013 by the authors; licensee MDPI, Basel, Switzerland. This article is an open access article distributed under the terms and conditions of the Creative Commons Attribution license (http://creativecommons.org/licenses/by/3.0/).
Share and Cite
Bonin, C.; Flores, J.; Lal, R.; Tracy, B. Root Characteristics of Perennial Warm-Season Grasslands Managed for Grazing and Biomass Production. Agronomy 2013, 3, 508-523. https://doi.org/10.3390/agronomy3030508
Bonin C, Flores J, Lal R, Tracy B. Root Characteristics of Perennial Warm-Season Grasslands Managed for Grazing and Biomass Production. Agronomy. 2013; 3(3):508-523. https://doi.org/10.3390/agronomy3030508
Chicago/Turabian StyleBonin, Catherine, Joao Flores, Rattan Lal, and Benjamin Tracy. 2013. "Root Characteristics of Perennial Warm-Season Grasslands Managed for Grazing and Biomass Production" Agronomy 3, no. 3: 508-523. https://doi.org/10.3390/agronomy3030508