Data analysis determined the importance of grass, soil, stress, sand layering and time and their interactions (
Table 2) on RW, BD, SH,
Eh and NCPS. For all variables, first order interactions and the main effects showed a higher level of significance, with amendment and stress being notable (
Table 2). Repeated measure ANOVA showed that measurement date had significant effects only on
Eh, indicating that after one month of incubation, compaction no longer influenced root zone variables. Correlation between the last
Eh measurement and NCPS was significant (
p = 0.01). Low
Eh was associated with high NCPS. This relationship, although not strong (
R = −0.330) indicates that oxygen concentration was higher in treatments with lower NCPS.
3.1. Root Weight
There was a significant (
p = 0.002) interaction between grass and stress on RW (
Table 3), indicating significant variation among the grasses in their responses to the applied stresses. The highest RW of 0.512 kg/m
3 was obtained for SG for the LC stress. SG also had the highest RW values for the high compaction and drought stresses, which were statistically similar to ZG under waterlogging (WL), although the latter was higher. The data indicates that SG and ZG have a high tolerance to WL, consistent with the greater tolerance of warm-season turfgrasses to prolonged periods of waterlogging, which is associated with their anatomical and morphological adaptations [
37]. Low aeration associated with waterlogging may have induced the branching of roots and surface adventitious root formation [
38]. ZG had the lowest RW among the grasses, with a value of 0.026 kg/m
3 recorded under drought stress. However, BG appeared to be the most vulnerable to preconditioning stresses, recording the lowest RW among the other stresses. All turf grasses were susceptible to drought conditions, resulting in lower RW values. Increased soil strength, due to the dry conditions and other edaphic stresses, are likely to have been responsible for the reduced root biomass production by all three turfgrasses in Bengough
et al. [
13]. In evaluating commonly used turfgrasses for drought resistance, Carrow [
8] ranked Meyer ZG lowest, with very few roots below 10 cm. Tifway BG was ranked highest. Our study showed similar results between BG and SG, which indicates that SG has comparatively good drought tolerance. The superior performance of SG to tropical acid and heavy clay soils makes it a better choice for recreational turfs.
Table 3.
Turfgrass RW affected by applied stress.
Table 3.
Turfgrass RW affected by applied stress.
| Grass type | Drought | Waterlogging | High compaction | Low compaction | Grass means † | |
|---|
| ![Agronomy 04 00124 i002]() |
|---|
| Bermuda | 0.036 cd ‡ | 0.149 cd | 0.114 cd | 0.117 cd | 0.104 c | |
| Savannah | 0.040 cd | 0.355 b | 0.443 ab | 0.512 a | 0.338 a | |
| Zoysia | 0.026 d | 0.426 ab | 0.175 c | 0.161 cd | 0.197 b | |
| Stress means § | 0.034 b | 0.310 a | 0.244 a | 0.263 a | | |
The main effect of grass type was significant (
p < 0.001), with RW values for SG being the highest, followed by ZG and, then, BG, in that order. Morphological differences and physiological adaptations can mostly explain variability across grasses [
8]. While there was also a significant (
p = 0.05) main effect of stress on RW, only the drought treatment resulted in a significantly lower value compared to other stresses. While overall plant growth, including root development, is expected to be compromised in conditions of low soil moisture [
7,
8], similar responses were also expected for the compactive stresses. The results indicated that the level of compaction applied was not very influential on RW. For this study, moisture stress was more influential on RW. This result contrasts with Agnew and Carrow [
12], but the nature of the compaction and moisture stresses differed. Notably, the compaction treatment was stronger and intermittently applied for Agnew and Carrow [
12].
Table 4 shows that RW values among the grasses varied significantly (
p = 0.023), depending on the soil. The highest RW was observed for SG grown on Talparo, whilst the lowest was on Princes Town with BG. The RW values for SG were statistically similar for all four soils, ranging from 0.285–0.422 kg/m
3, whilst significant variation was observed for the other grasses. This suggests that root development in SG is less sensitive to soil stresses compared to other tropical turfgrasses. The SG used in this experiment is a common cultivar, whilst both the other grasses were hybrids. It may be that SG is less affected by available phosphorus in the root zone compared to the other grasses, which may also explain its superior performance under drought, where reduced phosphorus mobility and availability to plants would have likely been exaggerated [
39]. ZG had the second highest RW in the Piarco soil, which was significantly higher than in the other soils. Both ZG and BG recorded extremely low RD values in the two clay soils (Princes Town and Talparo soils), which is largely related to their limited adaptability to heavy soils with adverse physical conditions. Both these clay soils are noted to have vertic properties and high phosphorus fixing capabilities [
40], which may have contributed to reducing root growth and development under the applied stresses. The higher root density for Piarco is attributed to its physical condition; being of coarser texture (
Table 1), it imparts fewer restrictions on root growth. Juska (1959), as reported by Carrow [
12], stated that Meyer ZG may not grow well under low pH. Our data indicates that soil physical conditions may be more influential, as the highest RW was seen in the soil with the lowest pH.
Table 4.
Root weight for three turfgrasses planted in four soils.
Table 4.
Root weight for three turfgrasses planted in four soils.
| Soil | Bermuda | Savannah | Zoysia | Soil means † |
|---|
| ![Agronomy 04 00124 i003]() |
|---|
| Piarco | 0.208 bcd ‡ | 0.334 ab | 0.412 a | 0.318 a |
| Princes Town | 0.025 e | 0.285 ab | 0.053 e | 0.121 b |
| River Estate | 0.118 cde | 0.308 ab | 0.237 bc | 0.221 ab |
| Talparo | 0.065 e | 0.422 a | 0.087 de | 0.191 ab |
The main effect of sand layering resulted in a significantly (
p = 0.039) higher RW for all turfgrasses (0.245 kg m
−3 compared to 0.180 kg m
−3 without sand). Sand addition favors increased macroporosity and infiltration, which enhances root growth by reducing impeding stresses [
41]. Correlation between RW and NCPS showed a significant (
p = 0.05), though weak, relationship between the two indices (R = 0.306), which supports this position.
3.2. Bulk Density
Root zone BD was affected by applied stresses and varied significantly (
p = 0.023) among the grasses (
Table 5). High compaction applied to BG resulted in the highest BD, which was significantly higher than all other combinations. ZG had the lowest BD values across all stresses, and only two treatments showed BD values higher than 1.3 Mg/m
3. The main effects of grass type were also very significant (
p = 0.05), with ZG recording the lowest BD value and BG the highest. Christians [
5] noted that the leaves of ZG are stiff, due to their high silica content [
42], which could buffer the compactive force applied to the surface [
43]. Eudoxie
et al. [
44] also reported that the type of turfgrass cover influenced the effects of compaction on the bulk density of the underlying root zone. Statistically, root zone BD under ZG was similar for all stress treatments, supporting the argument that the root system of this grass may also be responsible for this result. Notably, RW was highest in ZG under WL, which would have contributed to the overall mass of the sample used to measure BD. ZG was shown to be the best at preventing or reducing compactive effects on turf root zones.
Table 5.
Root zone BD under three turfgrass and four applied stresses.
Table 5.
Root zone BD under three turfgrass and four applied stresses.
| Grass type | Drought | Waterlogging | High compaction | Low compaction | Grass means † |
|---|
| ![Agronomy 04 00124 i004]() |
|---|
| Bermuda | 1.27 bc ‡ | 1.29 b | 1.43 a | 1.29 b | 1.32 a |
| Savannah | 1.20 cde | 1.29 b | 1.25 bcd | 1.32 b | 1.27 b |
| Zoysia | 1.16 e | 1.14 e | 1.18 de | 1.20 cde | 1.17 c |
| Stress means § | 1.21 b | 1.24 ab | 1.29 a | 1.27 a | |
The main effect of stress was also significant (
p = 0.029) with the compaction treatments recording the highest BD values and the D stress the lowest, but both were statistically similar to the value under WL (
Table 5). Across the four stresses. BD did not exceed 1.3 Mg/m
3. Houlbrooke
et al. [
45] showed that ryegrass root growth was not significantly reduced as BD increased from 0.9 to 1.2 Mg/m
3. It is noted that the compaction effort was applied only once, and compounded effects can be anticipated for continuous traffic, which would lead to increased BD and decreased turf growth and performance [
12,
46].
There was a significant (
p < 0.001) interaction between soil type and sand layering on root zone BD (
Table 6). Sand layering increased BD for all soils, but the effect was more pronounced in the clay soils; Princes Town and Talparo. Sandy soils tend to have higher BD than fine textured soils [
39], and additions of sand are therefore likely to have a more pronounced effect on the finer textured soils. The higher BD for Piarco and River Estate soils is linked to their greater proportion of coarse separates (
Table 1) and is supported by the means of these coarser textured soils recording significantly (
p = 0.05) higher BD than the clays. Ekwue
et al. [
47] showed that clay content and mineralogy influences soil compaction and, ultimately, bulk density. There is higher moisture retention by the clay particles, due to a greater proportion of micropores, which would create a softer surface, absorbing the energy produced by compaction. Waltz
et al. [
48] indicated that a BD range of 1.3 to 1.6 Mg/m
3 should be the upper limit for achieving good turfgrass growth. BD values in this study ranged from 0.91 to 1.51 Mg/m
3, which should therefore allow for adequate root growth and development. This result further supports the previous inference that the HC treatment was not as influential on root zone properties as anticipated.
While having a sand layer above the soil increased the bulk density of root zones under all grasses, this increase was greatest for BG (
Figure 1). The lower BD measured for both SG and ZG amended with sand compared with BG is linked to higher RW (
Table 3), described previously. Sand addition significantly (
p < 0.001) increased BD by 25%, consistent with the initial packing dry bulk densities (
Table 1).
Table 6.
Sand layering influence on root zone BD across four soils.
Table 6.
Sand layering influence on root zone BD across four soils.
| Soil | Soil | Soil + Sand | Soil means † |
|---|
| ![Agronomy 04 00124 i005]() |
|---|
| Piarco | 1.10 d ‡ | 1.51 a | 1.31 a |
| Princes Town | 0.91 f | 1.27 c | 1.09 c |
| River Estate | 1.11 d | 1.41 b | 1.26 a |
| Talparo | 1.01 e | 1.38 b | 1.20 b |
| Sand means § | 1.03 b | 1.39 a | |
Figure 1.
Sand layering effect on root zone bulk density for three grasses.
Figure 1.
Sand layering effect on root zone bulk density for three grasses.
3.3. Surface Hardness
SH was significantly (
p < 0.001) higher for treatments without the sand layer under D compared to the other treatment combinations (
Table 7). SH among the compaction × sand treatments were statistically similar, which may be attributed to the non-dependence of SH on bulk soil conditions. The correlation index between these variables was weak and non-significant. Eudoxie
et al. [
27] found a significant dependence of SH on moisture (
r2 = 47.4), whilst Baker
et al. [
49] reported that moisture content was the dominant factor controlling SH. The findings in this experiment further confirm that SH is not related to BD. For the compaction treatments, root zone moisture content was maintained near water holding capacity, indicating that SH can be controlled by proper turf water management, even under traffic. Reduced SH for sand amended treatments is likely related to the loose nature of the sand particles, which may have buffered the underlying soil. Baker
et al. [
49] also reported greater SH for soil
versus sand-amended golf green root zones. Linde [
50] reported that greens with a Clegg value of less than 50 gravities were too soft and those with values greater than 140 gravities too hard for sports fields. Therefore, the 164 gravities obtained under D without the sand amendment was an undesirable level of SH.
Table 7.
The influence of sand layering and applied stress on surface hardness (SH).
Table 7.
The influence of sand layering and applied stress on surface hardness (SH).
| Sand | Drought | High compaction | Low compaction | Sand means † |
|---|
| ![Agronomy 04 00124 i006]() |
|---|
| Soil | 164 a ‡ | 91 c | 82 c | 112 a |
| Soil + Sand | 109 b | 86 c | 85 c | 93 b |
| Stress means§ | 137 a | 89 b | 84 b | |
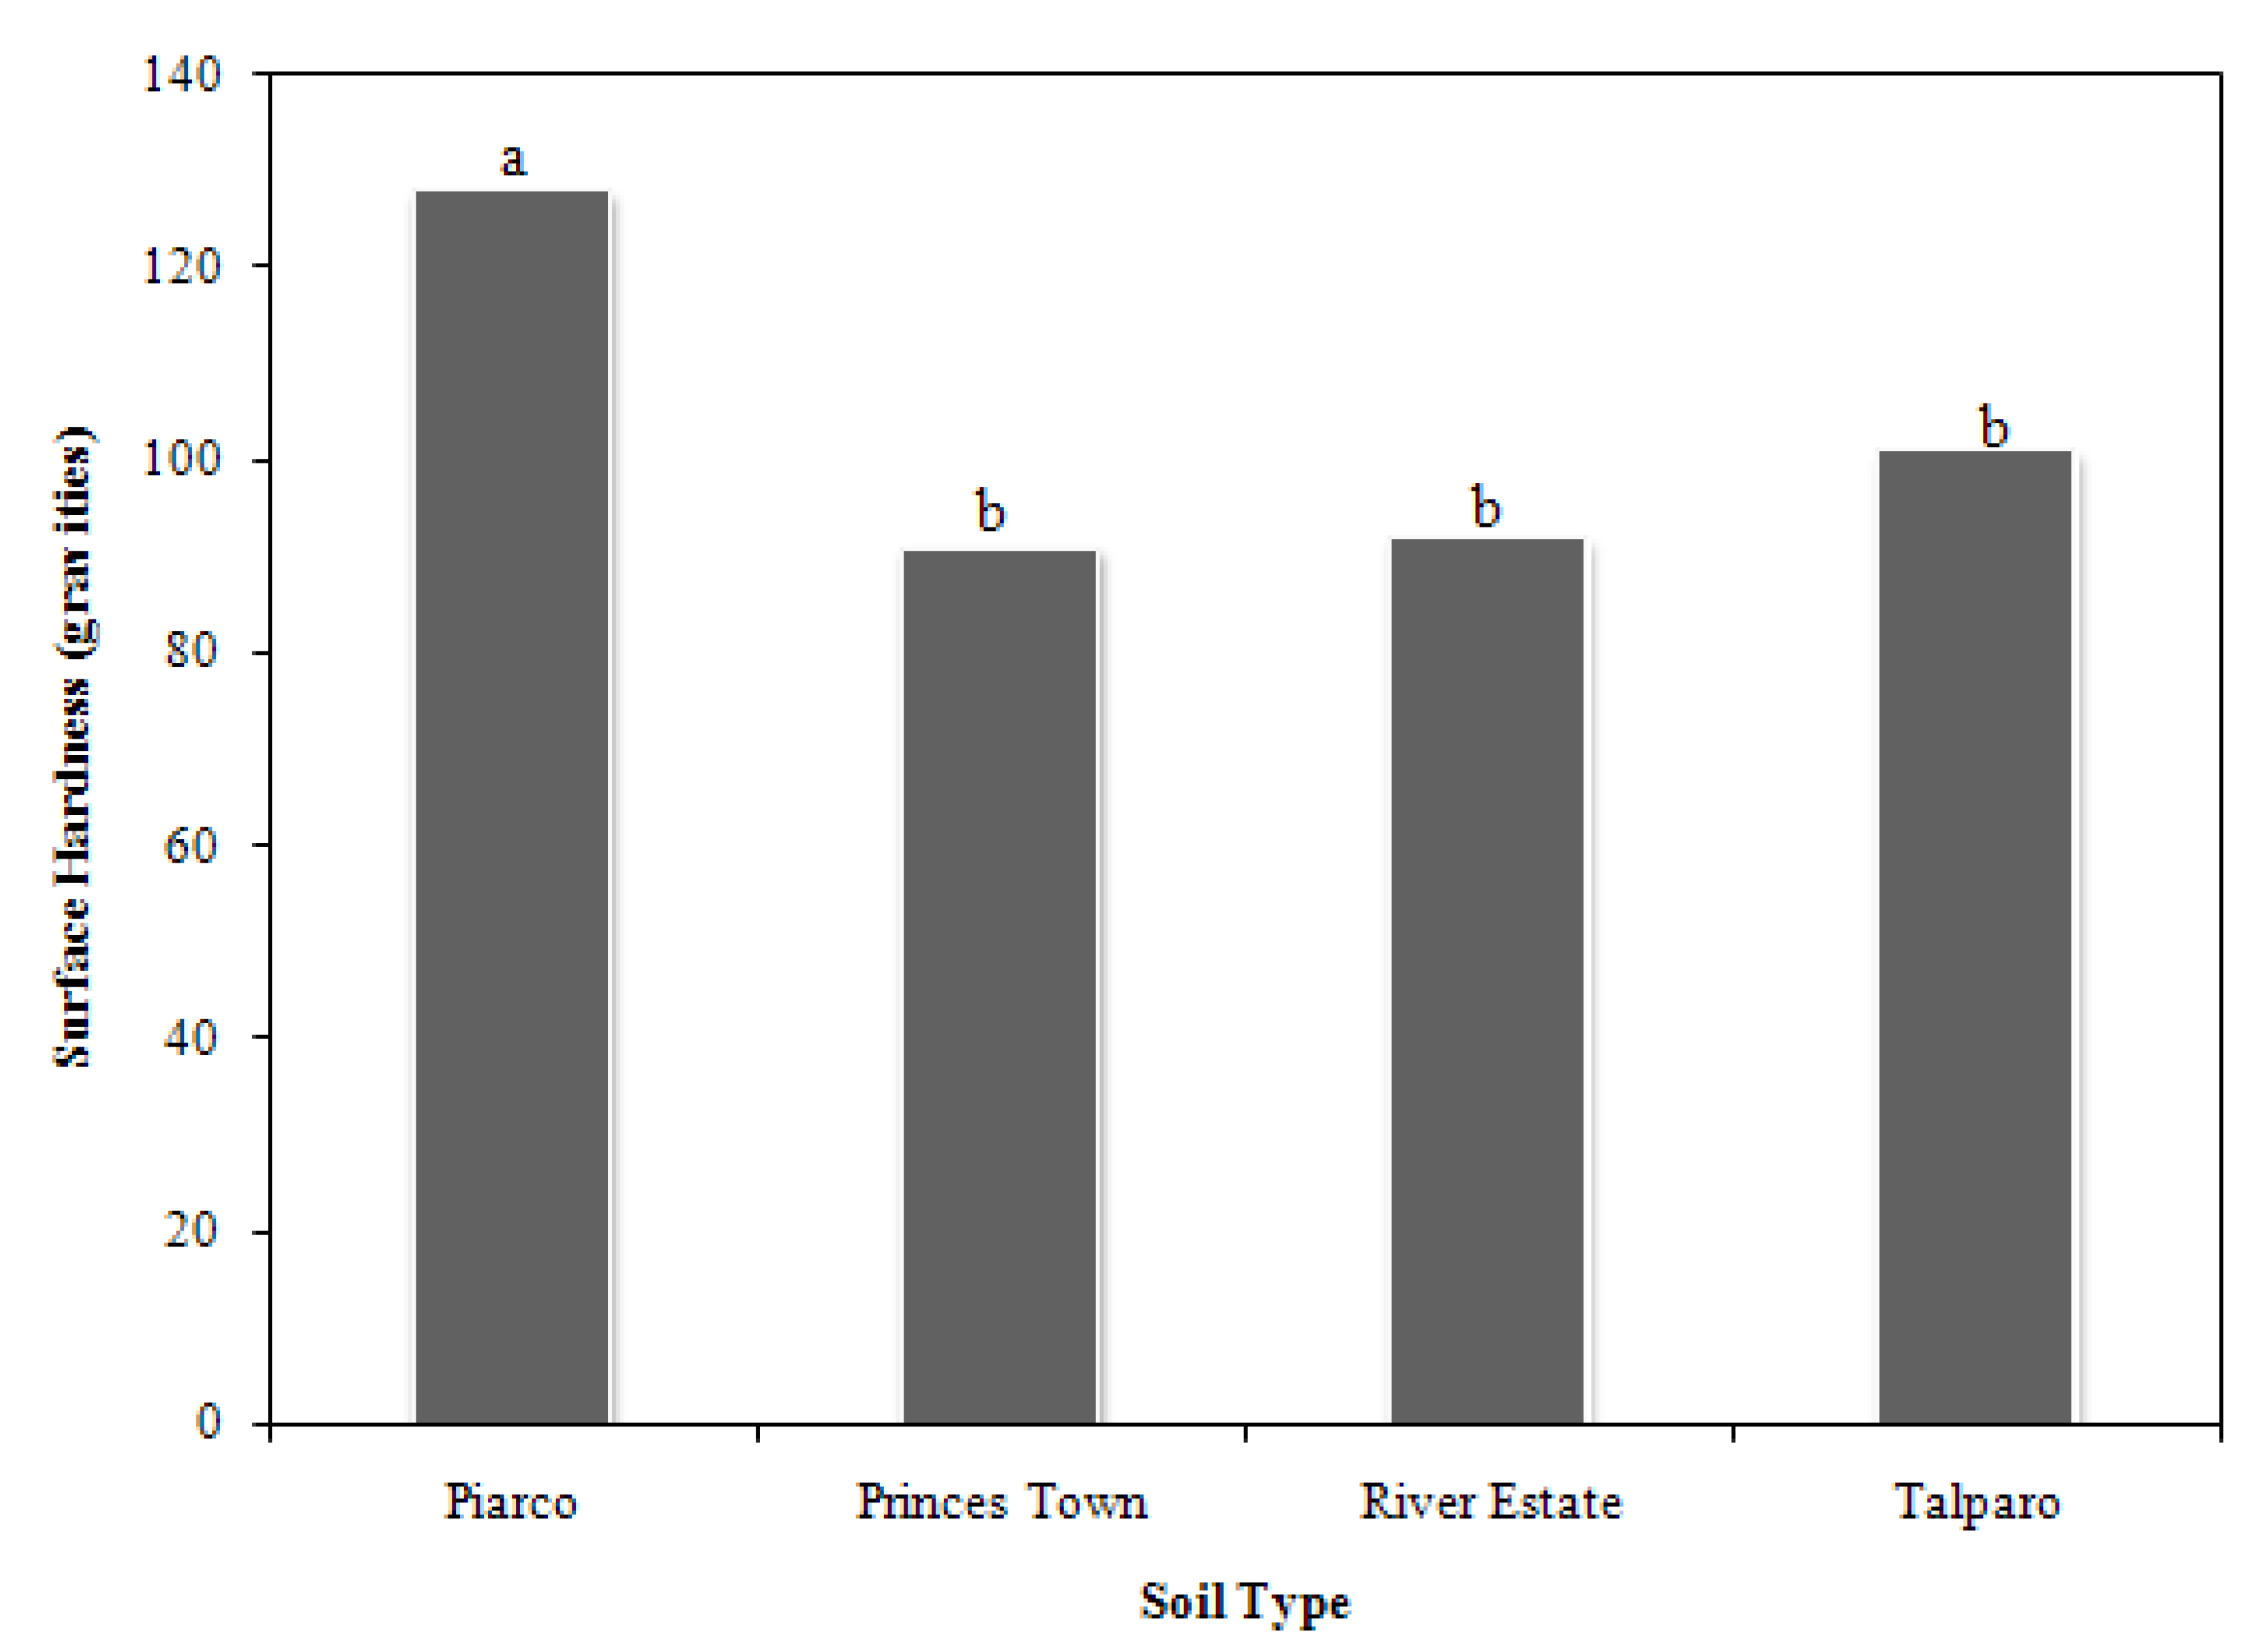
The data in
Figure 2 show that SH for Piarco was significantly (
p = 0.05) higher than the other soil types, with values among the other three soils being statistically similar. It is noteworthy that while Piarco showed the highest BD and SH among the soils, it still recorded the highest RW. However, only the SH was above acceptable levels, which may be related to the greater proportion of fine sand in this soil and the associated low water holding capacity.
Figure 2.
Main effect of soil type on root zone SH.
Figure 2.
Main effect of soil type on root zone SH.
3.4. Redox Potential
Eh was significantly (
p < 0.001) higher for compaction treatments compared to the other stresses for both sand treatments (
Table 8). Inclusion of the surface sand layer significantly lowered the
Eh for the compaction treatments. This finding supports the previously mentioned negative correlation between NCPS and Eh. Sand layering reduces capillary movement of water and its loss by evapotranspiration [
25], resulting in the greater water contents of the underlying soils. A greater requirement for aeration management might exist for which sand is used to modify turfgrass root zones on clay soils without subsurface drainage. Further, the measurement of
Eh was conducted using a probe that did not span the entire length of the pot and might not have included the sand layer, whilst the contribution of all media components was assessed in measuring NCPS. Contrastingly,
Eh was similar between sand treatments for both D and WL. Soil drying would encourage aeration, due to the replacement of the pore volume occupied by water with air. Since
Eh is proportional to O
2 content, which is itself proportional to water content, the later may have nullified the influence of the sand layer under WL.
Table 8.
The sand layering influence on root zone Eh across four stress treatments.
Table 8.
The sand layering influence on root zone Eh across four stress treatments.
| Stress | No Sand | Sand | Stress means † |
|---|
| ![Agronomy 04 00124 i007]() |
|---|
| Drought | 312 b ‡ | 333 b | 323 b |
| Waterlogging | −12 c | −39 c | −26 c |
| High Compaction | 346 b | 584 a | 465 a |
| Low Compaction | 353 b | 522 a | 437 a |
| Amendment means § | 250 b | 350 a | |
Eh values for all stress treatments, with the exception of WL, remained above 300 mV, indicative of high O
2 content. WL resulted in significantly (
p < 0.001) lower
Eh values in the anaerobic range. Jiang and Wang [
20] reported a reduction in
Eh with increasing water level below the soil surface. Haung
et al. [
51] noted that under WL conditions, oxygen deficiency is the major limitation to grass growth and quality. For our study, SG and ZG showed extensive stolon growth in response to WL. Ashraf and Yasmin [
52] also reported the low tolerance of BG to WL and related it to its limited ability to uptake and mobilize Fe and Mn to growing shoots. Bush
et al. [
53] further reported that the opposite was true for SG, which showed increased levels of Fe and Mn during prolonged WL. Comparatively, it can be inferred that BG is less tolerant to WL than SG and ZG.
River Estate recorded the lowest Eh, whilst Piarco the highest among the soils investigated (
Figure 3A). Wuddivira
et al. [
54] showed that River Estate is structurally weak and prone to slaking. Under wetting, this soil quickly loses aggregate stability and collapses, leading to low macroporosity and pore continuity. Inherently low aggregate stability led to the use of larger aggregates during root zone construction. The opposite is true for Piarco, as it is dominated by coarser particles. The heavy clay soils performed intermediary, with the higher clay and organic matter content allowing for greater stability [
55].
Eh for BG and SG were significantly higher than ZG (
Figure 3B), although all values were in the range of adequate root zone aeration. The lower
Eh of ZG may be attributed to lower oxygen concentration and differences in the mechanistic response between turfgrasses. Setter and Belford [
19] noted that during WL, root growth is slowed and root tips may be killed. Kramer [
56] indicated that increased root porosity under low oxygen conditions has been attributed to mechanisms of adventitious root development, root cell death or ethylene-induced aerenchyma cells. It is plausible that ZG had greater root porosities than BG and SG, noting that RW was significantly higher in the WL treatment. Hence, ZG was less dependent on changes in root zone aeration porosity. Chen
et al. [
57] reported that root porosity was much higher in flooded plants than in the un-flooded controls after three days of treatment and rose to 43% after 50 days.
Figure 3.
The main effects of soil (A) and turfgrass (B) on root zone Eh.
Figure 3.
The main effects of soil (A) and turfgrass (B) on root zone Eh.
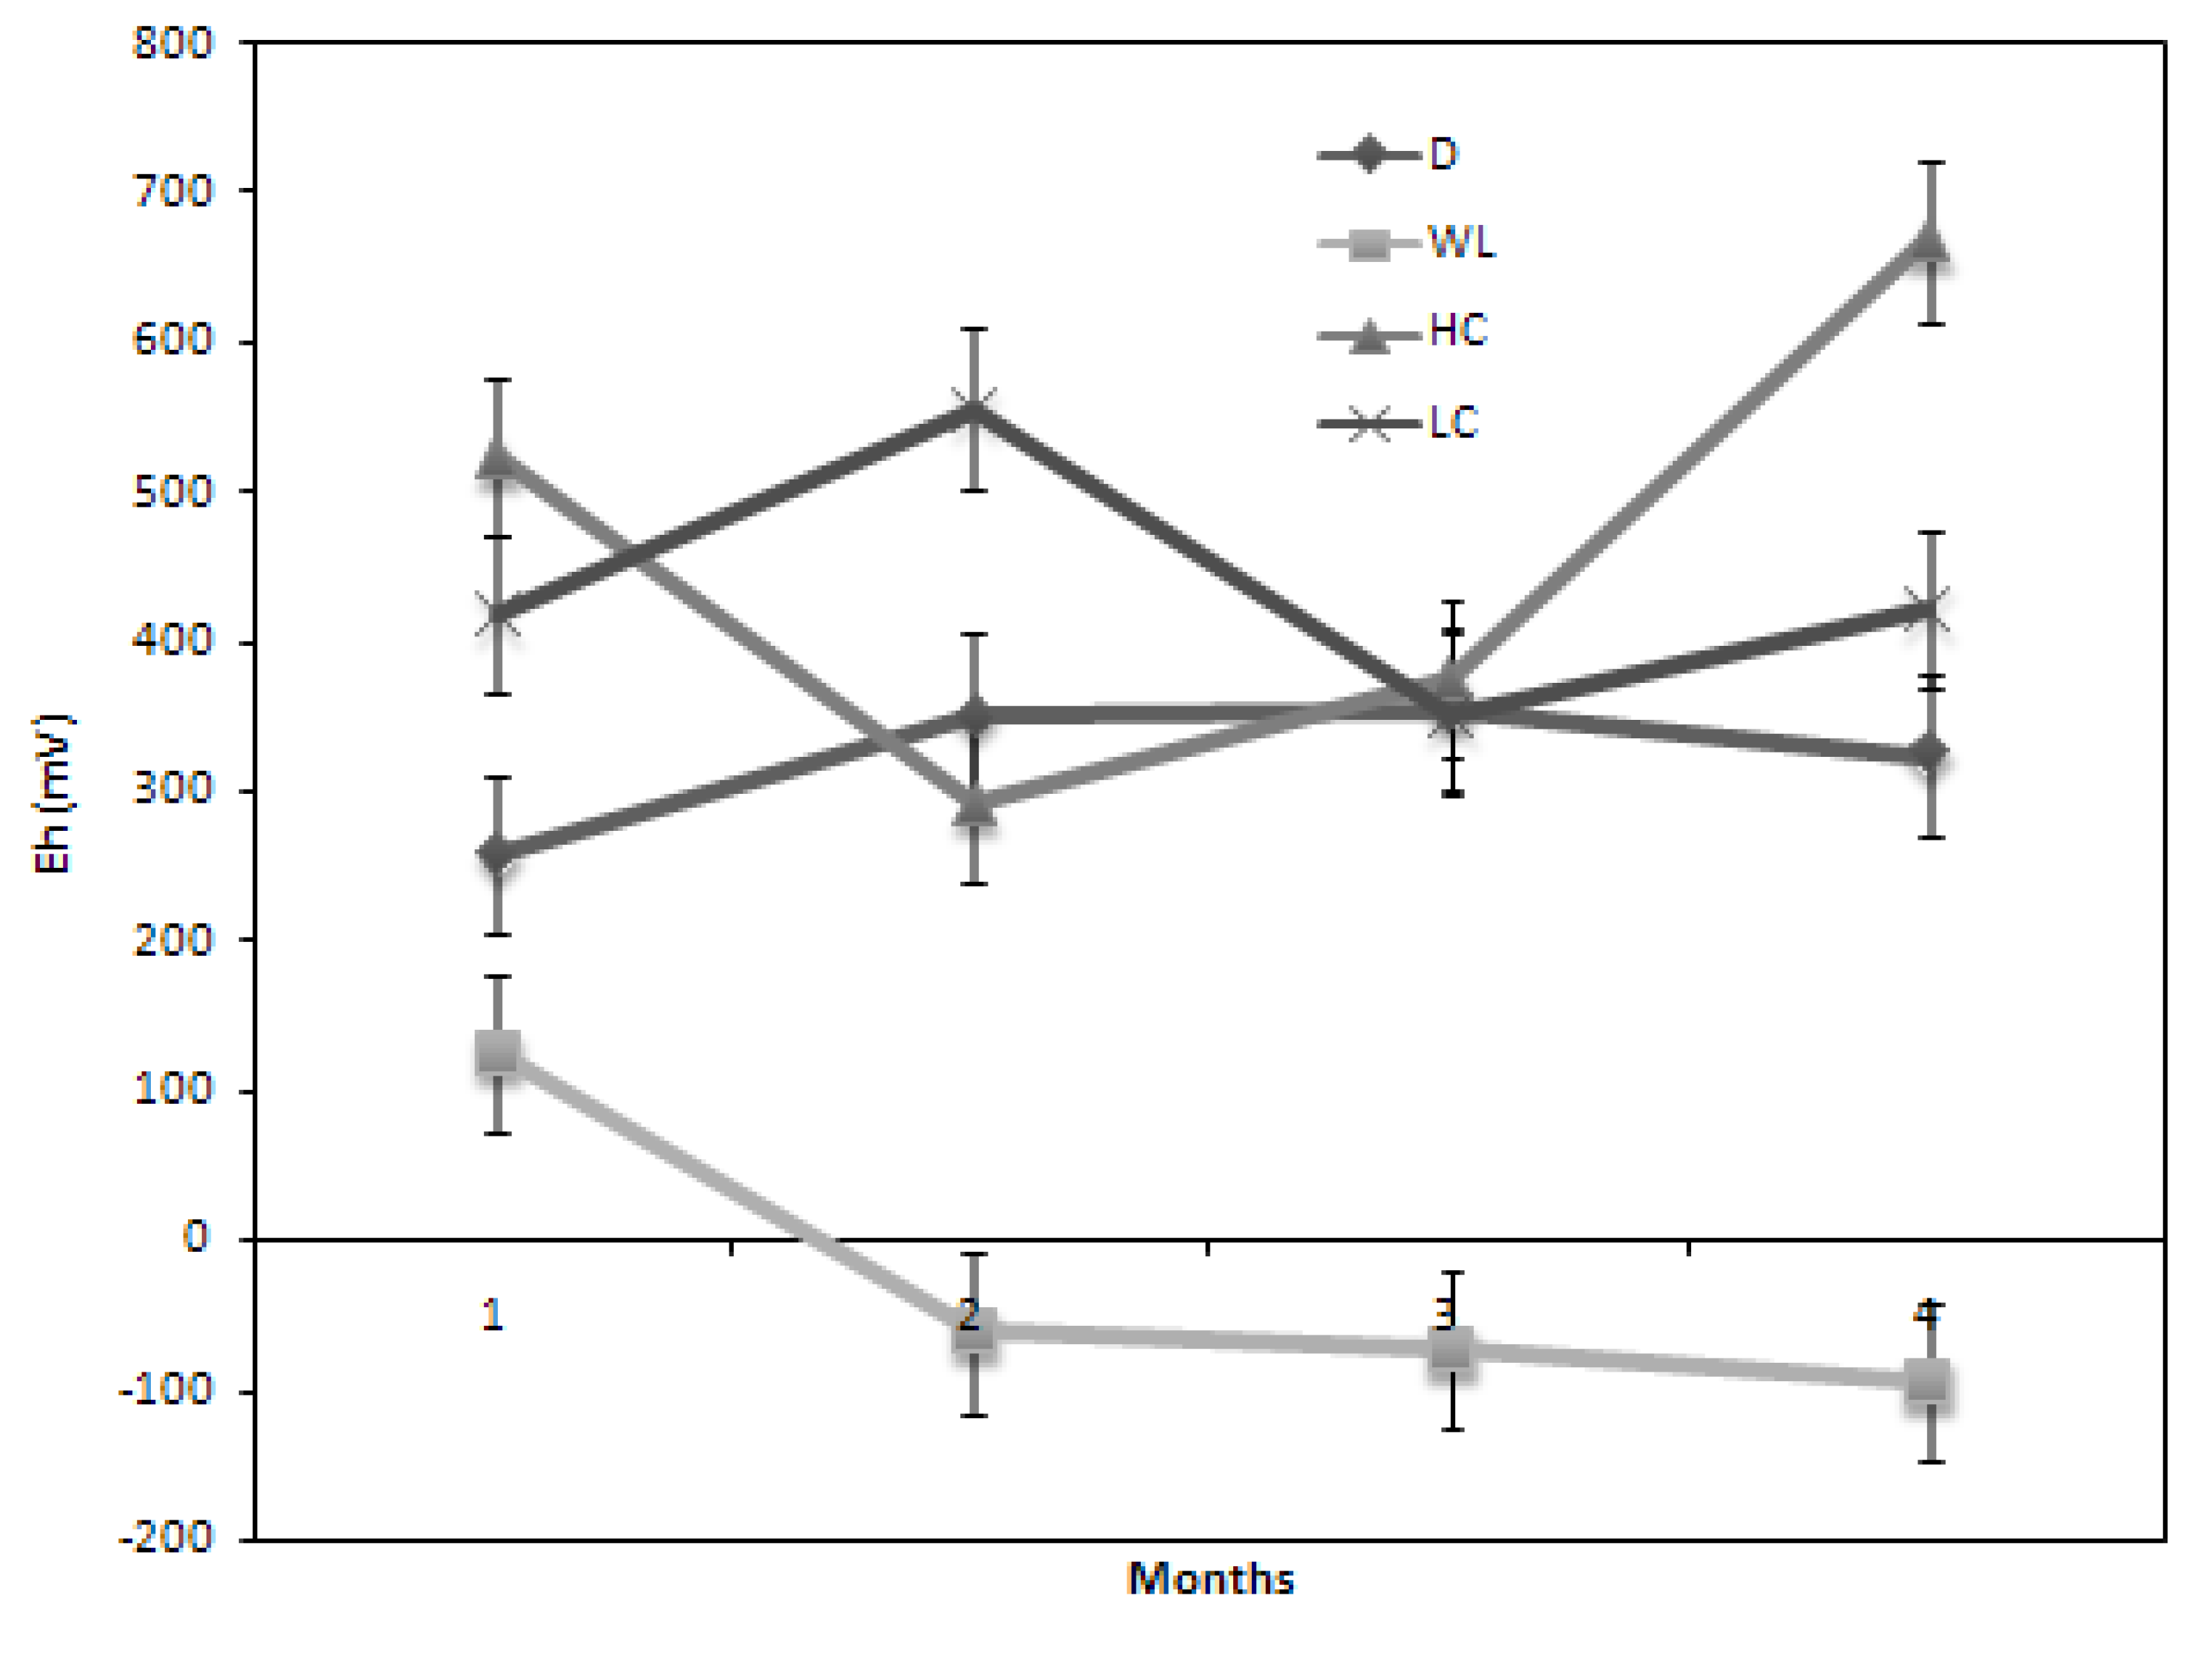
The water related stresses showed similar
Eh values through Months 2–4 (
Figure 4); however,
Eh differed among all stresses over time. The WL treatments had significantly lower
Eh at all times, associated with anaerobic conditions from decreasing O
2 levels within the root zone. Wang and Jiang [
21] noted that excess water in the root environment blocks the transfer of oxygen and other gases between the soil and atmosphere. Average
Eh values for WL treatments were slightly >100 mV after one month of incubation. The values decreased below zero at Month 2. Malik
et al. [
58] reported that in wheat, soil
Eh dropped from 600 mV to 40 mV after 28 days of waterlogging. Opposite fluctuations in
Eh were observed for the compaction treatments. The variation in
Eh for these treatments may be attributed to the changes in root zone moisture content related to periodic wetting, water use, oxygen diffusion and consumption [
59].
Figure 4.
Applied stresses drought (D), waterlogging (WL) high compaction, (HC) and low compaction (LC) effects on root zone Eh over four months.
Figure 4.
Applied stresses drought (D), waterlogging (WL) high compaction, (HC) and low compaction (LC) effects on root zone Eh over four months.
Soil
Eh showed a near similar trend for all soils planted with SG over the incubation period, compared to the other grasses (
Figure 5). SG had the greatest RW among all soils, which would imply greater macroporosity, as well as water use. Average
Eh was greater for SG compared to the other grasses. Wide fluctuations were seen for both BG and ZG across the four soils, reflective of a smaller, less influencing root system. Across all soils, RE showed the lowest
Eh values (occurring at different months for the three grasses), which may be attributed to its poor structural stability, especially when physically manipulated. Soil
Eh remained consistently lower than 200 mV under ZG over time, especially under compactive treatments. Agnew and Carrow [
12] reported reductions in water use for compaction treatments for Kentucky bluegrass and alluded to low oxygen levels inhibiting water uptake. The compactive treatments in the present study was kept near their water holding capacity throughout the study, which may have further added to the low oxygen content of the root zone.
Figure 5.
The effects of soils; Piarco (P), Princes Town (PT), River Estate (RE) and Talparo (T) on root zone Eh for (A) Bermuda, (B) Savannah and (C) Zoysia over a four month incubation period.
Figure 5.
The effects of soils; Piarco (P), Princes Town (PT), River Estate (RE) and Talparo (T) on root zone Eh for (A) Bermuda, (B) Savannah and (C) Zoysia over a four month incubation period.
3.5. Non-Capillary Pore Space
NCPS for ZG under the WL treatment was significantly higher when compared to the other treatments (
Table 9). Notably, all treatments showed <10% NCPS, which is below the recommended range (10%–20%) for sports turf and likely influenced by the use of disturbed soil with low structural integrity. Higher NCPS for ZG is probably related to higher root weight and associated aggregation and biopore formation. BG showed the lowest NCPS when subjected to D and HC. An increased compaction effort reduced NCPS for all turfgrasses, although the differences were not statistically significant. This finding was similar to Carrow [
60], who performed compaction studies on cool season turfgrasses and reported lower, but non-significantly different, aeration porosities between low and high compaction efforts. In a follow up study, Agnew and Carrow [
12] also showed no difference in NCPS between short- and long-term compaction on a silt loam soil.
NCPS was significantly higher for River Estate and Piarco planted to ZG in the no-sand treatments (
Table 10). Sand inclusion lowered NCPS for these soils and showed similar values compared to most of the other treatment combinations. Correspondingly, RW was also significantly higher for the combination of River Estate and Piarco and ZG compared to Princes Town and Talparo. Pearson correlation showed a low positive, yet significant, relationship (
R = 0.31) between RW and NCPS. Increased RW can result in greater aggregation, especially for the fibrous root system of turfgrasses [
61]. This phenomenon is enhanced by the wetting and drying cycles associated with plant growth.
Table 9.
Root zone NCPS for three turfgrasses affected by applied stress.
Table 9.
Root zone NCPS for three turfgrasses affected by applied stress.
| Grass type | Drought | Waterlogging | High Compaction | Low Compaction | Grass means † | |
|---|
| ![Agronomy 04 00124 i008]() | |
|---|
| Bermuda | 1.944 de ‡ | 3.013 bc | 1.788 e | 2.050 cde | 2.198 c | |
| Savannah | 2.039 cde | 2.988 bc | 2.888 bcd | 3.212 b | 2.782 b | |
| Zoysia | 3.137 b | 5.449 a | 2.579 bc | 3.150 b | 3.579 a | |
| Stress means § | 2.373 c | 3.816 a | 2.418 bc | 2.804 b | | |
Comparing grasses across soils, soil-only treatments showed greater NCPS compared to sand-amended treatments. In this study, the sand amendment was applied as a surface layer, influencing the root distribution and underlying soil properties. Huang
et al. [
7] indicated that under stress, turfgrass root proliferation occurs mainly in the 0–5 cm of the surface, which in this study, represented the sand layer; this may have resulted in fewer aggregation and biopores and reduced root influence on soil aeration. This inference is supported by the similarly lower
Eh of sand-layered treatments. The clay soils resulted in significantly lower NCPS compared to the loam and sandy soil. The lower NCPS is attributed to higher microporosity associated with clay soils [
39].
Table 10.
Sand layering influence on NCPS across four soils and three turfgrasses.
Table 10.
Sand layering influence on NCPS across four soils and three turfgrasses.
| Soil | Bermuda | Savannah | Zoysia | |
|---|
| No Sand | Sand | No Sand | Sand | No Sand | Sand | Soil means † |
|---|
| ![Agronomy 04 00124 i009]() |
|---|
| Piarco | 2.175 | 3.175 | 2.500 | 2.175 | 5.775 | 3.875 | 3.279 b ‡ |
| Princes Town | 1.250 | 1.420 | 3.300 | 2.475 | 2.200 | 3.150 | 2.299 c |
| River Estate | 4.275 | 1.825 | 3.950 | 3.575 | 6.200 | 3.920 | 3.957 a |
| Talparo | 2.300 | 1.168 | 2.625 | 1.653 | 2.375 | 1.135 | 1.876 c |
| Grass means § | 2.198 c | 2.782 b | 3.579 a | |
| LSD0.05 for Soil × Grass × Amendment = 1.421 |


