Article

Pheno-Copter: A Low-Altitude, Autonomous Remote-Sensing Robotic Helicopter for High-Throughput Field-Based Phenotyping

1
CSIRO Plant Industry and Climate Adaptation Flagship, Queensland Bioscience Precinct, 306 Carmody Rd, St. Lucia, QLD 4067, Australia
2
CSIRO Computational Informatics, QCAT, 1 Technology Court, Pullenvale, QLD 4069, Australia
3
CSIRO Computational Informatics, EcoSciences Precinct, 41 Boggo Rd, Dutton Park, QLD 4102, Australia
4
CSIRO Plant Industry and Climate Adaptation Flagship, Cooper Laboratory, PO Box 863, The University of Queensland, Warrego Highway, Gatton, QLD 4343, Australia
5
CSIRO Plant Industry, High Resolution Plant Phenomics Centre, Clunies Ross St, Black Mountain, Canberra, ACT 2601, Australia
*
Author to whom correspondence should be addressed.
Agronomy 2014, 4(2), 279-301; https://doi.org/10.3390/agronomy4020279
Submission received: 17 March 2014 / Revised: 20 May 2014 / Accepted: 21 May 2014 / Published: 17 June 2014
(This article belongs to the Special Issue New Phenotyping Platforms for Field Trials)

Abstract

:
Plant breeding trials are extensive (100s to 1000s of plots) and are difficult and expensive to monitor by conventional means, especially where measurements are time-sensitive. For example, in a land-based measure of canopy temperature (hand-held infrared thermometer at two to 10 plots per minute), the atmospheric conditions may change greatly during the time of measurement. Such sensors measure small spot samples (2 to 50 cm2), whereas image-based methods allow the sampling of entire plots (2 to 30 m2). Capturing images from an aircraft which is flown precisely at low altitude (10 to 40 m) to obtain high ground resolution data for every plot allows the rapid measurement of large numbers of plots. This paper outlines the implementation of a customized robotic helicopter (gas-powered, 1.78-m rotor diameter) with autonomous flight control and software to plan flights over experiments that were 0.5 to 3 ha in area and, then, to extract, straighten and characterize multiple experimental field plots from images taken by three cameras. With a capacity to carry 1.5 kg for 30 min or 1.1 kg for 60 min, the system successfully completed >150 flights for a total duration of 40 h. Example applications presented here are estimations of the variation in: ground cover in sorghum (early season); canopy temperature in sugarcane (mid-season); and three-dimensional measures of crop lodging in wheat (late season). Together with this hardware platform, improved software to automate the production of ortho-mosaics and digital elevation models and to extract plot data would further benefit the development of high-throughput field-based phenotyping systems.

1. Introduction

Crop breeding requires continued investment to maintain performance, particularly against the evolving resistances of pests and diseases to control measures, and to improve yields as crop production spreads into increasingly marginal environments that are now also subject to the additional risk of the negative impacts of climate change. The delivery of new cultivars can be accelerated directly through faster means of the generation of progeny and improved understanding of the genetic control of adaptive traits that facilitate earlier, faster selection of superior lines. Given this powerful capability to map and manipulate the genetics of crops, the limit to progress in improving adaptation traits is now our understanding and measurement of the phenotype in the field, an area of research described as field-based phenotyping (FBP), and which can be facilitated by using various remote-sensing platforms to monitor plant growth and development [1,2].
Breeding utilizes the knowledge of how the genetic composition of lines within species that can be best combined to maximize the expression of phenotypes, such as yield. Over the last 30 years or so, between the development of molecular markers and now the regular use of mapped genomic information, plant breeding has benefited from the application of these technologies to accelerate the identification of target genotypes. The price of high-density genomic screens, such as SNP chips (5000 to 500,000 genes are typical) is dropping, such that they are becoming less than the cost of a single yield plot evaluation (ca. USD$10 to 40) in a breeding program, i.e., for the cost of an extra yield plot or the substitution of one, breeders may obtain a genomic screen that facilitates a statistical prediction of the genotype. This approach allows breeders to undertake DNA screens on large numbers of individual seeds from multiple crosses and to plant only those which, based on pedigree, are predicted to have the maximum expectation for increased yield through the pyramiding of multiple gene segments [3]. New breeding methods, such as doubled-haploids, off-season nurseries and embryo rescue, as well as powerful statistical techniques to adjust for within and between trial environment effects have also reduced the time between an initial cross and a delivered cultivar. With these technological advances, the exploitation of novel genetic resources and the recombination of these and current genetics is able to be done faster than ever before. With the acceleration of the delivery of both genetic data and of new offspring, the collection of phenotypic data is therefore now the major limiting factor in being able to design and predict outcomes in breeding programs.
Some phenotypes associated with abiotic adaptation can be evaluated precisely in non-field conditions, e.g., flowering time responses to temperature and photoperiod, seedling vigour and early root development. In dryland cropping, the yield is the outcome of complex interactions of the crop canopy and root system and the partitioning of assimilates to economic yield. If we could better track the development of these resource-capturing systems and their consequent effects on the dynamics of crop water use and growth and partitioning to yield, then it would be possible to identify genotypes with more robust and/or optimal growth patterns to stabilise or maximize yield in the variable environments experienced by dryland farmers. Growth-associated characteristics of plants, such as chlorophyll content and water content, can be quantified using remote-sensing instruments to calculate indices based on the reflectance of different spectra from the canopy. In recent years, the application of such indices has moved from scientific investigation to commercial application with indices, such as NDVI (Normalised Difference Vegetation Index), being used to identify weeds in fallowed fields and to manage in-season nitrogen requirement of crops [4]. New instruments and methods are providing an increasingly diverse set of indices to measure characteristics in field experiments, including canopy temperature [5], pigments, like anthocyanins and carotenoids [6,7], water content indices [8], water potential of leaves [9] and other adaptation traits, such as the stem content of water-soluble carbohydrates [10]. Many of these indices have been found to have associations with the adaptation of crops to drought or well-watered conditions to the degree that they begin to separate the predicted yield performance of different genotypes [11].
There has been a long history of the application of both satellite remote-sensing and yield monitoring systems in agricultural production and the prediction of fertilizer needs or yields at the paddock, farm and regional scales. Plot-level harvesters were developed in the mid-20th century, and their use in breeding has been successfully augmented by visual observations and scoring, improved experiment design and statistical analysis and electronic data capture systems. Objective high-throughput phenotypic screening supported by appropriate instruments, vehicles and data processing tools are now being developed. White et al., 2012 [1], extensively reviewed the criteria and needs for field-based phenotyping and considered the options for proximal sensing of different characteristics of crops, including the characterization of crop development, leaf canopy and above-ground biomass over time and the condition of the canopy under different nutrient, heat and drought stress conditions. For data acquisition, they evaluated five vehicle options, including helicopters. With the miniaturisation of sensing instruments, such as cameras and scanning detectors, it becomes possible to implement these systems on unmanned aircraft, also commonly known as unmanned aerial vehicles (UAVs) or unmanned aircraft systems (UASs).
As noted by Merz and Chapman (2011) [12], UAS have been deployed for vegetation monitoring, photogrammetric survey and infrastructure inspection [13,14,15,16,17]. These craft have the advantage of allowing sensing with high spatial and spectral resolution at a relatively low cost, subject to the regulations of the country in which they are operated. The low altitude flight allows the use of less expensive sensors, compared to those needed in manned aircraft, without disturbing the local conditions above the crop canopy, even down to 10 to 15 m of elevation. The other advantages of UASs are their speed of deployment and of data collection and ability to access trials when the field is water-logged or untrafficable. The canopy temperature of crops is an indicator of their stress condition [18], but it is extremely sensitive to small changes in cloud cover and wind speed [19], causing this trait to be difficult to assess through slow ground-based methods. Water-logged conditions or the lodging of trials normally prevent any operations via ground-based vehicles, and in taller crops, such as sugarcane and maize, it is not possible for these vehicles to access the crops later in the season without causing substantial damage to the trial. Laneways can facilitate access in these crops, but can greatly increase the size of the experiment and consequent cost. Further, while ground-based vehicles may be suitable for research farm applications, plant breeding typically entails multiple field experiments grown on commercial properties over a large geographic area spanning >1000 km in extent for sorghum, wheat, cotton or sugarcane in Australia. These trials may only be visited on three or four occasions, including when the plots are harvested, so that timely visits with FBP ground vehicles would be greatly constrained by transport and operator costs, as well as the ground conditions at the time of visit.
Automated unmanned platforms can be quickly and cheaply transported and, with appropriate training, deployed by local operators. However, little is known about the dependability of the commercial off-the-shelf (COTS) UAS for field crop research, and the systems are typically not optimized for that particular application. On the other hand, many components of the system described here have already been proven in other The Commonwealth Scientific and Industrial Research Organisation (CSIRO) research projects (see below).
Merz and Chapman (2011) [12] described the automation of the data acquisition using a customized unmanned aircraft based on a COTS remote control (COTS RC) helicopter to undertake low-altitude, way-point following missions; alias “Pheno-Copter” (
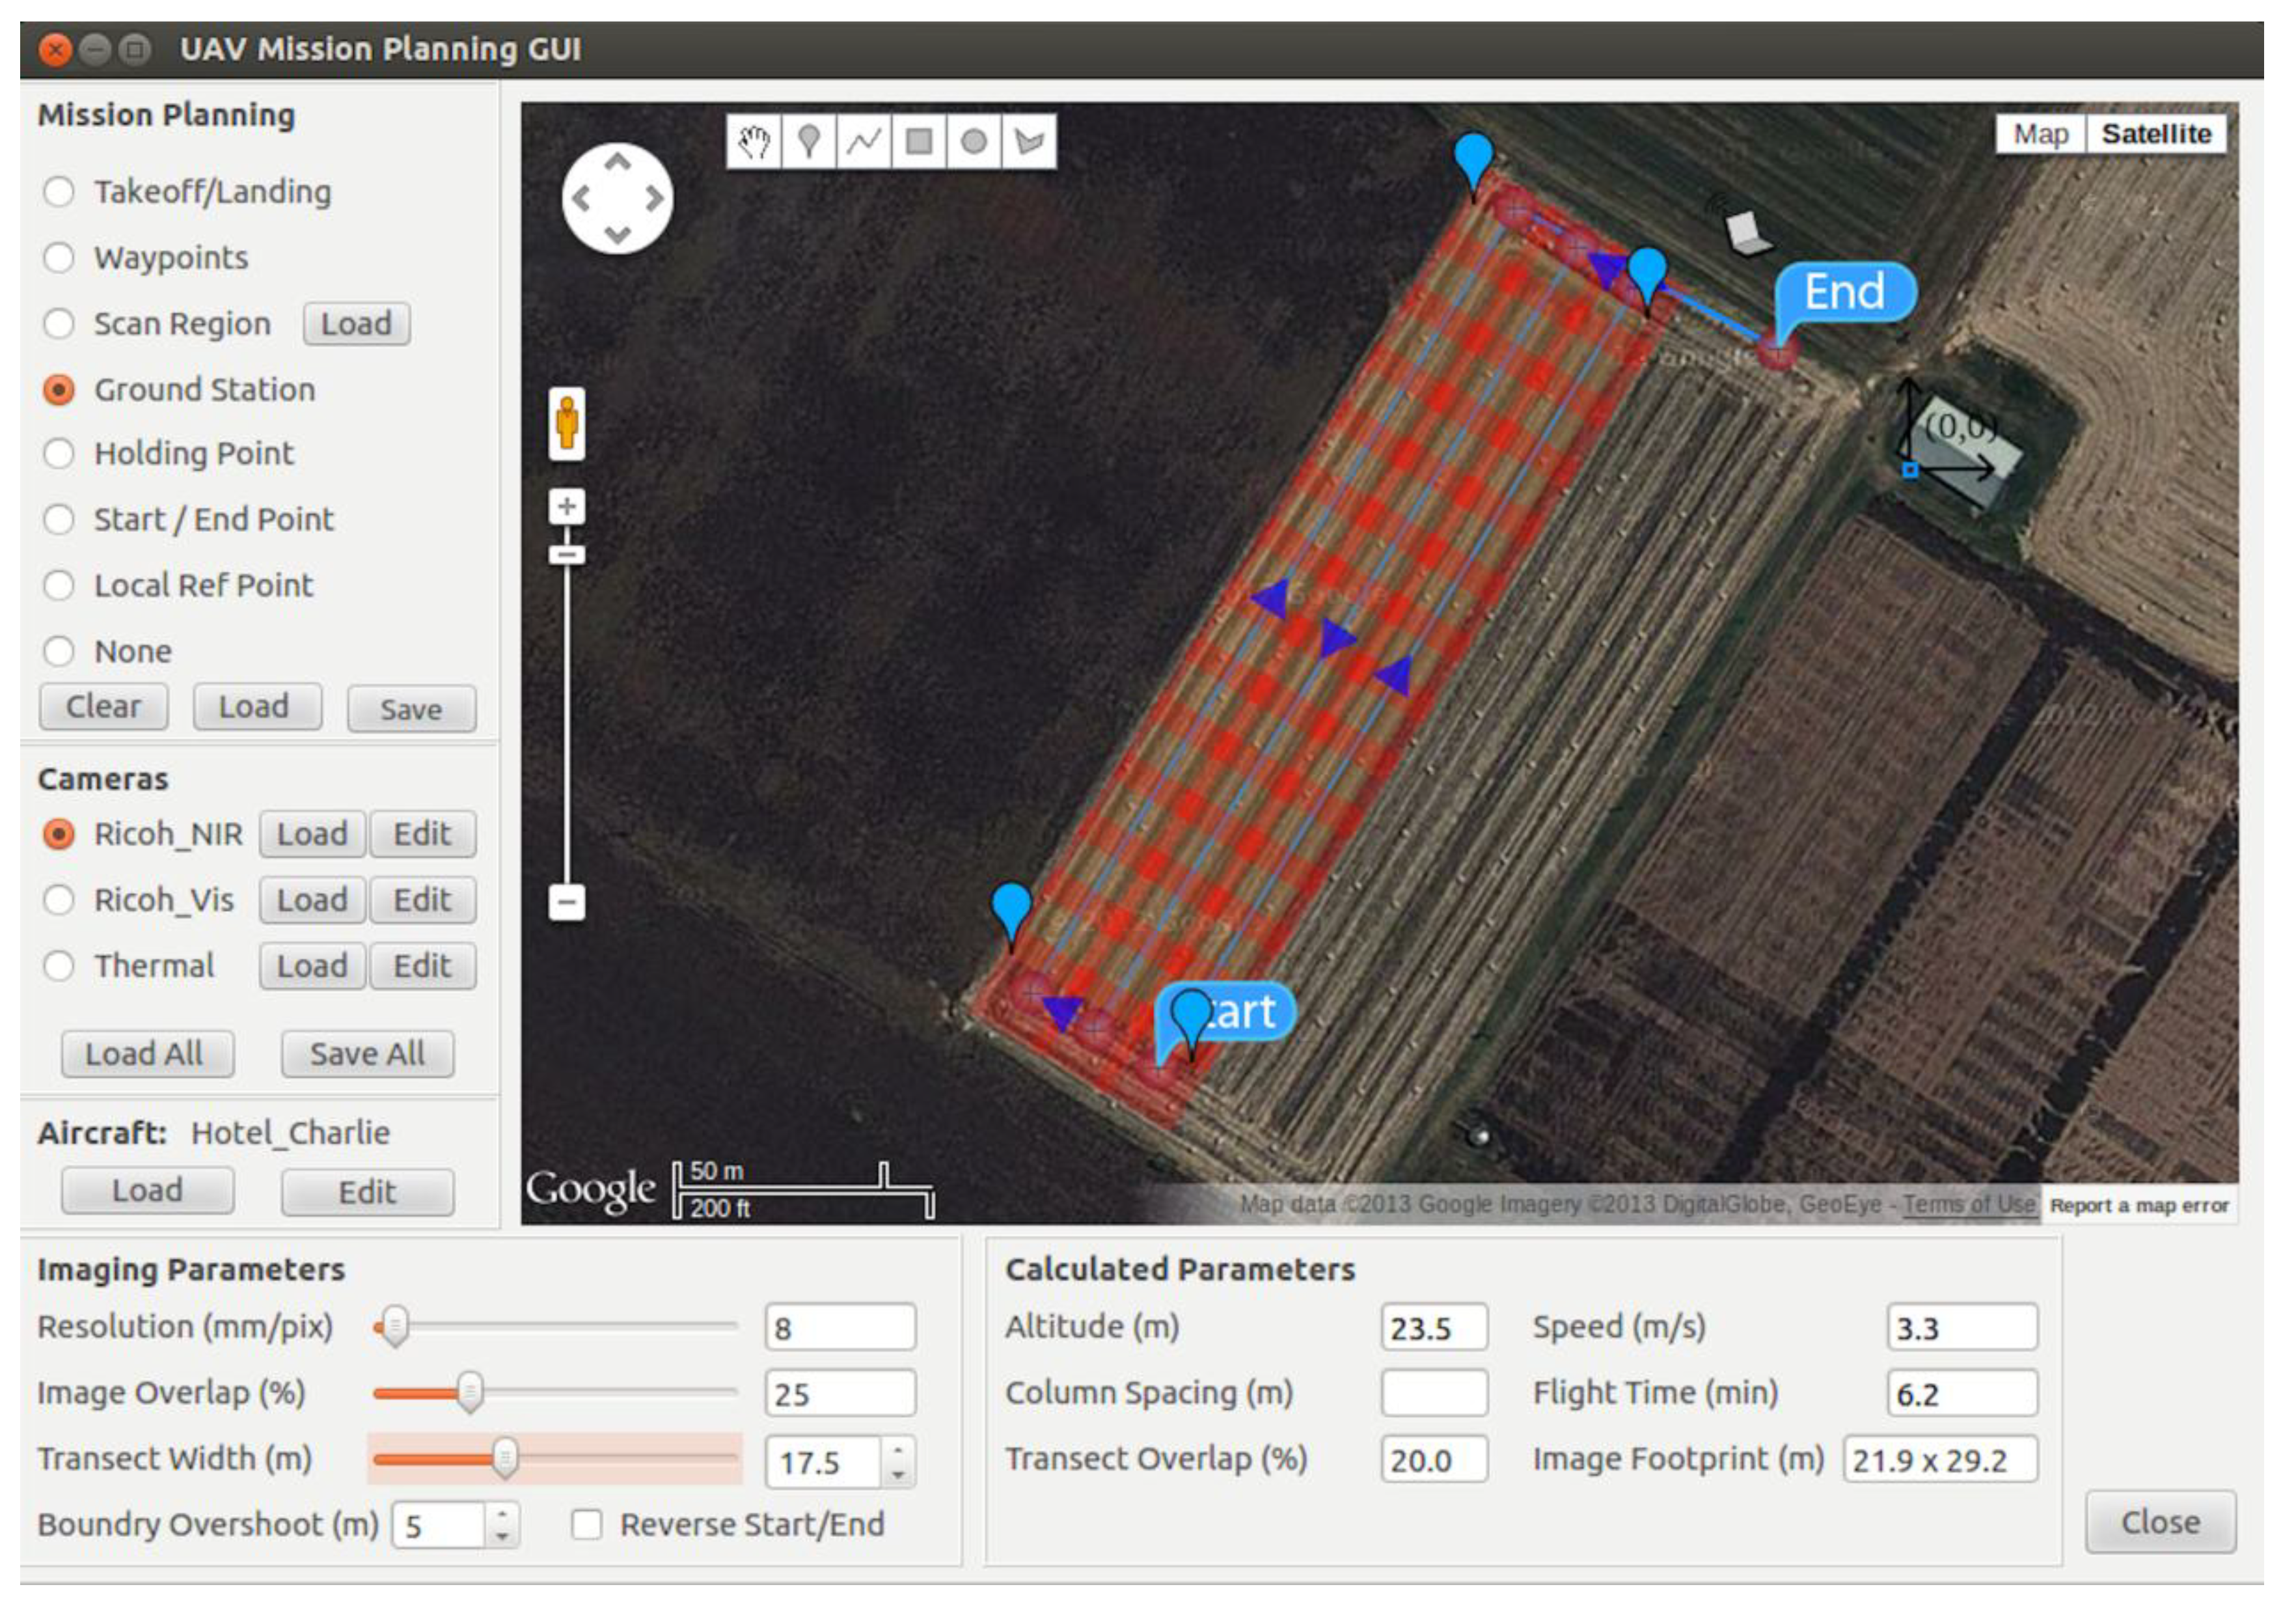
Figure 1). In this paper, we outline the further development of the hardware and software capabilities of the platform to provide a software workflow solution for plot-based experiments (Figure 2), and we assess the utility of this platform and software in the collection of phenotypic data in breeding trials of sorghum, wheat, cotton and sugarcane. The paper does not provide comprehensive ground-truthing of the datasets, as these analyses are still on-going, but rather aims to overview the performance and capabilities of the system and to identify research needs for improvement.
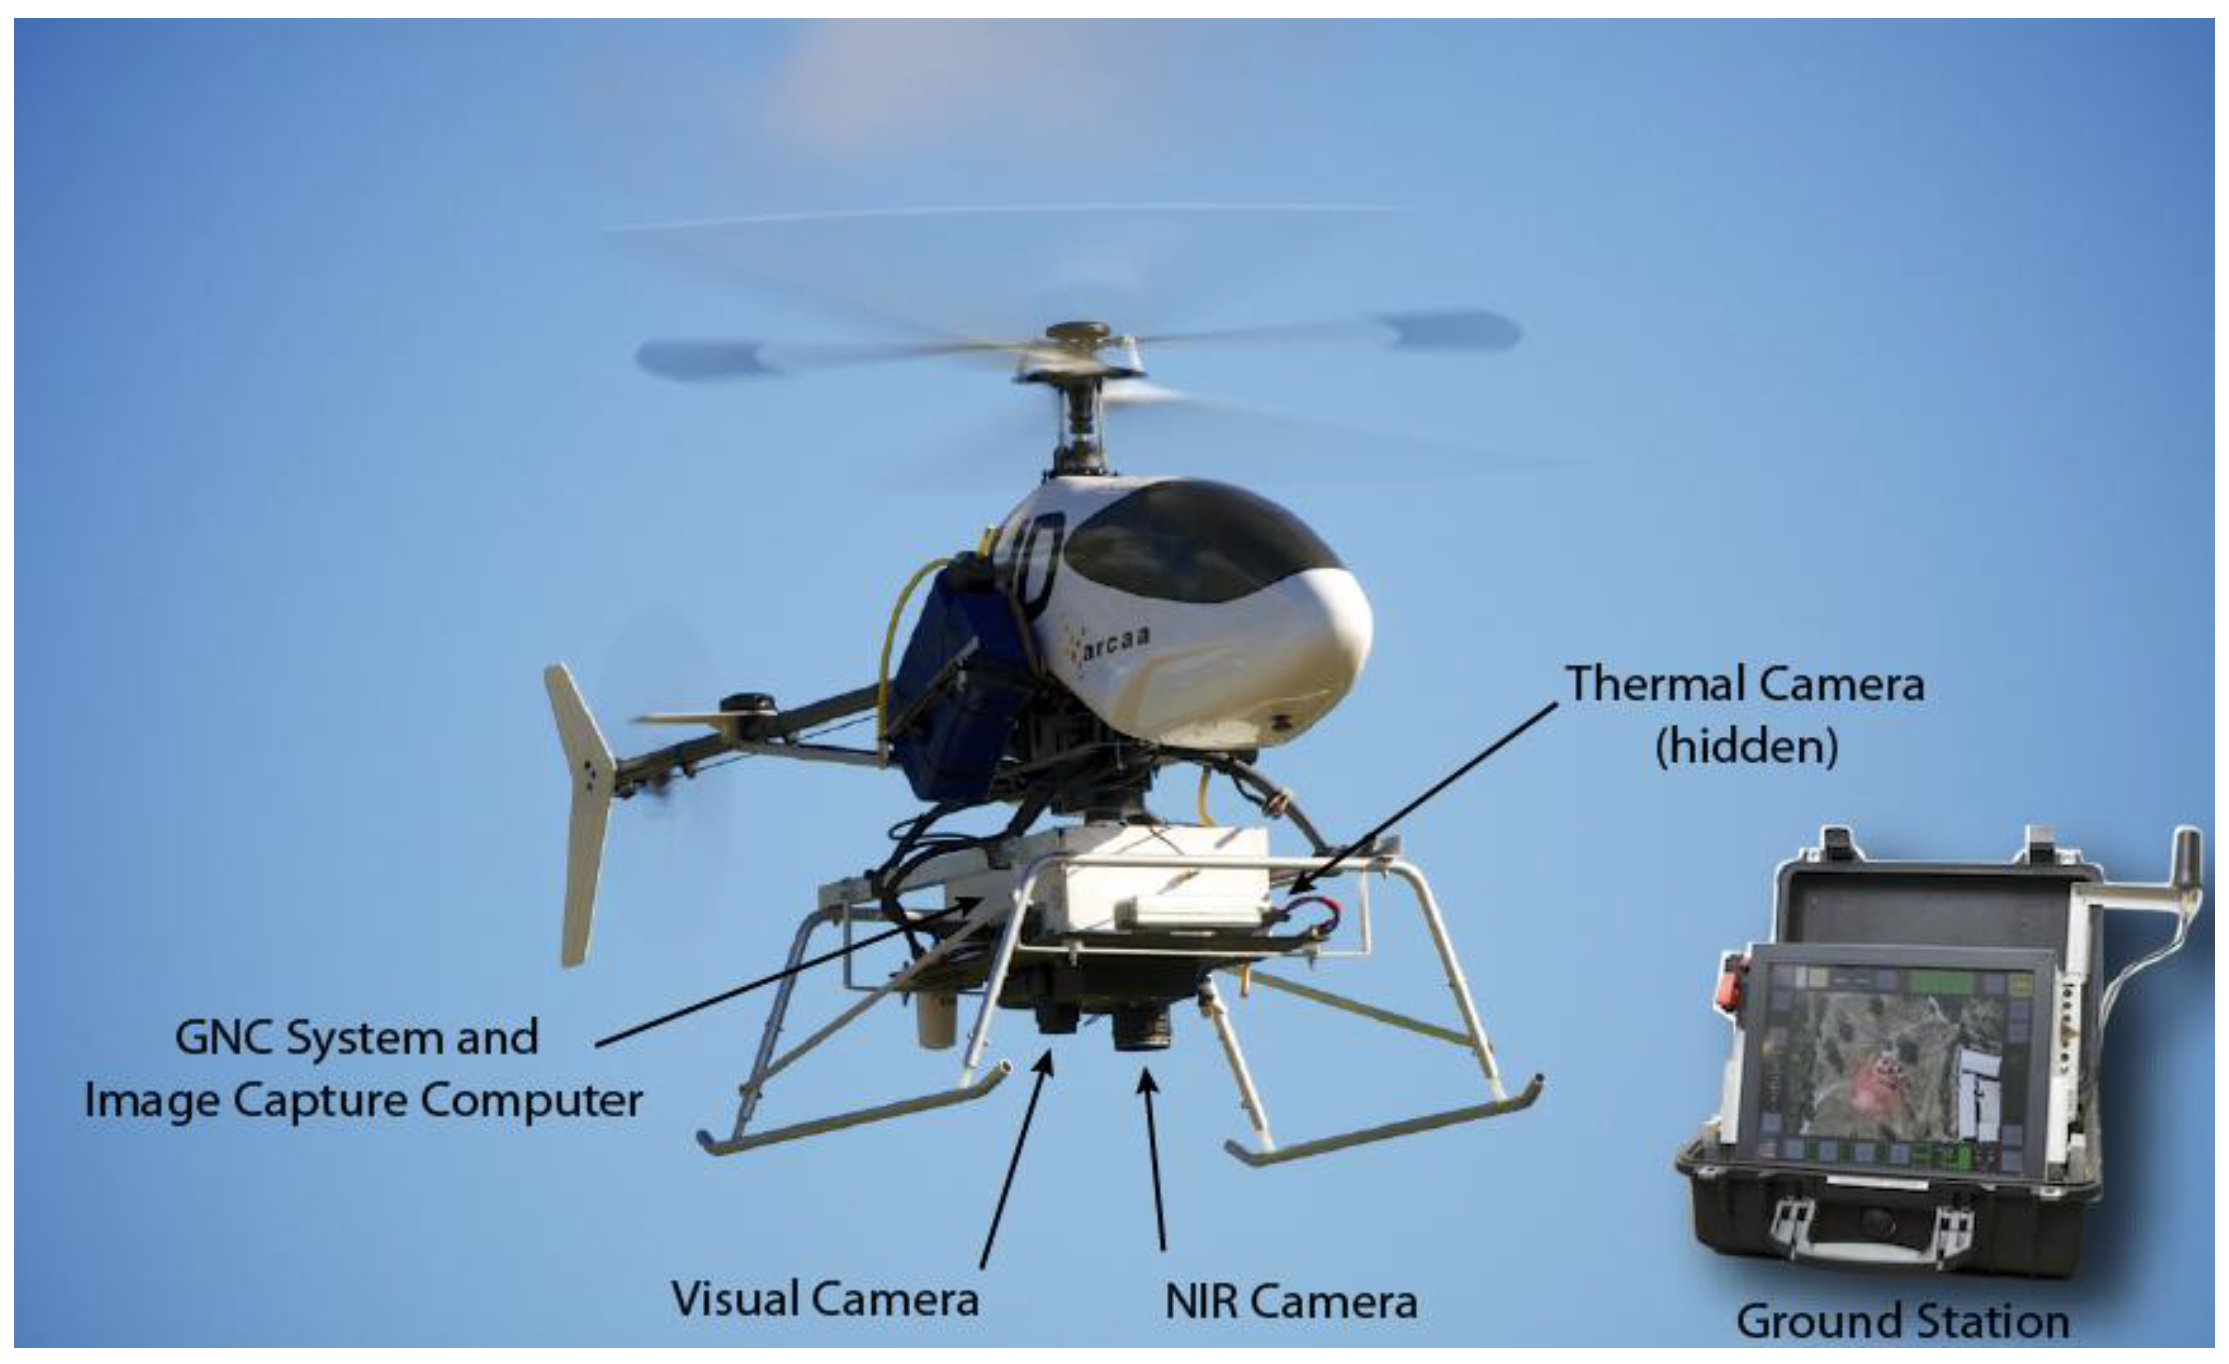
Figure 1. The platform as fitted out for Pheno-Copter work, which can be flown with a radio transmitter only or via a touch-screen control and monitoring ground station (inset).
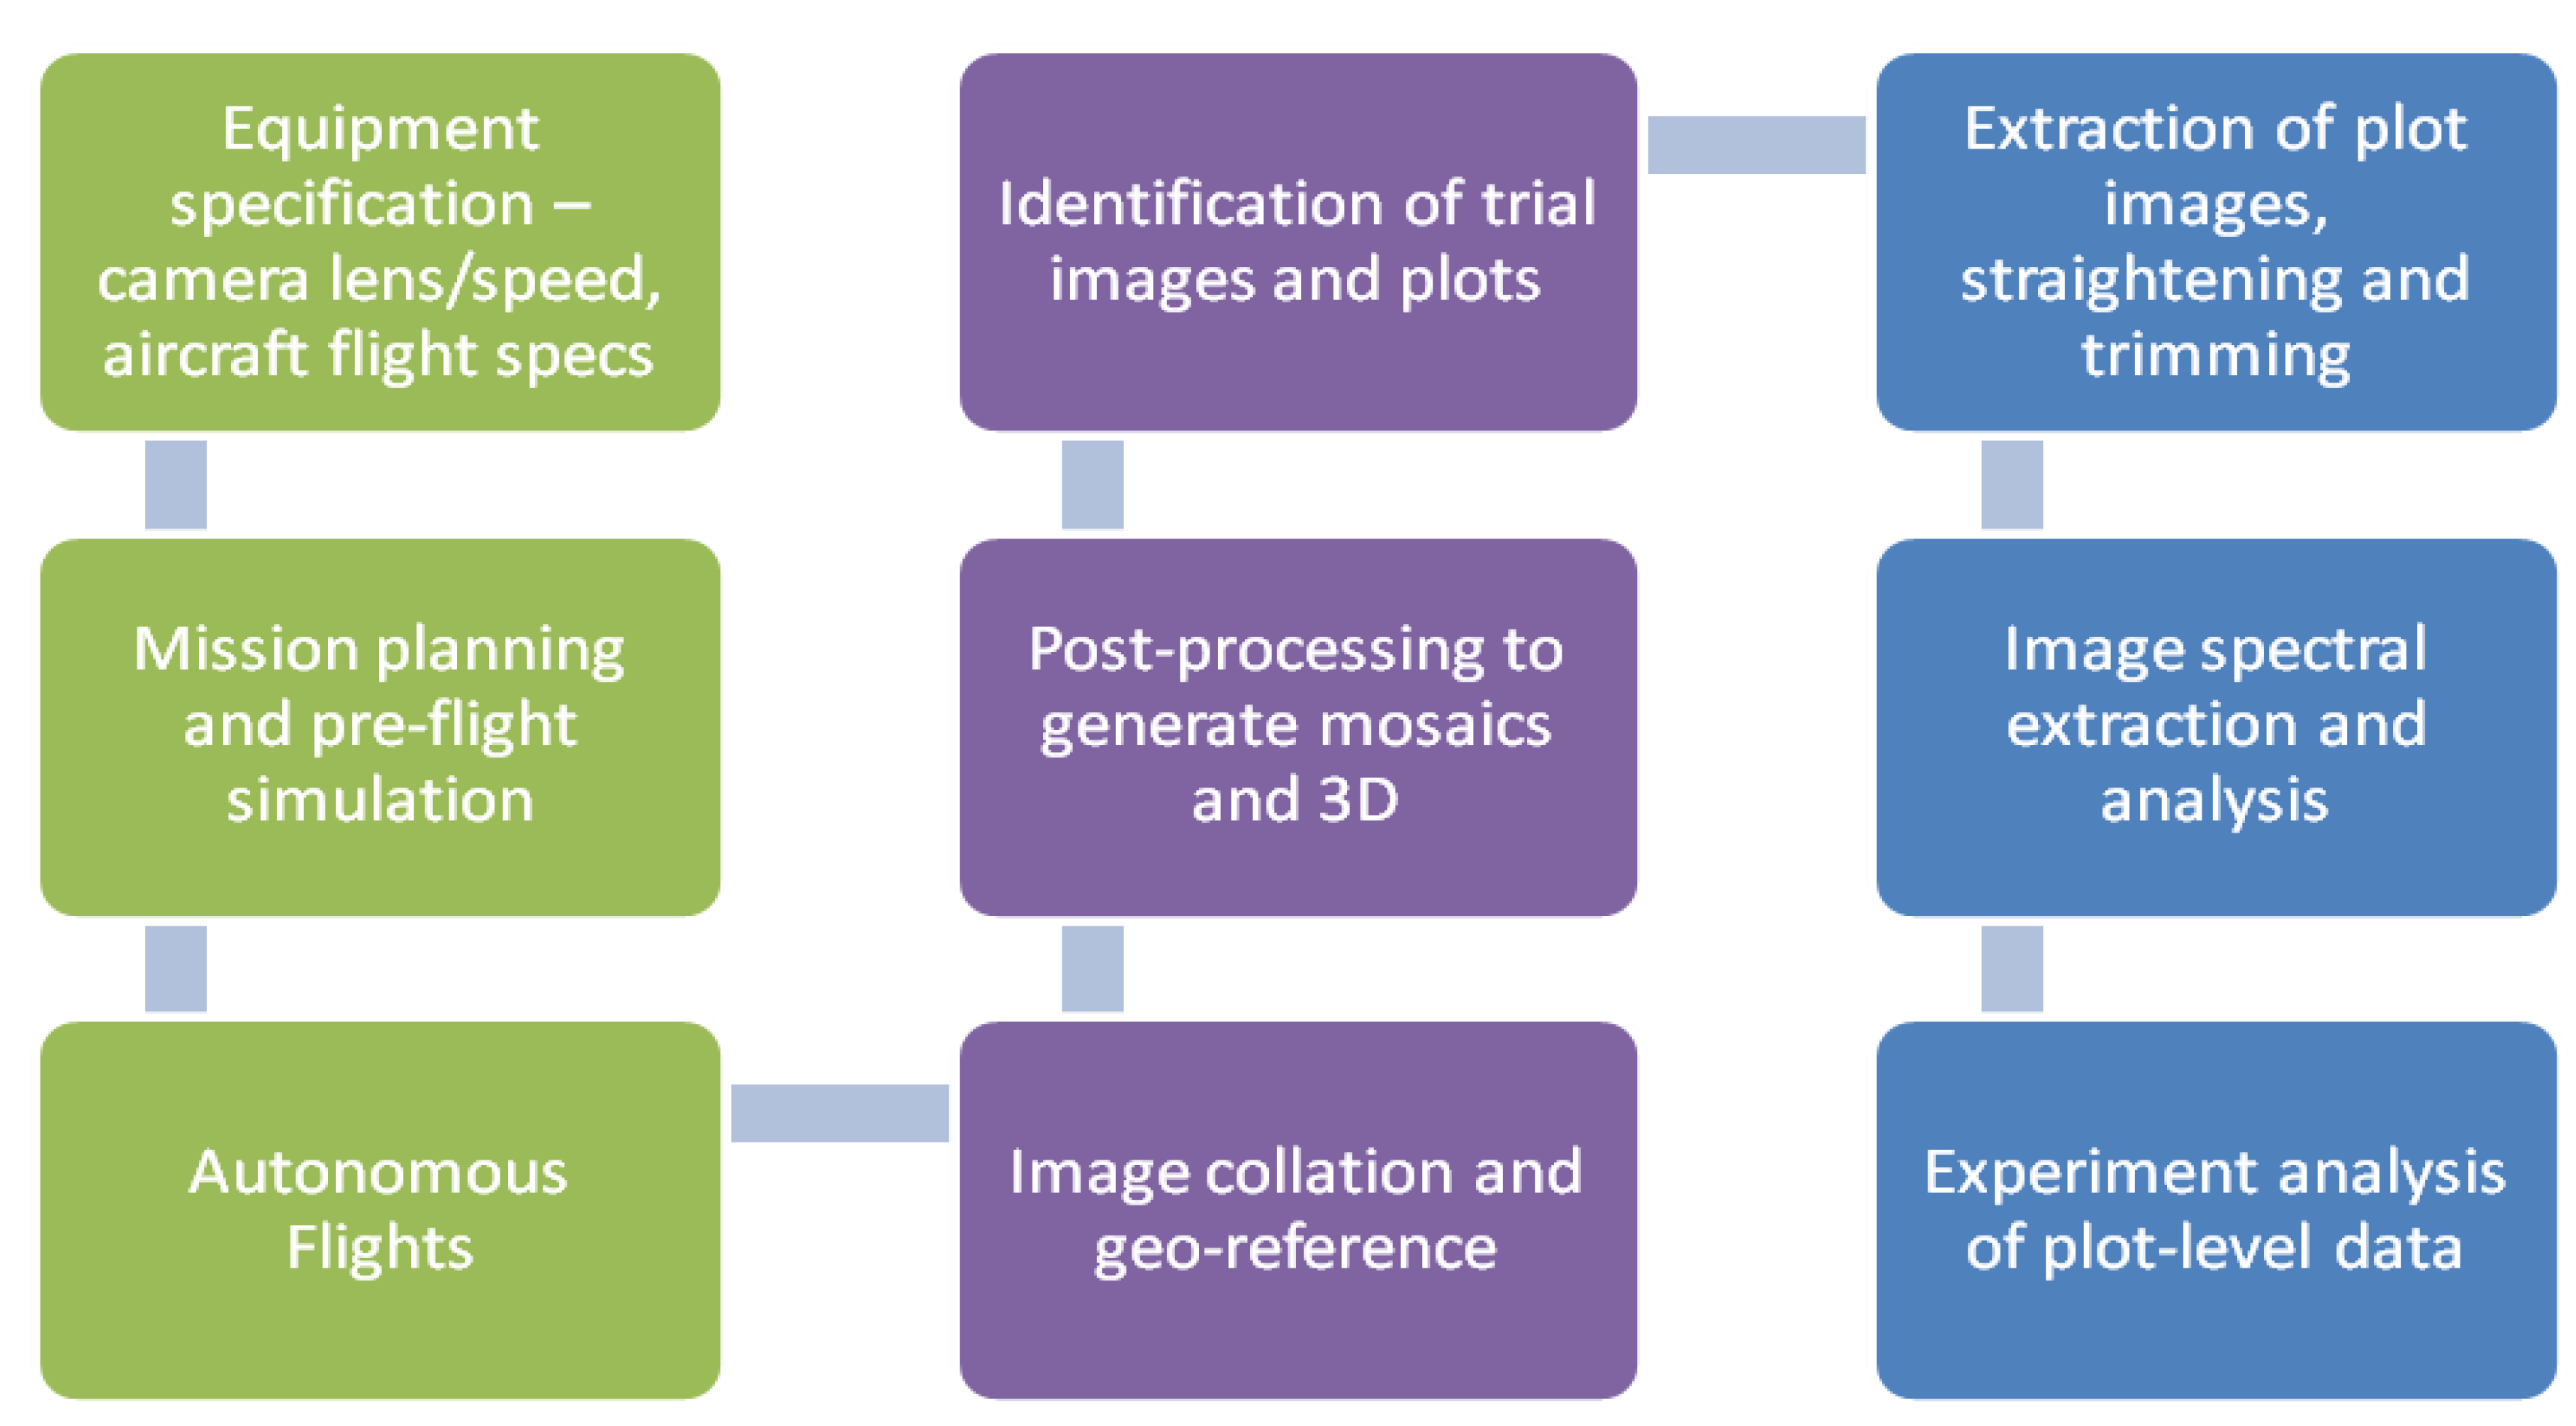
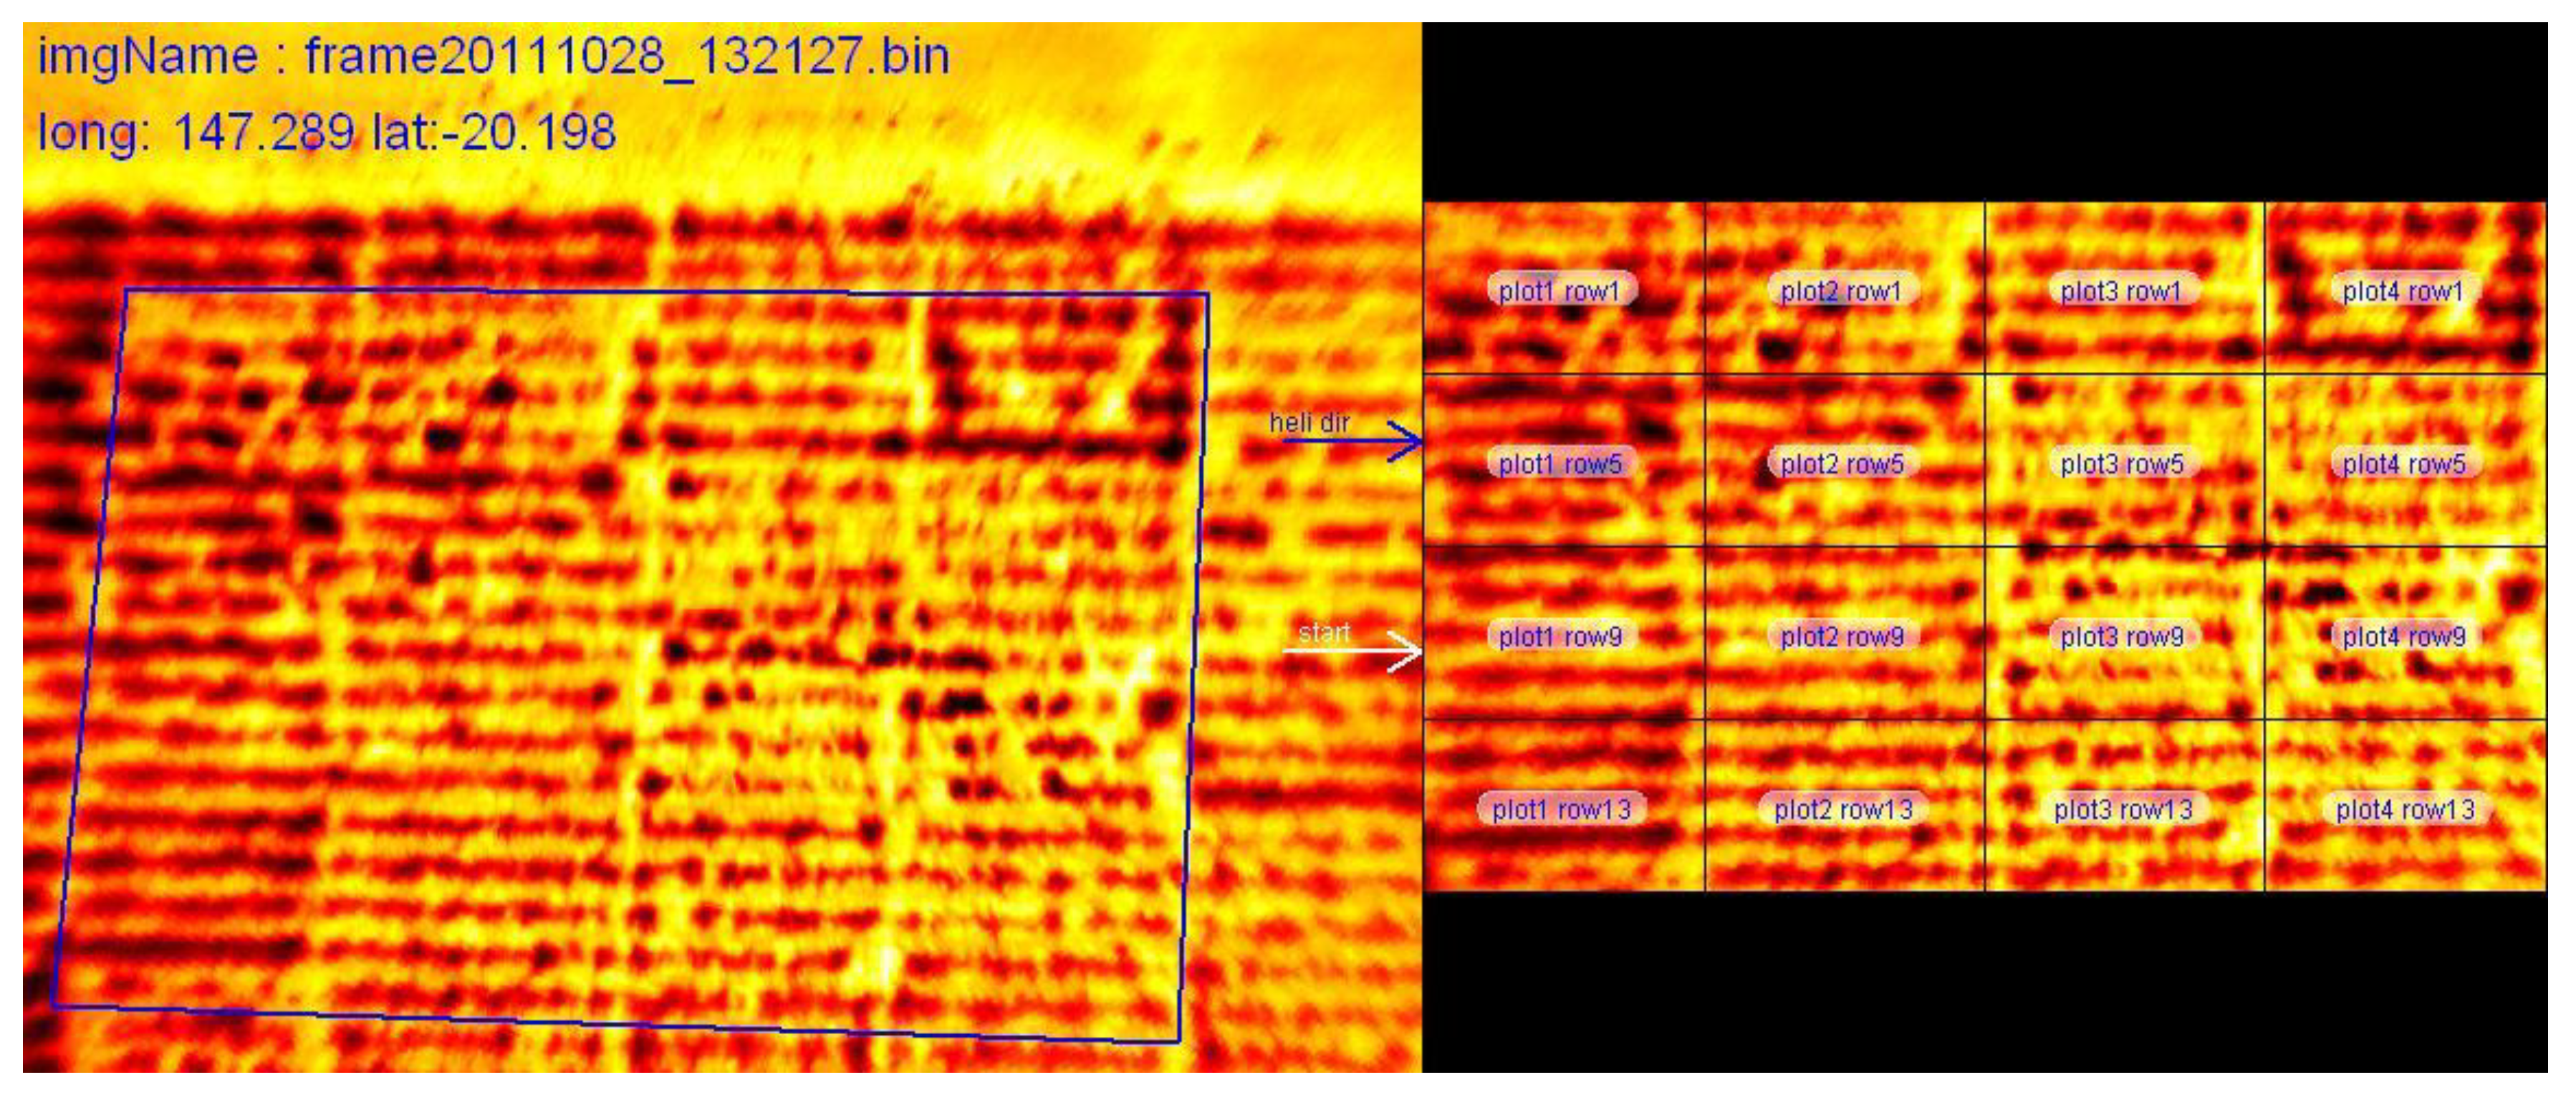
Agronomy 04 00279 g001
Figure 2. Aerial image analysis workflow showing pre-flight (left), post-flight (centre) and image processing (right) tasks.
Agronomy 04 00279 g002

2. Results and Discussion

Research on the utility of applying autonomous systems technology in plant breeding field experiments began in 2009, followed by improvements in hardware and software systems for both gathering and processing the images between 2011 and 2013. This section provides an evaluation of the performance of the platform for FBP applications in multiple crops, considering the use of aerial imagery to detect crop cover and crop canopy temperature and to generate digital elevation models of variations in crop height related to the lodging of the plots.

2.1. Evaluation of Pheno-Copter Performance

The first version of the CSIRO platform as a Pheno-Copter was flown at The University of Queensland campus, Gatton, Queensland (27.55° S, 152.34° E), on September 10, 2009, following a manually-created way-point route and carrying a single digital compact camera with continuous time delay triggering. Details of the system requirements for task and of the platform and cameras are given in the Experimental Section. In its most recent guise, the flight-plan was automatically generated and the entire flight of three cameras was autonomous, except for the operator needing to control the vertical descent speed on landing and to signal the touchdown. Log books are kept for these helicopters, recording flight times, maintenance, technical problems and incidents, and the on-board computer retains detailed flight logs. These logs include the position and attitude of the helicopter, image capture events and detailed information on many aspects of the helicopter system performance (engine parameters, servo commands, parameters of the electric power system, 
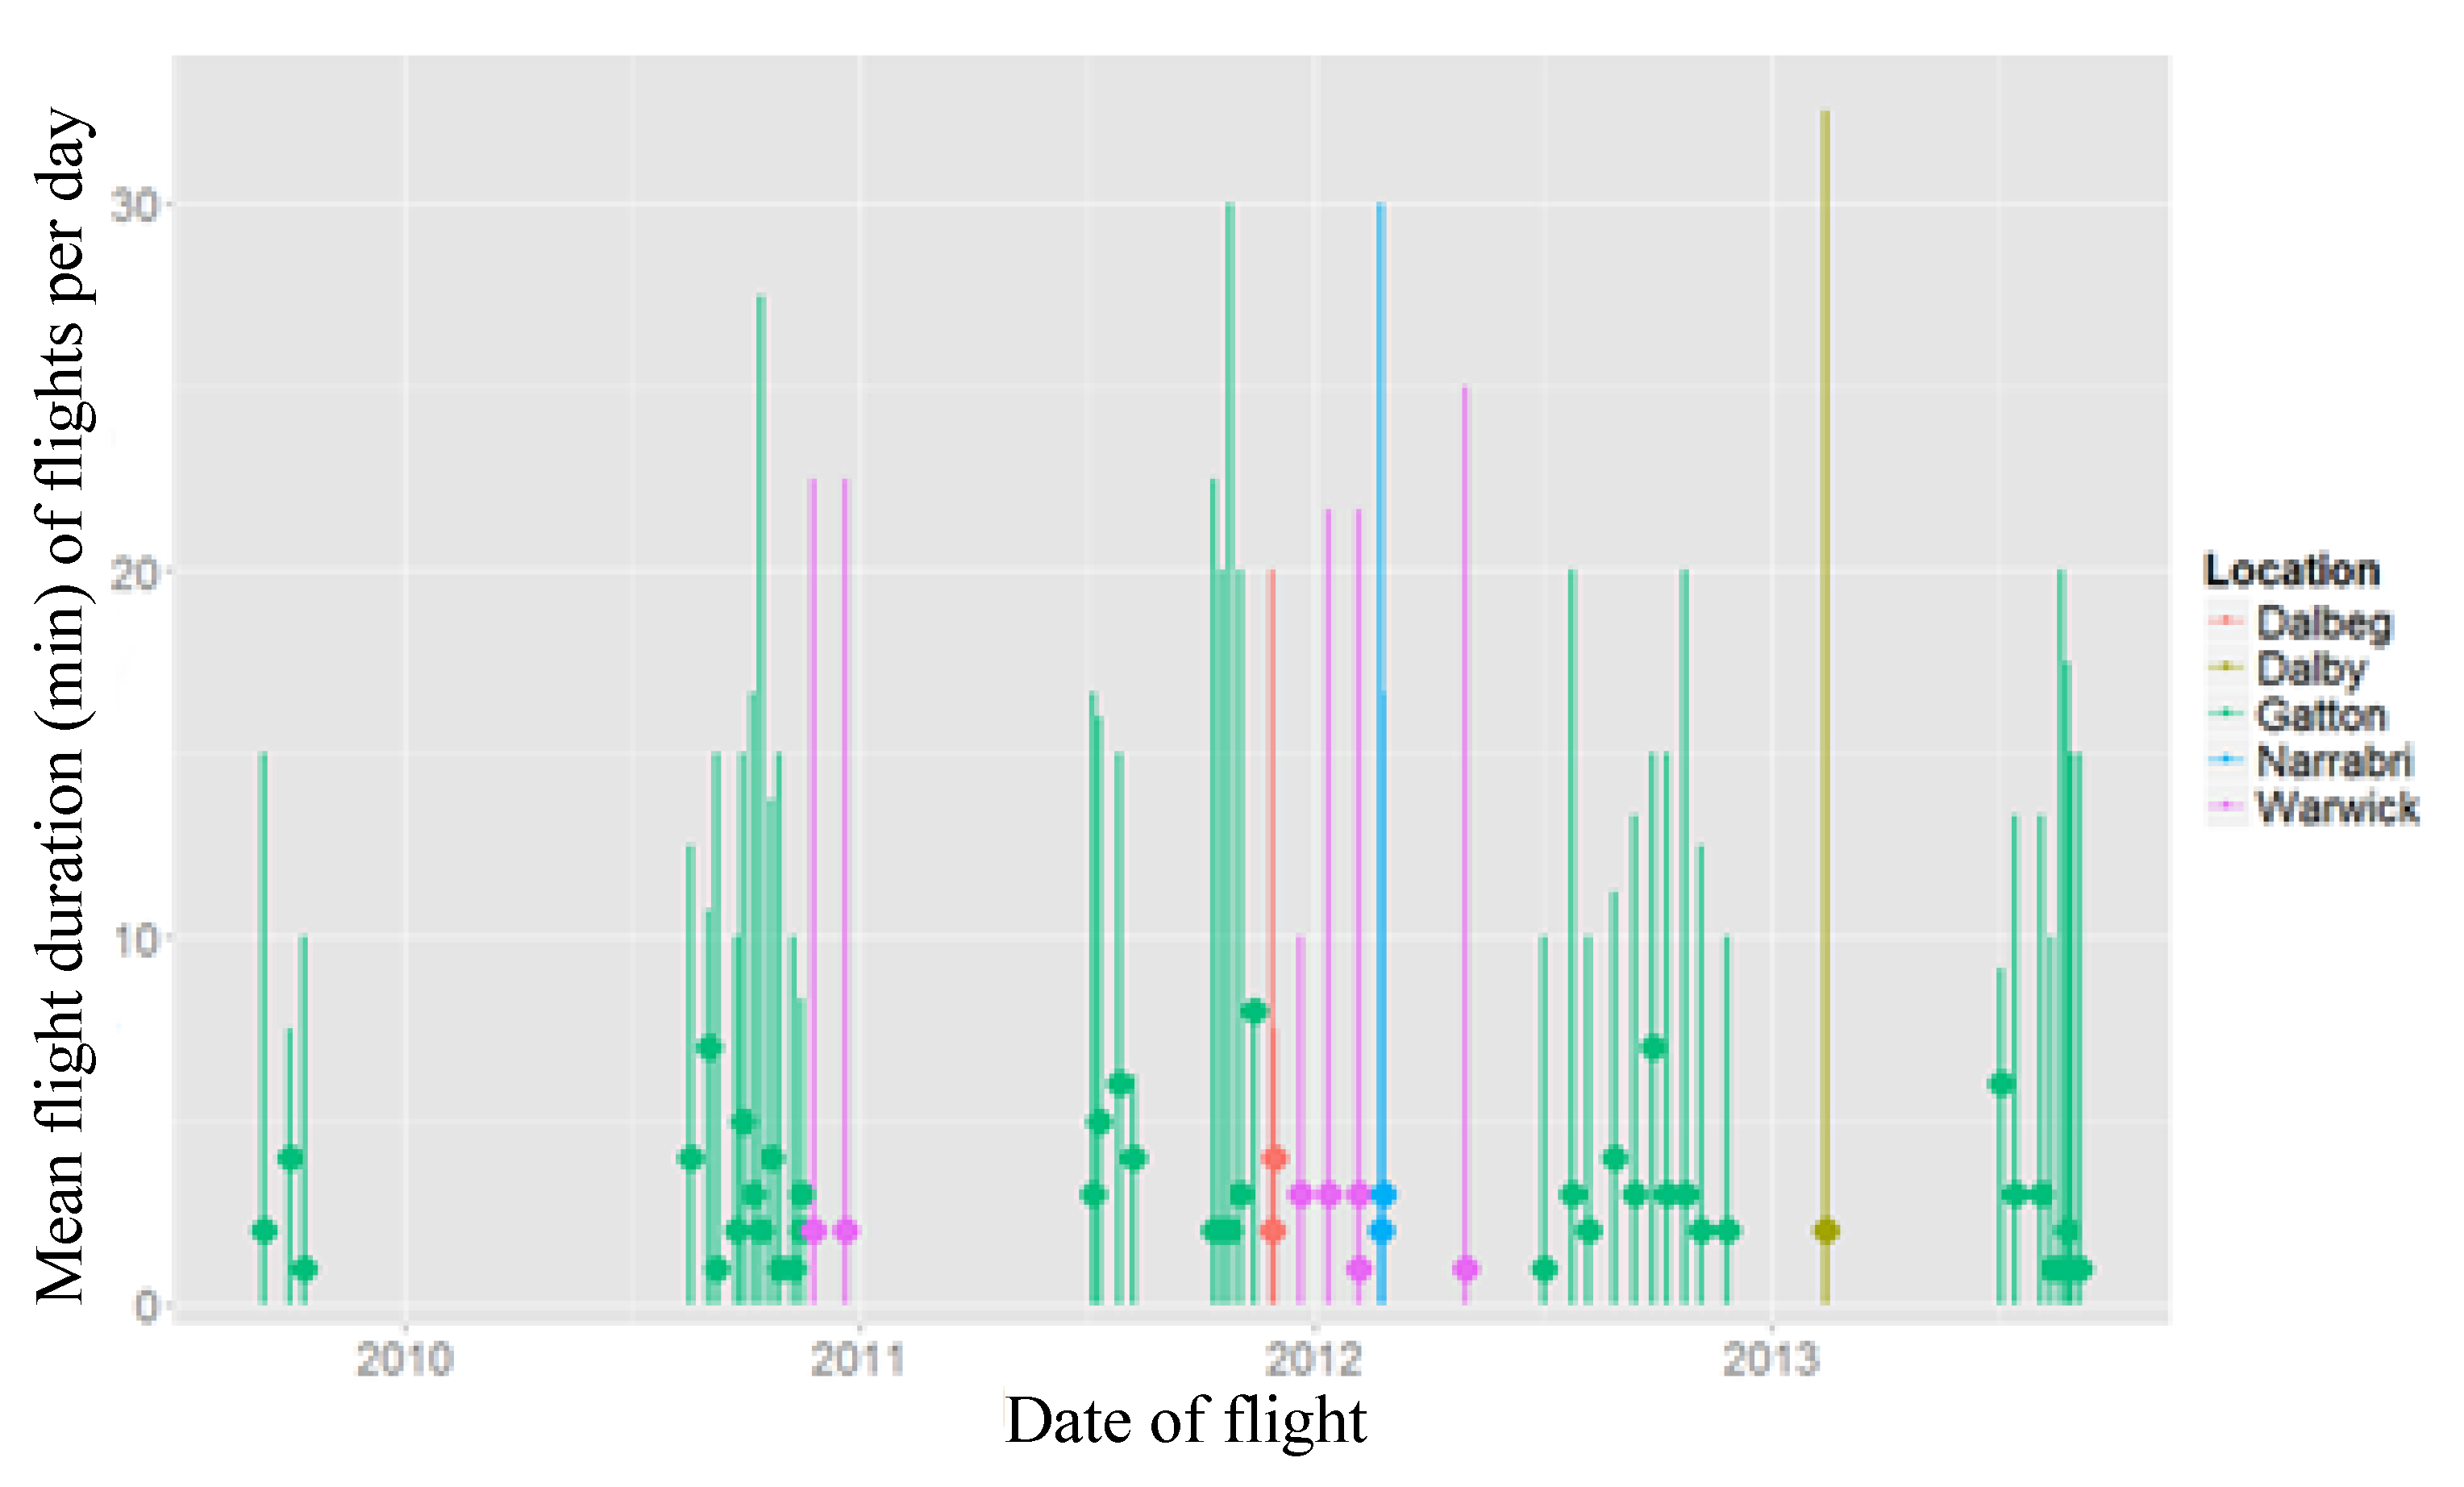
etc.). Since 2009, 155 Pheno-Copter flights have been logged using four of six available helicopters on 55 days, for 37.5 flight hours and an average flight time of just over 15 min (Figure 3). Between August, 2008, and March, 2014, and including other research applications, the six CSIRO helicopters of the same type have completed more than 275 flight hours and more than 1500 landings, with the loss of four. Two of the Pheno-Copters were lost—one, the mechanical failure of the COTS, and one, operator error, with the other two losses in other applications also being mechanical failures of the COTS. Record keeping and thorough failure analysis has allowed the continuous improvement of the helicopter system through the development of better components, the replacement of components and new inspection and maintenance procedures. Manual checks are performed before each flight, and flight tests are conducted whenever a system component is modified, following a strict protocol. With the current helicopter system, the most laborious maintenance tasks are the replacement of the engine after 25 h of use and the maintenance of the airframe every 30 h.
Figure 3. The average duration of flights (columns) and number of flights per day (symbols) between September, 2009, and September, 2013, at five locations for crops of wheat (Gatton 27.55° S, 152.34° E), sorghum (Dalby 27.36° S 151.24° E, Warwick 28.22° S, 152.10° E), sugarcane (Dalbeg 20.2° S, 147.3° E) or cotton (Narrabri 30.20° S, 149.61° E).
Agronomy 04 00279 g003
The Pheno-Copter has been demonstrated to be sufficiently reliable to undertake up to seven flights per day and almost two hours of flight time. Allowing 5 min for take-off/landing and a standard cruising speed of 3 m s−1 when taking images, the platform has flown more than 250 km so far. When flown by an operator without piloting skills in 2013 in its near-completely autonomous form (operator-assisted landing), the flight time was preceded by about 10 to 15 min of pre-flight setup and tethered engine testing (automated), so that the 3 ha of field experiments at Gatton could be imaged in 20 to 30 min. With its payload capacity of about 1.5 kg for 30 min endurance or 1.1 kg for 60 min endurance, a major advantage of the platform compared to smaller electric rotorcraft is that it could carry all three cameras and cover the whole area in a single flight. This provides a consistent dataset and reduces the field flight time. A small COTS electric octocopter, which was evaluated until it failed after six missions, needed, for five flights, at least twice the field flight time compared to the Pheno-Copter and required charging of at least 10 battery packs over the day. Moreover, the pitch and roll angles of the airframe of our single-rotor helicopter were relatively small during steady flight in low-wind conditions, eliminating the need for an attitude angle-compensated camera system.

2.2. Estimation of Ground Cover of Hybrids in a Sorghum Breeding Trial

Plant breeders frequently record “establishment” scores to use as independent co-variates in their analyses of yield trials. These assessments of ground cover are typically made visually or with ground-level digital images, need to be made in a timely fashion several weeks after planting, regardless of soil conditions, and require substantial labour to collect in large experiment programs.
In early 2011, a sorghum trial comprising >900 genotypes grown in two-row (1.8 m wide) plots that were each 4 m in length was machine planted at the Hermitage Research Station in Warwick (28.2° S, 152.0° E) as part of the state breeding research program [20]. The trial was a row/column design with augmented check genotypes distributed across the experiment. The crop had variable establishment, as many of the genotypes varied in their seed viability and vigour, so that there was substantial variation in the plant stand. On December 21, 2011, at six weeks after sowing, a flight was made at 60 m of elevation using the digital visual camera (see Experimental Section) and following a grid-like plan as similar to the example that is discussed in the in Experimental Section.
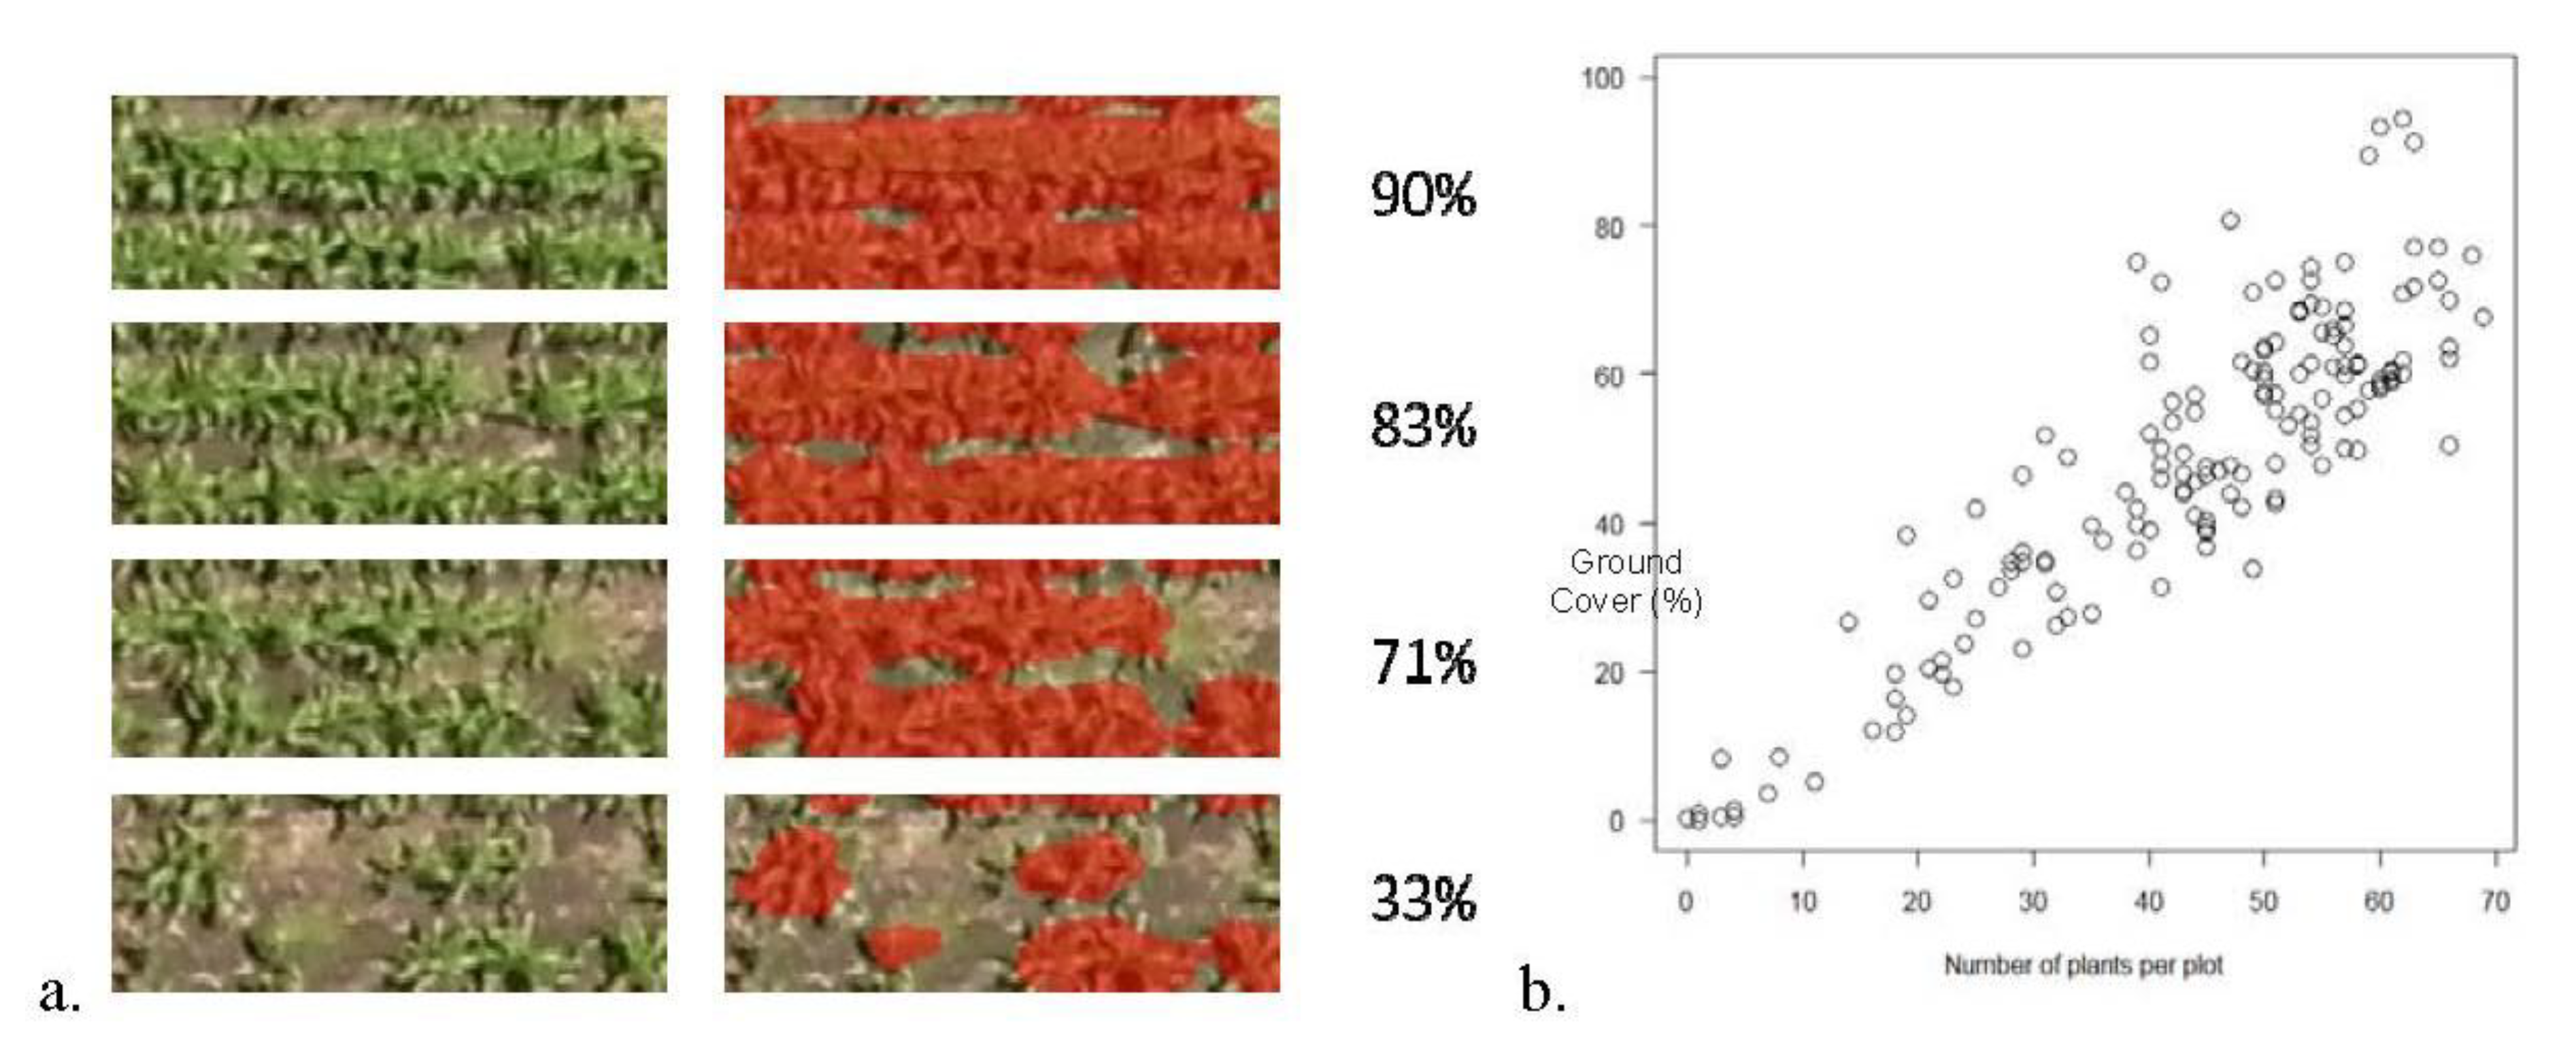
Analyses of images that covered the entire experiment were thresholded to estimate green cover in each plot, with a range of contrasting adjacent plots shown in Figure 4. Within two days of the flight, plant counts were made in 100 random plots, with these counts having a strong correlation (r2 = 0.78) with the estimates of green cover from the images. Using the ground cover data and experimental design, best linear unbiased predictors (BLUPs) were estimated for each genotype in a mixed effects statistical model that accounted for spatial trends in row and column directions. The trial included the hybrids that had been created using the F4 progeny from 17 diverse parents with ca. 50 hybrids per parent. 
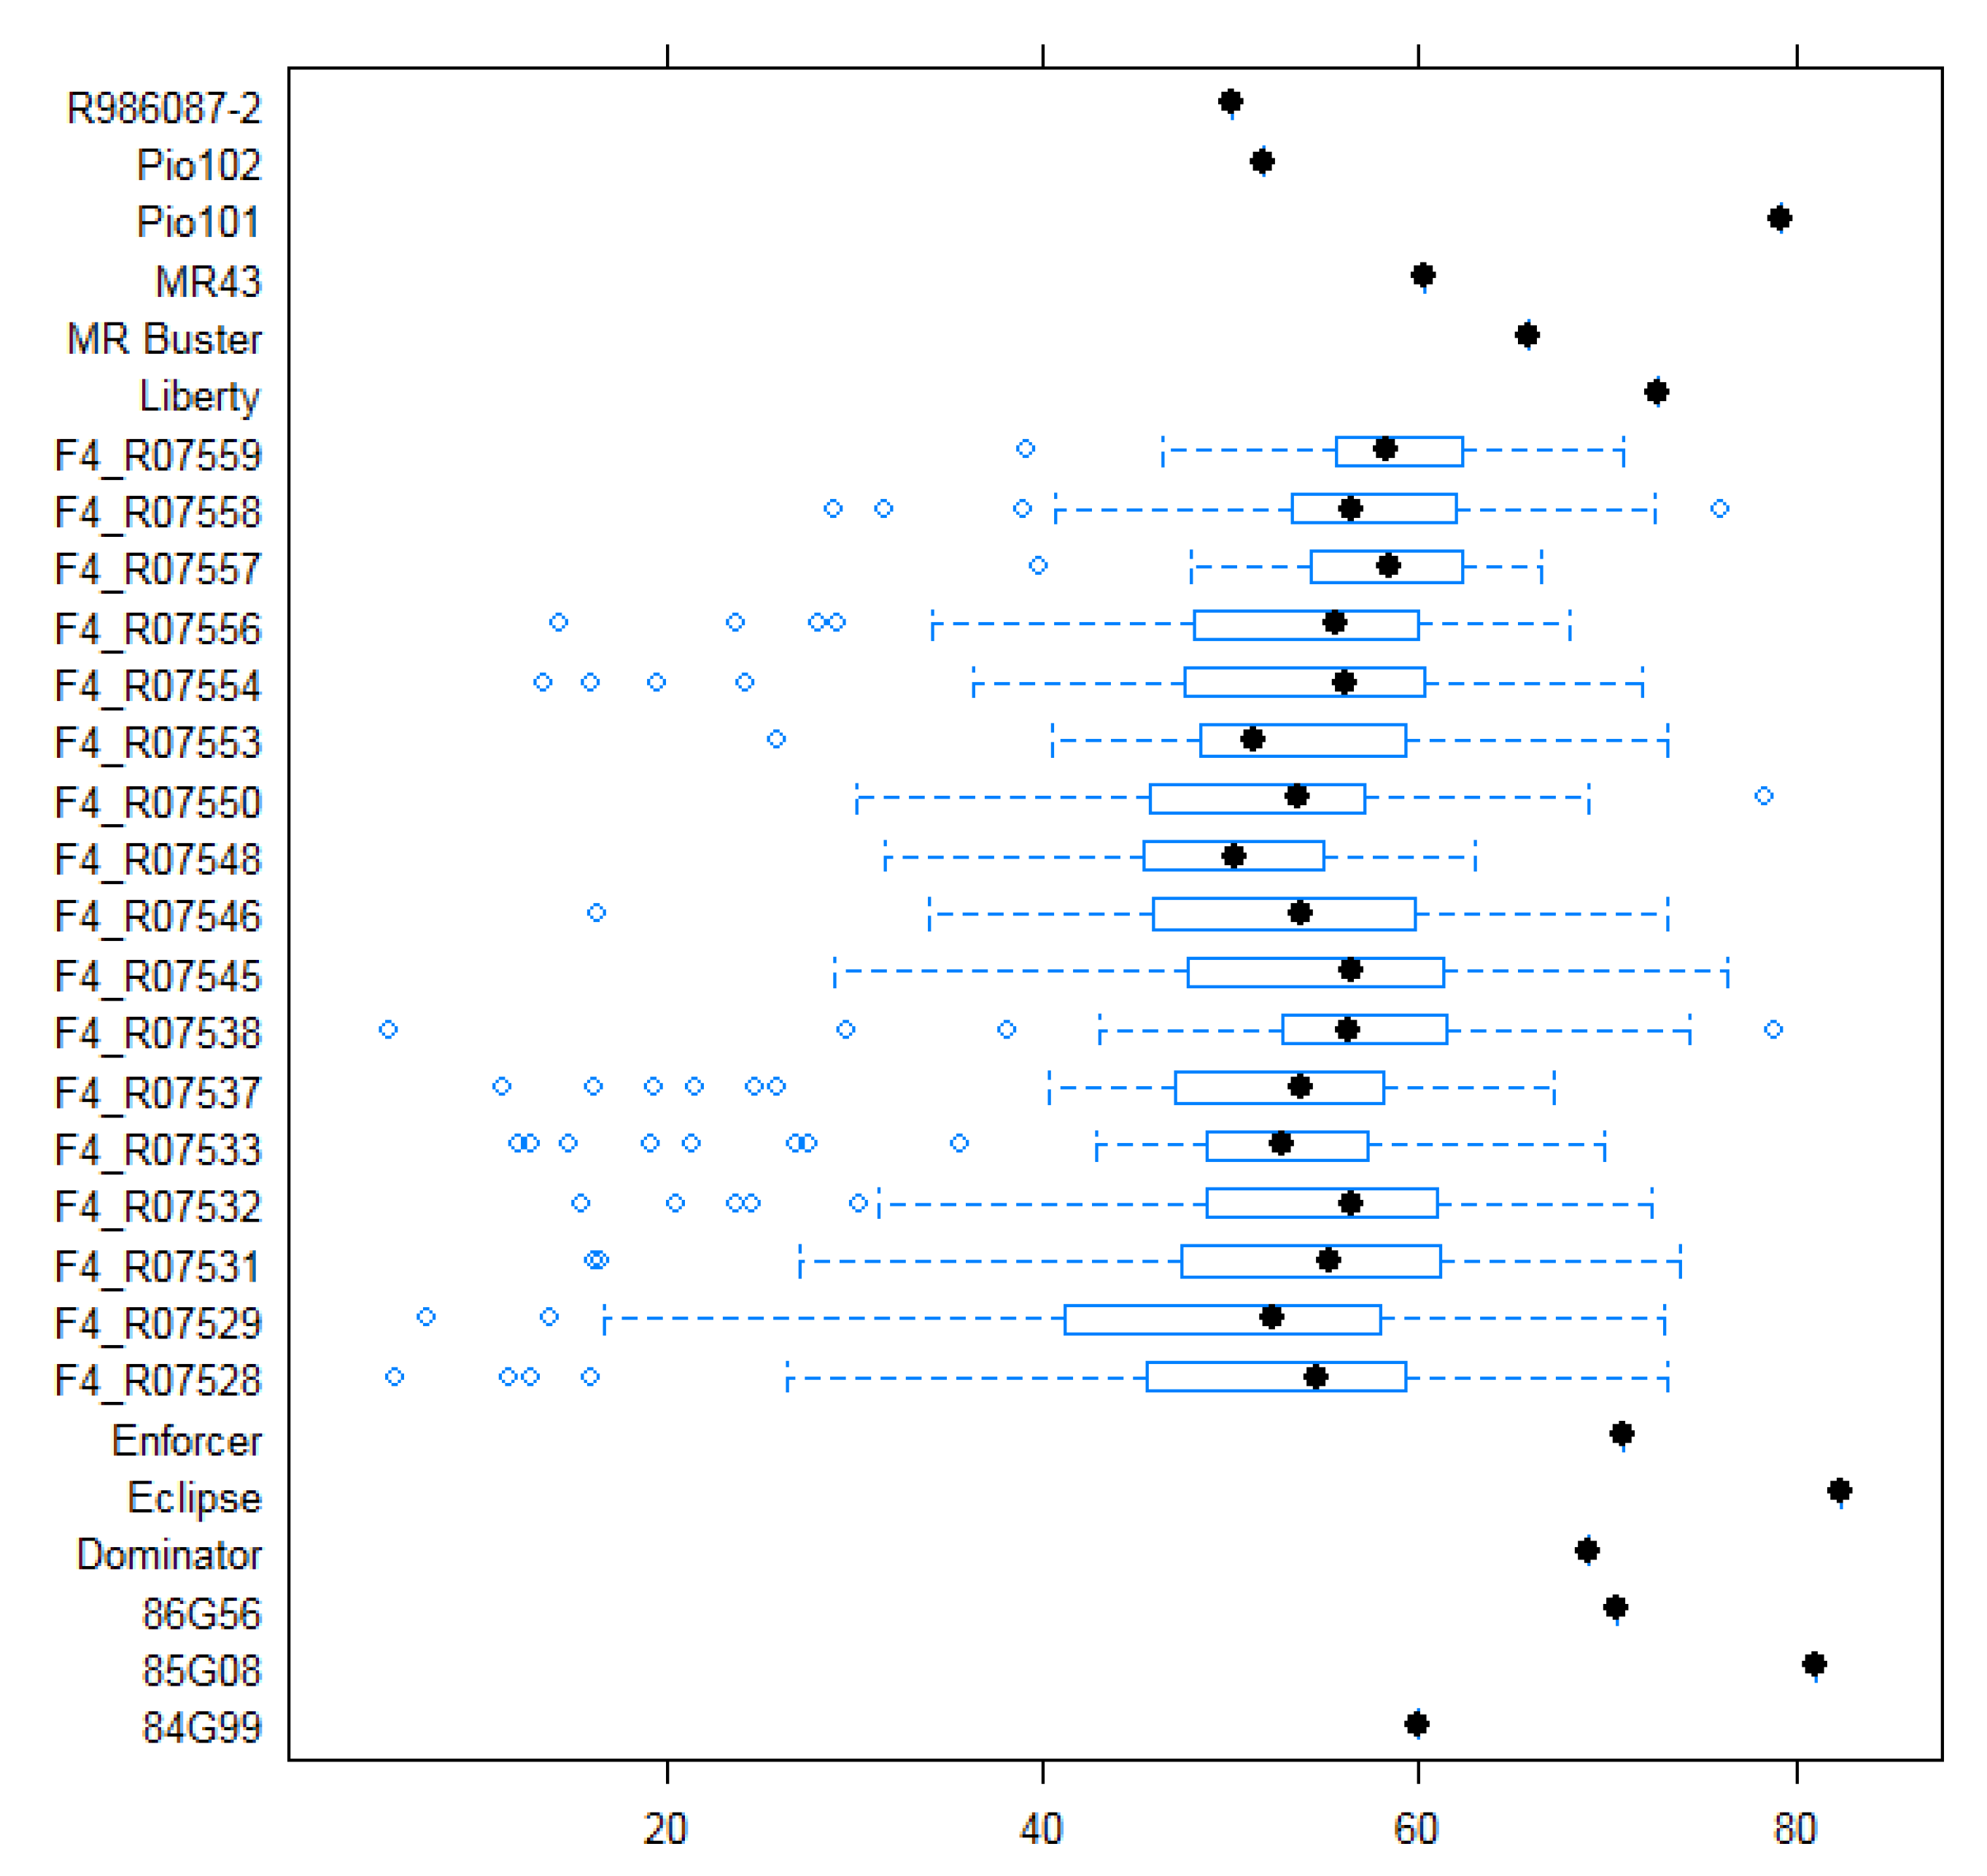
Figure 5 shows boxplots of the BLUPs, which indicate the values of the commercial checks (single points) and the distribution of values for the multiple hybrids for each F4 cross-parent. While most commercial lines and checks had ground cover estimates of 60% or greater, the hybrids from the F4 progeny had a substantial range of green cover, with the mean of the progeny hybrids being less than the checks. However, within each F4 family, the breeder could identify one or more hybrids that had high ground cover based on the image analysis. These hybrids and their parent lines would be good candidates for future breeding for increased ground cover.
For trials of several 1000 plots, ground-based estimates by visual scores or with cameras may take many hours to collect, compared to the 10- to 15-min flights that are possible with a UAS platform. The first flight of the day takes about 15 min to setup, while turn-around flights take about 5 min. Alternative estimates include the types of FBP vehicle described by [1] and others, as well as approaches that utilize laser detection of early biomass [21], for example, or that deploy methods that use near infrared sensors to detect vegetation cover. In addition to the time and labour savings associated with aerial detection, this speed and altitude of the platform assists in dealing with issues of variation in sun conditions that affect the quality of photography and non-active near-infrared methods compared to conventional aircraft.
Figure 4. Ground cover at six weeks after planting in a sorghum breeding trial at Warwick, December 21, 2011. (a) Four extracted plot images end trimmed at 10% and thresholded (to the right) to estimate green ground cover and (b) the correlation (r2 = 0.78) between the number of plants per plot and estimated green cover for 100 plots of the trial. Each ground cover point was averaged from at least two or, more commonly, three, images.
Agronomy 04 00279 g004
Figure 5. The boxplots of the best linear unbiased predictors (BLUPs) of green cover from a trial of commercial sorghum genotypes and of multiple hybrids produced from the F4 progeny of 17 families (ca. 50 hybrids per F4 family), where the progeny were derived from separate crosses between R986087-2 and the 17 parental lines.
Agronomy 04 00279 g005

2.3. Canopy Temperature and Estimate of a Relative Transpiration Index in Sugarcane

Collaborators at Dalbeg (20.2° S, 147.3° E) in the Burdekin irrigation area in northern Queensland are undertaking research to compare the yield and sugar content of diverse sugarcane clones when grown in drought or non-drought conditions. Analyses of these clones include extensive monitoring of leaf-level conductance, as well as biomass sampling to characterise growth rates.
A trial at this site comprised three treatments (drought, no irrigation; semidr, half irrigation; irrig, full irrigation), where irrigation was supplied via furrows on the laser-levelled site. In each irrigation treatment, the same 40 clones, comprising commercial lines and diverse germplasm sources (designated by the prefix “CT”) were planted as single-bud setts in May, 2011. The plot sizes were four rows (6 m) wide by 10 m long with three blocks of 40 clones replicated in each treatment. While the drought treatment was rainfed only, the “semidr” and “irrig” crops had been irrigated the week before measurement, with the irrigated treatment being watered at least once every three weeks from planting, depending on the rainfall received. On November 28–29, 2011, flights were made over the trial with the Ricoh cameras and the Miricle thermal camera on-board. At that time, the thermal camera had not been calibrated against canopy temperature. Ground measurements showed canopy temperatures of 30 to 38 °C on the day, as recorded by a hand-held IR thermometer (Mikron IN15+, IMPAC Infrared GmbH, Frankfurt [22]). A relative temperature index was computed from images similar to that in Experimental Section. The range of the thermal index was derived after masking out the hot soil and dead leaves (>ca. 50 °C) from the images. For each pixel, the index is computed as the pixel value divided by the difference between the maximum and the minimum pixel values for the masked image.
For each trimmed and thresholded image of a plot, the values of the masked pixels were averaged to determine the thermal index, and the ratio of masked pixels to total pixels was used as an estimate of green ground cover (Figure 6). As an approximation of the relative transpiration index of each plot, the ground cover was multiplied by (1 – the relative thermal index), given that higher temperatures are associated with lower transpiration rates. On this scale, the clones ranged in mean value between 0.2 and 0.45 in the drought treatment, with the lowest value being recorded for the clone Q190, which is a clone selected for performance in irrigated environments.
In general, there was little obvious variation among clones within either the drought or irrigated environments. However, in the semidr (partially irrigated environment), the unselected “CT” clones had greater variability in response when compared to the commercial clones, with at least six of the CT clones having substantially lower values in the semidr compared to the irrigated treatment. Commercial clones were not significantly different in their values for these two treatments.

2.4. Quantifying Crop Lodging in Wheat

In high yielding irrigated conditions, lodging is a major cause of yield loss, due both to premature senescence of the canopy and due to weathering of grain, especially in wet conditions. Wheat crops rarely lodge before stem elongation, a stage about halfway to flowering, but may lodge and sometimes “stand up” again on multiple occasions from this stage through to maturity. The date and extent of lodging are important considerations in the evaluation of the suitability of wheat varieties for high-input conditions, and breeders select against wheat genotypes that are susceptible to lodging.
Figure 6. (a) Approximation of the potential transpiration index for 40 clones of sugarcane in three different drought treatments (drought, semi-drought and irrigated) based on green leaf cover and relative crop temperature, as determined from images similar to that in Figure 4. Missing columns are “filler”, and missing plots had poor establishment or pigweed infestation and were eliminated based on inspection of the images. The upper figures are heatmaps of (b) the thresholded green cover estimates and (c) the relative crop temperature. Images were taken at 60 m of elevation on November 28, 2011, when the crop had just passed six months of age.
Agronomy 04 00279 g006
As part of an ongoing research program, an irrigated wheat trial (designated as 12GEHEAT-1) comprising 45 varieties in two replicates of 2 m-wide by 7 m-long plots, was sown on May 24, 2012, at the CSIRO research station near Gatton in southern Queensland (27.55° S, 152.34° E). The trial was subject to multiple lodging events after flowering. A flight made on September 28, 2012, while carrying two RICOH cameras (visual and NIR (red-edge) filtered, see the Experimental Section) enabled the visualization of the impact of some of the first lodging events that accompanied strong south-westerly winds of 30 to 40 km h−1 that were recorded by the adjacent weather station on September 21, 2012.
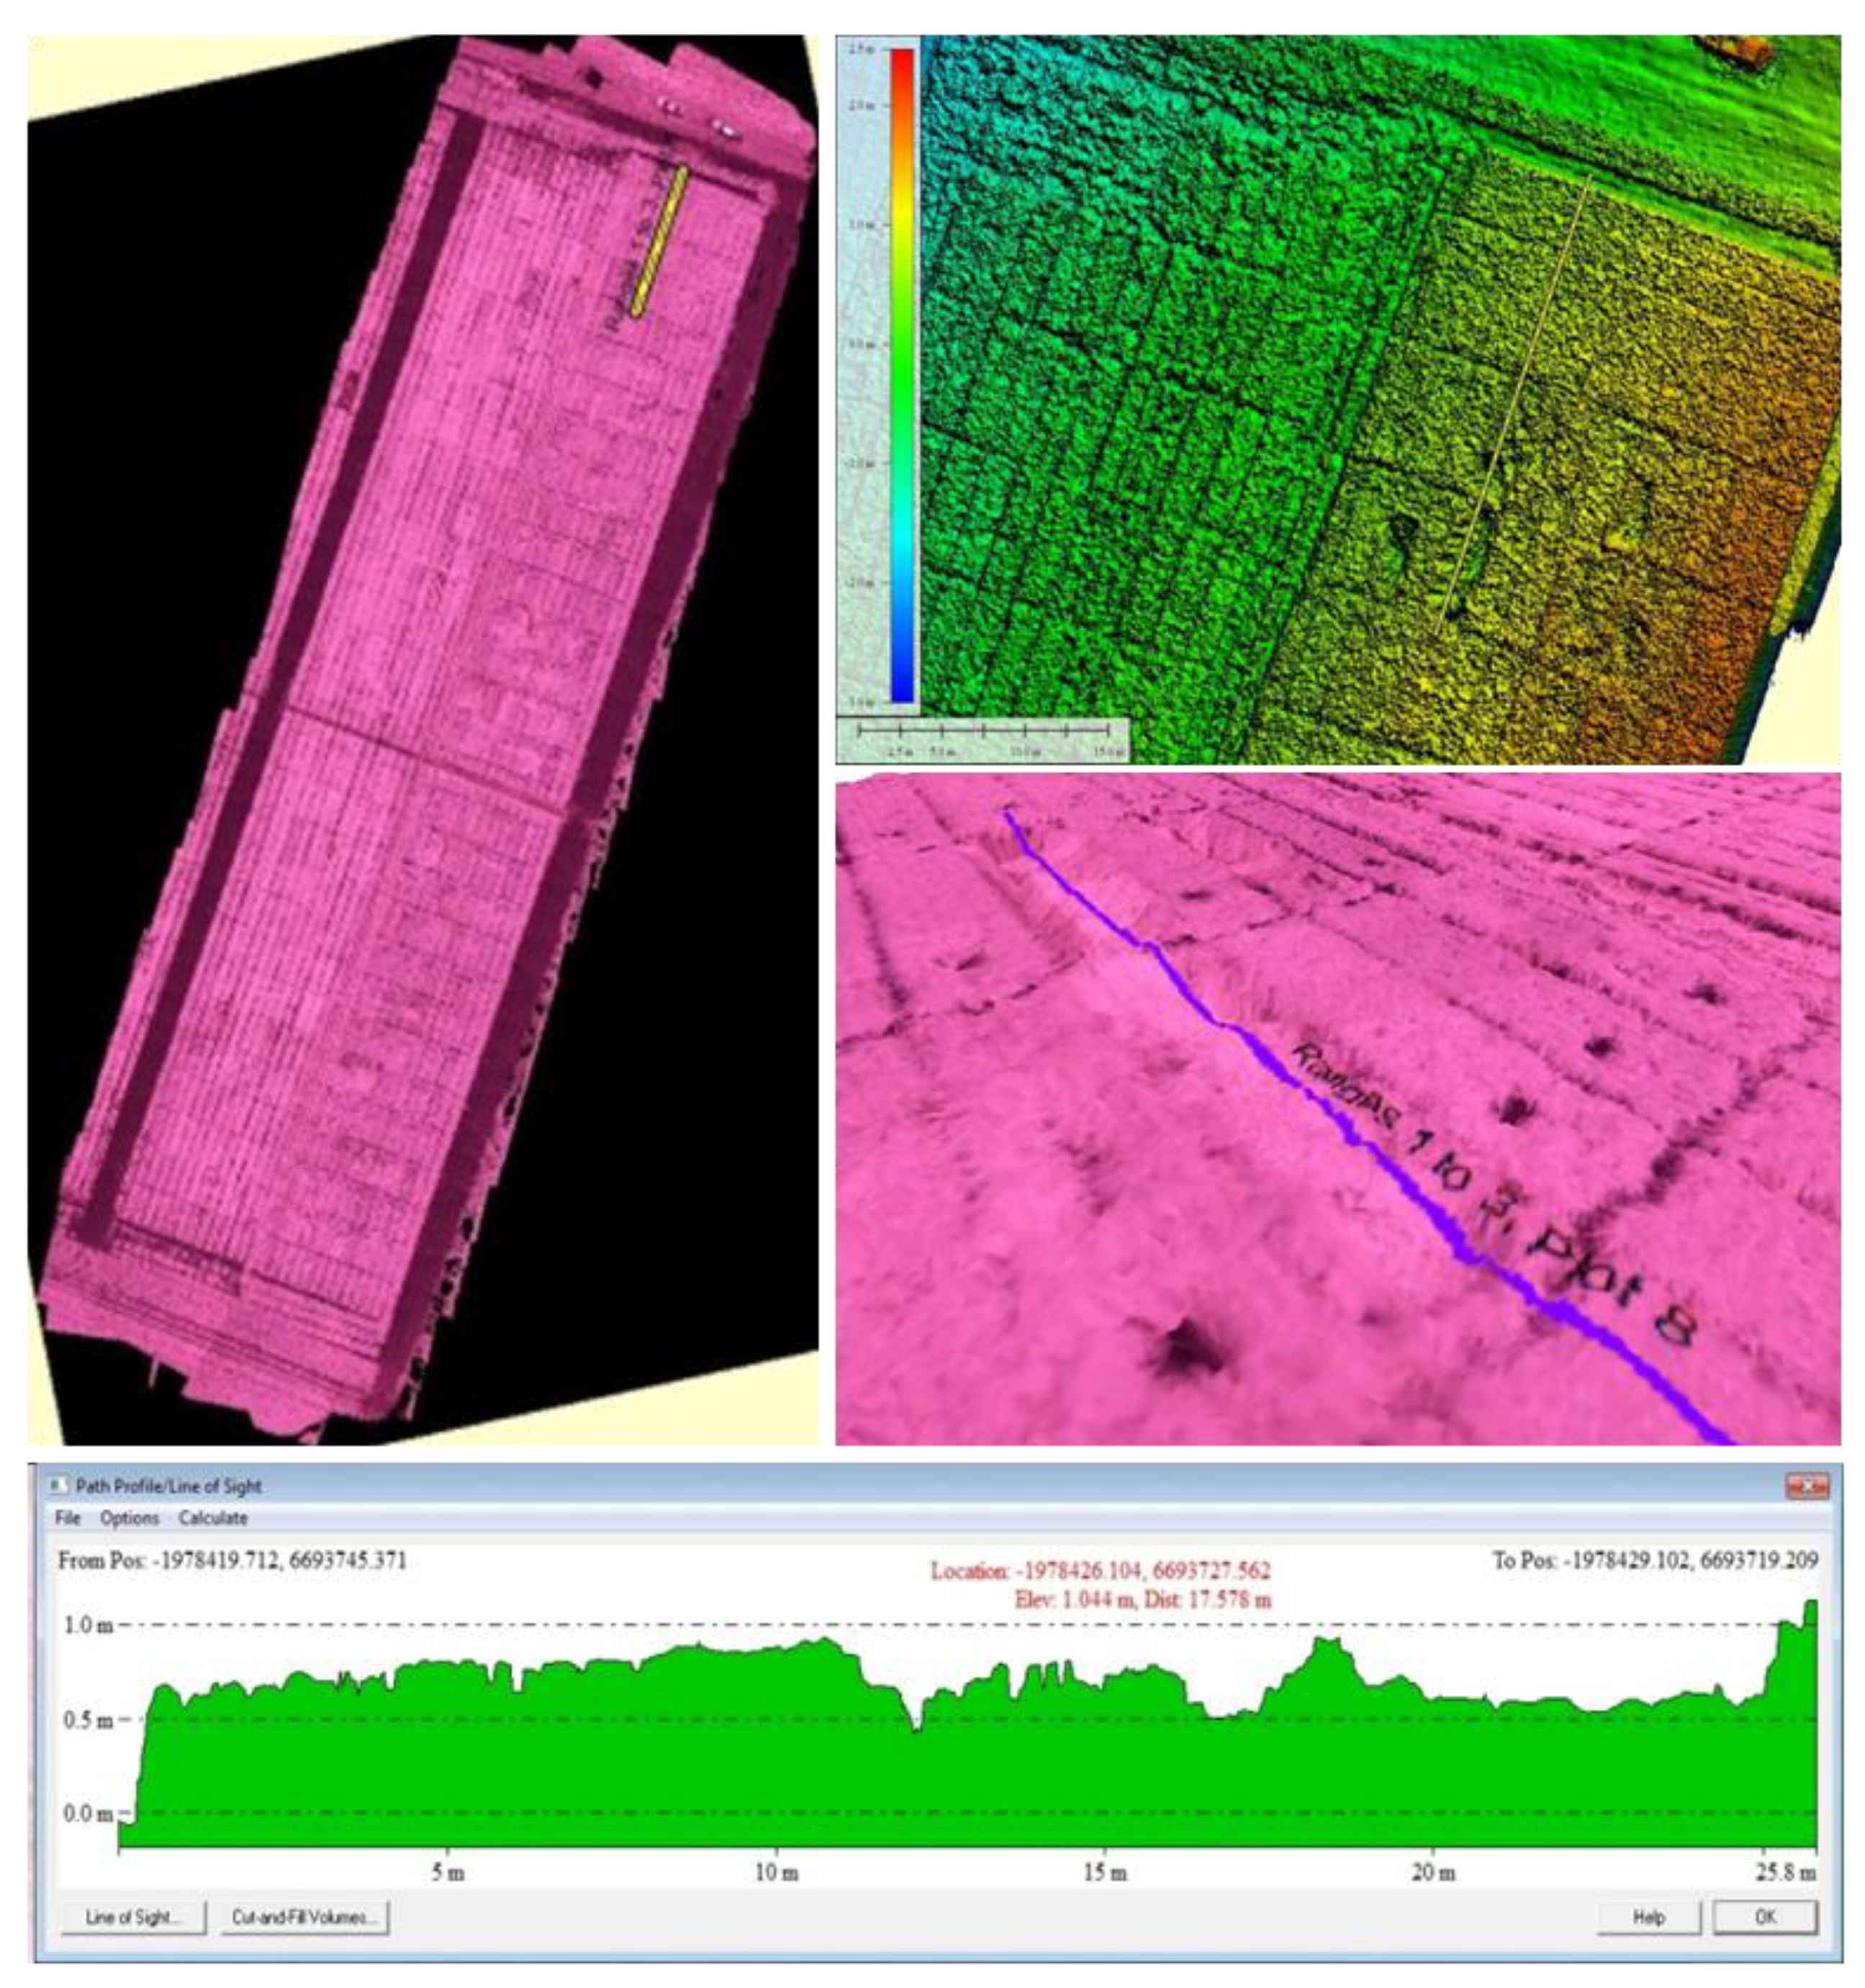
The JPG images from the NIR (red-edge) filtered camera were annotated using EXIF, a public domain software, to add metadata from the flight log, including latitude, longitude and elevation, in addition to the metadata that was stored by the cameras related to focal length, white balance setting, shutter speed and exposure. The images were submitted to the commercial “DroneMapper” service (see Materials and Methods) for processing into an ortho-mosaic and a three-dimensional point-cloud digital elevation model that is shown in polygon format in Figure 7. This model can be analysed by various tools to extract the height in an image from any x, y position, as indicated by an example transect in Figure 7. The mosaic was then processed by the Pheno-Copter R library to extract estimated heights for all 90 plots in the 12GEHEAT1 trial.
Figure 7. From an ortho-mosaic of NIR (red-edge) images (top left), the generated digital elevation model of wheat at about two weeks after average flowering time (top right) with a transect highlighted. A 3D view of the height transect through partially lodged plots is shown on a close-up of the DEM draped with the near-infrared ortho-mosaic (middle right), which allows the estimation of canopy height across three and a half 7-m plots (bottom). The dark squares in the near-infrared image are where sample quadrats were cut at anthesis.
Agronomy 04 00279 g007
To determine lodging, the variance was determined among pixel heights within each plot. By inspection of the images with the greatest variance, a height threshold (ca. 50 cm) was set in order to identify the lodged proportion of plots and the average height of lodged and standing fractions of the plots. For the date observed, the proportion of lodging was estimated in a range of 10% to 70% across the plots (
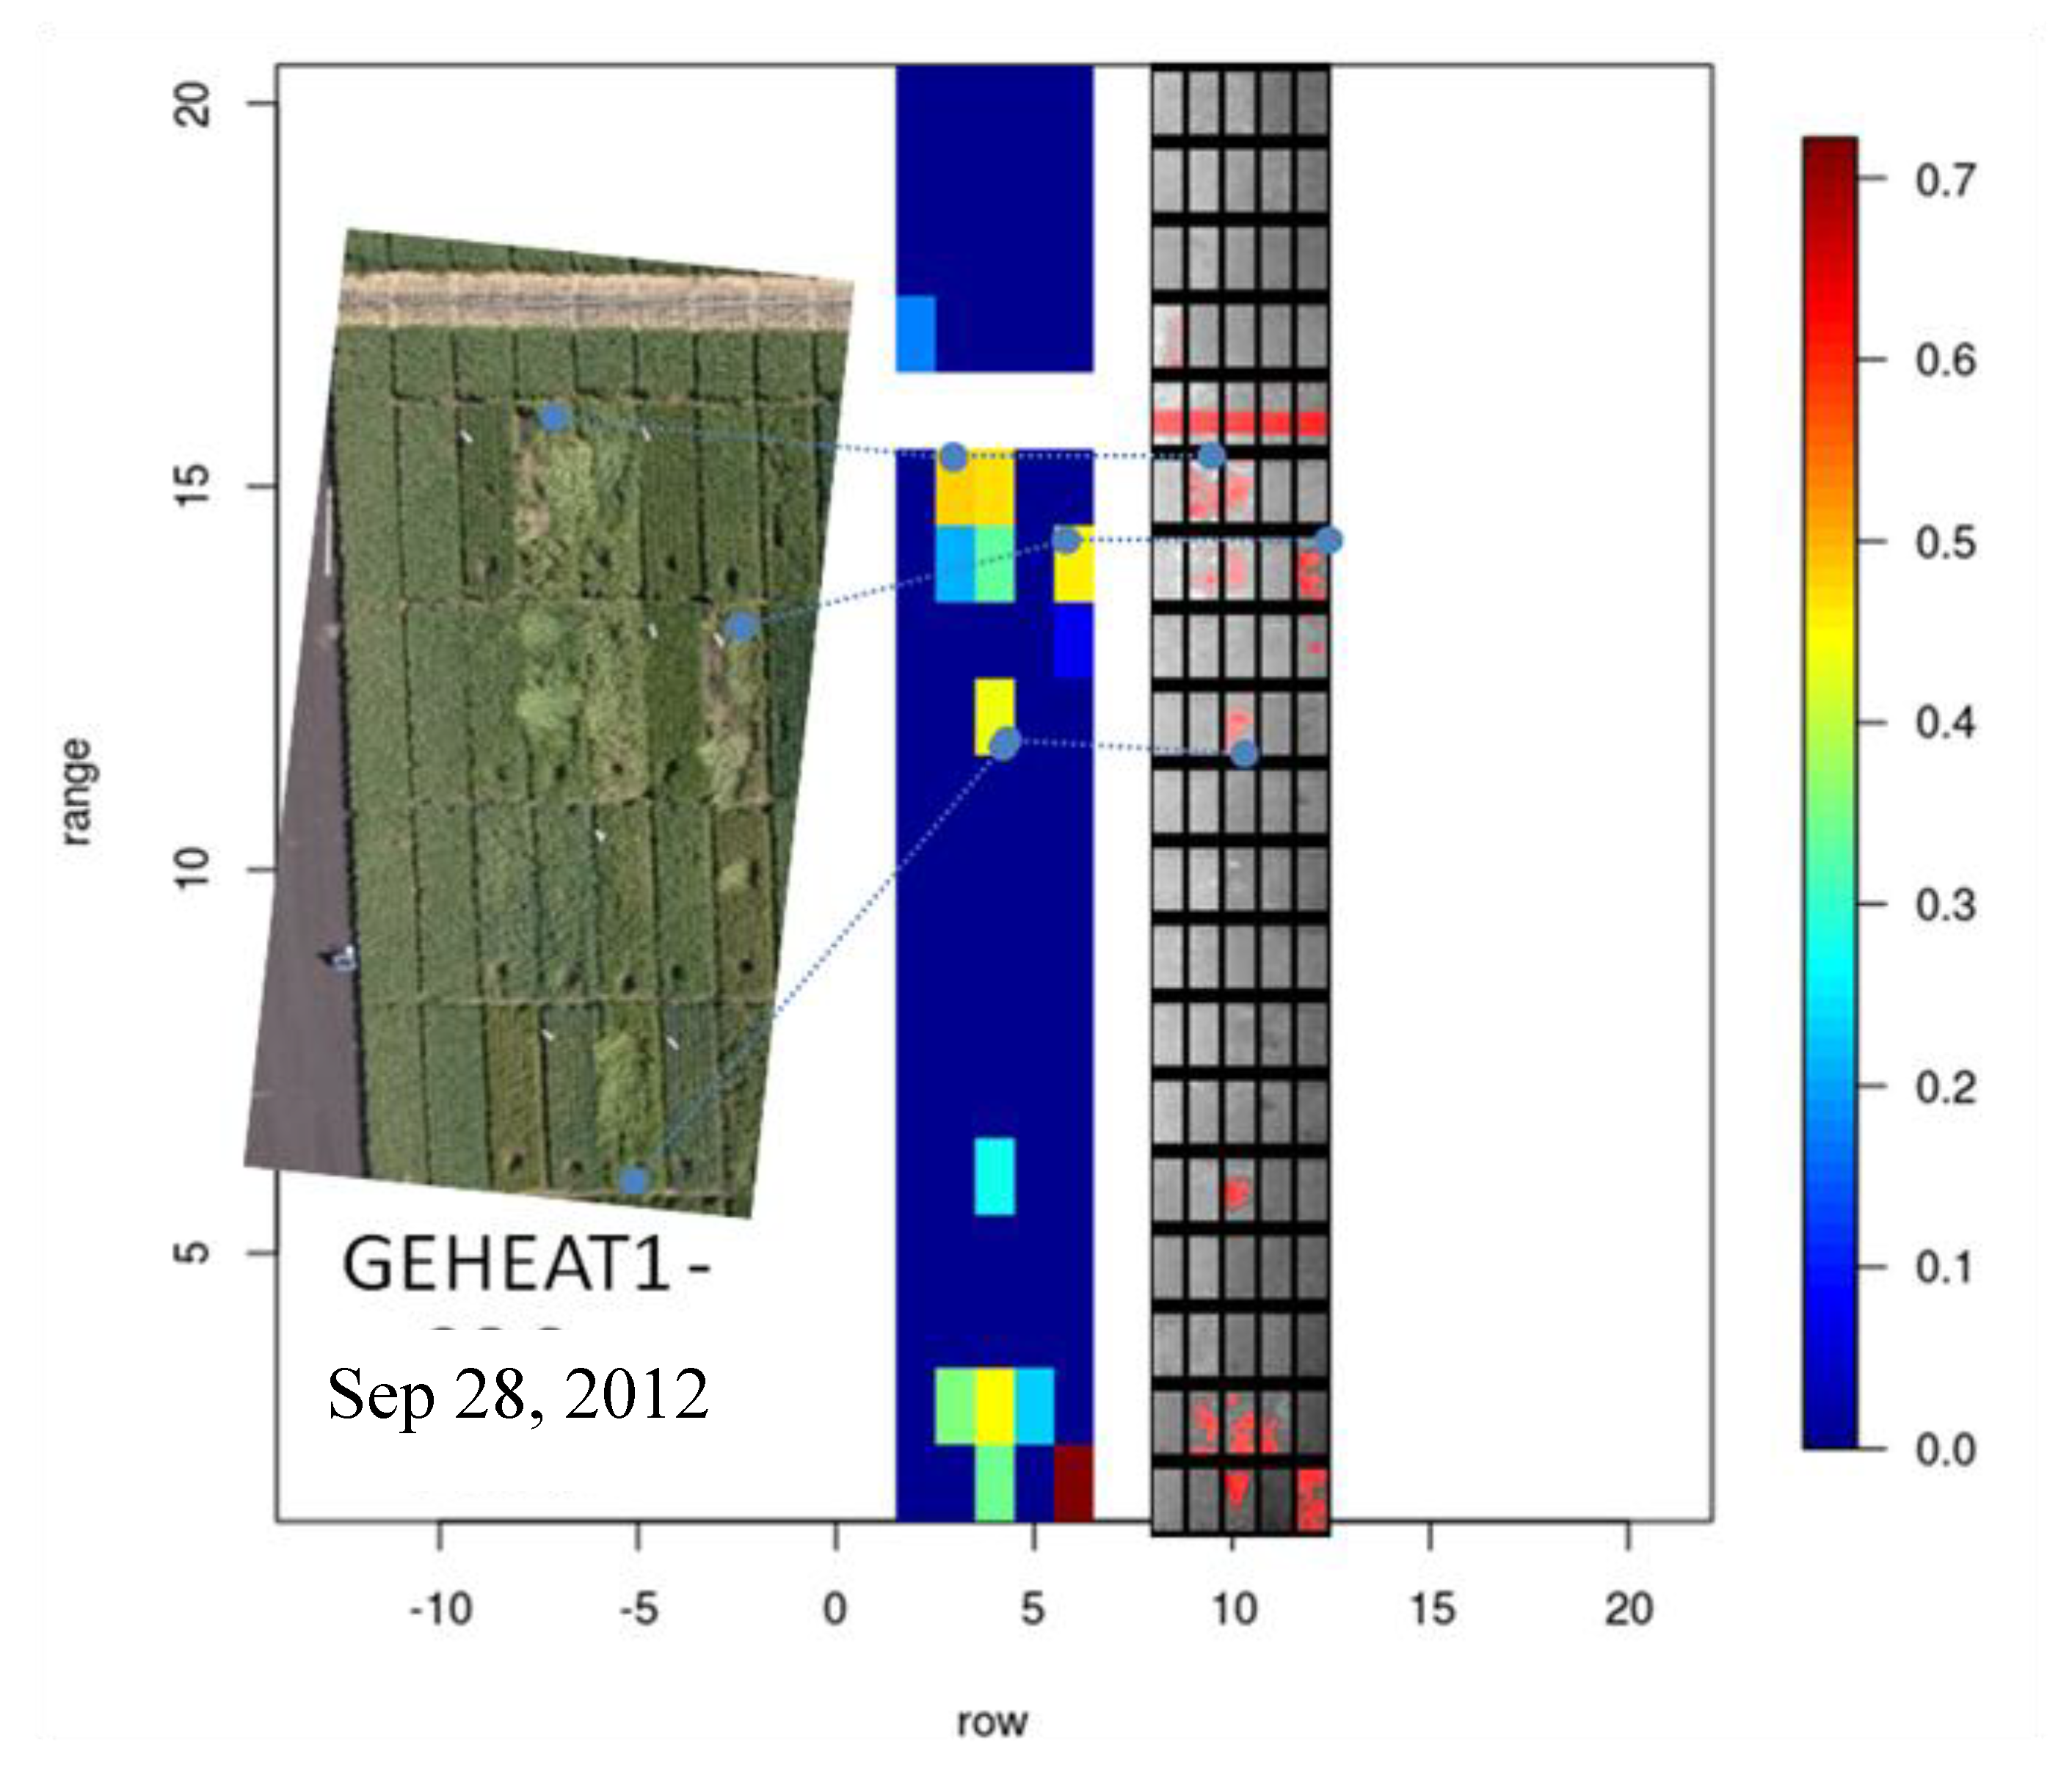
Figure 8) and was able to be verified by inspection of the images and by visual scores done at the same time as the flight.
Figure 8. Spatial layout (range and row) of a wheat variety trial showing the proportion of lodging (zero to one, coloured) by area for each plot. The proportion of lodging was estimated as the proportion of pixels within each plot that were deemed to be lodged. The right-hand false-colour image of crop height estimated from the DEM (Figure 8) shows the pixels (red) that had been deemed to be lodged based on their (low) estimated height within plots that had extreme variance. A single visual image of the upper part of the trial (left) is shown for comparison to the quantitative analysis, with example plots, from an irrigated wheat trial designated as 12GEHEAT-1, linked by blue lines across the three representations.
Agronomy 04 00279 g008

2.5. Combined Image Representations

Once the images have been extracted, they are typically trimmed by a similar amount (default 10%) to remove edge effects due to the wheel tracks between plots and due to walking alleys at the top and bottom of plots. Whether extracted from single images or from mosaics, these extracted images can be laid out in the original plot design for visual interpretation to assist quantitative analysis. 
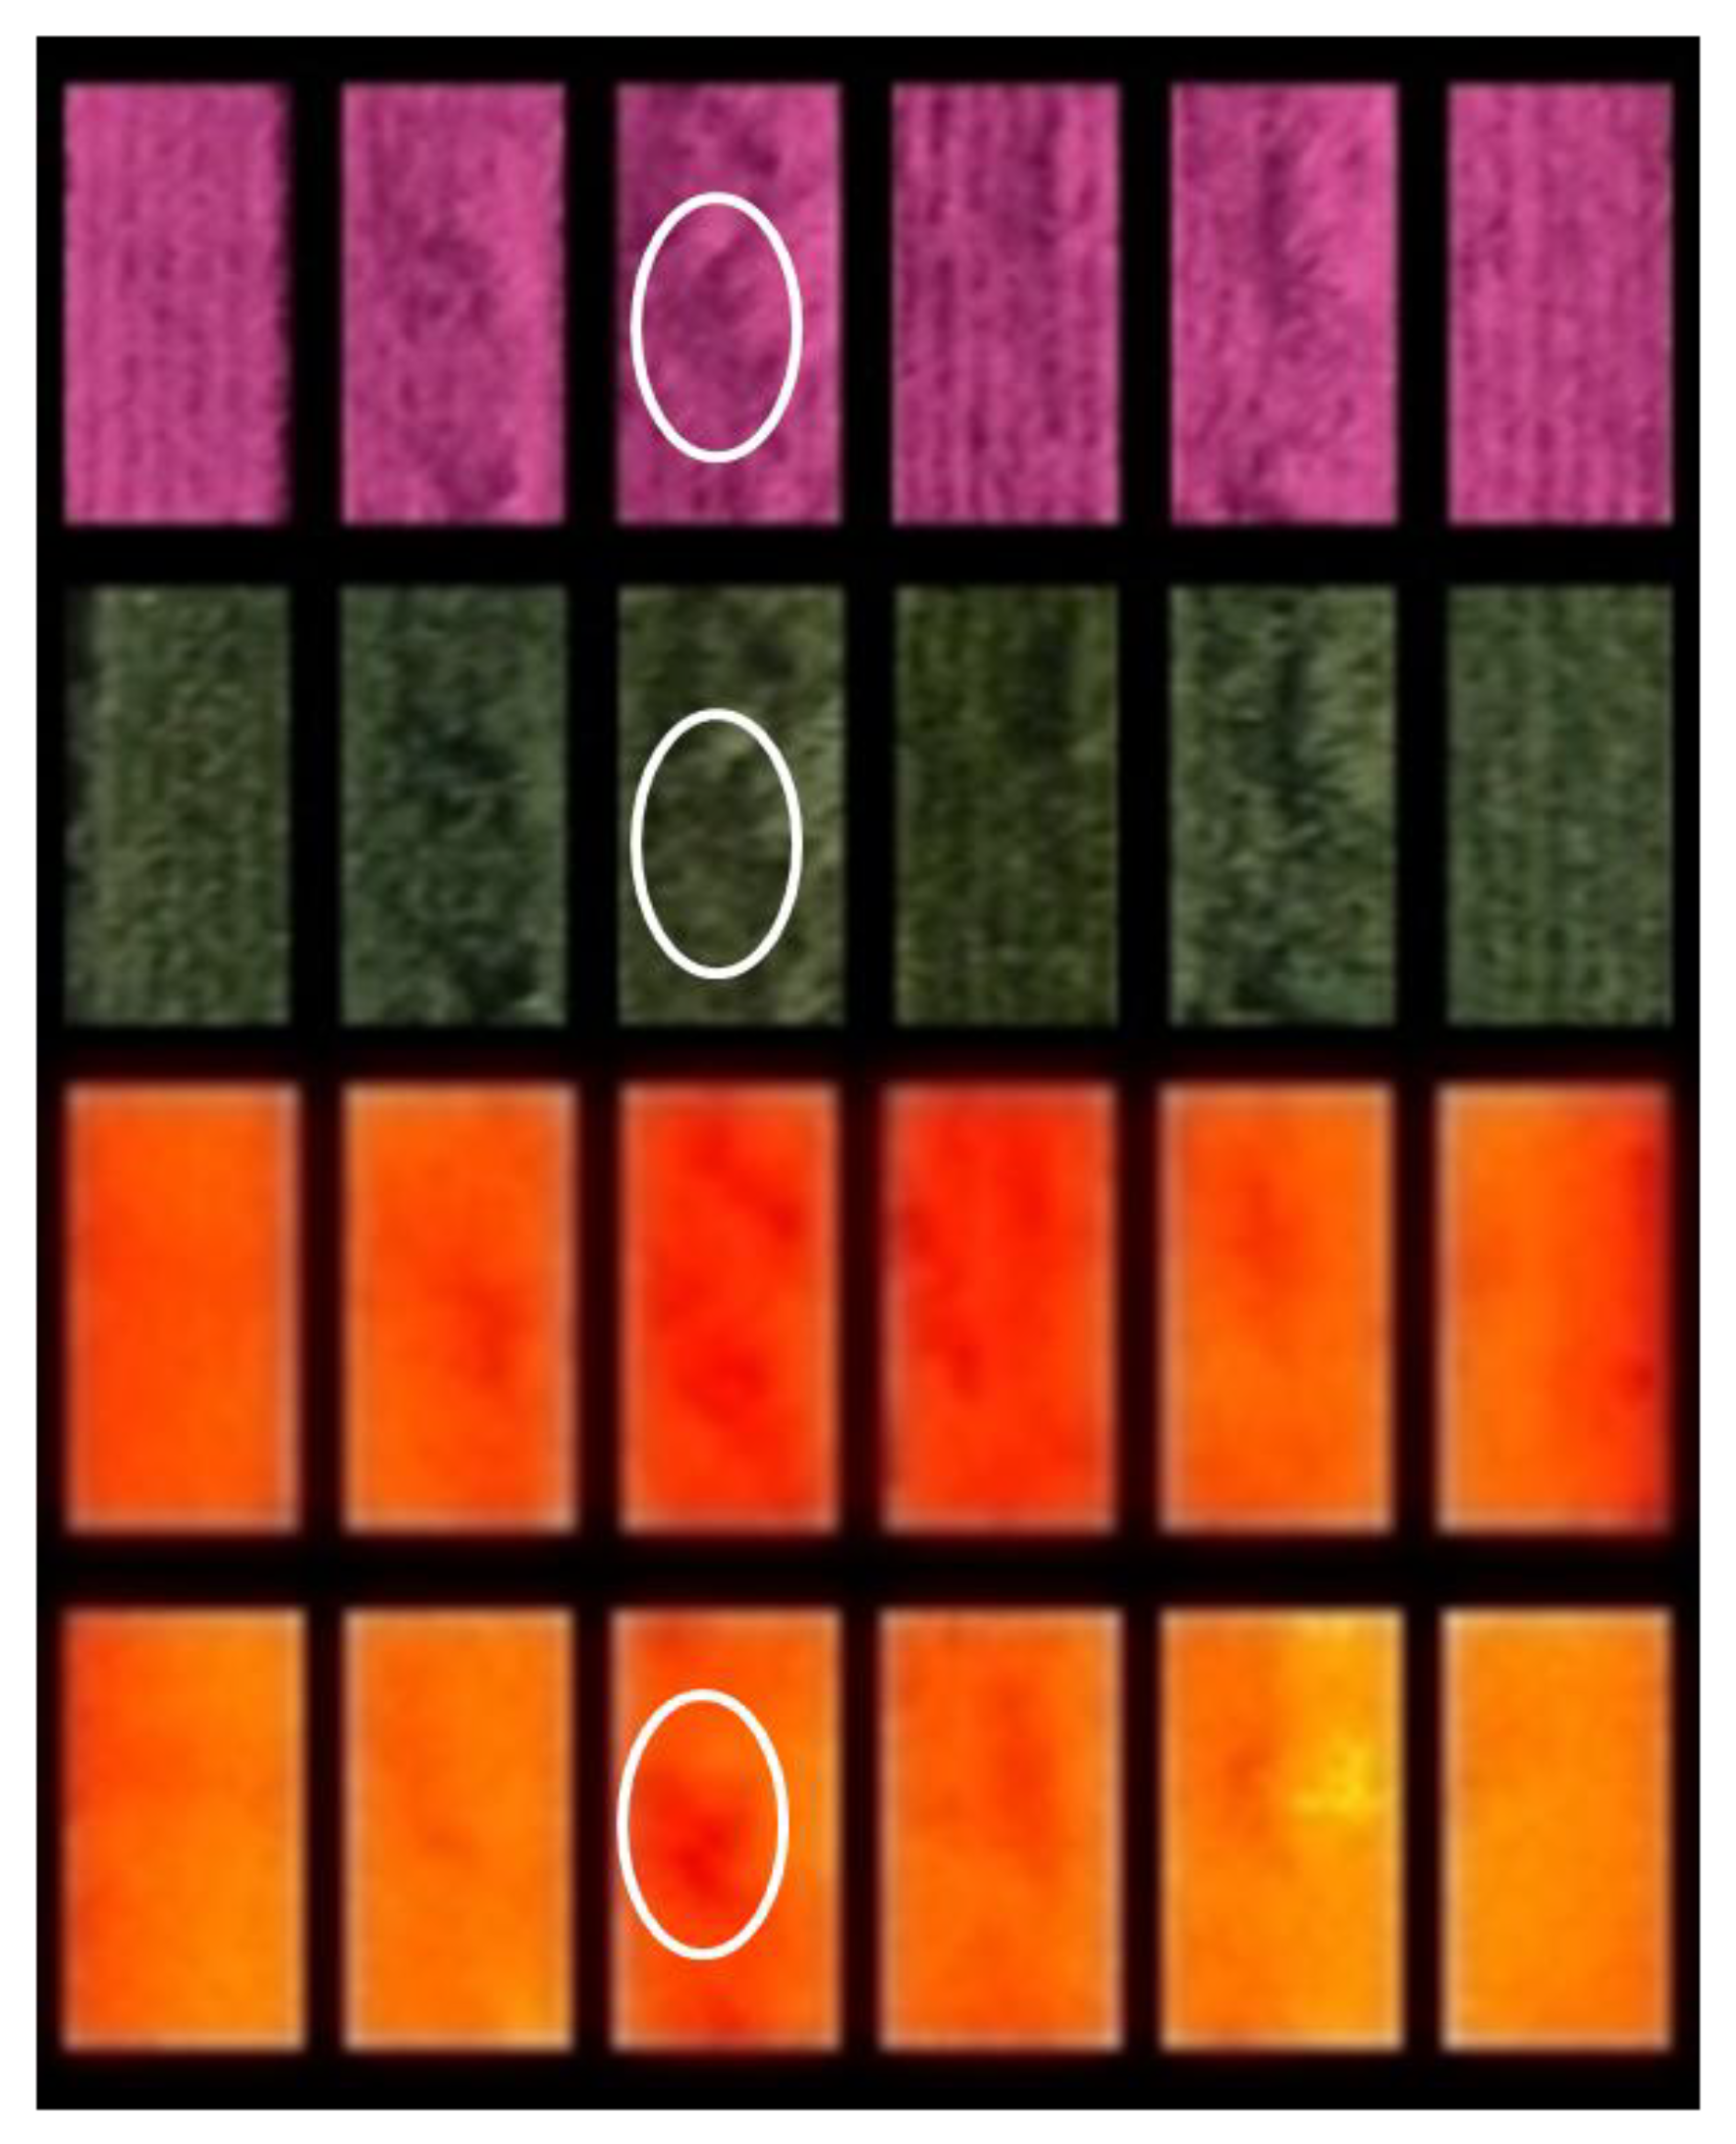
Figure 9 shows an example for another wheat trial grown at Gatton in 2011, on which multiple flights (up to 10 on one day) were done every two to three weeks during the season. This irrigated wheat trial had partially lodged about 2 weeks before the flight date in Figure 9. The NIR (red-edge) filtered image, which highlights vegetative material, shows the lodged areas more clearly than does the standard RGB image. At 11:00 h, the lodged areas of the plots were generally hotter than the non-lodged areas. By 15:05 h, the plots had started to cool, but lodged areas indicated by the oval shape were still hotter than the remainder of the plot.
Figure 9. Comparison of trimmed images for six adjacent plots of a wheat trial from flights made on November 14, 2011, from 60m of elevation at about one week after flowering time. The top three images (NIR (red-edge) filtered, RGB and false-colour thermal (yellow = cooler; red = hotter)) were taken at 11:00 h, while the bottom thermal image was taken at 15:05 h. The white ovals indicate a lodged area of the third plot (lodging is also evident in Plots 2, 4 and 5).
Agronomy 04 00279 g009
The generation of an ortho-mosaic and DEM requires high resolution images with substantial overlap in order to detect control points that will link the images. Most current thermal cameras have a maximum resolution of 640 × 480 and would require low flights (20 m or so) with high coverage to obtain sufficient coverage. At present, we are working on ways to project and link the thermal images onto DEMs generated by the higher resolution cameras. This would allow high-quality masking from those images to be transferred to thermal images, e.g., for estimation of the thermal effects associated with lodging events or with canopy height, per se, which has been shown to be genetically associated with effects on canopy temperature [23].

3. Experimental Section

To undertake the phenotyping that is described here, the autonomous capability of the helicopter was improved further to allow operations with minimal training, and several software solutions were integrated to provide an aerial image analysis workflow that results in quantitative plot-level data for visual, near-infrared and thermal (far infrared) wavelengths (Figure 2). Further details of the helicopter system and the other software are available from the authors. The platform is a research tool, and the software is not able to be supported, but some parts of it can readily be provided to potential users.

3.1. Robotic Helicopter

The robotic helicopter (Figure 1) was developed around the objectives of having: (1) high dependability; (2) sufficient payload capacity and endurance; (3) good usability; and (4) sufficient flight performance in terms of control errors and average cruise speed [12]. It comprises a modified COTS RC helicopter (Vario Benzin Trainer) and a wireless user interface.
The user interface is either a handheld RC transmitter or a touchscreen computer (Figure 1) that allows on-screen monitoring. The latest version of the Pheno-Copter does not require the touchscreen computer at all, as all flight information is provided on a USB memory stick, which is plugged into the Pheno-Copter before the mission, and all control is via a standard handheld transmitter to communicate essential commands, such as take-off, land and flight termination. The latter is important for safety reasons and to comply with Australian aviation regulations. Flight termination means the helicopter engine is killed and a full collective pitch is applied to the main rotor to reduce its rotor speed as quickly as possible. Flight termination can be evoked by the operator or by the system itself in case of a fatal error.
While not typically required for field crop research applications, the platform also has capabilities in terrain following and obstacle avoidance using 2D LiDAR and can operate in unknown environments that are beyond visual range, including in darkness. The key criteria measure for the robotic helicopter system was dependability, with the development being facilitated by the modelling of all system behaviour using an extended state machine software framework [24]. For new flight plans, all critical components can be ground-tested before flight to minimize the risk of failure. With the integration of two compact digital cameras, a thermal camera and an image capture computer, the 1.78-m single rotor helicopter weighs a little over 12 kg and can fly missions of at least 45 min. For the field crop research application, the cruise speed can be set to 1 to 5 m s−1 ground speed and the height chosen between 10–110 m above ground, and the flight path is limited to horizontal and vertical straight line segments.
Merz and Chapman (2011) [12] give further details on the system components, available flight services, system monitoring and flight termination, the guidance, navigation and control (GNC) system and the hardware modifications to the RC helicopter. The system logs and maintains full flight records to support the image analysis and facilitates the evaluation of flight performance and any malfunctions, should they occur.
In 2011, the system capability allowed it to follow a pre-set flight plan, taking images at a fixed time separation of 4 s, which was the maximum capture rate of the digital cameras, for any chosen sectors of a manually-created flight plan [24]. At this stage, the take-off and landing were operator controlled. Since that publication, developments in the flight software and hardware now provide automated pre-flight testing, autonomous take-off and operator-assisted landing. During landing, the helicopter flies to an elevation of approximately 15 m above the pre-set landing site, and the operator needs only to control the descent rate of the helicopter, with the system controlling all other position factors. While completely autonomous landings would be possible with a system suggested by Merz et al. (2006) [25], we decided not to sacrifice payload capacity and endurance for the integration of the landing system. Moreover, it is safer for the operator to observe and control the last part of the vertical descent in order to anticipate ideal conditions for landing, e.g., to avoid wind gusts at the exact time of landing, as these can be seen coming across the field by the operator.

3.2. Imaging Payload

The Pheno-Copter can carry a combination of a variety of sensors, typically including several cameras with different filters and a thermal far-infrared camera. As all sensors are mounted on the same vibration-isolated carrier board as the GNC system, this allows the helicopter state estimates to be used to determine the pose of a sensor. Sensors for vegetation monitoring are typically mounted vertically pointing down, while sensors for structure or tree canopy inspections are typically mounted horizontally pointing forward. To maximize sensor payload capacity and flight endurance, gimbals are not used, as the software applications can tolerate small changes in sensing direction and require only still images with short exposure times. As our applications do not require interactive control of sensors or live transmission of data, the sensors are controlled by the flight computer as defined in a mission plan and data is recorded on-board in flash memory. Sensor data is saved synchronously with helicopter state estimates. Table 1 contains details about the sensors and the accuracy of pose estimates. Depending on the application, the geo-referencing of data is possible based on pose estimates only or a combination of pose estimates and ground control points.
For phenotyping applications, three cameras are typically used. Two digital compact cameras (Ricoh GR Digital III and Ricoh GR Digital IV with a 10 million pixel CCD image sensor and a focal length equivalent to 28 mm for 35 mm film cameras) capture raw image formats under manual exposure and focus control. The time delay between sending a shutter command from the flight computer until image capture of the cameras is calibrated. The Ricoh GR Digital III camera has been after-market modified in which the factory-fitted infrared filter was removed and an external 720 nm infrared (red-edge) transmitting filter was added to the lens. The third sensor is a thermal (far-infrared) camera with three different models being used so far. For most flights, the thermal camera was an uncooled Thermoteknix MIRICLE 307K with a 640 × 480 array size, ≤50 mK sensitivity (excluding optics) and 56.3° horizontal field of view [26]. In July, 2013, we began using a higher quality pixel-calibrated camera (Xenics Gobi-640-GigE) that had the same spatial resolution as the MIRICLE. In the current system, all three cameras are initiated by the flight computer, typically at a constant cruise speed and constant interval between images, as defined in the mission plan.

3.3. Flight-Planning Tool

Aerial imagery captured for phenotyping work needs to satisfy requirements for complete coverage of the region of interest (ROI), a minimum ground sample distance (GSD) (the distance measured between pixel centres on the ground) and image overlap characteristics that allow for the effective creation of mosaics of images.
The flight planning tool (Figure 10) allows a user to specify an arbitrary polygonal ROI to be imaged with an overlay onto satellite image mosaics from Google Maps [27]. The tool then generates “lawnmower” pattern flight plans that ensure the parameters specified above are met, i.e., the flight plans are output-driven based on the information about the camera(s), lens, image frequency and aircraft flight specifications, such as cruising speed (Figure 10). This version of the planner assumes that the ROI has a negligible slope when generating the flight plan, although a 3D version is also under development, which facilitates flights in more mountainous regions, where some crops and forestry field experiments are planted.
Figure 10. The flight planning tool showing the mission planning information, options to read in camera and aircraft performance specifications and to determine desired imaging parameters for the flight for a region of interest (marked by the user with the blue drop pins). In this case, three passes (arrows) are needed, for the desired resolution is 10 mm/pixel with 25% image overlap (shown in red), a transect width of 10 m and a boundary overshoot of 5m (to continue imaging).
Agronomy 04 00279 g010
There are commercial [28,29,30] and open-source [31] flight planners with similar functionality, but which do not output flight plans that are compatible with our helicopter system and also do not easily account for camera and aircraft performance specifications. These planners were developed for experienced UAV operators and have complex interfaces. We developed a flight planner for ease of use by plant breeders and agronomists who may not have expert knowledge of unmanned aircraft systems. Other commercial flight planners for manned aerial photography flights [32,33] also have complex interfaces and do not produce compatible flight plans.
Once the relevant camera and aircraft parameters are entered and an ROI is designated, the flight planning tool provides direct visual feedback to the user, making it possible to visualize coverage and image overlap as other parameters are adjusted. In developing a flight plan, the parameters are set as follows:
-
Coverage: The user specified the corners of the ROI by clicking on the map or by loading a text file containing corner coordinates. Image footprints are displayed on the map for visual confirmation of the coverage;
-
GSD: This is entered in a text field or adjusted via a slider. The flight altitude is automatically adjusted to ensure that the specified GSD is achieved for the selected camera;
-
Image overlap: Overlap between consecutive images (front lap) is set via a slider. Overlap between consecutive rows (side lap) is set indirectly by adjusting the row width. The image footprints shown on the map help to visually confirm that the overlap is appropriate.
As cameras may have a different resolution and field of view, the flight is planned so that the specified GSD is achieved for the lowest resolution camera, while still maintaining the coverage and overlap requirements. The tool allows for toggling between three camera configurations to visualize the flight plan for each in case a specific flight plan is required.

3.4. Flight and Image Retrieval Tool

At the completion of a flight, the helicopter is connected to a laptop to download the flight data and camera images (Figure 2, lower centre box of the workflow). A directory structure comprising the location, date and flight number for the day is automatically constructed on the storage drive with all images being copied across to separate directories for each camera. For digital cameras, both JPG and RAW format images are retained, each comprising three wavelengths. The thermal cameras store data in a 256-bit binary format that can be displayed in monochrome or colour-enhanced formats. For each image, the associated entry in the flight log is automatically found, and the relevant data is appended into the image metadata. This includes the latitude, longitude, height and orientation of the camera at the time of capture. Geo-referencing the images in this way assists in the image assembly process described in Section 3.5.1. Creation of Image Mosaics.

3.5. Aerial Image Processing

The tools described above result in the images being collated into an organized storage system from which point they can be individually analysed or be combined into mosaics before additional analysis (Figure 2). The advantages of image mosaics is that they allow the extraction of large numbers of plots at once, which reduces the operator time and, with geo-referencing, can allow the creation of fine-scale digital elevation models (DEM) by treating adjacent images as stereo pairs. The disadvantages are that the merged images may vary in the information that can be extracted.

3.5.1. Creation of Image Mosaics

While most of the work presented below has utilized analyses of plots from single images, two commercial software tools (one desktop, one online) were used to create image mosaics (Figure 7, left-hand figure) that enable the analysis of a larger numbers of plots. The main use of the mosaics was to assist the image analysis in navigating through the processing of individual images. AutoPano GigaPro [34] is desktop software that utilizes features from images in order to create mosaics. While this software can be greatly challenged by the variable pose of images (i.e., movement of the helicopter position) and the lack of straight-line or colour contrast features in images of crop experiments, AutoPano has been able to generate reasonable “panoramas” for the extraction of plot information, similar to that in Figure 7. Apart from the standard settings in Auto-Pano, the detection control point RANSAC model was set to “homography” (recommended when the panorama point of view is changing, rather than from a single point); optimization was set to “strong algorithm” with lens distortion correction “enabled” with “multiple viewpoints”; projection was set to “ortho”; and render blending presets to “exposure fusion”.
Since the project began in 2009, on-line image-processing services have been developed, and after the evaluation of several services, DroneMapper Aerial Imagery Processing and GIS Services [35] was able to provide ortho-mosaics and DEM from supplied sets of images that contain embedded flight position metadata. In crop experiments, DEM data have shown the potential to allow the estimation of crop height and canopy structure, as well as the impacts of phenotype effects, such as lodging, and are partially evaluated in this paper (see later for the methods).

3.5.2. Identification and Extraction of Trial Images and Plots, Straightening and Trimming

The remainder of the steps in the software workflow (plot identification and the steps on the right of Figure 2) are completed using a customized software library developed in the R language [36]. Individual (or mosaic) images of multiple plots are processed together with a CSV file containing the row and column positions and identities of plots. Field experiments of row crops typically comprise rectangular plots that vary in dimension, depending on the trial purpose. Yield or physiology trial plots of field crops (e.g., wheat, sorghum, cotton) range from about one to three meters wide, with the row number varying with the crop/agronomy, and are three to 15 m in length. While agronomy and physiology trials tend to have 15 to 100 plots, breeding trials at a single site may have several hundred to several thousand plots.
A mission typically comprises 50 to several hundred images, depending on the elevation used and the flight area. In practice, most flights have been at 20, 40, 60 or 80 m of elevation and cover between 0.5 and 4 ha of trials, which amounts to 1200 plots across multiple experiments and fields. The platform does not currently use RTK-GPS, so the positional information for each image is only approximate and is not sufficiently accurate to allow the image to be re-orientated to the vertical (i.e., when vehicle pose is oblique) or automatically matched to a map of the field layout. Given this and other constraints (that plots are rectangular in shape and have the same dimensions), the approach was to use an image-based method to “straighten” the images by re-projecting them onto a rectangular grid matching the ground layout. The software displays an image (from a list given in R script), asks the user to interactively define four corners of an area of interest (normally fewer than 10 to 12 plots), to identify the corner plots and to provide the plot dimensions. The analysis output includes a low-resolution check image (Figure 11) to indicate the original and extracted plots and their identities, as well as “straightened” JPG (no compression) images that are named according to the flight and plot information. For each image manipulation in R, an R data file (.RDA) is created to allow the tracking and revision of any operations that were done and resetting many parameters associated with images, including camera focal information. This .RDA file facilitates the next stages of analysis.
Figure 11. An example of a check image from the plot extraction software. An overlay of the user-selected rectangle on the lens-corrected false-colour thermal image of a sugarcane experiment is seen on the left, with the 16 extracted, straightened and trimmed plot images shown on the right, together with their plot (column) and row positions in the trial layout.
Agronomy 04 00279 g011
The R library also contains functions from the VOIR package (an internal CSIRO library) that enable operations, such as feature extraction, trimming, thresholding and other image manipulations. As part of the previous step, the user may define trimming parameters for the plots (The default is 10% on each side, to remove inter-row space between plots). Alternatively, the R data file associated with each image can be used to re-process the plots for trimming after the extraction step. These functions can be also scripted using other open-source tools, such as ImageJ.

3.5.3. Image Spectral Extraction and Analysis

For any or all flights, R scripts were written to extract data from the single plot trimmed images and their associated .RDA files. These scripts process data for all three wavelengths for the visual cameras, and a single wavelength for the thermal camera, and thresholds or trimming were used to eliminate unwanted areas from single images, such as static sensors or equipment that was mounted in plots, or areas of plots where quadrat samples had been taken.
As many plots appeared in more than one image, replicated data was collected on these plots. The final stage of image processing was to set thresholds to select pixels for further analysis, depending on the phenotype of interest. These thresholds define an image mask that indicates which pixels to eliminate from further analysis. Studies of ground cover and leaf senescence utilized thresholds that estimated green pixels as a proportion of total pixels in the image. For canopy temperature, the thresholds were set based on the identification of the soil in images, which was typically much hotter than the crop canopy, although in some cases (early morning) it could be identified as being cooler than the crop canopy. Although we made attempts to set global thresholds for these images, we found that it was usually necessary to set thresholds for each flight, due to variation in lighting and environmental conditions. Mask overlays onto the extracted images made these decisions more objective than might be initially expected.

3.5.4. Experimental Analysis of Plot-Level and Treatment-Level Data

In the experiments reported here, the interest was largely in the comparison of data from multiple images and with independently assessed phenotypes where possible. Pearson correlations were computed to compare image data or image data vs. other phenotype data at the plot-level. In several examples, the results have been analysed to the level of genotype, which is the main treatment of interest. Where this has been done, a mixed model analysis using ASREML (ASREML, VSN International, Wallingford, UK [37]) has been applied in accordance with standard practice in Australian breeding research, which includes the adjustment of predicted fixed (Best Linear Unbiased Estimators, BLUEs) or random (BLUPs) effect means for the spatial effects of row and column dimensions [38]. These are spatially-adjusted means of the treatment factors, usually genotype.
Over the last four years, the Pheno-Copter has been used in breeding and/or agronomy trials of wheat, sorghum, cotton and sugarcane. To simplify the presentation of this work, examples from this work are both described and interpreted in the Results Section. Phenotypic traits that are presented include the estimation of ground cover (sorghum), canopy temperature (sugarcane) and crop lodging (wheat), although all of these traits have been variously phenotyped in all of the crops.

4. Conclusions

Plant breeding is a critical research and delivery mechanism to maintain food security and to respond to changes in the climate and production environment. The acceleration in our ability to phenotype crops will enable this essential part of the breeding process to keep up with improvements in plant genetics and methods of generating new progeny. While military-grade UAVs have large payload capacities (>10s to 100s of kg) and long flight times, there are few small, affordable platforms for use in cost-sensitive activities, like agricultural research. Although the platform described here cannot be purchased as “ready-to-fly”, the cost was comparable to current alternatives that are being developed for electric platforms: <ca. $25,000 to purchase, test and construct, not including imaging. With minor training (ca. 2 d), this platform provides a phenotyping capability in all soil conditions, at diverse locations, to allow repeated monitoring of crops within or across days. The software system developed for the platform has specifically addressed the need to have different levels of image coverage for different needs (plot extraction or the generation of DEMs) and allows the extraction of regular plots from the images. The analysis of aerial imagery in crop experimentation is proceeding rapidly and has not been discussed in detail here, with the reader being referred to the citations below as a starting point. Automated on-site image processing would facilitate the interpretation of this type of data and allow breeders to immediately visit specific plots of interest. Further miniaturization of flight and imaging platforms could eventually lead to the development of low-cost, “personal aerial assistants” that could be used remotely by breeders or “called in” when needed during walking visits to the field.

Acknowledgments

In the conduct of experiments, we gratefully acknowledge the technical staff at the Gatton site (Phillip van Drie and Laura Barnes) and collaborating scientists in sorghum (led by David Jordan) and sugarcane (led by Jaya Basnayake). Lennon Cork (former CSIRO research engineer), Brett Wood and Dennis Frousheger (both CSIRO Computational Informatics) contributed to design and build helicopter system components. Bilal Arain (former CSIRO post-doctoral fellow) contributed to the concepts, design and octocopter flights in the early part of the project. This research was funded by CSIRO as a project in the Transformational Biology Capability Platform (TBCP, David Lovell and Mark Morrison) with additional support from the then Divisions of Plant Industry and of Maths and Information Sciences (fellowship for Amy Chan) and the Climate Adaptation Flagship.

Author Contributions

Scott Chapman and Torsten Merz conceived of, designed and undertook the majority of the research with on-going advice from Jose Jimenez-Berni. Torsten Merz designed and built helicopter system components. Torsten Merz, Stefan Hrabar and Edward Holland flew missions. Amy Chan, Paul Jackway and Scott Chapman designed and built the image analysis tools; Stefan Hrabar designed the flight-planning tool; Amy Chan, Bangyou Zheng, T. Jun Ling, Torsten Merz and Scott Chapman undertook various parts of the image analysis. M. Fernanda Dreccer and Scott Chapman contributed field research expertise and data. Scott Chapman wrote the paper with input from the co-authors.

Conflicts of Interest

The authors declare no conflict of interest.

References

  1. White, J.W.; Andrade-Sanchez, P.; Gore, M.A.; Bronson, K.F.; Coffelt, T.A.; Conley, M.M.; Feldmann, K.A.; French, A.N.; Heun, J.T.; Hunsaker, D.J.; et al. Field-based phenomics for plant genetics research. Field Crops Res. 2012, 133, 101–112. [Google Scholar] [CrossRef]
  2. Deery, D.; Jimenez-Berni, J.; Jones, H.; Sirault, X.; Furbank, R. Proximal remote sensing buggies and potential applications for field-based phentopying. Agronomy 2014, in press. [Google Scholar]
  3. Goddard, M.E.; Hayes, B.J. Genomic selection. J. Anim. Breed. Genet. 2007, 124, 323–330. [Google Scholar] [CrossRef]
  4. Raun, W.R.; Johnson, G.V. Improving nitrogen use efficiency for cereal production. Agron. J. 1999, 91, 357. [Google Scholar] [CrossRef]
  5. Jones, H.G. Use of thermography for quantitative studies of spatial and temporal variation of stomatal conductance over leaf surfaces. Plant Cell Environ. 1999, 22, 1043–1055. [Google Scholar] [CrossRef]
  6. Sims, D.A.; Gamon, J.A. Relationships between leaf pigment content and spectral reflectance across a wide range of species, leaf structures and developmental stages. Remote Sens. Environ. 2002, 81, 337–354. [Google Scholar] [CrossRef]
  7. Demmig-Adams, B.; Adams, W.W., III. The role of xanthophyll cycle carotenoids in the protection of photosynthesis. Trends Plant Sci. 1996, 1, 21–26. [Google Scholar] [CrossRef]
  8. Babar, M.A.; Reynolds, M.P.; van Ginkel, M.; Klatt, A.R.; Raun, W.R.; Stone, M.L. Spectral reflectance to estimate genetic variation for in-season biomass, Leaf chlorophyll, and canopy temperature in wheat. Crop Sci. 2006, 46, 1046–1057. [Google Scholar] [CrossRef]
  9. De Bei, R.; Cozzolino, D.; Sullivan, W.; Cynkar, W.; Fuentes, S.; Dambergs, R.; Pech, J.; Tyerman, S. Non-destructive measurement of grapevine water potential using near infrared spectroscopy. Aust. J. Grape Wine Res. 2011, 17, 62–71. [Google Scholar] [CrossRef]
  10. Dreccer, M.F.; Barnes, L.R.; Meder, R. Quantitative dynamics of stem water soluble carbohydrates in wheat can be monitored in the field using hyperspectral reflectance. Field Crops Res. 2014, 159, 70–80. [Google Scholar] [CrossRef]
  11. Gutiérrez-Rodríguez, M.; Reynolds, M.P.; Escalante-Estrada, J.A.; Rodríguez-González, M.T. Association between canopy reflectance indices and yield and physiological traits in bread wheat under drought and well-irrigated conditions. Aust. J. Agric. Res. 2004, 55, 1139–1147. [Google Scholar] [CrossRef]
  12. Merz, T.; Chapman, S. Autonomous unmanned helicopter system for remote sensing missions in unknown environments. In Proceedings of the International Conference on Unmanned Aerial Vehicle in Geomatics, Zurich, Switzerland, 14–16 September 2011.
  13. Eisenbeiss, H.; Lambers, K.; Sauerbier, M. Photogrammetric recording of the archaeological site of Pinchango Alto (Peru) using a mini helicopter. In Proceedings of the 33rd CAA Conference, Tomar, Portugal, 21–24 March 2005.
  14. Berni, J.; Zarco-Tejada, P.J.; Suarez, L.; Fereres, E. Thermal and narrowband multispectral remote sensing for vegetation monitoring rrom an unmanned aerial vehicle. IEEE Trans. Geosci. Remote Sens. 2009, 47, 722–738. [Google Scholar] [CrossRef]
  15. Montambault, S.; Beaudry, J.; Toussaint, K.; Pouliot, N. On the application of VTOL UAVs to the inspection of power utility assets. In Proceedings of the 2010 1st International Conference on Applied Robotics for the Power Industry (CARPI), Montreal, QC, Canada, 5–7 October 2010; pp. 1–7.
  16. Wallace, L.; Lucieer, A.; Watson, C.; Turner, D. Development of a UAV-LiDAR system with application to forest inventory. Remote Sens. 2012, 4, 1519–1543. [Google Scholar]
  17. Torres-Sánchez, J.; López-Granados, F.; de Castro, A.I.; Peña-Barragán, J.M. Configuration and Specifications of an Unmanned Aerial Vehicle (UAV) for Early Site Specific Weed Management. PLoS One 2013, 8, e58210. [Google Scholar]
  18. Jackson, R.D.; Idso, S.B.; Reginato, R.J.; Pinter, P.J. Canopy temperature as a crop water stress indicator. Water Resour. Res. 1981, 17, 1133–1138. [Google Scholar] [CrossRef]
  19. Jackson, R.D.; Hatfield, J.L.; Reginato, R.J.; Idso, S.B.; Pinter, P.J., Jr. Estimation of daily evapotranspiration from one time-of-day measurements. Agric. Water Manag. 1983, 7, 351–362. [Google Scholar] [CrossRef]
  20. Jordan, D.; (The University of Queensland, Queensland Alliance for Agriculture and Food Innovation). Personal communication, 2013.
  21. Montes, J.M.; Technow, F.; Dhillon, B.S.; Mauch, F.; Melchinger, A.E. High-throughput non-destructive biomass determination during early plant development in maize under field conditions. Field Crops Res. 2011, 121, 268–273. [Google Scholar] [CrossRef]
  22. LumaSense Home Page. Available online: http://www.lumasenseinc.com/ (accessed on 11 June 2012).
  23. Rebetzke, G.J.; Rattey, A.R.; Farquhar, G.D.; Richards, R.A.; Condon, A.G. Genomic regions for canopy temperature and their genetic association with stomatal conductance and grain yield in wheat. Funct. Plant Biol. 2012, 40, 14–33. [Google Scholar]
  24. Merz, T.; Rudol, P.; Wzorek, M. Control system framework for autonomous robots based on extended state machines. In Proceedings of the 2006 International Conference on Autonomic and Autonomous Systems, ICAS’06, Silicon Valley, CA, USA, 16–18 July 2006.
  25. Merz, T.; Duranti, S.; Conte, G. Autonomous landing of an unmanned helicopter based on vision and inertial sensing. In Experimental Robotics IX; Springer Tracts in Advanced Robotics; Ang, M.H., Jr., Khatib, O., Eds.; Springer Berlin Heidelberg: Berlin, Germany, 2006; pp. 343–352. [Google Scholar]
  26. Thermalteknix Home Page. Available online: http://www.thermoteknix.com (accessed on 11 June 2012).
  27. Developers Home Page of Google Maps. Available online: https://developers.google.com/maps (accessed on 11 June 2012).
  28. MAVinci Home Page. Available online: http://www.mavinci.de/en/startseite (accessed on 11 June 2012).
  29. SenseFly eMotion2 Home Page. Available online: http://www.sensefly.com/products/emotion-2 (accessed on 11 June 2012).
  30. AutoGrid Aerial Mapping for GIS Home Page. Available online: http://www.aeryon.com/applications/missions/262-autogrid.html (accessed on 11 June 2012).
  31. ardupilot-mega Home Page. Available online: http://code.google.com/p/ardupilot-mega/wiki/AutoWP (accessed on 11 June 2012).
  32. OSAC Flight Planning Home Page. Available online: http://airbornescientific.com/content/osacplanning (accessed on 11 June 2012).
  33. TopoFlight Home Page. Available online: http://topoflight.com/en/Information/Software/TopoFlight (accessed on 11 June 2012).
  34. Kolor Home Page. Available online: http://www.kolor.com/ (accessed on 11 June 2012).
  35. DroneMapper Home Page. Available online: http://dronemapper.com/ (accessed on 11 June 2012).
  36. R FAQ Home Page. Available online: http://cran.r-project.org/doc/FAQ/R-FAQ.html (accessed on 11 June 2012).
  37. VSNI ASReml Home Page. Available online: http://www.vsni.co.uk/software/asreml (accessed on 11 June 2012).
  38. Gilmour, A.R.; Cullis, B.R.; Verbyla, A.P. Accounting for natural and extraneous variation in the analysis of field experiments. J. Agric. Biol. Environ. Stat. 1997, 2, 269–293. [Google Scholar] [CrossRef]

