Article

A Combined Field/Laboratory Method for Assessment of Frost Tolerance with Freezing Tests and Chlorophyll Fluorescence

CRA-GPG—Council for Agricultural Research and Economics, Genomics Research Centre, Via San Protaso 302, Fiorenzuola d'Arda (PC) 29017, Italy
*
Author to whom correspondence should be addressed.
Agronomy 2015, 5(1), 71-88; https://doi.org/10.3390/agronomy5010071
Submission received: 4 December 2014 / Revised: 12 February 2015 / Accepted: 3 March 2015 / Published: 17 March 2015
(This article belongs to the Special Issue Field Phenotyping for Yield and Environmental Stress Tolerance Traits)

Abstract

:
Recent progress in genotyping allows for studies of the molecular genetic basis of cold resistance in cereals. However, as in many other fields of molecular genetic analysis, phenotyping for high numbers of genotypes is still a major bottleneck. The use of chlorophyll fluorescence measurements as an indicator for freezing stress is a well established and rapid method for evaluation of frost tolerance. In order to extend the applicability of this technique beyond plants grown under controlled conditions in growth chambers and sacrificed for the test, here we study its applicability for leaves harvested from field trials during winter and subjected to freezing tests. Such an approach allows for simultaneous studies of the advancement of cold hardening and other components of winter survival apart from frost tolerance. It is shown that cutting or senescence of cut leaves does not have adverse effects on the outcome of subsequent freezing stress tests. The time requirements for field sampling and laboratory testing on high numbers of genotypes allow for the application of the proposed approach for genotyping/phenotyping studies.

1. Introduction

In mid-latitudes, winter survival is an important factor that influences the productivity of autumn sown cereals. Successfully surviving winter depends on capacities to resist a series of stresses provoked by environmental conditions in winter, such as soil heaving, physiological drought, ice encasement, anoxy, diseases like snow molds and freezing damage [1]. Freezing tolerance (FT), i.e., the resistance to cold stress, plays a major role in winter survival [2]. Rizza et al. [3] conservatively estimated that at least 50% of winter hardiness was associated with the level of FT in several European field tests on barley.
FT is a complex trait with polygenic inheritance [4]. Genetic variability in FT has been shown to be related to allele combinations of vernalization loci (e.g., [3,5,6,7]). Further dissection of the genetic determinants of FT as related to photoperiod (PPD) genes, CBF transcription factors, variation in copy number, polymorphisms of relevant genes and discovery of new QTLs (e.g., FR-H3 [8]) are needed to refine the predictability of FT. Thus further progress in studies of association mapping and subsequent use in marker assisted selection (MAS) depends on fast phenotyping methods applicable to high numbers of genotypes.
Traditional phenotyping through electrolyte leakage tests and/or survival screening after exposure to a range of freezing stress temperatures are cost and labor intensive. For example, Fisk et al. [8] reported a cost of $90 per line for hardening and freezing under controlled conditions with subsequent survival analyses. Chlorophyll fluorescence as a rapid and reproducible alternative has been shown to produce results that correlate well with those obtained using other well-established methods [3,7,9,10,11,12,13]. Measurements of Fv/Fm provide an indirect assessment of damage, i.e., they have an indicator function. Unlike studies of the direct effects of low temperatures on the efficiencies of various components of the photosynthetic apparatus [14], assessments of frost damage measuring Fv/Fm take Fv/Fm as an indicator of the breakdown of compartmentalization due to membrane damage [15] through the subsequent decline in maximum quantum yield of photosystem II photochemistry. FT characterized at the leaf level (either through Fv/Fm measurements after recovery or through electrolyte leakage tests) is not identical with FT at the whole plant level, i.e., the capacity to survive and eventually resprout. However, previous studies have shown that both are correlated [3]. Subsequently, FT assessed at the leaf level is addressed as FT. Note that this approach aims at establishing a relative ranking of genotypes with respect to FT applicable for biodiversity and genomics studies. Studies that aim at distinguishing the direct and indirect effects of low freezing temperatures on the photosynthetic apparatus as well as characterization of whole plant FT in absolute terms require application of other experimental approaches.
At any given stage of plant development, FT depends on the previous environmental conditions to which the plants were exposed, because FT increases upon exposure to low non-lethal temperatures, due to an adaptive process termed cold hardening, and decreases due to dehardening when plants are exposed to mild temperatures [1,16]. Thus, the FT of a given genotype will vary between sites and instants. Therefore, it is not possible to determine FT with observations in the field, whereas winter survival as a complex response to different stresses can be comprehensively assessed. In addition, the frequency distribution of winter stress conditions at inter-annual time scales may include a low fraction of winters that are suited for the purpose of FT evaluation (so called “test winters” or “differential winters”, sensu Levitt [2]). Especially in environments characterized by winters with aleatory severe frost events, many experimental years will not result in stress-conditions suitable for discrimination between more or less resistant cultivars. It will be excluded during mild winters that do not damage even the most sensitive genotypes and during winters with extremely cold episodes when all genotypes are severely damaged [8]. Controlled and repeatable growth and hardening conditions in growth chamber experiments and artificial freezing stress at defined temperatures are thus needed for quantification of FT at defined levels of hardening. For tests performed under controlled conditions, plants can be grown and acclimated in containers that occupy relatively little space for some weeks only.
Besides the evaluation of FT for plants grown under controlled conditions, it remains important to evaluate FT and/or survival probability at a given state of hardening and potential supplementary stresses in the field, excluding subsequent additional stresses [17]. To this end, several methodological approaches have been proposed and tested in the literature. One modification of the field methods is the “provocation pot method.” Plants are grown and wintered in boxes, placed at different heights above ground and transferred into a greenhouse after exposure to a strong frost event or other stresses. Subsequently, plant survival is determined after regeneration [18]. With several variants of field-laboratory methods (FLM) coined “provocation tests,” plants grown in the field or in pots that are placed outside during winter are transferred to the laboratory and exposed to frost using freezers [16,19,20].
In combination with these field-laboratory methods, high-throughput phenotyping techniques are needed to study the FT after hardening under field conditions as well as to allow for combined assessment of frost hardiness during winter and winter survival. Harvesting of single leaves from field trials and subsequently exposing them to freezing temperatures in controlled laboratory freezing tests combined with chlorophyll fluorescence analysis is potentially a viable solution [21,22]. Such an approach is only minimally invasive in the sense that the plant from which the leaf is harvested for a freezing test is not killed. In addition, the high number of individuals present even in small experimental field plots allows for repeated harvesting with sufficient sampling size in the course of the winter. Furthermore, laboratory freezing tests increase the capacity for evaluation of frost resistance, especially in environments that are characterized by winters with aleatory severe frost events only. The laboratory freezing test allows for provocation of damaging low temperatures within the background of a state of hardening obtained under ambient weather conditions.
Analogous applications of chlorophyll fluorescence analyses on cut leaves exposed to stress have been reported for heat stress in laboratory and greenhouse experiments on tomato [23], cotton (for screening genetic diversity) [24], and wheat [25], as well as rice (for chilling sensitivity) [26]. Chlorophyll fluorescence can also be measured to study the response of the photosynthetic apparatus to non-lethal low-temperature stress through, e.g., effects on ϕPSII, diverse quenching mechanisms [14], and several parameters that can be derived from fast fluorescence transients [20,27].
However, here we focus on the use of chlorophyll fluorescence as an indicator for lethal damage applied in the context of combined field-laboratory methods. This approach needs to be scrutinized for some potential pitfalls. Firstly, it must be determined whether subjecting detached leaves to the freezing test introduces a bias. Secondly, the time horizon up to which leaf senescence induced by detaching the leaf from the plant does not impact repeated measurements during recovery from freezing stress needs to be determined. Detaching leaves from the plant leads to physiological changes, e.g., switching from export of carbohydrates to storage as fructans in gramineae leaves, a change through which sink limitation of photosynthesis is avoided for up to several days after cutting [28]. However, in the context of using PSII chlorophyll fluorescence as an indicator for leaf damage, cutting-induced changes that lead to senescence, defined as reduction in chlorophyll content and photosynthetic capacity, remobilization of nitrogen from the leaf [29] that could potentially interfere with the assessment of FT, need to be excluded.
Therefore, following the development of FLM approaches described above and coupled with the use of chlorophyll fluorescence as an indicator, we further investigate the feasibility of using such an approach when phenotyping FT in large panels of genotypes. To this end we test the following hypotheses:
  • that leaf damage assessed with chlorophyll fluorescence measurements after freezing tests does not differ between leaves left attached to the living plant and cut leaves; and
  • that the onset of leaf senescence in detached leaves is sufficiently late as to not interfere with measurements of recovery after freezing tests.
These tests are reported with the objective of demonstrating the reliability and sensitivity of measurements of chlorophyll fluorescence in leaves detached in the field and evaluating the feasibility of application to discriminate genotypes with different FT in cereals grown under various environmental conditions during winter (see Table 1 for a list of the experiments). Some applications are reported that illustrate the utility of field sampling combined with laboratory freezing tests to address questions that cannot be approached with pure growth chamber studies or measurements taken exclusively in the field.
Table 1. Abbreviations for the experiments; studied species; growth conditions: GC = plants grown in growth chambers, field = plants grown in the field and leaves cut for subsequent freezing tests and measurements; Treatments: i = measurements on attached leaves, c = measurements on cut leaves, FACE = Free Air Carbon Dioxide Enrichment; Stress temperature = minimum temperature during freezing stress tests (°C); number of genotypes studied. See Table S1 in the Electronic Supplementary Materials (ESI) for more information on the field trials.
ExperimentSpeciesGrowth ConditionsTreatmentsStress TemperatureNumber of Genotypes
E1H. vulgareGCE1i, E1c, E1i, E1c−13 and no stress test31
E2H. vulgareGCE2i, E2c, E2i, E2c−13 and no stress test31
E3H. vulgarefieldE3−1430
E4A. sativafieldE4No stress test34
E5A. sativafieldE5No stress test46
E6T. aestivumfieldE6 FACE, ambient & elevated CO2No stress test1
E7T. durumfieldE7a, E7b ambient CO2No stress test1
E8T. durumfieldE8 FACE, ambient & elevated CO2−1412
E9H. vulgarefieldE9−1455

2. Results and Discussion

The combination of hardening in the field, harvesting of leaves from field plots and subsequent testing for FT builds on the assumptions that cut leaves are not subject to changes in the capacities and functioning of their photosynthetic apparatus, due to the immediate effects of cutting. In addition, Fv/Fm, the maximum quantum yield of photosystem II used as indicator of damage, should not change due to incipient senescence for at least four days after cutting, a time period that exceeds the length of a full freezing test experiment. Thus, it needs to be shown that cutting leaves for testing FT does not have an additional effect due to cutting.

2.1. Effects of Test Conditions

Before addressing the effects of cutting, the dynamics of the manifestation of damage symptoms needs to be described. Damage symptoms in the field are affected by conditions at harvest (hardening stage, degree of freezing stress in preceding nights, light intensity, other potential causes of damage). Factors that cause variability not related to the freezing damage itself can be minimized under controlled conditions in growth chamber experiments by testing Fv/Fm in intact leaves before and after freezing stress, as well as after a recovery period. At recovery, damage is revealed in the presence of light, and differences in FT are more evident because the difference in PS II maximum yield between damaged and non-damaged leaves is greater relative to the measurements taken directly after the end of the stress treatment [11,21].

2.1.1. Effect of Test Conditions in Absence of Freezing Stress: Attached vs. Cut Leaves (Effect of Cutting) in Growth Chamber Experiments

When Fv/Fm was measured for attached and cut leaves (E1, E2) that were not subjected to a freezing stress, at the time at which stressed leaves were measured after the recovery period (Figure 1, filled triangles), both attached and cut leaves had high Fv/Fm values typical for intact non-stressed PS II. Thus, in plants grown under controlled conditions within growth chambers, leaf senescence effects on PS II efficiency in detached leaves did not interfere with freezing tests. The implicit hypothesis that this also indicates there is no membrane damage should be tested with further studies.
Figure 1. FT of 31 barley genotypes (E1, E2) assessed with chlorophyll fluorescence after freezing tests and recovery. Varietal mean Fv/Fm of leaves still attached to the plant vs. those cut prior to the freezing test for experiments with a stress temperature of −13 °C. Fv/Fm measured on non-stressed leaves in E2 in parallel to the stressed leaves after time elapsed for the freezing test and 24 h of recovery is shown with filled triangles.
Agronomy 05 00071 g001

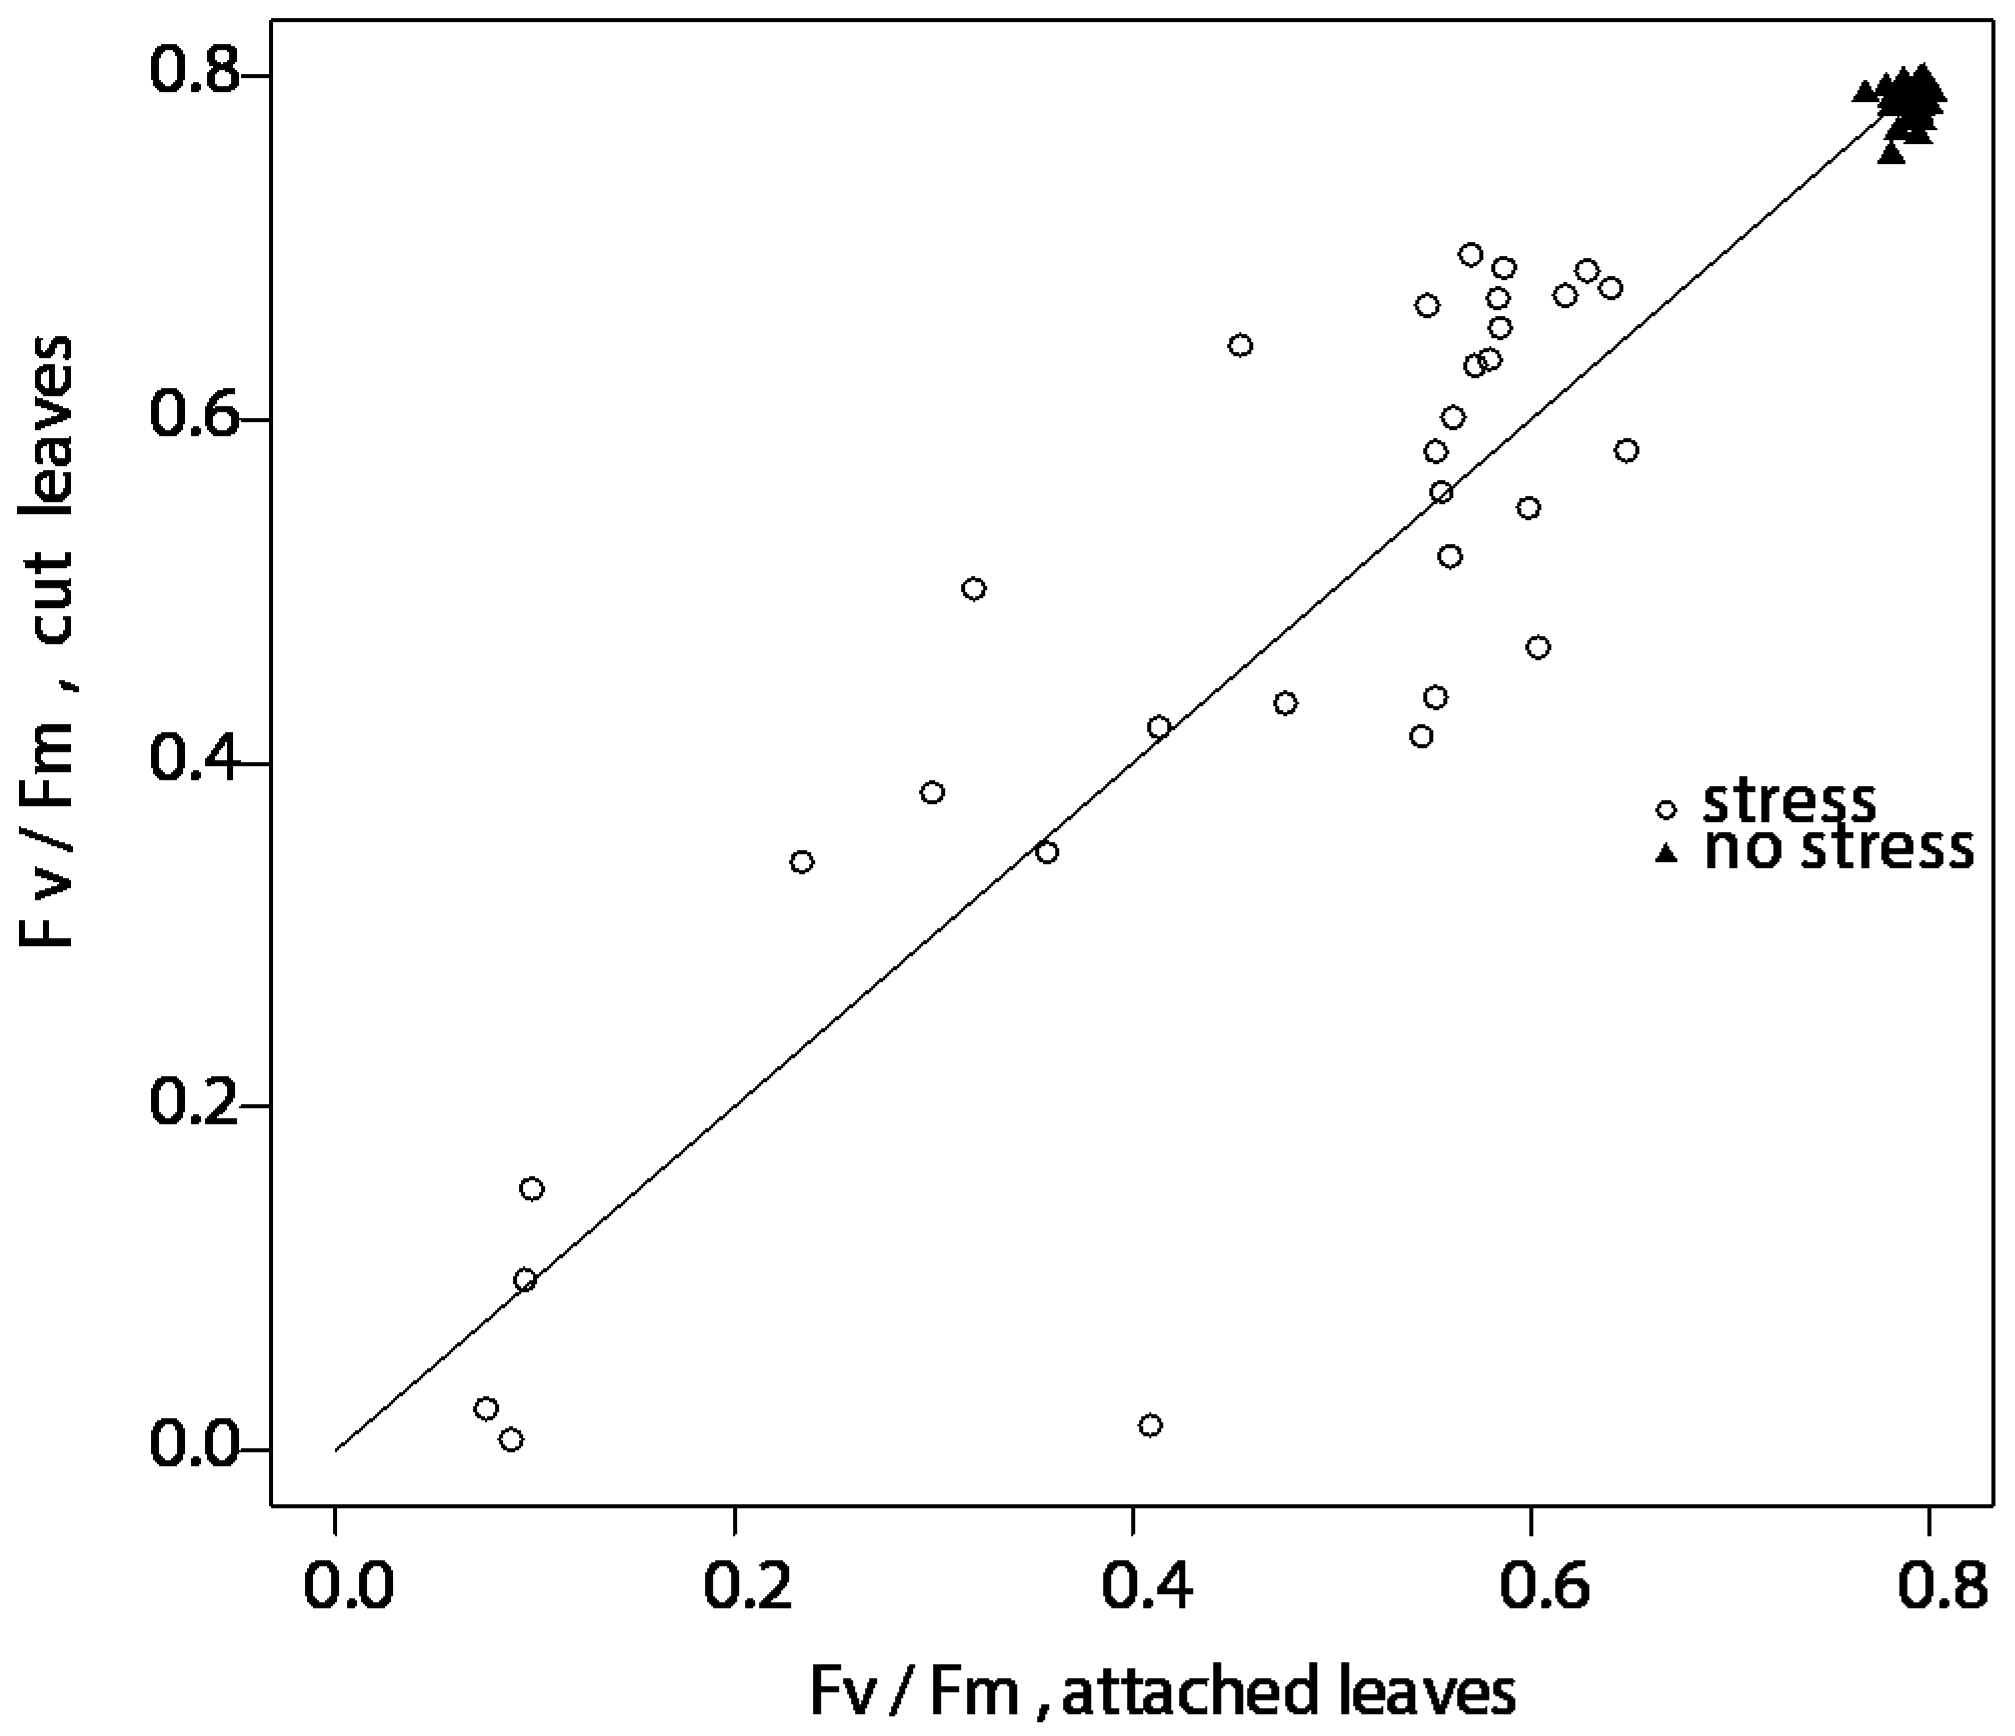
2.1.2. Freezing Tests on Attached and Cut Leaves Lead to Consistently Similar Results in Growth Chamber Experiments

Performing freezing stress tests on attached and cut leaves in parallel (experiments E1 and E2) led to highly significant correlations (p < 0.001) between the varietal averages for FT with correlation coefficients of 0.81 for E1 and 0.66 for E2. The mean FT did not differ significantly between attached and cut leaves (paired t-test, p = 0.577). The mean coefficient of variation was about 0.1 for non-damaged varieties and up to 0.8 for varieties close to their LT50. Thus, for measurements on a variety under identical conditions, the correlation coefficients indicate a good correspondence in FT between tests done on attached leaves and tests done on cut leaves. The ranking for FT for the average of experiments E1 and E2 was highly similar when assessed on attached or on cut leaves (Figure 1, open circles). The same conclusion was drawn from the comparison of cut leaves and leaves that remained attached to the plant exposed to heat stress for a test completed within two hours of cutting [23].

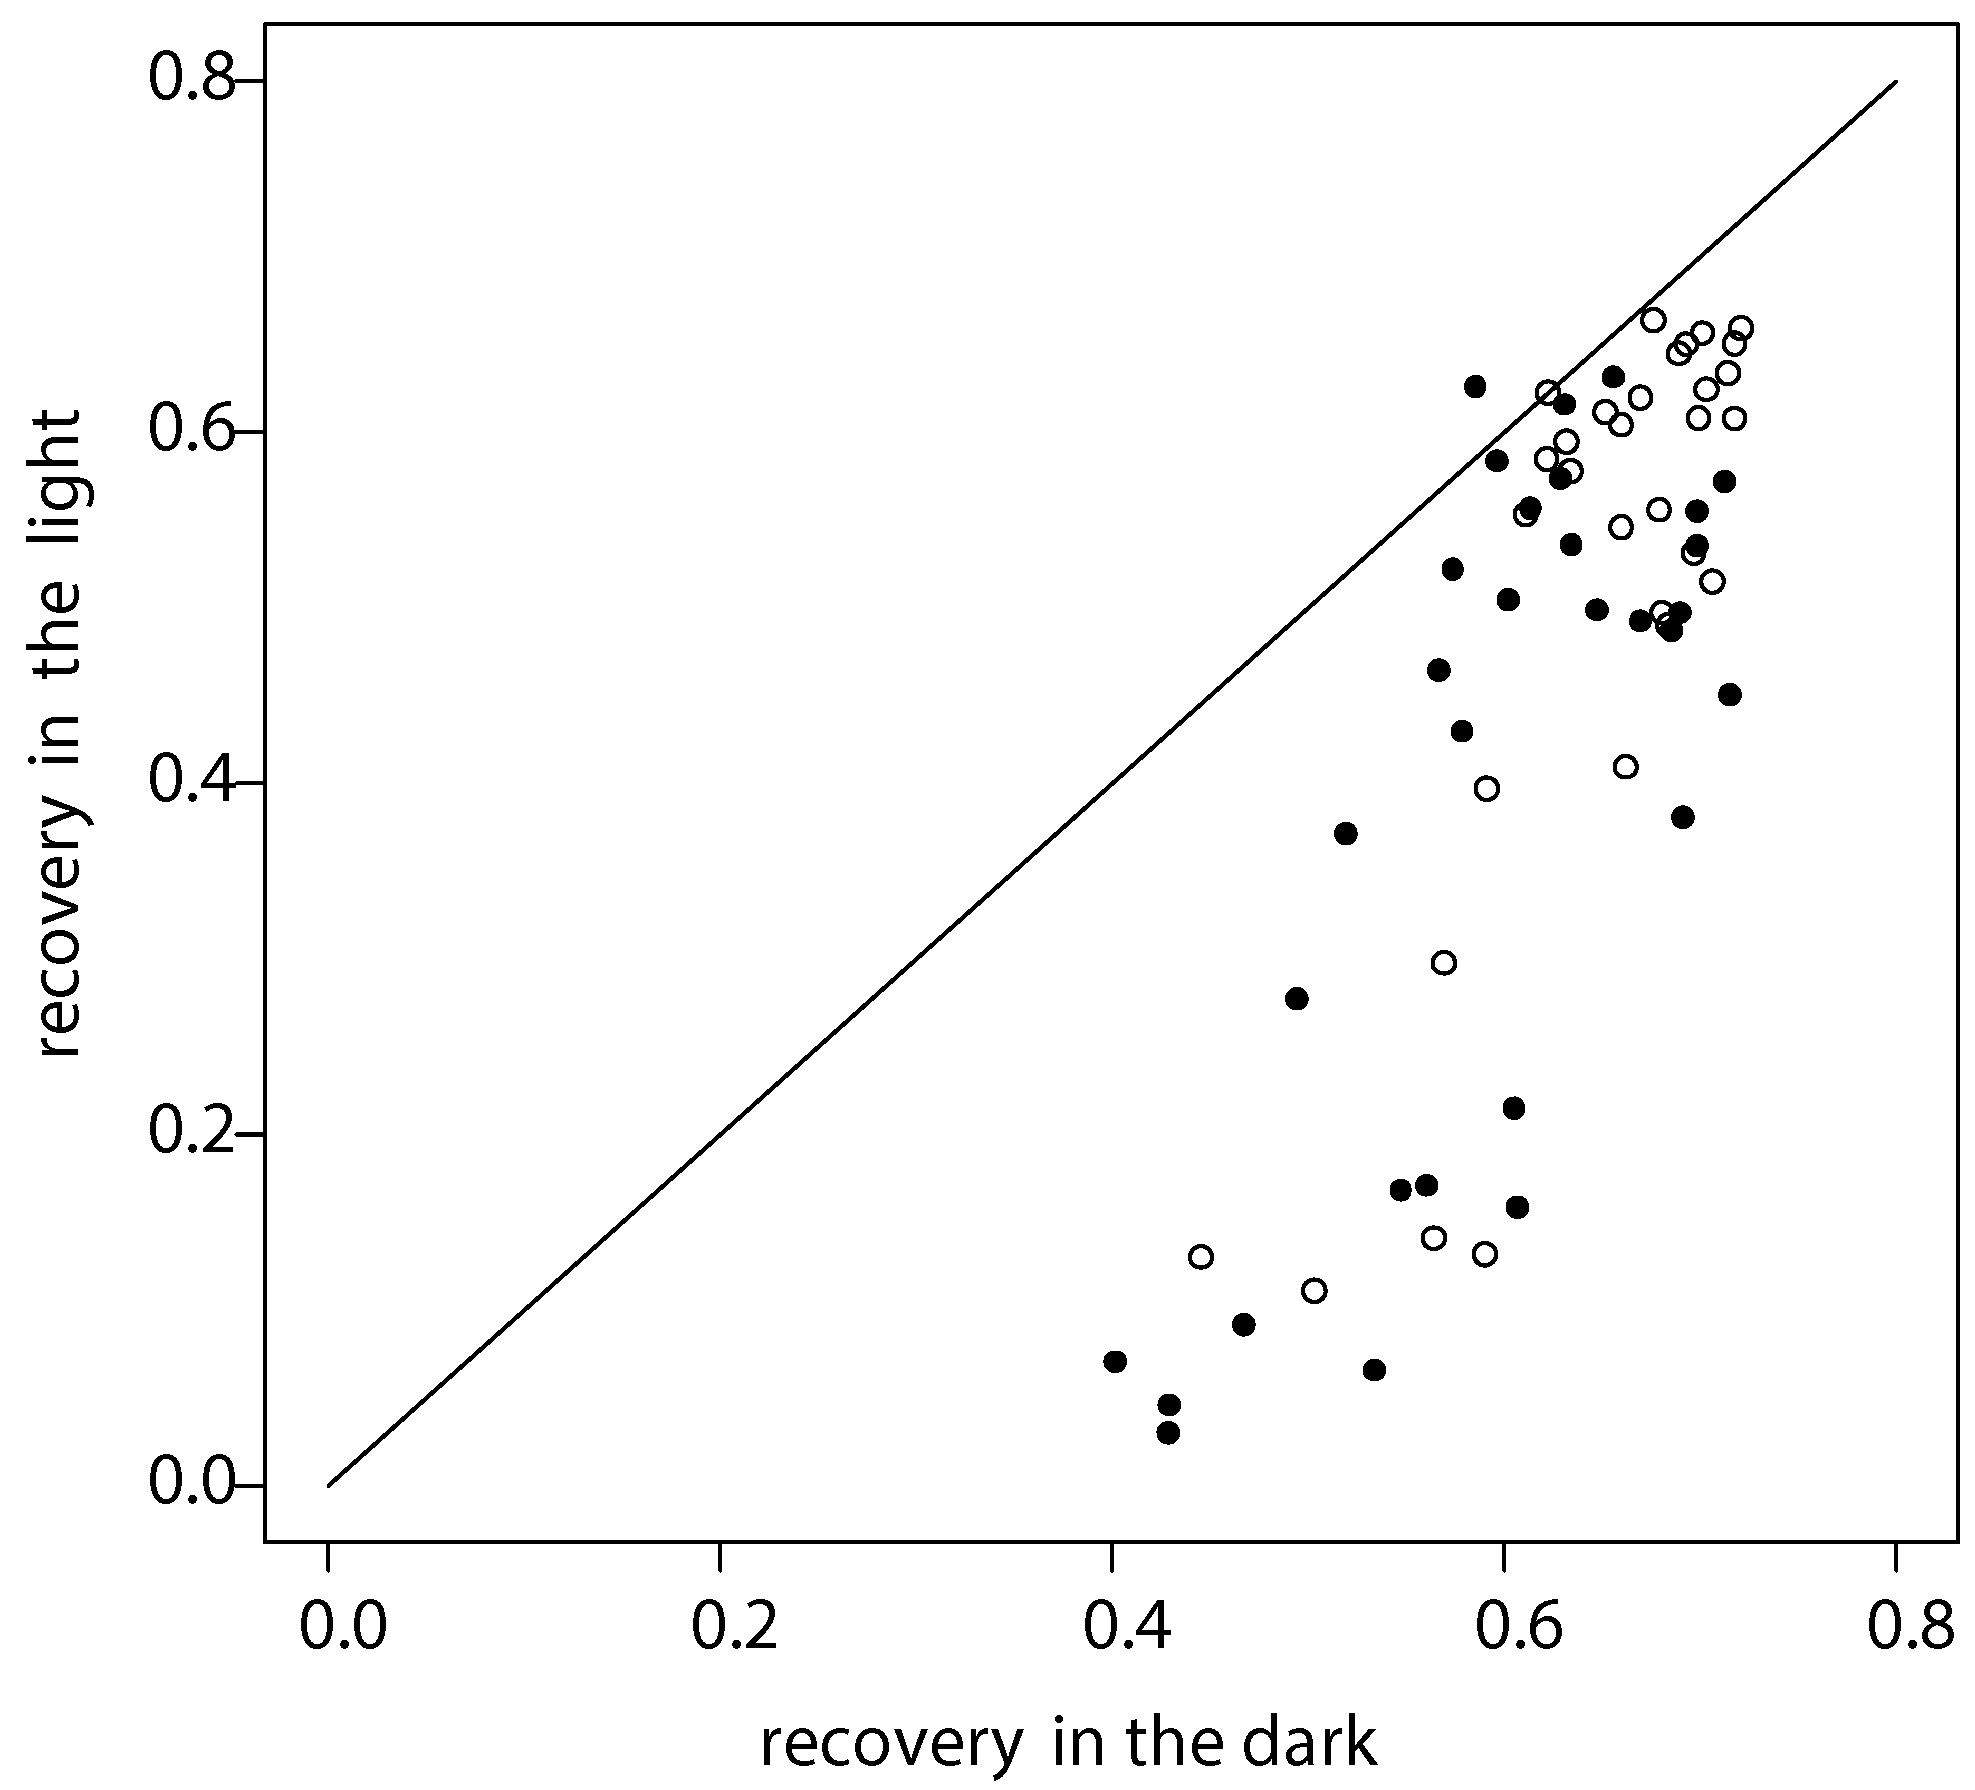
2.1.3. Daylight during Recovery Accelerates the Development of Damage Symptoms E1, E2

Recovery of attached leaves from stress in a 10/14 h day/night regime resulted in faster development of the damage symptoms (Figure 2) as compared to recovery in 24 h of darkness. However, the average genotype FT under the two recovery conditions were highly significantly correlated (p < 0.001) with correlation coefficients of 0.82 (E1) and 0.74 (E2). The measurements taken immediately after the end of the freezing stress treatment on the plants subsequently recovering in the light and in the dark significantly correlated with correlation coefficients of 0.67 (E1) and 0.78 (E2), and the correlation between measurements taken post-stress and after recovery was >0.78. Thus, it can be concluded that recovery in a day/night light regime accelerates the expression of damage symptoms but does not distort the differences between genotypes.
Figure 2. Comparison of FT of attached leaves as assessed with chlorophyll fluorescence subsequent to a freezing test after 24 h recovery in complete darkness vs. recovery in a day/night light regime for freezing test performed at −13 °C (E1 open circles and E2 closed circles).
Agronomy 05 00071 g002
These tests confirm the role of chlorophyll fluorescence emitted by photosystem II as an indicator of frost damage that manifests more rapidly when the recovery proceeds in the light. The primary frost damage presumably consists of damage to membranes and consequent membrane leakage [15]. Then, the length of the exposure to the effects of membrane leakage and the facilitation of spread of damage by recovery in the light would determine the speed with which damage to PS II manifests, and thus improve discrimination between genotypes. Measurements of Fv/Fm after recovery in a 24 h day/night cycle discriminate between damaged and non-damaged leaves more effectively than measurements taken immediately after the end of the freezing treatment or after recovery in the dark and are thus better suited to discriminate between genotypes. Therefore, it is important to apply a defined protocol to the freezing and testing sequence (see also [30] for sensitivity to the length of exposure to freezing temperatures, [10] for sensitivity to temperature during the recovery period, [11,20] for increasing discriminatory power of Fv/Fm after recovery).

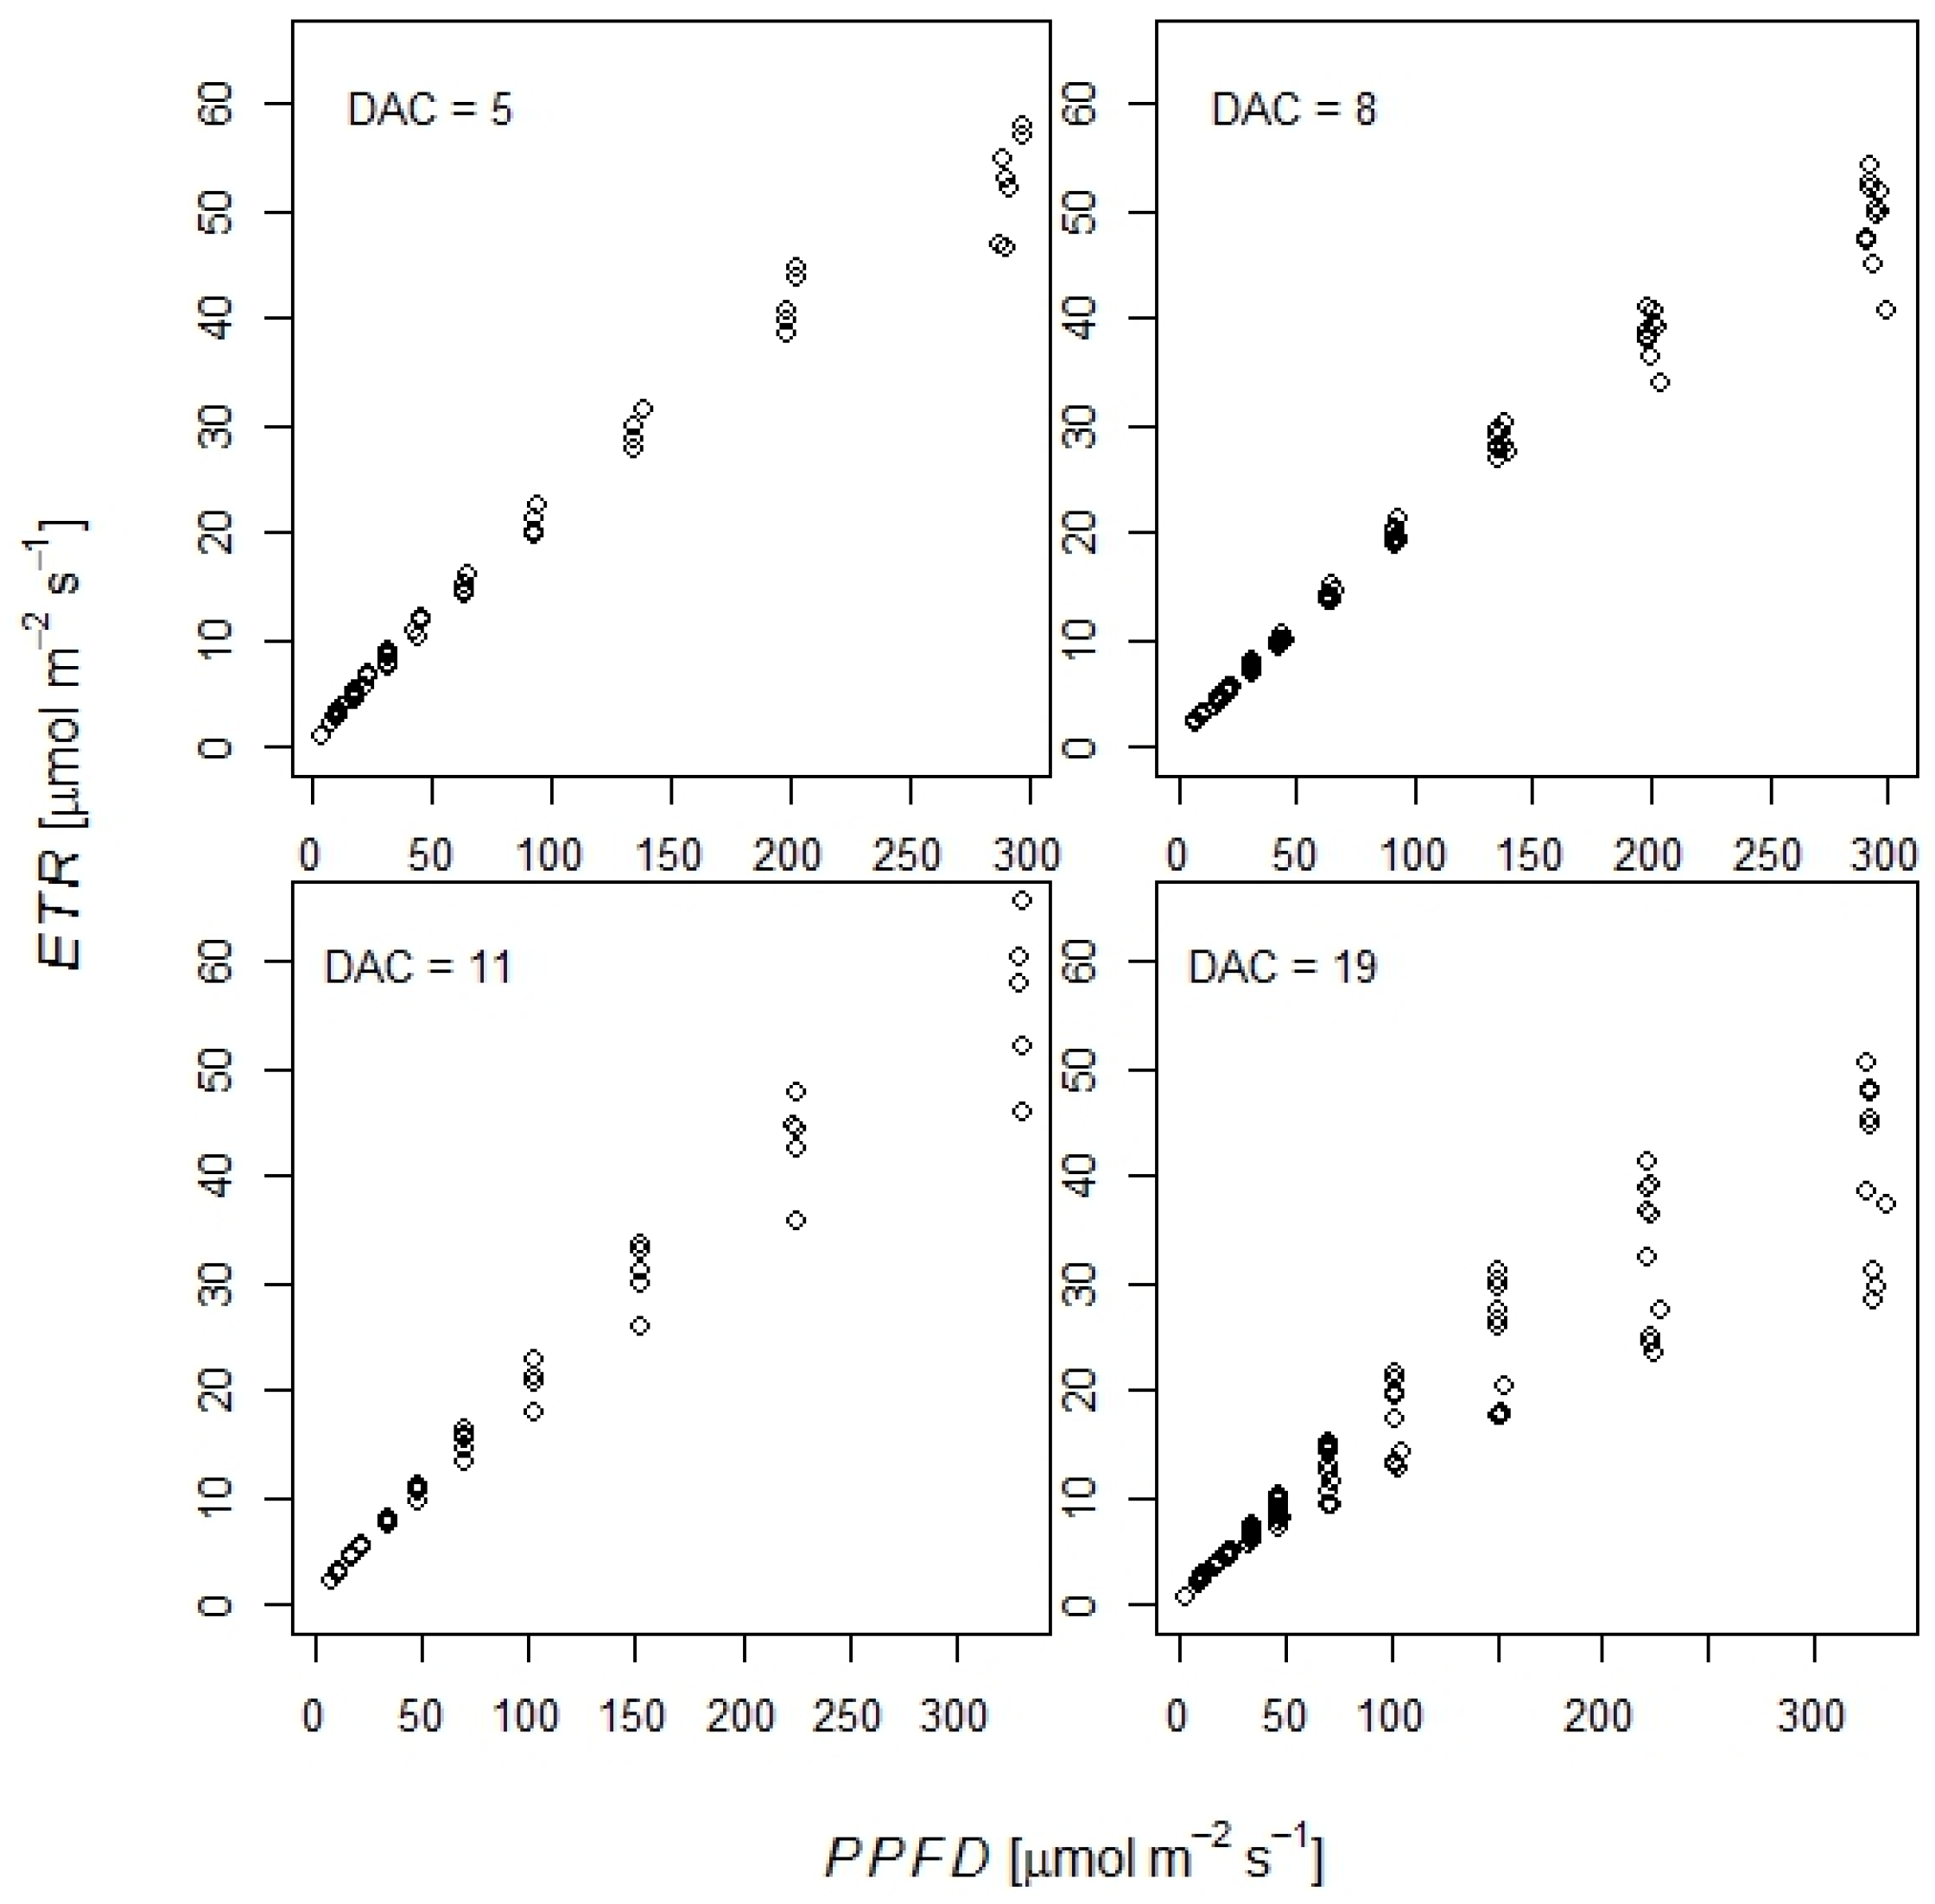
2.1.4. Effect of Cutting in Absence of Artificial Freezing Stress in Leaves Sampled in the Field

A condition for the application of freezing tests on leaves cut from plants in the field is that traumatic effects of cutting on the photosynthetic functions that are used for diagnosis of freezing damage can be excluded.
Barley: Leaves of the same barley genotypes tested with experiments E1 and E2 (except one genotype, Pamina) were cut in a field trial in January 2012 (E3), and Fv/Fm was subsequently monitored on leaves not subject to a freezing test for three days (Table 2). Fv/Fm slightly increased over time, indicating that the functioning of PS II was not impaired by cutting and keeping the leaves in Falcon tubes in a humid environment. Leaves sampled from the same experiment in December and February had an average Fv/Fm of 0.76 and 0.72 two hours after sampling and of 0.78 and 0.72 four hours after sampling, respectively. Leaf conditions are subject to preceding freezing stress and high light stresses in the field [22]. The variability between varieties is not an effect of cutting, as can be concluded from the differences of Fv/Fm measurements in hours subsequent to cutting taken at different sampling dates that include plants at different levels of stress experienced in the field prior to cutting.
Table 2. Average Photosystem II maximal quantum yield (Fv/Fm) after transfer of cut leaves of 30 barley genotypes acclimated in the field to the laboratory (E3). n = 180 = 6 leaves per genotype × 30 genotypes. Fv/Fm mean with lowest and highest genotype mean in parentheses. Sd = Standard deviation of the full set of all single measurements. Significant differences between sampling times tested with Wilcoxon rank sum test.
Time after SamplingFv/FmSdDifferences
2 h   0.68 (0.58, 0.72)0.061c
4 h   0.68 (0.57, 0.72)0.063c
1 day0.70 (0.58, 0.74)0.062b
2 days0.68 (0.59, 0.74)0.069c
3 days0.72 (0.55, 0.76)0.077a
Are these observations on barley representative of other cereal species? In order to respond to this question, post-cutting monitoring was also performed on oat, bread and durum wheat genotypes.
Oat: After two hours of dark acclimation, the average Fv/Fm of 34 oat genotypes (E4) was 0.536, and after five hours it had risen to 0.584. Four genotypes were damaged by frosts occurring in the field prior to the sampling. Two hours after sampling on dark adapted leaves, the average Fv/Fm of 46 oat genotypes (E5) was 0.694 and had risen after four hours after sampling to 0.718.
Wheat: After 0.75 h, 4 h, and 15.25 h in the dark, the Fv/Fm leaves of the bread wheat variety Bologna (E6) sampled on 31 January, 2012 of elevated CO2 (FACE) and control treatments (Table 3) did not differ. The cut leaves, kept in closed falcons to avoid dessication, recovered from slight non photochemical quenching as indicated by the increase in Fv/Fm in the course of time. As high values of Fv/Fm at the maximum usually exhibited by healthy, unstressed leaves (0.80 to 0.82) were recorded, there is no indication of detrimental effects on the functioning of photosystem II when keeping leaves for 15 h after cutting them from the plant. These results are in accordance with constancy of high Fv/Fm reported by Sharma et al. [25] for a spring wheat variety up to two hours after cutting.
Table 3. Bologna FACE (E) and ambient control (A) plots. n = 8 leaves per treatment. Fv/Fm mean with lowest and highest genotype mean in parentheses. Sd = standard deviation. Significant differences between sampling times tested with Wilcoxon rank sum test.
TreatmentTime after SamplingFv/FmSdDifferences
A0.75 h   0.76 (0.73–0.79)0.020c
A4 h   0.79 (0.77–0.81)0.017b
A15.25 h   0.81 (0.80–0.82)0.006a
E0.75 h   0.76 (0.70–0.81)0.040c
E4 h   0.79 (0.75–0.84)0.028bc
E15.25 h   0.81 (0.79–0.83)0.014ab
The measurements made on the durum wheat variety Claudio (E7) also sampled on 31 January 2012 produced similar results. After 0.75 h, 4 h, and 15.25 h in the dark, the Fv/Fm of leaves cut from plants sown at two different sowing dates did not differ (Table 4).
Table 4. Claudio first sowing date (S1) and second sowing date (S2) plots. n = 9 leaves per sowing date, of which 5 were kept in the light and 4 in darkness after the measurement at 4 h after cutting. Fv/Fm mean with lowest and highest genotype mean in parentheses. Sd = standard deviation. Significant differences between sampling times tested with Wilcoxon rank sum test.
TreatmentTime after SamplingFv/FmSdDifferences
S10.75 h   0.73 (0.68–0.78)0.036c
S14 h   0.77 (0.75–0.80)0.015b
S115.25 h   0.81 (0.80–0.83)0.010a
S20.75 h   0.75 (0.70–0.80)0.034c
S24 h   0.77 (0.75–0.80)0.019b
S215.25 h   0.82 (0.81–0.83)0.010a
The cut leaves recovered from slight reduction in the maximum yield of photosystem II as indicated by the increase in Fv/Fm in the course of time. As high values of Fv/Fm at the maximum usually exhibited by healthy, unstressed leaves (0.80 to 0.82) were recorded, there is no indication of detrimental effects on the functioning of photosystem II when keeping leaves for 15 h after cutting them from the plant. No significant differences were detected between plants kept under PPFD of 150 μmol m−2·s−1 or those kept in the dark between the second and the last measurement.
In order to assess the integrity of the photosynthetic apparatus on even longer time scales, leaves of the durum wheat variety Claudio were cut in the field on 31 January 2012 (H1), 3 February (H2), 8 February (H3), and 9 February (H4a and H4b) when plants were under snow cover and on 22 February 2012 (H5b) after snow melt. Monitoring of Fv/Fm for leaves kept in the dark confirmed the recovery of maximum capacity during the first hours after cutting and revealed that the integrity of PS II was conserved for at least 4 days after cutting (DAC, Figure 3a) with Fv/Fm values close to 0.8. Between days 3 and 6 after cutting, a slow decline in Fv/Fm is seen with values that remain above 0.7. From day 6 after cutting onwards, a rapid decline occurs, indicating leaf senescence. Also after snow melt, Fv/Fm remained high at an average of 0.77 three to five hours after sampling. Leaves cut at 10 February 2013, kept under low light (PPFD: 150 μmol m−2·s−1) and low temperature (3 °C day, 1 °C night) maintained PS II integrity for even longer (Figure 3b). Beyond PS II, the full photosynthetic machinery also remained intact and worked at unchanged capacity until DAC 11, as evidenced by the electron transport rates measured based on chlorophyll fluorescence (Figure 4). At DAC 11, between-leaf variability had started to increase, and at DAC 19, ETR was reduced by 25%.
Figure 3. (a) Time course of Fv/Fm of leaves of the durum wheat variety Claudio cut in the field when plants were under snow cover and kept in the dark. Different symbols denote harvests in January/February 2012 at different times (H1, H2, H3, H4a, H4b, H5b). H4a leaves under snow cover, H4b from a plot with snow removed the day before cutting, H5b after snow melt; (b) Time course of Fv/Fm of leaves of the durum wheat variety Claudio cut in the field when plants where under snow cover (10 February 2013) and kept in the light at low temperature (E7).
Agronomy 05 00071 g003
In summary, the tests of PS II maximum quantum yield and ETR show that leaves cut in the field and kept in Falcon tubes maintain fully functional photosynthetic machinery for several days when kept in the dark at room temperature or when kept in low light at low non-freezing temperatures. In any case, a slow decrease in photosynthetic capacities did not start before the 40 h maximally applied for the full length of freezing tests, including the subsequent recovery phase. Thus, cut cereal leaves can be regarded as a viable system for FT tests, as interference of leaf senescence or damage due to cutting with the integrity of the photosynthetic machinery, which is used as an indicator, cannot be detected.
Figure 4. Response of electron transport rate (ETR) to Photosynthetically active Photon Flux Density (PPFD) of the durum wheat variety Claudio at 5, 8, 11 and 19 days after cutting (DAC), respectively (E7).
Agronomy 05 00071 g004

2.2. Applications of the Field Sampling/Laboratory Test Methods

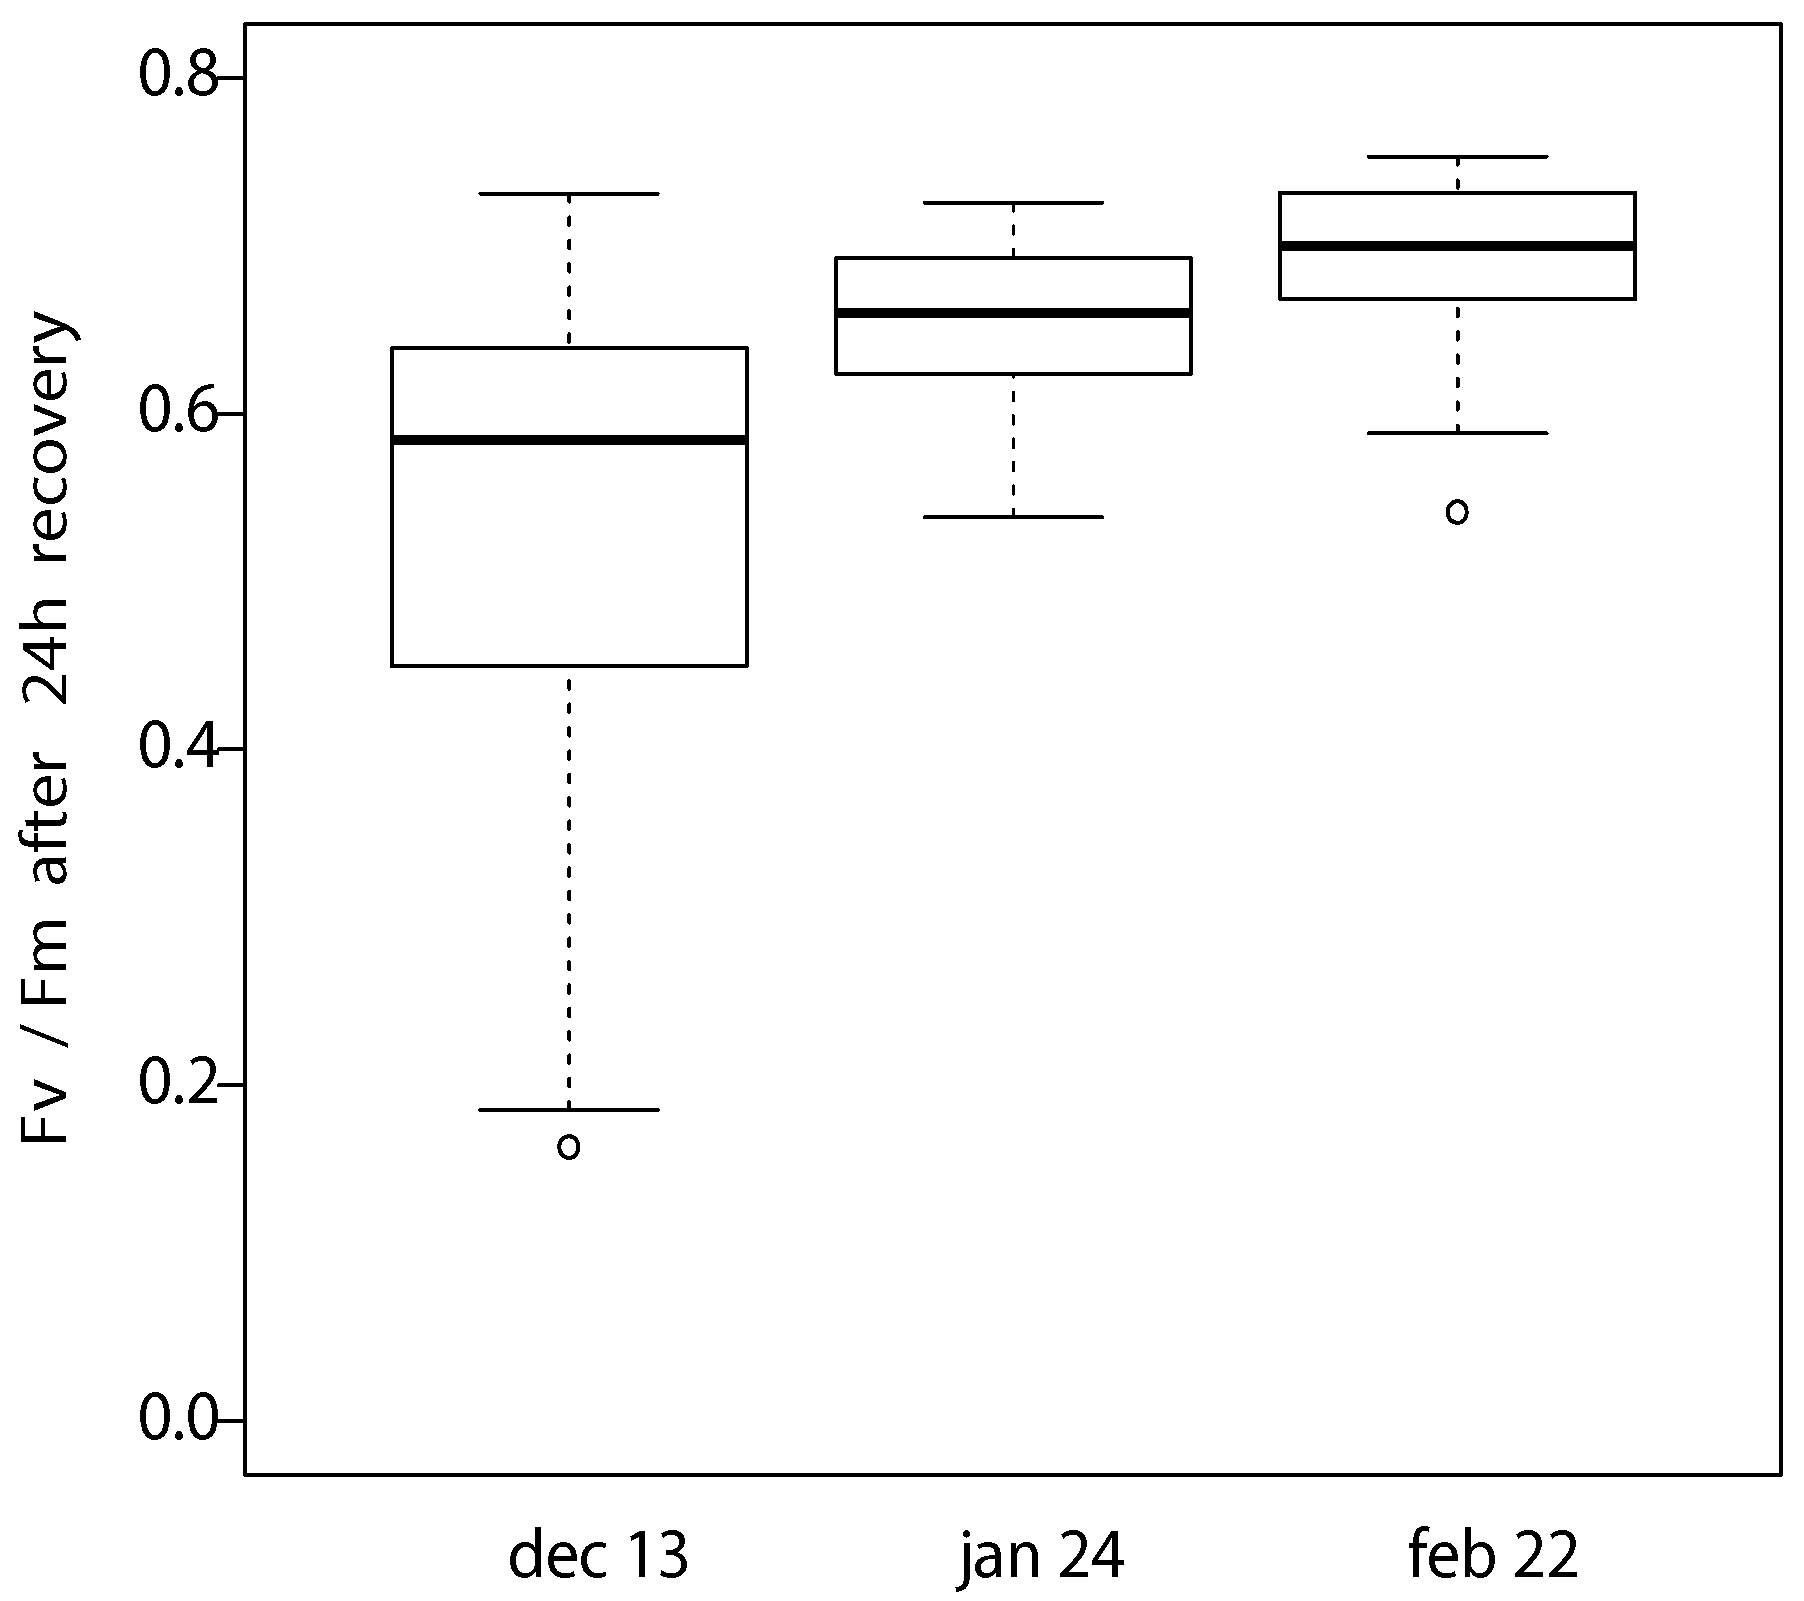
2.2.1. Seasonal Monitoring of Frost Hardiness

Seasonal monitoring of FT of barley leaves harvested in the field (E3) and subjected to laboratory freezing tests at −14 °C indicated an increase in FT from early winter (December) to January (Figure 5). Frost stress treatments had more severe effects in December due to the short time for acclimation and earlier growth stage of the plants with respect to the other sampling dates. The Fv/Fm of the leaves measured before the freezing stress test also revealed differences between the sampling dates (see Section 2.1.4).
The mean relative ranks of the 30 barley varieties determined for FT measured in the chamber experiments (E1, E2) and the field-laboratory test (E3) were correlated with r = 0.70 (p < 0.001). This correlation coefficient is similar to those between cut and attached leaves within the single chamber experiments described in Section 2.1.1 (0.81 and 0.66). However, the results obtained for the single harvesting dates differed in the degree to which they led to a FT ranking similar to the one obtained with growth chamber experiments. For the sampling dates in December and February, the varietal ranking correlated with the the ranking obtained within E1 and E2, while the January sampling led to weak, non-significant correlations (r = 0.09 to 0.24) with the other experiments. A priori, it is not expected that the ranking of FT remains constant throughout the winter season in the field because FT is not a static trait and it changes with nutrition, moisture, plant age, the duration and intensity of low temperatures, light intensity [1] and daylength [31]. In addition to the resulting state of hardening/dehardening, damage to the plants under field conditions and very slowly reversable reduction of Fv/Fm can also effect the results of subsequent freezing tests [16]. In the January sampling, Fv/Fm measured prior to the freezing test correlated weakly (r = 0.3) but significantly (p < 0.001) with Fv/Fm measured after recovery, while the two measurements did not correlate for the December and the February sampling. This correlation, together with the slow recovery of high Fv/Fm (see Section 2.1.4), indicates an unidentified stress to which the plants were subjected in the field prior to sampling.
Figure 5. FT of barley varieties assessed in winter 2011/2012 on leaves harvested from experimental plots at CRA-GPG, Fiorenzuola d’Arda, Italy. Freezing stress at −14 °C. Box plots represent measurement of 30 barley varieties (E3).
Agronomy 05 00071 g005
In conclusion, for seasonal monitoring of FT, two peculiarities need to be taken into account: (1) the minimum temperature applied during the freezing tests used to produce good discrimination of genotype FT varies throughout the season; (2) damage or only slowly reversable downregulation of Fv/Fm present at the time of sampling impact on FT screening and need to be taken into account.

2.2.2. Effect of Elevated CO2 on Frost Tolerance of Durum Wheat

Free Air Carbon dioxide Enrichment (FACE) techniques have been developed in order to study the effect of elevated CO2 on plant performance under field conditions (E8). If the relevance of FT for growth, survival and production is to be evaluated in the frame of such an experimentation, evidently field sampling for evaluation of FT obtained in different growth stages is the appropriate method, as a parallel growth chamber experiment would not simulate the full set of potential interactions that may play a role in the field. A freezing test at −14 °C performed with leaves of 12 durum wheat genotypes cut from a FACE experiment [32] at three dates (9 December 2011, 3 January 2012 and 25 February 2012) resulted in highly significant effect (ANOVA) from the sampling date. On average, the plants showed a progressive increase in FT during the winter months. The average Fv/Fm increased from 0.28 in December to 0.69 in January and 0.74 in February (see Table S3 for results by genotype). The FT of the tested genotypes differed significantly, but no significant effect of elevated CO2 or genotype by treatment interaction was found.

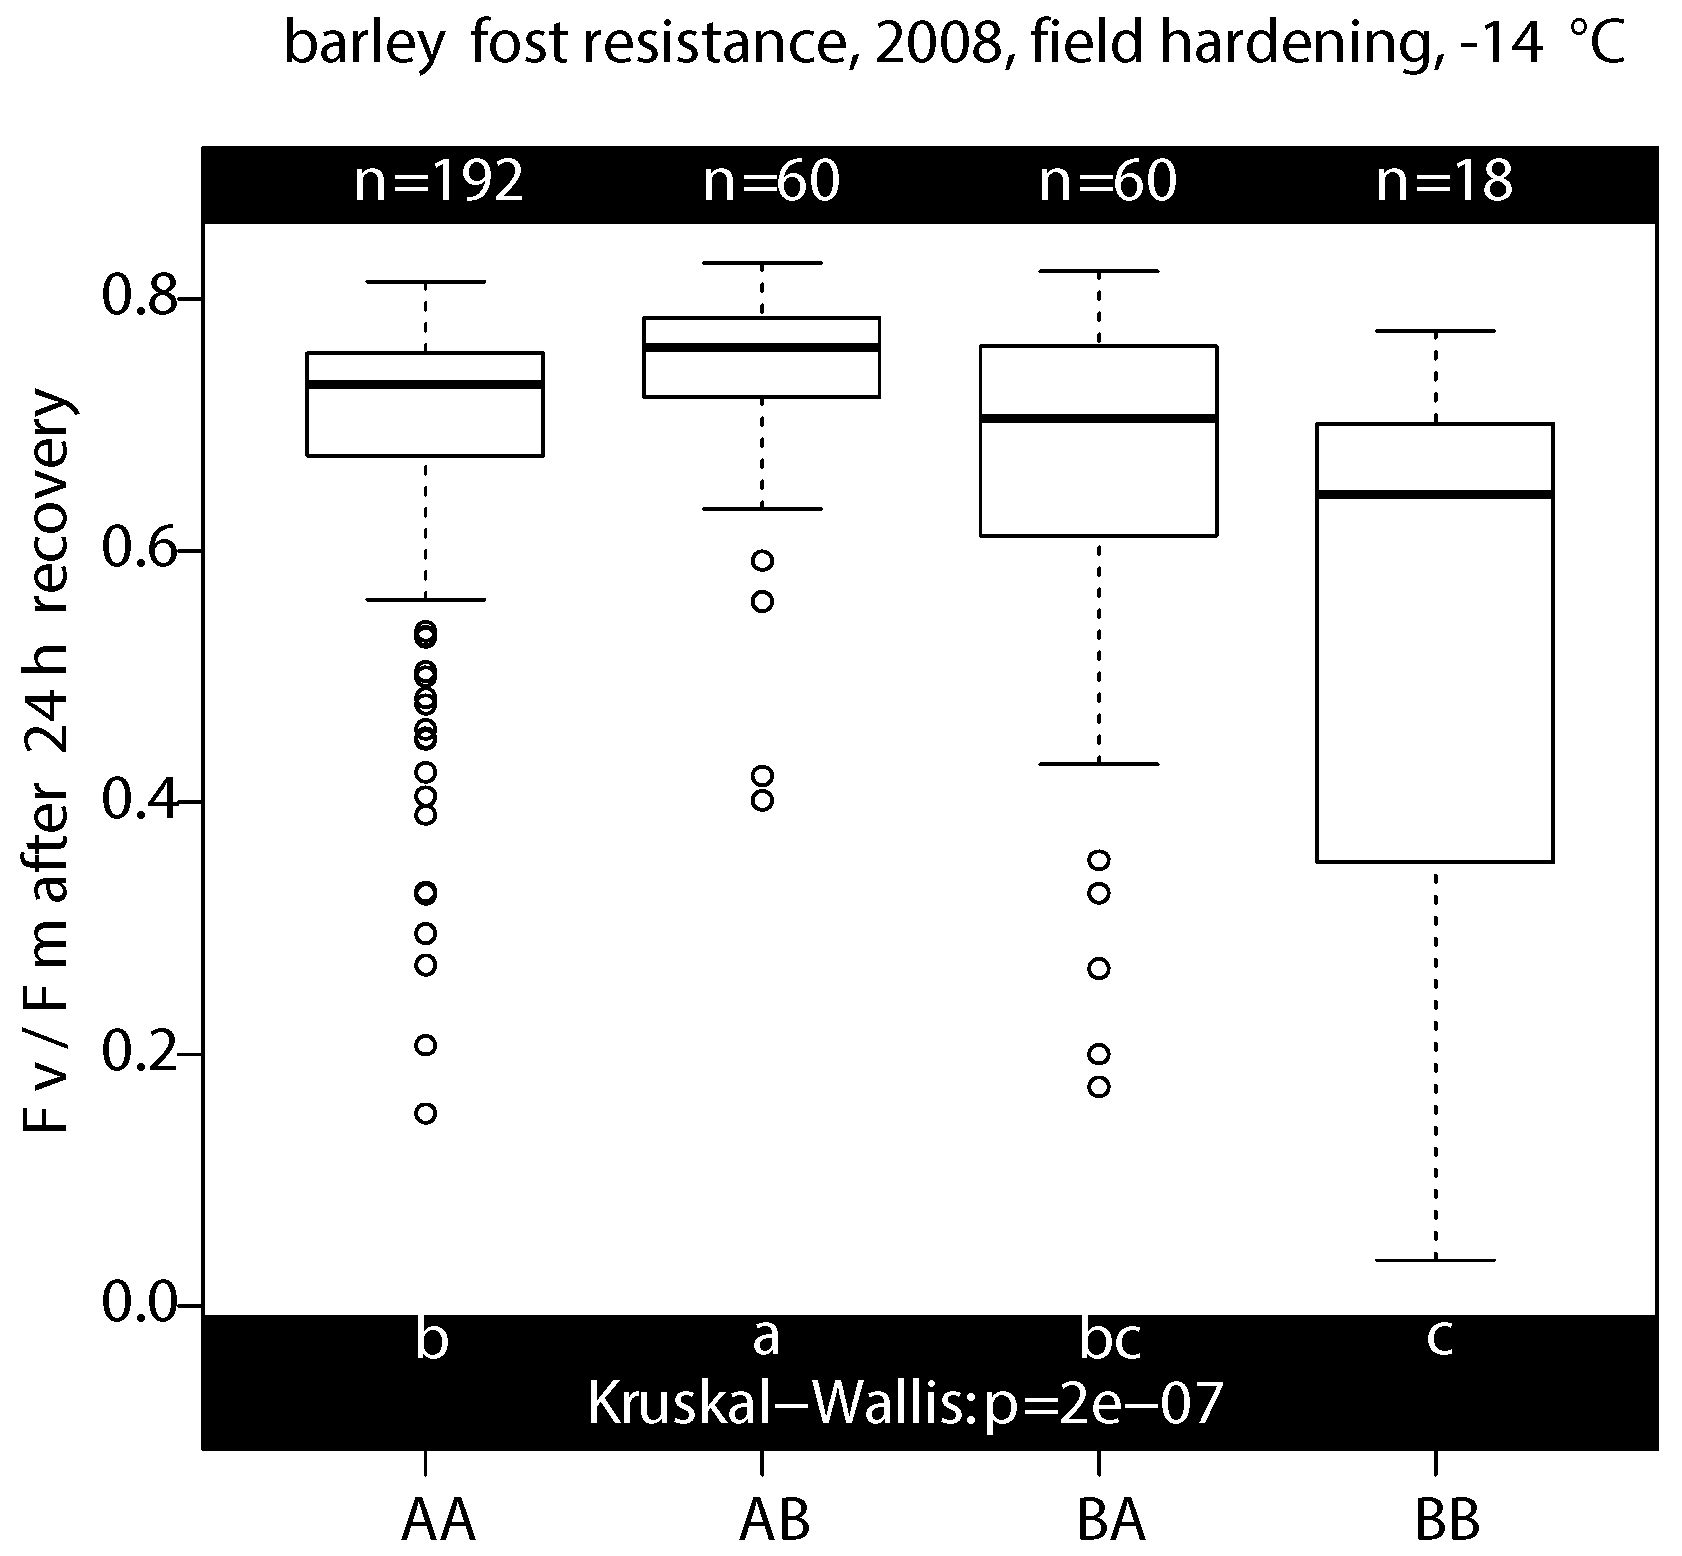
2.2.3. Phenotyping/Genotyping Study under Field Hardening Conditions

The association of FT of barley genotypes with the haplotypes of the vernalization loci VRN-H1 and VRN-H2 were studied by Rizza et al. [3] with freezing tests using barley seedlings grown in growth chambers under controlled conditions. Freezing tests after hardening under optimal (four weeks, 3/1 °C day/night) and suboptimal (shorter, i.e., three weeks or one week, or at higher temperatures, i.e., 12/7 °C day/night) hardening conditions revealed significant differences between the haplotypes AA, AB, BA and BB, where the abbreviations AA, BB, AB and BA indicate the vrn-H1/Vrn-H2 (winter), Vrn-H1/vrn-H2 (spring), vrn-H1/vrn-H2 (facultative), and Vrn-H1/Vrn-H2 (spring) haplotypes, respectively, with reference to the alleles of the varieties Nure (AA, winter) and Tremois (BB, spring). The genotypes carrying the haplotype AB were most resistant, especially when suboptimal hardening conditions were applied. Throughout the test, the order of resistance was AB > AA > BA > BB. It remains to be determined whether these results, obtained with laboratory studies, are representative of field conditions. The same set of barley genotypes was grown in the field, with leaves harvested and subsequently exposed to a freezing test (E9). The results (Figure 6, Table S2) are highly similar to the growth chamber/laboratory test studies. The FT difference between haplotypes is significant, with the order of the median response corresponding to the order described above. The FT of the genotype mean in the field-laboratory experiment and in the growth chamber experiment is correlated with r = 0.61 (p < 0.001).
Figure 6. FT of 55 barley varieties sampled in the field in February 2008, assessed with Fv/Fm after freezing tests and 24 h of recovery. n = number of measurements = 6 replicates × N, with N = number of genotypes. AA, AB, BA and BB refer to the Nure (A) and Tremois (B) alleles for the VRN-H1 and VRN-H2 vernalization genes [6].
Agronomy 05 00071 g006
These results confirm the applicability of the combined field sampling/laboratory testing approach as scrutinized in the previous sections for phenotyping large sets of genotypes as required for combined phenotyping/genotyping studies.

3. Experimental Section

For growth chamber experiments (Table 1; E1, E2) barley plants were grown from seed at 20/15 °C day/night temperatures for one week at 10 h daylength and 200 μmol m−2·s−1 PPFD. Subsequently, they were transferred to hardening conditions of 3/1 °C day/night for 4 weeks of hardening. Two series of independent freezing tests were carried out at freezing temperatures of −13 °C ± 1 °C. For these experiments, E1 and E2, either intact plants (E1i, E2i) or cut leaves (E1c, E2c) were subjected to the freezing treatment [11]. Fv/Fm was measured immediately before applying the freezing stress (pre stress), immediately after the end of the freezing stress (post stress), and after 24 h of recovery. In order to assess the role of light in the expression of post-stress damage, leaves were kept in darkness or in the light during the recovery period. Eventual rapid senescence was tested by comparing the results after recovery to measurements done on non-stressed plants kept under growth chamber conditions.
Plants from barley (E3, E9) and oat (E4, E5) field-trials and a bread and durum wheat FACE (Free Air Carbon dioxide Enrichment) experiment (E6, E7, E8) [32] were used for field sampling of the last fully developed leaves and then kept in the dark (see Table 1 and Table S1 for further information on the field trials). Fv/Fm was monitored after different lengths of dark acclimation to study reversion of initial reduction in the intrinsic maximal yield of photosystem II. Samples from E3 were taken at three sampling dates in December, January and February. For experiment E6, leaves were sampled on 31 January 2012 from the soft wheat variety Bologna in FACE and control rings, and from the durum wheat variety Claudio in the field surrounding the FACE experiment (E7). Claudio was sampled from plots with sowing dates 23 October 2011 (E7a) and 30 October 2011 (E7b). Five leaves of 34 oat genotypes each were cut in the field on 25 January 2011 (E4). Three leaves of 46 oat genotypes each were cut in the field on 19 December 2011 (E5) at 12:30 on a sunny day. Samples from E9 were taken on 13 February 2008. Information on sowing dates of the field experiments and freezing temperatures during nights preceding field sampling are reported with Table S1 in the Electronic Supplementary Materials.
Immediately after cutting, leaves were kept in the dark in Falcon tubes under the external weather conditions during the sampling time. Successively, Fv/Fm was measured after further dark acclimation at room temperature for at least half an hour (as detailed for the individual experiments). In some experiments, a second measurement was taken after one or more additional hours in the dark to follow reversion in the intrinsic maximal yield of photosystem II.
The freezing treatments were simulated in the dark in a temperature test cabinet (Vötsch VT 3050V, Weiss Technik, Magenta (Milano, Italy) as described in [11]: temperature was gradually reduced (2 °C·h−1) to −3 °C, and plants were kept at this temperature for 16 h. Subsequently, temperature was gradually lowered (2 °C·h−1) to the freezing temperature indicated for each experiment. Plants were kept at this temperature for 16 h. The temperature was then gradually raised to 1 °C at 2 °C·h−1. Plants were kept for 1 h at 1 °C to enable assessment of leaf-tissue damage. Freezing tolerance was quantified by measuring chlorophyll fluorescence using the last fully expanded leaf. Fv/Fm in a dark adapted state (Butler and Kitajima, 1975) was assessed by using a PAM-2000 fluorometer (Walz, Effeltrich, Upper Franconia, Germany). The measuring modulated light for determination of initial F0 was sufficiently low (<0.1 μmol m−2·s−1). Saturating white light of about 10,000 μmol m−2·s−1 was used for determination of Fm. Fv/Fm measurements were performed according to [11] before and immediately after the freezing treatment and after 24 h of subsequent recovery under the same conditions as used for growth prior to the hardening treatment in the growth chamber experiments (20 °C day, 15 °C night). Two methods were employed with leaves in Petri dishes or in Falcon tubes. No differences were found, thus the use of Falcon tubes was preferred because of the required shorter time.
All statistical analyses were performed with R [33]. Paired t-tests and correlation analysis were used to assess differences in means and correlation between FT of different treatments. A Kruskal-Wallis test was applied to test for the effect of haplotypes of vernalization genes on FT and subsequent non-parametric multiple contrast test with Tukey contrasts (R package nparcomp) to test for between group differences. Box and whisker plots were used to visualize distributions of results where the line within the box stands for the median, the box range includes the second and third quartile and the whiskers are located at the maximum and minimum values or at 1.5 times the interquartile range from the box if more extreme values are present.

4. Conclusions

Tests on the applicability of a protocol for combined field sampling and laboratory freezing tests showed that (a) leaves cut from plants in the field and kept in Falcon tubes in the laboratory retained full photosynthetic competence for time periods that exceed the time applied for the complete freezing test and subsequent fluorescence screening after a 24 h recovery period (see Section 2.1.2). Thus, interference from senescence with the vital functions used as indicators of frost damage in cereal leaves is highly unlikely; (b) freezing tests performed on leaves attached to or detached from the plant lead to similar rankings of genotypes subjected to the tests (see Section 2.1.3). We did not find indications that the proposed method introduces a bias in the comparative ranking of FT across time or between genotypes. Homogeneity of the freezing conditions within freezing cabinets and potential effects of changes in microclimatic conditions for leaves enclosed in a Falcon tube, as opposed to leaves exposed to the air currents in the freezing cabinet, lead to differences in the absolute levels of damage to PS II that should be further studied as they are also relevant for tests done with whole plants.
Fields of application of the combined field sampling and laboratory freezing test method are illustrated with several examples concerning (a) monitoring of the seasonal course of hardening for FT obtained under field conditions (see Section 2.2.1) (b) study of FT within experiments that are genuinely performed as field experiments (example FACE study, Section 2.2.2) and (c) use for genotyping studies (see Section 2.2.3) that aim at measuring additional traits in plants that continue to grow after cutting single leaves for the freezing tests or that target other traits determined within a field experiment in parallel.
Measuring Fv/Fm for leaves cut from field grown plants one or several times prior to the freezing stress treatment, immediately after the freezing stress and after recovery, provides information beyond the FT ranking. The first pre-stress measurement monitors the maximal quantum yield of PSII as modulated by the environmental conditions in the field and traces eventual reversible or non-reversible reduction of Fv/Fm. Subsequent pre-stress measurements can be added to monitor the reversability. As the artificial freezing test is applied in darkness, the post-stress measurement characterizes the transition between pre-stress and the fully damaged state when Fv/Fm is generally not yet or only minimally affected by damage [11], which is analogous with observations on chilling effects [27]. The measurement after recovery integrates the factors that lead to irreversible damage. The use of 24 h of recovery under a day/night light regime is sufficient, as results obtained with this measurement were highly correlated with the results of assessments made after 2 days (r > 0.97) and five days (r > 0.86) of recovery [11].
The time requirement for the fluorescence measurements was determined for a total of 4900 measurements done within several experiments. On average, 5.2 measurements were performed within 1 min. The measurements were done by two people, one putting the leaves into the clamp of the PAM2000 instrument and one controlling the measured signals and taking notes that serve to check and amend the output in PAM2000 files. Thus, e.g., for a large set of 200 genotypes replicated 5 times, the total of 1000 measurements to be done for a post-recovery assessment results in a time requirement of 3 h and 12 min per 2 experimenters. If pre-stress and post-stress measurements are taken as well, then the total time requirement is nine and a half hours per person.

Acknowledgments

We thank the three anonymous reviewers for valuable comments on the manuscript. The current research was partially financed by MIPAAF through the AGROSCENARI and FAO-RGV projects and the Duco project by the “Fondazione in rete per la ricerca agroalimentare” within the AGER program. We thank Donata Pagani and Flavio Astesano for their excellent technical support.

Conflict of Interest

The authors declare no conflict of interest.

References

  1. Saulescu, N.N.; Braun, H.J. Cold tolerance. In Application of Physiology in Wheat Breeding; Reynolds, M.P., Ortiz-Monasterio, J.I., McNab, A., Eds.; CIMMYT: Mexico, DF, Mexico City, 2001; pp. 111–123. [Google Scholar]
  2. Levitt, J. Response of Plants to Environmental Stresses: Chilling, Freezing, and High Temperature Stresses, 2nd ed.; Academic Press: New York, NY, USA, 1980. [Google Scholar]
  3. Rizza, F.; Pagani, D.; Gut, M.; Prasil, I.T.; Lago, C.; Tondelli, A.; Orru, L.; Mazzucotelli, E.; Francia, E.; Badeck, F.W.; et al. Diversity in the Response to Low Temperature in Representative Barley Genotypes Cultivated in Europe. Crop Sci. 2011, 51, 2759–2779. [Google Scholar] [CrossRef]
  4. Thomashow, M.F. Plant cold acclimation: Freezing tolerance genes and regulatory mechanisms. Annu. Rev. Plant Physiol. Plant Mol. Biol. 1999, 50, 571–599. [Google Scholar] [CrossRef] [PubMed]
  5. Fowler, D.B.; Limin, A.E. Interactions among factors regulating phenological development and acclimation rate determine low-temperature tolerance in wheat. Ann. Bot. 2004, 94, 717–724. [Google Scholar] [CrossRef] [PubMed]
  6. Francia, E.; Rizza, F.; Cattivelli, L.; Stanca, A.M.; Galiba, G.; Toth, B.; Hayes, P.M.; Skinner, J.S.; Pecchioni, N. Two loci on chromosome 5H determine low-temperature tolerance in a “Nure” (winter) × “Tremois” (spring) barley map. Theor. Appl. Genet. 2004, 108, 670–680. [Google Scholar] [CrossRef] [PubMed]
  7. Akar, T.; Francia, E.; Tondelli, A.; Rizza, F.; Stanca, A.M.; Pecchioni, N. Marker-assisted characterization of frost tolerance in barley (Hordeum vulgare L.). Plant Breed. 2009, 128, 381–386. [Google Scholar] [CrossRef]
  8. Fisk, S.P.; Cuesta-Marcos, A.; Cistue, L.; Russell, J.; Smith, K.P.; Baenziger, S.; Bedo, Z.; Corey, A.; Filichkin, T.; Karsai, I.; et al. FR-H3: A new QTL to assist in the development of fall-sown barley with superior low temperature tolerance. Theor. Appl. Genet. 2013, 126, 335–347. [Google Scholar] [CrossRef] [PubMed] [Green Version]
  9. Clement, J.M.A.M.; van Hasselt, P.R. Chlorophyll fluorescence as a parameter for frost hardiness in winter wheat. A comparison with other hardiness parameters. Phyton 1996, 36, 29–41. [Google Scholar]
  10. Herzog, H.; Olszewski, A. A rapid method for measuring freezing resistance in crop plants. J. Agron. Crop Sci. (Z. Acker Pflanzenbau) 1998, 181, 71–79. [Google Scholar] [CrossRef]
  11. Rizza, F.; Pagani, D.; Stanca, A.M.; Cattivelli, L. Use of chlorophyll fluorescence to evaluate the cold acclimation and freezing tolerance of winter and spring oats. Plant Breed. 2001, 120, 389–396. [Google Scholar] [CrossRef]
  12. Thalhammer, A.; Bryant, G.; Sulpice, R.; Hincha, D.K. Disordered Cold Regulated15 Proteins Protect Chloroplast Membranes during Freezing through Binding and Folding, But Do Not Stabilize Chloroplast Enzymes in Vivo. Plant Physiol. 2014, 166, 190–201. [Google Scholar] [CrossRef] [PubMed]
  13. Mishra, A.; Mishra, K.B.; Höermiller, I.I.; Heyer, A.G.; Nedbal, L. Chlorophyll fluorescence emission as a reporter on cold tolerance in Arabidopsis thaliana accessions. Plant Signal. Behav. 2011, 6, 301–310. [Google Scholar] [CrossRef] [PubMed]
  14. Dai, F.; Zhou, M.; Zhang, G. The change of chlorophyll fluorescence parameters in winter barley during recovery after freezing shock and as affected by cold acclimation and irradiance. Plant Physiol. Biochem. 2007, 45, 915–921. [Google Scholar] [CrossRef] [PubMed]
  15. Steponkus, P.L.; Webb, M.S. Freeze-induced dehydration and membrane destabilisation in plants. In Water and Life; Somero, G.N., Osmond, C.B., Bolis, C.L., Eds.; Springer: Berlin, Germany, 1992; pp. 338–362. [Google Scholar]
  16. Rapacz, M.; Tyrka, M.; Kaczmarek, W.; Gut, M.; Wolanin, B.; Mikulski, W. Photosynthetic acclimation to cold as a potential physiological marker of winter barley freezing tolerance assessed under variable winter environment. J. Agron. Crop Sci. 2008, 194, 61–71. [Google Scholar] [CrossRef]
  17. Prášil, I.T.; Prášilová, P.; Marík, P. Comparative study of direct and indirect evaluations of frost tolerance in barley. Field Crops Res. 2007, 102, 1–8. [Google Scholar] [CrossRef]
  18. Prášil, I.T.; Rogalewicz, V. Accuracy of wheat winterhardiness evaluation by a provocation method in natural conditions. Genetika Šlechtení (Genet. Plant Breed. Praha) 1989, 25, 223–230. [Google Scholar]
  19. Koch, H.-D.; Lehmann, C.O. Resistenzeigenschaften im Gersten- und Weizensortiment Gatersleben. 7. Prüfung der Frostresistenz von Wintergersten im künstlichen Gefrierversuch. Kulturpflanze 1966, 14, 263–282. [Google Scholar] [CrossRef]
  20. Rapacz, M. Chlorophyll a fluorescence transient during freezing and recovery in winter wheat. Photosynthetica 2007, 45, 409–418. [Google Scholar] [CrossRef]
  21. Rapacz, M.; Wozniczka, A. A selection tool for freezing tolerance in common wheat using the fast chlorophyll a fluorescence transient. Plant Breed. 2009, 128, 227–234. [Google Scholar] [CrossRef]
  22. Witkowski, E.; Waga, J.; Witkowska, K.; Rapacz, M.; Gut, M.; Bielawska, A.; Luber, H.; Lukaszewski, A.J. Association between frost tolerance and the alleles of high molecular weight glutenin subunits present in Polish winter wheats. Euphytica 2008, 159, 377–384. [Google Scholar] [CrossRef]
  23. Willits, D.H.; Peet, M.M. Measurement of chlorophyll fluorescence as a heat stress indicator in tomato: Laboratory and greenhouse comparisons. J. Am. Soc. Hortic. Sci. 2001, 126, 188–194. [Google Scholar]
  24. Wu, T.T.; Weaver, D.B.; Locy, R.D.; McElroy, S.; van Santen, E. Identification of vegetative heat-tolerant upland cotton (Gossypium hirsutum L.) germplasm utilizing chlorophyll fluorescence measurement during heat stress. Plant Breed. 2013, 133, 250–255. [Google Scholar] [CrossRef]
  25. Sharma, D.K.; Fernández, J.O.; Rosenqvist, E.; Ottosen, C.O.; Andersen, S.B. Genotypic response of detached leaves vs. intact plants for chlorophyll fluorescence parameters under high temperature stress in wheat. J. Plant Physiol. 2014, 171, 576–586. [Google Scholar] [CrossRef] [PubMed]
  26. Sthapit, B.R.; Witcombe, J.R.; Wilson, J.M. Methods of selection for chilling tolerance in Nepalese rice by chlorophyll fluorescence analysis. Crop Sci. 1995, 35, 90–94. [Google Scholar] [CrossRef]
  27. Strauss, A.J.; Krüger, G.H.J.; Strasser, R.J.; Heerden, P.D.R.V. Ranking of dark chilling tolerance in soybean genotypes probed by the chlorophyll a fluorescence transient O-J-I-P. Environ. Exp. Bot. 2006, 56, 147–157. [Google Scholar] [CrossRef]
  28. Housley, T.L.; Pollock, C.J. Photosynthesis and Carbohydrate-Metabolism in Detached Leaves of Lolium-Temulentum L. New Phytol. 1985, 99, 499–507. [Google Scholar] [CrossRef]
  29. Fischer, A.M. The Complex Regulation of Senescence. Crit. Rev. Plant Sci. 2012, 31, 124–147. [Google Scholar] [CrossRef]
  30. Min, K.; Chen, K.; Arora, R. Effect of short-term vs. prolonged freezing on freeze-thaw injury and post-thaw recovery in spinach: Importance in laboratory freeze-thaw protocols. Environ. Exp. Bot. 2014, 106, 124–131. [Google Scholar] [CrossRef]
  31. Mahfoozi, S.; Limin, A.E.; Fowler, D.B. Influence of vernalization and photoperiod responses on cold hardiness in winter cereals. Crop Sci. 2001, 41, 1006–1011. [Google Scholar] [CrossRef]
  32. Badeck, F.-W.; Rizza, F.; Maré, C.; Cattivelli, L.; Zaldei, A.; Miglietta, F. Durum wheat growth under elevated CO2: First results of a FACE experiment. In Atti del XV Convegno Nazionale di Agrometeorologia. Nuovi Scenari Agro Ambientali: Fenologia, Produzioni Agrarie ed Avversita. Palermo, 5-6-7 Giugno 2012; Ventura, F., Pieri, L., Eds.; PA.TRON EDITORE: Bologna, Italy, 2012; pp. 15–16. [Google Scholar]
  33. R Core Team. R: A Language and Environment for Statistical Computing. Vienna: R Foundation for Statistical Computing. 2014. Available online: http://www.R-project.org/ (accessed on 21 November 2014).

