Article

Influence of Irrigation Scheduling Using Thermometry on Peach Tree Water Status and Yield under Different Irrigation Systems

1
USDA-ARS Water Management Research Unit, San Joaquin Valley Agricultural Sciences Center, 9611 S. Riverbend Ave., Parlier, CA 93648, USA
2
Curent Affiliation: USDA-ARS Water Management and System Research Unit, 2150 Centre Avenue, Building D, Suite 320, Fort Collins, CO 80526, USA
*
Author to whom correspondence should be addressed.
Agronomy 2017, 7(1), 12; https://doi.org/10.3390/agronomy7010012
Submission received: 3 December 2016 / Revised: 20 January 2017 / Accepted: 24 January 2017 / Published: 9 February 2017

Abstract

:
Remotely-sensed canopy temperature from infrared thermometer (IRT) sensors has long been shown to be effective for detecting plant water stress. A field study was conducted to investigate peach tree responses to deficit irrigation which was controlled using canopy to air temperature difference (ΔT) during the postharvest period at the USDA-ARS (U.S. Department of Agriculture, Agricultural Research Service) San Joaquin Valley Agricultural Sciences Center in Parlier, California, USA. The experimental site consisted of a 1.6 ha early maturing peach tree orchard. A total of 18 IRT sensors were used to control six irrigation treatments including furrow, micro-spray, and surface drip irrigation systems with and without postharvest deficit irrigation. During the postharvest period in the 2012–2013 and 2013–2014 growing seasons, ΔT threshold values at mid-day was tested to trigger irrigation in three irrigation systems. The results showed that mid-day stem water potentials (ψ) for well irrigated trees were maintained at a range of −0.5 to −1.2 MPa while ψ of deficit irrigated trees dropped to lower values. Soil water content in deficit surface drip irrigation treatment was higher compared to deficit furrow and micro-spray irrigation treatments in 2012. The number of fruits and fruit weight from peach trees under postharvest deficit irrigation treatment were less than those well-watered trees; however, no statistically significant (at the p < 0.05 level) reduction in fruit size or quality was found for trees irrigated by surface drip and micro-spray irrigation systems by deficit irrigation. Beside doubles, we found an increased number of fruits with deep sutures and dimples which may be a long-term (seven-year postharvest regulated deficit irrigation) impact of deficit irrigation on this peach tree variety. Overall, deployment of IRT sensors provided real-time measurement of canopy water status and the information is valuable for making irrigation management decisions.

1. Introduction

The United States is the third largest peach producer in the world. The total peach production was estimated at 847 thousand tons in 2015 [1]. California was shown to be the largest producer on a state level, accounting for about 70% of the U.S. total in the same year. However, due to the continuous drought situation and warm winter temperatures in California in recent years, water supplies for agricultural irrigation have declined. Water shortages require farmers and producers to improve water management and utilize limited irrigation water effectively to meet crop demands.
Regulated deficit irrigation (RDI) has been applied to peach trees, as an irrigation management strategy, for saving water [2,3,4,5]. RDI during the second stage of fruit development and postharvest stages on late maturing peach trees in deep soils could save 23%–35% of irrigation water [6]. Compared with late maturing peach trees, early maturing varieties of peaches usually ripen and harvest in late May or early June and have their highest water demand during the postharvest summer months. For early maturing varieties of peaches, RDI can be applied during postharvest non-fruit bearing periods [7]. A four-year project with different levels of postharvest irrigation on an early season peach in California showed no reduction in yield and fruit size or a progressive decline in tree vigor and health [8]. Falagán et al. [9] also confirmed that RDI on early maturing peaches allowed saving a significant amount of water and provided peaches with overall good quality and vitamin C status. In addition, Bryla et al. [10] has studied furrow, micro-spray, surface and subsurface drip irrigation systems with different irrigation frequencies for early maturing peaches. Surface and subsurface drip irrigation systems had higher irrigation efficiency and produced higher growth and production. A study in the same orchard indicated RDI with furrow and drip irrigation during postharvest period can substantially save water without significantly impacting the yield [11]. Johnson and Phene [12] suggested RDI should be applied in June and July only during postharvest season to reduce double fruits, which had been considered to be a potential negative effect of RDI for peaches.
Traditionally irrigation can be scheduled with measurements of soil water content or water potential, stem or leaf water potential, direct or indirect estimate of evapotranspiration, or the check book type of methods. Irrigation scheduling with different plant- and climate-based water stress indicators has been reported on both late and early-maturing varieties of peaches, such as stem water potential [13], water supply index [14], and trunk diameter [15]. The downsides of these techniques are the need of intensive labor and additional irrigation equipment. Canopy temperature is a direct response to plant water status [16] and has the advantage of less laborious or more timely response than other traditional techniques. It also has the potential for upscaling by using remote sensing such as drones, airplanes, or satellite-borne thermal sensors for making the temperature measurement. With the advance of infrared thermometer technology in the late 70s, continuous measurement of canopy temperature by IRTs has been previously used for monitoring crop water status and controlling irrigation for a variety of crops and in different parts of the world for annual crops [17,18]. Clawson and Blad [19] used canopy temperature variability and average canopy temperature above that of a well-watered reference plot to schedule irrigation in corn (Zea mays L.). Wanjura and Upchurch [20] developed a temperature time-threshold model and demonstrated applications in irrigation scheduling in cotton. Infrared thermometry and thermal imaging have also been used on various fruit trees to measure canopy temperature. Glenn et al. [21] examined infrared measurement techniques for evaluating the canopy temperature in peaches. Sepulcre-Cantόet al. [22] investigated the detection of water stress in an olive (Olea European L.) orchard with airborne remote sensing imagery for individual trees and found a high correlation between leaf water potential and crown canopy to air temperature differences obtained from the imagery. Most of the peaches in California are irrigated by micro-spray and furrow surface irrigation systems. Surface drip and subsurface drip system have the advantage of reducing evaporation and better control of deep percolation. With less irrigation amount and high efficiency, drip irrigation has been adopted by farmers. There is a need to determine the performance of a canopy temperature based irrigation scheduling technique on peaches under different irrigation types.
The objectives of this study were to: (1) determine the effectiveness of the canopy-to-air temperature difference method to trigger irrigations for early maturing peach trees under different irrigation systems in an arid climate; and (2) to evaluate the peach tree response to deficit irrigation treatments.

2. Materials and Methods

2.1. Study Site and Irrigation System Descriptions

The study was conducted over a period of two growing seasons (2012–2013 and 2013–2014) in a 1.6 ha peach orchard at the USDA-ARS (U.S. Department of Agriculture, Agricultural Research Service) San Joaquin Valley Agricultural Sciences Center near Parlier, CA (36°37′ N; 119°31′ W). The soil is Hanford fine sandy loam characterized as coarse-loamy, mixed, thermic Typic Xerorthents, and low organic matter content (1.38% for 0–20 cm, and 0.24% for 20–100 cm soil depth). The averaged bulk density was 1.55 g·cm3.
The early maturing peach trees (Crimson Lady) were planted in 1999 at a spacing of 1.8 m × 4.9 m (6 feet by 16 feet) and were trained to a perpendicular-V shape. This peach variety blooms in February– March, were commercially thinned each spring, and were harvested at the end of May or early June every year. Tree canopy was pruned annually in the winter by commercial contractors. For the 2012–2013 growing season, deficit irrigation was applied during the postharvest period in 2012 and fruit yield was evaluated in late May or early June after harvest in 2013. Similarly for the 2013–2014 season, deficit irrigation occurred in 2013 after harvest and fruit yield and quality were determined in 2014.
The experimental design was a randomized block with furrow, micro-spray and surface drip irrigation treatments as the main effect and levels of postharvest deficit irrigation as the sub-effect with six replications. Each treatment plot consisted of three rows of eight trees. Three trees from the center of the middle rows were used for plant IRT measurements while the rest served as guard trees. Furrow treatments were irrigated in 1 m wide, 0.2 m deep, and 9.8 m long V-shaped furrows on both sides of the tree row, running parallel to the row, and located 1 m (furrow center) from the tree trunks. Drip treatments were irrigated with drip tubing containing 0.002 m3·h−1 (1/2 gph) integral turbulent flow embedded emitters spaced 0.91 m (3 feet) apart (GeoFlow, Charlotte, NC, USA). Two tubing laterals were used for each tree row, one on each side at a distance of 1 m from the tree trunks. Micro-spray treatments were applied with one 40 L/h Fan-jet emitter with a 4 m diameter, 230° spray pattern (Bowsmith, Inc., Exeter, CA, USA), and located near the base of each tree. Irrigation amount was measured using turbine water meters (Model SRII and W-120 Invensys Metering Systems, Uniontown, PA, USA). Detailed descriptions of the orchard, soil, and irrigation systems can be found in [10,23].

2.2. Irrigation Treatments and Irrigation Control

Johnson et al. [24] developed a daily crop coefficient (kc) curve using a weighing lysimeter located in a nearby peach orchard with the same variety, planting density, and training system as trees used in this current study. Crop evapotranspiration requirements (ETc) were estimated using this kc and current reference evapotranspiration (ETo) obtained from a nearby weather station (California Irrigation Management Information Systems or CIMIS, California Department of Water Resources, Sacramento, CA, USA).
All trees received uniform irrigation matching the full ETc requirement during early growing season in spring. The last full orchard irrigation was applied on 30 May 2012 and 31 May 2013. After that, the experimental treatments during the postharvest irrigation scheduling period were designated as:
FF—Full irrigation treatment by furrow irrigation system, where trees were targeted to irrigate with enough water to replace 100% of ETc,
FD—Deficit irrigation treatment by furrow irrigation system, where trees were targeted to irrigate with the same amount of water per irrigation event as in FF but with less frequency,
MF—Full irrigation treatment by micro-spray irrigation system, where trees were targeted to irrigate with enough water to replace 100% ETc,
MD—Deficit irrigation treatment by micro-spray irrigation system, where trees were targeted to irrigate with enough water to replace 25% ETc,
SF—Full irrigation treatment by surface drip irrigation system, where trees were targeted to irrigate with enough water to replace 100% ETc,
SD—Deficit irrigation treatment by surface drip irrigation system, where trees were targeted to irrigate with enough water to replace 25% ETc.
To measure real-time tree canopy temperatures, eighteen IRT sensors (Model SI-100 series, Apogee Instruments, Inc., Logan, UT, USA) were installed in the field on 23–25 April 2012 by mounting them on galvanized metal pipes 5.5 m above the soil surface. The field of view (FOV) of the IRT sensor was 36° with the accuracy at ±0.5°. The IRT sensors were calibrated by the manufacturer before installation. The sensors were used to measure canopy temperature for the irrigation treatments FF, FD, SF, SD, MF, and MD, for three of the six replications used in the study. The metal pipes were installed on the north side of the middle tree of the center row in each plot. The sensors were mounted on the pipes and pointed southward at approximately 30° from nadir with the center of the FOV aimed at the middle trees of the center row. Canopy temperature was measured at 1 Hz and an average value was recorded at 15-min intervals using a CR3000 datalogger (Campbell Scientific Inc., Logan, UT, USA). An MD9 multi-drop networksystem (Campbell Scientific, Inc., Logan, UT, USA) was used to connect the six sensors in each rep through a coax cable and the data were retrieved at a central station located outside the orchards. Air temperature was measured with a thermistor as part of an air temperature and relative humidity sensor (Vaisala HMP 45C, Campbell Scientific, Inc., Logan, UT, USA) located in the orchard at the top of canopy level. Detailed descriptions regarding the IRT sensor set up and irrigation scheduling management can be found in [11,25].
All irrigation events during the postharvest stages were triggered by the threshold values of canopy temperature to air temperature difference (ΔT) at 14:00 PDT (Pacific Daylight Time) that were determined based on the results in previous studies [11,25]. Wang and Gartung [11] found a linear correlation between mid-day ΔT and stem water potential (SWP) (ΔT = −5.3709 × SWP − 5.3289), using two-year data in this orchard. Although the emprical linear relationship is site-specific and plant specific, it may be robust enough to be used as a guide for irrigation. From their study, the highest SWP value for full irrigation treatment was about −0.7 MPa during the postharvest season. Therefore, if the goal is to maintain the peach orchard without water stress, instead of measuring SWP, it might be possible to use the ΔT value of −1.5 °C for full irrigation treatment. To maintain a deficit irrigation, we could use a ΔT value of 2.5 °C while SWP is less than −1.5 MPa. Thus, in this study the threshold values of ΔT for FF and FD plots were tested at −1.5 °C and 2.5 °C, respectively. A decision was made daily on whether to irrigate based on if the specific threshold of the treatment was exceeded. Due to the limitation of the capacity of furrow irrigation system, irrigation decisions were made only starting seven days after an irrigation event until a decision to irrigate was made. During each irrigation event, 75 mm water was applied and completed in three days. In the previous studies, ΔT performance had not been investigated for the micro-spray treatment plots. We determined a threshold value for it based on the findings in furrow and surface drip treatment plots. The threshold value of ΔT for MF plots was tested at −0.5 °C initially and changed to −2.5 °C in August 2012. An irrigation decision was made daily beginning five days after an irrigation event until a decision to irrigate was made when the specific threshold of the treatment was exceeded. During each irrigation event, 55 mm water of was applied and completed in two days. MD plots were irrigated at the same time with 14 mm of water. The threshold value of ΔT for SF plots was tested at −1.5 °C. A three-day irrigation cycle was used. An amount of 25 mm and 6.25 mm irrigation water was applied in SF and SD plots, respectively. When an irrigation event was triggered, the plots were irrigated immediately. The irrigation scheduling to control targeted full and deficit irrigation treatments started on 7 June 2012 (Day-of-year, DOY159) and 7 June 2013 (DOY158) to the end of August in each year.

2.3. Stem Water Potential

Stem water potential (ψ) was measured approximately weekly in all treatment plots after harvest at the end of May and continued for the rest of the year for 2012–2013 and 2013–2014 growing season. Stem water potential was measured using a pressure chamber (Model 3000–1412, Soil Moisture Equipment Corp., Santa Barbara, CA, USA) between 12:00–14:00 PDT following the procedures described in [10]. Six measurements per plot were taken from the middle three trees (two leaves per tree) of the center row. Total hermetic aluminum foil bags were placed on each leaf at least 2 h before taking stem water potential measurements.

2.4. Soil Water Content

Soil water content for the root zone profile was monitored weekly at 15, 45, 75, 105, and 135 cm depths using a neutron probe (Series 4300, Troxler International, LTD., Research Triangle Park, NC, USA) with galvanized steel access tubes located at the middle of the center row within each treatment plot. The neutron probe was calibrated with volumatric soil samples taken from 15–135 cm depths in the study field in 2012 (N = 30, R2 = 0.98).

2.5. Fruit Yield

Peach fruit yield was measured and fruit quality was assessed for both the 2012–2013 and 2013–2014 seasons. Marketable-sized fruits were picked by a commercial harvesting crew (Sunny Cal, Reedley, CA, USA) following typical farming procedures. A total of two picks, about three days apart, were used during each season. For the experimental plots, the total number of peaches per tree and weight per tree were measured for each treatment plot. Fruit quality was assessed by randomly selecting 120 peaches per plot and counting the number of peaches with doubles, deep sutures, external splits, dimples, deformation, or internal split pits. Ten fruit per plot were also assessed for skin color, flesh firmness, soluble solids, pH, and titratable acidity after one or two weeks of storage at 1 °C. Fruit skin color was measured by a handheld Chroma Meter (CR-400, Konica Minolta, Japan). A slice of skin of each fruit was removed and flesh firmness was measured by a penetrometer and recorded as pounds force and then converted to Newtons (N). Two pieces of each fruit were removed, and juiced using a juice processer to form a composite juice sample for each treatment. A few drops of peach juice were tested for soluble solids concentration with a handheld Brix refractometer (Atago Inc., Bellevue, WA, USA). Titratable acidity (%) and pH values were measured by titrating a 5-g sample of juice diluted with 50 mL of deionized water using 0.1 N NaOH to an endpoint of 8.6 pH using TIM 850 Titration Radiometer analytical workstation (Radiometer Analytical SAS, Lyon, France).

2.6. Statistical Analysis

Production data was analyzed by analysis of variance (ANOVA) test using JMP (SAS Institute, Cary, NC, USA). Means were separated at the 0.05 level using Tukey’s HSD (honest significant difference) test.

3. Results

3.1. Climatology

Because of the Mediterranean climate and drought conditions, precipitation was near zero during the 2012 and 2013 summer growing seasons at Parlier, California, which is about the same amount received for the past 10 years during this same period. The maximum air temperatures in June and July of 2013 were higher than temperatures observed in respective months in 2012, and mean wind speed was higher in 2012 than 2013. Average daily ET0 values were similar between 2013 and 2012 (Table 1).

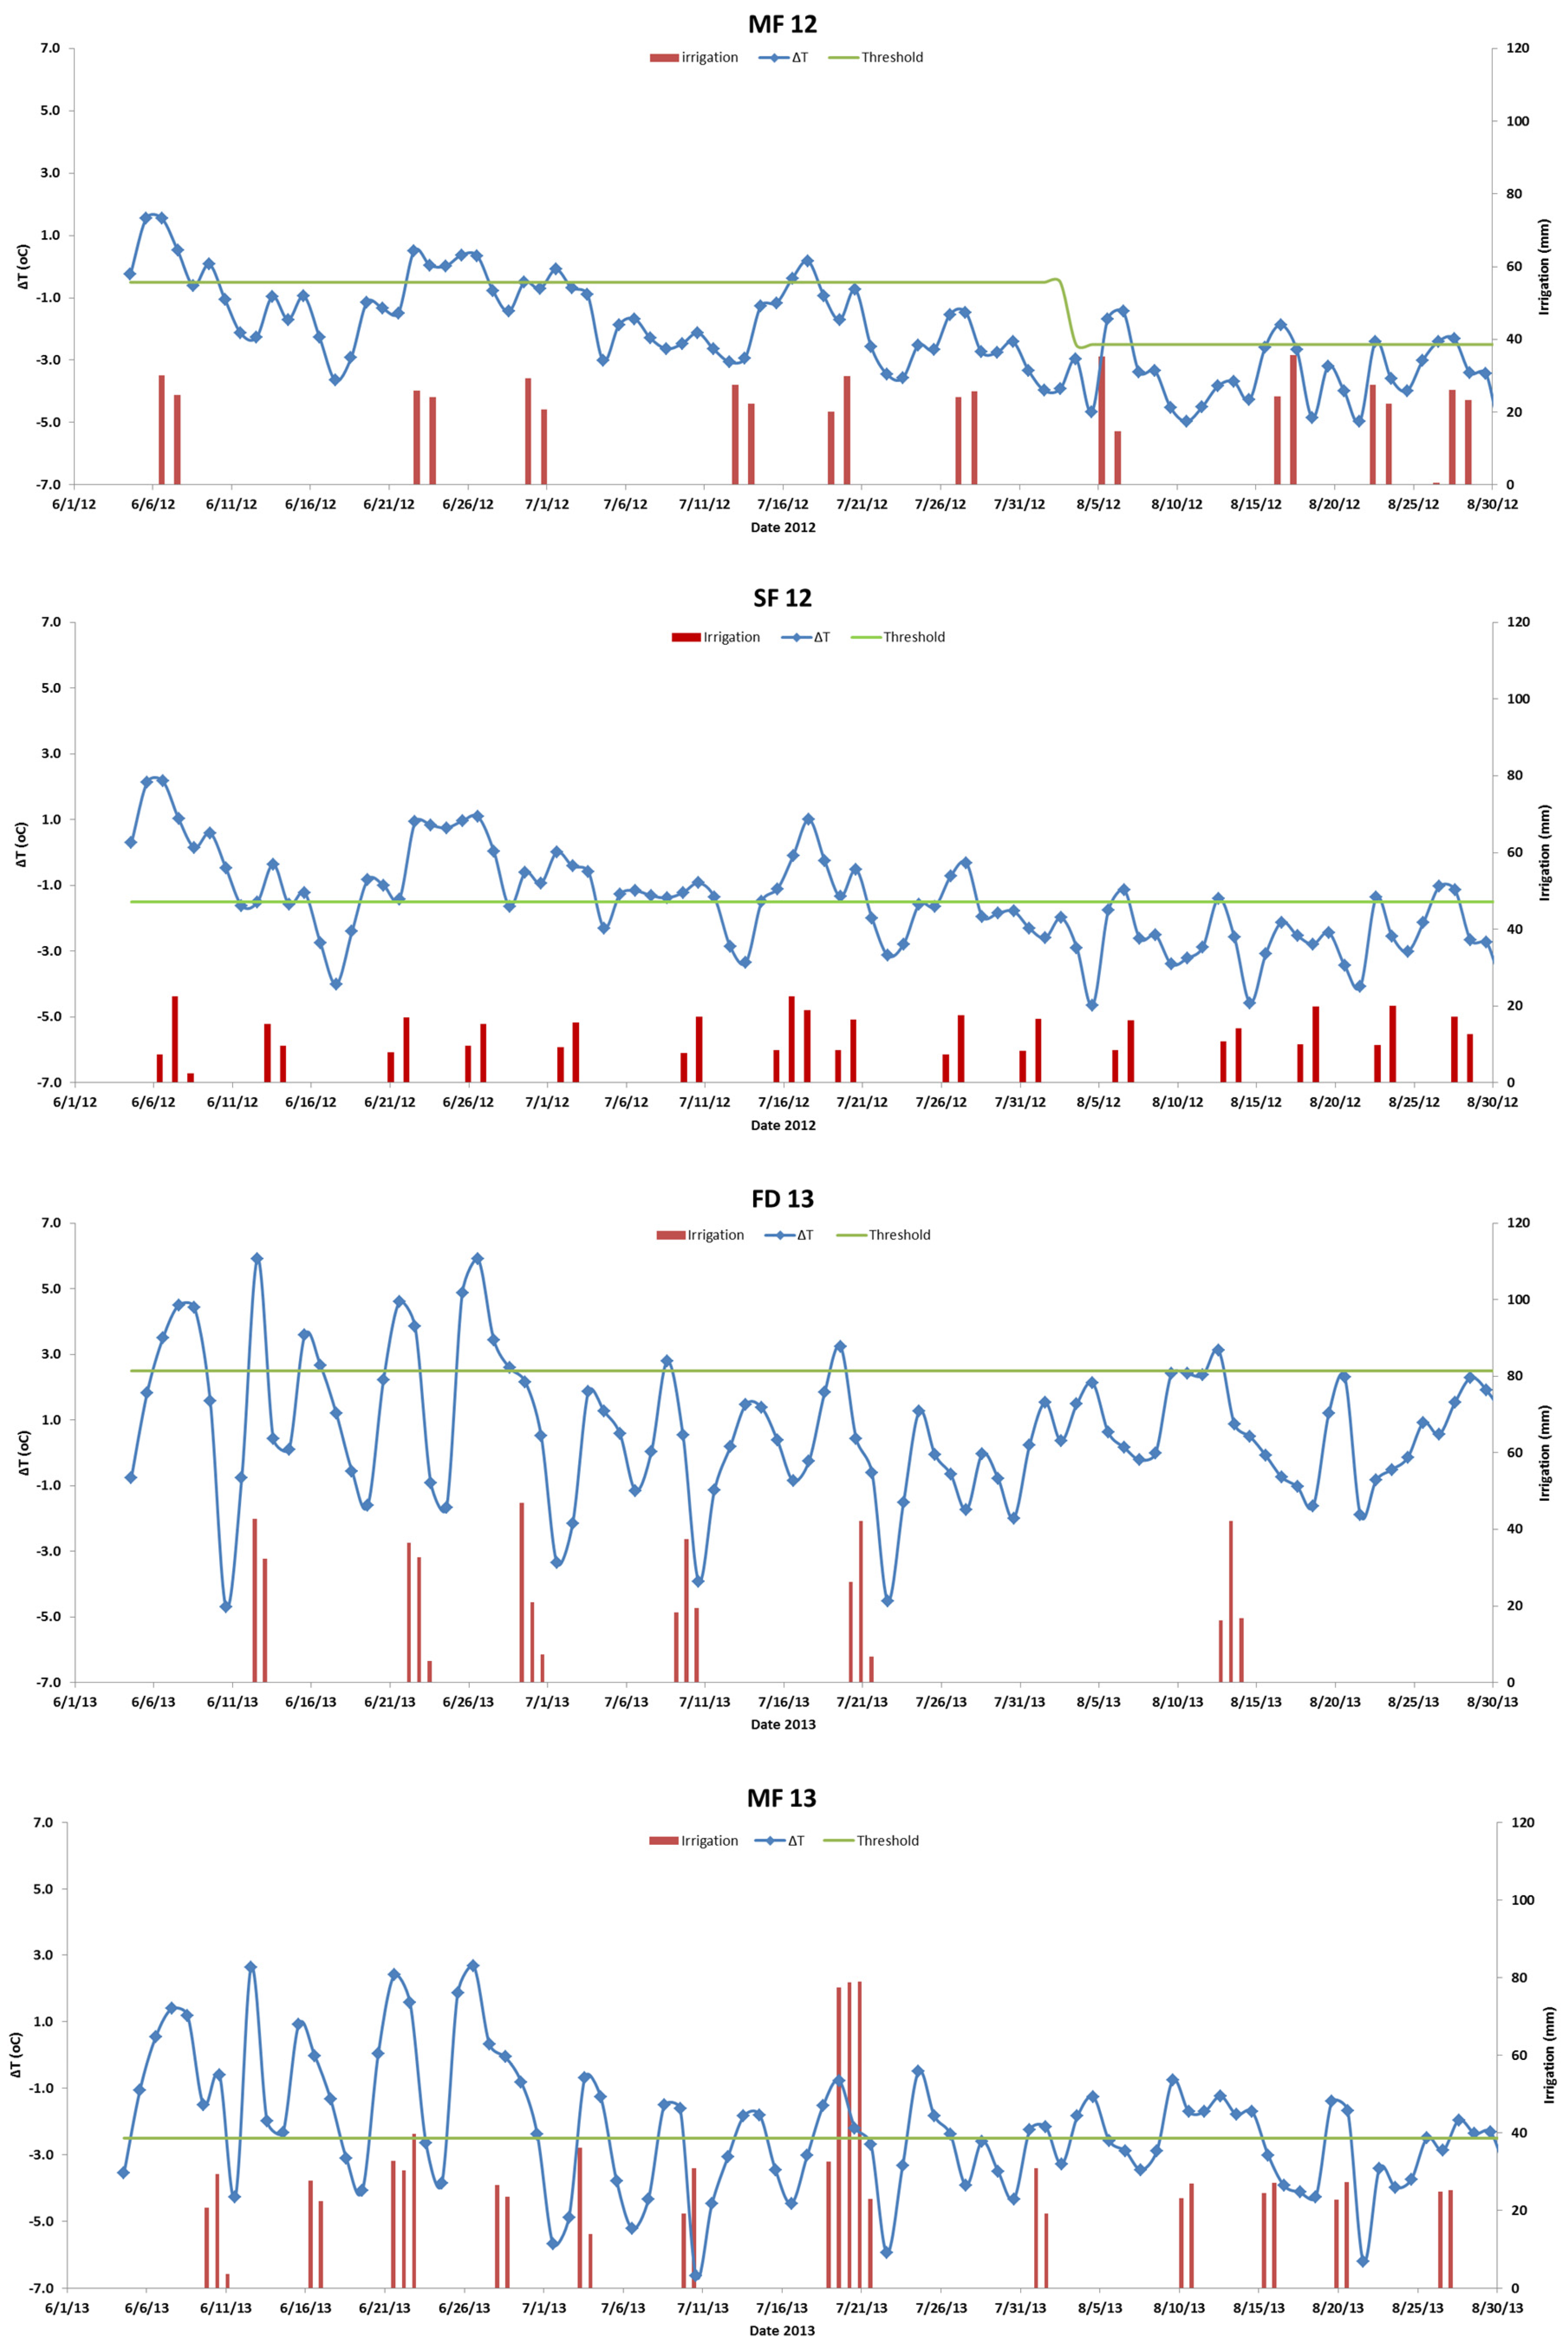
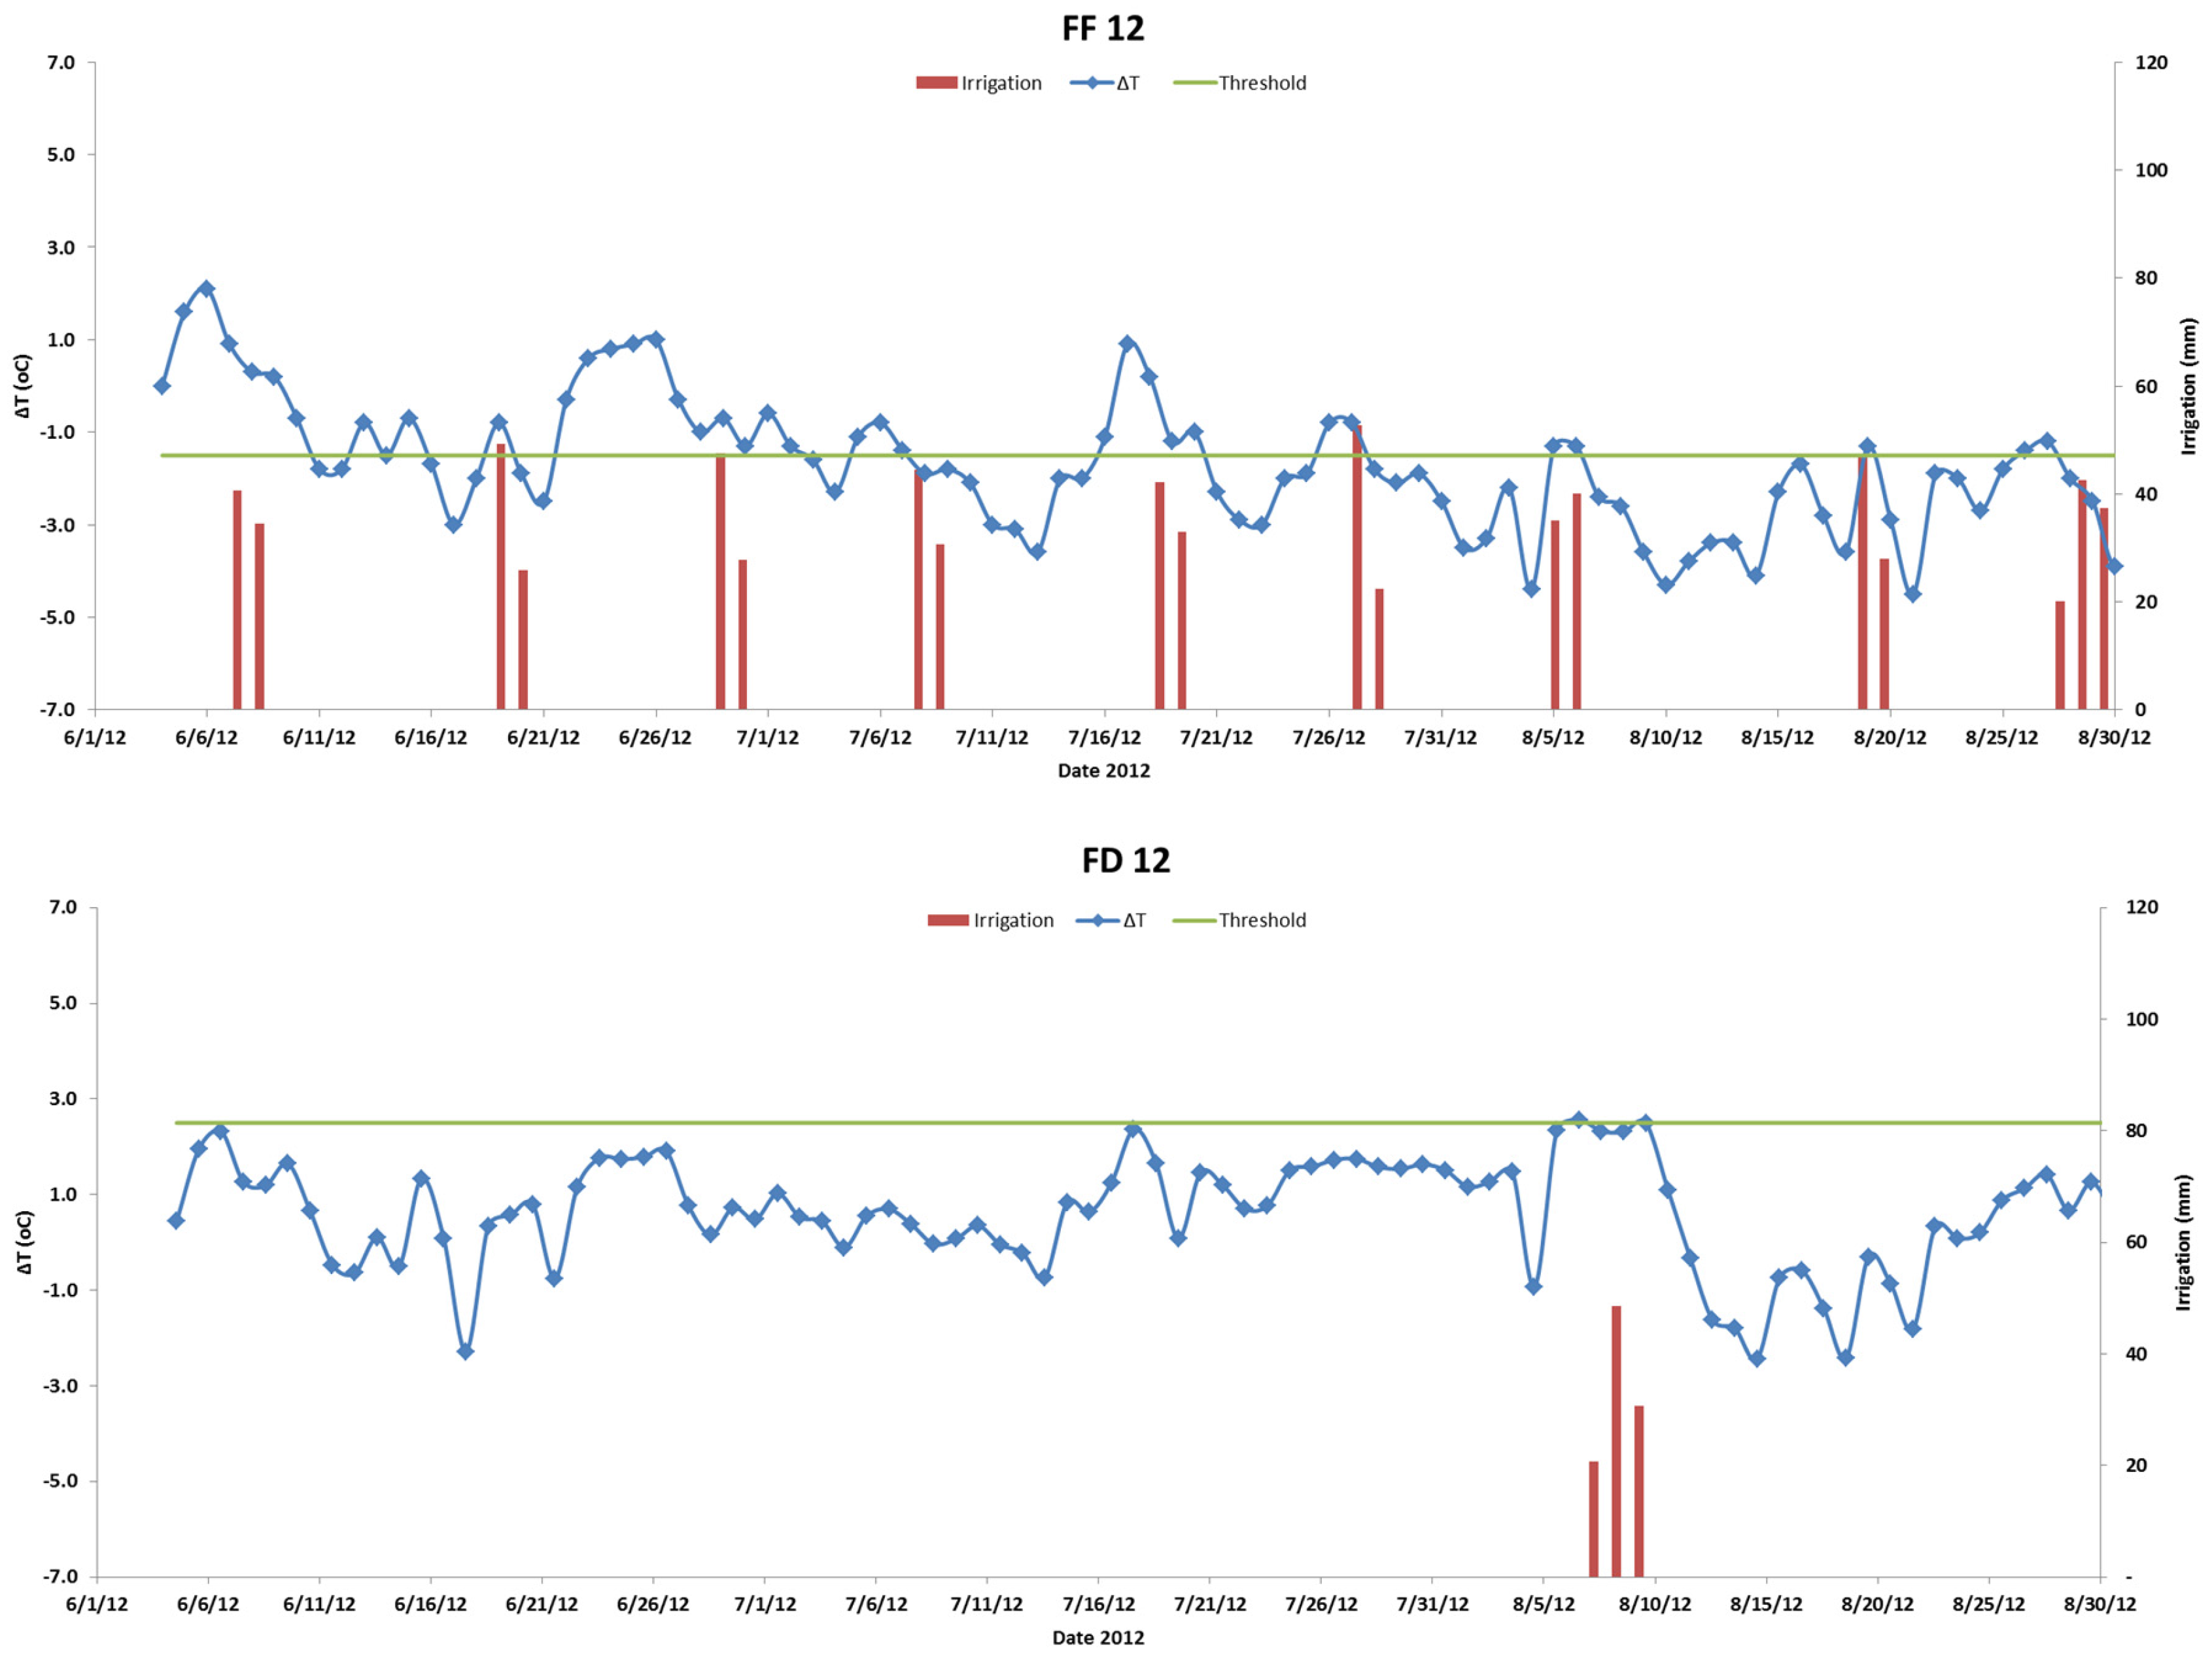
3.2. Irrigation Controlling by ΔT

Figure 1 shows the dynamic of ΔT values and irrigation events triggered by ΔT in treatment FF, MF, SF, and FD in 2012 and FD and MF in 2013 as examples of irrigation scheduling by thermometry on tree canopy. Deficit irrigations started right after harvest at the end of May in 2012. In general, most of the irrigation events were triggered by ΔT values. For example, treatment FF was furrow irrigated when ΔT exceeded the threshold value on 18 July 2012; consequently, ΔT dropped and fell below the threshold value. Seven days after the irrigation, ΔT value exceeded the threshold value on 27 July 2012 and triggered another irrigation event. The threshold value for treatment MF was determined initially based on the previous results on furrow and surface drip systems. The results showed only a few ΔT values were greater than the threshold value, so it hardly triggered an irrigation event for this full irrigation treatment. Since the irrigation frequency was low, it did not meet the 100% of ET requirement. We changed the threshold value to −2.5 °C at the beginning of August. From then on, more irrigation signals were received. The threshold value in treatment SF triggered more irrigation events than those in FF and MF. There were delayed irrigation or missed irrigation events, although irrigation signals were received in those days (i.e., 1 July (DOY183) and 7 July (DOY 190)). Two irrigation decisions were also not based on ΔT signals. Only one irrigation event was triggered by the ΔT signal during the period for treatment FD. In general, ΔT values ranged from −5 to 3 °C for all full irrigation treatments. The maximum ΔT value of 5.9 °C was found in FD in 2013, while the minimum ΔT value was −6.6 °C in MF in 2013. Due to the system failure, MF and MD plots were over-irrigated on 19–21 July 2013.

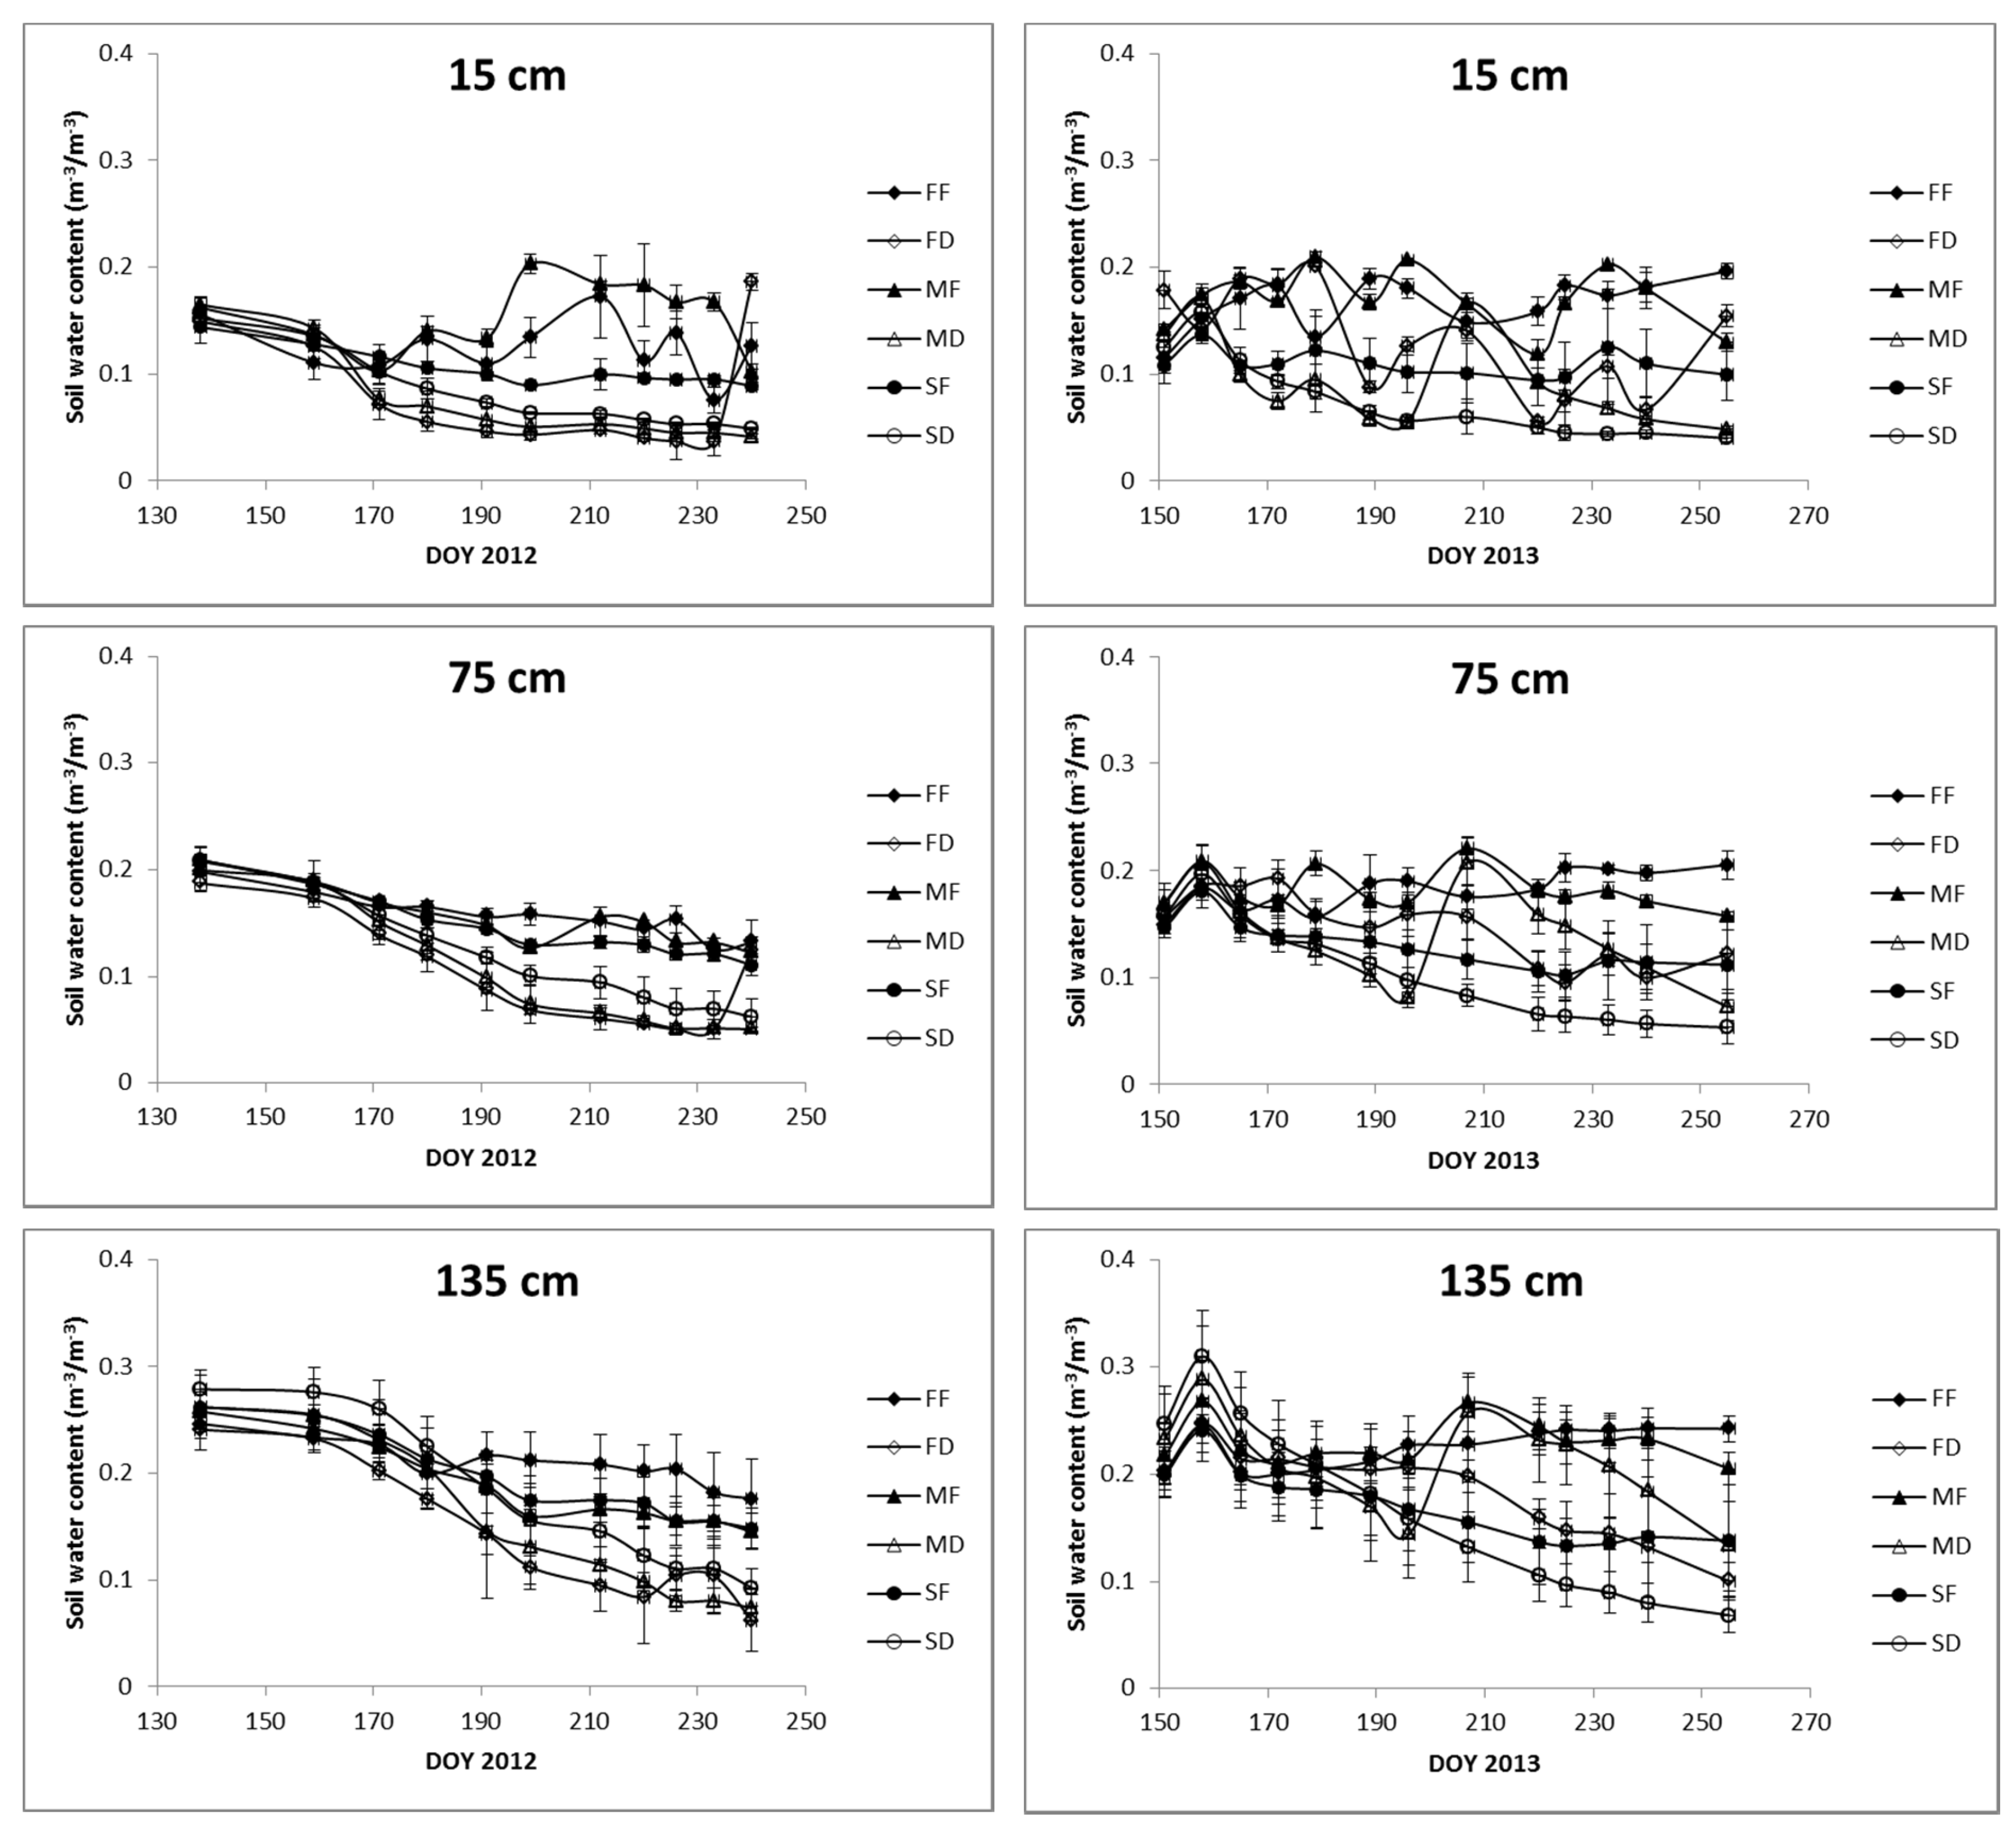
3.3. Soil Water and Irrigations

The soil water content for all the plots at the beginning of irrigation scheduling period (7 June~27 August 2012; DOY 159-240) was similar and not statistically different. The mean values were 0.16, 0.20 and 0.27 m3·m−3 at the 15 cm, 75 cm and 135 cm soil depths, respectively. Over the postharvest period, the soil water profile showed a decreasing trend (Figure 2) but remained above 0.12 m3·m−3 at the 75 cm depth and above 0.15 m3·m−3 at the 135 cm depth in three full irrigation treatments. The soil water profile in the deficit plots dropped to as low as 0.05 m3·m−3 at the end of this period at both 75 cm and 135 cm depths. We also found that for all three soil depths, the deficit irrigation treatment SD had higher soil water content than MD and FD although the irrigation amount was similar. Soil water content responded more to irrigation signals in furrow and micro-spray than for drip irrigation at the surface depth (15 cm). Also the high water content readings on 27 August 2012 (DOY 240) in the FD plots at 15 and 75 cm depths were caused by the residual effect of the large irrigation event on 10 August 2012 (DOY 233).
On 31 May in 2013 (DOY151), the initial soil water content was not significantly different in all depths among treatments. Differential irrigation treatments in 2012 did not result in soil water variability amongst treatments since we fully irrigated all the plots from early season to harvest. Over the irrigation scheduling period, 31 May~1 September 2013 (DOY 151–244), deficit irrigation treatments (FD, MD) received 54% and 59% of the irrigation amount in the full irrigation treatment FF and MF, respectively, and SD received 34% of the irrigation amount in SF (Table 2). The soil profiles in full irrigation treatments remained above 0.15 m3·m−3 at the 75 cm depth and 0.20 m3·m−3 at the 135 cm depth except for SF. We observed that soil water content in MD increased suddenly on 26 July 2013 (DOY 207) due to the over irrigation (Figure 2) on 19–21 July 2013 (DOY 200-202).
The ETc in June–August 2012 were similar to the values in 2013 (Table 1); however, the irrigation amount in 2013 was increased compared to 2012 (Table 2). For other treatments, the major difference of irrigation amount between two years happened in June. For example, irrigation signals were triggered twice in June 2012, but four times in June 2013 for MF. There was no irrigation in June 2012 for FD, but irrigation was triggered twice in June 2013 (Figure 2). Treatment FF received more irrigation in July and August, 2013 than for the comparable months in 2012. Although irrigation amount was higher in 2013 than 2012, the soil profiles in both SF and SD dropped lower in 2013 compared with the values in 2012. The irrigation amount in SF in both years and MF in 2012 did not meet full crop ETc.

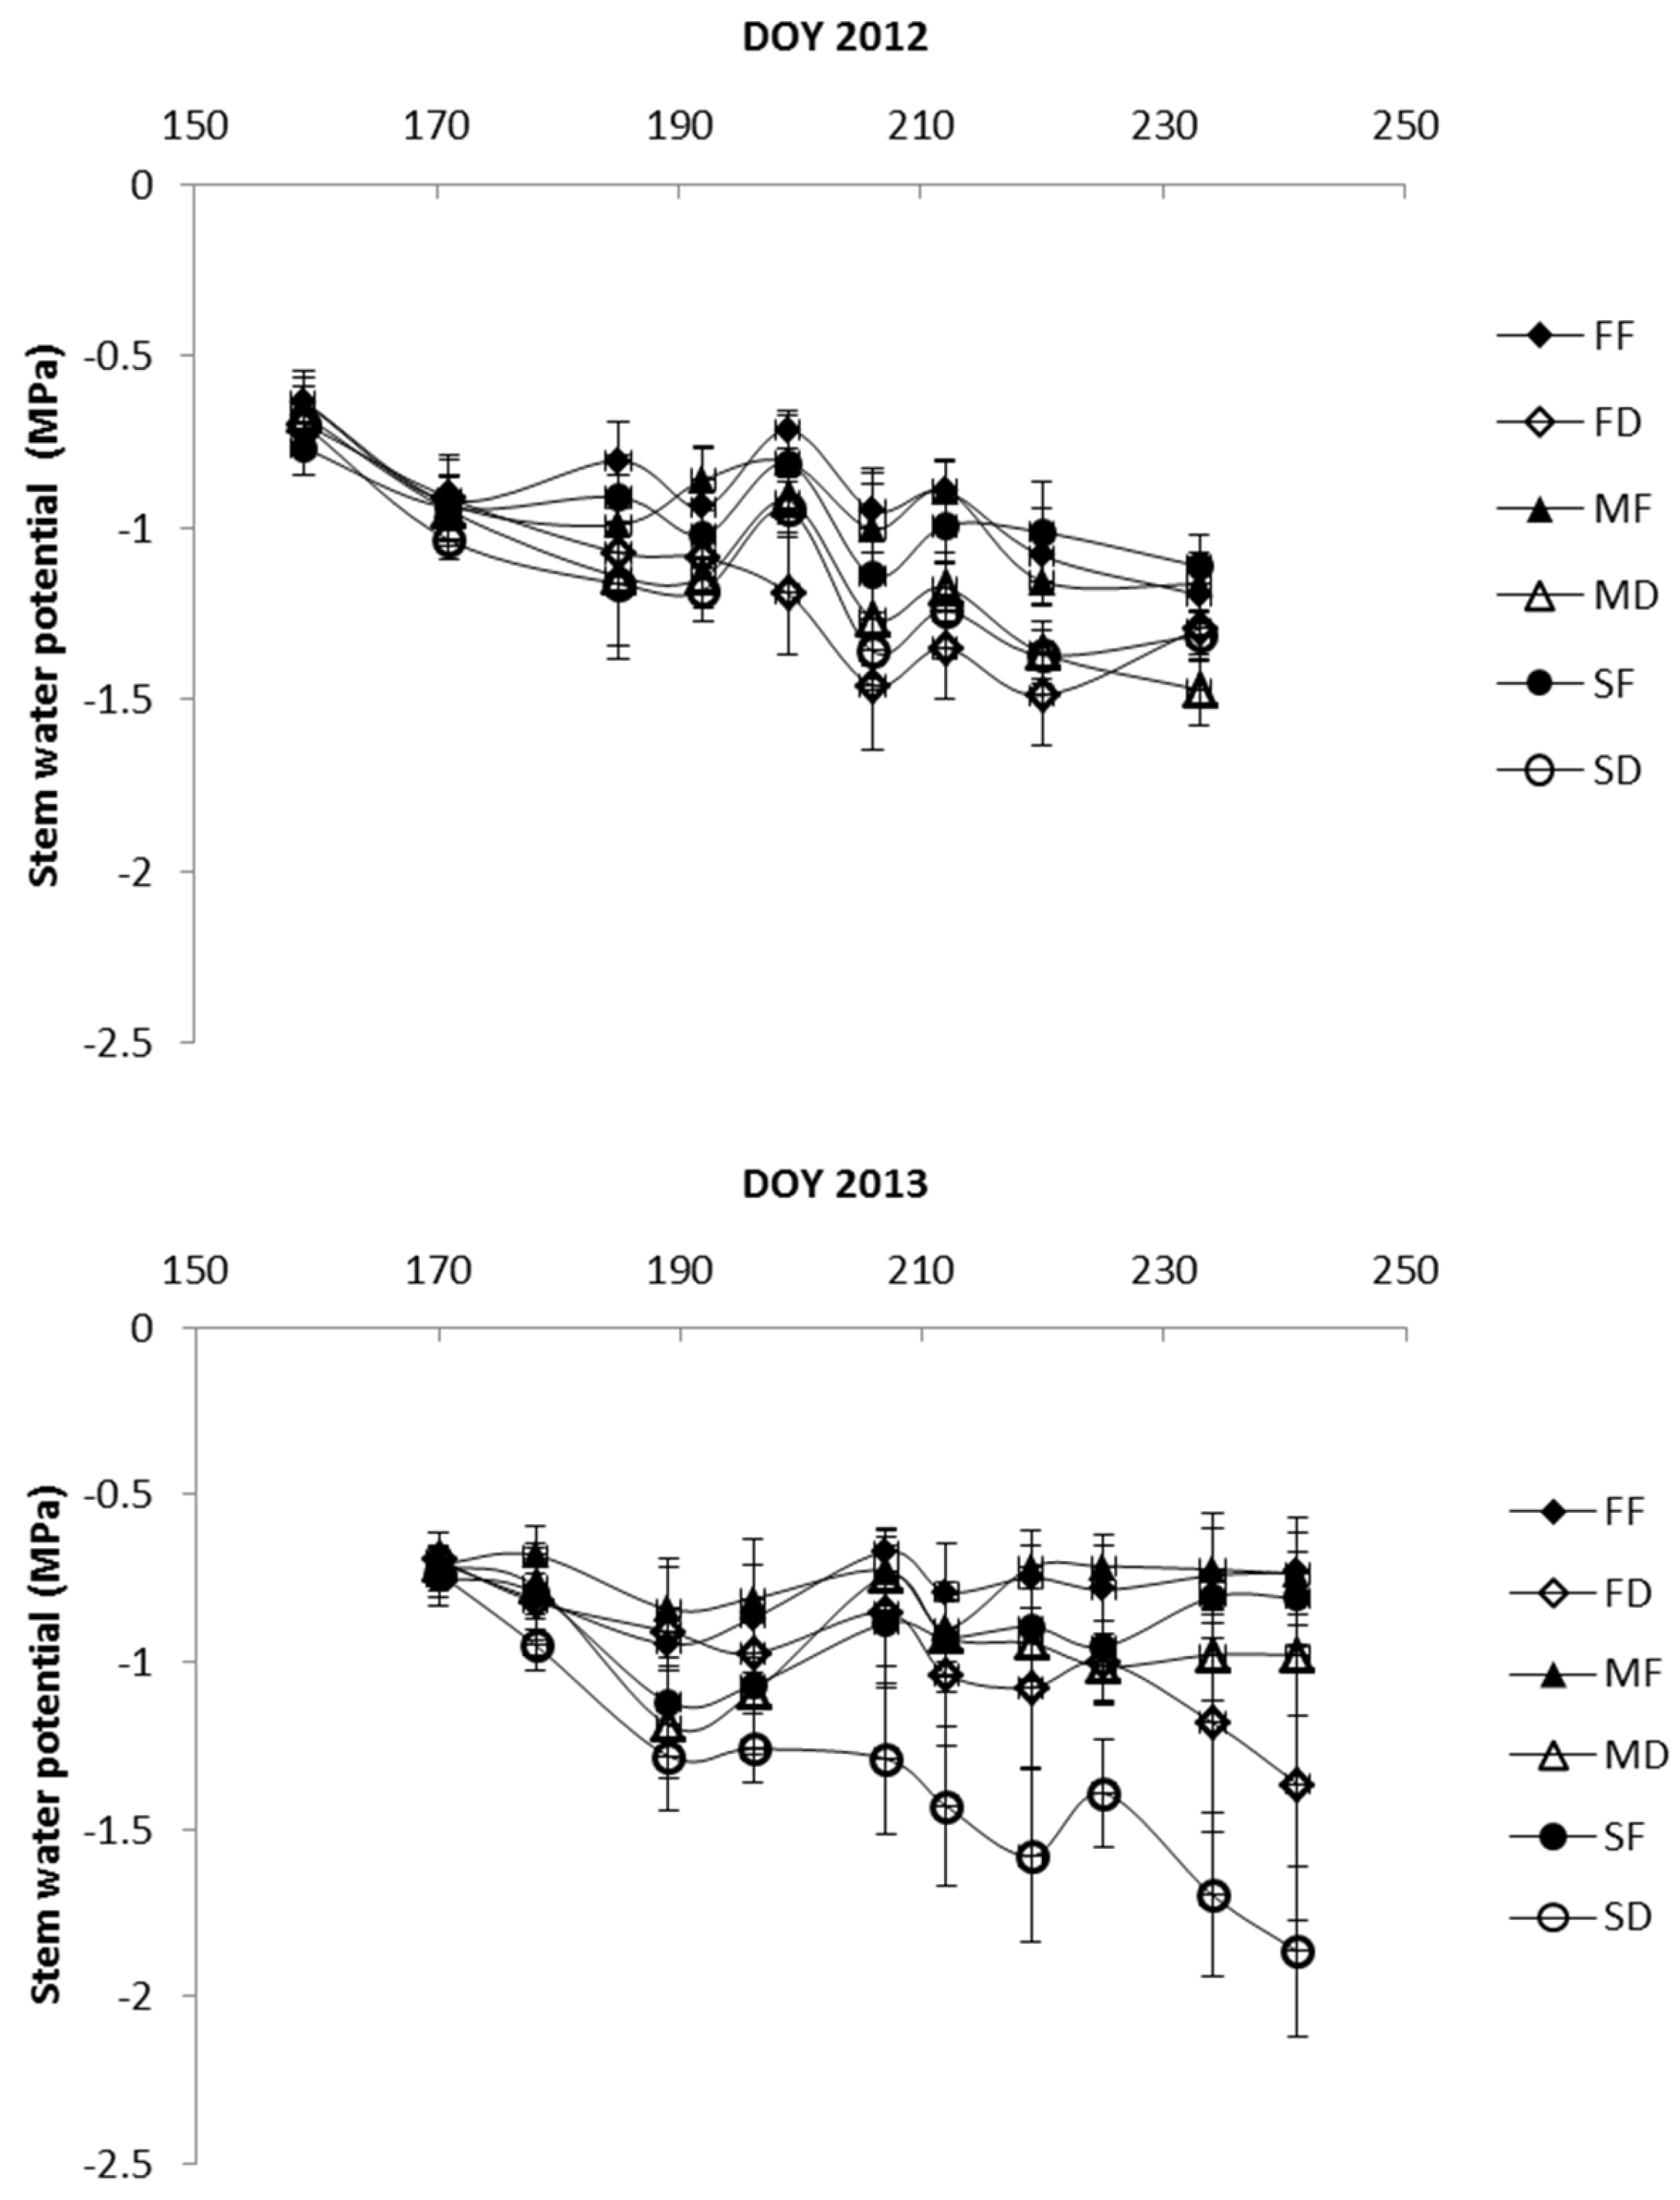
3.4. Stem Water Potential

Mid-day stem water potential varied widely among treatments (Figure 3). The ψ values were similar among all treatments at the beginning of the irrigation scheduling period. In 2012, ψ deceased progressively with increasing stress in deficit treatments, reaching the lowest values by 20 August 2012 (DOY 233) when the last measurement was taken (−1.29 MPa in FD, −1.31 MPa in SD, and −1.47 MPa in MD). However, ψ values in the full irrigation treatments were maintained above −1.0 MPa by the end of July and then decreased to about −1.2 MPa by 20 August 2012. In 2013, ψ values in FF and MF were above −0.9 MPa for the entire period, and ψ in SF was lower than −1.0 MPa in early July and then increased and remained above −1.0 MPa, which was close to the values in FF and MF. ψ in SD dropped to −1.9 MPa and was significantly more negative compared to those in MD and FD.

3.5. Yield and Fruit Quality

Table 3 summarizes the yield data for the 2012–2013 and 2013–2014 growing seasons by irrigation treatment during postharvest. The total fruit number per tree and fruit weight per tree showed statistically significant difference between treatments in both seasons. The reduction on yield in 2013 with respect to 2012 was attributed to differences in pruning and thinning work done by different contractors. Fruit size was not affected by irrigation treatment in the 2012–2013 growing season. In the 2013–2014 growing season, the fruit size in FF was significantly greater than the other five treatments. There was no statistical difference in total soluble solids (%), pH values of the juice, and flesh firmness (N) among all treatments in both years (Table 4). In addition, no statistical difference in fruit skin color and titratable acidity was found among all treatments in both seasons (data not shown). Table 5 shows fruit physical quality data for the 2012–2013 and 2013–2014 growing seasons by irrigation treatment during postharvest. The number of fruits with doubles and external split were found to be statistically different among treatments in 2012–2013 and for doubles only in the 2013–2014 growing season.
When comparing full and deficit irrigation treatment for each irrigation system, we found significantly greater fruit number and weight per tree in FF than FD (F value = 6.3, p = 0.01; F value = 7.7, p = 0.07); larger fruit in SF compared to SD (F value = 4.2, p = 0.05); more doubles in MD than MF and in SD than SF (F value = 10.2, p = 0.02; F value = 8.2, p = 0.04); and more external split fruits in SD compared to SF (F value = 9.0, p = 0.03) for the 2012–2013 growing season. For the 2013–2014 growing season, full irrigation treatments produced greater fruits in number and weight per tree than deficit irrigation treatments (FF vs. FD, MF vs. MD, and SF vs. SD). The number of fruit was significantly greater in FF compared to FD (F value = 4.17, p = 0.05) and no statistical difference was found in fruit size between MF and MD, and SF and SD. There were more deep suture fruits in FD than FF (F value = 15.9, p = 0.01) and doubles in SD than SF (F value = 20.9, p = 0.006). No other quality parameters were significant.
For the 2012–2013 growing season, various irrigation systems had a significant effect on fruit number and weight in full irrigation treatments (FF, MF, and SF) (F value = 12.8, p < 0.0001; F value = 14.1, p < 0.0001) and deficit irrigation treatments (FD, MD, and SD) (F value = 10.5, p < 0.0001; F value = 9.9, p = 0.0001). The results confirmed that trees irrigated by micro-spray had lower yield than trees irrigated by surface drip irrigation [23]. There were no statistical physical quality differences in both full and deficit irrigation treatments. For the 2013–2014 growing season, the total fruit number per tree and fruit weight per tree also showed significant difference among full irrigation treatments (FF, MF, and SF) (F value = 21.4, p < 0.0001; F value = 22.7, p < 0.0001) and among deficit irrigation treatments (FD, MD, and SD) (F value = 20.6, p < 0.0001; F value = 21.8, p < 0.0001). Treatment FF produced larger fruits than the other two full irrigation treatments MF and SF, but no statistically different fruit size was observed among deficit irrigation treatments. Physical quality differences among full irrigation treatments were insignificant, but there were more doubles in SD than the other deficit treatments FD and MD (F value = 5.6, p = 0.02).

4. Discussion

The relationship between canopy-to-air temperature difference (ΔT) and other crop water stress indicators have been confirmed on tree crops [22,26,27]. A well-watered crop will transpire to its potential rate so canopy temperature should be below surrounding air temperature; while a water stressed crop will tend to close stomata, preventing transpiration water loss but at the same time causing a rise in canopy temperature. The potential of using ΔT for irrigation scheduling on early maturing peach trees has been evaluated by [11,25]. Irrigation amount, interval, and ΔT signals for various irrigation systems, furrow, micro-spray, and surface drip, were decided based on the capacity and limitation of each irrigation system and the findings in the previous studies.
Irrigation controlled by ΔT signals in full irrigation treatments to meet full crop ET during the postharvest period was successful in furrow irrigation, but not in micro-spray and surface drip (Table 2). Treatments MF and SF were not treated as targeted full irrigation treatments, but only met crop ET requirement partially (except for MF in 2013 due to an over irrigation event). It may be related to ΔT threshold values and irrigation intervals. For example, we had to adjust the threshold values to increase irrigation frequency (Figure 1) in treatment MF.
Soil water contents showed the decreasing trend with decreasing irrigation application. Although with less irrigation in MF and SF compared to FF in 2012, the soil water content stayed stable after 17 July 2012 (DOY 199) at 75–135 cm soil depths with values close to treatment FF. Bryla et al. [10] has indicated that 90% roots in furrow, micro-spray and drip irrigation system were located at <1 m depth in the soil layer. The soil water content of treatment SF in 2013 became stable at 75–135 cm soil depth after 29 July 2013 (DOY 210); however, the values were much lower than those in FF and MF. Therefore, with irrigation at 34% of ETc and low soil water content (dropped even below deficit treatments FD and MD) in treatment SF in 2013, we believe that the targeted full irrigation treatment goal for SF was not achieved which likely resulted in some degree of water stress.
The ψ values recorded in the fully irrigated trees were similar to those found in well-irrigated peach trees by other studies [4,6]. Comparing fully irrigated treatments with deficit treatments that received 25% of ETc (Table 2), small negative ψ values were found in the fully irrigated trees with clear differences from stressed trees in July and August 2012 when seasonal water demand was the highest. Vera et al. [28] found the lowest ψ value was −1.9 MPa during the postharvest when irrigation satisfied 25% of ETc, which confirms our results in SD (25% of ETc). The ψ values of treatment SF in 2013 were similar to those in FF and MF. Trees from the treatment SF, did not show the level of water stress that should have been expected taking into account the soil water content profile of that treatment (Figure 2). It might indicate that stem water potential may not be a good indicator of peach tree water stress under surface drip systems at certain stress levels.
Although the fruit sizes were smaller in 2013–2014 than in the 2012–2013 growing season, the results were comparable to previous studies in this orchard [10,11,23,25] or for the same peach variety in a nearby field [12]. Also fruit in 2013–2014 growing season tended to be undersized at harvest because they were picked early for better pricing due to the hot weather. The two pick days in 2014 were on 14 May and 17 May, two weeks earlier than usual. When comparing treatment MF with FF in 2013, more irrigation water was applied to MF than FF, but larger fruit was recorded in FF than MF. The results confirmed that more water is actually needed for the micro-spray system to maximize yield and meet crop water requirement due to higher soil evaporation compared with the furrow system [29]. Deficit irrigation caused fewer numbers of fruits and lower total weight per tree, but fruit size remained relatively unchanged [15,25]. It again confirmed that postharvest deficit irrigation could save about 50% of irrigation water without impacting fruit size [25]. Among all defective fruits, deep sutures and dimples were a much more serious problem compared to doubles in the 2013–2014 growing season. Deep sutures and dimples increased more than doubles and dimples were significantly increased in the most severely stressed SD treatment compared to the 2012–2013 growing season.

5. Conclusions

In this study, full and deficit irrigation treatments were applied by furrow, micro-spray and surface drip systems on an early maturing variety of peach during the postharvest season from June to August in 2012 and 2013. Irrigation was controlled by canopy-to-air temperature difference. Using canopy-to-air temperature difference to signal irrigation worked well in the furrow irrigation system, but needs improved techniques in the micro-spray and surface drip irrigation systems. Both irrigation systems and full/deficit irrigation treatments had no significant effect on peach flesh qualities, but due to the seven-year postharvest RDI study in this orchard, the long-term deficit irrigation treatment did cause more defective fruits.

Acknowledgments

The authors would like to acknowledge Matthew Gonzales and Don Tucker for assistance with field and lab work; and Sharon Peterson and Rick Emershad for helping with fruit quality assessment.

Author Contributions

Huihui Zhang and Dong Wang conceived and designed experiments; Huihui Zhang and Jim Gartung performed the experiments and collected data; Huihui Zhang analyzed data and wrote the paper.

Conflicts of Interest

The authors declare no conflict of interest.

References

  1. National Agricultural Statistical Service. Non Citrus Fruits and Nuts USDA 2015. Available online: http://usda.mannlib.cornell.edu/usda/current/NoncFruiNu/NoncFruiNu-07-06-2016.pdf (accessed on 23 September 2016).
  2. Chalmers, D.J.; Mitchell, P.D.; Heek, L.V. Control of peach tree growth and productivity by regulated water supply, tree density, and summer pruning. J. Am. Soc. Hortic. Sci. 1981, 106, 307–312. [Google Scholar]
  3. Goldhamer, D.A.; Salinas, M.; Crisosto, C.; Day, K.R.; Soler, M.; Moriana, A. Effects of regulated deficit irrigation and partial root zone drying on late harvest peach tree performance. Acta Hortic. 2002, 592, 343–350. [Google Scholar] [CrossRef]
  4. Girona, J.; Mata, M.; Arbonès, A.; Alegre, S.; Rufat, J.; Marsal, J. Peach tree response to single and combined regulated deficit irrigation regimes under shallow soils. J. Am. Soc. Hortic. Sci. 2003, 128, 432–440. [Google Scholar]
  5. Sotiropoulos, T.; Kalfountzos, D.; Aleksiou, I.; Kotsopoulos, S.; Koutinas, N. Response of a clingstone peach cultivar to regulated deficit irrigation. Sci. Agric. 2010, 67, 164–169. [Google Scholar] [CrossRef]
  6. Girona, J.; Gelly, M.; Mata, M.; Arbonès, A.; Rufat, J.; Marsal, J. Peach tree response to single and combined deficit irrigation regimes in deep soils. Agric. Water Manag. 2005, 72, 97–108. [Google Scholar] [CrossRef]
  7. Larson, K.; DeJong, T.; Johnson, R. Physiological and growth responses of mature peach trees to postharvest water stress. J. Am. Soc. Hortic. Sci. 1988, 113, 296–300. [Google Scholar]
  8. Johnson, R.S.; Handley, D.F.; DeJong, T.M. Long-term response of early maturing peach trees to postharvest water deficits. J. Am. Soc. Hortic. Sci. 1992, 117, 881–886. [Google Scholar]
  9. Falagán, N.; Artés, F.; Gómez, P.A.; Artés-Hernández, F.; Conejero, W.; Aguayo, E. Deficit irrigation strategies enhance health-promoting compounds through the intensification of specific enzymes in early peaches. J. Sci. Food Agric. 2016, 96, 1803–1813. [Google Scholar] [CrossRef] [PubMed]
  10. Bryla, D.R.; Dickson, E.; Shenk, R.; Johnson, R.S.; Crisosto, C.H.; Trout, T.J. Influence of irrigation method and scheduling on patterns of soil and tree water status and its relation to yield and fruit quality in peach. Hortscience 2005, 40, 2118–2124. [Google Scholar]
  11. Wang, D.; Gartung, J. Infrared canopy temperature of early-ripening peach trees under postharvest deficit irrigation. Agric. Water Manag. 2010, 97, 1787–1794. [Google Scholar] [CrossRef]
  12. Johnson, R.S.; Phene, B.C. Fruit quality disorders in an early maturing peach cultivar caused by postharvest water stress. Int. Soc. Hortic. Sci. 2008, 385–390. [Google Scholar] [CrossRef]
  13. Mirás-Avalos, J.M.; Pérez-Sarmiento, F.; Alcobendas, R.; Alarcón, J.J.; Mounzer, O.; Nicolás, E. Using midday stem water potential for scheduling deficit irrigation in mid–late maturing peach trees under Mediterranean conditions. Irrig. Sci. 2016, 34, 161–173. [Google Scholar] [CrossRef]
  14. Ghrab, M.; Masmoudi, M.M.; Ben Mimoun, M.; Ben Mechlia, N. Plant- and climate-based indicators for irrigation scheduling in mid-season peach cultivar under contrasting watering conditions. Sci. Hortic. 2013, 158, 59–67. [Google Scholar] [CrossRef]
  15. Conejero, W.; Mellisho, C.D.; Ortuño, M.F.; Moriana, A.; Moreno, F.; Torrecillas, A. Using trunk diameter sensors for regulated deficit irrigation scheduling in early maturing peach trees. Environ. Exp. Bot. 2011, 71, 409–415. [Google Scholar] [CrossRef]
  16. Jackson, R.D.; Idso, S.B.; Reginato, R.J.; Pinter, P.J. Canopy temperature as a crop water stress indicator. Water Resour. Res. 1981, 17, 1133–1138. [Google Scholar] [CrossRef]
  17. O’Shaughnessy, S.A.; Evett, S.R.; Colaizzi, P.D.; Howell, T.A. A crop water stress index and time threshold for automatic irrigation scheduling of grain sorghum. Agric. Water Manag. 2012, 107, 122–132. [Google Scholar] [CrossRef]
  18. Baker, J.T.; Mahan, J.R.; Gitz, D.C.; Lascano, R.J.; Ephrath, J.E. Comparison of deficit irrigation scheduling methods that use canopy temperature measurements. Plant Biosyst. 2013, 147, 40–49. [Google Scholar] [CrossRef]
  19. Clawson, K.L.; Blad, B.L. Infrared thermometry for scheduling irrigation of corn1. Agron. J. 1982, 74, 311–316. [Google Scholar] [CrossRef]
  20. Wanjura, D.F.; Upchurch, D.R. Accounting for humidity in canopy-temperature-controlled irrigation scheduling. Agric. Water Manag. 1997, 34, 217–231. [Google Scholar] [CrossRef]
  21. Glenn, D.; Worthington, J.; Welker, W.; McFarland, M. Estimation of peach tree water use using infrared thermometry. J. Am. Soc. Hortic. Sci. 1989, 114, 737–741. [Google Scholar]
  22. Sepulcre-Cantó, G.; Zarco-Tejada, P.J.; Jiménez-Muñoz, J.C.; Sobrino, J.A.; Miguel, E.D.; Villalobos, F.J. Detection of water stress in an olive orchard with thermal remote sensing imagery. Agric. For. Meteorol. 2006, 136, 31–44. [Google Scholar] [CrossRef]
  23. Bryla, D.R.; Trout, T.J.; Ayars, J.E.; Johnson, R.S. Growth and production of young peach trees irrigated by furrow, microjet, surface drip, or subsurface drip systems. HortScience 2003, 38, 1112–1116. [Google Scholar]
  24. Johnson, R.; Williams, L.; Ayars, J.; Trout, T. Weighing lysimeters aid study of water relations in tree and vine crops. Calif. Agric. 2005, 59, 133–136. [Google Scholar] [CrossRef]
  25. Zhang, H.; Wang, D. Management of postharvest deficit irrigation of peach trees using infrared canopy temperature. Vadose Zone J. 2013, 12. [Google Scholar] [CrossRef]
  26. Andrews, P.K.; Chalmers, D.J.; Moremong, M. Canopy-air temperature differences and soil water as predictors of water stress of apple trees grown in a humid, temperate climate. J. Am. Soc. Hortic. Sci. 1992, 117, 453–458. [Google Scholar]
  27. Gonzalez-Dugo, V.; Zarco-Tejada, P.; Berni, J.A.J.; Suárez, L.; Goldhamer, D.; Fereres, E. Almond tree canopy temperature reveals intra-crown variability that is water stress-dependent. Agric. For. Meteorol. 2012, 154–155, 156–165. [Google Scholar] [CrossRef]
  28. Vera, J.; Abrisqueta, I.; Abrisqueta, J.M.; Ruiz-Sánchez, M.C. Effect of deficit irrigation on early-maturing peach tree performance. Irrig. Sci. 2013, 31, 747–757. [Google Scholar] [CrossRef]
  29. Layne, R.E.C.; Tan, C.S.; Hunter, D.M.; Cline, R.A. Irrigation and fertilizer application methods affect performance of high-density peach orchards. HortScience 1996, 31, 370–375. [Google Scholar]
Figure 1. The canopy-to-air temperature difference (ΔT) values plotted with irrigation amounts for the FF, MF, SF, and FD treatments in 2012 and FD and MF treatments in 2013. FF—Full irrigation treatment by furrow irrigation system, where trees were targeted to irrigate with enough water to replace 100% of ETc; FD—Deficit irrigation treatment by furrow irrigation system, where trees were targeted to irrigate with the same amount of water per irrigation event as in FF but with less frequency; MF—Full irrigation treatment by micro-spray irrigation system, where trees were targeted to irrigate with enough water to replace 100% ETc ; SF—Full irrigation treatment by surface drip irrigation system, where trees were targeted to irrigate with enough water to replace 100% ETc.
Agronomy 07 00012 g001aAgronomy 07 00012 g001b
Figure 2. Soil water contents at 15, 75 and 135 cm soil depths in six treatments during the postharvest periods in 2012 and 2013. Vertical bars indicate standard deviation.
Agronomy 07 00012 g002
Figure 3. Stem water potential (ψ) in 2012 and 2013. Vertical bars indicate standard deviation.
Agronomy 07 00012 g003
Table 1. Climatic conditions for the 2012 and 2013 irrigation scheduling periods. Min RH—Average monthly minimum relative humidity; Max RH—Average monthly maximum relative humidity; Min Air—Average monthly minimum air temperature; Max Air—Average monthly maximum air temperature.
MonthMin RH (%)Max RH (%)Min Air (°C)Max Air (°C)Total Monthly Precipitation (mm)Wind Speed (m/s)Average Daily ET0 (mm·day−1)
June 2012267914.631.902.46.95
July 2012288316.934.10.11.86.6
August 2012258417.936.901.65.99
June 2013327816.733.612.16.89
July 2013247718.839.601.76.65
August 2013247816.235.20.31.76.1
Table 2. Reference crop evapotranspiration (ET0), potential crop evapotranspiration (ETc), and irrigation amount applied to each treatment during the irrigation scheduling periods in 2012 and 2013. MD—Deficit irrigation treatment by micro-spray irrigation system, where trees were targeted to irrigate with enough water to replace 25% ETc; SD—Deficit irrigation treatment by surface drip irrigation system, where trees were targeted to irrigate with enough water to replace 25% ETc. See Figure 1 for previously provided definitions.
MonthET0 (mm)ETc (mm)Irrigation Amount (mm)
FFFDMFMDSFSD
2012
June20820722821062710727
July20524022502005014937
August1862272501002105116441
Total599674703102516128420105
2013
June2072052292252399318995
July20624230115047240117544
August189231301752205117544
Total602678831450931545539183
Table 3. Peach yield and yield parameters in the 2012–2013 and 2013–2014 growing season res ponding to different irrigation system and full/deficit irrigation treatments 1.
Treatment2012–20132013–2014
Fruit number per TreeFruit Weight (kg) per TreeFruit Weight (g/fruit)Fruit Number per TreeFruit Weight (kg) per TreeFruit Weight (g/fruit)
FF155 ± 5.6 a20.5 ± 0.7 a137 ± 4.4105 ± 3.2 a13.2 ± 0.4 a125 ± 1.1 a
FD138 ± 4.7 ab18.0 ± 0.7 ab136 ± 4.074 ± 3.2 c8.8 ± 0.4 c120 ± 1.4 b
MF114 ± 5.9 c15.2 ± 0.7 cd137 ± 3.4101 ± 3.4 a12.2 ± 0.4 a119 ± 1.2 b
MD107 ± 4.5 c14.3 ± 0.6 d135 ± 1.790 ± 4.1 b10.7 ± 0.5 b119 ± 1.0 b
SF129 ± 5.7 bc17.9 ± 0.7 abc144 ± 3.476 ± 3.4 c9.1 ± 0.4 c119 ± 1.2 b
SD122 ± 5.2 bc16.2 ± 0.5 acd136 ± 2.458 ± 3.0 d6.9 ± 0.4 d118 ± 1.6 b
p-value<0.0001<0.00010.4423<0.0001<0.00010.0018
1 Means (±SD) followed by a different letter (within a column) are significantly different at p = 0.05 according to the Tukey’s studentized range (HSD) test.
Table 4. Peach flesh quality parameters in the 2012–2013 and 2013–2014 growing season responding to different irrigation system and full/deficit irrigation treatments. TSS = total soluble solids.
Treatment2012–20132013–2014
TSS (%)Firmness (N)pHTSS (%)Firmness (N)pH
FF11.0 ± 0.237.5 ± 0.73.41 ± 0.0610.3 ± 0.339.2 ± 0.83.23 ± 0.03
FD11.2 ± 0.138.2 ± 0.63.35 ± 0.0610.8 ± 0.541.7 ± 0.83.18 ± 0.04
MF11.0 ± 0.136.9 ± 0.73.35 ± 0.0510.2 ± 0.542.9 ± 0.83.22 ± 0.02
MD11.4 ± 0.236.5 ± 0.63.42 ± 0.0610.3 ± 0.441.1 ± 0.93.28 ± 0.03
SF10.8 ± 0.237.0 ± 0.73.28 ± 0.0510.2 ± 0.439.9 ± 0.53.25 ± 0.02
SD11.4 ± 0.234.3 ± 0.73.42 ± 0.0510.4 ± 0.441.6 ± 0.93.27 ± 0.02
p-value0.24800.05710.40300.88170.87120.0931
Table 5. Peach fruit physical quality parameters in the 2012–2013 and 2013–2014 growing season res ponding to different irrigation system and full/deficit irrigation treatments 1.
Doubles (%)Deep sutures (%)External splits (%)Dimples (%)Deformed (%)Split pit (%)
TreatmentFruit quality parameters 2012–2013
FF1.53 b0.830.14 b0.410.76
FD1.94 b0.140.55 ab1.680.38
MF1.25 b0.700.69 ab0.920.86
MD5.83 a1.811.25 ab0.431.85
SF0.69 b0.690.28 b2.930.84
SD3.33 ab0.561.53 a2.111.55
p-value0.00050.28460.00550.19840.423
TreatmentFruit quality parameters 2013–2014
FF0 b0.690.141.391.530.14
FD0.7 b1.810.285.000.700.14
MF0 b1.390.141.111.250.28
MD0.28 b1.940.002.641.950.14
SF0.14 b1.250.006.811.390
SD1.67 a2.360.008.192.780.42
p-value<0.00010.42830.60320.11250.33190.5795
1 Means followed by a different letter (within a column) are significantly different at p = 0.05 according to the Tukey’s studentized range (HSD) test.

