Article

Metabolite Profiling for Leaf Senescence in Barley Reveals Decreases in Amino Acids and Glycolysis Intermediates

by
Liliana Avila-Ospina
,
Gilles Clément
and
Céline Masclaux-Daubresse
*
INRA-AgroParisTech, Institut Jean-Pierre Bourgin, UMR1318, ERL CNRS 3559, Saclay Plant Sciences, Versailles 78000, France
*
Author to whom correspondence should be addressed.
Agronomy 2017, 7(1), 15; https://doi.org/10.3390/agronomy7010015
Submission received: 10 January 2017 / Revised: 26 January 2017 / Accepted: 6 February 2017 / Published: 17 February 2017
(This article belongs to the Special Issue Senescence of Crop Plants)

Abstract

:
Leaf senescence is a long developmental phase important for plant performance and nutrient management. Cell constituents are recycled in old leaves to provide nutrients that are redistributed to the sink organs. Up to now, metabolomic changes during leaf senescence have been mainly studied in Arabidopsis (Arabidopsis thaliana L.). The metabolite profiling conducted in barley (Hordeum vulgare L.) during primary leaf senescence under two nitrate regimes and in flag leaf shows that amino acids, hexose, sucrose and glycolysis intermediates decrease during senescence, while minor carbohydrates accumulate. Tricarboxylic acid (TCA) compounds changed with senescence only in primary leaves. The senescence-related metabolite changes in the flag leaf were globally similar to those observed in primary leaves. The effect of senescence on the metabolite changes of barley leaves was similar to that previously described in Arabidopsis except for sugars and glycolysis compounds. This suggests a different role of sugars in the control of leaf senescence in Arabidopsis and in barley.

1. Introduction

Barley (Hordeum vulgare L.) is a major crop cultivated worldwide. Like in other crops, nitrogen remobilization efficiency is important as a main determinant of grain yield and seed quality [1,2]. In wheat and barley, grain protein content (GPC) and leaf senescence are controlled by the same gene (Gpc-1, NAMB-1), a transcription factor whose homologous gene in Arabidopsis is also involved in the control of leaf senescence [3,4]. The fact that the same gene controls both leaf senescence and GPC suggests that the metabolic changes occurring during leaf senescence are essential for grain composition.
Leaf senescence is a long developmental process essential for plant physiology and metabolism [5]. The numerous genes up- or down-regulated during leaf senescence are indeed strongly related to the primary and secondary metabolisms and especially involved in the transition from anabolism to catabolism [6,7,8,9]. The transcriptome analyses show that the cellular mechanisms involved in the protection against free radicals and reactive oxygen species are overexpressed during leaf senescence. This certainly contributes to the better survival of the leaf tissues all along the senescence process and ensures efficient nutrient remobilization to the sink organs. From that point of view, leaf senescence that ends with cell death, is essential to efficient nutrient recycling and mobilization at the whole plant level. This facilitates survival of environmental changes and seed production. The tightly regulated sequence of events occurring during senescence aims at recycling and remobilizing mineral nutrients and nitrogen-containing molecules as efficiently as possible and in good accordance with the needs of the plant [10,11]. The methodical degradation of cell constituents starts at the chloroplast level and has a strong impact on the photosynthesis capacity of the leaf. Mitochondria is maintained and collapses at the last stage of senescence. However, the nature of the nutrients used to support mitochondria respiration is certainly different at the different stages of the leaf senescence. As a result of chloroplast dismantling, protein degradation and recycling processes, major modifications of the leaf metabolite contents certainly modify the source sink relationships in the plant [12,13].
The molecular mechanisms occurring during the leaf senescence have been studied extensively for a long time because they are key elements controlling plant productivity and plant adaptation to the environment [9,14]. Most of the studies have focused on the signals and the transcriptional factors involved in the regulation of this process [15]. Actors of the degradation process like proteases, nucleases, lipases and other hydrolases have also been identified and their exact roles in the cell component degradations are still under investigation [6,16,17,18,19,20]. Recently, the role of autophagy machinery in the degradation processes occurring during leaf senescence and for nutrient remobilization has been reported [9,21,22,23,24,25,26,27]. Besides cell component degradation, which could be orchestrated by autophagy, and other proteolytic processes occurring in the organelles, the cytosol and the vacuole, a panel of enzymes and transporters in charge of nutrient inter-conversions and phloem loading and unloading remain to be identified [28].
While the changes in gene expressions during leaf senescence have been extensively studied in many plant species [6,29,30], there are still few reports describing how metabolite contents are affected during leaf senescence [12,13] and data available is mainly focused on Arabidopsis leaf senescence. Because we expected that N remobilization metabolism was more active in crops like barley than in Arabidopsis due to the higher harvest index of cereals, the metabolic changes during leaf senescence were investigated in barley.
The present study aims at comparing the metabolic changes occurring in barley leaves during senescence under nitrate-sufficient and nitrate-limited conditions. It is indeed known that under nitrate limitation, N remobilization metabolism is increased. Our results highlight the different behaviors in metabolite managements during senescence depending on nitrogen resources availability.

2. Results

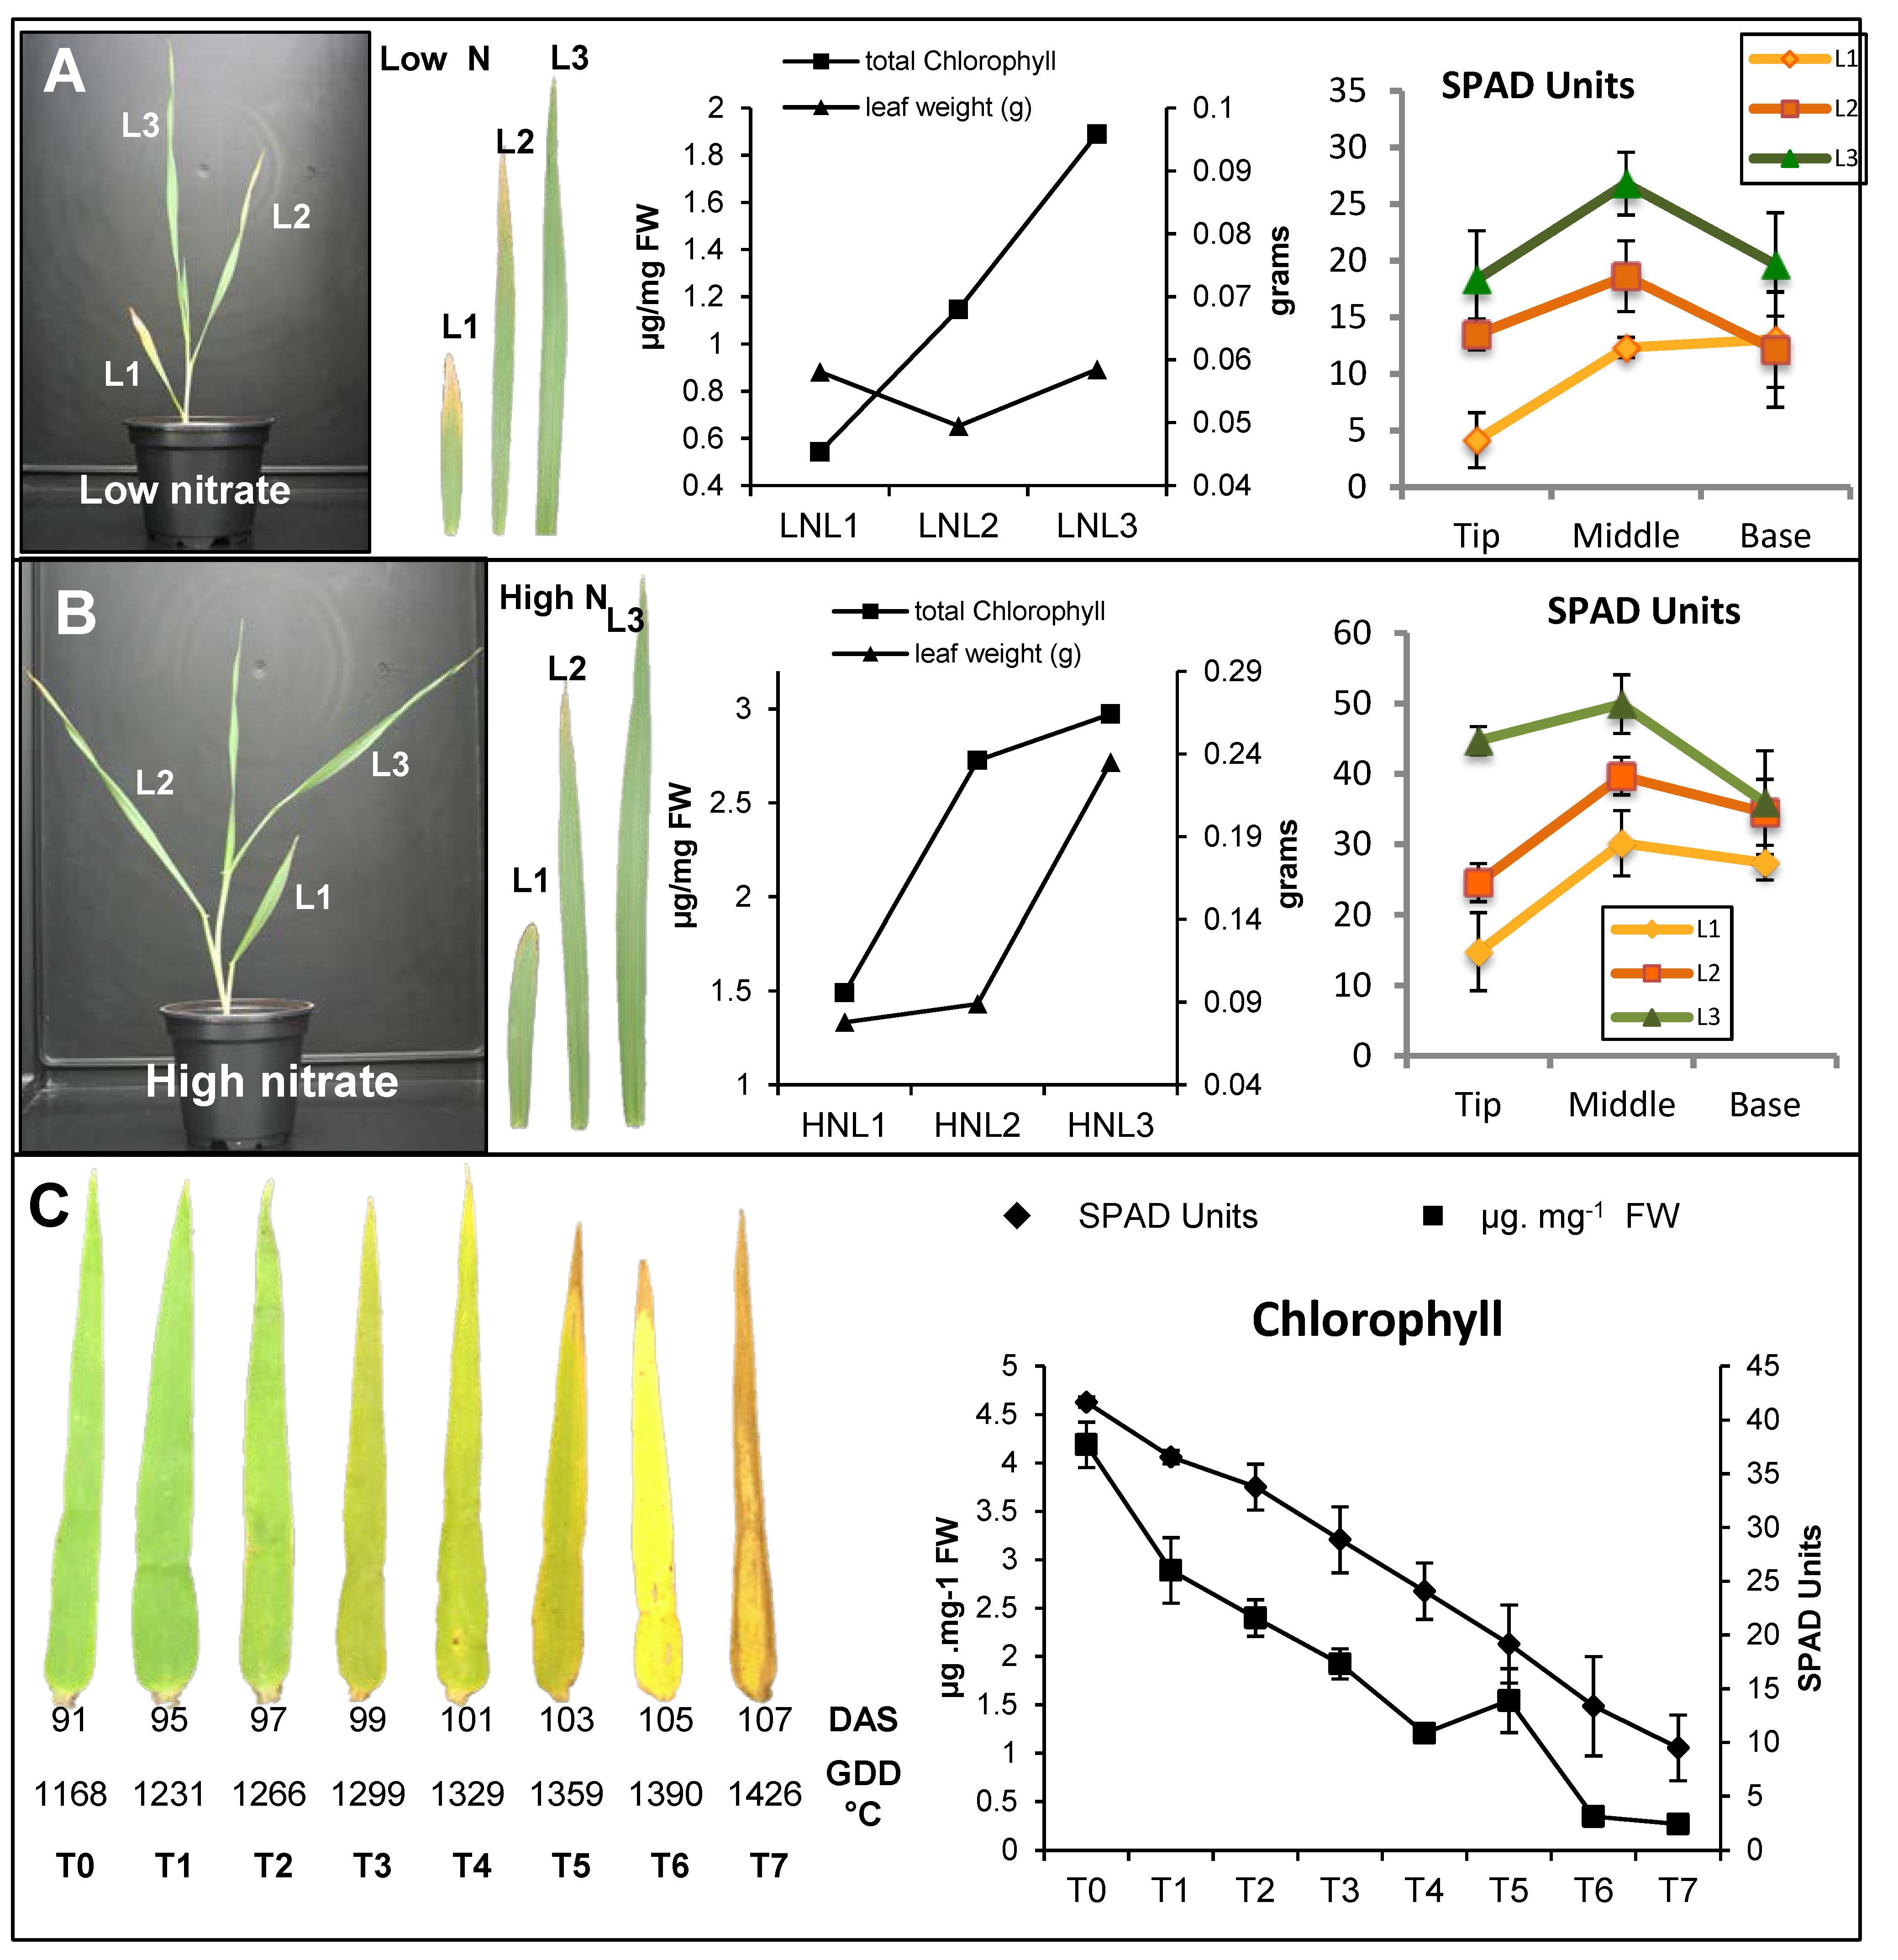
2.1. Characterization of Leaf Senescence in Barley

Leaf senescence in barley was first studied at vegetative stage on primary leaves. Metabolite contents were compared in three leaves (L1, L2 and L3 from the older to the younger), individually harvested on seedlings grown under low or high nitrate conditions for 20 days. Metabolite changes at reproductive stage were also studied on flag leaves harvested at different time points (T1, T3 and T5) chosen according to the expression of leaf-senescence molecular markers [27]. Figure 1 shows chlorophyll decreases in both flag leaves and primary leaves. In seedlings, the younger leaf L3 can be considered as a mature leaf as it displayed the highest chlorophyll content under both low and high nitrate conditions and because no difference in chlorophyll content could be observed between the tip, middle and base of the leaf. Under low nitrate conditions, chlorophyll levels were lower than under high nitrate, reflecting the lower nitrogen concentrations in plants grown under low nitrate. L1 and L2 showed lower chlorophyll concentrations at the tip of the leaves compare to their bases, thus showing the senescence progresses. The mature status of L3 and the senescence of L1 and L2 have been previously confirmed in the study of Avila-Ospina et al. [27]. The cytosolic glutamine synthetase and NAC13 genes were indeed found less expressed in L3 than in L2 and L1. Similarly, chlorophyll contents (this work) and senescence markers [27] showed the progress of flag leaf senescence from T1 to T5.

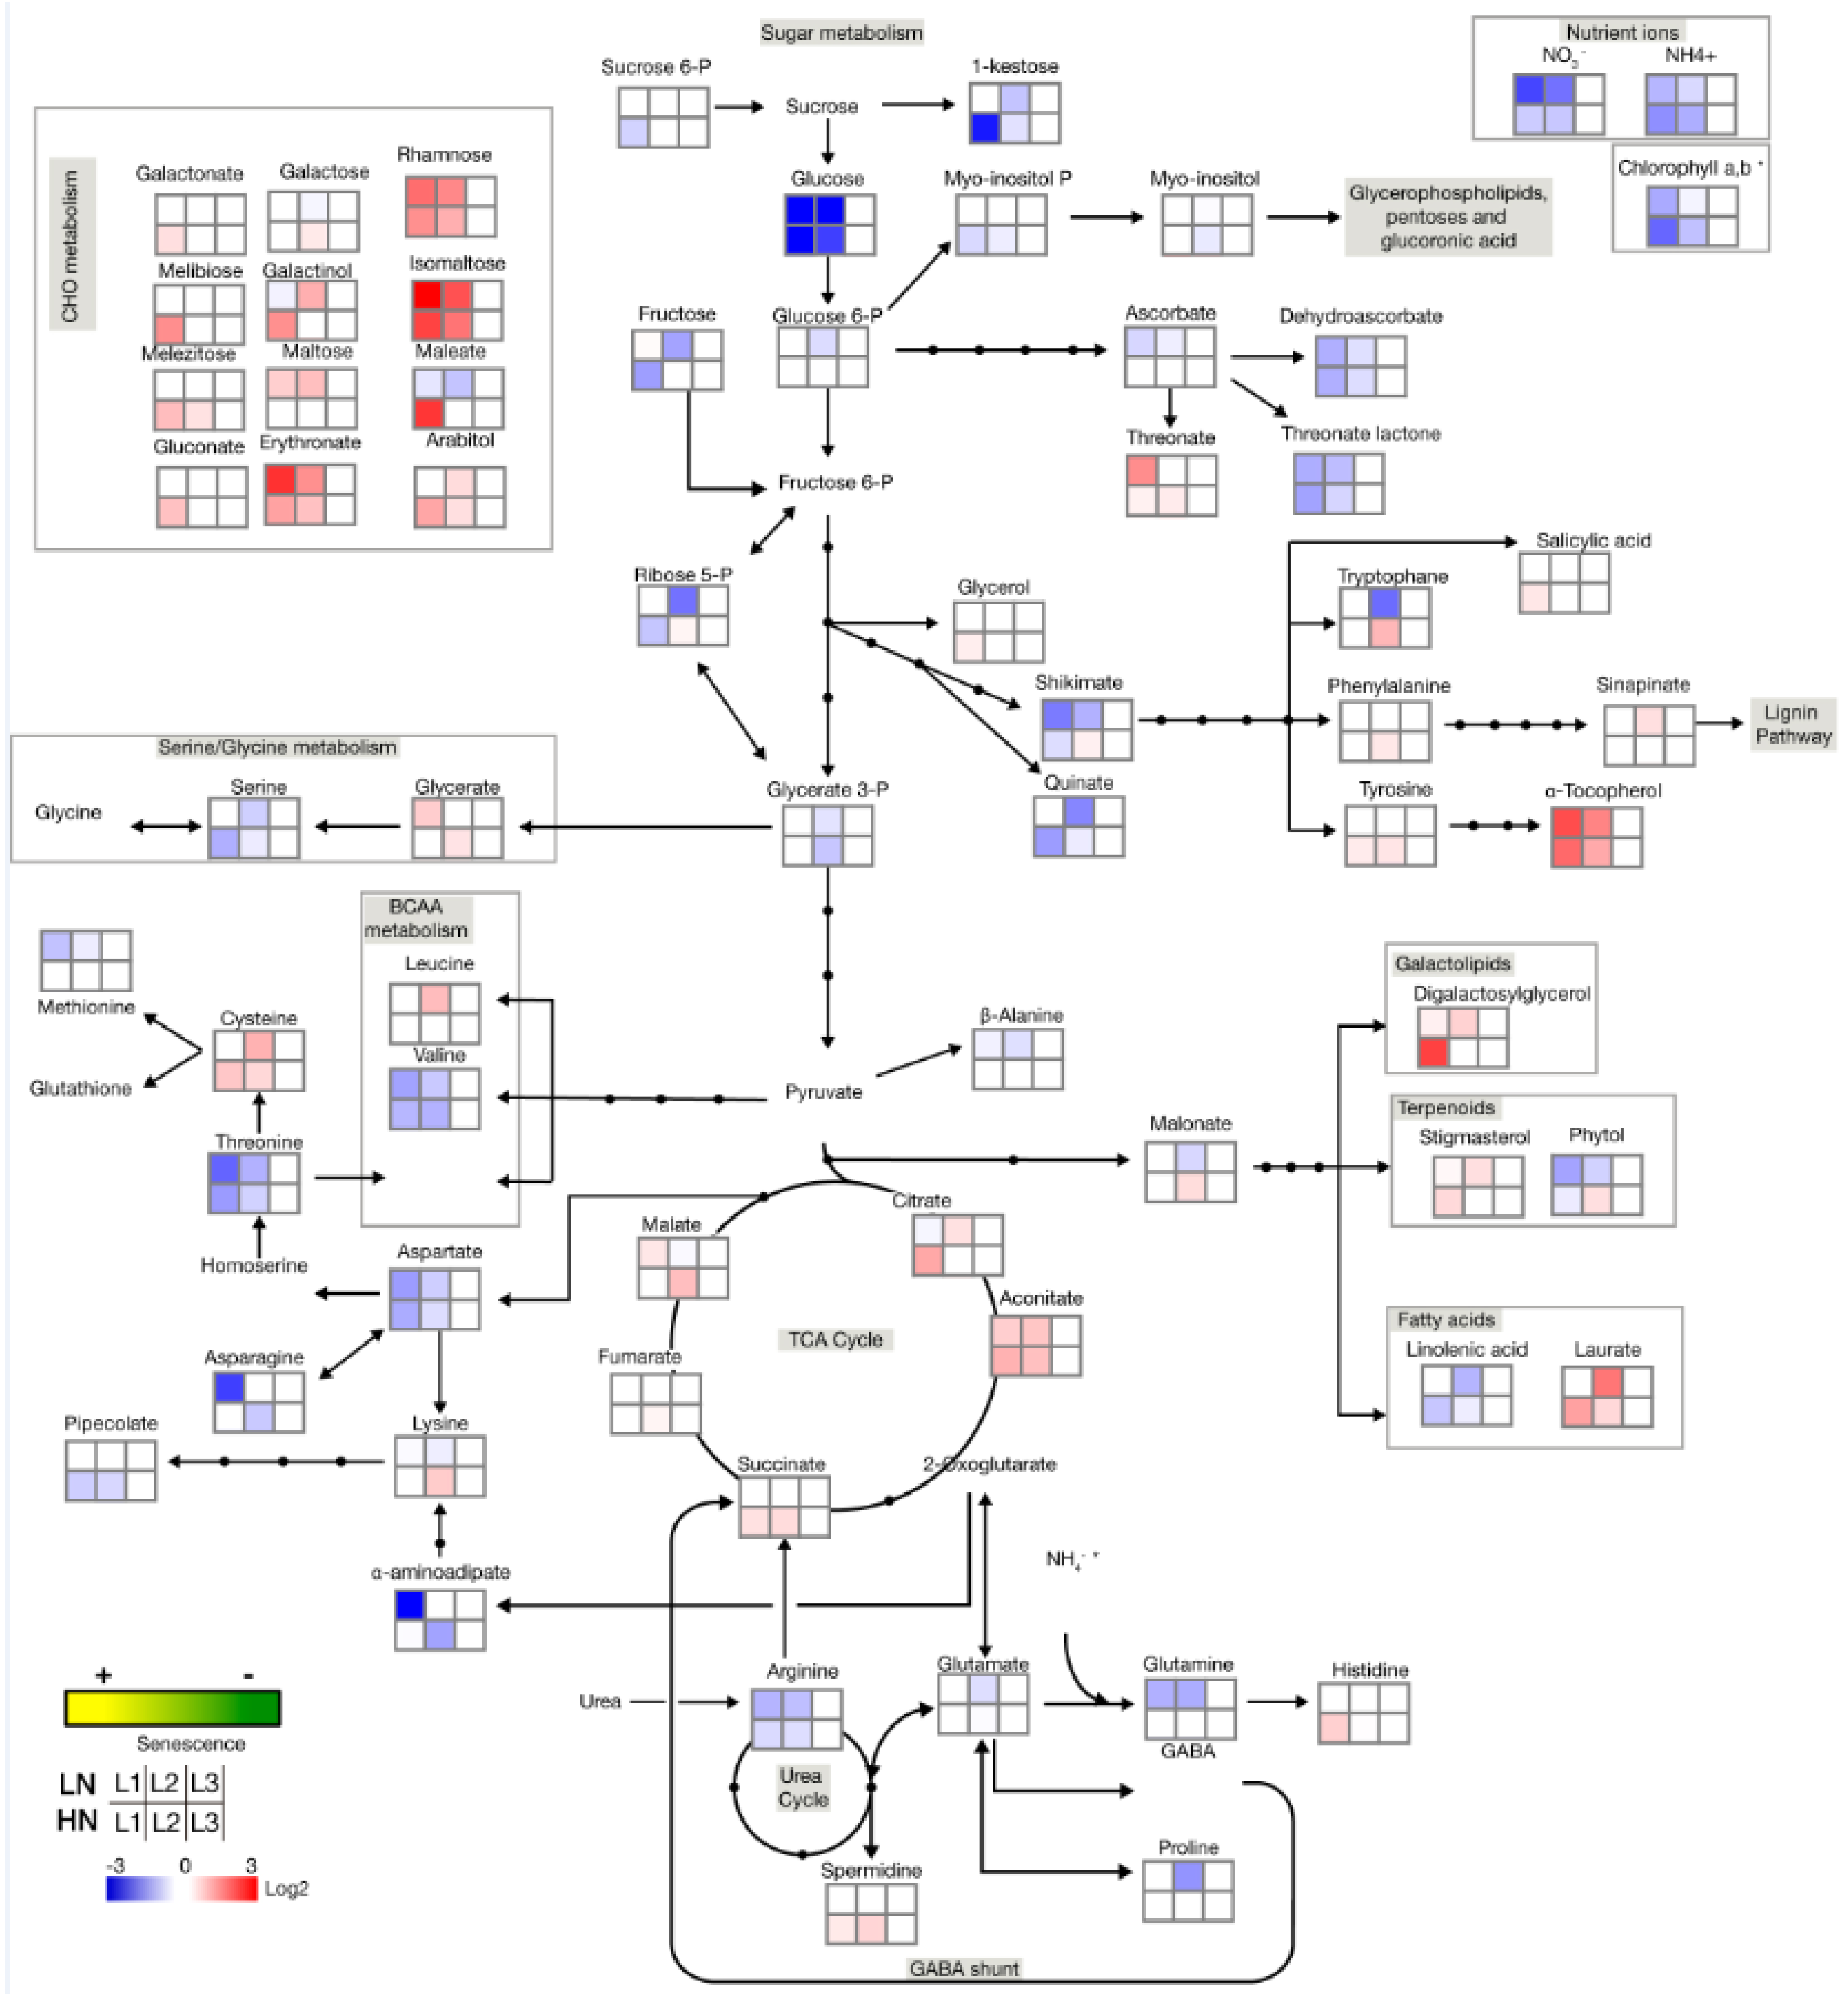
2.2. Senescence-Associated Changes Occurring at the Vegetative Stage in Barley Leaves

Metabolite-relative contents were investigated using GC-MS analyser. Raw data were obtained on the basis of peak areas relative to the ribitol standard per mg fresh weight. These values can be considered as metabolite-relative concentrations although they do not represent any mole of gram units per fresh weight. In order to analyse more easily the senescence-related metabolic changes, we then normalized all these metabolite concentrations to their respective concentrations in the L3 leaf (Supplementary Data Set 1). As such normalisation was performed separately for the LN and the HN leaves, it only permits the investigation of the senescence effect but it cannot reveal any nitrate effect. The Log2 ratios of the metabolite fold changes were calculated (Figure 2) and they are represented on a heat map to give an easier view of the senescence related changes (Figure 2). Only the metabolites with significantly different concentrations in leaves L1 and L2 relative to L3 are presented in the Figure 2 and Figure 3.
Leaf senescence effects were then illustrated by different metabolite classes (Figure 2). Class-1 and Class-2 include the metabolites down- or up-accumulated in old leaves in at least one of the two nitrate conditions respectively. Class-3 and Class-4 include metabolites that change in a different way depending on the nitrate nutrition.
The metabolic map of the senescence-related changes in Figure 3 uses the same false colours as in Figure 2. In agreement with the results reported previously [27], the chlorophyll contents were also represented. From Figure 2 and Figure 3, we can then observe that most of the metabolite changes that occurred with leaf senescence were similar in the plants grown under low or high nitrate, although the magnitudes of the metabolite changes were different under LN compared to HN. In Figure 2, we can observe that the Class 1, that groups the metabolites repressed during leaf senescence, mainly contains 10 amino acids among which glutamate, glutamine, asparagine and serine as known as abundant amino acids in plants. Class 1 also contains phosphate sugars and glycolysis sugars, while the Class 2 that represents the metabolites accumulated during senescence mainly contains minor carbohydrates and organic acids. Class 2 also contains minor (less abundant) amino acids as lysine, histidine, phenylalanine and leucine, tyrosine and cysteine. Figure 3 presents these changes on a metabolic map. Globally, we can see the accumulation of the carbohydrates (CHOs), lipids, TCA (tricarboxylic acid) compounds and minor amino acids in old leaves while glycolysis compounds (glycerate3-P, glucose, fructose, glucose 6-P) and major amino acids decreased in old leaves. Interestingly, tryptophan, lysine, phenylalanine and histidine only increased in old leaves under high nitrate conditions, suggesting they are less remobilized than the others when nitrate is available. In addition it is interesting to notice that decreases in glutamine, asparagine, arginine and threonine were higher under low nitrate than under high nitrate conditions. This suggests that these amino acids are major nitrogen sources for remobilization. Oxidative-stress related compounds are known to be important for the redox homeostasis and especially during leaf senescence. We can observe in Figure 2 a large increase in α-tocopherols in old leaves. However, the decreases in both ascorbate and dehydroascorbate in old leaves suggest that the antioxidants do not all vary in a similar way and do not play the same roles depending on the tissues and stress conditions ([31]).

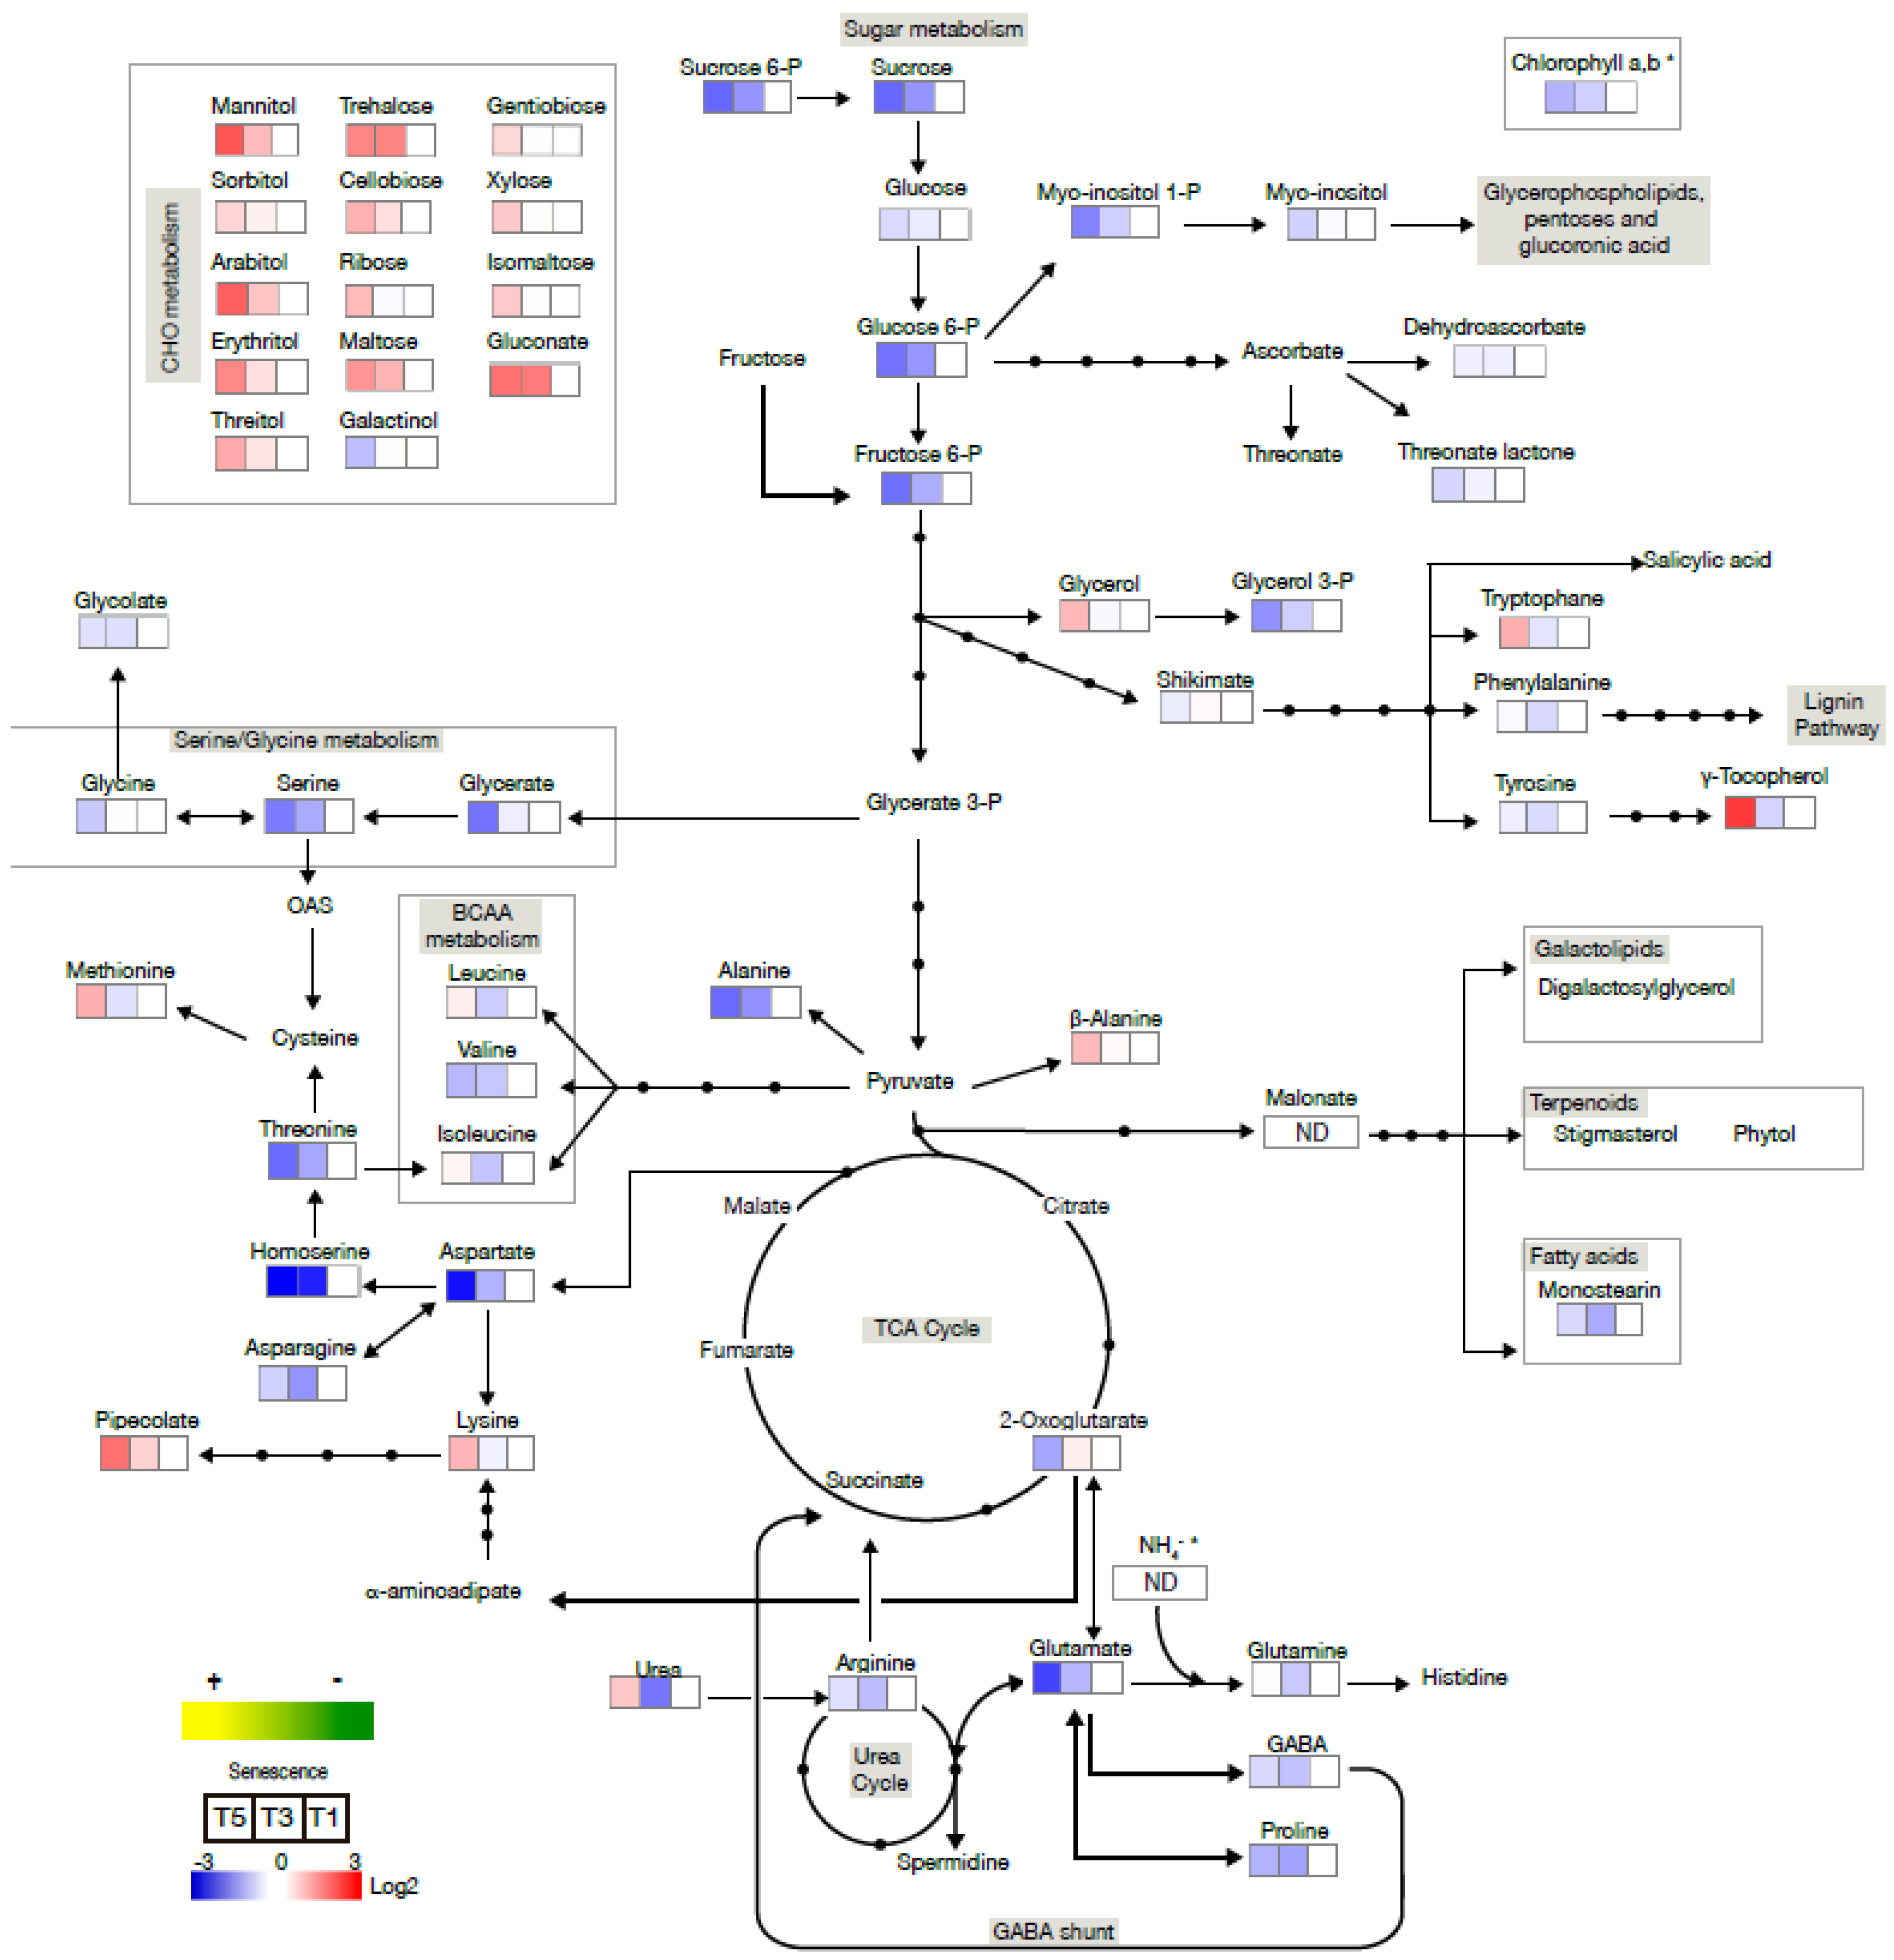
2.3. Senescence-Associated Changes Occurring at the Reproductive Stage in Barley Leaves

In flag leaves, the senescence-related metabolic changes were normalized to their concentrations in the youngest one (harvested at T1). The Log2 ratios of their fold change relative to T1 leaves were then calculated (Supplementary Data Set 2) and the metabolites were grouped in several classes depending on their senescence-related behaviours. Class-1 includes 25 metabolites with a significantly lower concentration in the old T5 leaves (Down during senescence). Class-2 includes 17 metabolites with significantly higher concentrations in the old T5 leaves (Up during senescence). Class-3 includes 11 metabolites with significantly lower concentrations in mature T3 leaves compared to young (T1) and old (T5) leaves. In contrast, Class-4 included two metabolites with significantly higher concentrations in the mature T3 leaves compared to young (T1) and old (T3) leaves. The metabolite changes occurring with flag leaf senescence are represented on the metabolic map in Figure 4 using the same false colours as in Supplementary Data Set 2.
The senescence-related changes observed in the flag leaves are mostly similar to those observed in seedling leaves. As such, in flag leaves like in primary leaves, most of the CHOs (except galactinol) increased with ageing, while glycolysis compounds (sucrose, hexose and hexose6-P) and most of the amino acids decreased. Like in primary leaves, aspartate, glutamine, alanine, serine and threonine sharply decreased in flag leaf with ageing. Only methionine, lysine and β-alanine slightly increased during flag leaf senescence.
Despite all these similarities, a major difference between the flag and the primary leaves concerned the TCA cycle compounds. While almost all the TCA compounds increased with senescence in primary leaves, none of them show any significant change with senescence in the flag leaves. It seems thus that the mitochondrial respiration is not affected in a similar manner by ageing at reproductive and vegetative stages. The maintenance of mitochondrial respiration during flag leaf senescence could explain that TCA compounds are poorly affected by ageing [32]. However, pipecolate and α-aminoadipate, which are both markers of the lysine anapleurotic respiratory pathway, increased during senescence in the flag leaf, suggesting a specific role of this pathway in flag leaf compared to seedling leaves [33,34].

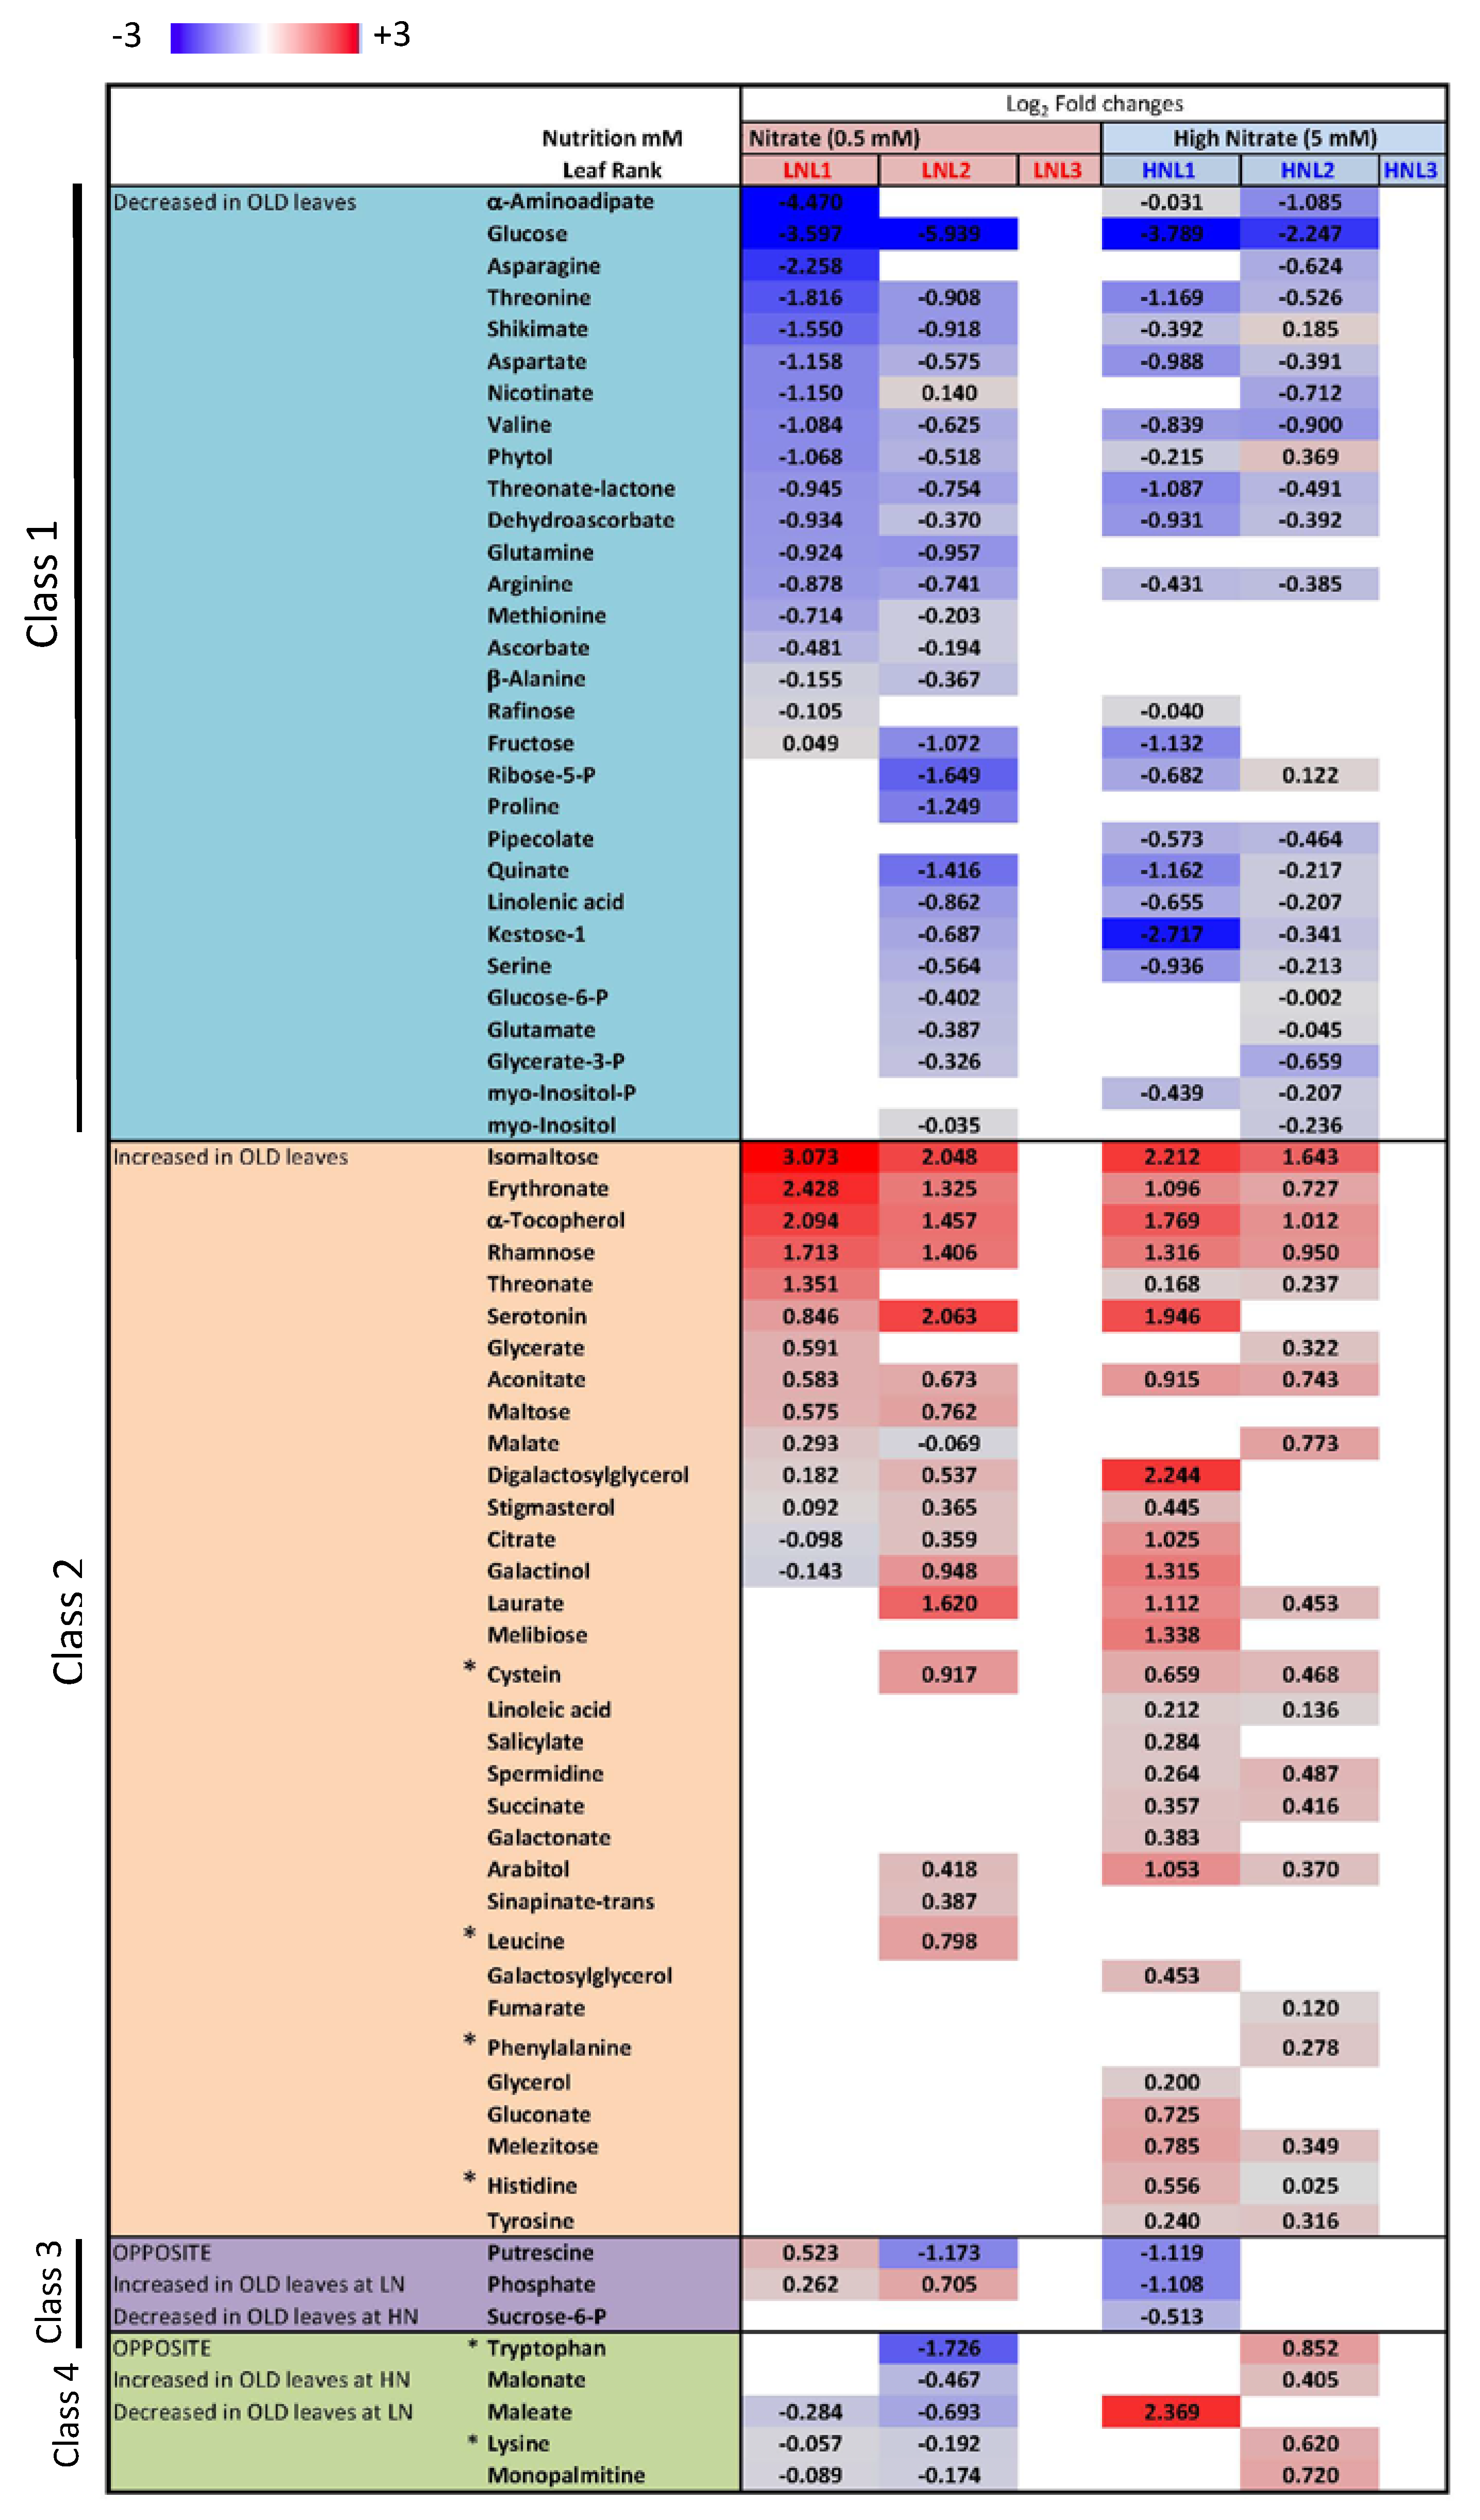
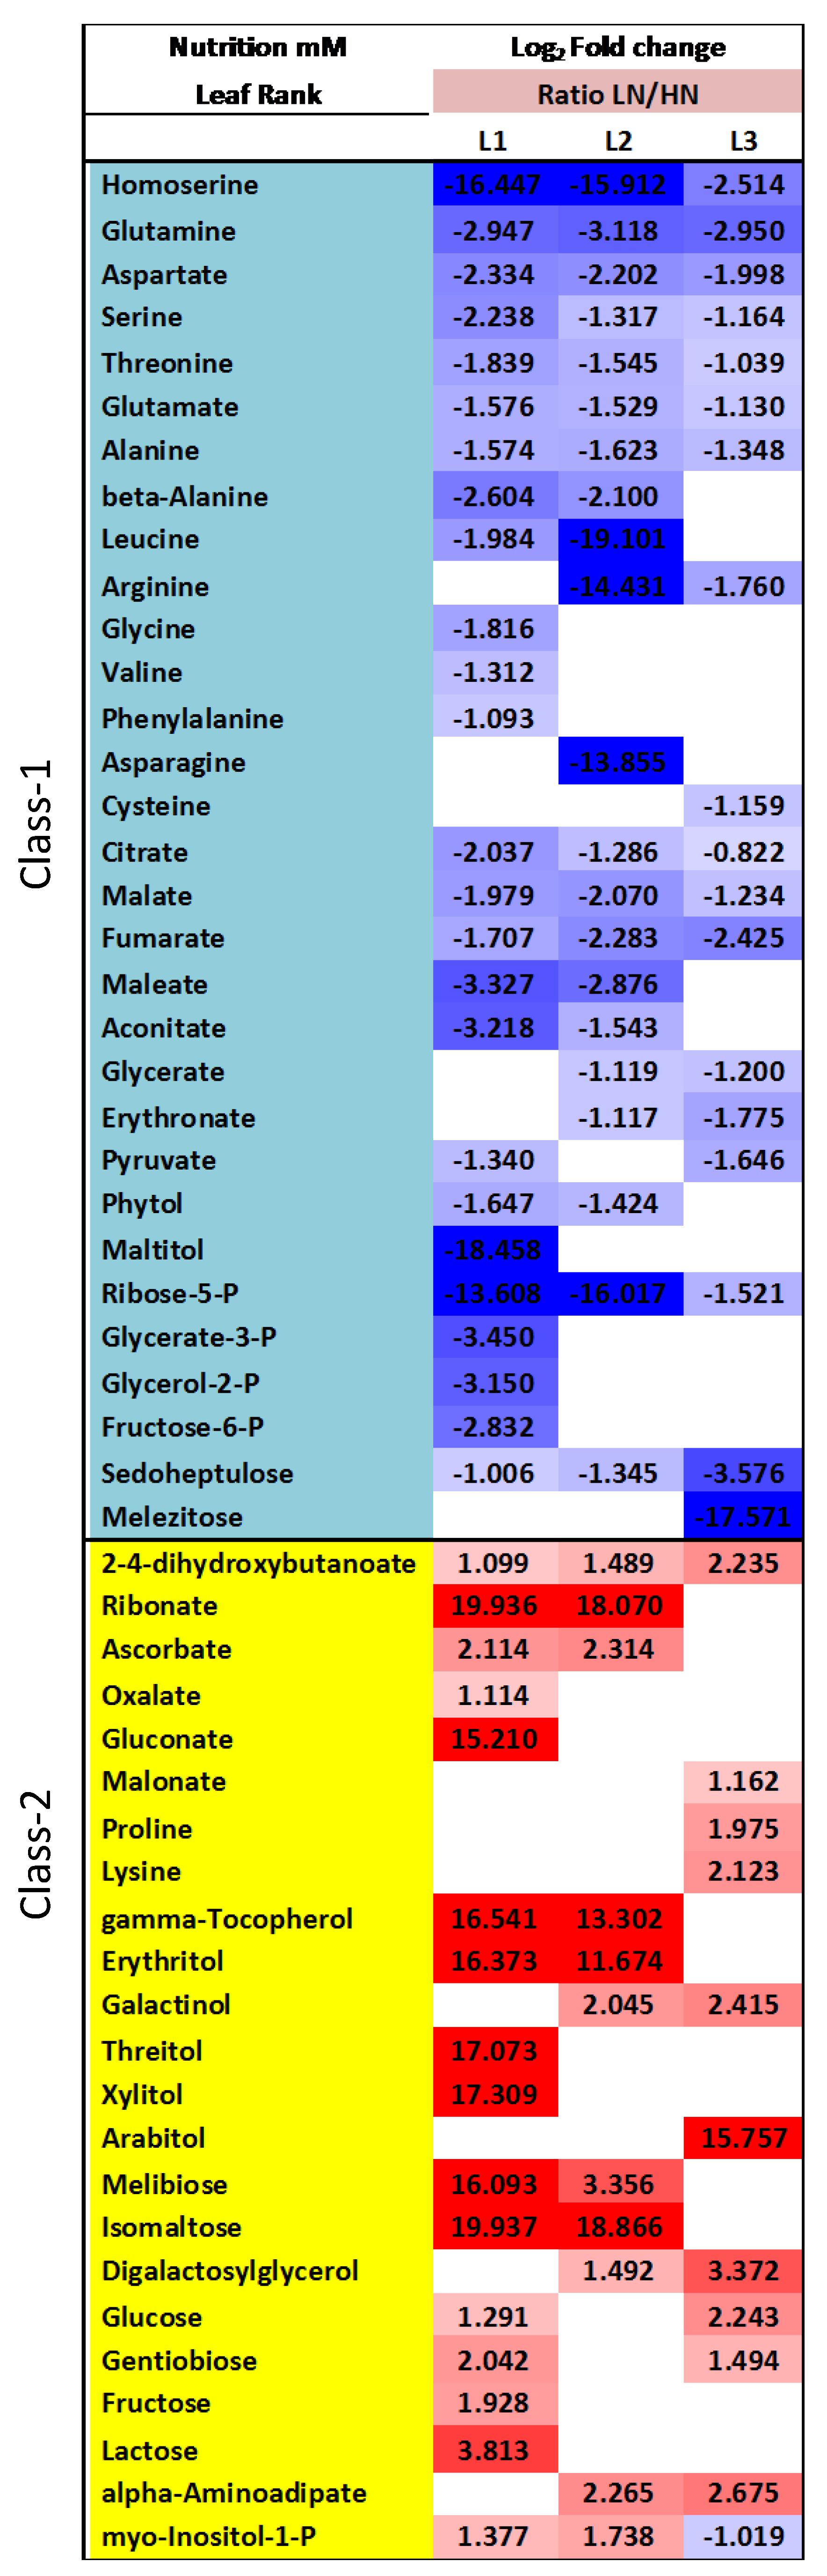
2.4. Nitrate Regime Affects Metabolite Contents in Primary Leaves but Poorly Modify Senescence Effect

The normalization used in Figure 3 only allowed the analyses of the senescence effect in primary leaves, and stated above, most of the senescence-related changes were similar in plants grown under low or high nitrate conditions.
In order to better compare the metabolite contents under low and high nitrate conditions, we then calculated the Log2 of the ratio of the metabolite levels in LN leaves relative to HN leaves (Figure 5). The number of metabolites that decreased under low nitrate (31) was higher than the number of metabolites over-accumulated under LN (22).
It was not surprising that almost all the amino acids (15 over 19) were less abundant in the LN leaves than in the HN ones, especially in older leaves. Only proline and lysine were more abundant in the LN leaves relative to HN, but this was only observed in the L3. The organic acids appeared also globally less abundant under LN as well as the glycolysis intermediates. The over-accumulated metabolites under LN were mostly sugar acids, sugar alcohol and hexoses. The global picture of nitrate limitation effects is the depletion of amino acids, organic acids and glycolysis intermediates, and the accumulation of minor CHO. Such effects of nitrate limitation are in good accordance with results obtained in Arabidopsis [35,36]. Differences between LN and HN were stronger and more numerous in the older leaf L1 than in the younger L3. This suggests that N limitation effect is increased with ageing. This could be due to the fact that nutrient recycling metabolism is more active in old leaves under LN than under HN.

3. Discussion

In the present study, we have analysed how metabolite contents change during leaf senescence in barley leaves. We used both primary leaves and flag leaves to consider leaf senescence at vegetative and reproductive stages. The effect of nitrate availability was also investigated by growing plants under two different nitrate regimes corresponding to ample N condition and N limitation. The nitrogen status of the plants has been described previously [27] and was confirmed by the differences of nitrate and amino acid contents between the HN and the LN plants.
The main result is that the senescence effects observed under the two nitrate regimes and in both primary and flag leaves are globally similar. It shows the decrease of the major amino acids and of the glycolysis sugars and the increase of the minor carbohydrates. Comparing metabolite changes in flag leaves and primary leaves, we can see that mainly only TCA compounds and few minor amino acids do not behave the same way. While TCA compounds increase with leaf senescence in primary leaves, they are unchanged in flag leaves. The reason of such difference could be that growth conditions were quite different or that the position of the leaves on the plant modifies their respiration activities. Another difference resides in the pipecolate and α-aminoadipate changes. Indeed these two compounds are linked to the degradation of lysine and to its anapleurotic role in the mitochondrial respiratory pathway [33,34]. While pipecolate and α-aminoadipate decreased in primary leaves with senescence, they sharply accumulated in flag leaves with ageing, suggesting that lysine was used for mitochondria respiration in seedlings but not so much in the flag leaves. The anapleurotic respiration of amino acids has been mainly observed in Arabidopsis in response to dark stress [32,34,37] and Chrobok et al. [32] showed that the whole metabolic pathway of lysine degradation was up-regulated in Arabidopsis individual darken leaves. It could then be possible that the differences of light environment between primary and flag leaves are the reason of these discrepancies and that lysine level could be related to both glutamate content and TCA replenishment.
Metabolic changes during leaf senescence have been mainly investigated in Arabidopsis [11,13,32]. They showed many similar features to what we found here in barley, such as the accumulation of minor CHO and the decrease in most of the amino acids like glutamine, glutamate, aspartate, serine, glycine and arginine. However, a considerable difference between the two plant species is related to the increase of glycolysis sugars in Arabidopsis while glycolysis sugars decrease with senescence in both primary and flag leaves of barley. The role of sucrose and glucose in the control of leaf senescence had been debated for long [38] and this question has mainly focused on Arabidopsis. The absence of hexose and sucrose accumulation with leaf senescence in barley then suggests that on this point the regulation of leaf senescence by sugars in barley is not the same as in Arabidopsis. In addition, the fact that glycolysis sugars fluctuate differently in barley and in Arabidopsis leaves with senescence suggests that their use for TCA replenishment or their neosynthesis through neoglucogenesis is different in the two plant species.

4. Material and Methods

4.1. Plant Material and Growth Conditions

Hordeum vulgare L. cultivar Golden Promise—a two-rowed spring barley cultivar—was grown in a growth chamber (16 h/8 h photoperiod—25/17 °C). Seeds were sown on sand and five-day old plants were transferred into polyvinyl chloride (PVC) tubes (6ø—45 cm units) containing sand as a substrate. Plants were watered eight times per day with a nutritive solution containing 0.5 mM NO3 (250 µM KH2PO4; 250 µM MgSO4; 250 µM K2SO4; 250 µM KNO3; 125 µM CaN2O6; 250 µM CaCl2; 0.04 µM (NH4)6Mo7O24; 24.3 μM H3BO3; 11.8 µM MnSO4; 3.48 µM ZnSO4; 1 µM CuSO4; 0.001% Sequestrene 138 FE 100 Syngenta) named high nitrate treatment (HN) or a 5 mM NO3 (250 µM KH2PO4; 250 µM MgSO4; 4 mM KNO3; 500 µM CaN2O6; 200 µM NaCl; 0.04 µM (NH4)6Mo7O24; 24.3 µM H3BO3; 11.8 µM MnSO4; 3.48 µM ZnSO4; 1 µM CuSO4; 0.001% Sequestrene 138 FE 100 Syngenta) named low nitrate treatment (LN) [27]. Individual leaf ranks, L1 to L4 of high nitrate grown plants (HN) and L1 to L3 of low nitrate grown plants (LN) (from bottom to top leaves) were harvested, immediately frozen in liquid nitrogen and stored at −80 °C for further experiments. Chlorophyll contents measured spectrometrically or using SPAD before harvest are presented in Supplementary Figure 1. Two plantings were performed and following analyses were carried out on two plant cultures.
In field experiments, spring barley (Hordeum vulgare L.) Cultivar Carina was used. The experiments were performed at Hohenschulen research farm at 15.5 km west of Kiel (https://www.hohenschulen.uni-kiel.de/en) during the 2013 growing season, June being nearly wet and July warm and relatively dry. Spring barley was sown using a drill on 2 April 2013. The barley was managed organically and organic manure equal to 70 kg·N·ha−1 was added. There were four replicate plots 150 m2 each. Plants were grown in a concentration of 300 plants/m2 with 12.5 cm of row distance. Crop was spreaded with 1.5 L/ha of Ariane C (Dow agrosciences) and 20 g/ha of Trimmer SX (FCS) (herbicides) on 14 May 2013. Subsequently, it was added 0.3 L/ha of Moddus (Syngenta; Maintal; Germany) and Ethephon (Bayer CropSc.; Frankfurt; Germany) (growth regulators), 0.5 L/ha of Gladio (Syngenta) (fungicide), 5 kg/ha of MgSO4 and 10 L/ha of Mn-EDTA on 5 June 2013. At last, 150 kg/ha Kierserit (KALI) (25% MgO, 20% S) and 30 kg/ha KAS (76% NH4NO3, 24% CaCO3) were added on 7 June 2013. Flag leaves from the main shoots were harvested from each plot between 10:00 and 12:00 and immediately frozen in liquid nitrogen and stored at −80 °C for further experiments. Several harvests were performed 95 days after sowing (DAS) (T0), 99 DAS (T1) and from T1 every 2 days for 2 weeks until flag leaves showed very low SPAD values. Metabolite profiling was performed on leaves harvested 95, 99 and 103 days after sowing; T1, T3 and T5 by reference to Avila-Ospina et al. [27].
The plant material studied here is the same as previously used to monitor leaf senescence markers [27]. It is important to note that none of the results presented here have ever been presented previously.

4.2. Chlorophyll and Anion Determinations

Chlorophyll content was determined spectrophotometrically in crude leaf extracts according to [27] or using the SPAD-502 chlorophyll meter (KONICA-MINOLTA, Carrière sur Seine, France). Anion concentrations were determined using Dionex HPLC (HPLC Dionex DX 120; Thermo Fischer Scientific, Courtaboeuf, France) on the same extract as used for metabolite profiling.

4.3. Metabolite Profiling Using GC-MS

Extraction, derivatization, analysis, and data processing were performed according to Fiehn [39].
The ground frozen samples (20 mg FW) were resuspended in 1 mL of frozen (−20 °C) Water:Acetonitrile:Isopropanol (2:3:3) containing ribitol at 4 µg·mL−1 and extracted for 10 min at 4 °C with shaking at 1400 rpm in an Eppendorf thermomixer. Insoluble material was removed by centrifugation at 20,000× g for 5 min. 100 µL of supernatant were collected and dried for 4 h in a Speed-Vac and stored at −80 °C. Just before derivatization, samples were dried again for 1.5 h in a Speed-Vac. Three blank tubes underwent the same steps as the samples. After drying, 10 µL of 20 mg·mL−1 methoxyamine in pyridine were added to the samples. The reaction was performed for 90 min at 28 °C under continuous shaking in an Eppendorf thermomixer. Then 90 µL of N-methyl-N-trimethylsilyl-trifluoroacetamide (MSTFA) (Aldrich Saint Quentin Fallavier; France; 394866-10x1ml) was added and the reaction continued for 30 min at 37 °C. After cooling, 45 µL of the derivatized sample was transferred to an Agilent (Les Ulis, France) vial for injection.
Metabolites were analysed by GC-MS 4 h after derivatization. One microliter of the derivatized samples was injected in splitless mode on an Agilent 7890A gas chromatograph coupled to an Agilent 5975C mass spectrometer. The column was an Rtx-5SilMS from Restek (30 m with 10 m Integraguard column). The liner (Restek 20994) was changed before each series of analyses and 10 cm of column was cut. The oven temperature ramp was 70 °C for 7 min, then 10 °C/min to 325 °C for 4 min (run length 36.5 min). Helium constant flow was 1.5231 mL/min. Temperatures were as follows: injector, 250 °C; transfer line, 290 °C; source: 250 °C; and quadripole, 150 °C. Samples and blanks were randomized. Amino acid standards were injected at the beginning and end of the analysis to monitor the derivatization stability. An alkane mix (C10, C12, C15, C19, C22, C28, C32 and C36) was injected in the middle of the queue for external calibration. Five scans per second were acquired.
Metabolites, analysed using a gas chromatography mass spectrometry technique were annotated and their levels on a fresh weight basis were normalized with respect to the ribitol internal standard.

4.4. Metabolomic Data Processing

Raw Agilent datafiles were converted to NetCDF format and analysed with AMDIS [40]. A home retention index/mass spectra library, built from the NIST, Golm, and Fiehn databases and standard compounds, was used for metabolite identification. Peak areas were then determined using the QuanLynx software (Waters; Guyancourt, France) after conversion of the NetCDF file to MassLynx format. Statistical analysis was done with TMEV [41]; univariate analysis by permutation (1 way-ANOVA and 2 way-ANOVA) was first used to select the significant metabolites. Multivariate analysis (hierarchical clustering and principal component analysis; PCA) was then done in order to establish the metabolite clusters. Only metabolites showing repeatable and significant differences (based on a t-test) according to leaf age or number reflecting different senescence stages and nitrate growth conditions were included.

5. Conclusions

The senescence effects of leaf metabolism in both primary and flag leaves are globally similar. The decrease of the major amino acids and the increase of the minor carbohydrates are similar to what found in Arabidopsis. However, glycolysis sugars show decrease in barley leaves with ageing by contrast with Arabidopsis. This suggests that the regulation of leaf senescence by sugars in barley is not the same as in Arabidopsis.

Supplementary Materials

The following are available online at www.mdpi.com/2073-4395/7/1/15/s1, Supplementary Data Set 1: Heat map of metabolite changes during leaf senescence in primary leaves; Supplementary Data Set 2: Heat map of metabolite changes in flag leaf during senescence.

Acknowledgments

The authors thank Joël Talbotec for help with plant material growth. The authors also thank the whole team at Observatoire du Végétal (http://www-ijpb.versailles.inra.fr/fr/plateformes/Observatoire-du-vegetal.html) for providing all the facilities to grow plants and perform metabolite profiling. The authors thank Laurence Cantrill for advices and correcting the English. The PhD fellowship for L. Avila-Ospina was supported by the FP7 Marie Curie Actions—Networks for Initial Training Project FP7-MC-ITN No. 264394 acronym CropLife.

Author Contributions

Experiments have been carried out by L.A.-O. and G.C.; Data mining was performed by L.A.-O. with contribution of G.C. and C.M.-D. Writing was performed by L.A.-O. and C.M.-D.

Conflicts of Interest

The authors declare no conflict of interest.

References

  1. Chardon, F.; Noël, V.; Masclaux-Daubresse, C. Manipulating NUE in Arabidopsis and crop plants to improve yield and seed quality. J. Exp. Bot. 2012, 63, 3401–3412. [Google Scholar] [CrossRef] [PubMed]
  2. Kichey, T.; Hirel, B.; Heumez, E.; Dubois, F.; Le Gouis, J. In winter wheat (Triticum aestivum L.), post-anthesis nitrogen uptake and remobilisation to the grain correlates with agronomic traits and nitrogen physiological markers. Field Crop Res. 2007, 102, 22–32. [Google Scholar] [CrossRef]
  3. Uauy, C.; Distelfeld, A.; Fahima, T.; Blechl, A.; Dubcovsky, J. A NAC gene regulating senescence improves grain protein, zinc, and iron content in wheat. Science 2006, 314, 1298–1301. [Google Scholar] [CrossRef] [PubMed]
  4. Distelfeld, A.; Avni, R.; Fischer, A. Senescence, nutrient remobilization, and yield in wheat and barley. J. Exp. Bot. 2014, 65, 3783–3798. [Google Scholar] [CrossRef] [PubMed]
  5. Masclaux-Daubresse, C.; Reisdorf-Cren, M.; Orsel, M. Leaf nitrogen remobilisation for plant development and grain filling. Plant Biol. 2008, 10, 23–36. [Google Scholar] [CrossRef] [PubMed]
  6. Guo, Y.; Cai, Z.; Gan, S. Transcriptome of Arabidopsis leaf senescence. Plant Cell Environ. 2004, 27, 521–549. [Google Scholar] [CrossRef]
  7. Hollmann, J.; Gregersen, P.L.; Krupinska, K. Identification of predominant genes involved in regulation and execution of senescence-associated nitrogen remobilization in flag leaves of field grown barley. J. Exp. Bot. 2014, 65, 2963–3973. [Google Scholar] [CrossRef] [PubMed]
  8. Buchanan-Wollaston, V. The molecular biology of leaf senescence. J. Exp. Bot. 1997, 48, 181–199. [Google Scholar] [CrossRef]
  9. Avila-Ospina, L.; Moison, M.; Yoshimoto, K.; Masclaux-Daubresse, C. Autophagy, plant senescence, and nutrient recycling. J. Exp. Bot. 2014, 65, 3799–3811. [Google Scholar] [CrossRef] [PubMed]
  10. Himelblau, E.; Amasino, R.M. Nutrients mobilized from leaves of Arabidopsis thaliana during leaf senescence. J. Plant Physiol. 2001, 158, 1317–1323. [Google Scholar] [CrossRef]
  11. Diaz, C.; Lemaitre, T.; Christ, A.; Azzopardi, M.; Kato, Y.; Sato, F.; Morot-Gaudry, J.F.; Le Dily, F.; Masclaux-Daubresse, C. Nitrogen recycling and remobilization are differentially controlled by leaf senescence and development stage in Arabidopsis under low nitrogen nutrition. Plant Physiol. 2008, 147, 1437–1449. [Google Scholar] [CrossRef] [PubMed]
  12. Diaz, C.; Purdy, S.; Christ, A.; Morot-Gaudry, J.-F.; Wingler, A.; Masclaux-Daubresse, C. Characterization of markers to determine the extent and variability of leaf senescence in Arabidopsis. A metabolic profiling approach. Plant Physiol. 2005, 138, 898–908. [Google Scholar] [CrossRef] [PubMed]
  13. Watanabe, M.; Balazadeh, S.; Tohge, T.; Erban, A.; Giavalisco, P.; Kopka, J.; Mueller-Roeber, B.; Fernie, A.; Hoefgen, R. Comprehensive dissection of spatio-temporal metabolic shifts in primary, secondary and lipid metabolism during developmental senescence in Arabidopsis thaliana. Plant Physiol. 2013, 62, 1290–1310. [Google Scholar] [CrossRef] [PubMed]
  14. Masclaux-Daubresse, C.; Daniel-Vedele, F.; Dechorgnat, J.; Chardon, F.; Gaufichon, L.; Suzuki, A. Nitrogen uptake, assimilation and remobilization in plants: Challenges for sustainable and productive agriculture. Ann. Bot. 2010, 105, 1141–1157. [Google Scholar] [CrossRef] [PubMed]
  15. Garapati, P.; Xue, G.P.; Munne-Bosch, S.; Balazadeh, S. Transcription factor ATAF1 in Arabidopsis promotes senescence by direct regulation of key chloroplast maintenance and senescence transcriptional cascades. Plant Physiol. 2015, 168, 1122–1139. [Google Scholar] [CrossRef] [PubMed]
  16. Roberts, I.N.; Caputo, C.; Criado, M.V.; Funk, C. Senescence-associated proteases in plants. Physiol. Plantarum 2012, 145, 130–139. [Google Scholar] [CrossRef] [PubMed]
  17. Donnison, I.S.; Gay, A.P.; Thomas, H.; Edwards, K.J.; Edwards, D.; James, C.L.; Thomas, A.M.; Ougham, H.J. Modification of nitrogen remobilization, grain fill and leaf senescence in maize (Zea mays) by transposon insertional mutagenesis in a protease gene. New Phytol. 2007, 173, 481–494. [Google Scholar] [CrossRef] [PubMed]
  18. Buchanan-Wollaston, V.; Earl, S.; Harrison, E.; Mathas, E.; Navabpour, S.; Page, T.; Pink, D. The molecular analysis of leaf senescence—a genomics approach. Plant Biotechnol. J. 2003, 1, 3–22. [Google Scholar] [CrossRef] [PubMed]
  19. Sakamoto, W.; Takami, T. Nucleases in higher plants and their possible involvement in DNA degradation during leaf senescence. J. Exp. Bot. 2014, 65, 3835–3843. [Google Scholar] [CrossRef] [PubMed]
  20. Diaz-Mendoza, M.; Velasco-Arroyo, B.; Gonzalez-Melendi, P.; Martínez, M.; Isabel, D. C1A cysteine protease-cystatin interactions in leaf senescence. J. Exp. Bot. 2014, 65, 3825–3833. [Google Scholar] [CrossRef] [PubMed]
  21. Doelling, J.H.; Walker, J.M.; Friedman, E.M.; Thompson, A.R.; Vierstra, R.D. The APG8/12-activating enzyme APG7 is required for proper nutrient recycling and senescence in Arabidopsis thaliana. J. Biol. Chem. 2002, 277, 33105–33114. [Google Scholar] [CrossRef] [PubMed]
  22. Hanaoka, H.; Noda, T.; Shirano, Y.; Kato, T.; Hayashi, H.; Shibata, D.; Tabata, S.; Ohsumi, Y. Leaf senescence and starvation-induced chlorosis are accelerated by the disruption of an Arabidopsis autophagy gene. Plant Physiol. 2002, 129, 1181–1193. [Google Scholar] [CrossRef] [PubMed]
  23. Guiboileau, A.; Avila-Ospina, L.; Yoshimoto, K.; Soulay, F.; Azzopardi, M.; Marmagne, A.; Lothier, J.; Masclaux-Daubresse, C. Physiological and metabolic consequences of autophagy defisciency for the management of nitrogen and protein resources in Arabidopsis leaves depending on nitrate availability. New Phytol. 2013, 199, 683–694. [Google Scholar] [CrossRef] [PubMed] [Green Version]
  24. Guiboileau, A.; Yoshimoto, K.; Soulay, F.; Bataillé, M.; Avice, J.; Masclaux-Daubresse, C. Autophagy machinery controls nitrogen remobilization at the whole-plant level under both limiting and ample nitrate conditions in Arabidopsis. New Phytol. 2012, 194, 732–740. [Google Scholar] [CrossRef] [PubMed]
  25. Avice, J.-C.; Etienne, P. Leaf senescence and nitrogen remobilization efficiency in oilseed rape (Brassica napus L.). J. Exp. Bot. 2014, 65, 3813–3824. [Google Scholar] [CrossRef] [PubMed]
  26. Prins, A.; van Heerden, P.D.R.; Olmos, E.; Kunert, K.J.; Foyer, C.H. Cysteine proteinases regulate chloroplast protein content and composition in tobacco leaves: A model for dynamic interactions with ribulose-1,5-biphosphate carboxylase/oxygenase (rubisco) vesicular bodies. J. Exp. Bot. 2008, 59, 1935–1950. [Google Scholar] [CrossRef] [PubMed]
  27. Avila-Ospina, L.; Marmagne, A.; Talbotec, J.; Krupinska, K.; Masclaux-Daubresse, C. The identification of new cytosolic glutamine synthetase and asparagine synthetase genes in barley (Hordeum vulgare L.), and their expression during leaf senescence. J. Exp. Bot. 2015, 66, 2013–2026. [Google Scholar] [CrossRef] [PubMed]
  28. Havé, M.; Marmagne, A.; Chardon, F.; Masclaux-Daubresse, C. Nitrogen remobilisation during leaf senescence: Lessons from Arabidopsis to crops. J. Exp. Bot. 2016. [Google Scholar] [CrossRef] [PubMed]
  29. Sekhon, R.S.; Childs, K.L.; Santoro, N.; Foster, C.E.; Buell, C.R.; de Leon, N.; Kaeppler, S.M. Transcriptional and metabolic analysis of senescence induced by preventing pollination in maize. Plant Physiol. 2012, 159, 1730–1744. [Google Scholar] [CrossRef] [PubMed]
  30. Palmer, N.A.; Donze-Reiner, T.; Horvath, D.; Heng-Moss, T.; Waters, B.; Tobias, C.; Sarath, G. Switchgrass (Panicum virgatum L.) flag leaf transcriptomes reveal molecular signatures of leaf development, senescence, and mineral dynamics. Funct. Integr. Genom. 2015, 15, 1–16. [Google Scholar] [CrossRef] [PubMed]
  31. Foyer, C.H.; Noctor, G. Ascorbate and glutathione: The heart of the redox hub. Plant Physiol. 2011, 155, 2–18. [Google Scholar] [CrossRef] [PubMed]
  32. Chrobok, D.; Law, S.R.; Brouwer, B.; Lindèn, P.; Ziolkowska, A.; Liebsch, D.; Narsai, R.; Szal, B.; Moritz, T.; Rouhier, N.; et al. Dissecting the metabolic role of mitochondria during developmental leaf senescence. Plant Physiol. 2016. [Google Scholar] [CrossRef] [PubMed]
  33. Boex-Fontvieille, E.; Gauthier, P.; Gilard, F.; Hodges, M.; Tcherkez, G. A new anaplerotic respiratory pathway involving lysine biosynthesis in isocitrate dehydrogenase-deficient Arabidopsis mutants. New Phytol. 2013, 99, 673–682. [Google Scholar] [CrossRef] [PubMed]
  34. Araujo, W.L.; Tohge, T.; Ishizaki, K.; Leaver, C.J.; Fernie, A.R. Protein degradation—An alternative respiratory substrate for stressed plants. Trends Plant Sci. 2011, 16, 489–498. [Google Scholar] [CrossRef] [PubMed]
  35. Lemaitre, T.; Gaufichon, L.; Boutet-Mercey, S.; Christ, A.; Masclaux-Daubresse, C. Enzymatic and metabolic diagnostic of nitrogen deficiency in Arabidopsis thaliana Wassileskija accession. Plant Cell Physiol. 2008, 49, 1056–1065. [Google Scholar] [CrossRef] [PubMed]
  36. Balazadeh, S.; Schildhauer, J.; Araujo, W.L.; Munne-Bosch, S.; Fernie, A.R.; Proost, S.; Humbeck, K.; Mueller-Roeber, B. Reversal of senescence by N resupply to N-starved Arabidopsis thaliana: Transcriptomic and metabolomic consequences. J. Exp. Bot. 2014, 65, 3975–3992. [Google Scholar] [CrossRef] [PubMed]
  37. Araujo, W.L.; Ishizaki, K.; Nunes-Nesi, A.; Larson, T.R.; Tohge, T.; Krahnert, I.; Witt, S.; Obata, T.; Schauer, N.; Graham, I.A.; et al. Identification of the 2-hydroxyglutarate and isovaleryl-CoA dehydrogenases as alternative electron donors linking lysine catabolism to the electron transport chain of Arabidopsis mitochondria. Plant Cell 2010, 22, 1549–1563. [Google Scholar] [CrossRef] [PubMed]
  38. Wingler, A.; Masclaux-Daubresse, C.; Fischer, A.M. Sugars, senescence, and ageing in plants and heterotrophic organisms. J. Exp. Bot. 2009, 60, 1063–1066. [Google Scholar] [CrossRef] [PubMed]
  39. Fiehn, O. Metabolite profiling in Arabidopsis. Methods Mol. Boil. 2006, 323, 439–447. [Google Scholar]
  40. AMDIS. Available online: http://chemdata.nist.gov/mass-spc/amdis/ (accessed on 31 May 2016).
  41. TMEV. Available online: http://mev.tm4.org/#/welcome (accessed on 1 January 2017).
Figure 1. Natural leaf senescence in barley. Leaf senescence was monitored in primary leaves from seedlings grown under low (A, LN) and high (B, HN) nitrate conditions in growth chambers, and in flag leaves of plants grown in the field. Leaf ranks harvested from seedlings at 20 DAS were numbered from the oldest (L1) to the youngest (L3). Flag leaves were harvested at different time points after heading (from T0 to T7). Changes in chlorophyll contents in primary leaves were measured through spectrophotometry after extraction (black square, A,B) (see [27]). Chlorophyll contents at the tip, middle and base of primary leaves were estimated using SPAD measurements. Chlorophyll contents in flag leaves were measured by SPAD (black circle, C) and spectrophotometry (black square, C). The data presented are the mean ± SD of four biological replicates. DAS (days after sowing); GDD °C (growing degree days in °C); T (harvesting time). Seedling experiment was performed twice showing similar results.
Agronomy 07 00015 g001
Figure 2. Metabolite changes during primary leaf senescence of plants grown under low (LN) or high nitrate (HN) conditions. Values for each metabolite were first measured as peak area in GC-MS analyses normalized according to the ribitol internal standard and to the mg FW (see Supplementary Data Set 1). ANOVA and Newman-Keuls (SNK) comparisons were performed in order to select the metabolites whose relative contents significantly changed with leaf senescence. Only these significantly different metabolites are presented in the figure. The Log2 Fold changes from L3 were then calculated independently for LN and HN leaves on the mean of eight biological repeats. The values range from low (blue) to high (red) metabolite-relative content compared to the youngest leaf (L3). The scale bar of red and blue shades ranges from −3 to +3. Class 1 represents metabolites decreased during leaf senescence, Class 2 metabolites accumulated during senescence, Class 3 metabolites accumulated in LN leaves and decreased in HN leaves during leaf senescence and Class 4 metabolites decreased in LN leaves and increased in HN leaves during leaf senescence. Asterisks identify amino acids.
Agronomy 07 00015 g002
Figure 3. Heat map representation of the metabolite distribution in the three L1, L2 and L3 leaves of barley seedlings grown under LN and HN conditions. Figure 3 uses the same Log2 Fold change values and the same false colour presentation as used in Figure 2 to represent the relative metabolite distribution in the three L1, L2 and L3 leaves of LN or HN plants. Only metabolites significantly different with senescence are shown. As in Figure 3, only senescence effect is presented, as normalization to L3 was performed separately on HN plants and on LN plants. The values range from low (blue) to high (red) metabolite-relative content compared to the youngest leaf (L3). The scale bar of red and blue shades ranges from −3 to +3. The stage of leaf senescence is schematically indicated by shades of colours from yellow (more senescent old leaf) to green (less senescent young leaf).
Agronomy 07 00015 g003
Figure 4. Heat map representation of the metabolite distribution in the three T1, T3 and T5 leaves of barley plants grown in the field. Metabolite concentrations were determined as the peak area in GC-MS analyses normalized to ribitol and to sample mg fresh weight (see Supplementary Data Set 2). The Log2 of the ratios of the mean of the metabolite contents in each leaf relative to the youngest (T1) leaf were used to represent the metabolite distribution as a heat map. The shades of red or blue colours represent values ranging from −3 to 3 according to the scale bar. The stage of leaf senescence is schematically indicated by shades of colours from yellow (more senescent old leaf) to green (less senescent young leaf). The Log2 Fold changes from T1 were calculated on the mean of four biological repeats. Only significant metabolites are presented. Significance was tested using ANOVA and Newman-Keuls (SNK) comparisons.
Agronomy 07 00015 g004
Figure 5. Primary leaf metabolite changes in low nitrate conditions (LN) compared to high nitrate (HN) conditions. Values for each metabolite were first measured as peak area normalized to the ribitol internal standard and to the mg FW (see Supplementary Data Set 1). The Log2 of the fold changes in LN leaves from HN leaves were calculated for each leaf L1, L2 and L3. Data used to calculate the Log2 Fold changes are the mean of eight biological repeats. The values go from low (blue) to high (red) metabolite-relative contents in LN leaves compared to HN leaves. The scale bar of red and blue shades range from −5 to +5. Only metabolites significantly different in LN leaf compared to HN leaf are shown. Significance was determined on the normalized peak areas using T-test (n = 8; p < 0.05).
Agronomy 07 00015 g005

