Article

Molecular Characterizations of Kenyan Brachiaria Grass Ecotypes with Microsatellite (SSR) Markers

1
Biosciences Eastern and Central Africa‐International Livestock Research Institute (BecA‐ILRI) Hub, P.O. Box 30709, Nairobi 00100, Kenya
2
Kenya Agricultural and Livestock Research Organization (KALRO), P.O. Box 57811, Nairobi 00200, Kenya
*
Author to whom correspondence should be addressed.
Agronomy 2017, 7(1), 8; https://doi.org/10.3390/agronomy7010008
Submission received: 24 October 2016 / Accepted: 18 January 2017 / Published: 9 February 2017

Abstract

:
Brachiaria grass is an emerging forage option for livestock production in Kenya. Kenya lies within the center of diversity for Brachiaria species, thus a high genetic variation in natural populations of Brachiaria is expected. Overgrazing and clearing of natural vegetation for crop production and nonagricultural uses and climate change continue to threaten the natural biodiversity. In this study, we collected 79 Brachiaria ecotypes from different parts of Kenya and examined them for genetic variations and their relatedness with 8 commercial varieties. A total of 120 different alleles were detected by 22 markers in the 79 ecotypes. Markers were highly informative in differentiating ecotypes with average diversity and polymorphic information content of 0.623 and 0.583, respectively. Five subpopulations: International Livestock Research Institute (ILRI), Kitui, Kisii, Alupe, and Kiminini differed in sample size, number of alleles, number of private alleles, diversity index, and percentage polymorphic loci. The contribution of within-the-individual difference to total genetic variation of Kenyan ecotype population was 81%, and the fixation index (FST = 0.021) and number of migrant per generation (Nm = 11.58) showed low genetic differentiation among the populations. The genetic distance was highest between Alupe and Kisii populations (0.510) and the lowest between ILRI and Kiminini populations (0.307). The unweighted neighbor-joining (NJ) tree showed test ecotypes grouped into three major clusters: ILRI ecotypes were present in all clusters; Kisii and Alupe ecotypes and improved varieties grouped in clusters I and II; and ecotypes from Kitui and Kiminini grouped in cluster I. This study confirms higher genetic diversity in Kenyan ecotypes than eight commercial varieties (Basilisk, Humidicola, Llanero, Marandú, MG4, Mulato II, Piatá and Xaraés) that represent three species and one three-way cross-hybrid Mulato II. There is a need for further collection of local ecotypes and their morphological, agronomical, and genetic characterizations to support Brachiaria grass breeding and conservation programs.

1. Introduction

Brachiaria grass is one of the most important tropical grasses distributed throughout the tropics, especially in Africa [1]. The genus Brachiaria consists of about 100 documented species of which 7 perennial species of African origin have been used for pasture production in South America, Asia, South Pacific, and Australia [2]. It has high biomass production potential and produces nutritious herbage resulting in increased livestock productivity [3,4]. Brachiaria is adapted to drought and low-fertility soils, sequesters carbon through its large root system, enhances nitrogen use efficiency, and subsequently minimizes eutrophication and greenhouse gas emissions [5,6,7,8]. Brachiaria plays important roles in soil erosion control and ecological restoration. Brachiaria species have been an important component of sown pastures in humid lowlands and savannas of tropical America, with current estimated acreage of 99 million hectares in Brazil alone [9].
In Africa, the evaluations of Brachiaria species for pasture improvement started during the 1950s. These researches focused on B. brizantha, B. decumbens, B. mutica, and B. ruziziensis for forage production, agronomy (establishment, drought, cutting intervals, and fertilizers), compatibility with herbaceous and tree legumes, nutritive values, and their benefit to ruminant production. These studies concluded the suitability and broader adaptation of several Brachiaria species to different agroecological zones in Africa [10]. However, these practices were not widespread because of ample communal grazing lands, limited realization on roles of sown pasture in the livestock production, subsistence animal farming, and low government priority to pasture development. Recently, the mounting demand for livestock products in Africa has renewed interest of farmers, researchers, development agencies, and government organizations on forages, particularly in species with good adaptability to climate change such as Brachiaria grass. Therefore, there has been multiple repatriations of Brachiaria grass to Africa in the form of hybrids and improved landraces [11,12]. These materials have shown positive performance in terms of biomass production, improved forage availability and livestock productivity in Kenya and Rwanda. These results have revealed Brachiaria as an ideal forage option for the livestock farmers in East Africa.
Despite high popularity, the Brachiaria acreage in Africa is low and relies on a few varieties that were developed for tropical Americas and Australia. Within a short period of introduction, some of these varieties have shown susceptibility to pests and diseases, raising question on the expansion of Brachiaria acreage in Africa with these varieties. There is therefore a need for an Africa-based Brachiaria improvement program to develop varieties that are tolerant to biotic and abiotic stress for different environmental conditions. Germplasms of broad genetic base is the prerequisite for any crop improvement. The best approach to increase genetic variations in apomictic species such as Brachiaria is tapping natural variations from the center of diversity. Since the 1950s, multiple missions were undertaken in Africa to collect Brachiaria germplasms, with a current inventory of 987 accessions of 33 known Brachiaria species [13]. Considering distribution of Brachiaria in Africa and size of the continent, the number of samples available in collection is definitely non-exhaustive and warrants further collection efforts. However, the existence of these genetic resources in Africa is continuously threatened by overgrazing and clearing of vegetation for crop production and nonagricultural uses and adverse effects of climate change.
Kenya is located within a region that represents a center of diversity for genus Brachiaria. Therefore, high natural variation is expected among Brachiaria populations in Kenya. This study aimed to create a collection of local Brachiaria ecotypes in Kenya, assess their genetic diversity using microsatellite markers, and examine their genetic relationships with eight commercial cultivars. The study will broaden geographical coverage and/or genetic base of the global Brachiaria collection and provide invaluable information for Brachiaria improvement and conservation programs.

2. Results

2.1. Descriptive Statistics for Simple Sequence Repeat (SSR) Markers

Descriptive statistics for all marker sets were computed (Table 1). The major allele frequency ranged from 0.2405 (Brz3002) to 0.8228 (Brz0076) with a mean of 0.5184. The number of different alleles ranged from 3 (Brz0029) to 10 (Brz0130) with a mean of 5.45. The genetic diversity averaged to 0.6225 with a range of 0.3169–0.8021. Similarly, the polymorphic information content (PIC) ranged from 0.3087 (Brz0076) to 0.8384 (Brz3002) with a mean of 0.5825.

2.2. Population Diversity Indices

The population diversity indices for five ecotype populations from Kenya were summarized (Table 2). The International Livestock Research Institute (ILRI) population had highest number of different alleles, and the Alupe population had the least. The number of private alleles was highest for the ILRI population and the lowest for Kisii population. The information index ranged from 0.408 to 0.887 with a mean of 0.599. The observed heterozygosity was higher than expected for all populations. The percentage polymorphic loci ranged from 46.47% (Kitui) to 86.87% (ILRI).

2.3. Genetic Diversity and Relationships

The pairwise genetic distance and population matrix of Nie genetic identity were calculated (Table 3). The genetic distance was highest between Alupe and Kitui populations (0.510), whereas it was the lowest between ILRI and Kiminini populations (0.307). Similarly, genetic identity was the highest between ILRI and Kiminini populations (0.636) and the lowest between Alupe and Kitui populations (0.235). The principal coordinate analysis (PCoA) plot of ecotypes from five populations showed no distinct clustering pattern (Figure 1). The first two principal coordinates explained 18.27% of the total genetic variation within the test ecotypes. Specifically, the first and second coordinates explained 10.85% and 7.42% of the total genetic variation, respectively. However, an unweighted neighbor-joining tree of 79 ecotypes and 8 commercial cultivars showed them grouped into three distinct clusters (Figure 2). Cluster I included 50 ecotypes from all five populations and six cultivars, cluster II included 21 ecotypes from three populations (Alupe, ILRI, and Kisii) and two cultivars, and cluster III included 8 ecotypes, all from the ILRI population.

2.4. Analysis of Molecular Variance (AMOVA)

The partitioning of the total variation in population at different levels was estimated with AMOVA (Table 4). Within-the-individual difference contributed highest (81%) to total variation followed by among-individual difference (17%) and among-population differences (2%). The fixation index (FST) and number of immigration per generation (Nm) for study populations were 0.021 and 11.585, respectively.

3. Discussion

The genetic complexity, primarily apomictic mode of reproduction, and abundant natural variations in Africa urge for a two-pronged approach (selection and breeding) for improving Brachiaria grass in Africa. All-inclusive germplasm base with documented variations are prerequisite for the effective breeding programs. This study collected 79 Brachiaria ecotypes in Kenya and documented their genetic variations using microsatellite markers.
The PIC values for 22 SSR markers averaged to 0.5825, suggesting markers were capable of differentiating 79 Kenyan Brachiaria ecotypes. The PIC value in this study is within the range reported by Silva et al. [14], Jungmann et al. [15], and Vigan et al. [16], but was lower than that found by Jungmann et al. [17] and Pessoa-Filho et al. [18]. Similarly, the average numbers of allele detected per loci (5.45) was in the range reported by Silva et al. [14], Jungmann et al. [15], and Vigan et al. [16], but was about half and one-third of that reported by Jungmann et al. [17] and Pessoa-Filho et al. [18], respectively. However, these comparisons between studies may not be conclusive due to differences in types and number of germplasms and markers used among studies.
The analysis of the distributions of alleles across populations is important for explaining genetic diversity and population relationships [19]. Private alleles are important in plant breeding and conservation as they are present only in a single population among a broader collection of populations [20]. Five ecotypes populations of Kenya were different for private alleles, with the highest number of private alleles in the ILRI population and the least in the Kiminini population. Such variations in the private alleles among populations most likely was the effect of the number of individuals per population, which ranged from 3 to 60 individuals. Although no information was available on species composition of each population, it is likely the presence of multiple species resulting in a high number of private alleles in some populations. Irrespective of populations, HO was higher than HE, indicating mixing of previously isolated populations. This is consistent with the human involvement in moving planting materials and outcrossing nature of some Brachiaria species, for example, B. ruziziensis.
The study population varied in genetic distance and genetic identity coefficients. The highest genetic distance between Alupe and Kitui populations can be explained by the wider geographical distance between these two locations (675 km), but the genetic distance between other populations could not be associated to geographical proximity. Reports are available on forage research, including seed production of B. ruziziensis in Kitale, Kenya [21,22], and involvement of Kenya Agricultural Research Institute and Kenya Seed Company in the past in production and trading of B. ruziziensis seeds [23]. It is likely that some of these Brachiaria seeds might have reached farmers’ fields and other research stations in Kenya, including the ILRI, and afterwards naturalized in the wild. If this hold true, a low genetic distance (0.307) between the ILRI and Kiminini (20 km away from Kitale) populations could be because of shared genetic materials in early days.
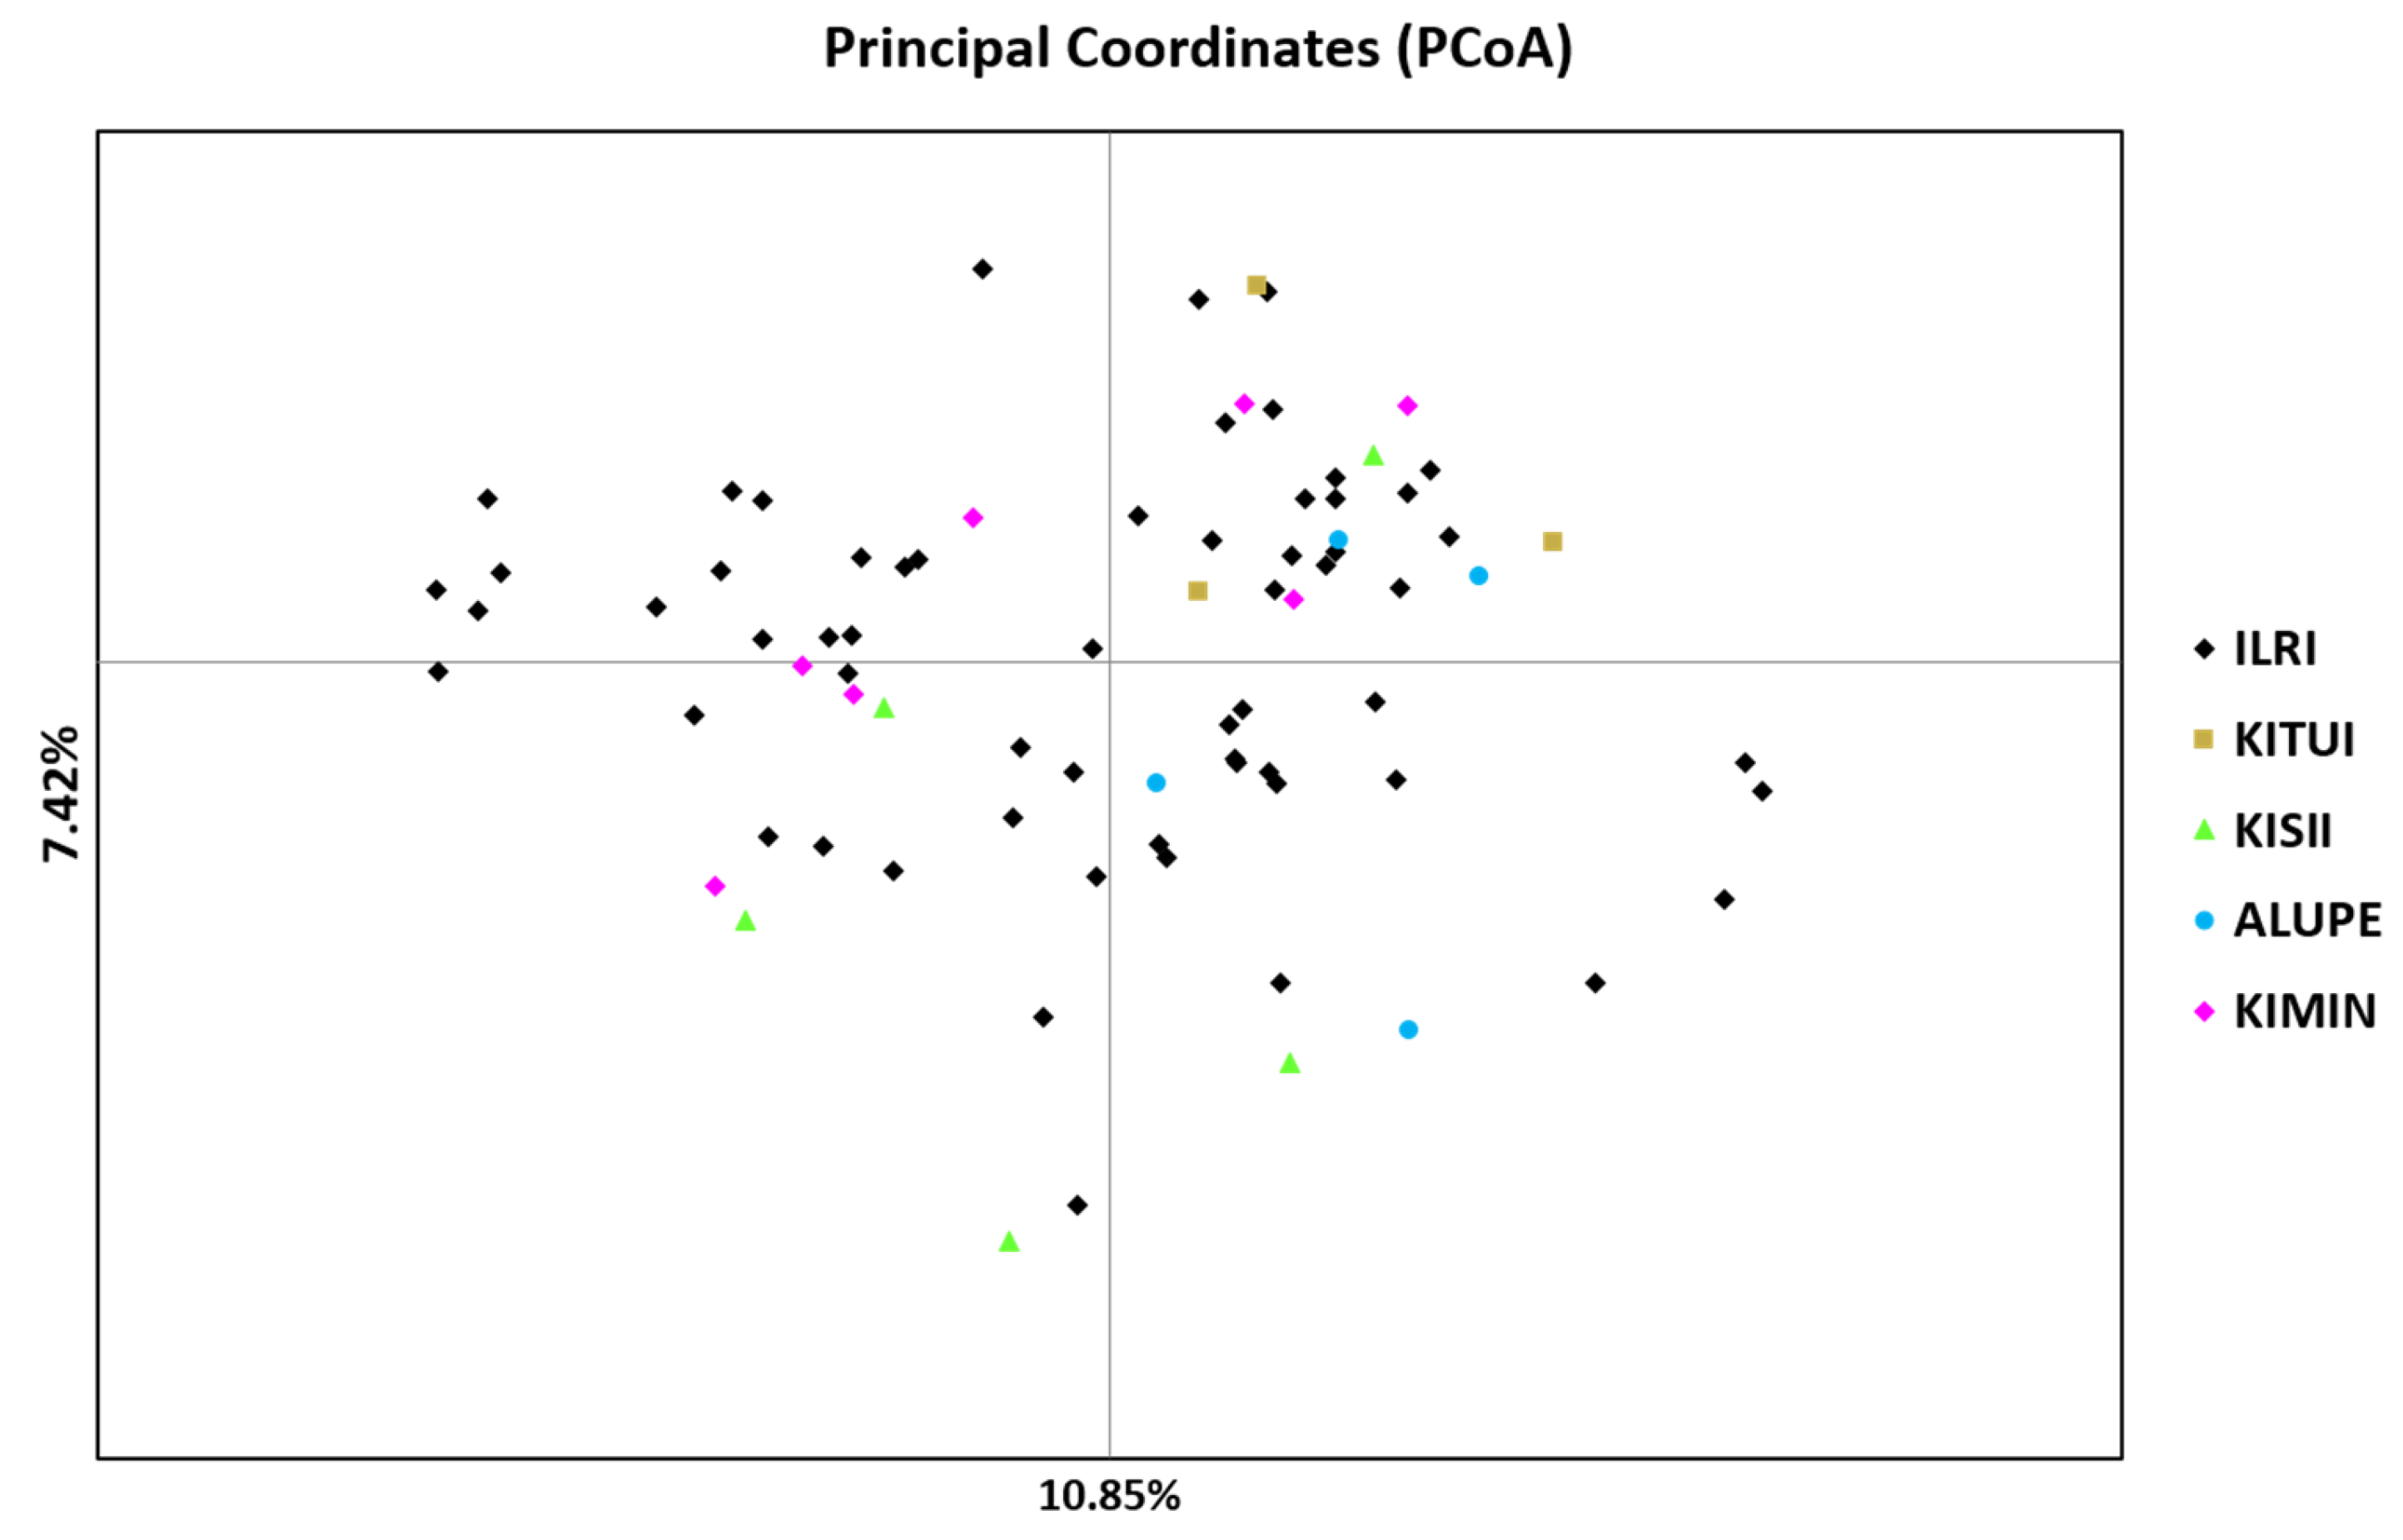
The contribution of within-individual difference to total variation was 81%, whereas among-the-individual and among-populations differences contributed 17% and 2%, respectively (Table 5). These observations were in agreement with Vigna et al. [16] and Pessoa-Filho et al. [18], who reported high contributions of within-the-accession/individual differences to total variation in B. brizantha (84%) and B. ruziziensis (88%) populations. Similarly, Garcia et al. [24] and Azevedo et al. [25] reported 73% and 65% of total variation attributed to within species or cluster, respectively. However, Jungmann et al. [26] reported 44% of the variation in B. humidicola accessions as being due to the subdivision of the germplasms into five groups. The FST and effective number of migrants per generation (Nm) values of 0.021 and 11.580 indicated a relatively low genetic differentiation among populations [27] and relatively high level of gene flow among the Kenyan ecotypes populations [28], respectively. A low genetic differentiation among the study populations could be associated with apomictic mode of reproduction, variable ploidy causing meiotic anomalies leading to reduced pollen fertility, and dispersal of seeds by migratory herbivorous and human activities such as hay transportation for feeding animals [16,26,29,30,31,32]. Polyploid plants are effective colonizers that can occupy pioneer habitats and generate individuals that are able to exploit new niches or outcompete progenitor species, whereas apomictic polyploid plants can fix heterosis [16,26,30].
This study is an effort to build a collection of Brachiaria ecotypes in Kenya and identify the potential values of these genetic resources in the Brachiaria breeding program. It is important to acknowledge some methodological limitations of this study while inferring population genetic parameters such as unequal and/or small sample sizes (3–60 individuals per population), unknown species and ploidy status of ecotypes, and dominant scoring scheme used in recording SSR fragments. The current Brachiaria taxonomy is far from satisfactory and the problem of generic identity, and species composition across entire taxa needs to be undertaken [1,22]. Application of robust genetic markers and bioinformatics procedures in genetic analysis of Brachiaria spp. have been constrained by a limited understanding of Brachiaria genetics, cytogenetic and reproductive biology, and unavailability of reference genome. The agricultural and environmental importance of Brachiaria has recently spurred several studies on Brachiaria, including sequencing of B. ruziziensis genome. Therefore, Kenyan ecotypes collected in this study should be conserved and characterized further with the advent of new genomics and bioinformatics tools developed for species with complex genome.
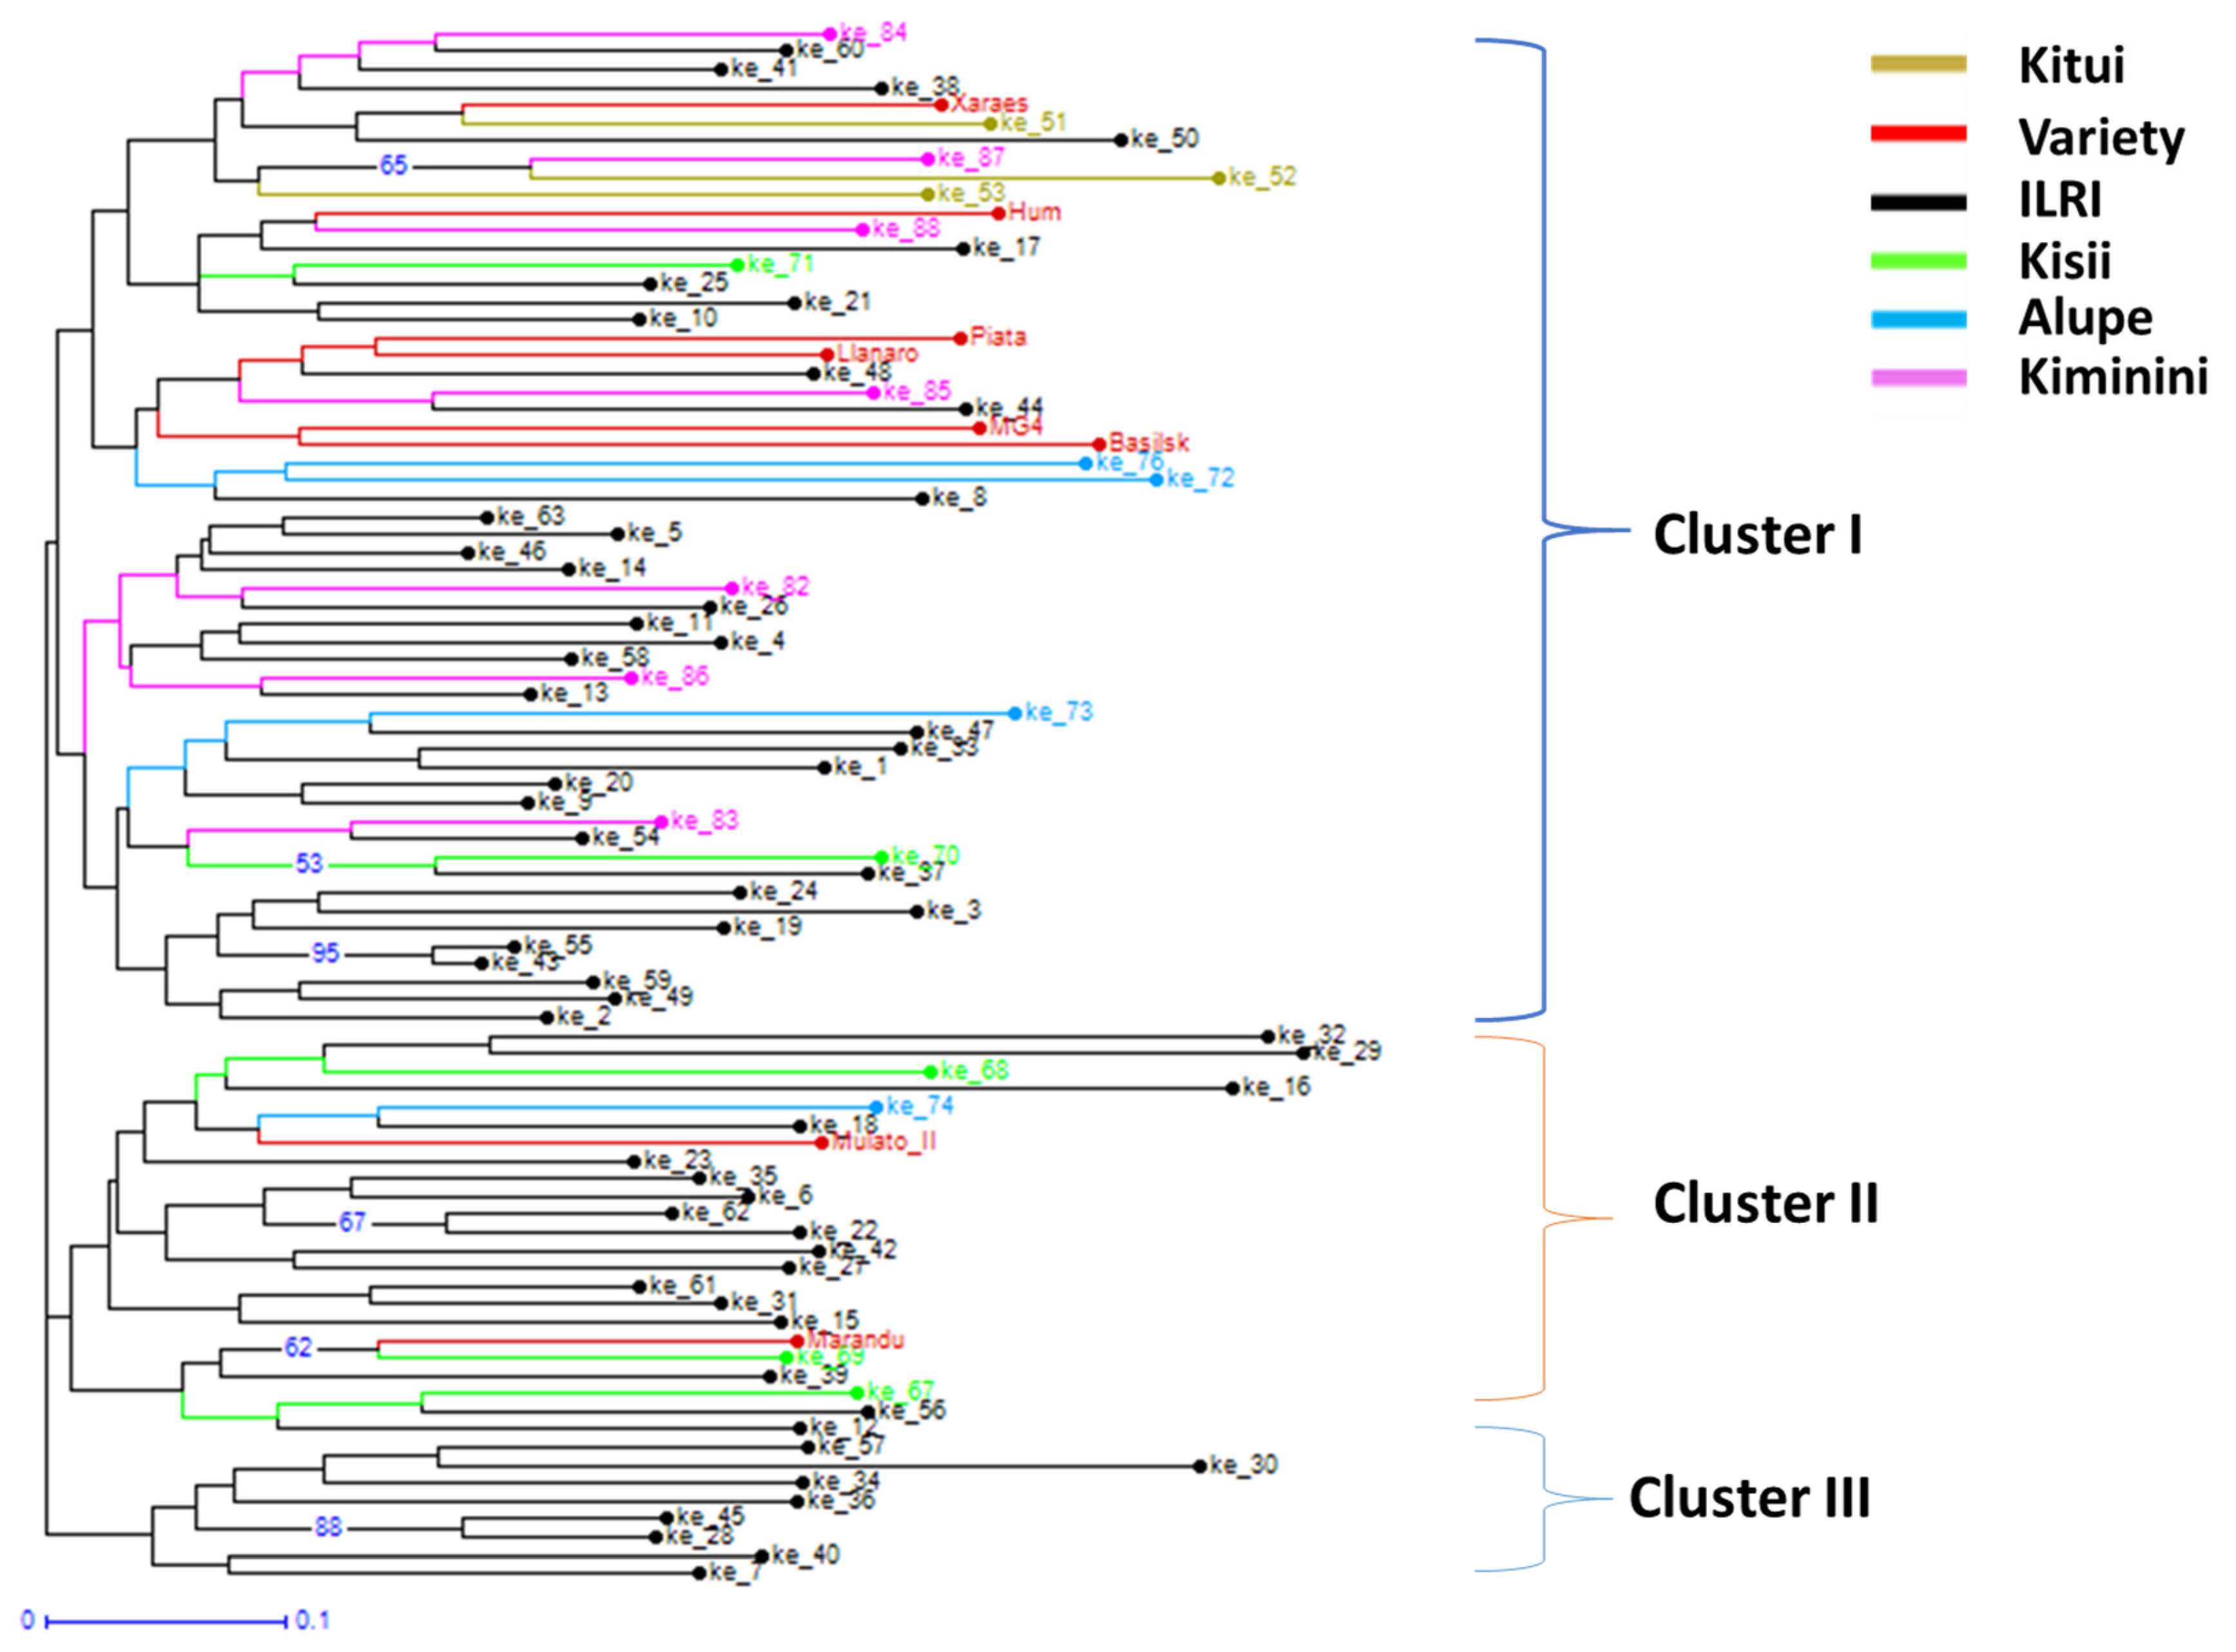
This is among the very first studies of this century in sub-Saharan Africa that involved collection of local Brachiaria ecotypes from different parts of Kenya and examination of their genetic differences using microsatellite markers. The genetic diversity data revealed that ecotypes, though representing a few locations of Kenya, contained much more diversity than currently available 8 improved Brachiaria varieties, which represent three species (B. brizantha, B. decumbens, and B. humidicola) and three-way cross-hybrid Mulato II (B. brizantha × B. decumbens × B. ruziziensis). These results clearly indicate a need for (I) further collection of local ecotypes in Kenya and other east and central African countries that represent center of diversity of Brachiaria species to enrich the Brachiaria genepool in the gene bank collections; (II) genetic characterization of local ecotypes and currently available gene bank materials to understand diversity and ascertain the need for further collection; and (III) morphological characterization of available genetic resource to identify/develop varieties suitable for different production environments.

4. Experimental Section

4.1. Source of Plant Materials

Whole plant sample of 79 Brachiaria ecotypes were collected from five different parts of Kenya: Alupe (n = 4), ILRI Farm (n = 60), Kiminini (n = 7) Kisii (n = 5), and Kitui (n = 3) in 2013 and 2014, and maintained in field at forage research plots of International Livestock Research Institute (ILRI), Headquarters, Nairobi, Kenya. Seeds of eight improved varieties—B. decumbens cv. Basilisk, B. brizantha cvs. Marandú, Xaraés, Piatá, and MG4, B. humidicola cvs. Humidicola and Llanero (Marangatu Sementes, Ribeirão Preto, São Paulo, Brazil), and Mulato II (Tropical Seeds, Coral Springs, FL, USA)—were planted in a variety demonstration plot at the ILRI Campus. About 4-week-old leaves were harvested from all 79 ecotypes and 8 varieties (one sample/variety), freeze-dried, and stored at −80° prior to DNA extraction. Ecotypes from all location but the ILRI Campus were collected jointly by Biosciences eastern and central and Africa-International Livestock Research Institute (BecA-ILRI) Hub and Kenya Agricultural and Livestock Research Organization (KALRO). The collection details are summarized in Table 6.

4.2. Genomic DNA Extraction

The DNA was extracted using the cetyl-trimethyl ammonium bromide (CTAB) [33] method with slight modifications. About 150 mg of the young leaves were cut into small pieces, ground in liquid nitrogen, and added with 800 μL of 2% CTAB buffer. The suspension was transferred into clean microfuge tubes and incubated at 65 °C for 30 min, followed by incubation at room temperature for 5 min and centrifuged at 3500 rpm for 10 min. After centrifugation, 400 μL of supernatant was transferred into new microfuge tubes and 400 μL of chloroform iso-amyl alcohol (24:1) was added to each tube and mixed by inversion for 10 min. Tubes were spun at 3500 rpm for 10 min, aqueous phase was transferred to clean microfuge tubes, and 400 μL of chloroform iso-amyl alcohol (24:1) was added again to each tube and spun for 10 min at 1100 rpm; this process was repeated twice. After the final centrifugation, the DNA was precipitated in 300 μL of cold isopropanol (100%) and inverted about 50 times to facilitate the mixing and precipitation, and incubated overnight at −20 °C. The following day, the microfuge tubes were removed from the freezer, thawed and spun at 3500 rpm at 4 °C for 20 min. The isopropanol was decanted and the genomic DNA pellet was air-dried. The DNA pellet was rinsed with 300 μL of 70% (w/v) ethanol and dissolved in 100 μL of low-salt TE buffer containing 3 μL of 10 mg/mL of 1% RNase solution and incubated in a water bath at 45 °C for 90 min. DNA quality and quantity were checked by 0.8% agarose gel (w/v) and NanoDrop Spectrophotometer. The genomic DNA was adjusted to the final concentration of 20 ng/μL and stored at 4 °C for PCR amplification.

4.3. PCR Amplification and Genotyping

The genomic DNA was amplified using AccuPower®PCRPreMix with Bioneer negative dye (Bioneer, Alameda, CA, USA). A reaction volume of 10 μL containing 0.4 μL MgCl2 (final concentration of 2 mM MgCl2), 0.4 μL each of forward and reverse primers labeled with different fluorescent dyes (6-FAM (blue), VIC (green), NED (black), and PET(red)), 2 μL template DNA (20 ng/μL), and 6.8 μL of sterile distilled water was used for PCR amplification. A total of 22 SSR markers (Table 5) initially developed for B. ruziziensis with the proven transferability to other species were used in this study [14]. The PCR conditions were: initial denaturation for 5 min at 94 °C followed by 35 cycles at 94 °C for 30 s, 57 °C for 60 s, 72 °C for 2 min, and final extension at 72 °C for 10 min. The amplicons’ integrity was checked using agarose gel electrophoresis in 2% agarose gel (w/v) stained with 2.5 μL of GelRed solution. The agarose gel images were visualized under Ultra-Violet and the digital image was captured. The size of amplified fragments was estimated comparing with 1 kb DNA ladder (Thermo Fisher Scientific, Waltham, MA, USA). The SSR fragment sizes and allele variations in the repeats were assessed by capillary electrophoresis of amplicons and sequencing of the amplified loci. The multiplexed PCR products were mixed with 8.87 μL Hi-Di-formamide and 0.135 μL fluorescent-labeled GeneScan™ LIZ size standard (Applied Biosystems, Foster City, CA, USA) in a 96-well microtiter plate. The mixed products were denatured at 95 °C for 3 min and snap-chilled on ice for 5 min to avoid the formation of double-strand DNA. The products were loaded to Applied Biosystems 3730xl DNA Analyzer (Applied Biosystems, Foster City, CA, USA).

4.4. Data Analysis

The allele sizes generated by all 22 SSR markers on 79 ecotypes and 8 commercial varieties were scored using GeneMapper v4.1 software (Applied Biosystems, Foster City, CA, USA). Since the information on ploidy levels of test ecotypes was not available, SSR fragments were analyzed following a dominant scoring scheme, as used for other polyploidy species [34,35,36,37]. ALS-Binary and Allelobin software [38,39] were used to convert allelic data to binary data (0, 1) where 0 and 1 represent absence and presence of an allele, respectively. Statistical analysis of allelic and binary data was performed using PowerMarker v.3.25 [40] to obtain total number of alleles per locus, allele size range, genetic diversity and heterozygosity, and frequency-based genetic distances were calculated using shared alleles distance matrix. The population diversity indices (e.g., number of alleles, private alleles, and effective alleles per locus, Shannon Information index, and observed and expected heterozygosity) were calculated using GenAIEx v.6.5 [41]. The same software was used to compute analysis of molecular variance (AMOVA), principal coordinate analysis (PCoA), and matrix of genetic distance. The Dice binary similarity coefficient [42] was used to generate the unweighted neighbor-joining tree (NJT) showing relationships among test genotypes in Darwin Software v6.0 [43].

5. Conclusions

Brachiaria is a native African grass which is widely distributed in Kenya. It is one of the most extensively cultivated forages in tropical Americas, Australia and East Asia. However the cultivation of Brachiaria for pasture production in Kenya and Africa in general has been recently initiated through the repatriation of Brachiaria in the form of hybrids and improved landraces from South America. Despite excellent herbage production performance and benefits to livestock productivity, some of these introduced materials have shown susceptibility to pests and diseases within a short period of establishment. It has raised serious concern on the expansion of Brachiaria acreage in Kenya urging the needs for the Africa based Brachiaria improvement program. This study with collection of 79 Brachiaria ecotypes from a few locations of Kenya and their genetic diversity analyses revealed the presence of substantial genetic variations among Kenyan ecotypes, and close genetic relationships among improved landraces and Hybrid Mulato II. This study suggests need for collecting more ecotypes from different agroecological regions of Kenya to broaden genetic bases of existing genebank collections, and their morphological, agronomical, and genetic characterizations to support Brachiaria grass breeding and conservation programs.

Acknowledgments

This project was supported by the BecA-ILRI Hub through the Africa Biosciences Challenge Fund (ABCF) program. The ABCF Program is funded by the Australian Department for Foreign Affairs and Trade (DFAT) through the BecA-CSIRO partnership; the Syngenta Foundation for Sustainable Agriculture (SFSA); the Bill & Melinda Gates Foundation (BMGF); the UK Department for International Development (DFID) and; the Swedish International Development Cooperation Agency (Sida). We are grateful to Marie Christine Dusingize and Jean de dieu Ayabagabo for their assistance in experiment and data analysis, respectively. Thanks are due to Monday Ahonsi for assistance in research planning and implementation.

Author Contributions

N.O., D.N., A.D. and S.G. conceived and designed the experiments; N.O., S.M. and W.K. performed experiment; N.O. and S.G. performed data analysis; N.O. and S.G. wrote manuscript, D.N., S.M., W.K. and A.D. reviewed manuscript and S.G. supervised all research work.

Conflicts of Interest

The authors declare no conflict of interest.

References

  1. Renvoize, S.A.; Clayton, W.D.; Kabuye, C.H.S. Morphology, taxonomy and natural distribution of Brachiaria (Trin.) Griseb. In Brachiaria: Biology, Agronomy, and Improvement; Miles, J.W., Maass, B.L., do Valle, C.B., Eds.; International Centre for Tropical Agriculture: Cali, Colombia, 1996; pp. 1–15. [Google Scholar]
  2. Miles, J.W.; Maass, B.L.; do Valle, C.B. Brachiaria: Biology, Agronomy, and Improvement; International Centre for Tropical Agriculture: Cali, Colombia, 1996; p. 288. [Google Scholar]
  3. Holmann, F.; Rivas, L.; Argel, P.J.; Perez, E. Impact of the adoption of Brachiaria grasses: Central America and Mexico. Livest. Res. Rural Dev. 2004, 16. Available online: http://www.lrrd.org/lrrd16/12/holm16098.htm (accessed on 21 January 2017). [Google Scholar]
  4. Jotee, D. Evaluation of the potential of some common forage germplasms in Mauritius. In Proceedings of the Third PANESA Workshop, Arusha, Tanzania, 27–30 April 1987; Dzowela, B.H., Ed.; ILCA: Addis Ababa, Ethiopia, 1988; pp. 81–90. [Google Scholar]
  5. Subbarao, G.V.; Nakahara, K.; Hurtado, M.P.; Ono, H.; Moreta, D.E.; Salcedo, A.F.; Yoshihashi, A.T.; Ishikawa, T.; Ishitani, M.; Ohnishi-Kameyama, M.; et al. Evidence for biological nitrification inhibition in Brachiaria pastures. Proc. Natl. Acad. Sci. USA 2009, 106, 17302–17307. [Google Scholar] [CrossRef] [PubMed]
  6. Arango, J.; Moreta, D.; Núñez, J.; Hartmann, K.; Domínguez, M.; Ishitani, M.; Miles, J.; Subbarao, G.; Peters, M.; Rao, I. Developing methods to evaluate phenotypic variability in biological nitrification inhibition (BNI) capacity of Brachiaria grasses. Trop. Grassl.-Forrajes Trop. 2014, 2, 6–8. [Google Scholar] [CrossRef]
  7. Moreta, D.E.; Arango, J.; Sotelo, M.; Vergara, D.; Rincón, A.; Ishitani, N.; Castro, A.; Miles, J.; Peters, M.; Tohme, J.; et al. Biological nitrification inhibition (BNI) in Brachiaria pastures: A novel strategy to improve eco-efficiency of crop-livestock systems and to mitigate climate change. Trop. Grassl.-Forrajes Trop. 2014, 2, 88–91. [Google Scholar] [CrossRef]
  8. Rao, I.; Ishitani, M.; Miles, J.; Peters, M.; Tohme, J.; Arango, J.; Moreta, D.E.; Lopez, H.; Castro, A.; Hoek, R.V.D.; et al. Climate-smart crop-livestock systems for smallholders in the tropics: Integration of new forage hybrids to intensify agriculture and to mitigate climate change through regulation of nitrification in soil. Trop. Grassl.-Forrajes Trop. 2014, 2, 130–132. [Google Scholar] [CrossRef]
  9. Jank, L.; Barrios, S.C.; do Valle, C.B.; Simeão, R.M.; Alves, G.F. The value of improved pastures to Brazilian beef production. Crop Pasture Sci. 2014, 65, 1132–1137. [Google Scholar] [CrossRef]
  10. Ndikumana, J.; de Leeuw, P.N. Regional experiences with Brachiaria: Sub-Saharan Africa. In Brachiaria: Biology, Agronomy, and Improvement; Miles, J.W., Maass, B.L., do Valle, C.B., Eds.; International Centre for Tropical Agriculture: Cali, Colombia, 1996; pp. 247–257. [Google Scholar]
  11. Maass, B.L.; Midega, A.O.; Mutimura, M.; Rahetlah, V.B.; Salgado, P.; Kabirizi, J.M.; Khan, Z.R.; Ghimire, S.; Rao, I.M. Homecoming of Brachiaria: Improved hybrids prove useful for African animal agriculture. E. Afr. Agric. For. J. 2015, 81, 1–78. [Google Scholar]
  12. Ghimire, S.; Njarui, D.; Mutimura, M.; Cardoso, J.; Johnson, L.; Gichangi, E.; Teasdale, S.; Odokonyero, K.; Caradus, J.; Rao, I.; et al. Climate-smart Brachiaria for improving livestock production in East Africa: Emerging opportunities. In Sustainable Use of Grassland Resources for Forage Production, Biodiversity and Environmental Protection; Vijaya, D., Srivastava, M., Gupta, C., Malaviya, D., Roy, M., Mahanta, S., Singh, J., Maity, A., Ghos, P., Eds.; Range Management Society of India; ICAR-Indian Grassland and Fodder Research Institute: New Delhi, India, 2015; pp. 361–370. [Google Scholar]
  13. Keller-Grein, G.; Maass, B.L.; Hanson, J. Natural variation in Brachiaria and existing germplasm collection. In Brachiaria: Biology, Agronomy, and Improvement; Miles, J.W., Maass, B.L., do Valle, C.B., Eds.; International Centre for Tropical Agriculture: Cali, Colombia, 1996; pp. 16–42. [Google Scholar]
  14. Silva, P.I.; Martins, A.M.; Gouvea, E.G.; Pessoa-Filho, M.; Ferreira, M.E. Development and validation of microsatellite markers for Brachiaria ruziziensis obtained by partial genome assembly of Illumina single-end reads. BMC Genom. 2013, 14, 17. [Google Scholar] [CrossRef] [PubMed]
  15. Jungmann, L.; Vigna, B.B.Z.; Paiva, J.; Sousa, A.C.B.; do Valle, C.B.; Laborda, P.R. Development of microsatellite markers for Brachiaria humidicola (Rendle) Schweick. Conserv. Genet. Resour. 2009, 1, 475–479. [Google Scholar] [CrossRef]
  16. Vigna, B.B.Z.; Jungmann, L.; Francisco, P.M.; Zucchi, M.I.; do Valle, C.B.; Souza, A.P. Genetic diversity and population structure of the Brachiaria brizantha germplasm. Trop. Plant Biol. 2011, 4, 157–169. [Google Scholar] [CrossRef]
  17. Jungmann, L.; Sousa, A.C.B.; Paiva, J.; Francisco, P.M.; Vigna, B.B.Z.; do Valle, C.B. Isolation and characterization of microsatellite markers for Brachiaria brizantha (Hochst. ex A. Rich.) Stap. Conserv. Genet. 2009, 10, 1873–1876. [Google Scholar] [CrossRef]
  18. Pessoa-Filho, M.; Azevedo, A.L.S.; Sobrinho, F.S.; Gouvea, E.G.; Martins, A.M.; Ferreira, M.E. Genetic diversity and structure of Ruzigrass germplasm collected in Africa and Brazil. Crop Sci. 2015, 55, 2736–2745. [Google Scholar] [CrossRef]
  19. Szpiech, Z.A.; Jakobsson, M.; Rosenberg, N.A. ADZE: A rarefaction approach for counting alleles private to combinations of populations. Bioinformatics 2008, 24, 2498–2504. [Google Scholar] [CrossRef] [PubMed]
  20. Kalinowski, S.T. Counting alleles with rarefaction: Private alleles and hierarchical sampling designs. Conserv. Genet. 2004, 5, 539–543. [Google Scholar] [CrossRef]
  21. Boonman, J.G. Experimental studies on seed production of tropical grasses in Kenya part 2 tillering and heading on in seed crops of eight grasses. Neth. J. Agric. Sci. 1971, 19, 237–249. [Google Scholar]
  22. Boonman, J.G. East Africa’s Grasses and Fodders: Their Ecology and Husbandry; Kluwer Academic Publishers: Dordrecht, The Netherlands, 1993; p. 343. [Google Scholar]
  23. Wandera, J.L. Forage research and production in western Kenya. In A Review of Agricultural Practices and Constraints in the North Rift Valley Province; Rees, D.J., Nkonge, C., Wandera, J.L., Eds.; Kenya Agricultural Research Institute: Nairobi, Kenya, 1997; pp. 169–187. [Google Scholar]
  24. Garcia, M.; Vigna, B.B.Z.; Sousa, A.C.B.; Jungmann, L.; Cidade, F.W.; Toledo-Silva, G.; Francisco, P.M.; Chiari, L.; Carvalho, M.A.; Karia, C.T.; et al. Molecular genetic variability, population structure and mating system in tropical forages. Trop. Grassl.-Forrajes Trop. 2013, 1, 25–30. [Google Scholar] [CrossRef]
  25. Azevedo, A.L.S.; Costa, P.P.; Machado, M.A.; de Paula, C.M.P.; Sobrinho, F.S. High degree of genetic diversity among genotypes of the forage grass Brachiaria ruziziensis (Poaceae) detected with ISSR markers. Genet. Mol. Res. 2011, 10, 3530–3538. [Google Scholar] [CrossRef] [PubMed]
  26. Jungmann, L.; Vigna, B.B.Z.; Boldrini, K.R.; Sousa, A.C.B.; do Valle, C.B.; Resende, R.M.S.; Pagliarini, M.S.; Zucchi, M.I.; de Souza, A.P. Genetic diversity and population structure analysis of the tropical pasture grass Brachiaria humidicola based on microsatellites, cytogenetics, morphological traits, and geographical origin. Genome 2010, 53, 698–709. [Google Scholar] [PubMed]
  27. Wright, S. The genetical structure of populations. Ann Eugen 1951, 15, 323–354. [Google Scholar] [CrossRef] [PubMed]
  28. Vucetich, J.A.; Waite, T.A. Is one migrant per generation sufficient for the genetic management of fluctuating populations? Anim. Conserv. 2000, 3, 261–266. [Google Scholar] [CrossRef]
  29. Do Valle, C.B.; Savidan, Y.H. Genetics, cytogenetic and reproductive biology of Brachiaria. In Brachiaria: Biology, Agronomy, and Improvement; Miles, J.W., Maass, B.L., do Valle, C.B., Eds.; International Centre for Tropical Agriculture: Cali, Colombia, 1996; pp. 147–163. [Google Scholar]
  30. Harrington, K.C.; Beskow, W.B.; Hodgson, J. Recovery and viability of seeds ingested by goats. N. Z. Plant Prot. 2011, 64, 75–80. [Google Scholar]
  31. Leitch, A.R.; Leitch, I.J. Genomic plasticity and the diversity of polyploid plants. Science 2008, 320, 481–483. [Google Scholar] [CrossRef] [PubMed]
  32. Malo, J.E.; Suárez, F. Herbivorous mammals as seed dispersers in a Mediterranean dehesa. Oecologia 1995, 104, 246–255. [Google Scholar] [CrossRef]
  33. Doyle, J.J.; Doyle, J.L. Isolation of plant DNA from fresh tissue. Focus 1990, 12, 13–15. [Google Scholar]
  34. Cordeiro, G.M.; Pan, Y.; Henry, R.J. Sugarcane microsatellites for the assessments of genetic diversity in sugarcane germplasm. Plant Sci. 2003, 165, 181–189. [Google Scholar] [CrossRef]
  35. Cidade, F.W.; Vigna, B.B.Z.; de Sauza, F.H.D.; Valls, J.F.M.; Dall’Agnol, M.; Zucchi, M.I.; de Sauza-Chies, T.T.; Sauza, A.P. Genetic variation in polyploid forage grass: Assessing the molecular genetic variability in the Paspalum genus. BMC Genet. 2013, 14, 50. [Google Scholar] [CrossRef] [PubMed]
  36. Lu, X.; Zhou, H.; Pan, Y.B.; Chen, C.Y.; Zhu, J.R.; Chen, P.H.; Li, Y.R.; Cai, Q.; Chen, R.K. Seggregation analysis of microsatellite (SSR) markers in sugarcane polyploids. Genet. Mol. Res. 2015, 14, 18384–18395. [Google Scholar] [CrossRef] [PubMed]
  37. Schie, S.; Chaudhary, R.; Debener, T. Analysis of a complex polyploid plant genome using molecular markers: Strong evidence for segmental allooctoploidy in garden Dahalias. Plant Genome 2014, 7, 3. [Google Scholar] [CrossRef]
  38. Prasanth, V.P.; Chandra, S. ALS-Binary. A Program for Converting Allele Size in Microsatellite Markers into 0–1 (Binary) Data; ICRISAT: Hyderabad, India, 1997. [Google Scholar]
  39. Prasanth, V.P.; Chandra, S.; Jayashree, B.; Hoisington, D. AlleloBin. A Software for Allele Binning of Microsatellite Markers Based on the Algorithms of Idury and Cardon; ICRISAT: Hyderabad, India, 1997. [Google Scholar]
  40. Liu, K.; Muse, S.V. PowerMarker: An integrated analysis environment for genetic marker analysis. Bioinformatics 2005, 21, 2128–2129. [Google Scholar] [CrossRef] [PubMed]
  41. Peakall, R.; Smouse, P.E. GenAlEx 6.5: Genetic analysis in Excel. Population genetic software for teaching and research—An update. Bioinformatics 2012, 28, 2537–2539. [Google Scholar] [CrossRef] [PubMed]
  42. Perrier, X.; Jacquemoud-Collet, J.P. DARwin: Dissimilarity Analysis and Representation for Windows, Version 5.0.157. Computer Program. 2006. Available online: http://darwin.cirad.fr/darwin (accessed on 21 January 2017).
  43. Dice, LR. Measures of the amount of ecologic association between species. Ecology 1945, 26, 297–302. [Google Scholar] [CrossRef]
Figure 1. Principal coordinates analysis (PCoA) biplot showing the clustering of the 79 Brachiaria ecotypes from different parts of Kenya (orange = Kitui, black = International Livestock Research Institute (ILRI) Farm, green = Kisii, blue = Alupe, and purple = Kiminini).
Agronomy 07 00008 g001
Figure 2. Unweighted neighbor-joining tree using the simple matching dissimilarity coefficient based on 22 microsatellite loci for all collected 79 Brachiaria ecotypes (ke_1 to ke_88) collected from different parts of Kenya (orange = Kitui, red = commercial cultivars, black = ILRI Farm, green = Kisii, blue = Alupe, and purple = Kiminini), and 8 commercial cultivars (B. brizantha cvs. Marandú, MG4, Piatá, and Xaraés; B. decumbens cv. Basilisk; B. humidicola cvs. Humidicola and Llanero; and three-species-ways cross-hybrid Mulato II.
Agronomy 07 00008 g002
Table 1. Descriptive statistics for microsatellite markers.
MarkerMAFNDAIPIC
Brz00120.430450.71010.6670
Brz00280.430450.65210.5892
Brz00290.620330.51240.4327
Brz00670.405150.74190.7061
Brz00760.822830.31690.3087
Brz00870.48180.69830.6649
Brz00920.810150.33520.3240
Brz01000.468440.66140.6052
Brz01150.367170.80210.7829
Brz01170.607660.53710.4676
Brz01180.506340.55730.4613
Brz01220.455760.67390.6225
Brz01300.3418100.79470.7706
Brz01490.772250.38740.3679
Brz01560.645640.53650.497
Brz02030.367170.76850.7379
Brz02120.582380.61950.5906
Brz02130.746840.41920.3932
Brz02140.430470.74320.7138
Brz02350.405140.74380.709
Brz30020.240550.8540.8384
Brz30090.468450.63130.5643
Mean0.51845.450.62250.5825
MAF = minor allele frequency, NDA = number of different alleles, I = Shannon’s genetic diversity, and PIC = polymorphic information content.
Table 2. Summary of population diversity indices averaged over 22 simple sequence repeat (SSR) markers.
PopulationNNaNpAeIHoHePL (%)
ILRI603.6330.8332.210.8870.760.49986.67
KITUI31.2330.1331.1710.4080.4170.26146.67
KISII51.5670.0671.3960.4980.5370.31556.67
ALUPE41.60.01331.4860.5240.5440.33360.00
KIMIN72.1330.11.8330.6780.6470.4170.00
Mean15.82.0330.229261.6190.5990.5810.36464.00
N = number of samples, Na = number of different Alleles, Np = number of private alleles, Ae = number of effective alleles, I = Shannon’s information Index, Ho = observed heterozygosity, He = expected heterozygosity and PL = percentage polymorphic loci.
Table 3. Pairwise genetic distance based on shared allele (left) and population matrix of Nie genetic identity (right) among the Brachiaria ecotype population from Kenya.
PopulationAlupeILRIKimininiKisiiKitui
Alupe-0.4620.3880.3230.235
ILRI0.393-0.6360.4400.327
Kiminini0.4480.307-0.3990.299
Kisii0.4670.3920.446-0.247
Kitui0.5100.4410.4130.503-
Table 4. Analysis of molecular variance among and within populations, and within individuals for Brachiaria accessions based on 22 SSR loci.
SourceDegree of FreedomSum of SquaresMean SquaresEstimated VarianceVariation (%)p Values
Among Populations443.44010.8600.1552%0.023
Among Individual74619.6498.3741.21517%0.001
Within Individual79469.5005.9435.94381%0.001
Total1571132.5897.313100%
FST = 0.021 and Nm = 11.580
FST = Fixation index; Nm = Number of migration per generation.
Table 5. Microsatellite markers, primer sequences, annealing temperature (Ta), allele sizes, and number of repeat motifs (adapted from Silva et al. [14]).
MarkerForward PrimerReverse PrimerTa (°C)Allele Size (bp)Repeat Motif
Brz0012ACTCAAACAATCTCCAACACGCCCACAAATGGTGAATGTAAC59160(AT)8
Brz0028CATGGACAAGGAGAAGATTGATGGGAGTTAACATTAGTGTTTTT57158(TA)8
Brz0029TTTGTGCCAAAGTCCAAATAGTATTCCAGCTTCTTCTGCCTA56150(AG)14
Brz0067TTAGATTCCTCAGGACATTGGTCCTATATGCCGTCGTACTCA51156(AT)9
Brz0076CCTAGAATGCGGAAGTAGTGATTACGTGTTCCTCGACTCAAC58151(AT)7
Brz0087TTCCCCCACTACTCATCTCAAACAGCACACCGTAGCAAGT60243(GA)9
Brz0092TTGATCAGTGGGAGGTAGGATGAAACTTGTCCCTTTTTCG54251(AT)6
Brz0100CCATCTGCAATTATTCAGGAAAGTTCTTGGTGCTTGACCATT56256(AT)11
Brz0115AATTCATGATCGGAGCACATTGAACAATGGCTTTGAATGA59252(AT)6
Brz0117AGCTAAGGGGCTACTGTTGGCGCGATCTCCAAAATGTAAT60260(TA)5
Brz0118AGGAGGTCCAAATCACCAATCGTCAGCAATTCGTACCAC57252(CT)11
Brz0122CATTGCTCCTCTCGCACTATCTGCAGTTAGCAGGTTGGTT57253(CA)6
Brz0130TCCTTTCATGAACCCCTGTACATCGCACGCTTATATGACA57248(CT)14
Brz0149GCAAGACCGCTGTTAGAGAACTAACATGGACACCGCTCTT57245(AT)11
Brz0156GCCATGATGTTTCATTGGTTTTTTGCACCTTTCATTGCTT58260(AC)7
Brz0203CGCTTGAGAAGCTAGCAAGTTAGCCTTTTGCATGGGTTAG57301(GA)8
Brz0212ACTCATTTTCACACGCACAACGAAGAATTGCAGCAGAAGT57301(CA)5
Brz0213TGAAGCCCTTTCTAAATGATGGAACTAGGAAGCCATGGACA57296(CA)7
Brz0214TCTGGTGTCTCTTTGCTCCTTCCATGGTACCTGAATGACA57309(AT)8
Brz0235CACACTCACACACGGAGAGACATCCAGAGCCTGATGAAGT57298(TC)9
Brz3002GCTGGAATCAGAATCGATGAGAACTGCAGTGGCTGATCTT57160(AAT)7
Brz3009AGACTCTGTGCGGGAAATTAACTTCGCTTGTCCTACTTGG55151(AAT)10
Table 6. Collection details of Kenyan Brachiaria ecotypes included in the diversity assessment.
EcotypeSpeciesStatusLocationAlt. (m a.s.l.)Lat. (S)Lon. (E)Collection Year
ke_1Brachiaria spp.WildILRI Farm17611.2708536.722042013
ke_2Brachiaria spp.WildILRI Farm17831.2709136.722002013
ke_3Brachiaria spp.WildILRI Farm17871.2711736.722062013
ke_4Brachiaria spp.WildILRI Farm18051.2715236.722122013
ke_5Brachiaria spp.WildILRI Farm17981.2730636.722552013
ke_6Brachiaria spp.WildILRI Farm18041.2730736.723842013
ke_7Brachiaria spp.WildILRI Farm18101.2729236.723902013
ke_8Brachiaria spp.WildILRI Farm18131.2728136.724042013
ke_9Brachiaria spp.WildILRI Farm18151.2726936.724362013
ke_10Brachiaria spp.WildILRI Farm18141.2726236.724832013
ke_11Brachiaria spp.WildILRI Farm18081.2727536.725172013
ke_12Brachiaria spp.WildILRI Farm18711.2707736.722242013
ke_13Brachiaria spp.WildILRI Farm18141.2707636.725322013
ke_14Brachiaria spp.WildILRI Farm18701.2707336.725622013
ke_15Brachiaria spp.WildILRI Farm18521.2708836.726972013
ke_16Brachiaria spp.WildILRI Farm18511.2709136.727022013
ke_17Brachiaria spp.WildILRI Farm18401.2713536.727162013
ke_18Brachiaria spp.WildILRI Farm18361.2715236.726992013
ke_19Brachiaria spp.WildILRI Farm18321.2721436.726492013
ke_20Brachiaria spp.WildILRI Farm18301.2723636.726052013
ke_21Brachiaria spp.WildILRI Farm18281.272536.725922013
ke_22Brachiaria spp.WildILRI Farm18231.2726836.725472013
ke_23Brachiaria spp.WildILRI Farm18251.2726336.725202013
ke_24Brachiaria spp.WildILRI Farm18251.2727336.725192013
ke_25Brachiaria spp.WildILRI Farm18251.2726136.725602013
ke_26Brachiaria spp.WildILRI Farm18331.2721336.726602013
ke_27Brachiaria spp.WildILRI Farm18351.2719636.726732013
ke_28Brachiaria spp.WildILRI Farm18431.2714436.727092013
ke_29Brachiaria spp.WildILRI Farm18521.2710936.727132013
ke_30Brachiaria spp.WildILRI Farm18761.2706736.725852013
ke_31Brachiaria spp.WildILRI Farm18371.2708636.722102014
ke_32Brachiaria spp.WildILRI Farm18821.2708436.722082014
ke_33Brachiaria spp.WildILRI Farm18541.2725236.722352014
ke_34Brachiaria spp.WildILRI Farm18391.2726436.724242014
ke_35Brachiaria spp.WildILRI Farm18261.2727436.725182014
ke_36Brachiaria spp.WildILRI Farm18241.2723336.726122014
ke_37Brachiaria spp.WildILRI Farm18301.2725736.725672014
ke_38Brachiaria spp.WildILRI Farm18351.2716536.726922014
ke_39Brachiaria spp.WildILRI Farm18471.2710136.727182014
ke_40Brachiaria spp.WildILRI Farm18711.2707736.725362014
ke_41Brachiaria spp.WildILRI Farm18661.270836.722102014
ke_42Brachiaria spp.WildILRI Farm18591.2713436.722132014
ke_43Brachiaria spp.WildILRI Farm18421.2728536.722492014
ke_44Brachiaria spp.WildILRI Farm18351.2724236.722302014
ke_45Brachiaria spp.WildILRI Farm18291.273436.723022014
ke_46Brachiaria spp.WildILRI Farm18281.2731536.723812014
ke_47Brachiaria spp.WildILRI Farm18291.2727136.724272014
ke_48Brachiaria spp.WildILRI Farm18281.2726936.724542014
ke_49Brachiaria spp.WildILRI Farm18161.2726136.725502014
ke_50Brachiaria spp.WildILRI Farm18291.271736.726882014
ke_51Brachiaria spp.WildKitui1163NANA2014
ke_52Brachiaria spp.WildKitui1163NANA2014
ke_53Brachiaria spp.WildKitui1163NANA2014
ke_54Brachiaria spp.WildILRI Farm17541.2777836.388212014
ke_55Brachiaria spp.WildILRI Farm18571.270836.722062014
ke_56Brachiaria spp.WildILRI Farm18561.2728436.722042014
ke_57Brachiaria spp.WildILRI Farm18441.2716236.722082014
ke_58Brachiaria spp.WildILRI Farm18401.2720336.722172014
ke_59Brachiaria spp.WildILRI Farm18221.273236.723572014
ke_60Brachiaria spp.WildILRI Farm18221.2732136.723582014
ke_61Brachiaria spp.WildILRI Farm18101.2728136.725062014
ke_62Brachiaria spp.WildILRI Farm18211.2717636.726782014
ke_63Brachiaria spp.WildILRI Farm18241.2715536.726972014
ke_67Brachiaria spp.WildKisii17500.6857534.789782014
ke_68Brachiaria spp.WildKisii17500.6848634.789142014
ke_69Brachiaria spp.WildKisii17500.6848434.789102014
ke_70Brachiaria spp.WildKisii17500.6847134.788962014
ke_71Brachiaria spp.WildKisii17500.6847334.788842014
ke_72Brachiaria spp.WildAlupe12000.4976634.124802014
ke_73Brachiaria spp.WildAlupe12000.4978134.124802014
ke_74Brachiaria spp.WildAlupe12000.4984734.123192014
ke_76Brachiaria spp.WildAlupe12000.4985534.122842014
ke_82Brachiaria spp.WildKiminini17500.8910434.913682014
ke_83Brachiaria spp.WildKiminini17500.8910234.913782014
ke_84Brachiaria spp.WildKiminini17500.8912634.913382014
ke_85Brachiaria spp.WildKiminini17500.8914434.913102014
ke_86Brachiaria spp.WildKiminini17500.8913934.913022014
ke_87Brachiaria spp.WildKiminini17500.891334.912722014
ke_88Brachiaria spp.WildKiminini17500.8913134.912642014

