Article

Residues Management Practices and Nitrogen-Potassium Fertilization Influence on the Quality of Pineapple (Ananas comosus (L.) Merrill) Sugarloaf Fruit for Exportation and Local Consumption

by
Elvire Line SOSSA
1,*,
Codjo Emile AGBANGBA
2,
Sènan Gbèmawonmèdé Gwladys Stéfania ACCALOGOUN
3,
Guillaume Lucien AMADJI
1,
Kossi Euloge AGBOSSOU
4 and
Djidjoho Joseph HOUNHOUIGAN
3
1
Faculty of Agronomic Sciences, Research Unit Eco-Pedology, University of Abomey-Calavi, Laboratory of Soil Sciences, 01 P.O. Box 526, Cotonou, Benin
2
Laboratory of Biomathematics and Forests Estimations, Faculty of Agronomic Sciences, University of Abomey-Calavi, 03 P.O. Box 2819, Cotonou, Benin
3
Laboratory of Nutrition and Alimentary Sciences, Faculty of Agronomic Sciences, University of Abomey-Calavi, 01 P.O. Box 526, Cotonou, Benin
4
Laboratory of Hydraulic and Water Control, Faculty of Agronomic Sciences, University of Abomey-Calavi, 01 BP 526, Cotonou, Benin
*
Author to whom correspondence should be addressed.
Agronomy 2017, 7(2), 26; https://doi.org/10.3390/agronomy7020026
Submission received: 25 December 2016 / Revised: 1 March 2017 / Accepted: 10 March 2017 / Published: 2 April 2017

Abstract

:
Heterogeneity in pineapple fruit quality explains the low export volume of fruits from Benin to international markets. This work aims to investigate the influences of residues mulching or burying and N-K fertilization on (1) fresh fruit juice quality and the proportion of fruit meeting European standards and (2) fruit acceptability for fresh local consumption, as well as to identify morphological characteristics most related to fruit chemical quality attributes. The experimental design was a split-plot with three replications, where the main factor was N-K fertilization (T1 = 1.6 N and 1.6 K, T2 = 5.8 N and 6.6 K, T3 = 10 N and 11.6 K, T4 = 1.6 N and 11.6 K, T5 = 10 N and 1.6 K in g·plant−1) and the sub-plot factor was mulching with pineapple residues (no mulching = 0, surface mulching = 10, buried = 10 in t·ha−1). The results suggested that residues mulching and N-K fertilization has improved the percentage of fruit meeting European standards and local acceptability. The treatments T2B (T2 + burying) and T4B (T4 + burying) gave a higher proportion of fruits meeting European standards and were also promising for producing highly acceptable fruits by local consumers. Finally, the results revealed that the ratios of crown length: fruit length, crown length: infructescence length and crown length: median diameter were significantly associated with fruit quality, which has not yet been reported.

1. Introduction

Pineapple (Ananas comosus (L.) Merr.) is a well-appreciated fruit all over the world [1] and is cultivated all around the tropical and subtropical regions for local consumption and international export. It plays an important role in the human diet and is a good source of fiber and micronutrients, especially vitamins and minerals [2].
Benin is a country in West Africa at the coast of the Atlantic Ocean, with a suitable climate for growing tropical fruits including pineapple [3]. Pineapple production is of great importance for the Beninese economy and has contributed for 13 billion CFA francs to the Gross Domestic Product (GDP) in 2006. This contribution represented in this year about 1.2% of the total GDP and 4.3% of the agricultural GDP [4]. In 2009, it was estimated that less than 2% of the production was exported to Europe, which is far below the export potential, given that Benin has favorable production systems, coastal access, and well appreciated cultivars. This low export volume is due to the quality of the Beninese pineapple, which is heterogeneous [5]. A recent study on pineapple supply chains in Benin revealed that heterogeneity in quality attributes such as fruit weight, taste, firmness and flesh translucency was a constraint to the success of the chain [6]. Homogenous, good taste and heavier fruits are selected and bought by merchants in the producers’ field who sold in domestic, border or regional markets (Kraké, Nigeria, Burkina Faso, Niger and Mali) [7]. Hence, cultural practices that guarantee good and homogeneous quality of fruit need to receive considerable attention. Heavy planting material and flowering induction at the optimum time can increase homogeneity in pineapple quality attributes [6]. The heterogeneity in pineapple quality might also be explained by the use of various fertilization practices, which influence the plant growth and consequently its yield and its quality [8,9,10]. Nitrogen and potassium fertilizers have a high impact on pineapple fruit yield, as well as organoleptic and sanitary quality [11]. Chemical fertilization represents a large part of total production costs [12]. Moreover, the nearly exclusive use of mineral fertilizers causes soil acidification [13]. Alternative cultivation practices that could reduce the use of N and K chemical fertilizers should be investigated. The positive effect of organic fertilizers (such as Mucuna puriens, Panicum maximum and compost of pineapple residues) and black polyethylene on pineapple fruit quality attributes were reported by some authors [12,14,15,16,17]. Pineapple residues are usually removed and burned in situ prior to being returned to the soil [18], leading to the loss of nutrients and environment pollution [19]. In Benin, pineapple is dominated by conventional monocropping with agrochemical inputs and little or no use of residues [20]. In this study, we hypothesize that the use of crop residues could reduce the need for N and K fertilizers for pineapple crops. The integration of crop residues to mineral fertilizer would improve fruit quality, meeting local acceptability and European standards as well. Stringent international regulations on quality norms and standards pose significant challenges to many small-scale pineapple producers and exporters in Benin [7]. These norms include the crown length: fruit length ratio, which should be between 50% and 150% [21]. So far, no literature has reported the relation between the crown length: Fruit length ratio and quality attributes. This work investigates (1) the influences of residues mulching or burying and N-K fertilization on fresh fruit juice quality and on the proportion of fruit meeting European standards, (2) the influences of residues mulching or burying and N-K fertilization on fruit acceptability for fresh local consumption, and (3) morphological characteristics most related to fruit chemical quality attributes.

2. Materials and Methods

2.1. Study Area

The study was carried out in the Atlantic department in southern Benin (1°59′ N and 2°15′ E). In this area, average annual rainfall is 1200 mm. The dominant soil type is a low-desaturated lateritic soil, commonly called “terre de barre” [22]. The soil physico-chemical analysis indicates that this is a soil of silty-clay-sandy texture, well drained, with an average pH of 5.6 and a C/N ratio of 11.2. These characteristics meet the requirements of pineapple cultivation soil described by [23].

2.2. Experimental Design and Management

The field experiment was conducted between 10 November 2013 and 15 April 2015. The experimental design consisted of a split plot with 3 replications, the main factor was the nitrogen-potassium (N-K) fertilization at 5 levels in g·plant−1 (T1:1.6 N and 1.6 K, T2:5.8 N and 6.6 K, T3:10 N and 11.6 K, T4:1.6 N and 11.6 K, T5:10 N and 1.6 K) and the sub-plot factor was the use of fresh pineapple residues at 3 levels (surface mulching (M) at 10 t·ha−1, 10 t·ha−1 buried residues at 10 cm deep (B), and no mulching (NM)). Each plot had an area of 12 square meters and included 48 plants.
Following soil tillage and delimitation of experimental units, the fresh pineapple residues coming from the same field were cut into pieces 10–15 cm long and were applied using a hoe. Planting material of about 300 g was sorted and planted at a density of 41,500 plants per hectare; the distance between lines or between ridges was 60 cm and the distance between plants was 40 cm.
Urea (46% N), trisulfate of phosphorus (TSP: 46% P2O5) and potassium sulphate (K2SO4: 50% K2O, 45% SO3) were used as mineral fertilizers. Phosphorus was applied fourteen days after planting (DAP) at a dose of 100 kg·ha−1. Five treatments resulting from the combination of different doses of nitrogen (N) and potassium (K) were done in six phases. Thus, the rates of nitrogen and potassium to be applied were split respectively into five (5) and six (6) equal portions. The first application was done at 45 DAP (1/5N + 1/6K), the second at 90 DAP (1/5N + 1/6K), the third at 135 DAP (1/5N + 1/6K), the fourth at 180 DAP (1/5N + 1/6K), the fifth at 225 DAP (1/5N + 1/6K) and the sixth at 270 DAP (1/6K). Fertilizers were applied at the base of each plant. The maintenance of the plots was done by monthly weeding. Flowering induction was made twelve month after planting, with diluted calcium carbide. For this purpose, 1 kg of carbide was diluted in a 200-liter drum. Each plant received 50 cm3 of acetylene carbide during the cooler hours of the day (between 6 AM and 8 AM). The harvest took place five months after flowering induction.

2.3. Fruit Weight Attributes and Fresh Juice Physico-Chemical Measurements

The fruits were harvested in each experimental unit at C3 stage (yellow/orange on two thirds of the fruit surface) [24]. The weight of each fruit and crown were assessed using a brand (DH2-000050, ±0.0001, Zawiera, Tianjin, China). The measurements of median diameter, total fruit length, infructescence length and crown length were taken for each fruit with a tape and a ruler. Each fruit was then peeled and crushed. The obtained product was pressed, the fresh juice filtered, and the juice volume weighed. The total soluble solids (TSS) content of the juice was determined with the refractometer (HI96801, HANNA instruments, Bucharest, Romania) and the pH with the pH meter (HI96107, ±0.1 pH, HANNA instruments, Villafranca Padovana, Italy).
For each fruit, the crown length: fruit length ratio was calculated and associated with fruit weight and TSS for the determination of percentage of exportable pineapple fruits per treatment. Minimum quality criteria for fruits meeting European export standards include: the fruit weight should be between 0.70 and 2.75 kg, the crown length: fruit length ratio should be between 50% and 150% and the TSS should be at least 12° Brix [21].
The concentration of various sugars (sucrose, glucose, fructose, raffinose) and organic acids (oxalate, citrate, malate, propionate, lactic acid and formic acid) present in the fresh juice was determined using high performance liquid chromatography (HPLC) [25] on fruits harvested the same day for each experimental unit. The juice from each fruit was deducted with a syringe and filtered through a sterile filter (Sartorius Minisart) of 0.20 μm. The filtrate was collected in an Eppendorf tube of 2 mL. Solubles, sugars, and acids present in the juice were separated by liquid chromatography on a column SUPELCOGEL H of dimensions 30 cm × 7.8 mm. Twenty (20) microliters of juice was injected per sample into the system. The eluent used was sulfuric acid (5 mM). Each compound was identified from its retention time and quantified.

2.4. Panel of Tasters’ Selection and Fruit Sensory Characteristics Measurements

The evaluation of sensory characteristics of fresh pineapple pulp was made according to [26]. Initially, a group of 25 students from the University of Abomey-Calavi was selected and filtered based on their sensory acuity on elemental flavors. The examination consisted of asking them to identify the elemental flavors and the smells of the basic flavors, on coded samples of sugar solutions (sweet flavor), salt (salt flavor), lemon (acid flavor) and caffeine (bitter flavor). Thus, the sugar solution was prepared with sugar 10 g·kg−1; the saline solution with salt 2 g·kg−1; the acid solution with citric acid 0.4 g·kg−1; and the bitter solution with caffeine 0.5 g·kg−1. At the end of this step, 20 people were able to identify each of these solutions and were therefore selected.
After this first selection, the 20 tasters were subjected to an intensity notation test realized on five coded pineapple samples (purchased in the market) whose characteristics were known and different. The purpose of this step was to judge the sensitivity of each taster to different characteristics of pineapple fruits. They were asked to assess each sample by indicating the intensity of its sweet taste, its acid taste, its aroma, its fiber content and its acceptability, according to a scale with five categories (not at all, slightly, moderately, strongly, extremely). At the end of this test, 16 tasters had demonstrated superior performance and were selected for the test on the pineapple samples from the experimental test.
Fruits were harvested by experimental unit and their sensorial characteristics were evaluated by the selected and trained panel of tasters. Thus, a total of 16 samples, 15 corresponding to the 15 treatments of the experiment and one control (T0) (fruit purchased in the market), were evaluated.
Each fruit was peeled and cut into pieces. The samples were coded with three random digits. All samples were presented simultaneously to the tasters, in a random order. Each taster could taste a sample several times, and rinse his mouth with water before moving to another sample. The sensorial characteristics such as the sweetness, acidic taste, aroma, and fiber content were evaluated by an intensity notation test, using a scale with five categories (not at all, slightly, moderately, strongly, extremely). The overall acceptability was assessed with a nine-point hedonic scale, with nine representing the most acceptable. Two sections of the test were carried out on different days.

2.5. Statistical Analysis

A two-way ANOVA test for the split plot was performed on chemical characteristics of fresh juice quality and fruit weight attributes (juice yield, TSS, pH, sucrose, glucose, fructose, raffinose, oxalate, citrate, malate, propionate, formic acid, malic acid) using package agricolae in R software (version R.3.1.0, 2014, R Core Team, Vienna, Australia) [27]. The percentages of fruits meeting European standards was transformed into arcsine square root [28]. Proportions equal to 0 and 1 were replaced by (1/4n) and (1-(1/4n)) respectively, where n is the total number of fruits per net plot [28]. The normality [29] and homoscedasticity [30] conditions of model residues were checked for validation. Means were separated using the LSD test, with different LSD values being necessary for comparisons [31]. To evaluate fruit acceptability for fresh local consumption, a principal components analysis followed by a hierarchical classification was performed with the package FactoMineR on the sensory and physico-chemical characteristics of fruits. The chemical parameters were considered as supplementary quantitative variables, because they are directly related to sensory characteristics [32,33]. For each sensory and physico-chemical characteristics class, we measured the difference between the values for class and overall values. These statistics can be converted into a criterion called value-test, used to select the most characteristic variables [33,34]. The most characteristic variables of a class are those whose associated values are greater in absolute value than 2. Moreover, if this value test is positive for a variable, it has a high value in the class under consideration. In contrast, if the value is negative, the variable has a low value for the class. Linear regressions were performed between fruit weight attributes and physico-chemical characteristics. The conditions of normality [29] and homoscedasticity [35] of regression residues, residues independence [36] and linearity [37] were checked for the model validation.

3. Results

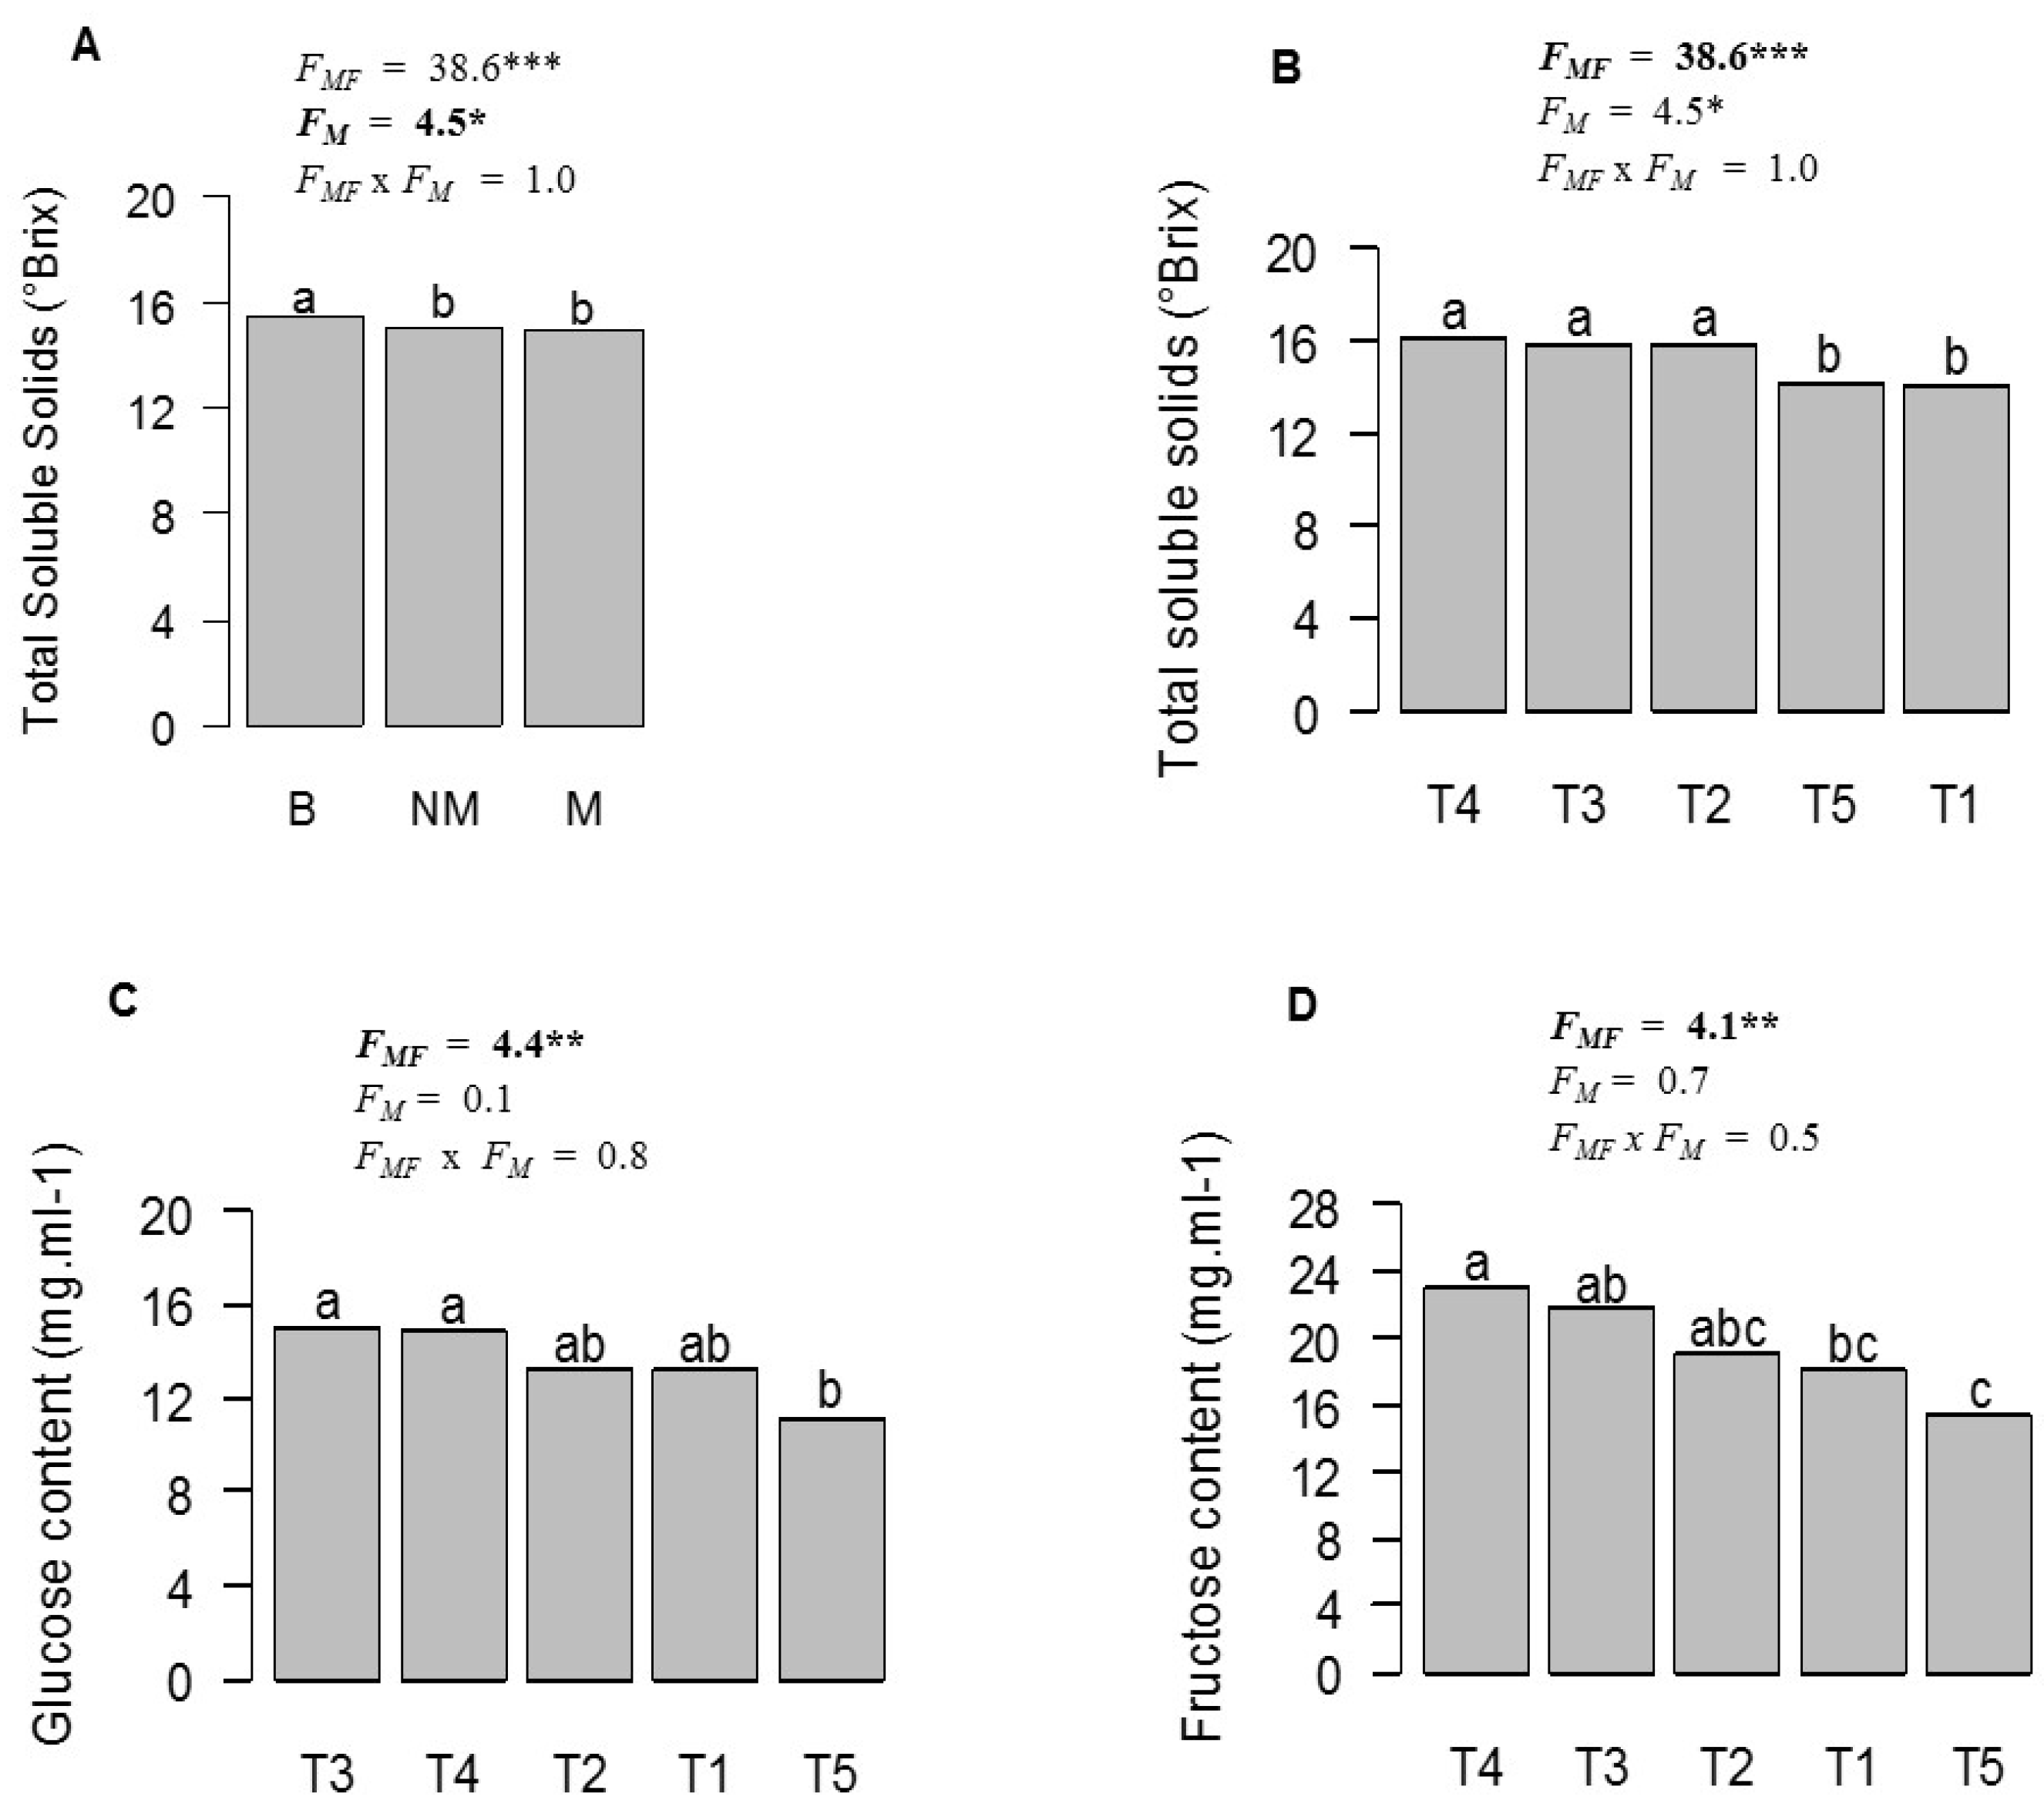
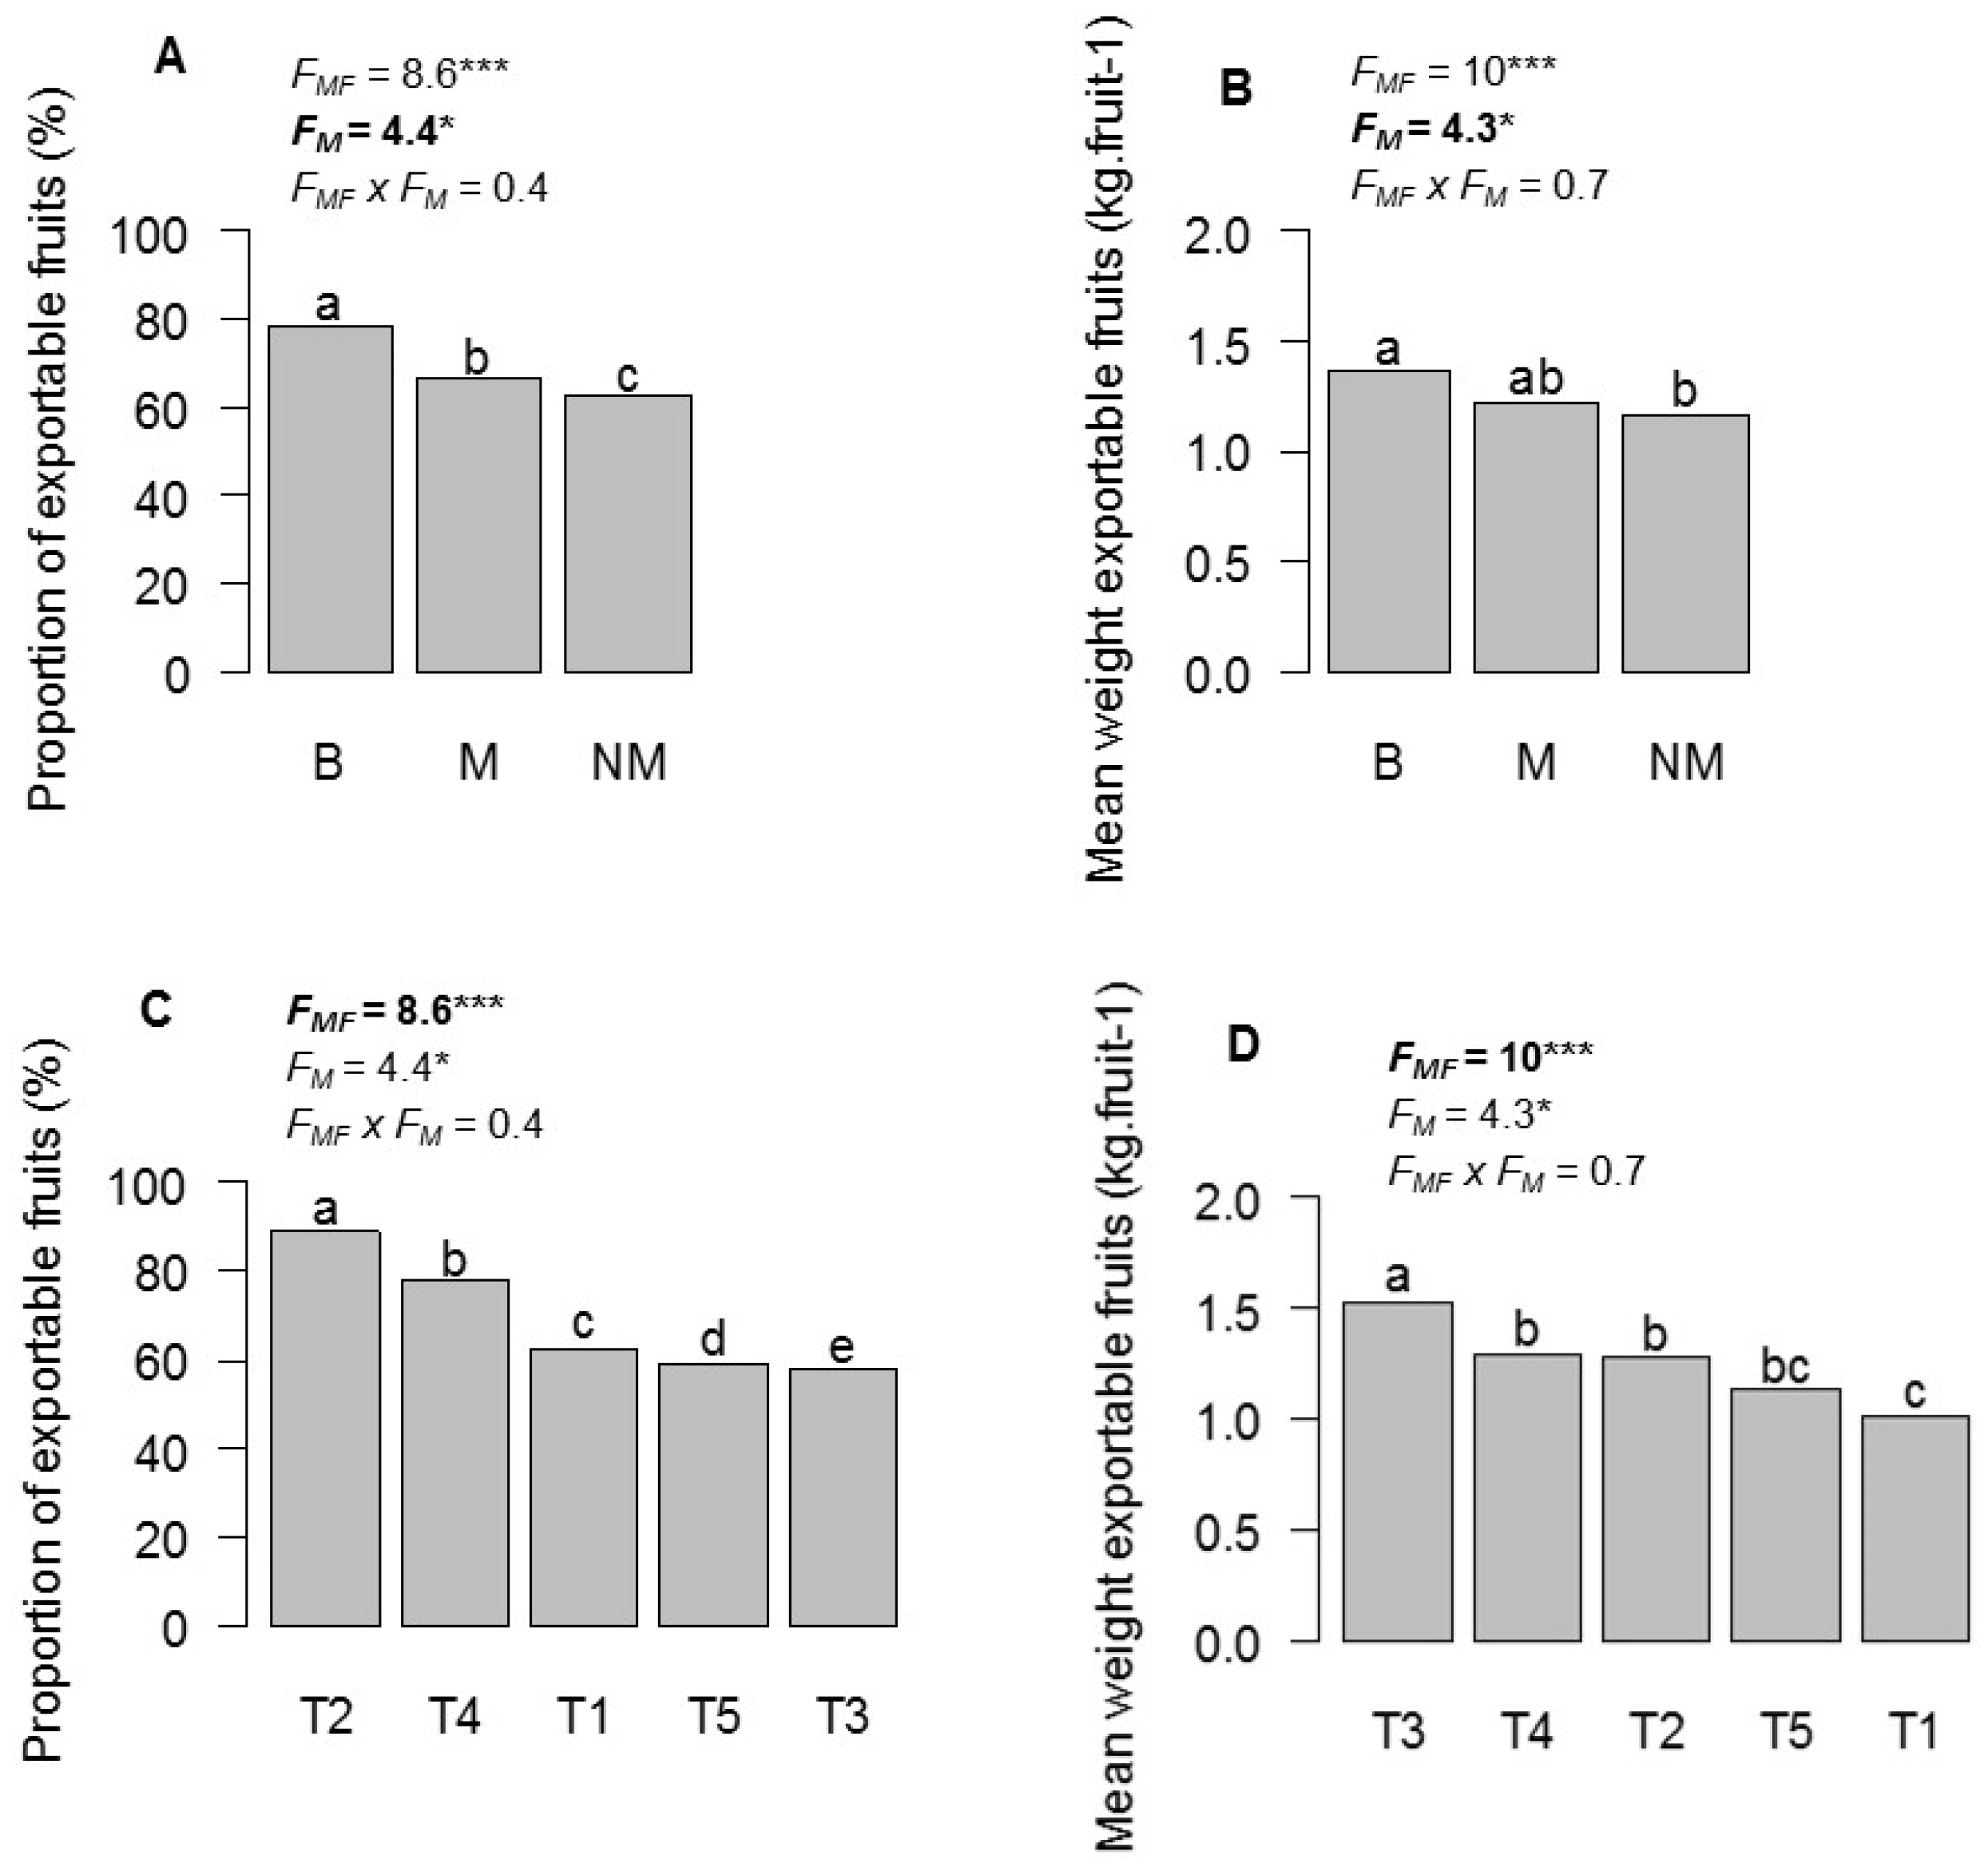
3.1. Influence of Mulching and N-K Fertilization on Pineapple Fresh Fruit Juice Quality and Proportion of Fruit Meeting European Standards

Significant effects of mulching and/or mineral fertilizer were observed on some fruit juice attributes (Figure 1). Mulching had significant effects on total soluble solids (TSS) (p = 0.020). Juice from pineapples with burying residues had more sweetness (15.5° ± 0.87° Brix) than from those with no mulching (15.1° ± 1.2° Brix) and mulching (14.9° ± 1.03° Brix) (Figure 1A). N-K fertilization had a significant effect on the TSS (p = 0.000), glucose (p = 0.007) and fructose (p = 0.009) content of juice. Treatments T4, T3 and T2 had the higher juice TSS (16.1° ± 0.5° Brix, 15.8° ± 0.7° Brix and 15.7° ± 0.5° Brix, respectively) whereas the lower TSS values were obtained with treatments T5 (10 N and 1.6 K) and T1 (1.6 N and 1.6 K) (respectively, 14.2° ± 0.5° Brix and 14° ± 0.5° Brix) (Figure 1B). Glucose content was higher with T3 and T4 (1.6 N and 11.6 K) (14.9 ± 2.2 mg·mL−1 and 14.81 ± 3.0 mg·mL−1, respectively), while the lower value (11.1 ± 2.8 mg·mL−1) was obtained with treatment T5 (Figure 1C). The highest and lowest values of fructose content were obtained respectively with treatments T4 (23 ± 7.3 mg·mL−1) and T5 (15.3 ± 3.4 mg·mL−1) (Figure 1D).
In terms of juice pH and organic acid, significant influences were observed with mulching and/or N-K fertilization (Figure 2). Mulching associated with N-K fertilization had a significant effect on the lactic acid content of juice (p = 0.006). We noticed indeed that higher lactic acid content was observed with the T5NM (treatment T5 + no mulching) (1.42 ± 0.28 mg·mL−1) and lower content with T1NM (treatment T1 + no mulching) (0.12 ± 0.12 mg·mL−1) (Figure 2A). Mulching had significantly influenced juice citrate content (p = 0.05). The citrate content was higher with the influence of no mulching (86.7 ± 16.5 mg·mL−1), followed respectively by mulching (78.9 ± 16.7 mg·mL−1) and burying residues (73.2 ± 16.5 mg·mL−1) (Figure 2B). N-K fertilization had a significant effect on pH (p = 0.011) and the malate content of juice (p = 0.040). Juice was less acid with T3 treatment (pH = 5.18 ± 0.63), than treatments T2 (pH = 5.0 ± 0.6), T1 (pH = 4.98 ± 0.51), T4 (pH = 4.95 ± 0.55) and T5 (pH = 4.93 ± 0.63) (Figure 2C). The malate content was higher with the treatments T4 (43.5 ± 8.9 mg·mL−1) and T3 (40.8 ± 10.4 mg·mL−1), followed by treatments T1 (37.1 ± 6.9 mg·mL−1) and T2 (36.4 ± 4.8 mg·mL−1) (Figure 2D). Moreover, mulching and/or mineral fertilizer were not found to have significant effects (p > 0.05) on sucrose, raffinose, oxalate, proprionate and formic acid.
Mulching and/or mineral fertilizer significantly influenced fruit quality attributes and proportion of fruit for exportation (Figure 3 and Figure 4). Mulching had significant effects on infructescence length (p = 0.008) and fruit weight (p = 0.002). Infructescence length was higher with burying (15.81 ± 0.51 cm), followed respectively by mulching (14.95 ± 0.63 cm) and no mulching (13.96 ± 0.58 cm) (Figure 3A). Meanwhile, fruit weight was higher with burying (1.36 ± 0.07 kg·fruit−1) and mulching (1.25 ± 0.09 kg·fruit−1), followed by no mulching (1.11 ± 0.08 kg·fruit−1) (Figure 3B). Infructescence length, fruit weight and the ratio of crown length: fruit length was significantly influenced by N-K fertilization (p = 0.000, p = 0.000 and p = 0.000 respectively). The highest infructescence length and fruit weight were obtained with T3 treatment (17.03 ± 0.52 cm and 1.57 ± 0.08 kg·plant−1 respectively), followed first by T4 (14.97 ± 0.64 cm and 1.28 ± 0.1 kg·plant−1) and T2 (14.93 ± 0.44 cm and 1.25 ± 0.08 kg·fruit−1), and then T5 (14.48 ± 0.92 and 1.11 ± 0.1 kg·fruit−1) and T1 (13.11 ± 0.76 cm and 0.99 ± 0.01 kg·fruit−1) (Figure 3C,D). The ratio of crown length: fruit length was higher with treatment T1 (0.61 ± 0.01), followed respectively by treatments T5 (0.59 ± 0.02), T2 (0.56 ± 0.01), T4 (0.55 ± 0.01) and T3 (0.53 ± 0.01) (Figure 3E).
Mulching had a significant effect on the proportion of exportable fruits (p = 0.02) and the mean weight of exportable fruits (p = 0.02). The highest proportion of exportable fruits and the highest mean weight of exportable fruits were obtained with burying (78.67% ± 4.99% and 1.35 ± 0.07 kg·fruit−1), followed respectively by mulching (66.67% ± 4.88% and 1.23 ± 0.08 kg·fruit−1) and no mulching (62.22% ± 5.26% and 1.16 ± 0.07 kg·fruit−1) (Figure 4A,B). N-K fertilization had significantly influenced the proportion of exportable fruits (p = 0.000) and the mean weight of exportable fruits (p = 0.000). The proportion of exportable fruits was higher with T2 treatment (88.88% ± 4.81%), followed respectively by T4 (77.77% ± 6.21%), T1 (62.59% ± 6.54%), T5 (59.26% ± 4.90%) and T3 (57.41% ± 5.63%) (Figure 4C). Treatment T3 (1.53 ± 0.06 kg·fruit−1) induced the highest mean weight of exportable fruits, followed first by T4 (1.29 ± 0.09 kg·fruit−1) and T2 (1.27 ± 0.09 kg·fruit−1), and then T5 (1.13 ± 0.09 kg·fruit−1) and T1 (1.02 ± 0.07 kg·fruit−1) (Figure 4D). Finally, crown length had not been significantly (p > 0.05) influenced by mulching and/or mineral fertilizer. Therefore, the treatments T2 or T4 containing a lower quantity of fertilizer associated with buried residues could be advocated to farmers.

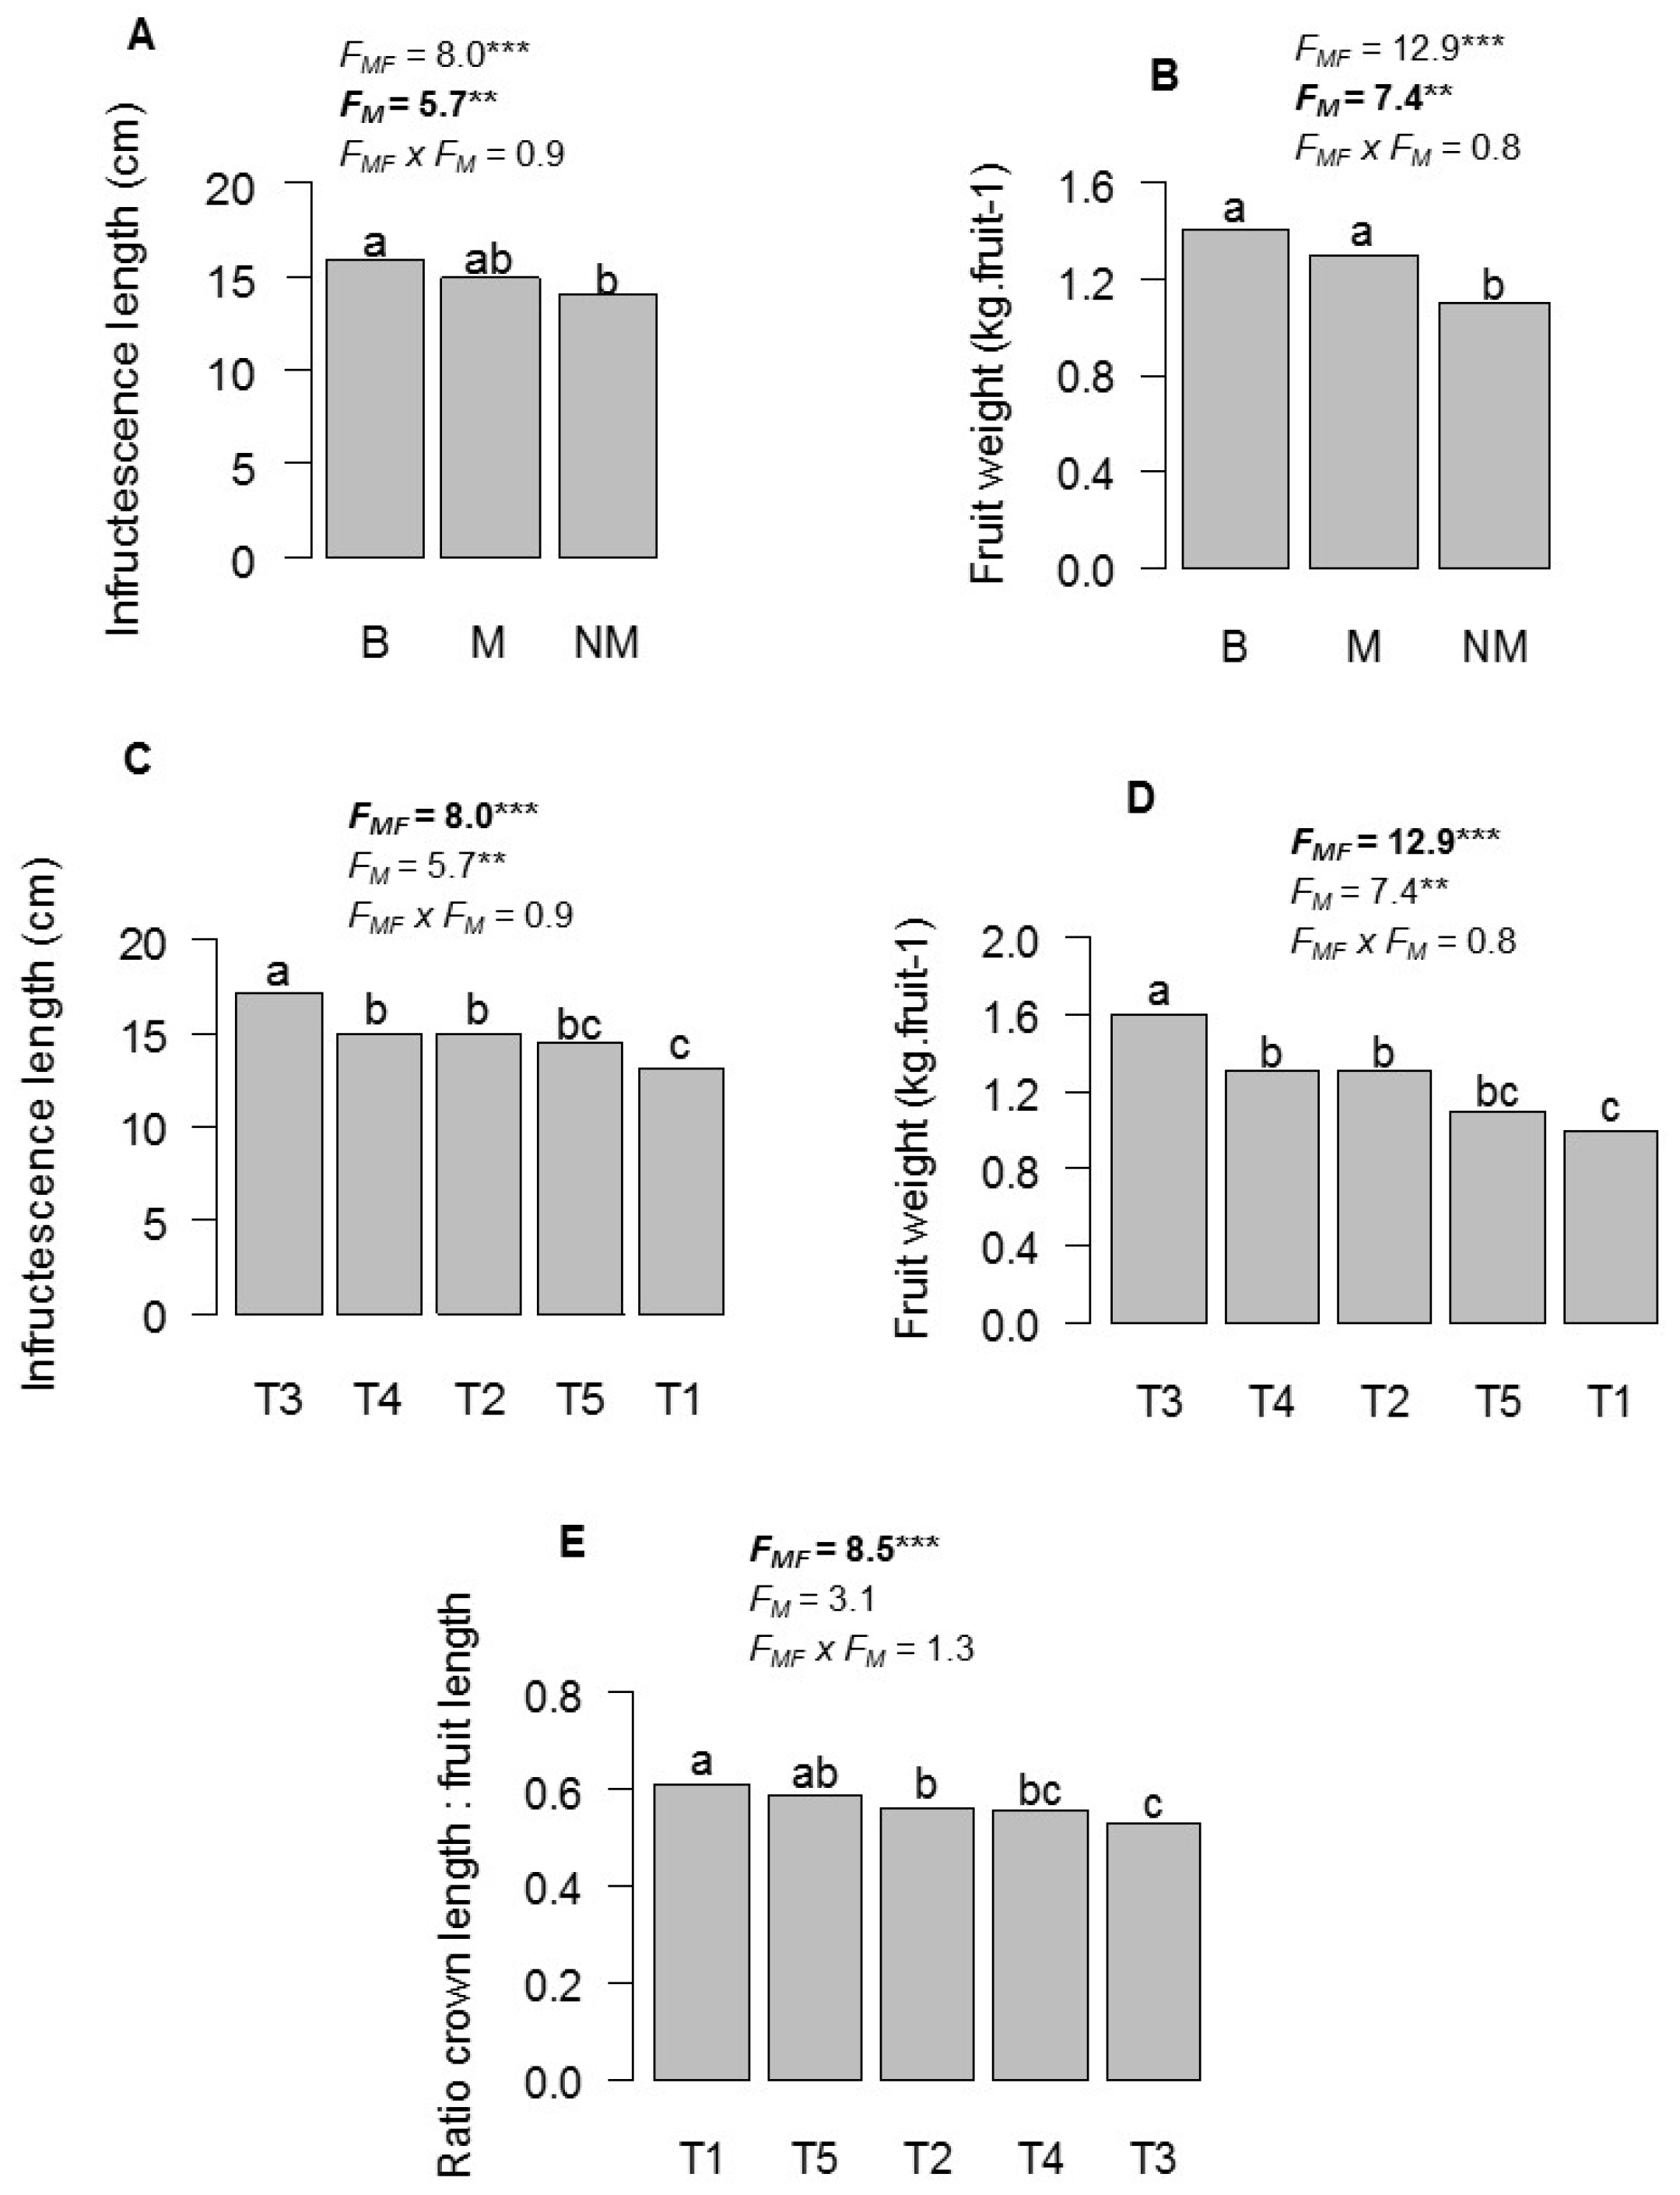
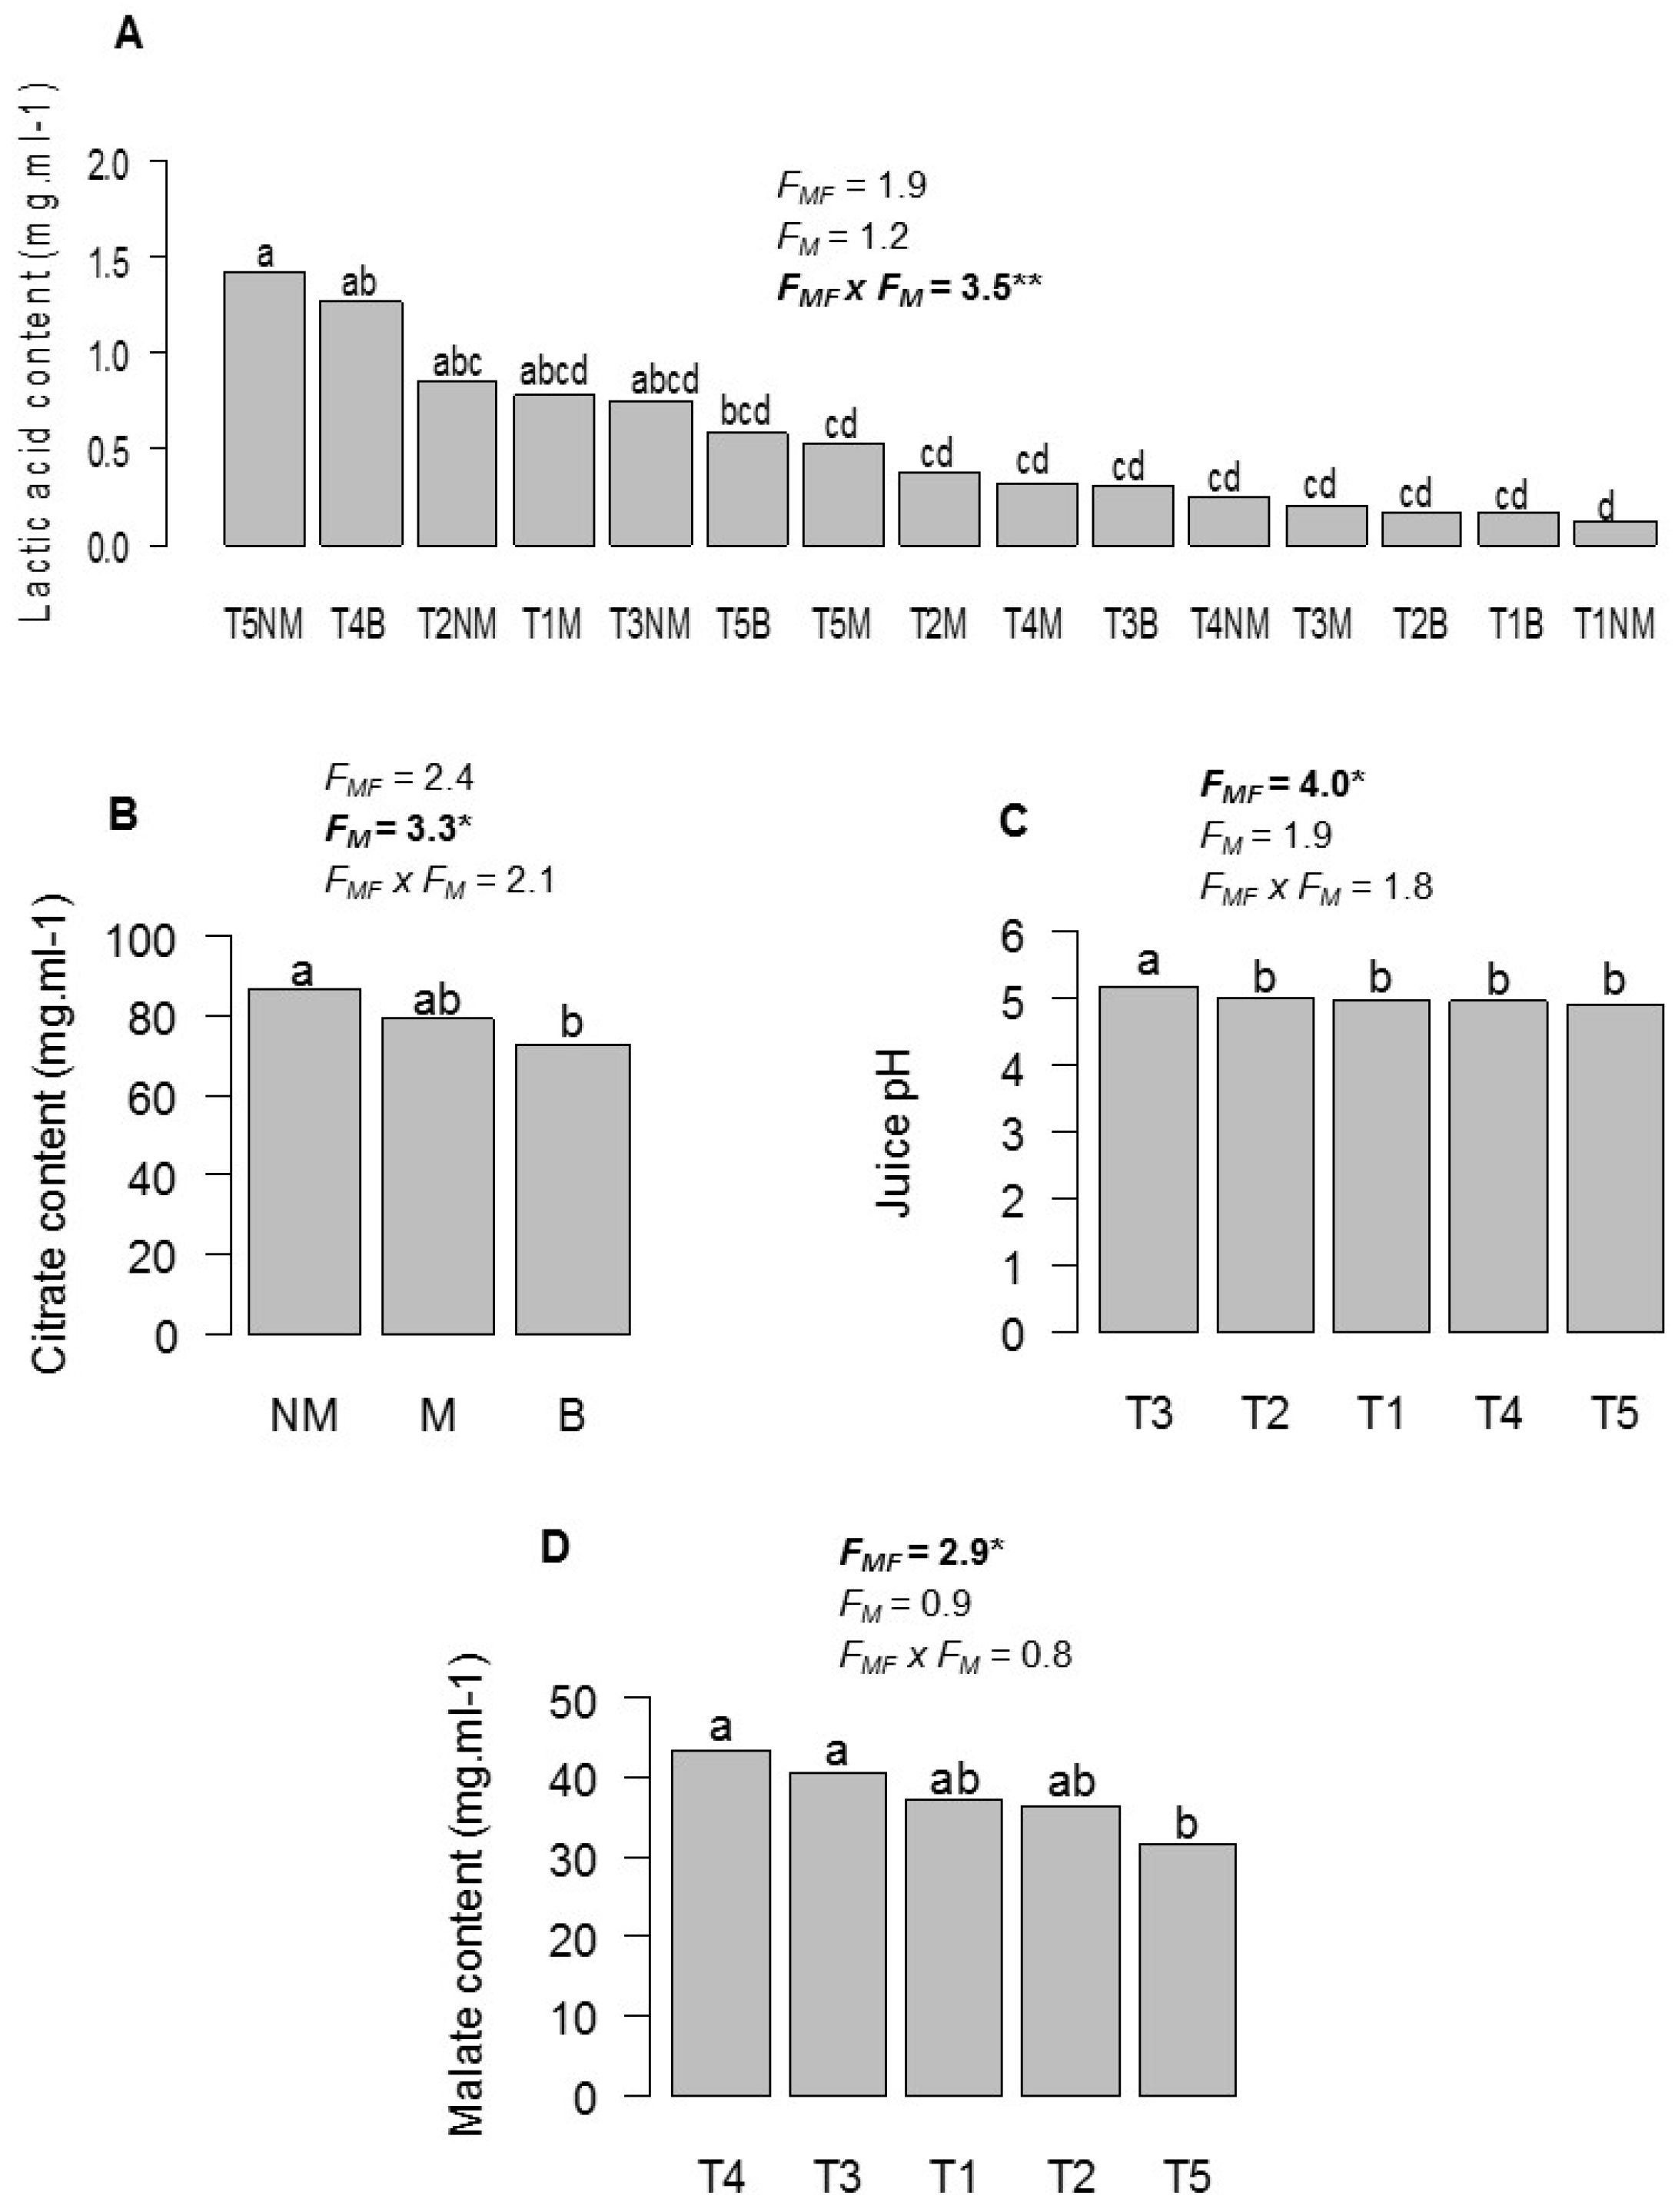
3.2. Influence of Mulching and N-K Fertilization on Pineapple Fruit Quality for Local Consumption

The principal component analysis performed on the sensorial and physico-chemical characteristics of fruits showed that the first two axes explained 62.7% of the total inertia. The first dimension was characterized by the variables juice yield (r = 0.85, p = 0.000), fruit weight (r = 0.83, p = 0.000), sweet taste (r = 0.71, p = 0.003), glucose (r = 0.70, p = 0.003), TSS (r = 0.66, p = 0.008), pH (r = 0.65, p = 0.008), acceptability (r = 0.64, p = 0.009), and fructose (r = 0.51, p = 0.049), which were positively correlated to it; meanwhile the variables raffinose (r = −0.58, p = 0.024) and acid taste (r = −0.76, p = 0.000) were negatively correlated to it. The variable fructose (r = 0.62, p = 0.013) was positively correlated to the second dimension, while the variable aroma (r = −0.79, p = 0.000) was negatively correlated to it (Figure 5).
The fertilizer treatments were grouped into four classes (Figure 6). The first class was represented by T2B, T3B, T3M, T3NM and T4B, of which fruits were heavier (V.test > 2, p < 0.01) and high yielding in juice (V.test > 2, p < 0.01), with high pH (V.test > 2, p < 0.05), glucose (V.test > 2, p < 0.05), TSS (V.test > 2, p < 0.05) and low raffinose (V.test < −2, p < 0.05). Among these interesting treatments, T2B or T4B, containing lower fertilizer quantities and buried residues, could be used for local-oriented production. The second class, represented by treatments T1NM, T1B, T2NM, T2M, T4NM and T5M, was defined by fruits having a very high content of raffinose (V.test > 2, p < 0.05) and very low juice yield (V.test < −2, p < 0.05). The third class included T4M, whose fruits were very little flavored (V.test < −2, p < 0.01). The treatments T1M, T5NM and T5B belonged to the fourth class, where fruits had a very acidic taste (V.test > 2, p < 0.05), were very weakly sweet (V.test < −2, p < 0.01), and contained low sucrose levels (V.test < −2, p < 0.05) and low TSS (V.test < −2, p < 0.05) (Table 1).

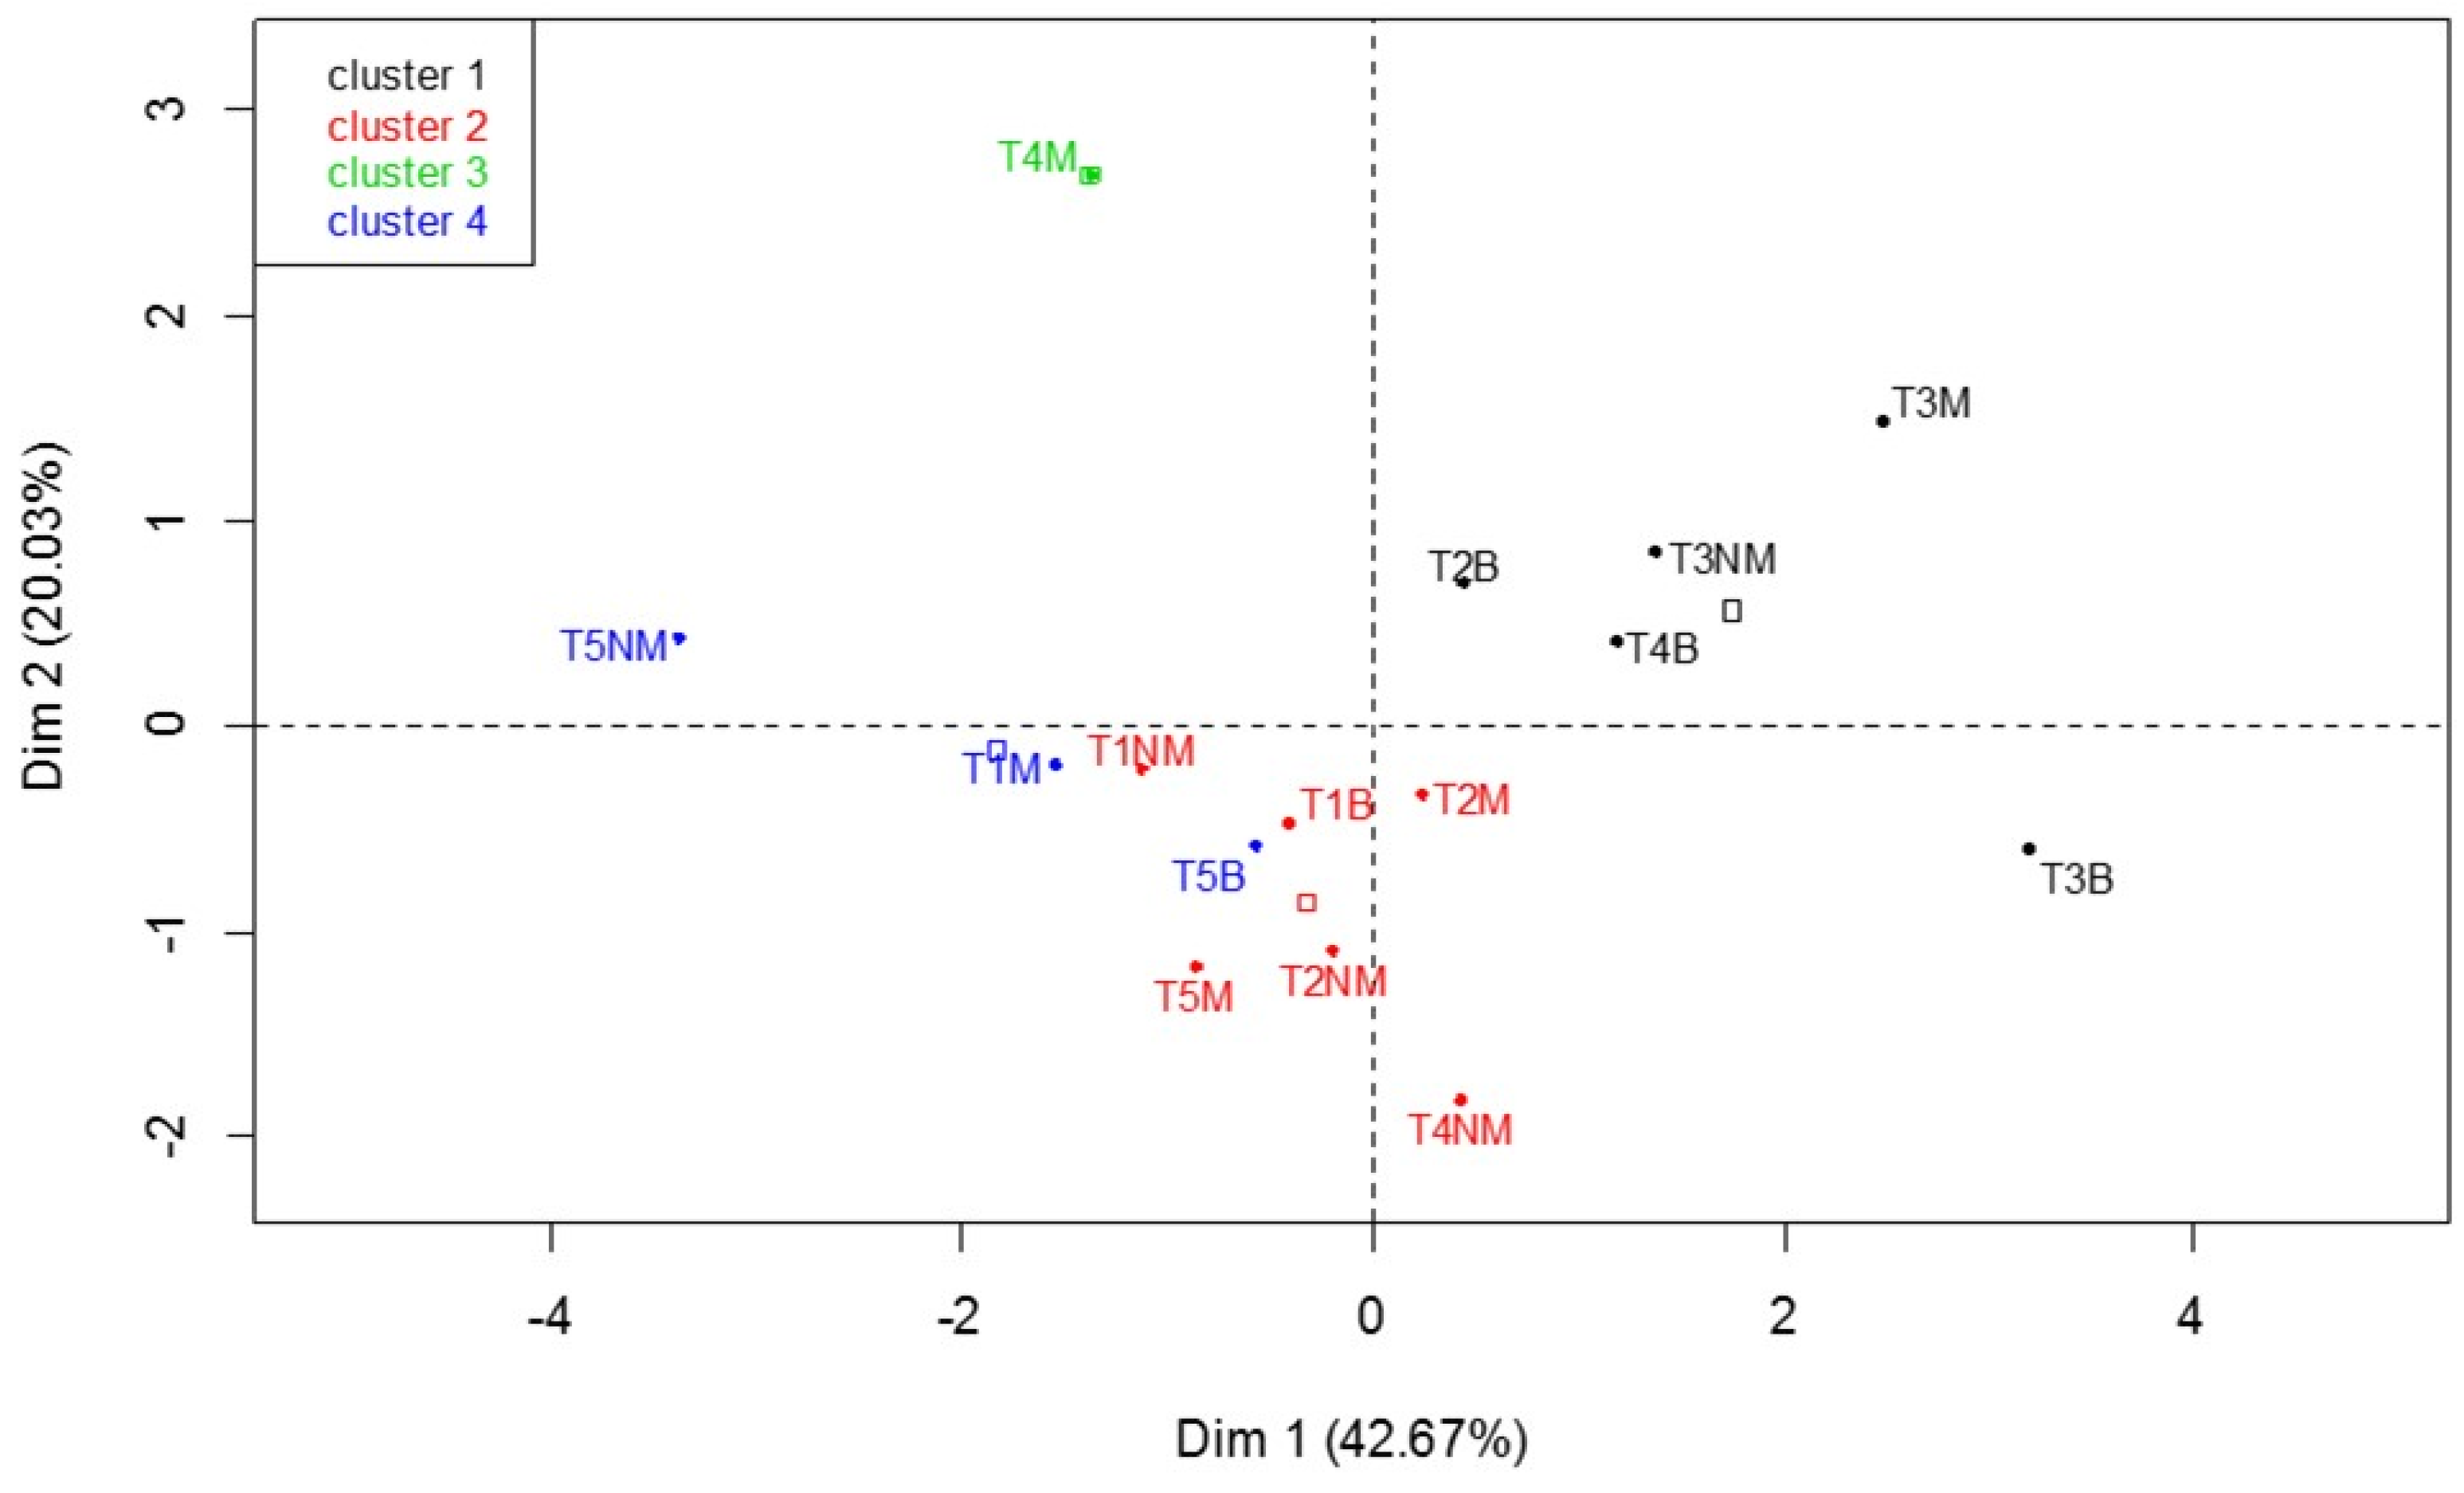
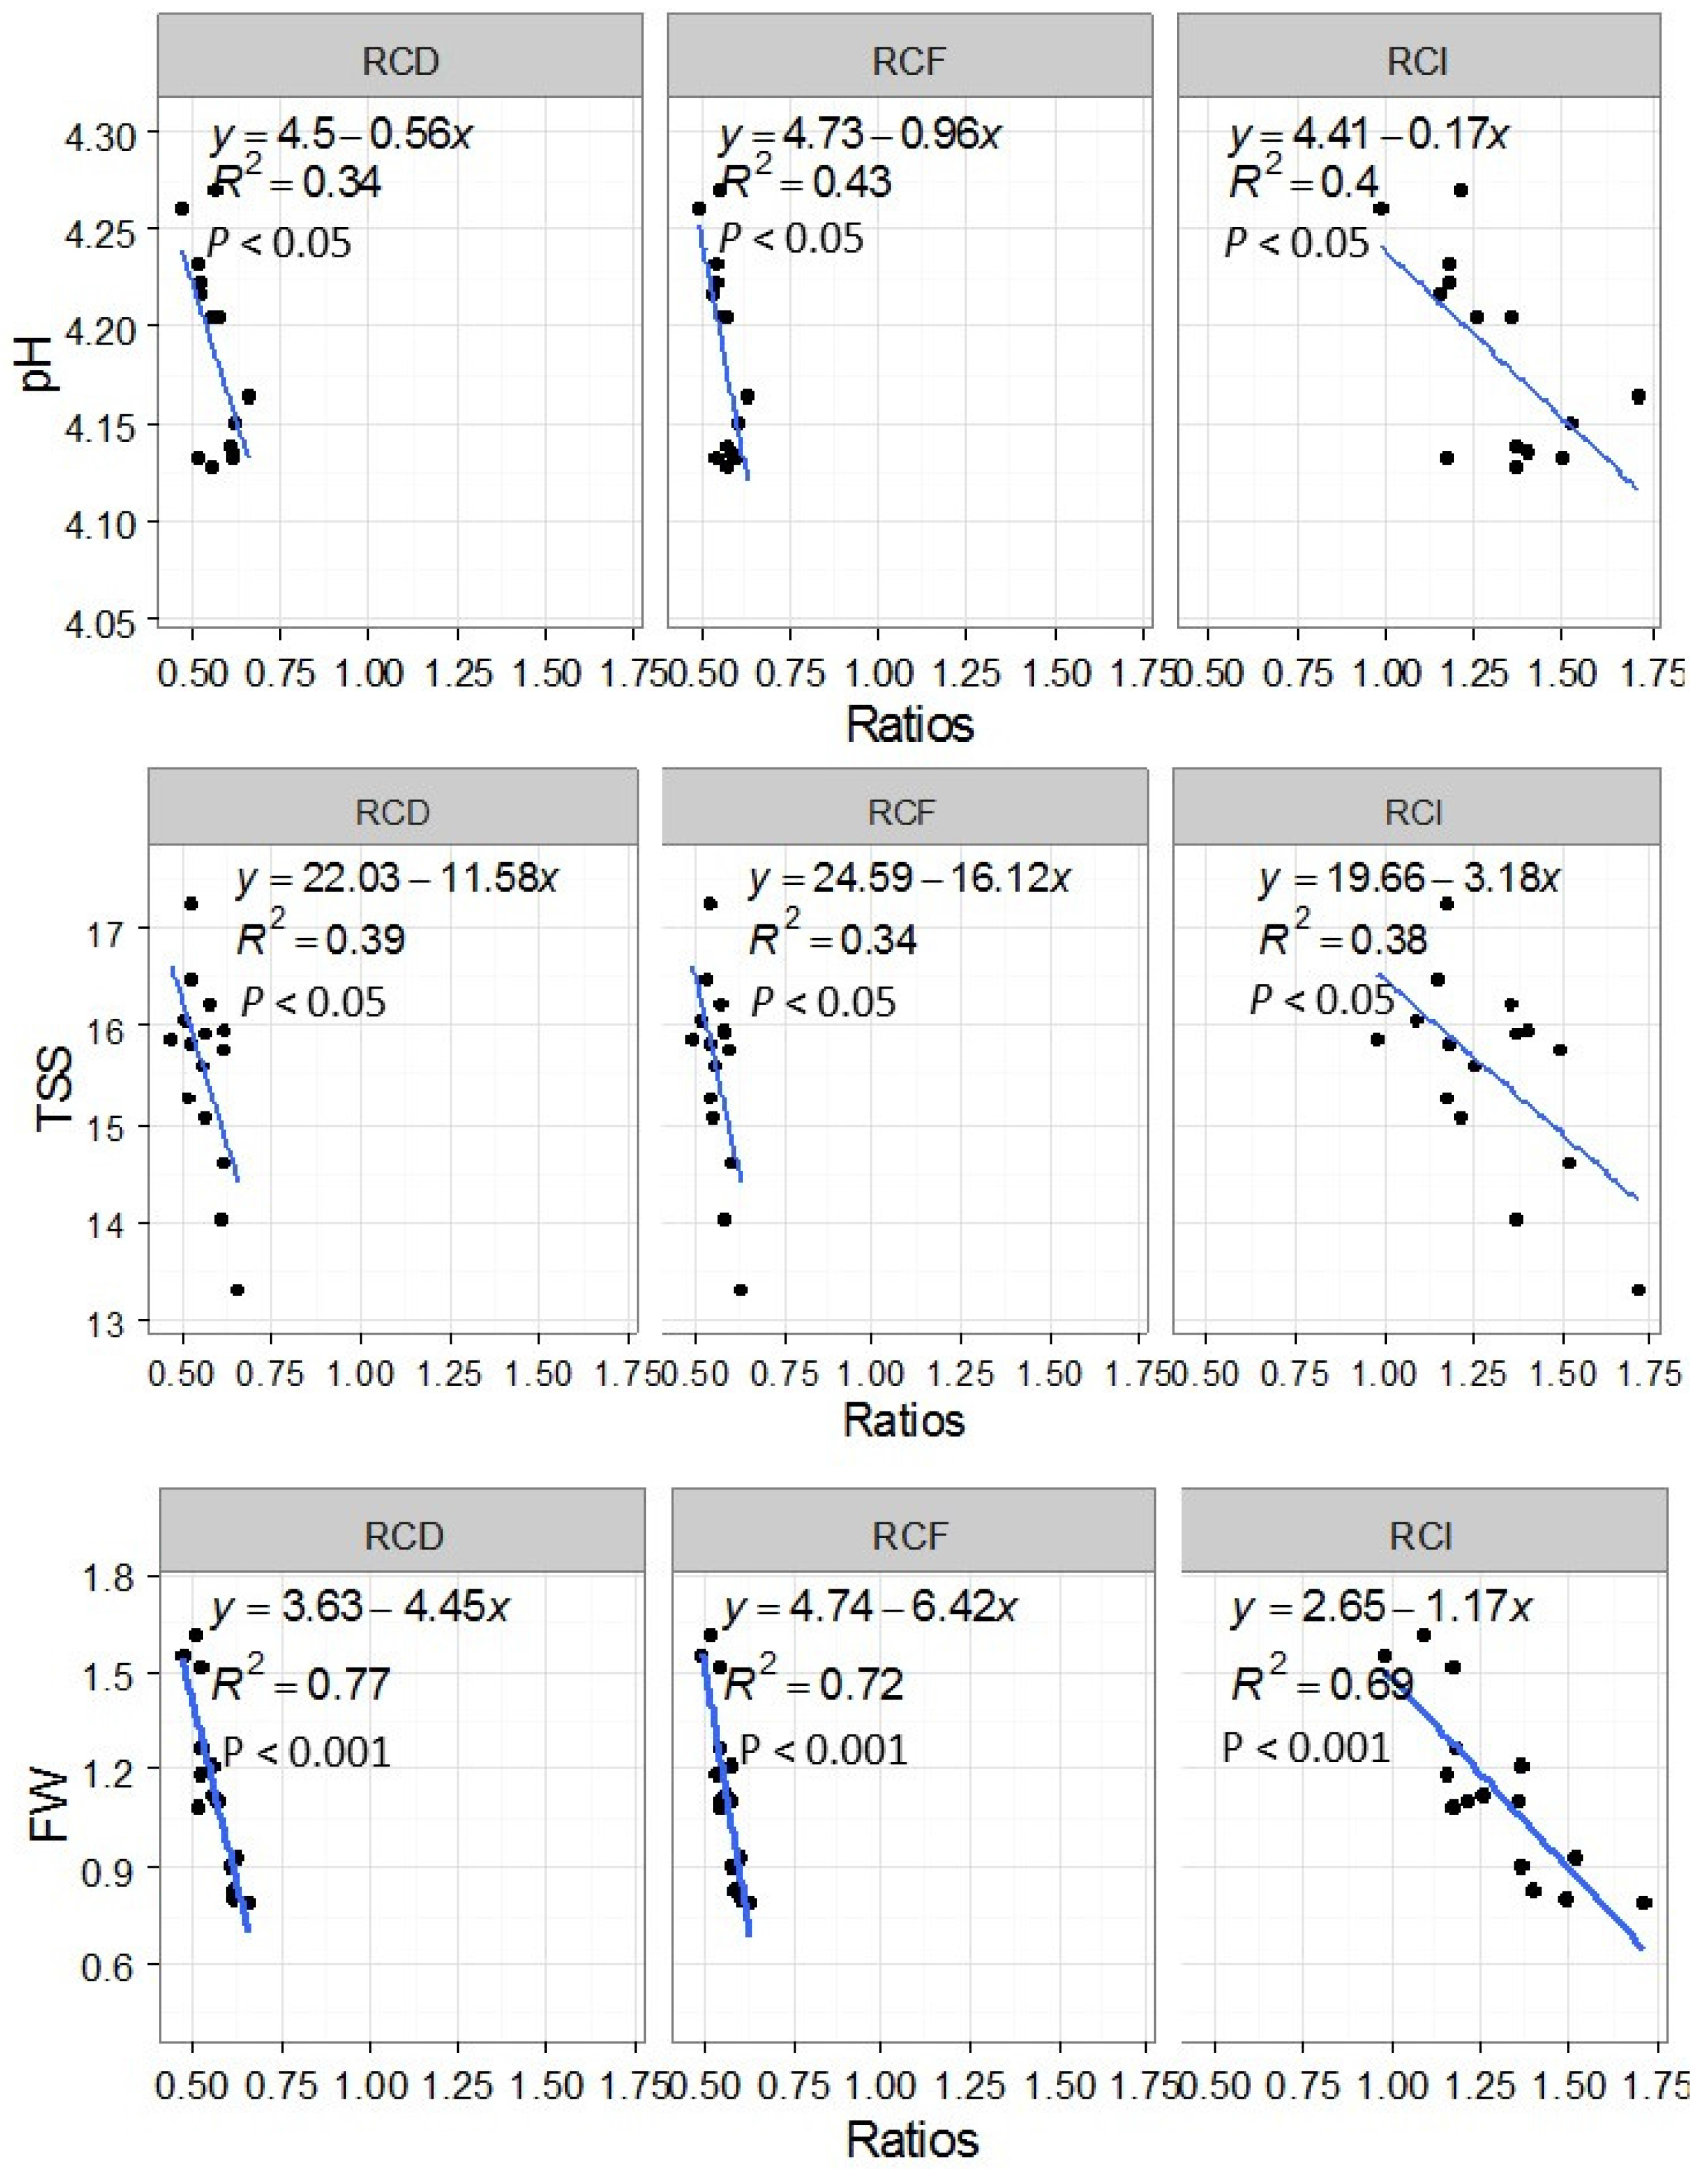
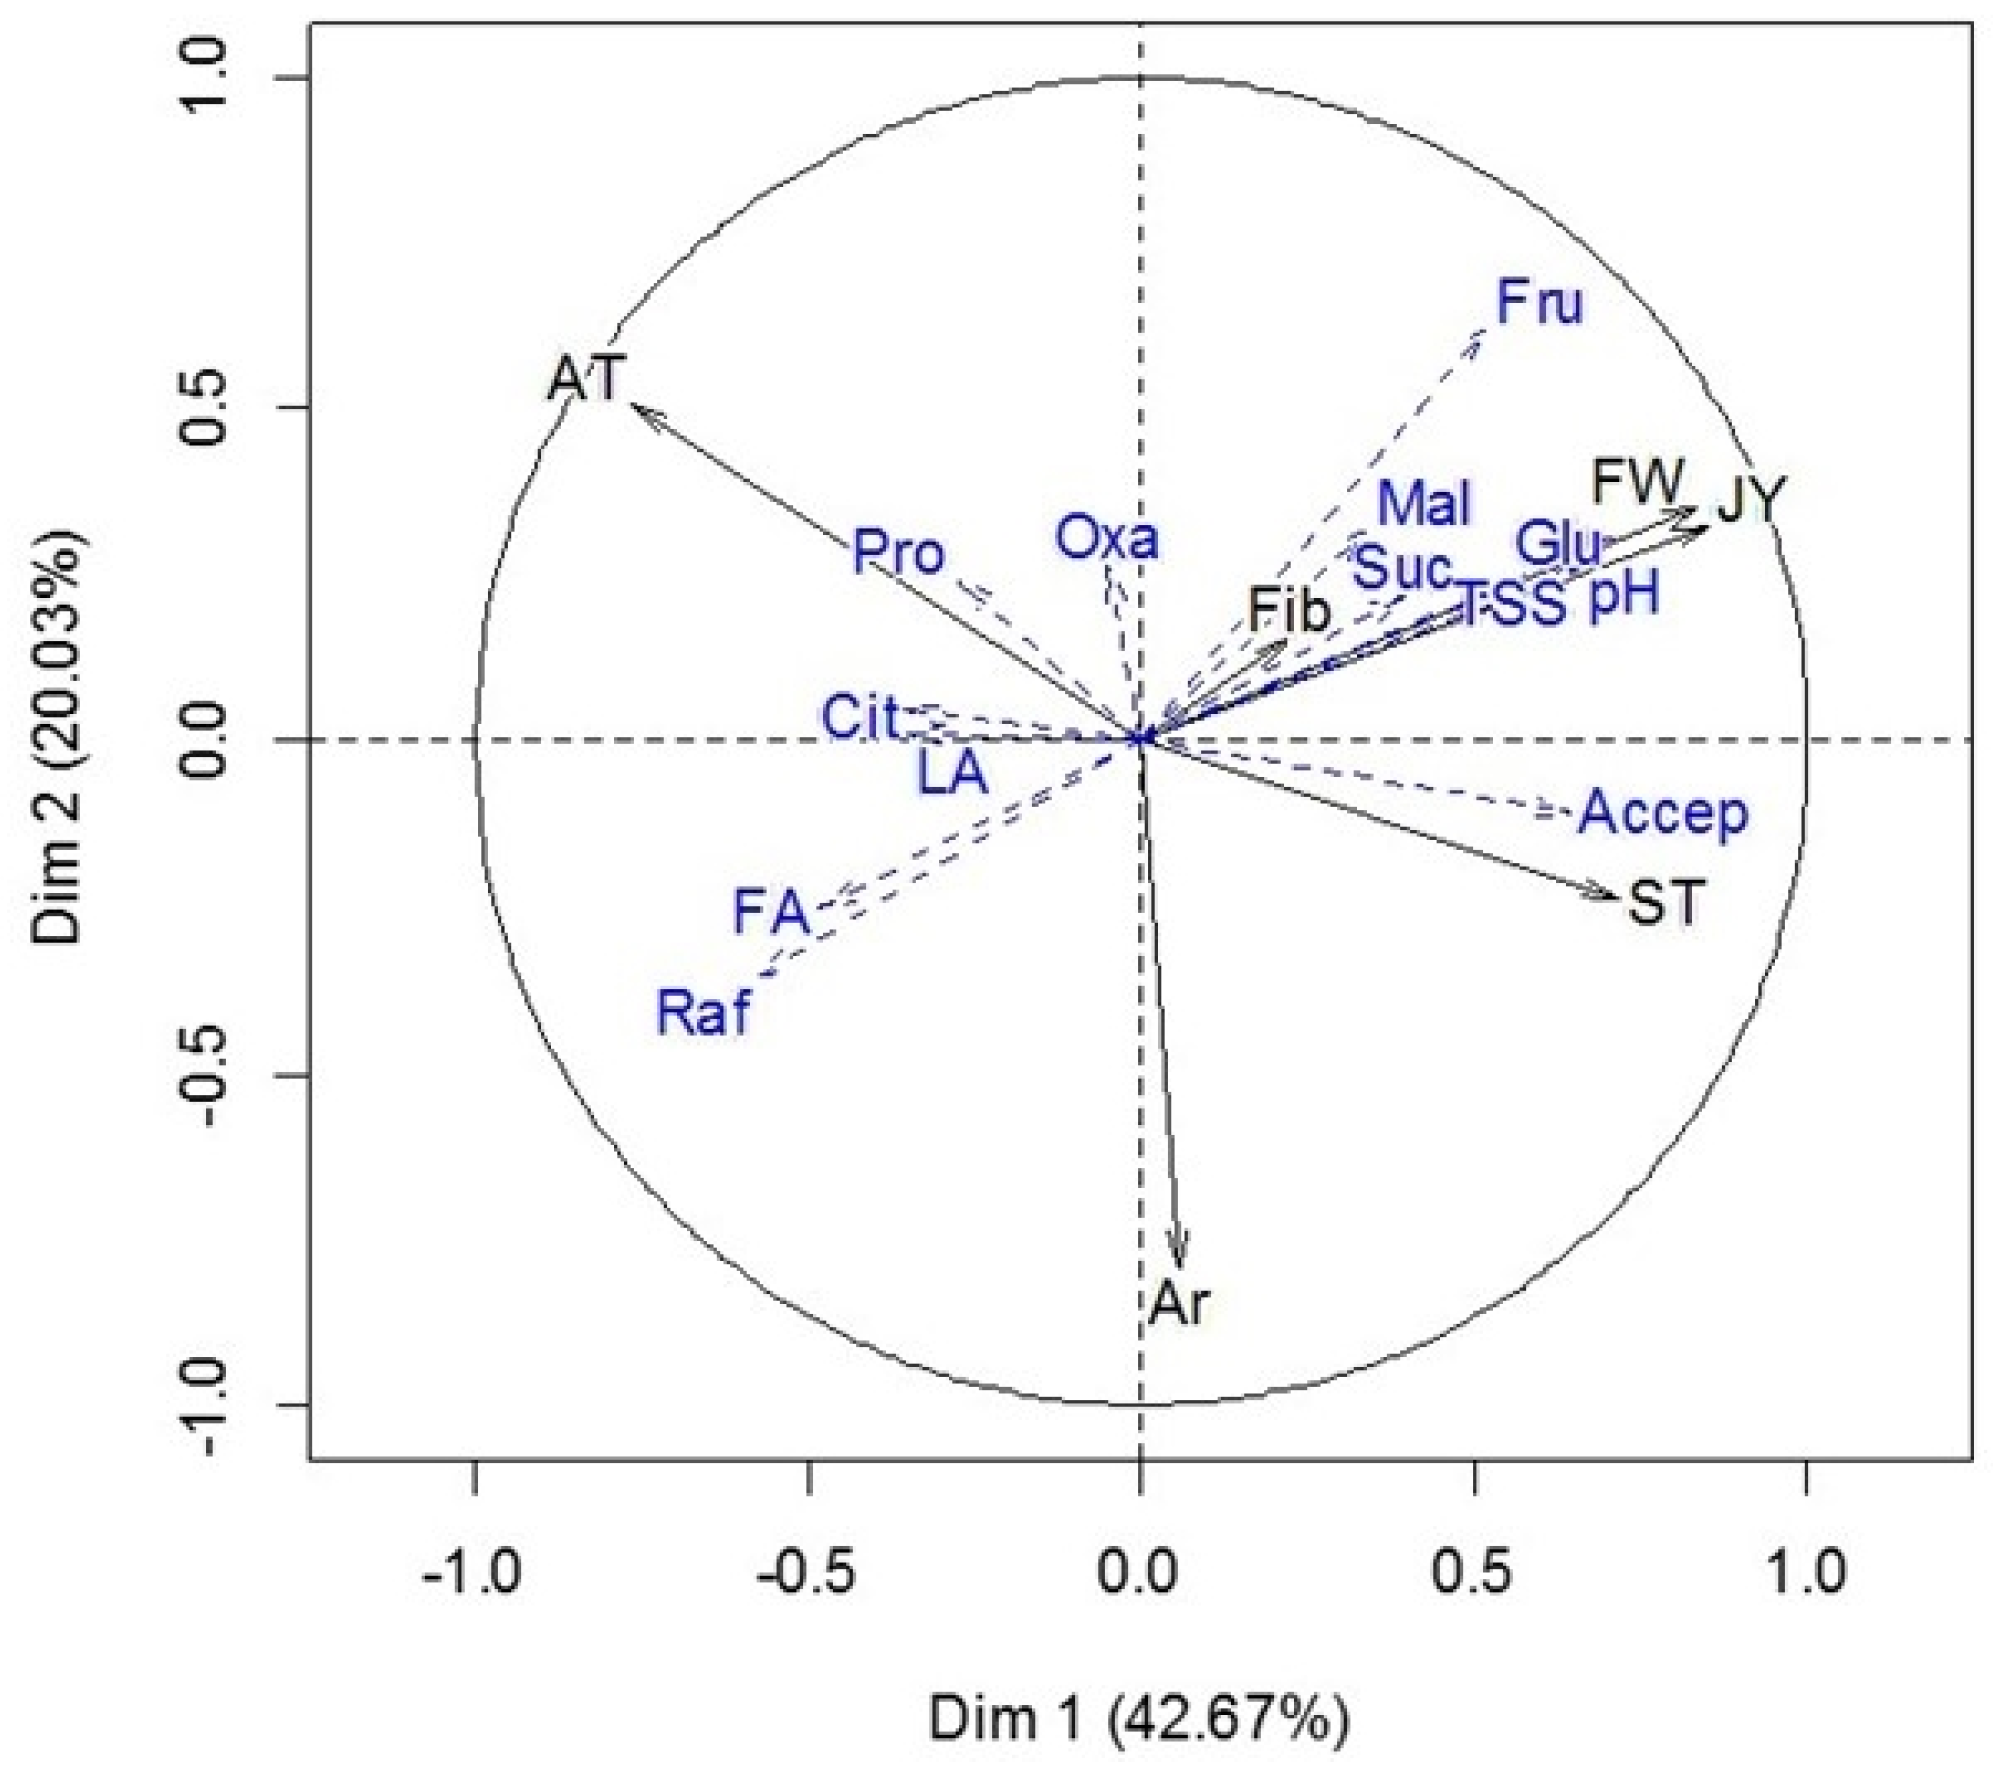
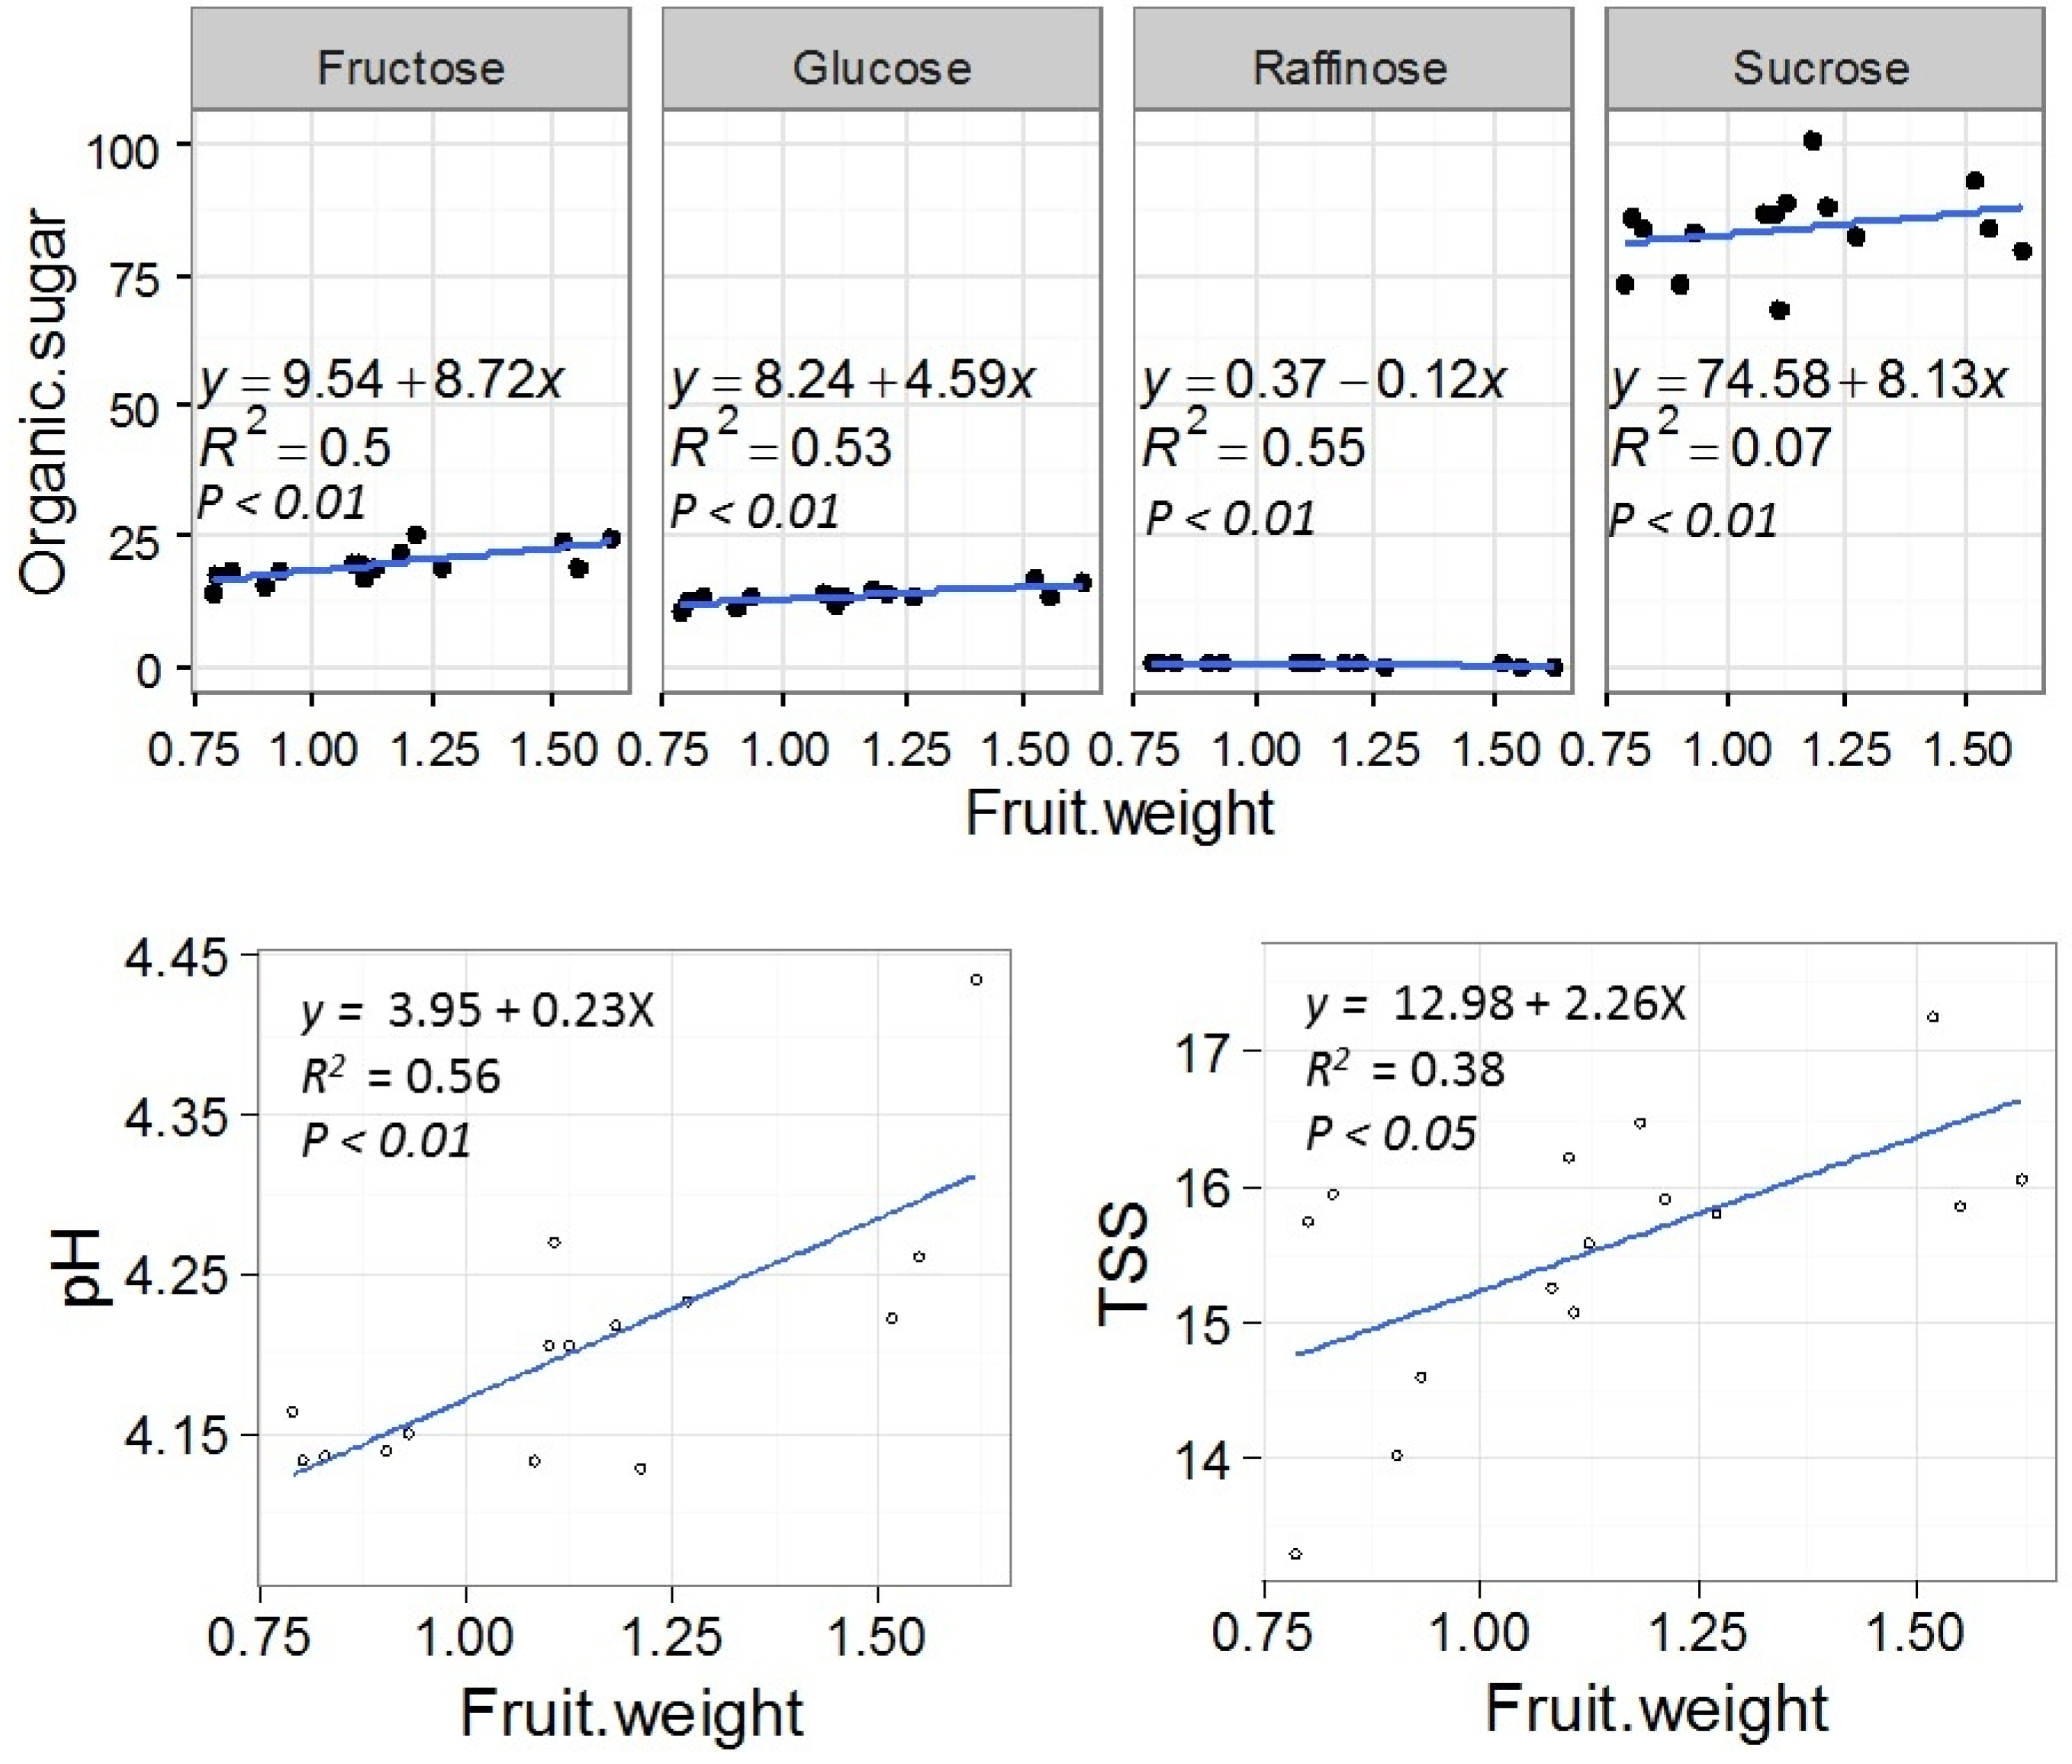
3.3. Relation Between Fruit Morphological and Physico-Chemical Properties

Linear regressions between morphological and physico-chemical characteristics of fruit revealed significant relationships. It was shown that pH, total soluble solids (TSS) (p < 0.05) and fruit weight (p < 0.001) decreased linearly as the ratios of crown length: fruit length, crown length: infructescence length and crown length: median diameter increased (Figure 7). This implies that the higher these ratios are, the weaker the fruit quality becomes. Therefore, these ratios have been revealed to all be useful for selecting fruit for exportation. An increase of fruit weight was significantly associated with a linear increase of fructose, glucose, sucrose (p < 0.01), TSS (p < 0.01), and pH (p < 0.01). Conversely, raffinose (p < 0.01) content decreased linearly as fruit weight increased (Figure 8).

4. Discussion

4.1. Influence of Mulching and N-K Fertilization on Pineapple Fresh Fruit Juice Quality and Proportion of Fruit Meeting European Standards and Local Acceptability

Mulching associated with N-K fertilization had influenced positively the quality of sugarloaf pineapple and, as a result, had improved the percentage of fruit meeting European standards and standards for local consumption. Mineral and/or organic fertilizer effects on fruit quality attributes has been reported by some authors [12,14,15,16,17,32,38], but the impact of pineapple residues on fruit quality was not explored. Likewise, information about fertilization influence on organic sugars and acids had not yet been reported. Plant vigor at flowering induction time ensures fruit quality (fruit weight and length attributes) [39]. However, cultural practices that guarantee a plant vigor before flowering induction need to receive considerable attention.
Our results suggested that burying or mulching pineapple residues enhanced TSS, fruit weight, infructescence length, proportion of exportable fruits, and mean weight of exportable fruits while decreasing citrate content. These findings were consistent with the works of [17] and [12], showing the highest TSS and lowest titrable acidity respectively with application of M. puriens green manure and dry grass of panicum maximum. The residues effects were improved with burying. Buried residues associated with N-K fertilization had increased fruit characteristics for local consumption. Pineapple residues burying thus remains an alternative cultivation practice that could reduce N and K chemical fertilizer use. This can be explained by the rapid decomposition of residues in burying [40], which release soil nutrients including potassium and nitrogen [41]. An increase of 39.6% of total sugar content of pineapple fruit by the addition of compost pineapple residue to topsoil, compared to no application of compost, was observed [16].
N-K fertilization also enhanced TSS, glucose, fructose and malate contents, as well as pH, fruit weight, infructescence length, proportion of exportable fruits and mean weight of exportable fruit. High values were globally obtained with treatments which associated higher nitrogen and potassium doses. These results are comparable to those of [32], who observed an increase in pH of pineapple “Smooth Cayenne” under the influence of nitrogen and potassium. Similarly, [11] and [38] noted a reduction in juice acidity under the influence of increasing nitrogen rates. However, [42] reported that potassium improves fruit quality through increasing the acidity and flesh firmness, increasing sugar content and flavor of fruit with the expansion of stalk diameter.
Our findings suggested that the best mulching and N-K fertilization for satisfying fruit characteristics for local consumption did not also lead to all fruit meeting exportation standards. Consequently, advocating optimum rates of mulching and N-K fertilization to farmers should be done with respect to the destination of the production.

4.2. Fruit Morphological Characteristics Were Correlated with Physico-Chemical Properties

Interestingly, our results suggested that the ratios of RCF (ratio crown length: fruit length), RCI (ratio crown length: infructescence length) and RCD (ratio crown length: median diameter) were significantly associated with fruit quality, which had not been previously reported. The optimum range for RCF for pineapple meeting export standards is 50%–150% [21]. RCI and RCD also remain relevant to estimate fruit quality attributes. According to these ratios, fruits with too long of crowns cannot be of good physico-chemical quality. Longer crowns can accumulate more nutrients than necessary for infructescence growth and quality. Dry-matter accumulation in the crown was 1.2%–2.5% and the accumulation of macronutrients ranged from 0.30%–1.29% for nitrogen, 0.06%–0.22% for phosphorus and 0.45%–2.68% for potassium, depending on cultivars [43]. In this work, heavier fruit tended to have interesting organic sugars content, with higher pH and total solids. Therefore, fruit weight is an indicator of fruit quality while it is grown under mulching and N-K fertilization.

5. Conclusions

The study revealed that mulching and mineral fertilization positively influenced fruit physico-chemical and organoleptic characteristics for sugarloaf pineapple, and consequently enhanced the percentage of fruit meeting European standards and the standards of acceptability for local consumption. Buried pineapple residues or surface mulching enhanced TSS, fruit weight, infructescence length, proportion of exportable fruits and mean weight of exportable fruits, while decreasing citrate content. N-K fertilization also enhanced TSS, glucose, fructose and malate contents, pH, fruit weight, infructescence length, proportion of exportable fruits and mean weight of exportable fruit. Interesting treatments such as T2B or T4B, containing a lower quantity of fertilizer associated with buried residues, could be advocated to farmers for exportation and local-oriented production. Finally, the ratios RCF (ratio crown length: fruit length), RCI (ratio crown length: infructescence length), and RCD (ratio crown length: median diameter) were correlated to fruit quality, which has not been previously reported.

Acknowledgments

This experiment was supported by the Competitive Fund Program for Researches of Abomey-Calavi University (PFCR/UAC).

Author Contributions

Elvire L. Sossa, Codjo E. Agbangba and Sènan G. G. S. Accalogoun performed the research design, data collection, data analysis and wrote the manuscript. Guillaume L. Amadji, Kossi E. Agbossou and Djidjoho J. Hounhouigan performed the whole write up and contributed significantly to manuscript improvement.

Conflicts of Interest

The authors declare no conflict of interest.

References

  1. Vagneron, I.; Faure, G.; Loeillet, D. Is there a pilot in the chain? Identifying the key drivers of change in the fresh pineapple sector. Food Policy 2009, 34, 437–446. [Google Scholar] [CrossRef]
  2. Calderon, M.M.; Graü, M.A.R.; Belloso, O.M. Mechanical and chemical properties of Gold cultivar pineapple flesh (Ananas comosus). Eur. Food Res. Technol. 2009, 230, 675–686. [Google Scholar] [CrossRef]
  3. Hounhouigan, M.H.; Lineman, A.R.; Ingenbleek, P.T.M.; Soumanou, M.M.; van Trijp, H.C.M.; van Boekel, M.A.J.S. Effect of physical damage and storage of pineapple fruits on their suitability for juice production. J. Food Qual. 2014, 37, 268–273. [Google Scholar] [CrossRef]
  4. INSAE (Institut National de la Statistique et de l’Analyse Economique). Dynamique des Filières D’exportation au Bénin; Ministère du Plan: Cotonou, Benin, 2009; p. 50. [Google Scholar]
  5. Fassinou, H.V.N.; Lommen, W.; van der Vorst, J.; Agbossou, K.E.; Struik, P. Analysis of pineapple production systems in Benin. Acta Hortic. 2012, 928, 47–58. [Google Scholar] [CrossRef]
  6. Fassinou, H.V.N.; Lommen, W.J.M.; Agbossou, K.E.; Struik, P.C. Influence of weight and type of planting material on fruit quality and its heterogeneity in pineapple (Ananas comosus (L.) Merrill). Front. Plant Sci. 2015, 5, 1–16. [Google Scholar] [CrossRef] [PubMed]
  7. Djalalou-Dine, A.A.A. Marketing channel selection by smallholder farmers in pineapple supply chain in Benin. J. Food Prod. Mark. 2015, 21, 337–357. [Google Scholar]
  8. Agbangba, C.E.; Olodo, G.P.; Dagbenonbakin, D.G.; Akpo, L.E.; Sokpon, N. Preliminary DRIS Model parametrization to access pineapple variety ‘Perola’ nutrient status in Benin (West Africa). Afr. J. Agric. Res. 2011, 6, 5841–5847. [Google Scholar]
  9. Malezieux, E.; Bartholomew, D.P. Plant nutrition. In The Pineapple: Botany, Production and Uses; Bartholomew, D.P., Paull, R.E., Rohrbach, K.G., Eds.; CABI Publishing: New York, NY, USA, 2003; pp. 143–165. [Google Scholar]
  10. Soares, A.G.; Trugo, L.C.; Botrel, N.; Sousa, L.F.S. Reduction of internal browning of pineapple fruit (Ananas comusus L.) by preharvest soil application of potassium Postharvest. Biol. Technol. 2005, 35, 201–207. [Google Scholar] [CrossRef]
  11. Spironello, A.; Quaggio, J.A.; Teixeira, L.A.J.; Furlani, P.R.; Sigrist, J.M.M. Pineapple Yield and Fruit Quality Affected By NPK Fertilization in a Tropical Soil. Rev. Bras. Frutic. 2004, 26, 155–159. [Google Scholar] [CrossRef]
  12. Darnaudery, M.; Fournier, P.; Léchaudel, M. Low-input pineapple crops with high quality fruit: Promising impacts of locally integrated and organic fertilization compared to chemical fertilizers. Exp. Agric. 2016, 52, 1–17. [Google Scholar] [CrossRef]
  13. Zougmore, R.; Ouattara, K.; Mando, A.; Ouattara, B. Rôle des nutriments dans le succès des techniques de conservation des eaux et des sols (cordons pierreux, bandes enherbées, zaï et demi-lune) au Burkina Faso. Sécheresse 2004, 15, 41–48. [Google Scholar]
  14. Amorim, A.V.; Garruti, D.S.; de Lacerda, C.F.; Moura, C.F.H.; Filho, E.G. Postharvest and sensory quality of pineapples grown under micronutrients doses and two types of mulching. Afr. J. Agric. Res. 2013, 8, 2240–2248. [Google Scholar]
  15. Liu, C.; Liu, Y.; Yi, G. Effects of Film Mulching on Aroma Components of Pineapple Fruits. J. Agric. Sci. 2011, 3, 196–201. [Google Scholar] [CrossRef]
  16. Liu, C.H.; Liu, Y.; Fan, C.; Kuang, S.Z. The effects of composted pineapple residue return on soil properties and the growth and yield of pineapple. J. Soil Sci. Plant Nutr. 2013, 13, 433–444. [Google Scholar] [CrossRef]
  17. Norman, J.C. Effects of mulching and nitrogen fertilization on “sugarloaf” pineapple, Ananas comosus (L.) Merr. Den Trop. Subtrop. 1986, 87, 47–53. [Google Scholar]
  18. Ahmed, O.H.; Husni, M.H.A. Exploring the nature of the relationships among total, extractable and solution phosphorus in cultivated organic soils. Int. J. Agric. Res. 2010, 5, 746–756. [Google Scholar]
  19. Heard, J.; Cavers, C.; Adrian, G. Up in Smoke—Nutrient Loss with Straw Burning. Better Crops 2006, 90, 10–11. [Google Scholar]
  20. Sossa, E.L.; Amadji, G.L.; Vissoh, P.V.; Hounsou, B.M.; Agbossou, K.E.; Hounhouigan, D.J. Caractérisation des systèmes de culture d’ananas (Ananas comosus (L.) Merrill) sur le plateau d’Allada au Sud-Bénin. Int. J. Chem. Biol. Sci. 2014, 8, 1030–1038. [Google Scholar] [CrossRef]
  21. Codex Alimentarius. Codex Standard for Pineapples; CODEX STAN 182-1993 2005; FAO-WHO: Rome, Italy; p. 5.
  22. Sossa, E.L.; Amadji, G.L.; Aholoukpè, N.S.H.; Hounsou, B.M.; Agbossou, K.E.; Hounhouigan, D.J. Change in a ferralsol physico-chemical properties under pineapple cropping system in southern of Benin. J. Appl. Biosci. 2015, 91, 8559–8569. [Google Scholar] [CrossRef]
  23. Scohier, P.; Texido, R.A. Agriculture en Afrique Tropical; Raemaekers, H.R., Ed.; Direction Générale de la Coopération Internationale: Ministère des Affaires Etrangères, du Commerce Exterieur et de la Cooperation Internationale: Brussels, Belgique, 2001; p. 1634. [Google Scholar]
  24. Soler, A. L’ananas: Critères de Qualité; CIRAD-IRFA: Paris, France, 1992; p. 48. [Google Scholar]
  25. Mestres, C.; Rouau, X. Influence of natural fermentation and drying conditions on the physicochemical characteristics of cassava starch. J. Sci. Food Agric. 1997, 74, 147–155. [Google Scholar] [CrossRef]
  26. Watts, B.M.; Ylimaki, G.L.; Jeffery, L.E.; Elias, L.G. Méthodes de Base pour l'Evaluation Sensorielle des Aliments; CRDI: Ottawa, ON, Canada, 1991; p. 159. [Google Scholar]
  27. R Core Team. A Language and Environment for Statistical Computing; R Foundation for Statistical Computing: Vienna, Austria, 2015; Available online: https://www.R-project.org/ (accessed on 15 January 2015).
  28. Fernandez, G.C. Residual analysis and data transformations: Important tools in statistical analysis. HortScience 1992, 27, 297–300. [Google Scholar]
  29. Shapiro, S.S.; Wilk, M.B. An analysis of variance test for normality (complete samples). Biometrika 1965, 52, 591–611. [Google Scholar] [CrossRef]
  30. Snedecor, G.W.; Cochran, W.G. Statistical Methods Applied to Experiments in Agriculture and Biology; The Iowa State College Press: Ames, LA, USA, 1956; p. 250. [Google Scholar]
  31. Gomez, K.A.; Gomez, A.A. Statistical Procedures for Agricultural Research, 2nd ed.; John Wiley and Sons: New York, NY, USA, 1984; p. 300. [Google Scholar]
  32. Agbangba, C.E.; Dagbenonbakin, G.D.; Djogbénou, C.P.; Houssou, P.; Assea, D.E.; Sossa, E.L.; Kotomalè, U.A.; Ahotonou, P.; Ndiaga, C.; Akpo, L.E. Influence de la fertilisation minérale sur la qualité physico-chimique et organoleptique du jus d’ananas Cayenne lisse au Bénin. Int. J. Biol. Chem. Sci. 2015, 9, 1277–1288. [Google Scholar] [CrossRef]
  33. Husson, F.; Lê, S.; Pagês, G. Exploratory Multivariate Analysis by Exemple Using R; CRC Press, Taylor and Françis Group: New York, NY, USA, 2010; p. 205. [Google Scholar]
  34. Morineau, A. Note sur la Caractérisation Statistique d'une Classe et les Valeurs-tests. Bull. Tech. Cent. Stat. d'Inform. Appl. 1984, 2, 20–27. [Google Scholar]
  35. Breusch, T.; Pagan, A. Simple test for heteroscedasticity and random coefficient variation. Econom. Soc. 1979, 47, 1287–1294. [Google Scholar] [CrossRef]
  36. Durbin, J.; Watson, G.S. Testing for Serial Correlation in Least Squares Regression. Biometrika 1950, 37, 409–428. [Google Scholar] [CrossRef] [PubMed]
  37. Ramsey, J.B. Tests for Specification Errors in Classical Linear Least Squares Regression Analysis. J. R. Stat. Soc. Ser. B 1969, 31, 350–371. [Google Scholar]
  38. Omotoso, S.O.; Akinrinde, E.A. Effect of nitrogen fertilizer on some growth, yield and fruit quality parameters in pineapple (Ananas comosus L. Merr.) plant at Ado-Ekiti Southwestern, Nigeria. Int. Res. J. Agric. Sci. Soil Sci. 2013, 3, 11–16. [Google Scholar]
  39. Fassinou, H.V.N.; Lommen, W.J.M.; Agbossou, E.K.; Struik, P.C. Heterogeneity in pineapple fruit quality within crops results from plant heterogeneity at flower induction. Front. Plant Sci. 2014, 5, 670. [Google Scholar]
  40. Eusufzai, M.K.; Fujii, K.; Iiyama, I. Decomposition of Surface Applied and Buried Residue Biomass. Geol. Soc. Am. Abstr. Programs 2008, 40, 358. [Google Scholar]
  41. Ching, H.Y.; Ahmed, O.H.; Kassim, S.; Ab Majid, N.M. Co-composting of pineapple leaves and chicken manure slurry. Int. J. Recycl. Org. Waste Agric. 2013, 2, 23. [Google Scholar] [CrossRef]
  42. Teixeira, L.; Quaggio, J.; Cantarella, H.; Mellis, E. Potassium fertilization for pineapple: Effects on plant growth and fruit yield. Rev. Bras. Frutic. Jaboticabal-SP 2011, 33, 618–626. [Google Scholar] [CrossRef]
  43. Hanafi, M.M.; Selamat, M.M.; Husni, M.H.A.; Adzemi, M.A. Dry matter and nutrient partitioning of selected pineapple cultivars grown on mineral and tropical peat soils. Commun. Soil Sci. Plant Anal. 2009, 40, 3263–3280. [Google Scholar] [CrossRef]
Figure 1. Influence of mulching and N-K fertilization on TSS (A,B) and organic sugar (C,D) content of pineapple fresh fruit juice. * = significant, ** = highly significant, *** = very highly significant. FMF = Fisher value for mineral fertilizer, FM = Fisher value for mulching, FMF × FM = Fisher value for mineral fertilizer and mulching interaction. T1 = 1.6 N and 1.6 K, T2 = 5.8 N and 6.6 K, T3 = 10 N and 11.6 K, T4 = 1.6 N and 11.6 K, T5 = 10 N and 1.6 K (g·plant−1). B = Burying, M = Mulching, NM = No mulching. Means that do not share a letter are significantly different.
Agronomy 07 00026 g001
Figure 2. Influence of mulching and N-K fertilization on pH (C) and organic acid (A,B,D) content of pineapple fresh fruit juice. * = significant, ** = highly significant, FMF = Fisher value for mineral fertilizer, FM = Fisher value for mulching, FMF × FM = Fisher value for mineral fertilizer and mulching interaction. T1 = 1.6 N and 1.6 K, T2 = 5.8 N and 6.6 K, T3 = 10 N and 11.6 K, T4 = 1.6 N and 11.6 K, T5 = 10 N and 1.6 K (g·plant−1). B = Burying, M = Mulching, NM = No mulching. Means that do not share a letter are significantly different.
Agronomy 07 00026 g002
Figure 3. Influence of mulching and N-K fertilization on infructescence length (A,C), fruit weight (B,D) and ratio crown length: fruit length (E) of pineapple. * = significant, *** = very highly significant. FMF = Fisher value for mineral fertilizer, FM = Fisher value for mulching, FMF × FM = Fisher value for mineral fertilizer and mulching interaction. T1 = 1.6 N and 1.6 K, T2 = 5.8 N and 6.6 K, T3 = 10 N and 11.6 K, T4 = 1.6 N and 11.6 K, T5 = 10 N and 1.6 K (g·plant−1). B = Burying, M = Mulching, NM = No mulching. Means that do not share a letter are significantly different.
Agronomy 07 00026 g003
Figure 4. Influence of mulching and N-K fertilization on proportion of exportable fruits (A,C) and mean weight exportable fruits of pineapple (B,D). * = significant, *** = very highly significant. FMF = Fisher value for mineral fertilizer, FM = Fisher value for mulching, FMF × FM = Fisher value for mineral fertilizer and mulching interaction. T1 = 1.6 N and 1.6 K, T2 = 5.8 N and 6.6 K, T3 = 10 N and 11.6 K, T4 = 1.6 N and 11.6 K, T5 = 10 N and 1.6 K (g·plant−1). B = Burying, M = Mulching, NM = No mulching. Means that do not share a letter are significantly different.
Agronomy 07 00026 g004
Figure 5. Correlation between physico-chemical and organoleptic characteristics of pineapple fruit and the PCA of the first two dimensions. Raf = Raffinose, FA = Formic Acid, Latic Acid, Pro = Proprionate, Oxa = Oxalate, Fib = Fiber, Fru = Fructose, Mal = Malate, Suc = Sucrose, Glu = Glucose, FW = Fruit Weight, TSS = Total Soluble Solids, Accep = Acceptability, ST = Sweet taste, Ar = Aroma.
Agronomy 07 00026 g005
Figure 6. Projection of treatment classes according to physico-chemical and organoleptic parameters of pineapple fruit in the PCA factorial design. T1B = 1.6 N + 1.6 K + Burying, T1M = 1.6 N + 1.6 K + Mulching, T1NM = 1.6 N + 1.6 K + No mulching; T2B = 5.8 N + 6.6 K + Burying, T2M = 5.8 N + 6.6 K + Mulching, T2NM = 5.8 N + 6.6 K + No mulching; T3B = 10 N + 11.6 K + Burying, T3M = 10 N + 11.6 K + Mulching, T3NM = 10 N + 11.6 K + No mulching; T4B = 1.6 N + 11.6 K + Burying, T4M = 1.6 N + 11.6 K + Mulching, T4NM = 1.6 N + 11.6 K + No mulching; T5B = 10 N + 1.6 K + Burying, T5M = 10 N + 1.6 K + Mulching, T5NM = 10 N + 1.6 K + No mulching.
Agronomy 07 00026 g006
Figure 7. Relationship between pH, TSS, fruit weight and fruit characteristics ratios. RCD = Ration crown length/median diameter, RCF = Ration crown length/fruit length, RCI = Ration crown length/infructescence, TSS = total soluble solids (° Brix), FW = fruit Weight (kg·fruit−1), P = Probability, R2 = Coefficient of determination.
Agronomy 07 00026 g007
Figure 8. Relationship between fruit weight and physico-chemical characteristics. TSS = total soluble solids (° Brix), P = Probability, R2 = Coefficient of determination.
Agronomy 07 00026 g008
Table 1. Discriminant variables of treatment classes for physico-chemical and organoleptic quality of pineapple fruit.
CharacteristicsClassesV. testMeanProbability
Juice yield13.150.69 ± 0.090.002
Fruit Weight31.43 ± 0.170.003
pH2.424.27 ± 0.080.015
Glucose2.3614.91 ± 1.450.018
TSS2.0816.29 ± 0.530.037
Raffinose−2.290.2 ± 0.010.022
Raffinose22.350.27 ± 0.040.02
Juice volume−2.060.46 ± 0.060.04
Aroma3−2.771.64 ± 0.000.00
Acid taste42.051.61 ± 0.130.04
Sucrose−2.1474.81 ± 6.040.03
TSS−2.3914.33 ± 0.750.01
Sweet taste−3.003.09 ± 0.270.00
V.test = V - computed from the V.test in comparison of the mean value of the sensorial parameter for a given variable to the overall mean. A V - computed greater than 2 means the class had significantly (p < 0.05) greater value for the given variable. But V - computed lower than 2 implies that the class had significantly lower (p < 0.05) value for the given variable.

