
Effects on Water Management and Quality Characteristics of Ozone Application in Chicory Forcing Process: A Pilot System


Department of Agriculture, Food, Natural Resources, Animals and Environment, University of Padova, Campus of Agripolis, Viale dell’Università 16, Legnaro 35020, Italy
*
Author to whom correspondence should be addressed.
Agronomy 2017, 7(2), 29; https://doi.org/10.3390/agronomy7020029
Submission received: 23 February 2017
/
Revised: 7 April 2017
/
Accepted: 13 April 2017
/
Published: 19 April 2017
Abstract
:Agriculture is the largest user of world water resources, accounting for 70% of all consumption. Reducing water consumption and increasing water use efficiency in agriculture are two of the main challenges that need to be faced in the coming decades. Radicchio Rosso di Treviso Tardivo (RTT) is a vegetable that requires a water forcing process prior to final commercialization which presents a significant environmental impact due to the high water volumes used and then dispersed into the environment. The experiment was aimed at reducing the water use in the forcing process of RTT, by developing a pilot system with recycled water in a closed loop through ozone treatment. Concerning water quality, the redox potential value was higher in the ozonized system, whereas turbidity, pH and electrical conductivity of the ozonized system did not change significantly from the control. Yield and quality of plants obtained in the ozonized system did not significantly differ from the control plants except for the antioxidant activity that was higher in plants forced using the water treated with ozone. Our initial results suggest that the ozone treatment could be applied in the forcing process and is suitable for growers, saving up to 95% of water volumes normally used for this cultivation practice.
1. Introduction
Environment and natural resources management is one of the most important challenges that agriculture is facing today. The negative environmental footprint of this sector should be reduced, considering the fragility of the environment and exploited resources (water, soil, etc.). At the same time, it is equally essential to obtain higher yields, with high quality and safety, in order to meet the dietary needs of a growing world population. The production increase in agriculture inevitably follows the crops’ genetic improvement and newer agronomic techniques used for their cultivation, taking care to preserve the relations between production, conservation, social and economic values [1].
The water role in agriculture is strategic and is one of the main limiting factors of production. Globally, about 70% of the fresh water used by humans (estimated 3800 km3) is employed in the agricultural sector, 20% in industry and only 10% for civilian use, with an estimated increase by 2050 of 13% [2]. In Italy, the amount of water used for agricultural purposes amounted to 85%, which makes Italy the European country with the highest use [3]. The higher amount of water for agricultural use comes from aqueducts and consortiums based on turn delivery (34.2%) and on demand delivery (28.8%); the underground water uptake accounts for 17.9%, whereas the surface water use is represented by sources outside the farm (11%) and sources inside the farm (4.7%).
Beyond that, it must be considered that the increasing deterioration of irrigation water quality is due to salinization processes, contamination from fertilizers, herbicides, agricultural chemicals, pathogens and heavy metals. Finally, the heterogeneity of rainfall and its intensity has led to significant imbalances in recent years, with negative effects both on crops and on groundwater depth [4].
Vegetables production, as obvious, is particularly dependent on the use of water for irrigation purposes. Consequently, the possible use of new technologies to reduce water consumption and improve water use efficiency is of particular interest. One such technology is the ozone application.
Ozone (O3), bluish gas with a pungent smell, is detectable at concentrations of 0.01 to 0.05 ppm in the air and consists of a dipolar and electrophilic molecule capable of very selective reactions [5]. It is a powerful antioxidant, second only to fluorine, which makes the more powerful disinfectant agent commercially available. The high reactivity of ozone makes it a non-storable product, therefore, it must be produced in the place where it is needed. In addition to the different industrial fields of application, there are many opportunities for O3 use in agriculture and the food industry [6,7]. It can be used to extend the post-harvest life of citrus fruits, tomatoes, and berries [8] by inhibiting the development of pathogens [9,10]. Due to its antimicrobial activity, it can be added in small quantities to the water used as a spray to keep cool the fruit and vegetables in supermarkets, as well as being added in the washing water of different vegetables [11]. Overall, ozone is commonly used in drinking water treatment for two main reasons: its great reactivity and the complete absence of chemical residues [12]. Ozone has been approved by the American Food and Drug Administration for direct use in human food, drugs, and cosmetics and also as compounds in food contact materials such as cutting boards and other surfaces that come into contact with unprotected food [13]. In addition, O3 is listed by the National Organic Program under the list of The National List of Allowed and Prohibited Substances with code (205.605) [14].
As part of the several horticultural products grown in the north-eastern Italy, red chicories (Cichorium intybus L., Rubifolium Group) are one of the most important with more than 8.5 ha and production value of about 200 million euro. It is known that there are different types of chicory obtained in the course of time due to selective processes operated by the growers. Some of these (Radicchio di Verona, Variegato di Castelfranco and Radicchio rosso di Treviso tardivo), especially if PGI certified, require the forcing process to best enhance the aesthetic potential, qualitative and organoleptic characteristics of the final product [15,16].
Among the above-cited chicories, Radicchio rosso di Treviso Tardivo (RTT) is considered by recent statistics the most cultivated with production exceeding 10,000 tons and a total turnover between 70 and 80 million euro. The forcing process is a strategic technique realized by placing the plants under conditions to form new leaves that, in the absence of light, have less or are without chlorophyll pigments, bring out the intense red coloration of the leaf blade, lose their fibrous texture, enhancing the crunchy and pleasantly bitter taste. Forcing the RTT requires high quality well water with temperature of about 11 °C. A similar technique is normally used for the witloof chicory forcing [17,18,19], with the difference that, in this case, plants are maintained in a hydroponic solution with a close circulation system, higher temperatures (14 °C to 23 °C) and plants require a longer period to produce the chicons (around 23 days). RTT plants are, instead, placed vertically in large protected tanks with the root system immersed just in water for the time necessary to reach the right level of maturity. The use of well water of high quality for this practice is extremely important. Roughly, a midsize farm uses approximately 35,000 m3 of well water during the forcing-process season. The sustainability of this production system needs significant improvements, especially considering that the agronomical practice of the forcing process requires about twice the entire water amount for crop growing.
Taking for granted that the need to use high quality water for the forcing process exists, the use of ozone can be useful to reduce the environmental impact of the forcing process by treating the same recirculating water.
With this in mind, the experiment was aimed at the reduction of the water use in a crucial stage of the production process of RTT, the forcing-process phase, developing an alternative pilot system by means of the ozone potential and creating a closed loop.
2. Results and Discussion
2.1. Water Quality
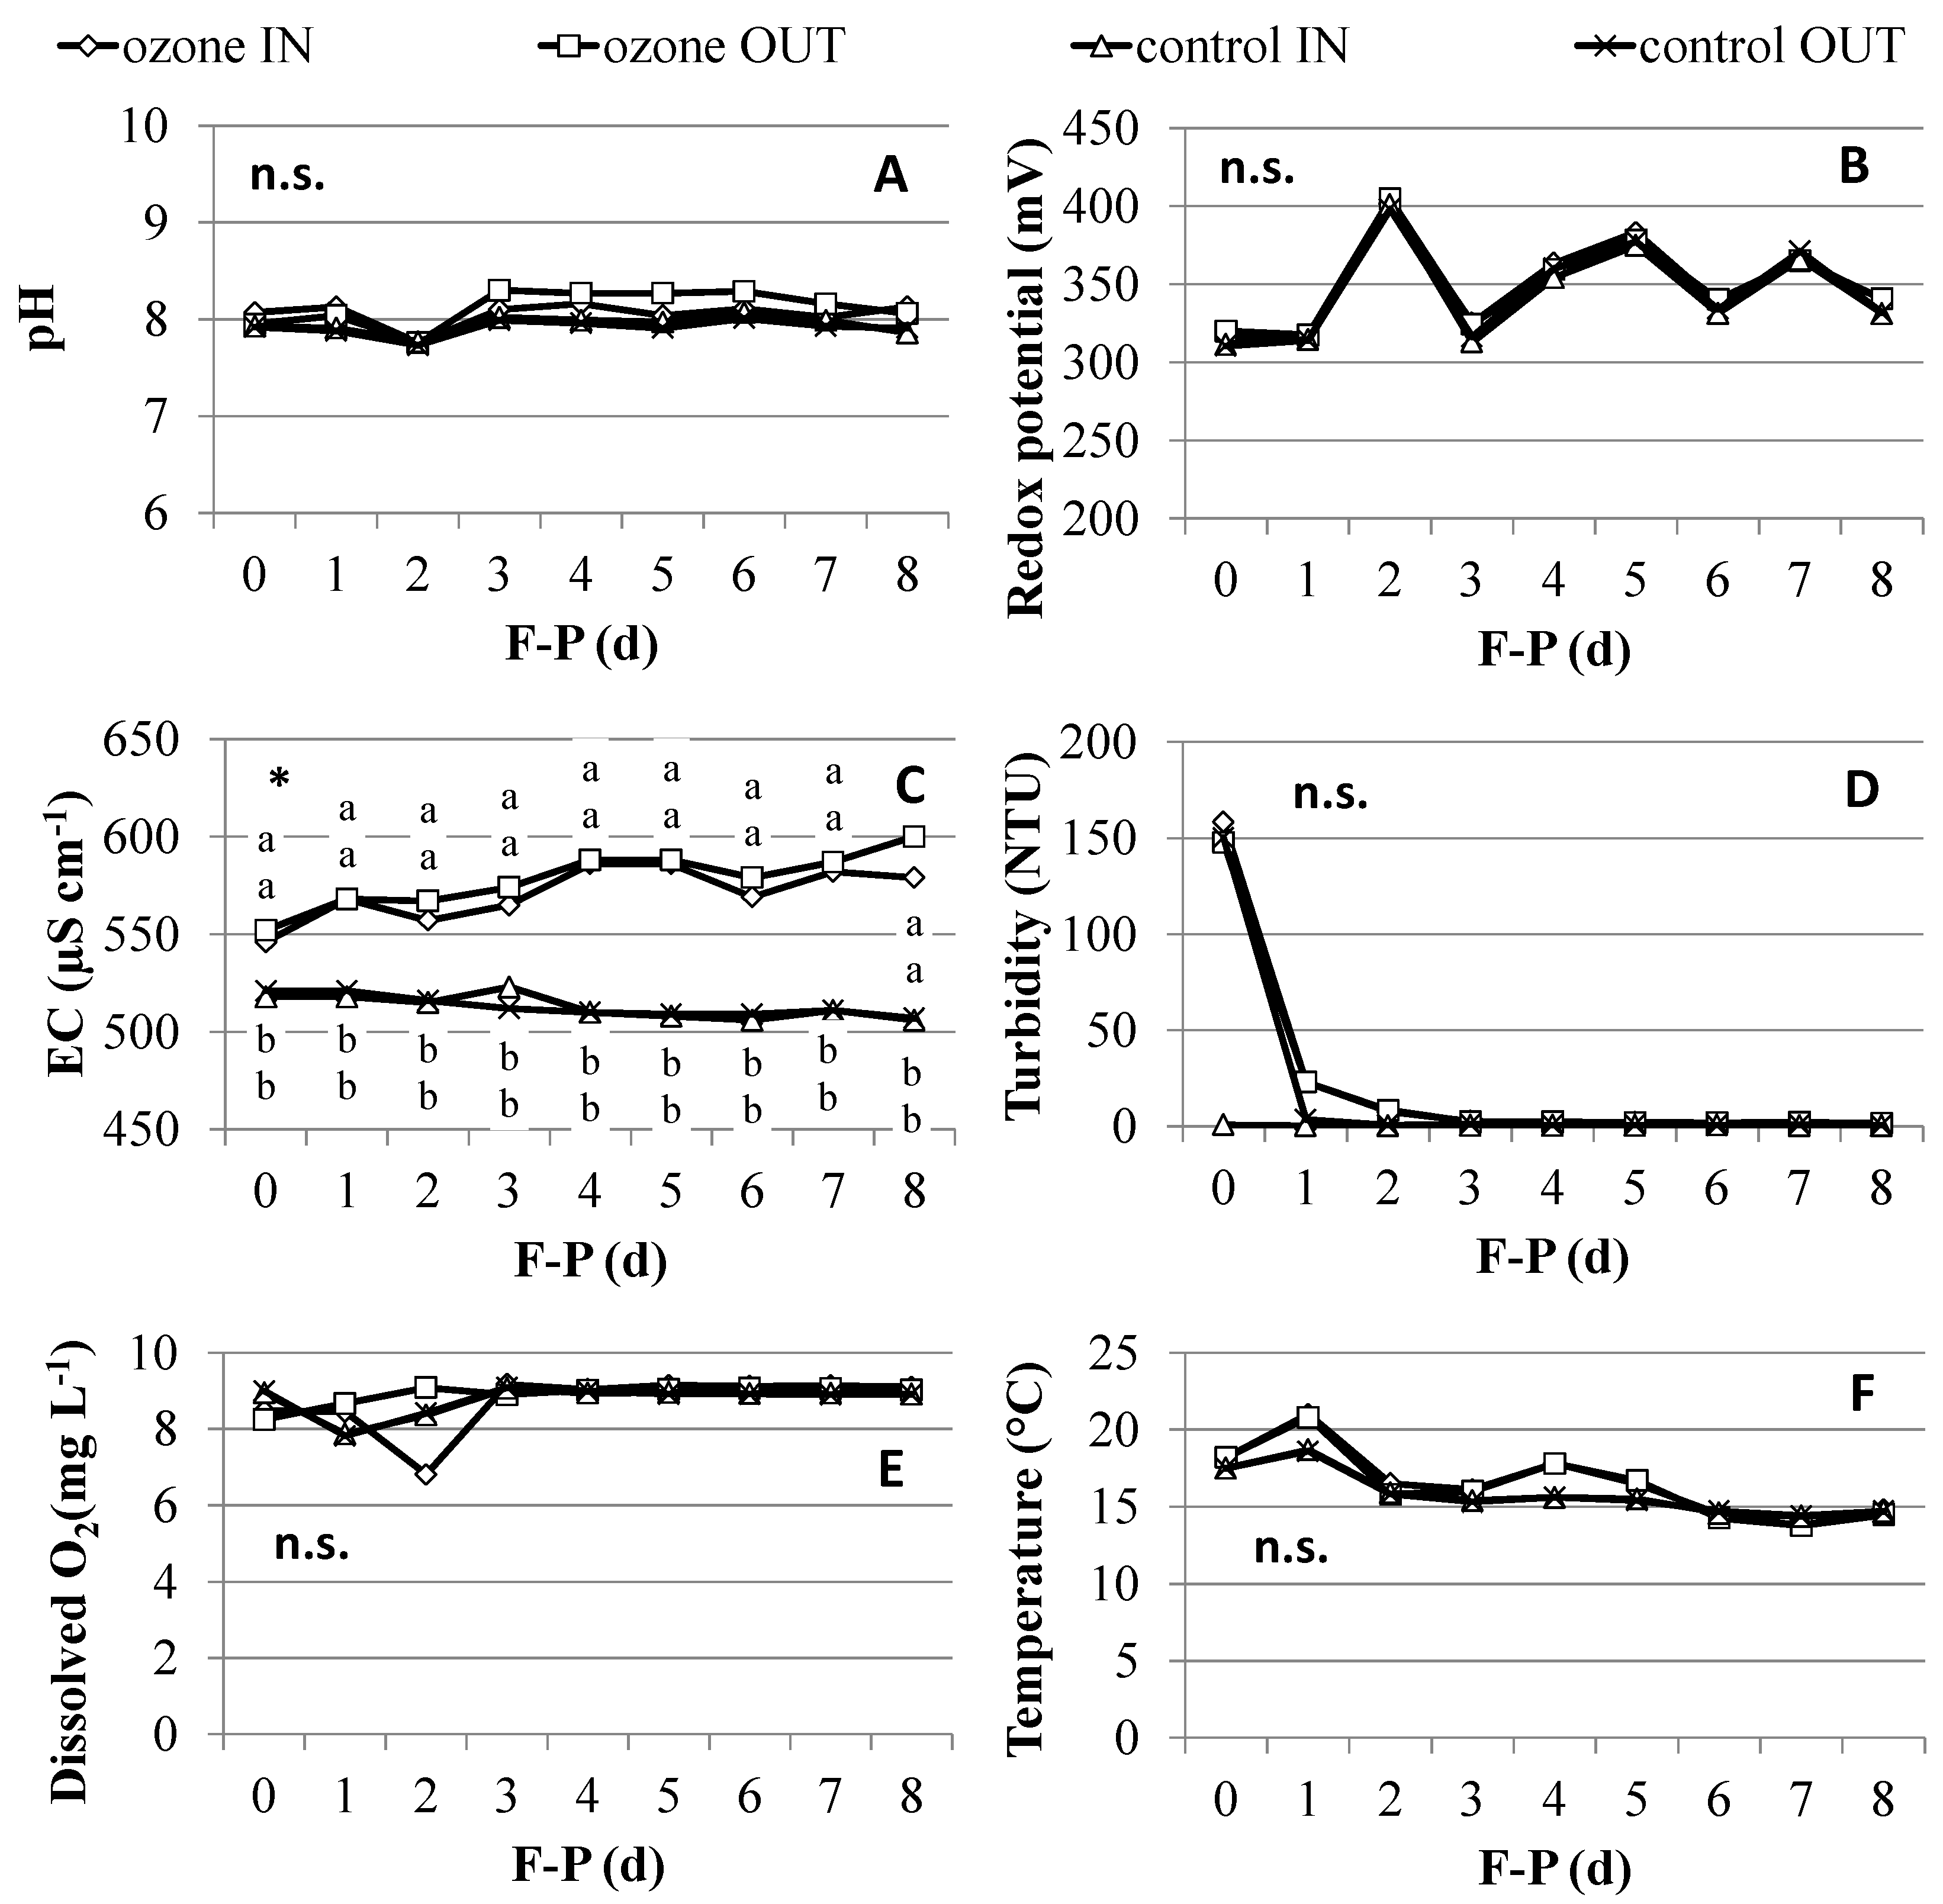
The water pH showed almost stable values, next to 8 in both systems, without significant differences between the inflow water and outflow from the control tank (Figure 1A). A slight difference in pH was observed in the ozonized system between the inflow water and the outflow water after the first stage of adjustment. On average, the pH registered in the inflow water was of 8.09 in contrast to that of outflow water of 8.23. This result, although not significant, indicates the remarkable effect of ozone with respect to the organic substance. The ozonation of waters containing organic matter produces biodegradable by-products such as organic acids, aldehydes, and ketoacids [20]. Moreover, since the ozone generator is fed by air rather than oxygen, some nitrous or nitric acids from the nitrogen oxides can also be produced. These chemical compounds can significantly affect the water pH.
The redox potential showed initial values of 310 mV in both systems, reaching a peak of about 400 mV in the second forcing day to then assuming lower values fluctuating around 350 mV (Figure 1B). The recorded values are perfectly in line with the measurements in the open-loop system, indicating that the oxidant value of the environment treated with ozone ensured similar conditions as determined by a continuous well water flow. The high redox potential measured in the closed-loop system is typically determined by the extreme reactivity of ozone that can oxidize a wide spectrum of compounds and produce highly reactive short-lived free radicals that can further react [21].
The electrical conductivity (EC), although with comparable absolute values between the two systems, presented an opposite trend (Figure 1C). The values were higher in the ozonized system with a starting value of 550 µS cm−1 and increased by 7% in 8 days. In the control, instead, the initial value of the EC was 520 µS cm−1 and decreased by about 3% during the experiment. The EC was higher in the system treated with ozone because it was a closed system where there is no water replacement, and then the water evaporation slightly increased the salts concentration. In the control, the continuous water flows allowed the constant maintenance of the EC level in the tank, increasing the leaching of those that are present in the soil fraction near the root system.
The turbidity in the tank with ozonized water highlighted a peak on the first day of around 150 Nephelometric Turbidity Units (NTU) after RTT containers placement; then, it declined in the following two days by 95% and by 99.3% until the end of the experiment with values of about 1.00 NTU (Figure 1D). The measurements performed in inflow and outflow water showed similar values, perfectly overlapping. In the control, the inflow water was characterized, as is obvious, by constant physical–chemical parameters and an average turbidity throughout the duration of the test of about 0.50 NTU. Regarding outflow water, a peak of 150 NTU was registered on the first day with a fast reduction on the second day reaching values of 3.5 NTU; in the following experimental days, the turbidity settled down at 0.45 NTU (the same value of inflow water). The highest turbidity values were due to plant container immersion in the forcing pool that caused a water contamination with soil. The faster reduction of turbidity in the control system was linked to the continuous input of clean water, resulting in a dilution of suspended particles. In any case, we can say that the water turbidity in the two systems did not present significant differences after the third day of the forcing process. The pre-oxidation applied in this system confirmed what is reported in literature [12]. The main possible points of chemical oxidant introduction are pre-oxidation, intermediate oxidation and final disinfection. Usually, pre-oxidation leads to the elimination of mineral compounds, color, turbidity and suspended solids, bad tastes and odors; in addition, this step partly degrades natural organic matter and inactivates microorganisms; finally, this treatment generally enhances the coagulation–flocculation–decantation step. The turbidity reduction with ozone application is also reported by other authors [22] for surface waters with a turbidity decrease of 40%. Drinking water or swimming pool water are characterized by a 0.2–0.4 NTU in post-ozonation [21]; then, our data showed really good water quality from the turbidity point of view considering that there is a soil contamination.
In the ozonized system, the dissolved oxygen (DO) reached values of 8.25 mg L−1 during the first experimental day and 9 mg L−1 by the third day to the end of the test (Figure 1E) both for inflow and outflow water. In the first two days of the experiment, the two systems did not achieve a balance; the DO readings were variable, probably due to the high presence of organic particles still in the solution. Subsequently, in both systems, the concentration of dissolved oxygen was comparable, demonstrating the good functioning of ozone treatment and water recirculation.
Regarding water temperature (Figure 1F), the results obtained in the two systems were affected, as expected, by the environmental conditions in which the test was held. The maximum temperature recorded in the system with ozone treatment was of 18.2 °C on the first day and the minimum value of 13.8 °C was recorded in the final stages of the experiment. For the control system, water temperature reached the maximum of 17.5 °C on the first day and then was stabilized near 15 °C. Temperatures recorded in the two systems are suitable for high ozone action. In fact, the reaction ability of ozone is significantly affected by the temperature. Usually, ozone depletion rates increase with increasing temperature [23]. First-order kinetic plots indicate that, in general, ozone depletion is first-order in O3 concentration for at least three to four reaction half-lives. Rate constants derived from these plots show that O3 decay rates increase more than one order of magnitude for a temperature range of 5–35 °C. For 5 °C and 15 °C, an initial, fast reaction phase precedes the principal first-order phase. For reactions at 25 °C and 35 °C, there is little or no distinct initial phase and the entire ozone depletion appears to be first-order in (O3) [23]. From the agronomical point of view, the water temperature was higher than optimal values [15,16] for the forcing process in both systems; the higher sensitivity to thermal variations of the environment was measured for the closed loop system. The traditional method allows a constant water temperature to be maintained due to the continuous water exchange. However, it should be considered that under optimum conditions of the radicchio forcing process, these thermal differences tend to fade since the forcing process takes place mainly during winter time. Moreover, a slight increase of temperature compared to optimal values does not affect the product quality, but simply anticipates the marketable stage.
The bactericidal effects of ozone have been studied and documented on a wide variety of organisms, including Gram-positive and Gram-negative bacteria as well as spores and vegetative cells [24,25,26,27] both on food and water [28]. The latter showed that treating water with ozone (1 mg L−1) resulted in a significant reduction (93%) in the number of live cells after 16 min treatment. In our experiment, the amount of viable microorganisms in the water at the end of the experiment was on average 1.4 × 10³ UFC mL−1 in the control and 1.5 × 10⁵ UFC mL−1 in the ozonized system. This result, apparently unfavorable for the closed-loop system, is a good outcome if compared with the open-cycle system. In the latter, the viable microbial load is lower only by 100 times compared to a system with the same water recirculation that is continuously in contact with plants, soil and subjected to the considerable effect of concentration due to evaporation. Additionally, for this aspect, the ozone treatment effectively contributes to the maintenance of good water quality during the forcing process.
2.2. Production and Quality Aspects of RTT
In relation to production aspects, the last part of the experiment was aimed at the evaluation and comparison of the RTT marketable yield and waste after the forcing-process practice. The average marketable production per plant was of 0.19 kg and did not differ between systems (Figure 2A). Plants forced in the ozonized tank showed an average waste of 0.31 kg (Figure 2B), whereas the control plants showed an average waste of 0.25 kg per plant. The difference is apparently higher in the ozone treatment, but not statistically different. The average height of the marketable head did not differ between forcing systems and was of 0.14 m (Figure 2C). Similar to what is found for the plant height, the head basal diameter also did not substantially vary in relation to the used system (Figure 2D).
Concerning the qualitative parameters of the commercial product, pH, EC, soluble solids, titratable acidity and total phenols were not affected by the forcing system (Table 1).
Only the total antioxidant activity (TAA) content was significantly higher (14.1%) in plants forced in the ozonized system. The ozone effect on the antioxidants content in vegetables has been addressed in several studies [29,30]. However, O3 is often employed directly on the product in gaseous form, with modified atmosphere [31], or as a disinfection treatment in fresh-to-eat products [32,33]. Limited are the studies that evaluate the use of ozone in the water where the product is dipped [34,35] and, to our knowledge, there is no information about plant growing inside ozonized water. Some recent studies used ozone for nutrient solution sanitization in hydroponics [14], but no reference is made to the product quality. Many fresh-to-eat food products showed an antioxidant increase after ozone treatment in a modified atmosphere [36,37], whereas in terms of ozonized water, the answer seems to be also linked to the species used. Some experiments [34] reported that treating broccoli with ozonized water did not alter phenols and antioxidants content. In this experiment, instead, the water treatment increased the amount of antioxidants in the whole plant and the commercial product. This effect can be connected to the high reducing power that could act at root level by increasing the stress to the plant. However, no root system damages were observed in this trial because the ozone surplus in the system was dispersed by the ozone gas exhauster unit. However, any residual concentrations of 0.2–0.3 mg O3 L−1 can cause root injury when immersing plant roots in ozonized water [38].
For RTT, the increase of TAA can be a good result because of the nutritional value of the product, but could also affect the bitter taste perceived by the consumer. As known, in fact, many of the antioxidant components present in radicchio confer a bitter taste to the product [39]. For this reason, the determination of sesquiterpene lactones (SLs) was carried out in order to evaluate whether the increase of total antioxidants is due to this class of compounds. In Table 2, the main SLs values that determine the bitter taste in chicory are reported.
It is possible to observe that both forcing systems did not affect these qualitative traits, despite the content of SLs being slightly higher in plants treated with ozone. Consequently, it is possible to exclude a negative effect of the increasing content of TAA in the commercial product. In order to determine the general quality assessment of the product from the antioxidants point of view, the phenolic acids content was also measured (Table 3).
Also in this case, the main phenolic acids in RTT were chicoric acid and chlorogenic acid [40,41,42]. The antioxidant and radical scavenger activity of phenolic compounds is well documented, in particular, caffeic acid derivatives can act as anti-inflammatory [43], skin photo damage protectors [44] and chicoric acid showed anti-HIV-1 activity [45]. The results displayed that the forced chicory in the ozonized system has a significantly higher content of chicoric acid compared to control plants. This could be the reason for the higher TAA in radicchio forced in ozonized water. Regarding sugars content in the marketable product, no significant differences were observed between treatments (Table 3).
Overall, considering both water features and RTT quality, we can say that the ozone application is able to maintain a good balance in the system without significantly altering the quality of the product. These results may have an additional advantage since this pilot system could be applied to other vegetable crops that require similar treatment or nutrient solution recirculation systems. In this regard, witloof chicory presents considerable problems during forcing [19]. The hydroponic forcing is a very specific type of culture system in which a nutrient solution recirculates in a closed system providing excellent conditions for disease outbreak [45]. Such a system favors the fast growing and uniform spread of the pathogen, enforced by a genetically uniform host and a controlled physical environment [46,47]. The primary concern of witloof chicory growers is to prevent the pathogen from entering the forcing system. The application of the pilot system shown in this trial could also be a useful tool for other growing contexts.
2.3. Cost Considerations
The outputs obtained in this preliminary experiment showed the real opportunity of applying ozone technology to the forcing system in red chicory. The yield, essential for farmers, is comparable to that of traditional water system management. Consequently, some concluding remarks about environmental and economics traits can be made. In terms of environmental sustainability, water saving seems to be an extremely interesting parameter. The system with ozone application allowed the same production to be obtained using about 1% of the water used in the traditional system with a significant effect on the environment and on water resources saving. Regarding the water management for the following forcing cycles, the water volume can be simply integrated with fresh water. This is in accordance with both the losses due to evaporation and plant transpiration and water losses related to the plants’ handling. From the economical point of view, the setting up costs of a full-scale system can be estimated around 2000 € (2100 US$) with an exercise energy cost of about 500 € (530 $) per growing season (about six months) assuming a 24-h working system. These costs represent an additional expense, even if limited, to the RTT production cost while the well water use continues to be free. If we consider the average price for the irrigation water equal to 0.20 €/m3 (0.21 $), and the amount of 35,000 m3 of water per season for an average farm, the production costs related to the forcing process can easily reach 7000 € (7500 $) per season. In the latter case, the pilot system adopted in this experiment seems to be convenient.
3. Materials and Methods
3.1. Forcing Process Systems
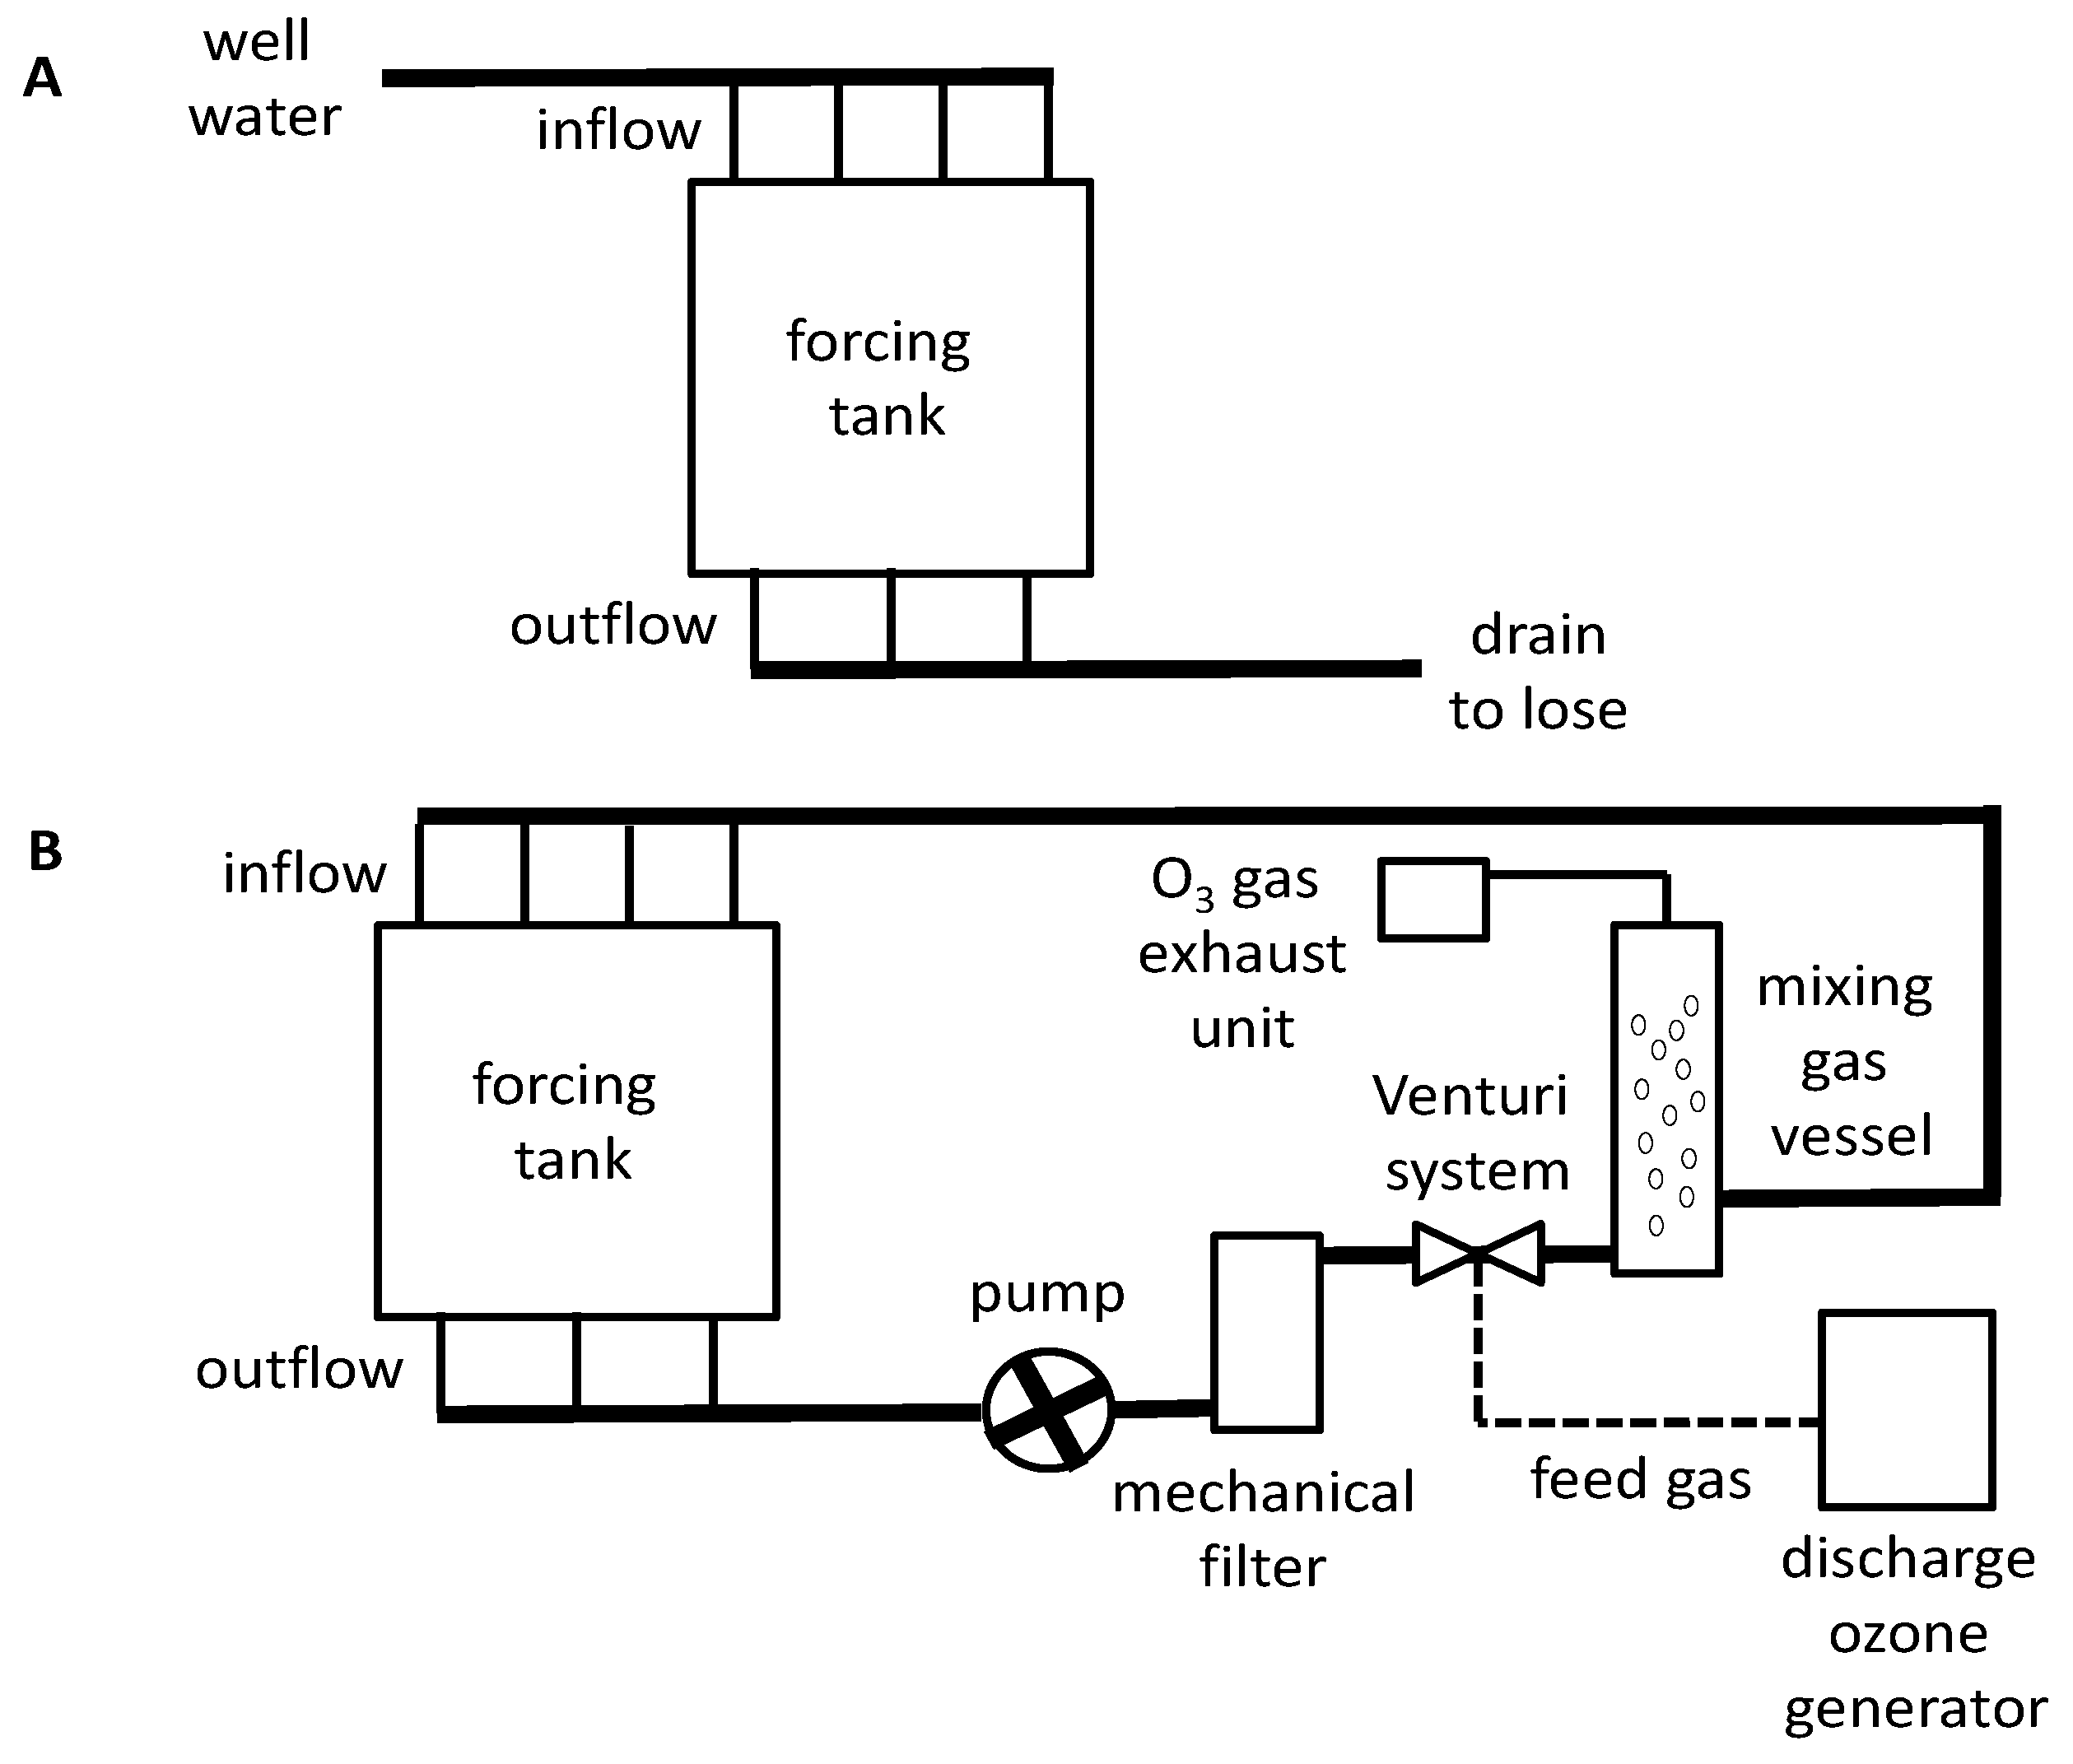
The trial was carried out in April 2016 at the “L. Toniolo” Experimental Farm of Padua University at Legnaro, NorthEast Italy (45°20′ N; 11°57′ E). The experimental set was built inside a greenhouse-tunnel. The two forcing-process systems are reported in Figure 3.
The first one (Figure 3A) shows the solution normally adopted by the growers, i.e., forcing tanks fed with well water and a drain to release water (in this case, a water flow of 5 L min−1 was used to simulate well water flow); Figure 3B, instead, reports the innovative system equipped with the same tank for the forcing process, a suction pump for water recirculation (60 L min−1), a mechanical filter and an ozone generator (0.5 g h−1, Del Ozone, CA, USA) that can handle volumes up to about 95,000 L of water. The ozone generator was combined with a mixing vessel in order to increase the oxidation power of ozone towards organic material. After conclusion of this phase, the treated water reenters the forcing tank, continuing with new cycles of ozonizing treatment. The forcing-process tank had a surface area of 2 m2, a depth of 0.30 m and was filled up with 300 L of water. In order to facilitate soil fraction settling, both systems were equipped with a stainless steel net, 50 mm from the bottom, on which the plant containers were placed.
3.2. Plant Material
The RTT plant material was cultivated by a professional grower at Zero Branco (Treviso province, north-eastern Italy, 45°36′ N; 12°10′ E) on a loamy soil (sand 36%, silt 38% and clay 26%). The main crop management practices and dates are reported in Table 4.
On 21 January, plants were harvested and, after having cut the main root at about 0.15 m, were placed in cold storage at 1.0–1.5 °C until the trial. The experiment with RTT began on 20 April. The starting data were intentionally delayed to maximize the issues related to the possible formation of algae in the ozonized system. Both the control and the ozonized system were activated using well water. Subsequently, in both forcing tanks, six containers with 30 plants each (two containers for replication) were positioned and the plant root system was completely immerged in the water.
3.3. Water Analysis and Plant Sampling
During the experiment (20–27 April), water physico-chemical characteristics were daily monitored with a Hach Lange HQ40d multi-parametric probe (Hach, Loveland, CO, USA) to detect pH, redox potential (ORP), dissolved oxygen (DO) and electrical conductivity (EC) whereas water turbidity was measured with a turbidimeter (Hanna Instruments HI83414, Bedfordshire, UK) and expressed in Nephelometric Turbidity Units (NTU). The water total microbial count (CFU mL−1) was also measured at the end of the test in both systems (UNI EN ISO 6222:2001). At the marketable stage, defined with the formation of new inner leaves, plants were removed and subjected to the usual cleaning procedure. The morphological traits of the plants, the marketable yield and waste biomass were measured at the same time. Dry matter was obtained in a PID system ventilated oven (model M80-VF; Instruments; Bernareggio, MI, USA) set at 65 °C for 72 h. The fresh marketable sample of each replication was cut in big pieces, immediately frozen at −80 °C overnight, freeze-dried and ground before extraction for further qualitative analysis. The pH, EC, soluble solids (°Brix) and titratable acidity (ISO 750 method) were measured on juice obtained after filtering unfrozen sample fractions.
3.4. Extraction of Phenols for Analysis
RTT freeze-dried samples (0.2 g) were homogenized in methanol (20 mL) with an Ultra Turrax T25 (IKA, Staufen, Germany) until uniform consistency at 13,500 rpm. Samples were filtered (filter paper, 589 Schleicher) and appropriate aliquots of extracts were assayed by Folin Ciocalteau (FC) assay for total phenols (TP) content and by Ferric Reducing Antioxidant Power (FRAP) assay for total antioxidant activity. Concerning HPLC analysis, extracts were further filtered through cellulose acetate syringe filters (0.45 µm). For each sample, triplicate extractions and analyses were carried out.
3.5. Determination of Total Phenols by the Folin Ciocalteu Assay
The content of TP was determined using the FC assay with gallic acid as calibration standard, by a Shimadzu UV-1800 spectrophotometer (Shimadzu, Kyoto, Japan). The FC assay was carried out by pipetting 200 µL of RTT extract into a 10 mL polypropylene tube. This was followed by addition of 1 mL of FC’s reagent. The mixture was vortexed for 30 s, and 800 µL of filtered 20% sodium carbonate solution was added after 1 minute and before 8 min of the addition of the FC reagent. This was recorded as time zero; the mixture was then vortexed for 30 s after the addition of sodium carbonate. After 2 h at room temperature, the absorbance of the colored reaction product was measured at 765 nm. The content of TP in the extracts was calculated from a standard calibration curve, built with different concentrations of gallic acid, ranging from 0 to 600 µg mL−1 (R2 = 0.9982). Results were expressed on the basis of mg of Gallic Acid Equivalent per kg (mg GAE kg−1) of dried RTT powder [48].
3.6. Determination of Total Antioxidant Activity by Ferric Reducing Antioxidant Power
The FRAP reagent was prepared fresh so that it contained 1 mM 2,4,6-tripyridyl-2-triazine and 2 mM ferric chloride in 0.25 M sodium acetate at pH 3.6 [49]. A 100 µL aliquot of the methanol extract prepared as above was added to 1900 µL of FRAP reagent and accurately mixed. After leaving the mixture at 20 °C for 4 min, the absorbance at 593 nm was determined. Calibration was against a standard curve (0–1200 µg mL−1 ferrous ion) produced by the addition of freshly prepared ammonium ferrous sulfate. FRAP values were calculated as mg mL−1 ferrous ion (ferric reducing power) from three determinations and are presented as mg of Fe2+E (ferrous ion equivalent) kg−1 dw.
3.7. Separation and Analysis of Free Phenolic Acids by HPLC
The phenolic acids were separated and quantified using a HPLC-DAD constituted of a Jasco X-LC system (LabX, Midland, ON, Canada), consisting of a model PU-2080 pump, a multiwavelength detector (mod. MD-2015), an autosampler (mod. AS-2055) and a column oven (mod. CO-2060). ChromNAV Chromatography Data System software (JASCO Inc., Tokyo, Japan) was used for result analyses. The separation of phenolic acids was achieved on a Tracer Extrasil OSD2 column (5 µm, 250 × 4.6 mm), operating at 35 °C, at a flow rate of 1 mL min−1. The mobile phase consisted of two solvents: 0.1% acid formic (A) and methanol (B). Gradient elution was as follows: 0–100% B over 50 min and held at 100% B for an additional 10 min to clean up the column. Two wavelengths (310 and 325 nm) were used to detect eluent composition. HPLC analysis at 325 nm was used for quantification of chlorogenic, caffeic and ferulic acids. Quantification of p-coumaric acid was performed at 310 nm. Phenolic acids were quantified following a calibration method. Standards ranging from 0.3 to 30 mg L−1 were used.
3.8. Quantitative Determination of Sugars by HPLC
The liquid chromatography apparatus utilized in these analyses was a Jasco X.LC system (JASCO Inc., Tokyo, Japan) consisting of a model PU-2080 pump, a model RI-2031 refractive index detector, a model AS-2055 autosampler and a model CO-2060 column. ChromNAV Chromatography Data System was used as software. The separation of sugars was achieved on a Hyper-Rez XP Carbohydrate Pb++ analytical column (7.7 mm × 300 mm, ThermoFisher Scientific, Waltham, MA, USA), operating at 80 °C. Isocratic elution was effected using water at a flow rate of 0.6 mL min−1. D-(+)-glucose and D-(-)-fructose were quantified following a calibration method. All standards utilized in the experiments were accurately weighed, dissolved in water and the calibration curves were generated with concentrations ranging from 100 mg L−1 to 1000 mg L−1 of standards.
3.9. Extraction of Sesquiterpene Lactones (SLs)
A freeze-dried sample (0.5 g) was weighed in a screw-cap plastic centrifuge tube to which was added 100 μg of santonin (internal standard, methanolic solution) and 15 mL of 2% (v/v) formic acid in methanol/water 4/1 (v/v). The sample was then shaken on a vortex stirrer for 1 min, sonicated at room temperature for 10 min and then centrifuged at 4000× g for 10 min. After collection of the supernatant fraction, the extraction procedure was repeated. The extracts were pooled, dried under reduced pressure at 35 °C, subjected to nitrogen flux for 5 min, and recovered with 2 mL of methanol. Before SPE, the SL fraction was centrifuged at 4000× g for 10 min to remove solid particles. SLs were purified from phenols and other interfering compounds by SPE, employing silica cartridges (3 mL reservoir, 500 mg sorbent mass). The cartridges were conditioned with 6 mL of dichloromethane/isopropanol 1/1 (v/v), equilibrated with 6 mL of dichloromethane and, after sample loading, eluted with 6 mL of dichloromethane/ethyl acetate 3/2 (v/v). Both the loading and elution fractions were collected, dried under reduced pressure at 35 °C, recovered with 1 mL of methanol/water 1/1 (v/v), filtered in a HPLC glass vial through a nylon syringe filter (diameter: 13 mm; pore dimension: 0.45 μm) and stored at −18 °C. The HPLC analysis of SLs was then performed [39].
3.10. Statistical Analysis
In this experiment, replication through time (for systems) and space (for plants) rather than through independent experimental units was used. The normality of data was checked using the Kolmogorov–Smirnov test. Data were normally distributed, so one-way analysis of variance (ANOVA) was adopted for their statistical analysis. In the case of a significant F-value, the means were compared with Tukey’s Honestly Significant Difference test at the significance level of p < 0.05. Two treatments, represented by different forcing systems, were considered. All the qualitative analyses were performed in triplicates.
4. Conclusions
Although the results reported in this paper are preliminary, and thus need to be confirmed in further trials, they indicate that ozone is also able to sanitize waters rich in suspended solids (such as those of the chicory forcing process) obtaining physical–chemical characteristics comparable with those of well water in combination with a proper recirculation and avoiding stagnation in the tank. This result suggests that this technique should be further developed and adapted for water volumes reduction and disinfection for other vegetable crops during post-harvest processing.
The RTT marketable yield was comparable to that obtained with the traditional system. The results of this preliminary test were also potentially encouraging from an environmental and economical point of view. In the first case, the same production was obtained saving up to 99% of the traditionally used water; regarding the estimated energy cost and management, a full-scale system could be conveniently used assuming a future, but probable, cost of well water for irrigation.
Acknowledgments
Thanks to the company Venturini sas for the ozone generation system supply and the Florian farm for the collaboration in the experiment.
Author Contributions
C.N. and P.S. conceived and designed the experiments; C.N. and C.M. performed the experiments; C.N. analyzed the data; C.N., C.M. and P.S. wrote the paper.
Conflicts of Interest
The authors declare no conflict of interest.
Abbreviations
The following abbreviations are used in this manuscript:
| RTT | Radicchio rosso di Treviso Tardivo |
| ANOVA | Analysis Of Variance |
| FRAP | Ferric Reducing Antioxidant Power |
| GAE | Gallic Acid Equivalent |
| FC | Folin Ciocalteau |
| SLs | Sesquiterpene Lactones |
| TP | Total Phenols |
| TAA | Total Antioxidant Activity |
| EC | Electrical Conductivity |
| NTU | Nephelometric Turbidity Units |
| DO | Dissolved Oxygen |
References
- Pisante, M.; Stagnari, F. L’agricoltura Sostenibile. 2013. Available online: http://hdl.handle.net/11575/12668 (accessed on 3 April 2017).
- Pisante, M. Agricoltura Sostenibile Principi. In Sistemi E Tecnologie Applicate All’agricoltura Produttiva Per La Salvaguardia Dell’ambiente E La Tutela Climatica; Edagricole-New Business Media Srl: Milano, Italy, 2013. [Google Scholar]
- Adinolfi, F.; Di Pasquale, J. L’impronta idrica dell’Italy. 2014. Available online: http://www.expo2015.org/magazine/it/cultura/il-buon-uso-dell-acqua-conviene-a-tutti.html (accessed on 3 April 2017).
- Falloon, P.; Betts, R. Climate impacts on European agriculture and water management in the context of adaptation and mitigation—The importance of an integrated approach. Sci. Total Environ. 2010, 408, 5667–5687. [Google Scholar] [CrossRef] [PubMed]
- Guzel-Seydim, Z.B.; Greene, A.K.; Seydim, A.C. Use of ozone in the food industry. Food Sci. Technol. 2004, 37, 453–460. [Google Scholar] [CrossRef]
- Kim, J.G.; Yousef, A.E.; Dave, S. Application of ozone for enhancing the microbiological safety and quality of foods: A review. J. Food Protect. 1999, 62, 1071–1087. [Google Scholar] [CrossRef]
- Kim, J.G.; Yousef, A.E.; Khadre, M.A. Ozone and its current and future application in the food industry. Adv. Food Nutr. Res. 2003, 45, 167–218. [Google Scholar] [PubMed]
- Soliva-Fortuny, R.C.; Martín-Belloso, O. New advances in extending the shelf-life of fresh-cut fruits: A review. Trends Food Sci. Technol. 2003, 14, 341–353. [Google Scholar] [CrossRef]
- Akata, I.; Torlak, E.; Erci, F. Efficacy of gaseous ozone for reducing microflora and foodborne pathogens on button mushroom. Postharvest Biol. Technol. 2015, 109, 40–44. [Google Scholar] [CrossRef]
- Wani, S.; Maker, J.K.; Thompson, J.R.; Barnes, J.; Singleton, I. Effect of ozone treatment on inactivation of Escherichia coli and Listeria sp. on Spinach. Agriculture 2015, 5, 155–169. [Google Scholar] [CrossRef]
- Bermúdez-Aguirre, D.; Barbosa-Cánovas, G.V. Disinfection of selected vegetables under nonthermal treatments: Chlorine, acid citric, ultraviolet light and ozone. Food Control 2013, 29, 82–90. [Google Scholar] [CrossRef]
- Camel, V.; Bermond, A. The use of ozone and associated oxidation processes in drinking water treatment. Water Res. 1998, 32, 3208–3222. [Google Scholar] [CrossRef]
- Kobayashi, F.; Ikeura, H.; Ohsato, S.; Goto, T.; Tamaki, M. Disinfection using ozone microbubbles to inactivate Fusarium. oxysporum f. sp. melonis and Pectobacterium. carotovorum subsp. carotovorum. Crop Protect. 2011, 30, 1510–1518. [Google Scholar]
- Msayleb, N.; Kanwar, R.; Robertson, A.; Wu, H. Ozone inactivation of Fusarium oxysporum conidia in hydroponic nutrient solutions. In Soil Ozonation as a Sustainable Alternative to Methyl Bromide Fumigation and Synthetic Pesticides, Graduate Theses and Dissertations; Iowa State University: Ames, IA, USA, 2014; pp. 74–95. [Google Scholar]
- Nicoletto, C.; Pimpini, F. Influence of the forcing process on some qualitative aspects in radicchio “Rosso di Treviso tardivo” (Cichorium. intybus L., group rubifolium). 1. Nitrate, nitrite and organic nitrogen. Italy J. Agron. 2009, 4, 137–146. [Google Scholar] [CrossRef]
- Nicoletto, C.; Pimpini, F. Influence of the forcing process on some qualitative aspects in radicchio “Rosso di Treviso Tardivo” (Cichorium. intybus L., group rubifolium). 2. Antioxidant capacity, phenols and ascorbic acid. Ital. J. Agron. 2010, 5, 43–52. [Google Scholar] [CrossRef]
- Vertregt, N.; Van Kruistum, G. Redistribution of dry matter and carbohydrates in witloof chicory during forcing. Sci. Hortic. 1989, 39, 271–278. [Google Scholar] [CrossRef]
- Fouldrin, K.; Limami, A. The influence of nitrogen (15NO3) supply to chicory (Cichorium. intybus L.) plants during forcing on the uptake and remobilization of N reserves for chicon growth. J. Exp. Bot. 1993, 44, 1313–1319. [Google Scholar] [CrossRef]
- De Jonghe, K.; De Dobbelaere, I.; Sarrazyn, R.; Höfte, M. Control of brown root rot caused by Phytophthora cryptogea in the hydroponic forcing of witloof chicory (Cichorium. intybus var. foliosum) by means of a nonionic surfactant. Crop Protect. 2005, 24, 771–778. [Google Scholar]
- Siddiqui, M.S.; Amy, G.L.; Murphy, B.D. Ozone enhanced removal of natural organic matter from drinking water sources. Water Res. 1997, 31, 3098–3106. [Google Scholar] [CrossRef]
- Gottschalk, C.; Libra, J.A.; Saupe, A. Ozonation of Water and Waste Water: A Practical Guide to Understanding Ozone and Its Applications; Wiley-VCH: Weinheim, Germany, 2009. [Google Scholar]
- Kainulainen, T.K.; Tuhkanen, T.A.; Vartainen, T.K.; Kalliokoski, P.J. Removal of residual organics from drinking water by ozonation and activated carbon filtration: A pilot plant study. Ozone Sci. Eng. 1995, 17, 449–462. [Google Scholar] [CrossRef]
- Elovitz, M.S.; von Gunten, U.; Kaiser, H.P. Hydroxyl radical/ozone ratios during ozonation processes. II. The effect of temperature, pH, alkalinity, and DOM properties. Ozone Sci. Eng. 2000, 22, 123–150. [Google Scholar] [CrossRef]
- Restaino, L.; Frampton, E.W.; Hemphill, J.B.; Palnikar, P. Efficacy of ozonated water against various food-related microorganisms. Appl. Environ. Microb. 1995, 61, 3471–3475. [Google Scholar]
- Khadre, M.A.; Yousef, A.E.; Kim, J.G. Microbiological aspects of ozone applications in food: A review. J. Food Sci. 2001, 66, 1242–1252. [Google Scholar] [CrossRef]
- Karaca, H.; Velioglu, Y.S. Effects of ozone treatments on microbial quality and some chemical properties of lettuce, spinach, and parsley. Postharvest Biol. Technol. 2014, 88, 46–53. [Google Scholar] [CrossRef]
- Pérez, A.; Poznyak, T.; Chairez, I. Microorganism inactivation by ozone dissolved in aqueous solution: A kinetic study based on bacterial culture lipid unsaturation. Ozone Sci. Eng. 2015, 37, 119–126. [Google Scholar] [CrossRef]
- Al-Hashimi, A.M.; Mason, T.J.; Joyce, E.M. Combined effect of ultrasound and ozone on bacteria in water. Environ. Sci. Technol. 2015, 49, 11697–11702. [Google Scholar] [CrossRef] [PubMed]
- Skog, C.L.; Chu, L.J. Effect of ozone on qualities of fruits and vegetables in cold storage. Can. J. Plant Sci. 2001, 81, 773–778. [Google Scholar] [CrossRef]
- Glowacz, M.; Rees, D. The practicality of using ozone with fruit and vegetables. J. Sci. Food Agric. 2016, 96, 4637–4643. [Google Scholar] [CrossRef] [PubMed]
- Fagundes, C.; Moraes, K.; Perez-Gago, M.B.; Palou, L.; Maraschin, M.; Monteiro, A.R. Effect of active modified atmosphere and cold storage on the postharvest quality of cherry tomatoes. Postharvest Biol. Technol. 2015, 109, 73–81. [Google Scholar] [CrossRef]
- Oliveira, M.; Abadias, M.; Usall, J.; Torres, R.; Teixidó, N.; Viñas, I. Application of modified atmosphere packaging as a safety approach to fresh-cut fruits and vegetables–A review. Trends Food Sci. Technol. 2015, 46, 13–26. [Google Scholar] [CrossRef]
- Zhang, M.; Meng, X.; Bhandari, B.; Fang, Z. Recent developments in film and gas research in modified atmosphere packaging of fresh foods. Crit. Rev. Food Sci. 2016, 56, 2174–2182. [Google Scholar] [CrossRef] [PubMed]
- Lima, G.P.P.; Machado, T.M.; Oliveira, L.M.D.; Borges, L.D.S.; Pedrosa, V.D.A.; Vanzani, P.; Vianello, F. Ozonated water and chlorine effects on the antioxidant properties of organic and conventional broccoli during postharvest. Sci. Agric. 2014, 71, 151–156. [Google Scholar] [CrossRef]
- Koukounaras, A.; Papachristodoulou, M.; Chatzidimos, C.; Tsouvaltzis, P.; Gerasopoulos, D.; Siomos, A.S. The effects of ozone treatment on quality and biochemical parameters of fresh-cut lettuce. Acta Hortic. 2016, 1142, 349–354. [Google Scholar] [CrossRef]
- Bortolin, R.C.; Caregnato, F.F.; Junior, A.M.D.; Zanotto-Filho, A.; Moresco, K.S.; de Oliveira Rios, A.; Gelain, D.P. Chronic ozone exposure alters the secondary metabolite profile, antioxidant potential, anti-inflammatory property, and quality of red pepper fruit from Capsicum baccatum. Ecotox. Environ. Saf. 2016, 129, 16–24. [Google Scholar] [CrossRef] [PubMed]
- Xue, Z.; Li, J.; Yu, W.; Lu, X.; Kou, X. Effects of nonthermal preservation technologies on antioxidant activity of fruits and vegetables: A review. Food Sci. Technol. Int. 2016, 22, 440–458. [Google Scholar] [CrossRef] [PubMed]
- Matsuo, M. Ozone sterilizing for the plant pathogenic fungi in the solution of soilless culture: The case of microconidia of Fusarium. oxysporum cucumerinum. J. Jpn. Soc. Agric. Mach. 1993, 55, 105–111. [Google Scholar]
- Graziani, G.; Ferracane, R.; Sambo, P.; Santagata, S.; Nicoletto, C.; Fogliano, V. Profiling chicory sesquiterpene lactones by high resolution mass spectrometry. Food Res. Int. 2015, 67, 193–198. [Google Scholar] [CrossRef]
- Jaiswal, R.; Kiprotich, J.; Kuhnert, N. Determination of the hydroxycinnamate profile of 12 members of the Asteraceae. family. Phytochemistry 2011, 72, 781–790. [Google Scholar] [CrossRef] [PubMed]
- Carazzone, C.; Mascherpa, D.; Gazzani, G.; Papetti, A. Identification of phenolic constituents in red chicory salads (Cichorium. intybus) by high-performance liquid chromatography with diode array detection and electrospray ionisation tandem mass spectrometry. Food Chem. 2013, 138, 1062–1071. [Google Scholar] [CrossRef] [PubMed]
- Innocenti, M.; Gallori, S.; Giaccherini, C.; Ieri, F.; Vincieri, F.F.; Mulinacci, N. Evaluation of the phenolic content in the aerial parts of different varieties of Cichorium. intybus L. J. Agric. Food Chem. 2005, 53, 6497–6502. [Google Scholar] [CrossRef] [PubMed]
- Speroni, E.; Covoni, P.; Guizzardi, S.; Renzulli, C.; Guerra, M.C. Anti-inflammatory and cicatrizing activity of Echinacea pallida Nutt. root extract. J. Ethnopharmacol. 2002, 79, 265–272. [Google Scholar] [CrossRef]
- Maffei Facino, R.; Carini, M.; Aldini, G.; Saibene, L.; Pietta, P.; Mauri, P. Echinacoside and caffeoyl conjugates protect collagen from free radical-induced degradation: A potent use of Echinacea extacts in the prevention of skin photodamage. Planta Med. 1995, 61, 510–514. [Google Scholar] [CrossRef]
- Lin, Z.; Neamati, N.; Zhao, H.; Kiryu, Y.; Turpin, J.A.; Aberham, C.; Strebel, K.; Kohn, K.; Witvrouw, M.; Pannacoque, C.; et al. Chicoric acid analogues as HIV-1 integrase inhibitors. J. Med. Chem. 1999, 42, 1401–1414. [Google Scholar] [CrossRef] [PubMed]
- Stanghellini, M.E.; Rasmussen, S.L.; Kim, D.H.; Rorabaugh, P.A. Efficacy of nonionic surfactants in the control of zoospore spread of Pythium. aphanidermatum in a recirculating hydroponic system. Plant. Dis. 1996, 80, 422–428. [Google Scholar] [CrossRef]
- Stanghellini, M.E.; Rasmussen, S.L. Hydroponics—A solution for zoosporic pathogens. Plant Dis. 1994, 78, 1129–1138. [Google Scholar] [CrossRef]
- Singleton, V.L.; Orthofer, R.; Lamuela-Raventós, R.M. Analysis of total phenols and other oxidation substrates and antioxidants by means of folin-ciocalteu reagent. Methods Enzymol. 1999, 299, 152–178. [Google Scholar]
- Benzie, I.F.; Strain, J.J. The ferric reducing ability of plasma (FRAP) as a measure of “antioxidant power”: The FRAP assay. Anal. Biochem. 1996, 239, 70–76. [Google Scholar] [CrossRef] [PubMed]
Figure 1.
Influence of ozone treatment on the main water physical and chemical parameters during the forcing process (F-P): pH (A), redox potential (B), electrical conductivity (C), turbidity (D), dissolved O2 (E) and temperature (F). Within each parameter, different letters indicate significant differences for each monitoring day according to the Tukey’s Honest Significant Difference test at p < 0.05.

Figure 2.
Influence of ozone treatment on production and morphological traits in Radicchio rosso di Treviso tardivo: marketable yield (A), waste production (B), marketable plant height (C) and plant basal diameter (D). Within each parameter, different letters indicate significant differences according to the Tukey’s Honest Significant Difference test at p < 0.05.
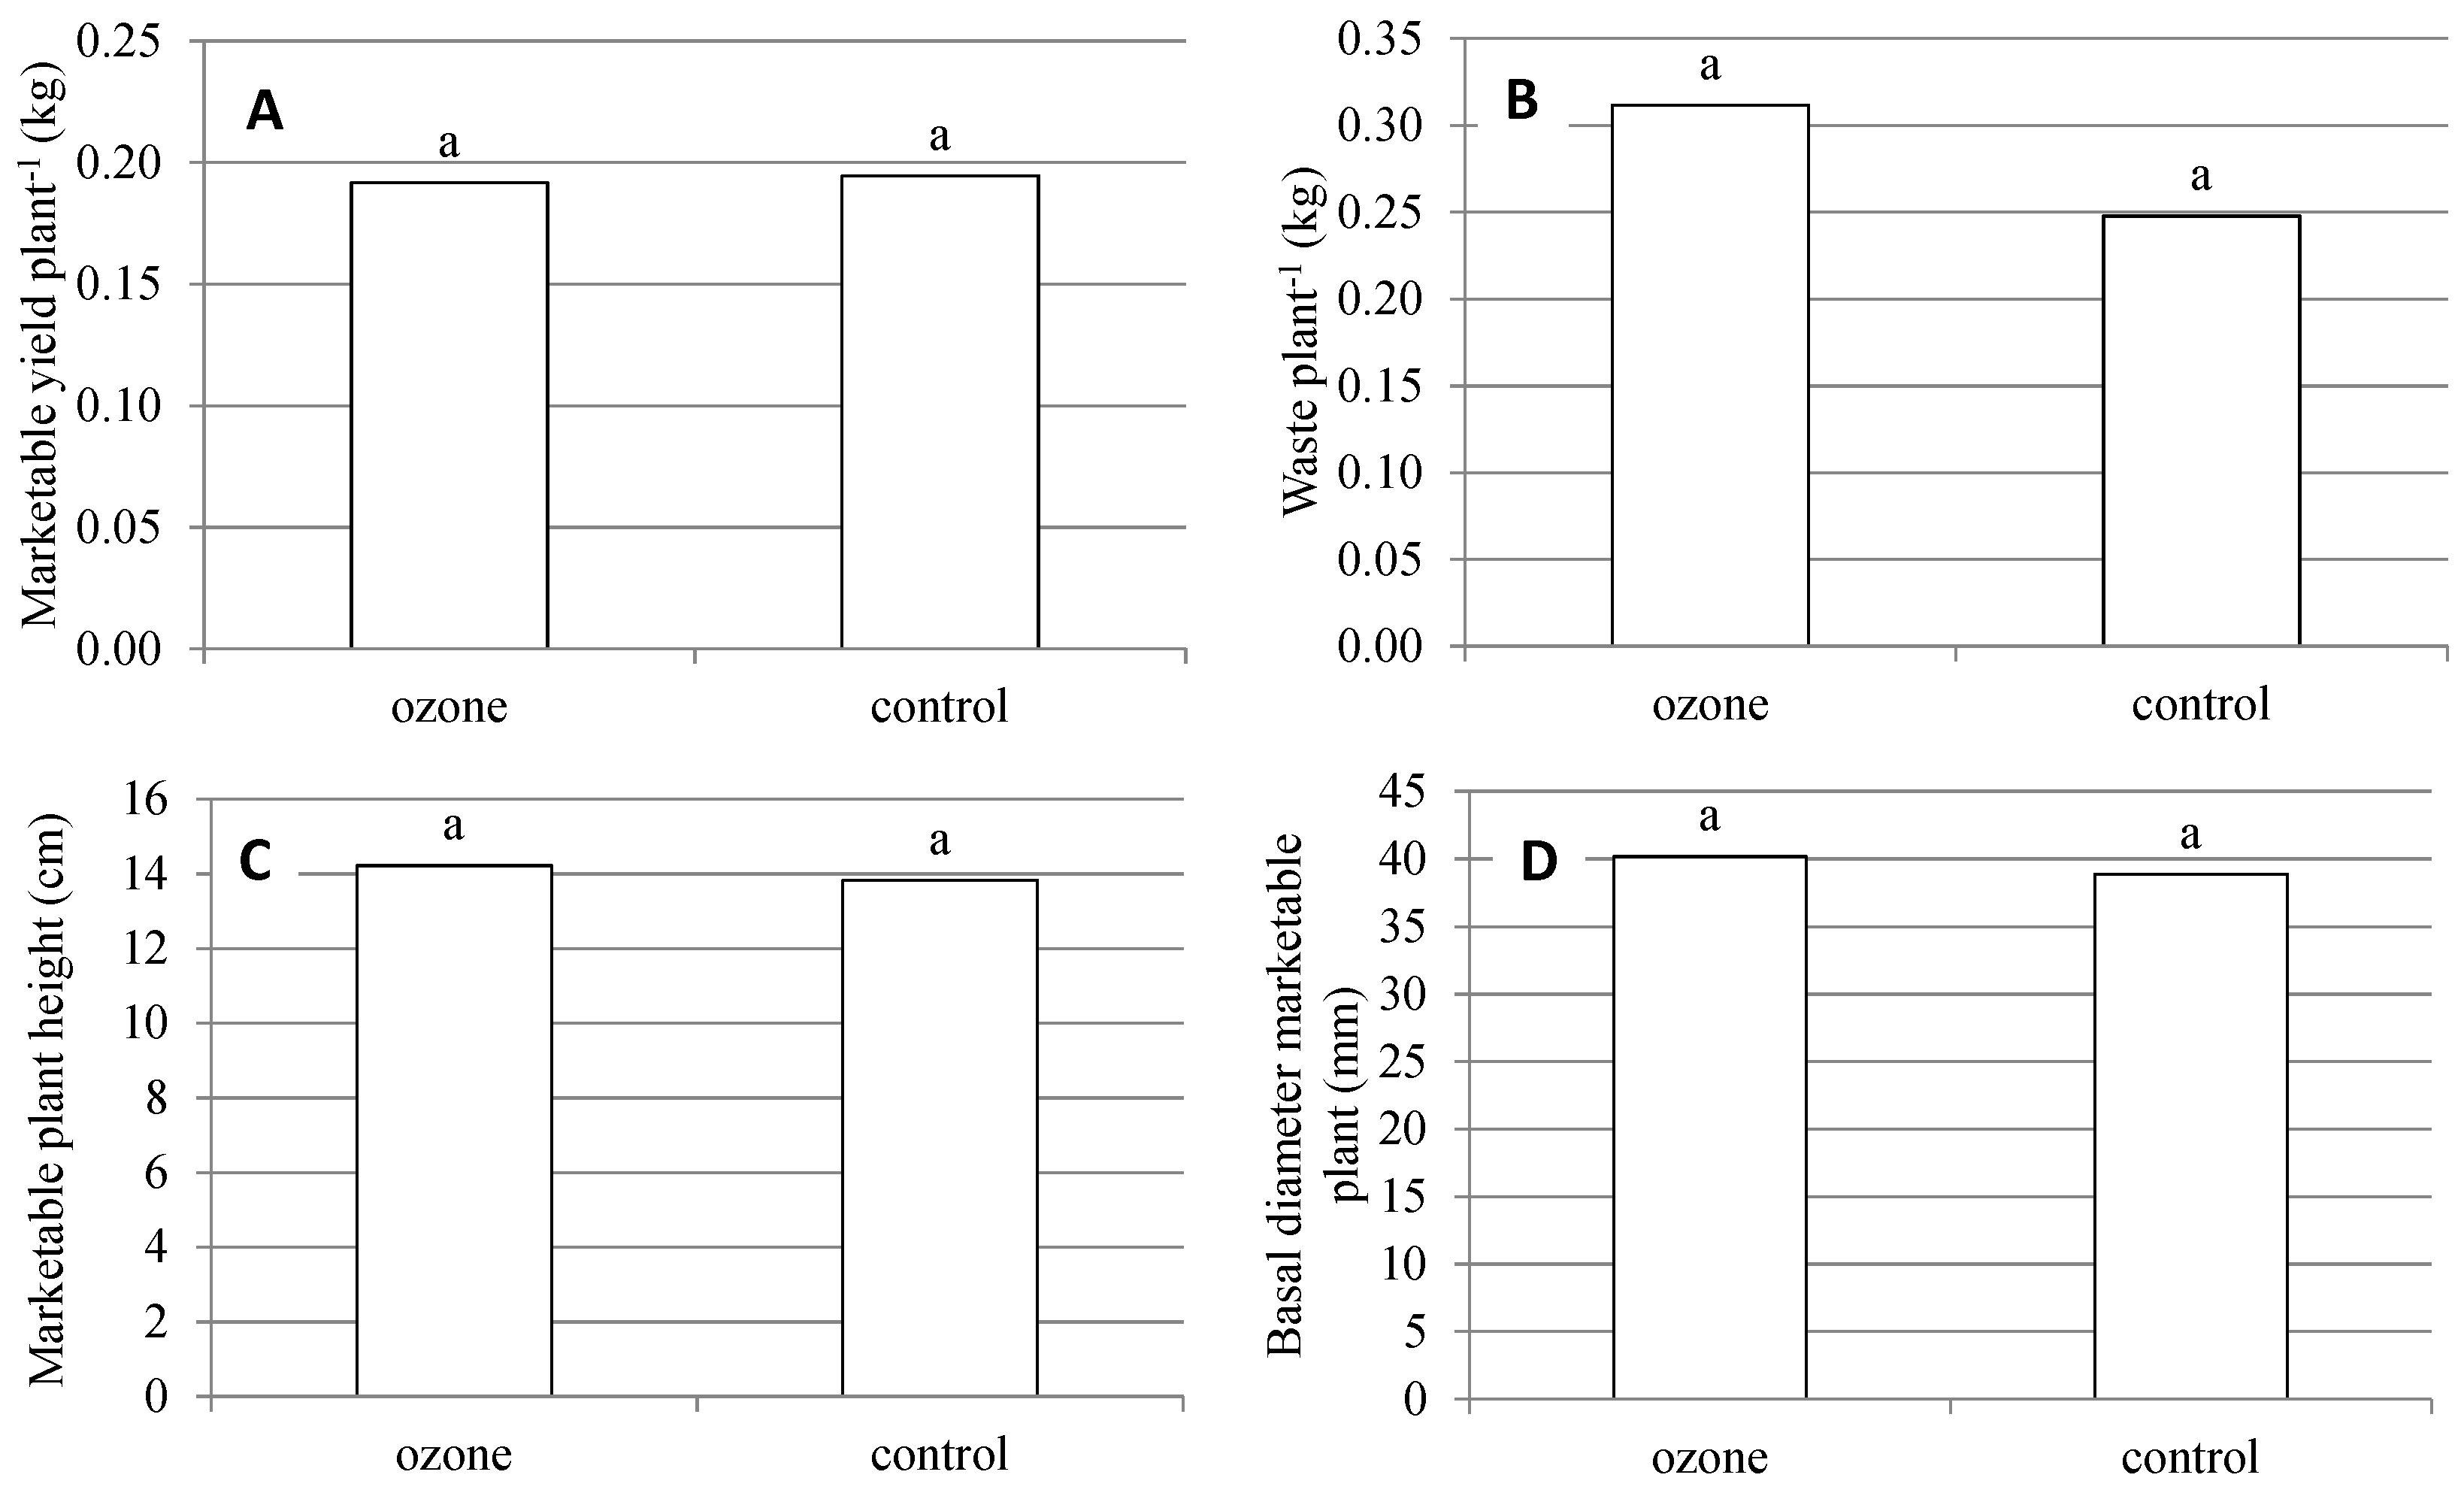
Figure 3.
Schematic diagram of the traditional forcing-process system (A) and the closed loop forcing system with ozone water treatment (B).
Figure 3.
Schematic diagram of the traditional forcing-process system (A) and the closed loop forcing system with ozone water treatment (B).


Table 1.
Effect of ozone treatment on some qualitative traits in Radicchio rosso di Treviso Tardivo.
Table 1.
Effect of ozone treatment on some qualitative traits in Radicchio rosso di Treviso Tardivo.
| pH | EC | TDS | Titratable Acidity | Antioxidant Activity | Total Phenols | |
|---|---|---|---|---|---|---|
| (mS cm−1) | (°Brix) | (% Citric Acid) | (mg Fe2+E kg−1 dw) | (mg GAE kg−1 dw) | ||
| Ozone | 4.94 ± 0.12 a | 5.64 ± 0.90 a | 4.97 ± 0.46 a | 0.28 ± 0.05 a | 44,554 ± 348 a | 4757 ± 193 a |
| Control | 4.83 ±0.15 a | 6.45 ± 0.95 a | 5.30 ± 0.38 a | 0.31 ± 0.08 a | 39,042 ± 681 b | 4245 ± 142 a |
Within each parameter, different letters indicate significant differences according to the Tukey’s Honest Significant Difference test at p < 0.05. EC, electrical conductivity; TDS, total dissolved solids.
Table 2.
Effect of ozone treatment on main bitter taste chemical compounds (mg kg–1 dw) in Radicchio rosso di Treviso tardivo.
Table 2.
Effect of ozone treatment on main bitter taste chemical compounds (mg kg–1 dw) in Radicchio rosso di Treviso tardivo.
| 1 | 2 | 3 | 4 | 5 | Total | |
|---|---|---|---|---|---|---|
| Ozone | 4.12 ± 0.43 a | 3.28 ± 0.31 a | 6.53 ± 0.62 a | 4.29 ± 0.45 a | 2.38 ± 0.29 a | 20.6 ± 1.3 a |
| Control | 3.78 ± 0.47 a | 3.00 ± 0.27 a | 5.98 ± 0.71 a | 3.93 ± 0.50 a | 2.17 ± 0.22 a | 18.9 ± 1.6 a |
(1) Dihydrolactucin; (2) lactucin; (3) 8-deoxy-lactucin+dihydro-lactucopicrin oxalate; (4) jaquinellin; (5) dihydro-lactucopicrin+lactucopicrin. Within each parameter, different letters indicate significant differences according to the Tukey’s Honest Significant Difference test at p < 0.05.
Table 3.
Effect of ozone treatment on main phenolic acids and sugars (mg kg–1 dw) in Radicchio rosso di Treviso tardivo.
Table 3.
Effect of ozone treatment on main phenolic acids and sugars (mg kg–1 dw) in Radicchio rosso di Treviso tardivo.
| Chicoric Acid | Chlorogenic Acid | Glucose | Fructose | Sucrose | |
|---|---|---|---|---|---|
| Ozone | 25,036 ± 365 a | 17,758 ± 1687 a | 102,068 ± 4298 a | 94,137 ± 1828 a | 13,965 ± 2415 a |
| Control | 19,473 ± 482 b | 16,249 ± 1734 a | 106,213 ± 4337 a | 92,453 ± 1749 a | 11,618 ± 2531 a |
Within each parameter, different letters indicate significant differences according to the Tukey’s Honest Significant Difference test at p < 0.05.
Table 4.
Crop management practices during the experimental year (2016).
| Crop Management Practice | Date | Note |
|---|---|---|
| Fertilization | 15 July | 65 kg N ha−1, 130 kg P2O5 ha−1, 1 kg B ha−1 |
| Field transplant | 21 July | 7.4 (plants m−2) |
| Irrigation | 21–27 July; 5 August | 100 m3 ha−1 (sprinkling method) |
| Mechanical weeding | 25 August | Inter row tillage |
| Harvest | 21 January | Uprooting |
© 2017 by the authors. Licensee MDPI, Basel, Switzerland. This article is an open access article distributed under the terms and conditions of the Creative Commons Attribution (CC BY) license (http://creativecommons.org/licenses/by/4.0/).
Share and Cite
MDPI and ACS Style
Nicoletto, C.; Maucieri, C.; Sambo, P. Effects on Water Management and Quality Characteristics of Ozone Application in Chicory Forcing Process: A Pilot System. Agronomy 2017, 7, 29. https://doi.org/10.3390/agronomy7020029
AMA Style
Nicoletto C, Maucieri C, Sambo P. Effects on Water Management and Quality Characteristics of Ozone Application in Chicory Forcing Process: A Pilot System. Agronomy. 2017; 7(2):29. https://doi.org/10.3390/agronomy7020029
Chicago/Turabian StyleNicoletto, Carlo, Carmelo Maucieri, and Paolo Sambo. 2017. "Effects on Water Management and Quality Characteristics of Ozone Application in Chicory Forcing Process: A Pilot System" Agronomy 7, no. 2: 29. https://doi.org/10.3390/agronomy7020029
Note that from the first issue of 2016, this journal uses article numbers instead of page numbers. See further details here.