
Drought Stress-Related Physiological Changes and Histone Modifications in Barley Primary Leaves at HSP17 Gene

1
Institute of Biology, Martin Luther University Halle-Wittenberg, Weinbergweg 10, 06120 Halle, Germany
2
Department of Molecular Biology and Genetics, Faculty of Science, Istanbul University, Istanbul 34134, Turkey
*
Author to whom correspondence should be addressed.
Agronomy 2017, 7(2), 43; https://doi.org/10.3390/agronomy7020043
Submission received: 18 May 2017
/
Revised: 7 June 2017
/
Accepted: 14 June 2017
/
Published: 17 June 2017
(This article belongs to the Special Issue Senescence of Crop Plants)
Abstract
:Stress-inducible genes undergo epigenetic modifications under stress conditions. To investigate if HSP17, of which transcripts accumulate in plant cells under stress, is regulated through epigenetic mechanisms under drought stress, 5-day-old barley (Hordeum vulgare cv. Carina) plants were subjected to progressive drought through water withholding for 22 days. Changes in physiological status and expression of HSP17 gene were monitored in primary leaves of control and drought-treated plants every two days. Twelve days after drought started, control and drought-treated plants were analyzed by chromatin-immunoprecipitation using antibodies against three histone modifications (H3K4me3, H3K9ac, and H3K9me2) and H3 itself. Already after four days of drought treatment, stomatal conductance was severely decreased. Thereafter, maximum and quantum yield of photosystem II (PSII), regulated and non-regulated energy dissipation in PSII, and later also chlorophyll content, were affected by drought, indicating the stress-induced onset of senescence. At the 12th day of drought, before leaf water content declined, expression of HSP17 gene was increased two-fold in drought-treated plants compared to the controls. Twelve days of drought caused an increase in H3 and a loss in H3K9me2 not only at HSP17, but also at constitutively transcribed reference genes ACTIN, PROTEIN PHOSPHATASE 2A (pp2A), and at silent regions BM9, CEREBA. In contrast, H3K4me3 showed a specific increase at HSP17 gene at the beginning and the middle part of the coding region, indicating that this mark is critical for the drought-responsive transcription status of a gene.
1. Introduction
Drought is also known as the water deficit stress [1]. The decrease in water supply is first sensed by roots that signal leaves by the production of abscisic acid (ABA), which triggers stomatal closure. When water availability to cells is low because of poor hydraulic conductance from roots to leaves caused by stomatal closure and due to the loss of cell turgor, this results in growth inhibition. The closure of stomata prevents not only water loss but also CO2 entry, and it reversibly inhibits photosynthesis [2]. Light energy absorbed by chlorophyll molecules is either used to drive photosynthesis (photochemistry) or is re-emitted as heat or light (fluorescence). These processes are in competition [3,4]. Under conditions in which carbon fixation is limited e.g., drought, the requirement of light decreases and to get rid of excess light, plants may prevent light absorption, lose chlorophyll, or divert energy as thermal dissipation. Otherwise, excess energy causes the generation of reactive oxygen species (ROS) molecules that can cause damage to PSII, DNA, proteins, and membranes [1,2,5,6,7].
Antioxidant enzymes and protein kinases are activated [1] and several hundred genes e.g., genes encoding transcription factors, dehydrins, osmolytes, chaperones, protein kinases, and phosphatases as well as genes involved in water management, carbon, and antioxidant metabolism, are regulated by drought [2,8,9,10]. Gene expression is influenced by chromatin structure, which is governed by processes often associated with epigenetic regulation, namely DNA methylation, histone variants, and post-translational histone modifications. N-terminal tails of histones are modified after translation and these modifications define transcription status and gene expression level by the alteration of the strength of the DNA histone interaction or the recruitment of non-histone proteins. Drought-induced regulation of gene expression is associated with changes in histone modification patterns [11,12]. Histone marks that are associated with active transcription accumulate at histones connected to drought-induced genes under drought conditions, and may be reversed after rehydration [13].
Physiological and biochemical changes [14] as well as changes in gene expression [15], proteome [16], and metabolome [17] in drought-stressed barley plants have been shown. Studies on histone modifications under drought stress have been restricted to rice [18,19], tomato [20], and Arabidopsis [21]. Overall, the DNA methylation level is high and stable in barley under water-deficient conditions, yet methylation and demethylation events do occur [22]. Although genes that encode histone-modifying enzymes are induced in barley under drought [23,24], how these modifications are distributed in barley, a stress-tolerant crop, is not clear. HSP17 gene was shown to be upregulated in drought-tolerant barley cultivars under water deficit conditions and is involved in drought tolerance in barley [8]. In this study, we report how progressive drought affects physiology, chlorophyll fluorescence, and the expression of HSP17 gene, encoding a heat shock protein, in barley plants grown under greenhouse conditions. Furthermore, certain histone modifications were analyzed in both 12-day-old well-watered (control) and drought-stressed plants.
2. Results
2.1. Drought Treatment: Soil Water Content (SWC) and Leaf Water Content (LWC)
The SWC of the control group was maintained at 65% by regular watering. To apply drought stress, irrigation was stopped five days after sowing (DAS). In these pots, the SWC decreased (p < 0.01) from 65% to 46.7% at the end of drought (22 days; Figure 1a). During the first 12 days of drought treatment, the LWC did not decrease and stayed at about 88%, as in control plants. After that time point, the LWC of drought-stressed plants decreased (p < 0.05) and was 11% less than in control plants after 22 days of drought stress (Figure 1b). Under well-watered control conditions, changes in the LWC were not significant.
2.2. Effects of Drought Treatment on Stomatal Conductance, Chlorophyll Content, and Photosynthetic Parameters
Stomatal conductance (gS) started to decrease (p < 0.001) after two days of drought treatment and was reduced to about 50% of the control already at the fourth day of treatment. After 18 days of treatment, it was only 20% of the control (Figure 2a). There was a highly significant (p < 0.001) interaction between age and watering for gS. Relative chlorophyll content stayed high in control plants and drought-stressed plants until 18 days of treatment (Figure 2b). Thereafter, the drought-treated plants showed a slight decrease in chlorophyll content. Changes in chlorophyll content were not significant (p > 0.05).
To characterize the effect of drought on the physiological status of the leaves, photosynthetic parameters were determined using chlorophyll fluorescence measurements. While photosynthetic performance, documented by maximum quantum efficiency of photosystem II (Fv/Fm), quantum yield of photosystem II photochemistry (ΦPSII), photochemical quenching based on the puddle model (qP) and Electron Transport Rate (ETR), started to decrease under drought after 14–16 days of water deficiency (Figure 3), while non-photochemical quenching (Non-photochemical quenching (NPQ) and Quantum yield of regulated energy dissipation in PS II (ΦNPQ)) and Quantum yield of nonregulated energy dissipation in PS II (ΦNO) were altered after only 4–6 days of stress treatment (Figure 4). Changes in Fv/Fm, ΦPSII, ETR, NPQ and ΦNPQ were statistically significant (p < 0.05) and independent from age (p > 0.05). Changes in qP and photochemical quenching based on the lake model (qL) were significant (p > 0.05).
2.3. Drought-Responsive Expression of HSP17Gene
The expression of HSP17 gene was monitored for 22 days and normalized against ACTIN gene. Progressive drought affected (p < 0.005) HSP17 gene expression. The expression of HSP17 increased two- and three-fold at the 12th and 14th days of drought, respectively (Figure 5). ACTIN and PP2A had stable Ct values around 24–25 at all time-points. BM9, a MADS box gene, and the retrotransposon CEREBA primer pairs could not cross the threshold. In other words, the expression of BM9 and CEREBA genes could not be detected.
2.4. Drought-Responsive Histone Modifications at HSP17 and Control Genes
Well-watered plants and plants drought-stressed for 12 days, both of the same age, were used to analyze the occurrence of euchromatic (H3K4me3 and H3K9ac) and heterochromatic (H3K9me2) histone marks as well as histone H3 at reference genes (ACTIN, PP2A, BM9, CEREBA) and four regions of the HSP17 gene (Supplementary Figure S1). Primer pair corresponding to the upstream region (HSP17-1) of the HSP17 gene could not amplify the PCR fragment. All other primer pairs gave a single peak after the melting curve analysis. Drought caused a general increase (p < 0.001) in H3 levels at all sequences analyzed, except HSP17-3. The TSS region of the HSP17 gene and the CEREBA had the lowest and highest H3 levels, respectively (Figure 6). There was an interaction (p < 0.001) between the gene region and watering on H3 levels.
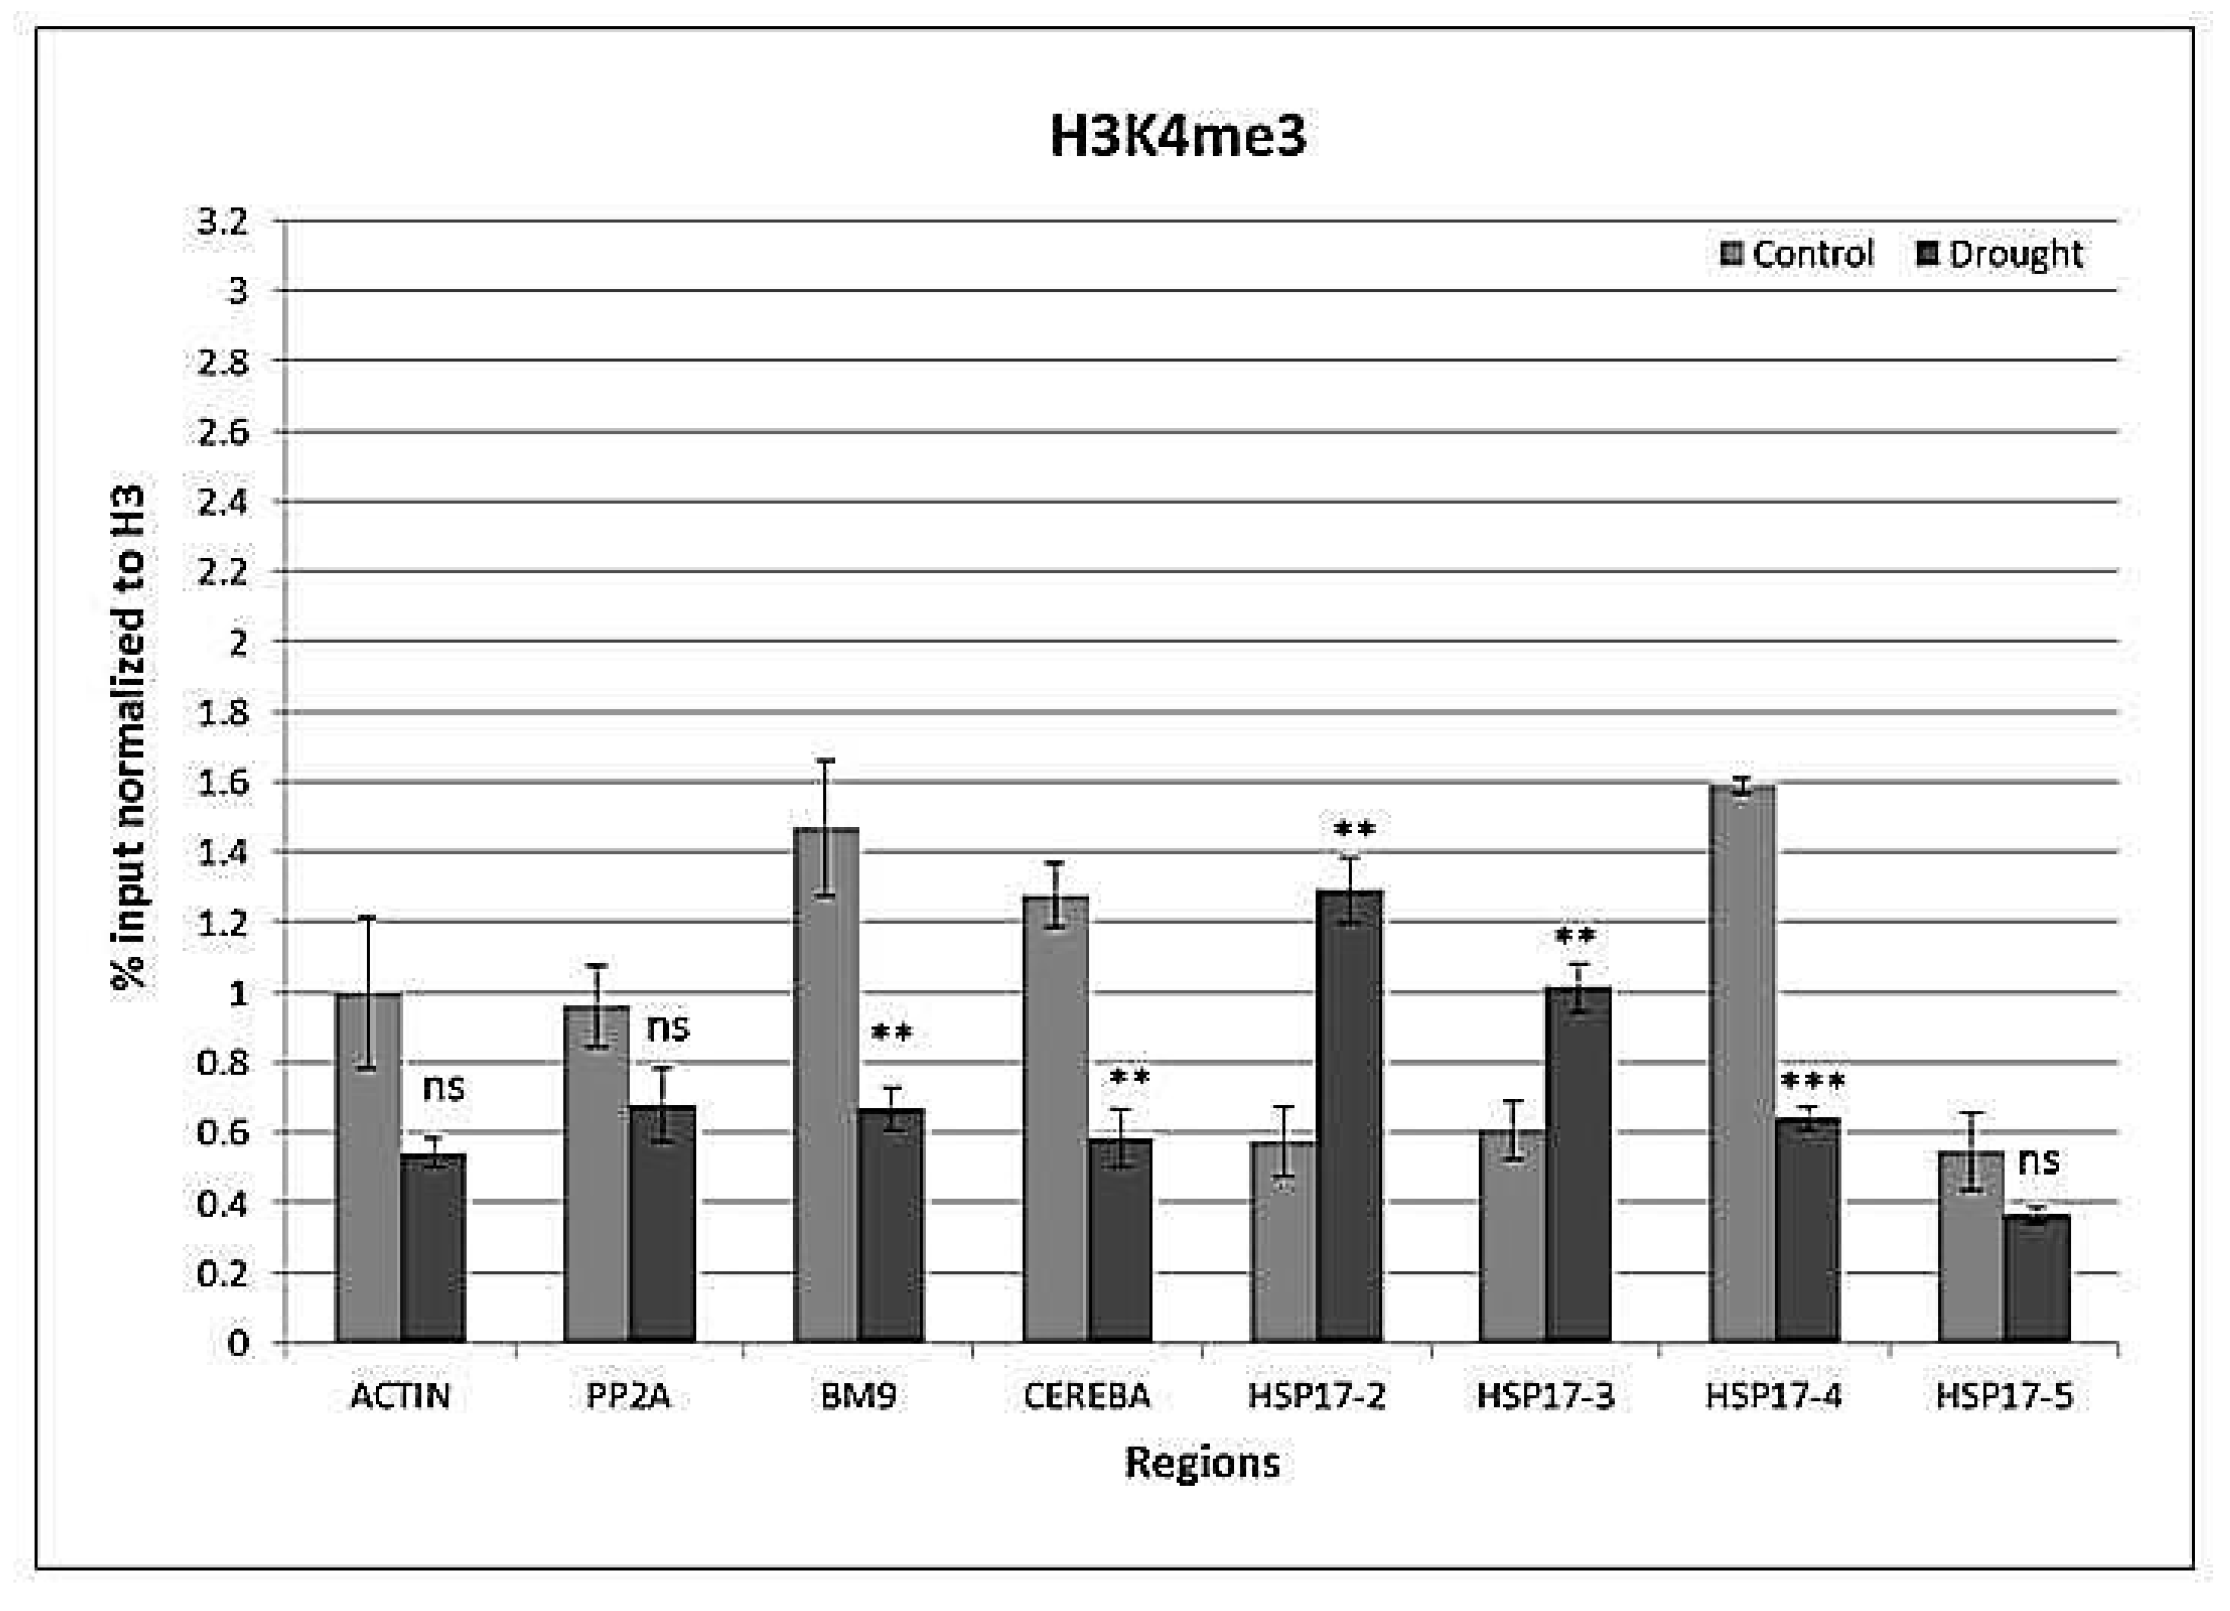
Drought affected (p < 0.001) H3K4me3 levels, except for H3K4me3 in the first (HSP17-2) and middle (HSP17-3) parts of the coding region. The end (HSP17-4) of the coding region and silent genes lost H3K4me3 (Figure 7). There was an interaction (p < 0.001) between the gene region and watering on H3K4me3 levels.
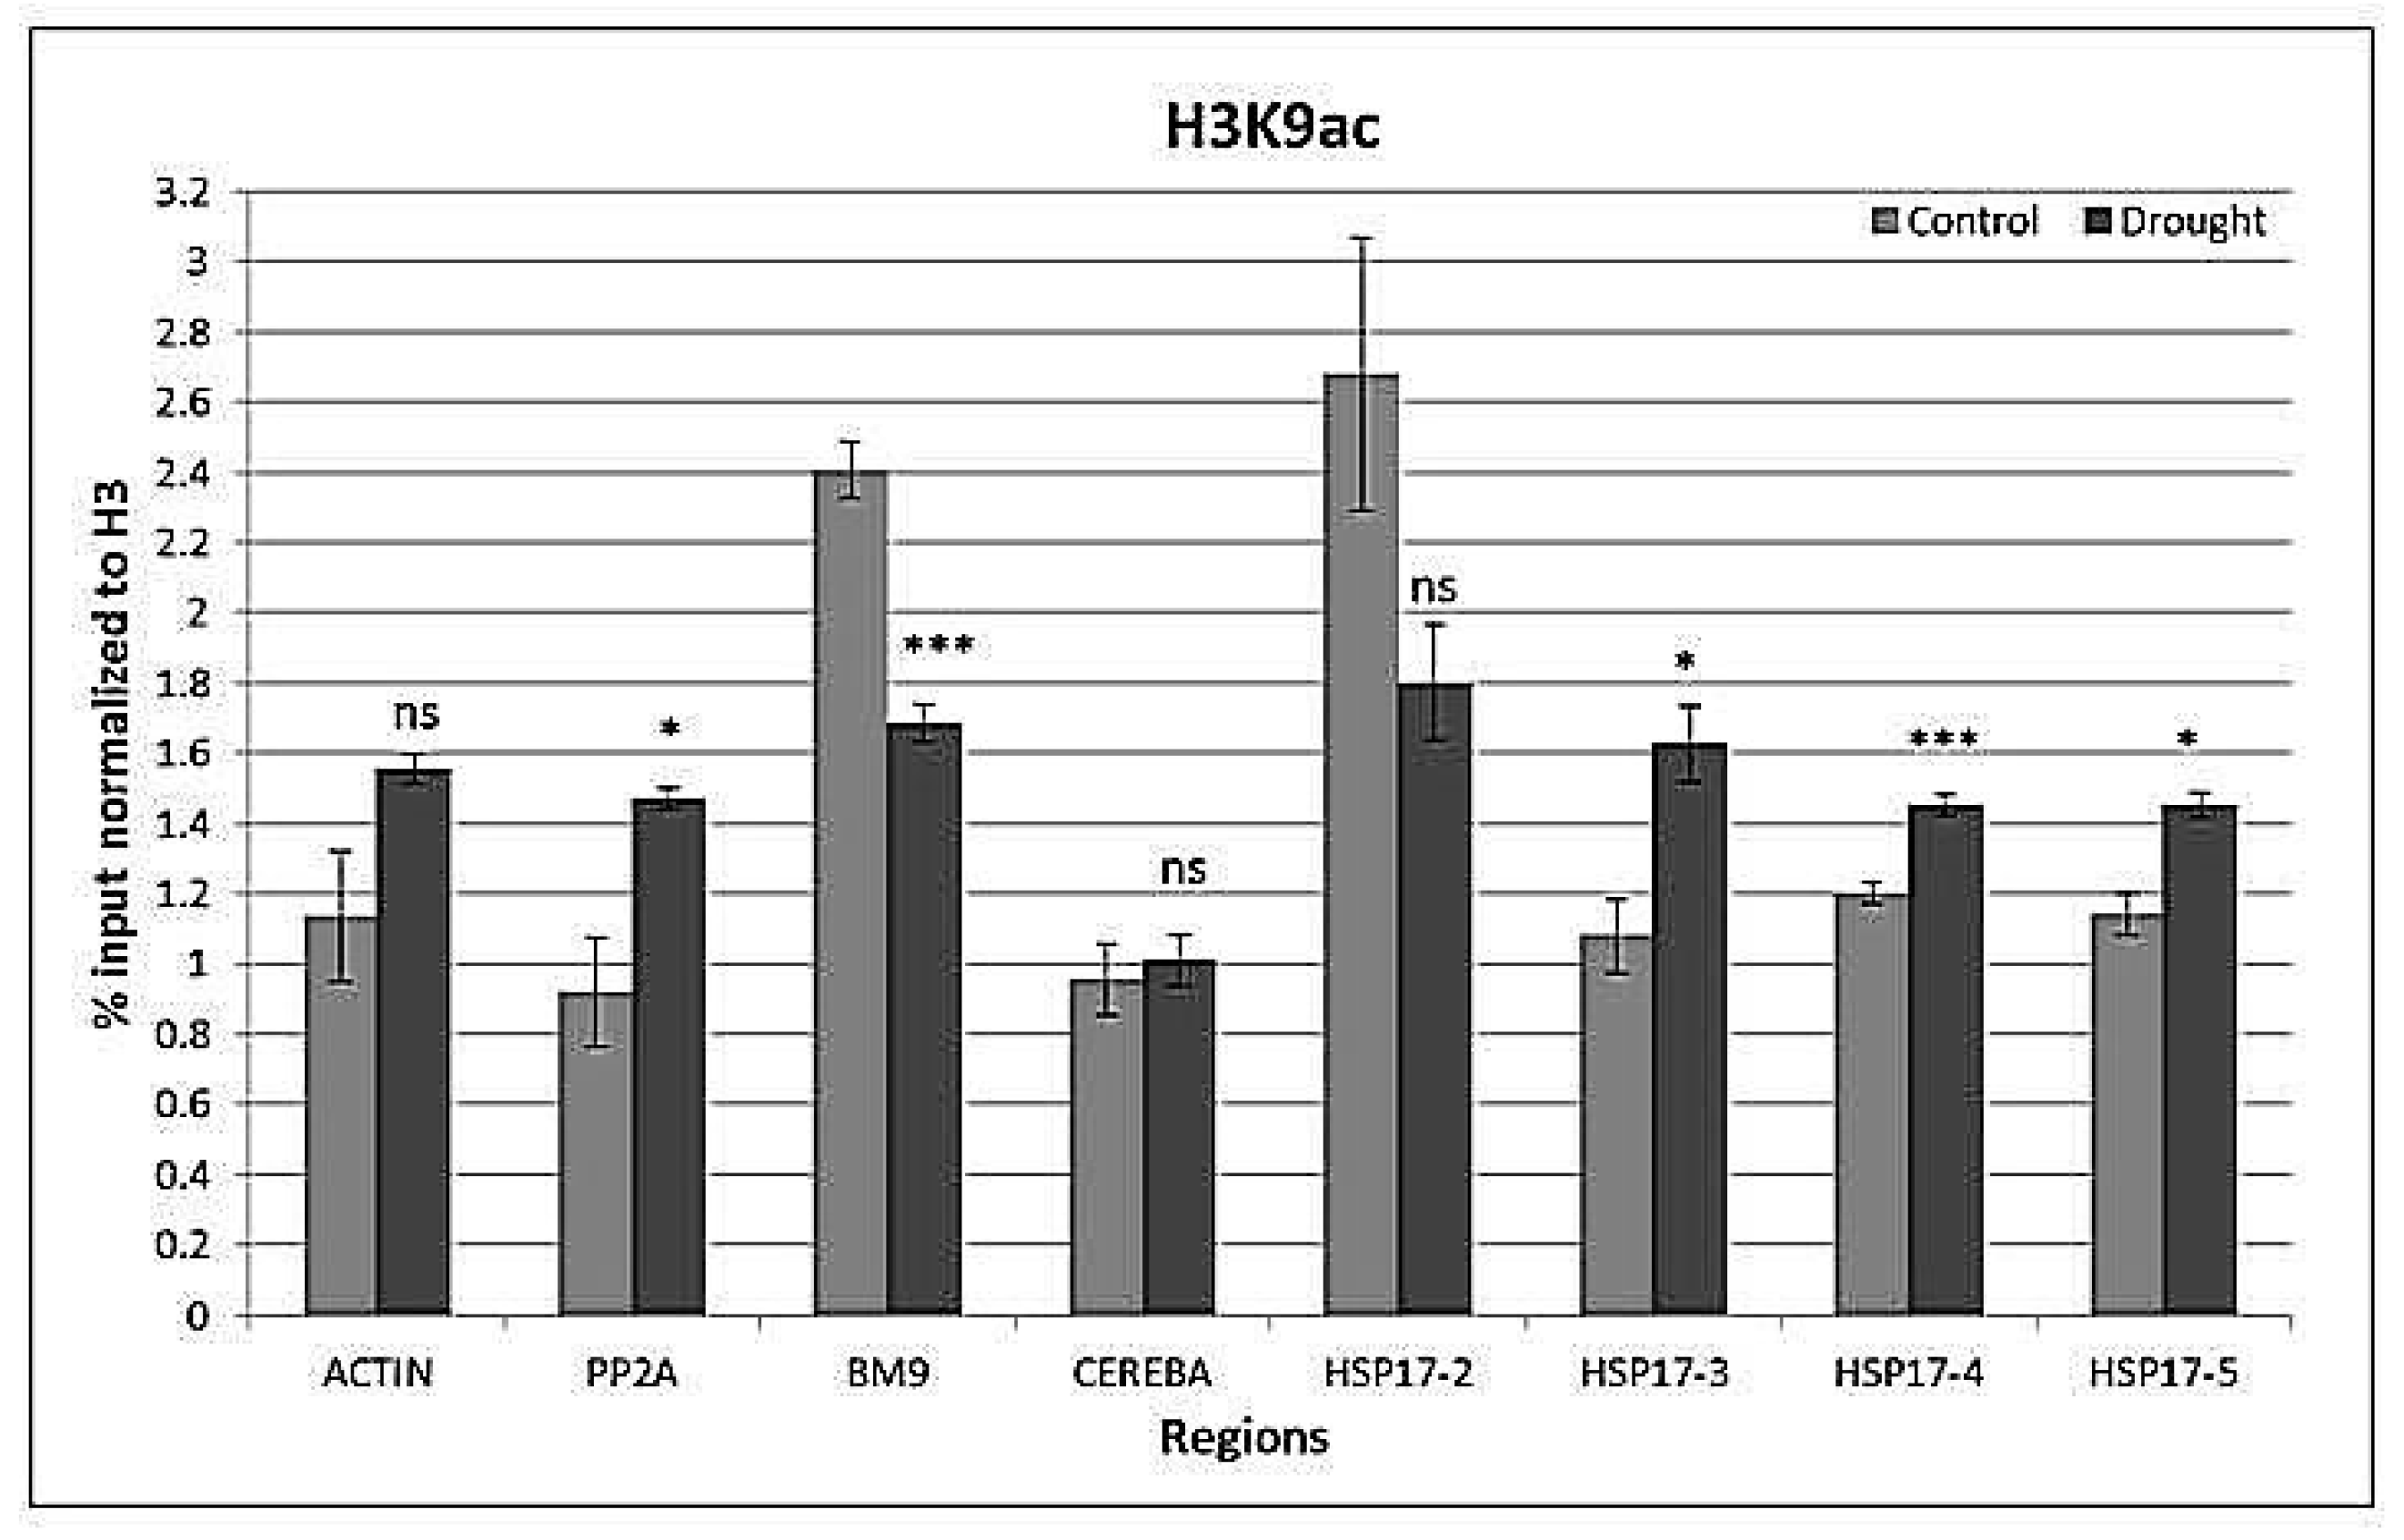
Drought-induced changes in H3K9ac levels were not statistically significant (p > 0.05). However, the middle and end parts and the downstream of the coding region gained H3K9ac (Figure 8). There was an interaction (p < 0.001) between the gene region and watering on H3K9ac levels.
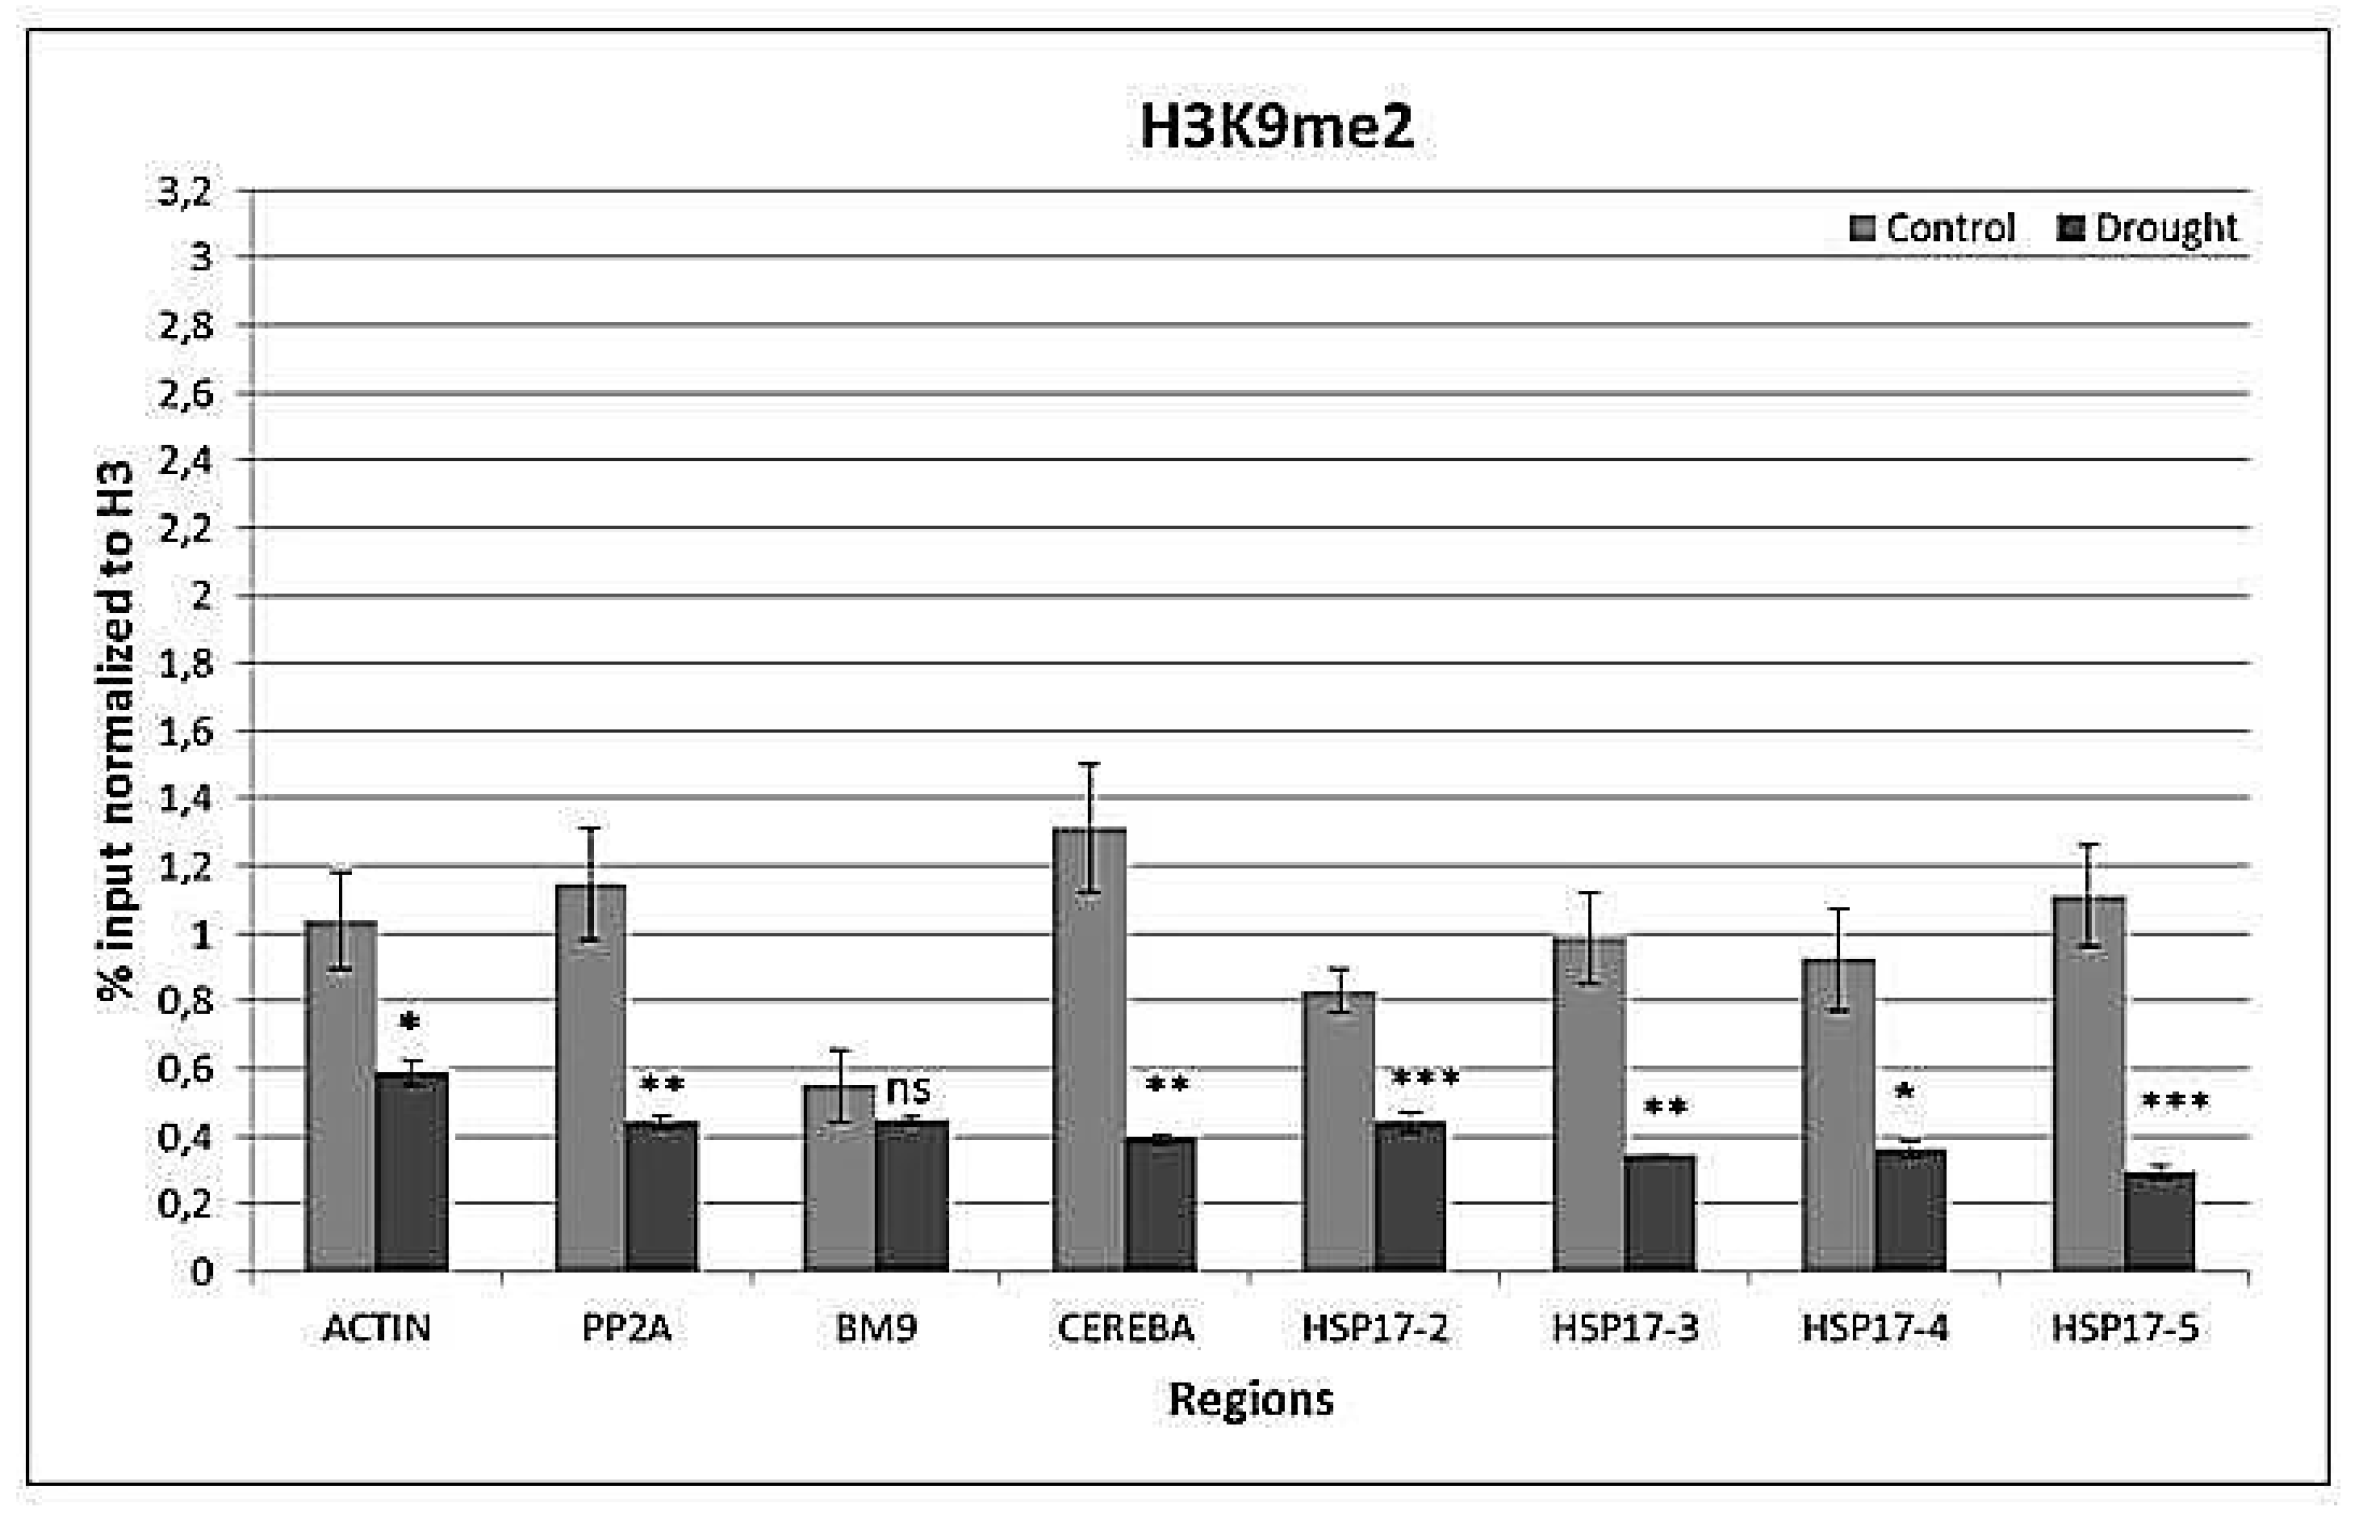
Drought decreased (p < 0.001) H3K9me2 levels in all regions except BM9 (Figure 9). There was an interaction (p < 0.01) between the gene region and watering on H3K9me2 levels.
3. Discussion
3.1. Physiological Responses to Drought
Drought is characterized by a reduction in water content, closure of stomata, and a decrease in cell enlargement and growth [25], and is also associated with leaf senescence, which is the regulated, age-dependent deterioration process to ensure the translocation of nutrients from older leaves to developing tissues and seeds. Unfavorable conditions can induce or accelerate senescence [26,27]. Senescence is characterized by the breakdown of the chloroplast [27], decreased chlorophyll content, and reduced photosynthesis [28]. Moreover, the delay of leaf senescence confers drought tolerance in transgenic plants [29]. In this study, drought was imposed by withholding irrigation five days after sowing, which was sustained for 22 days. The effects of drought were observed every two days. The halt of irrigation resulted in a continuous decrease in soil water content. However, water content in leaves remained high at about 88% during 12 days of drought. Thereafter, it decreased and reached about 78% after 22 days. The long period of maintaining high water content in the leaves is connected to the early closure of stomata [30]. It was reported that under mild stress, a decline in stomatal conductance may have protective effects against stress, by allowing plant water saving and improving plant water-use efficiency by the plant [7]. Plants can avoid dehydration by sustaining cellular hydration through enhanced water uptake or limited water loss. Such dehydration avoidance is a drought tolerance mechanism [31].
A decrease in chlorophyll content is a symptom of drought-induced oxidative stress [25], and the stability of chlorophyll content under drought conditions might be an indicator of drought tolerance [32]. Drought-tolerant cultivars of barley can maintain chlorophyll content even under severe drought [33]. In this study, chlorophyll content remained stable during 18 days of drought and then started to slightly decrease, showing that the final senescence-specific degradation of chloroplasts in barley in our experiment started only in the later stages of drought treatment. Photosynthetic performance, however, sensitively reacted to the drought treatment much earlier. To monitor responses in PSII performance and photochemical protection mechanisms, chlorophyll fluorometry was performed. While ΦPSII is the proportion of absorbed energy being used in photochemistry; qP gives an indication of the proportion of PSII reaction centers that are open [3]. qL is also a parameter estimating open PSII centers based on a lake model [34]. All these parameters decreased in both the control and drought-treated plants after primary leaf was fully grown. However, drought treatment in later stages caused a faster decrease. Another oft-used parameter to monitor photosynthetic performance under stress conditions is PSII efficiency (Fv/Fm), which in an optimal stage should be around 0.83 for many plant species [3]. Fv/Fm remained high in control plants, but started to decrease after about 16 days of drought, indicating the loss of efficiency of PSII under these conditions. Prior to the breakdown of photosynthetic performance due to drought-induced senescence, mechanisms protecting photosynthesis were induced. This was indicated by an early increase in NPQ and ΦNPQ [34], which reflects photo-protective processes that remove excess excitation energy within chlorophyll-containing complexes and prevents the formation of damaging free radicals [4]. Our data showed that this protection mechanism was downregulated during leaf development, but stayed active under drought. Another parameter reflecting more unregulated energy dissipation is ΦNO, using the lake model [34]. Under stress conditions, processes involving regulated-energy dissipation increased to protect the photosynthetic apparatus (as measured by ΦNPQ, NPQ) but decreased when the stress became more severe, while ΦNO increased [35]. High ΦNPQ implies that a plant is trying to protect itself by a regulation process. High ΦNO values indicate the plant’s inability to cope with radiation [36]. Drought-stressed plants had higher ΦNPQ but lower ΦNO values than their controls, suggesting that energy dissipation was more regulated under drought. Our data conform to other publications showing that a severe decrease in water content results in lower values of ΦPSII, qP, and Fv/Fm, and higher NPQ [37,38,39,40].
3.2. hsp17 Gene Expression
Small heat shock proteins (sHSPs), which have a molecular mass of 15–42 kDa, are a family of HSPs, or chaperons, which are synthesized upon heat shock and are responsible for the proper folding of unfolded or partially-folded polypeptides [41,42]. The synthesis of sHSPs is induced by stress; their transcript levels are correlated with the duration of stress, and start to decline after the elimination of stress [43]. Overexpression of the gene encoding HSP17 protein increases drought tolerance [44,45]. Different members of HSPs play different roles under drought stress. One HSP is involved in drought tolerance, while another one is a drought-responsive gene [8]. Drought-tolerant cultivars exhibit the accumulation of HSP17 proteins and transcripts [46,47]. A time course analysis of HSP17 gene expression showed a gradual increase that was prominent after 12 days of drought.
3.3. Drought-Responsive Alterations of Histone Modification Patterns
H3, along with other histones, package eukaryotic genomes into nucleosomal units that must be mobilized for genes to be expressed [48]. Promoter regions are depleted of nucleosomes relative to transcribed regions [49]. Under drought conditions, a reduction in H3 accumulation in drought-induced genes is expected [50]. However, stress conditions e.g., cold stress, do not always alter nucleosome occupancy [51]. Under drought conditions, not all drought-induced genes lose nucleosomes [18]. A decrease in H3 levels may be specific to promoter regions of responsive genes [21]. Anti-H3 antibody was used to analyze whether H3 occupancy was influenced by drought. CEREBA, a centromeric retroelement of barley [52], had the highest and the TSS region of HSP17 (HSP17-2) had the lowest H3 levels. H3 loading increased under drought even in the coding region of HSP17. Chromatin decondensation does not always lead to the activation of silent genes, and vice versa; genes in compact chromatin can be transcribed [53,54] and stress conditions do not always result in decondensed chromatin [54]. Nucleosomes do not always prevent chromatin accessibility [55] and are also suggested to manage transcription through the interaction of two trans-acting factors [49]. Our data on H3 indicate that drought affects nucleosome occupancy in barley, especially at control genes ACTIN and CEREBA. However, further investigations are needed to analyze whether this is a general chromatin response to drought.
In addition to a more general condensation and decondensation response of chromatin, a plethora of histone modifications determines chromatin status at specific genes. A well-known example is the acetylation of lysine 9 of H3, which neutralizes the positive charge of the histones and decreases their affinity for negatively charged DNA, and thus promotes the accessibility of other proteins to the DNA [56]. In general, H3K9ac is enriched in euchromatin at active genes and normally peaks at translation start sites (ATG). However, repressive marks may weaken the positive effect of H3K9ac [57]. Genes that gain H3K9ac are not always upregulated, and downregulated genes may retain H3K4me3 and H3K9ac marks [58]. It has been shown that drought stress-inducible genes are enriched by H3K9ac in response to drought [18]. In this study, HSP17 gene was more enriched, up to three times as much, by H3K9ac than control genes. However, control genes ACTIN and PP2A, as well as CEREBA and BM9, gained some H3K9ac under drought stress, indicating a more general stress-responsive loading with H3K9ac. Similar results have been reported, showing that heterochromatic loci may also be enriched by H3K9ac under stress conditions [59].
It is known that H3K4 methylation, another euchromatic mark, recruits multiple effectors that participate in gene induction [60]. H3K4me3 is said to define the active expression of a gene [61] and localizes 5′ ends of open reading frames. Yet, in some cases, H3K4me3 recruits certain complexes associated with transcriptional repression [60]. In general, highly-expressed genes have more H3K4me3 than genes with lower basal expression levels under controlled conditions, and consequently, H3K4me3 levels decrease in downregulated genes [62]. As reported before, during drought, H3K4me3 accumulates in 5′ UTR and coding regions of drought-induced genes [18] and is not completely removed on drought-inducible genes upon rehydration [50]. In this study, H3K4me3 specifically accumulated in the TSS region of HSP17 under drought conditions. In contrast, H3K4me3 was downregulated in control genes, which were not induced in response to drought. This drought-specific loading of HSP17 with the euchromatic H3K4me3 indicates the drought-responsive regulation of HSP17 gene expression via the establishment of this euchromatic mark.
A typical repressive mark is H3K9me2, which provides binding sites for HP1 [56] and is necessary for DNA methylation-mediated gene silencing [63]. H3K9me2 is enriched in heterochromatin and chromocenters, and is associated with transposons without any preference along gene territory [57,63,64]. Stress-induced activation of heterochromatic loci may be accompanied with an increase in H3K9ac and a decrease in H3K9me2 [59]. As expected, CEREBA had the highest H3K9me2 levels in all conditions. BM9 is a barley MADS-box gene, of which expression is restricted to reproductive organs [65], and was therefore selected to be a silent gene in this study. BM9 transcript could not be detected by Q-RT-PCR in any condition, while drought caused an accumulation of H3K9ac and H3K9me2 at histones associated to BM9. The high levels of H3K27me3, which is a repressive mark at developmentally regulated genes, may not interfere with the H3K4me3 accumulation and gene induction [66].
4. Material and Methods
4.1. Plant Material and Growth Conditions
Barley (Hordeum vulgare cv. Carina) seeds were incubated in the dark on wet paper tissue for two days at 4 °C, and pre-germinated at 25 °C for two days. Uniformly-germinated seedlings were transferred to Mitscherlich pots (10–14 seedlings per pot) containing 1.5 kg soil (ED73, Einheitserdewerk Hameln A. Stangenberg GmbH) with 65% initial soil water content (SWC), and were grown for five days under greenhouse conditions (16 h light/8 h dark, 21–18 °C, 45–50% humidity) with regular watering to ensure constant SWC. The position of the pots was changed every day in order to provide randomness.
On the fifth day after sowing, half of the pots were subjected to drought stress by withholding water. The other half was watered every two days and provided the control group. Control and drought pots were weighed to calculate SWC. Physiological parameters were measured and plant material for RNA extraction was harvested at 11 time points in a two-day kinetic from day 2 to 22 in both control and drought plants.
4.2. Physiological Measurements
Length, fresh weight (FW), dry weight (DW), stomatal conductance (gS), and chlorophyll content and fluorescence of eight primary leaves of control and drought-stressed plants, respectively, were measured every two days. Leaves were dried at 80 °C for 24 h to determine DW. Stomatal conductance was measured with a porometer (AP4, Delta-T Devices). Chlorophyll content was measured with a portable chlorophyll meter (SPAD-502, Konica Minolta). Primary leaves were dark-adapted for 10 min and chlorophyll fluorescence parameters were measured with a chlorophyll fluorometer (Imaging PAM, Waltz). Leaves were first exposed to weak modulated light to measure dark-adapted minimal fluorescence and then exposed to saturating pulse to measure dark-adapted maximal fluorescence. Actinic light was turned on, and a saturating pulse was repeated every 30 s. Fluorescence increased until it reached a steady-state after 5 min, and a final saturating pulse was applied to measure the light-adapted maximal fluorescence. Actinic light was turned off and a far-red light was switched on to measure the light-adapted minimal fluorescence. Fv (variable fluorescence from dark-adapted leaf), Fv/Fm (maximum quantum efficiency (yield) of PSII photochemistry), ΦpSII (effective quantum yield of PSII photochemistry), ETR (electron transport rate), qP (coefficient of photochemical quenching), NPQ (non-photochemical quenching), ΦNO (quantum yield of nonregulated energy dissipation in PSII), and ΦNPQ (quantum yield of regulated energy dissipation in PSII) values, which were calculated by ImagingWin v2.40b software, were presented. A detailed explanation and formulas of the chlorophyll fluorescence parameters can be found elsewhere [67,68].
4.3. RNA Isolation and cDNA Synthesis
Five primary leaves of control and drought-stressed plants were harvested in a two-day rhythm from day 2 of drought stress in the middle of light period and quickly frozen in nitrogen. Total RNA samples were isolated using a homemade Trizol reagent (0.8 M guanidine thiocyanate, 0.4 M ammonium thiocyanate, 0.1 M sodium acetate, 5% glycerol, 38% phenol (pH 5)) and dissolved in Diethyl pyrocarbonate -water. Three micrograms RNA was DNase (Roche)-treated at 37 °C for 30 min. Three micrograms of DNase-treated RNA was converted to cDNA with 5 µM random hexamer primer and 2.5 µM oligo (dT) using RevertAidTM H first strand cDNA synthesis kit (Fermentas, ThermoFisher, Waltham, MA, USA) in a reaction volume of 20 µL.
4.4. Expression Analysis by Real-Time PCR
The 10-µL reaction mixture consisted of 2 µL of 1:16 diluted cDNA (6.25 ng/µL), 1 × Platinum® SYBR® Green qPCR SuperMix-UDG (Invitrogen, ThermoFisher, Waltham, MA, USA), 0.3 µM each primer (specific for each gene, Table S1), and 10 nM Fluorescein calibration dye (Bio-rad, Hercules, CA, USA). Reactions were performed with MyiQ™2 (Bio-Rad, Hercules, CA, USA) at 50 °C for 2 min, followed by 95 °C for 60 s and 40 cycles of 95 °C for 15 s, 58 °C for 30 s, and a melting curve of 55–95 °C (0.5 °C/cycle increment, 7 s/cycle). A control sample of each time point was used as the control tissue (calibrator), and ACTIN gene was used as a reference gene.
4.5. ChIP
Ten primary leaves of control and drought-stressed plants were collected in the middle of the light period at day 12, crosslinked and used for chromatin extraction according to Reference [69]. Chromatin samples were sheared using a focused ultrasonicator (M220, Covaris, Woburn, MA, USA) to generate fragment sizes between 150 and 500 bp. Equal amounts of chromatin (500 µL) were divided into six aliquots. Four chromatin aliquots were incubated with equal amounts (9 µg) of four different antibodies (Anti-H3K4me3, ab8580; anti-H3K9ac, ab10812; anti-H3K9me2, ab1220 from Abcam, (Cambridge, UK); and anti-H3, MA301B, from Takara Bio Europe, Saint-Germain-en-Laye, France) at 4 °C overnight. No antibody was added to the fifth aliquot, but it was treated as the four İmmunoprecipitation samples and termed as the mock “no antibody control.” The sixth aliquot was stored at 4 °C until the reverse crosslinking step and termed as the input, representing the total chromatin. The washing of samples and elution of DNA were performed according to Reference [69]. DNA samples were amplified by real-time PCR in a 20-µL reaction mix containing 1 × qPCR master mix (KAPA SYBR FAST, Kapa Biosystems, Wilmington, MA, USA), 0.2 µM each primer, and 5 µL template. Reaction conditions were at 50 °C for 2 min followed by 95 °C for 60 s and 40 cycles of 95 °C for 15 s, 57 or 60 °C for 30 s, and a melting curve of 57–95 °C (0.5 °C/cycle increment, 10 s/cycle). The amount of DNA in antibody-enriched samples was quantified using a standard curve, which is a seven serial two-fold dilution (0.12–0.001875%) of input DNA. Five primer pairs (Table S1) representing four different regions (Figure S1) of HSP17 gene (HM854841) were designed using OligoAnalyzer 3.1 (Integrated DNA Technologies, Coralville, IA, USA). ACTIN, PP2A, BM9, and CEREBA were selected as reference genes with stable expression. , were reference genes described for the normalization of expression signals [70]. BM9, a barley MADS-box gene [65], and CEREBA, a centromeric retroelement of barley [52], were selected to represent the silent regions of the genome.
4.6. Data Analysis
All data are the arithmetic means of biological triplicates (n = 3). Statistical significance of the data was analyzed by ANOVA using ezANOVA (http://www.cabiatl.com/mricro/ezanova/). Age, one of the independent variables, has 11 levels; while watering, the other independent variable, has two levels.
5. Conclusions
Barley leaves respond to drought by a sequence of physiological responses which include fast stomatal closure, the onset of mechanisms protecting photosynthetic machinery against detrimentally effects, and later on, the onset of drought stress-induced senescence. Due to the enormous capacity to close stomata drastically, to keep water content stable, and to dissipate excess energy from PSII without closing reaction centers and losing chlorophyll, Carina gains tolerance against drought.
This complex physiological response is based on molecular pathways including, as a central mechanism, the reprogramming of nuclear gene expression. One of these drought-responsive genes is HSP17, which is induced during drought. Our results prove the drought-responsive regulation of chromatin status at HSP17. The general response is a shift in H3-density at all genes investigated, with an increase during drought. This indicates a denser nucleosome packaging in drought-treated plants. At HSP17, the euchromatic mark H3K4me3 is established at TSS during drought, indicating epigenetic control mechanisms upstream of the drought-responsive expression of HSP17. The loss of H3K9me2 is a common histone modification, especially in CEREBA, a centromeric retrotransposon. This, along with H3K9ac, did not affect the transcription of housekeeping genes. The modification of both housekeeping (ACTIN, PP2A) and silent genes (BM9, CEREBA) by the loss or gain of epigenetic marks did not alter their transcription status.
Supplementary Materials
The following are available online at www.mdpi.com/link/2073-4395/7/2/43/s1. Figure S1: Representation of the primer sets on the HSP17, Table S1: Primer sequences used in the study.
Acknowledgments
We thank Christina Mohr (MLU-Halle) for her help in greenhouse studies. This work was supported by Scientific Research Projects Coordination Unit of Istanbul University (project number 51971).
Author Contributions
Aslihan Temel and Klaus Humbeck conceived and designed the experiments; Aslihan Temel performed the experiments; Aslihan Temel and Bianka Janack analyzed the data; Aslihan Temel, Bianka Janack and Klaus Humbeck wrote the paper.
Conflicts of Interest
The authors declare no conflict of interest.
References
- Mahajan, S.; Tuteja, N. Cold, salinity and drought stresses: An overview. Arch. Biochem. Biophys. 2005, 444, 139–158. [Google Scholar] [CrossRef] [PubMed]
- Bhargava, S.; Sawant, K. Drought stress adaptation: Metabolic adjustment and regulation of gene expression. Plant Breed. 2013, 132, 21–32. [Google Scholar] [CrossRef]
- Maxwell, K.; Johnson, G.N. Chlorophyll fluorescence—A practical guide. J. Exp. Bot. 2000, 51, 659–668. [Google Scholar] [CrossRef] [PubMed]
- Murchie, E.H.; Lawson, T. Chlorophyll fluorescence analysis: A guide to good practice and understanding some new applications. J. Exp. Bot. 2013, 64, 3983–3998. [Google Scholar] [CrossRef] [PubMed]
- Athar, H.; Ashraf, M. Photosynthesis under drought stress. In Photosynthesis, 2nd ed.; Pessarakli, M., Ed.; CRC Press: New York, NY, USA, 2005; pp. 795–810. [Google Scholar]
- De Carvalho, M.H.C. Drought stress and reactive oxygen species. Plant Signal Behav. 2008, 3, 156–165. [Google Scholar] [CrossRef]
- Chaves, M.M.; Flexas, J.; Pinheiro, C. Photosynthesis under drought and salt stress: Regulation mechanisms from whole plant to cell. Ann. Bot. 2009, 103, 551–560. [Google Scholar] [CrossRef] [PubMed]
- Guo, P.; Baum, M.; Grando, S.; Ceccarelli, S.; Bai, G.; Li, R.; von Korff, M.; Varshney, R.K.; Graner, A.; Valkoun, J. Differentially expressed genes between drought-tolerant and drought-sensitive barley genotypes in response to drought stress during the reproductive stage. J. Exp. Bot. 2009, 60, 3531–3544. [Google Scholar] [CrossRef] [PubMed]
- Behringer, D.; Zimmermann, H.; Ziegenhagen, B.; Liepelt, S. Differential gene expression reveals candidate genes for drought stress response in Abies alba (Pinaceae). PLoS ONE 2015, 10, e0124564. [Google Scholar] [CrossRef] [PubMed]
- Li, S.; Fan, C.; Li, Y.; Zhang, J.; Sun, J.; Chen, Y.; Tian, C.; Su, X.; Lu, M.; Liang, C.; et al. Effects of drought and salt-stresses on gene expression in Caragana korshinskii seedlings revealed by RNA-seq. BMC Genomics 2016, 17, 200. [Google Scholar] [CrossRef] [PubMed]
- Chinnusamy, V.; Zhu, J.K. Epigenetic regulation of stress responses in plants. Curr. Opin. Plant Biol. 2009, 12, 133–139. [Google Scholar] [CrossRef] [PubMed]
- Han, S.K.; Wagner, D. Role of chromatin in water stress responses in plants. J. Exp. Bot. 2014, 65, 2785–2799. [Google Scholar] [CrossRef] [PubMed]
- Kinoshita, T.; Seki, M. Epigenetic memory for stress response and adaptation in plants. Plant Cell Physiol. 2014, 55, 1859–1863. [Google Scholar] [CrossRef] [PubMed]
- Filek, M.; Łabanowska, M.; Koscielniak, J.; Biesaga-Koscielniak, J.; Kurdziel, M.; Szarejko, I.; Hartikainen, H. Characterization of barley leaf tolerance to drought stress by chlorophyll fluorescence and electron paramagnetic resonance studies. J. Agron. Crop Sci. 2015, 201, 228–240. [Google Scholar] [CrossRef]
- Ferdous, J.; Sanchez-Ferrerov, J.C.; Langridge, P.; Milne, L.; Chowdhury, J.; Brien, C.; Tricker, P.J. Differential expression of microRNAs and potential targets under drought stress in barley. Plant Cell Environ. 2017, 40, 11–24. [Google Scholar] [CrossRef] [PubMed]
- Rollins, J.A.; Habte, E.; Templer, S.E.; Colby, T.; Schmidt, J.; von Korff, M. Leaf proteome alterations in the context of physiological and morphological responses to drought and heat stress in barley (Hordeum vulgare L.). J. Exp. Bot. 2013, 64, 3201–3212. [Google Scholar] [CrossRef] [PubMed]
- Templer, S.E.; Ammon, A.; Pscheidt, D.; Ciobotea, O.; Schuy, C.; McCollum, C.; Sonnewald, U.; Hanemann, A.; Förster, J.; Ordon, F.; et al. Metabolite profiling of barley flag leaves under drought and combined heat and drought stress reveals metabolic QTLs for metabolites associated with antioxidant defense. J. Exp. Bot. 2017, 68, 1697–1713. [Google Scholar] [CrossRef] [PubMed]
- Kim, J.M.; To, T.K.; Ishida, J.; Morosawa, T.; Kawashima, M.; Matsui, A.; Toyoda, T.; Kimura, H.; Shinozaki, K.; Seki, M. Alterations of lysine modifications on the histone H3 N-tail under drought stress conditions in Arabidopsis thaliana. Plant Cell Physiol. 2008, 49, 1580–1588. [Google Scholar] [CrossRef] [PubMed]
- Zong, W.; Zhong, X.; You, J.; Xiong, L. Genome-wide profiling of histone H3K4-tri-methylation and gene expression in rice under drought stress. Plant Mol. Biol. 2013, 81, 175–188. [Google Scholar] [CrossRef] [PubMed]
- Gonzalez, R.M.; Ricardi, M.M.; Iusem, N.D. Epigenetic marks in an adaptive water stress-responsive gene in tomato roots under normal and drought conditions. Epigenetics 2013, 8, 864–872. [Google Scholar] [CrossRef] [PubMed]
- Kwon, C.S.; Lee, D.; Choi, G.; Chung, W.I. Histone occupancy-dependent and -independent removal of H3K27 trimethylation at cold-responsive genes in Arabidopsis. Plant J. 2009, 60, 112–121. [Google Scholar] [CrossRef] [PubMed]
- Chwialkowska, K.; Nowakowska, U.; Mroziewicz, A.; Szarejko, I.; Kwasniewski, M. Water-deficiency conditions differently modulate the methylome of roots and leaves in barley (Hordeum vulgare L.). J. Exp. Bot. 2016, 67, 1109–1121. [Google Scholar] [CrossRef] [PubMed]
- Papaefthimiou, D.; Tsaftaris, A.S. Characterization of a drought inducible trithorax-like H3K4 methyltransferase from barley. Biol. Plant. 2012, 56, 683–692. [Google Scholar] [CrossRef]
- Papaefthimiou, D.; Tsaftaris, A.S. Significant induction by drought of HvPKDM7-1, a gene encoding a jumonji-like histone demethylase homologue in barley (H. vulgare). Acta Physiol. Plant. 2012, 34, 1187–1198. [Google Scholar] [CrossRef]
- Ahmed, I.M.; Nadira, U.A.; Bibi, N.; Zhang, G.; Wu, F. Tolerance to combined stress of drought and salinity in barley. In Combined Stresses in Plants Physiological, Molecular, and Biochemical Aspects; Mahalingam, R., Ed.; Springer: Basel, Switzerland, 2015; pp. 93–121. ISBN 978-3-319-07899-1. [Google Scholar]
- Munne-Bosch, S.; Alegre, L. Die and let live: Leaf senescence contributes to plant survival under drought stress. Funct. Plant Biol. 2004, 31, 203–216. [Google Scholar] [CrossRef]
- Lim, P.O.; Kim, H.J.; Nam, H.G. Leaf senescence. Annu. Rev. Plant Biol. 2007, 58, 115–136. [Google Scholar] [CrossRef] [PubMed]
- Prochazkova, D.; Sairam, R.K.; Srivastava, G.C.; Singh, D.V. Oxidative stress and antioxidant activity as the basis of senescence in maize leaves. Plant Sci. 2001, 161, 765–771. [Google Scholar] [CrossRef]
- Rivero, R.M.; Kojima, M.; Gepstein, A.; Sakakibara, H.; Mittler, R.; Gepstein, S.; Blumwald, E. Delayed leaf senescence induces extreme drought tolerance in a flowering plant. Proc. Natl. Acad. Sci. USA 2007, 104, 19631–19636. [Google Scholar] [CrossRef] [PubMed]
- Chaves, M.M.; Pereira, J.S.; Maroco, J.; Rodrigues, M.L.; Ricardo, C.P.; Osorio, M.L.; Carvalho, I.; Faria, T.; Pinheiro, C. How plants cope with water stress in the field. Photosynthesis and growth. Ann. Bot. 2002, 89, 907–916. [Google Scholar] [CrossRef] [PubMed]
- Blum, A. Drought resistance, water-use efficiency, and yield potential-are they compatible, dissonant, or mutually exclusive? Aust. J. Agric. Res. 2005, 56, 1159–1168. [Google Scholar] [CrossRef]
- Arunyanark, A.; Jogloy, S.; Akkasaeng, C.; Vorasoot, N.; Kesmala, T.; Nageswara Rao, R.C.; Wright, G.C.; Patanothai, A. Chlorophyll stability is an indicator of drought tolerance in peanut. J. Agron. Crop Sci. 2008, 194, 113–125. [Google Scholar] [CrossRef]
- Li, R.H.; Guo, P.G.; Michael, B.; Stefania, G.; Cecceralli, S. Evaluation of chlorophyll content and fluorescence parameters as indicators of drought tolerance in barley. Agric. Sci. China 2006, 5, 751–757. [Google Scholar] [CrossRef]
- Kramer, D.M.; Johnson, G.; Kiirats, O.; Edwards, G.E. New fluorescence parameters for the determination of q(a) redox state and excitation energy fluxes. Photosynth. Res. 2004, 79, 209–218. [Google Scholar] [CrossRef] [PubMed]
- Gorbe, E.; Calatayud, A. Applications of chlorophyll fluorescence imaging technique in horticultural research: A review. Sci. Hortic. 2012, 138, 24–35. [Google Scholar] [CrossRef]
- Osorio, M.L.; Osorio, J.; Vieira, A.C.; Goncalves, S.; Romano, A. Influence of enhanced temperature on photosynthesis, photooxidative damage, and antioxidant strategies in Ceratonia siliqua L. seedlings subjected to water deficit and rewatering. Photosynthetica 2011, 49, 3–12. [Google Scholar] [CrossRef]
- Subrahmanyam, D.; Subash, N.; Haris, A.; Sikka, A.K. Influence of water stress on leaf photosynthetic characteristics in wheat cultivars differing in their susceptibility to drought. Photosynthetica 2006, 44, 125–129. [Google Scholar] [CrossRef]
- Razavi, F.; Pollet, B.; Steppe, K.; van Labeke, M.C. Chlorophyll fluorescence as a tool for evaluation of drought stress in strawberry. Photosynthetica 2008, 46, 631–633. [Google Scholar] [CrossRef]
- Efeoglu, B.; Ekmekci, Y.; Cicek, N. Physiological responses of three maize cultivars to drought stress and recovery. S. Afr. J. Bot. 2009, 75, 34–42. [Google Scholar] [CrossRef]
- Terzi, R.; Saglam, A.; Kutlu, N.; Nar, H.; Kadioglu, A. Impact of soil drought stress on photochemical efficiency of Photosystem II and antioxidant enzyme activities of Phaseolus vulgaris cultivars. Turk. J. Bot. 2010, 34, 1–10. [Google Scholar]
- Sun, W.; Van Montagu, M.; Verbruggen, N. Small heat shock proteins and stress tolerance in plants. Biochim. Biophys. Acta 2002, 1577, 1–9. [Google Scholar] [CrossRef]
- Waters, E.R. The evolution, function, structure, and expression of the plant sHSPs. J. Exp. Bot. 2013, 64, 391–403. [Google Scholar] [CrossRef] [PubMed]
- Hayano-Kanashiro, C.; Calderon-Vazquez, C.; Ibarra-Laclette, E.; Herrera-Estrella, L.; Simpson, J. Analysis of gene expression and physiological responses in three Mexican maize landraces under drought stress and recovery irrigation. PLoS ONE 2009, 4, e7531. [Google Scholar] [CrossRef] [PubMed]
- Zou, J.; Liu, C.; Liu, A.; Zou, D.; Chen, X. Overexpression of OsHsp17.0 and OsHsp23.7 enhances drought and salt tolerance in rice. J. Plant Physiol. 2012, 169, 628–635. [Google Scholar] [CrossRef] [PubMed]
- Sun, X.; Sun, C.; Li, Z.; Hu, Q.; Han, L.; Luo, H. AsHSP17, a creeping bentgrass small heat shock protein modulates plant photosynthesis and ABA-dependent and independent signalling to attenuate plant response to abiotic stress. Plant Cell Environ. 2016, 39, 1320–1337. [Google Scholar] [CrossRef] [PubMed]
- Grigorova, B.; Vaseva, I.; Demirevska, K.; Feller, U. Combined drought and heat stress in wheat: Changes in some heat shock proteins. Biol. Plant. 2011, 55, 105–111. [Google Scholar] [CrossRef]
- Svoboda, P.; Janska, A.; Spiwok, V.; Prasil, I.T.; Kosova, K.; Vitamvas, P.; Ovesna, J. Global scale transcriptional profiling of two contrasting barley genotypes exposed to moderate drought donditions: Contribution of leaves and crowns to water shortage coping strategies. Front. Plant Sci. 2016, 7, 1958. [Google Scholar] [CrossRef] [PubMed]
- Henikoff, S. Nucleosome destabilization in the epigenetic regulation of gene expression. Nat. Rev. Genet. 2008, 9, 15–26. [Google Scholar] [CrossRef] [PubMed]
- Radman-Livaja, M.; Rando, O.J. Nucleosome positioning: How is it established, and why does it matter? Dev. Biol. 2010, 339, 258–266. [Google Scholar] [CrossRef] [PubMed]
- Kim, J.M.; To, T.K.; Ishida, J.; Matsui, A.; Kimura, H.; Seki, M. Transition of chromatin status during the process of recovery from drought stress in Arabidopsis thaliana. Plant Cell Physiol. 2012, 53, 847–856. [Google Scholar] [CrossRef] [PubMed]
- Roy, D.; Paul, A.; Roy, A.; Ghosh, R.; Ganguly, P.; Chaudhuri, S. Differential Acetylation of Histone H3 at the Regulatory Region of OsDREB1b Promoter Facilitates Chromatin Remodelling and Transcription Activation during Cold Stress. PLoS ONE 2014, 9, e100343. [Google Scholar] [CrossRef] [PubMed]
- Presting, G.G.; Malysheva, L.; Fuchs, J.; Schubert, I. A Ty3/gypsy retrotransposon-like sequence localizes to the centromeric regions of cereal chromosomes. Plant J. 1998, 16, 721–728. [Google Scholar] [CrossRef] [PubMed]
- Gilbert, N.; Boyle, S.; Fiegler, H.; Woodfine, K.; Carter, N.P.; Bickmore, W.A. Chromatin architecture of the human genome: Gene-rich domains are enriched in open chromatin fibers. Cell 2004, 118, 555–566. [Google Scholar] [CrossRef] [PubMed]
- Van Zanten, M.; Tessadori, F.; Peeters, A.J.M.; Fransz, P. Environment-induced chromatin reorganization and plant acclimation. In Signaling and Communication in Plants; Grafi, G., Ohad, N., Eds.; Springer: Berlin, Germany, 2013; pp. 21–40. ISBN 978-3-642-35226-3. [Google Scholar]
- Mieczkowski, J.; Cook, A.; Bowman, S.K.; Mueller, B.; Alver, B.H.; Kundu, S.; Deaton, A.M.; Urban, J.A.; Larschan, E.; Park, P.J.; et al. MNase titration reveals differences between nucleosome occupancy and chromatin accessibility. Nat. Commun. 2016, 7, 11485. [Google Scholar] [CrossRef] [PubMed]
- Fuchs, J.; Schubert, I. Chromosomal distribution and functional interpretation of epigenetic histone marks in plants. In Plant Cytogenetics: Genome Structure and Chromosome Function; Bass, H.W., Birchler, J.A., Eds.; Springer: New York, NY, USA, 2012; Volume 4, pp. 231–253. [Google Scholar]
- Zhou, J.; Wang, X.; He, K.; Charron, J.B.; Elling, A.A.; Deng, X.W. Genome-wide profiling of histone H3 lysine 9 acetylation and dimethylation in Arabidopsis reveals correlation between multiple histone marks and gene expression. Plant Mol. Biol. 2010, 72, 585–595. [Google Scholar] [CrossRef] [PubMed]
- Brusslan, J.A.; Bonora, G.; Rus-Canterbury, A.M.; Tariq, F.; Jaroszewicz, A.; Pellegrini, M. A genome-wide chronological study of gene expression and two histone modifications, H3K4me3 and H3K9ac, during developmental leaf senescence. Plant Physiol. 2015, 168, 1246–1261. [Google Scholar] [CrossRef] [PubMed]
- Hu, Y.; Zhang, L.; He, S.; Huang, M.; Tan, J.; Zhao, L.; Yan, S.; Li, H.; Zhou, K.; Liang, Y.; et al. Cold stress selectively unsilences tandem repeats in heterochromatin associated with accumulation of H3K9ac. Plant Cell Environ. 2012, 35, 2130–2142. [Google Scholar] [CrossRef] [PubMed]
- Berger, S.L. The complex language of chromatin regulation during transcription. Nature 2007, 447, 407–412. [Google Scholar] [CrossRef] [PubMed]
- Santos-Rosa, H.; Schneider, R.; Bannister, A.J.; Sherriff, J.; Bernstein, B.E.; Emre, N.C.; Schreiber, S.L.; Mellor, J.; Kouzarides, T. Active genes are tri-methylated at K4 of histone H3. Nature 2002, 419, 407–411. [Google Scholar] [CrossRef] [PubMed]
- Van Dijk, K.; Ding, Y.; Malkaram, S.; Riethoven, J.J.; Liu, R.; Yang, J.; Laczko, P.; Chen, H.; Xia, Y.; Ladunga, I.; et al. Dynamic changes in genome-wide histone H3 lysine 4 methylation patterns in response to dehydration stress in Arabidopsis thaliana. BMC Plant Biol. 2010, 10, 238. [Google Scholar] [CrossRef] [PubMed]
- Liu, C.; Lu, F.; Cui, X.; Cao, X. Histone methylation in higher plants. Annu. Rev. Plant Biol. 2010, 61, 395–420. [Google Scholar] [CrossRef] [PubMed]
- Roudier, F.; Ahmed, I.; Berard, C.; Sarazin, A.; Mary-Huard, T.; Cortijo, S.; Bouyer, D.; Caillieux, E.; Duvernois-Berthet, E.; Al-Shikhley, L.; et al. Integrative epigenomic mapping defines four main chromatin states in Arabidopsis. EMBO J. 2011, 30, 1928–1938. [Google Scholar] [CrossRef] [PubMed]
- Schmitz, J.; Franzen, R.; Ngyuen, T.H.; Garcia-Maroto, F.; Pozzi, C.; Salamini, F.; Rohde, W. Cloning, mapping and expression analysis of barley MADS-box genes. Plant Mol. Biol. 2000, 42, 899–913. [Google Scholar] [CrossRef] [PubMed]
- Liu, N.; Fromm, M.; Avramova, Z. H3K27me3 and H3K4me3 chromatin environment at super-induced dehydration stress memory genes of Arabidopsis thaliana. Mol. Plant. 2014, 7, 502–513. [Google Scholar] [CrossRef] [PubMed]
- Misra, A.N.; Misra, M.; Singh, R. Chlorophyll fluorescence in plant biology. In Biophysics; Misra, A.N., Ed.; InTech: Shanghai, China, 2012; pp. 171–192. ISBN 978-953-51-0376-9. [Google Scholar]
- Brestic, M.; Zivcak, M. PSII fluorescence techniques for measurement of drought and high temperature stress signal in crop plants: Protocols and applications. In Molecular Stress Physiology of Plants; Rout, G.R., Das, A.B., Eds.; Springer: New Delhi, India, 2013; pp. 87–131. ISBN 978-81-322-0806-8. [Google Scholar]
- Ay, N.; Janack, B.; Fischer, A.; Reuter, G.; Humbeck, K. Alterations of histone modifications at the senescence-associated gene HvS40 in barley during senescence. Plant Mol. Biol. 2015, 89, 127–141. [Google Scholar] [CrossRef] [PubMed]
- Tian, C.; Jiang, Q.; Wang, F.; Wang, G.L.; Xu, Z.S.; Xiong, A.S. Selection of suitable reference genes for qPCR normalization under abiotic stresses and hormone stimuli in carrot leaves. PLoS ONE 2015, 10, e0117569. [Google Scholar] [CrossRef] [PubMed]
Figure 1.
Soil water content (SWC) (a) and leaf water content (LWC) (b) of control and stressed plants during drought stress treatment.
Figure 1.
Soil water content (SWC) (a) and leaf water content (LWC) (b) of control and stressed plants during drought stress treatment.
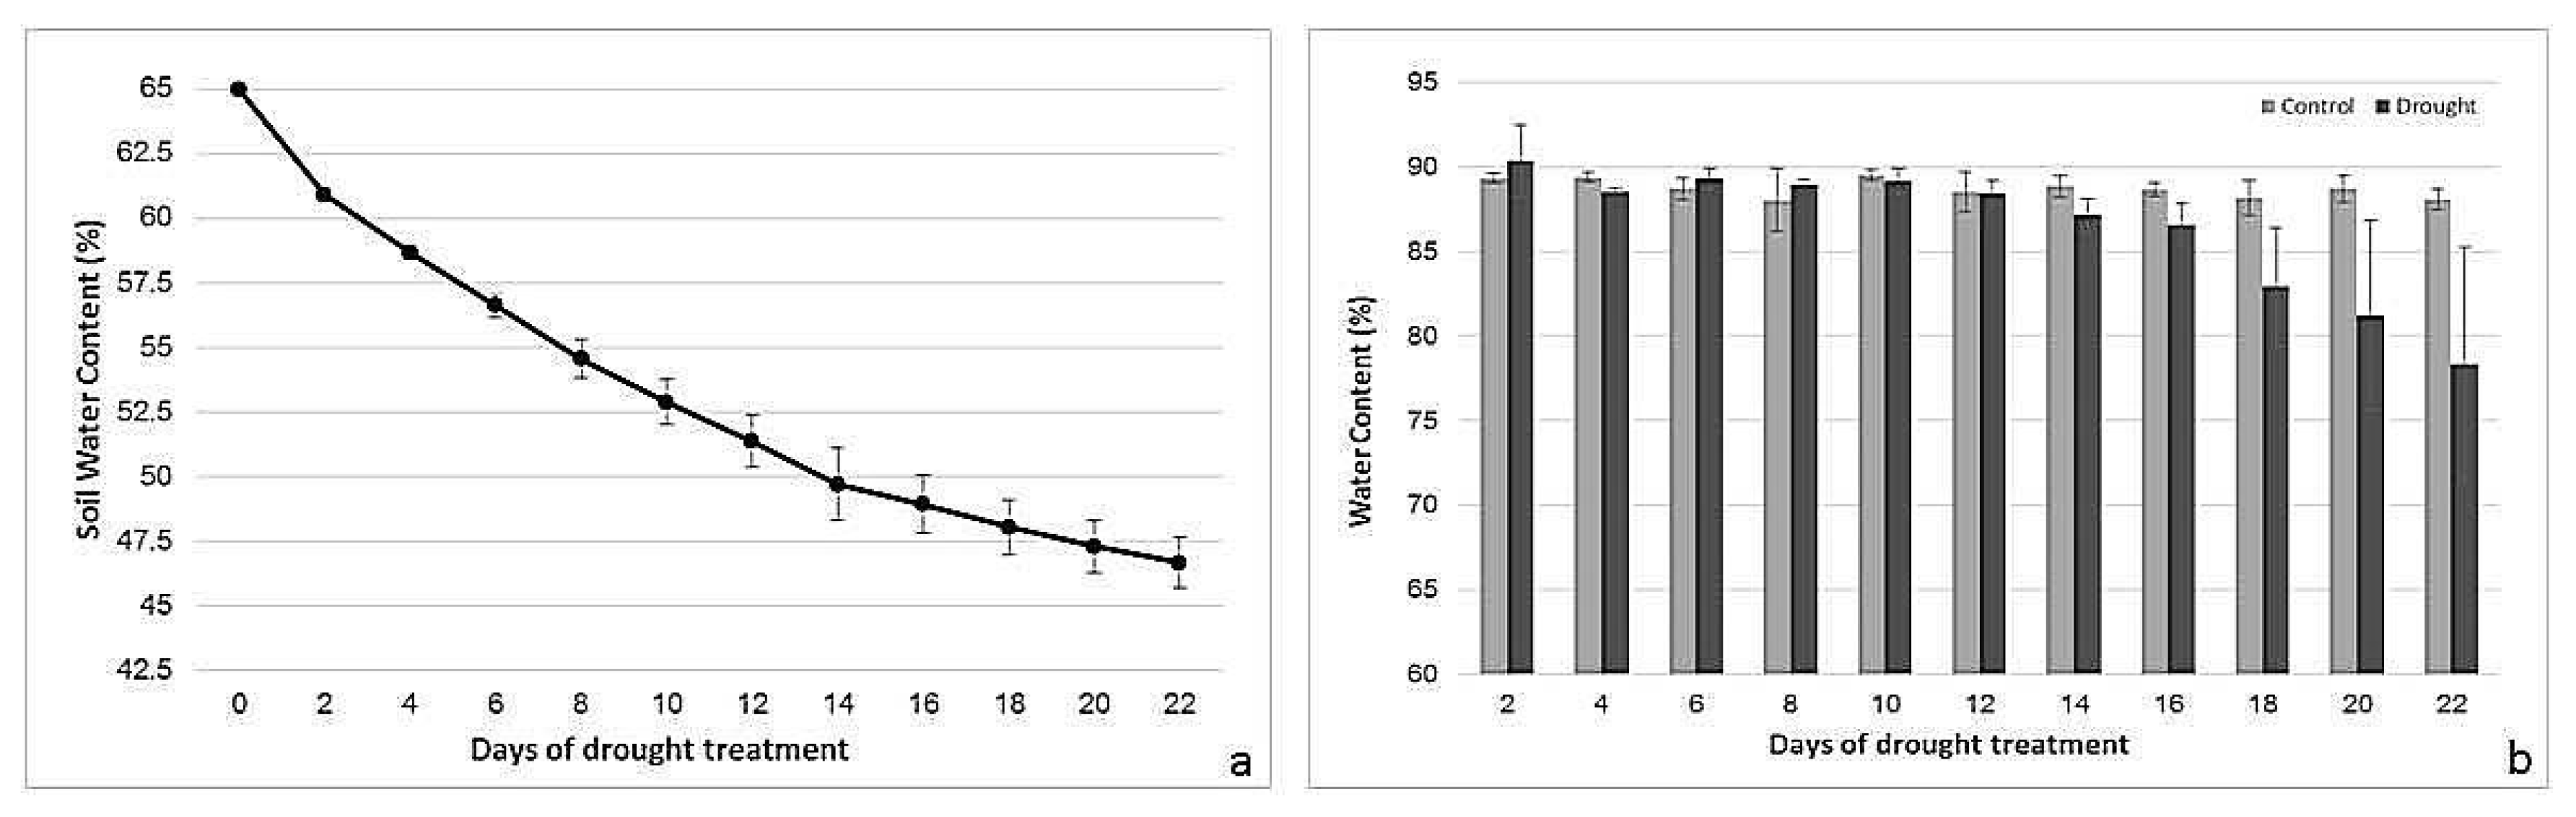
Figure 2.
Changes in stomatal conductance (mmol/m2/s) (a) and relative chlorophyll content (SPAD chlorophyll meter values) (b) of control and drought-stressed plants. n = 3, error bars represent standard error.
Figure 2.
Changes in stomatal conductance (mmol/m2/s) (a) and relative chlorophyll content (SPAD chlorophyll meter values) (b) of control and drought-stressed plants. n = 3, error bars represent standard error.
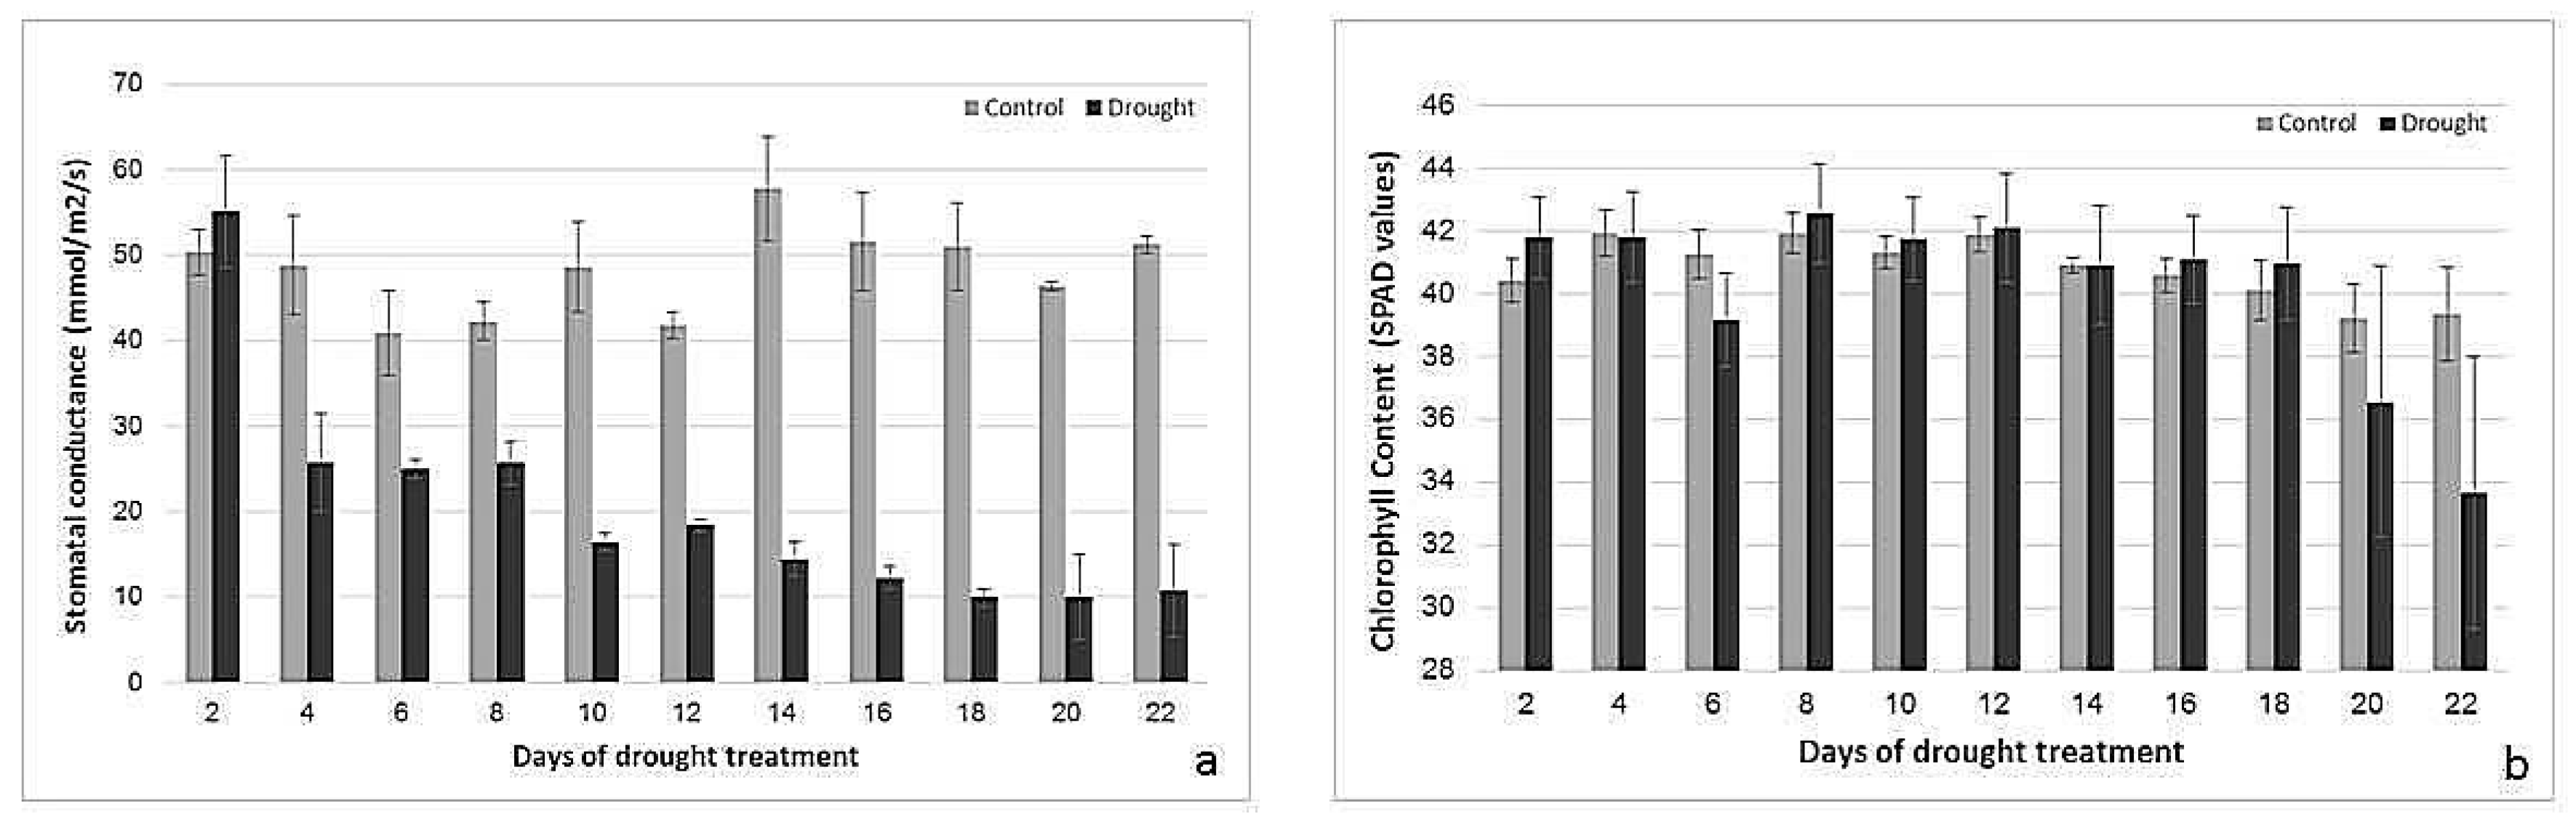
Figure 3.
Changes in Fv/Fm (a), ΦPSII (b), qP (c), and qL (d) of control and drought-stressed plants. n = 3, error bars represent standard error.
Figure 3.
Changes in Fv/Fm (a), ΦPSII (b), qP (c), and qL (d) of control and drought-stressed plants. n = 3, error bars represent standard error.
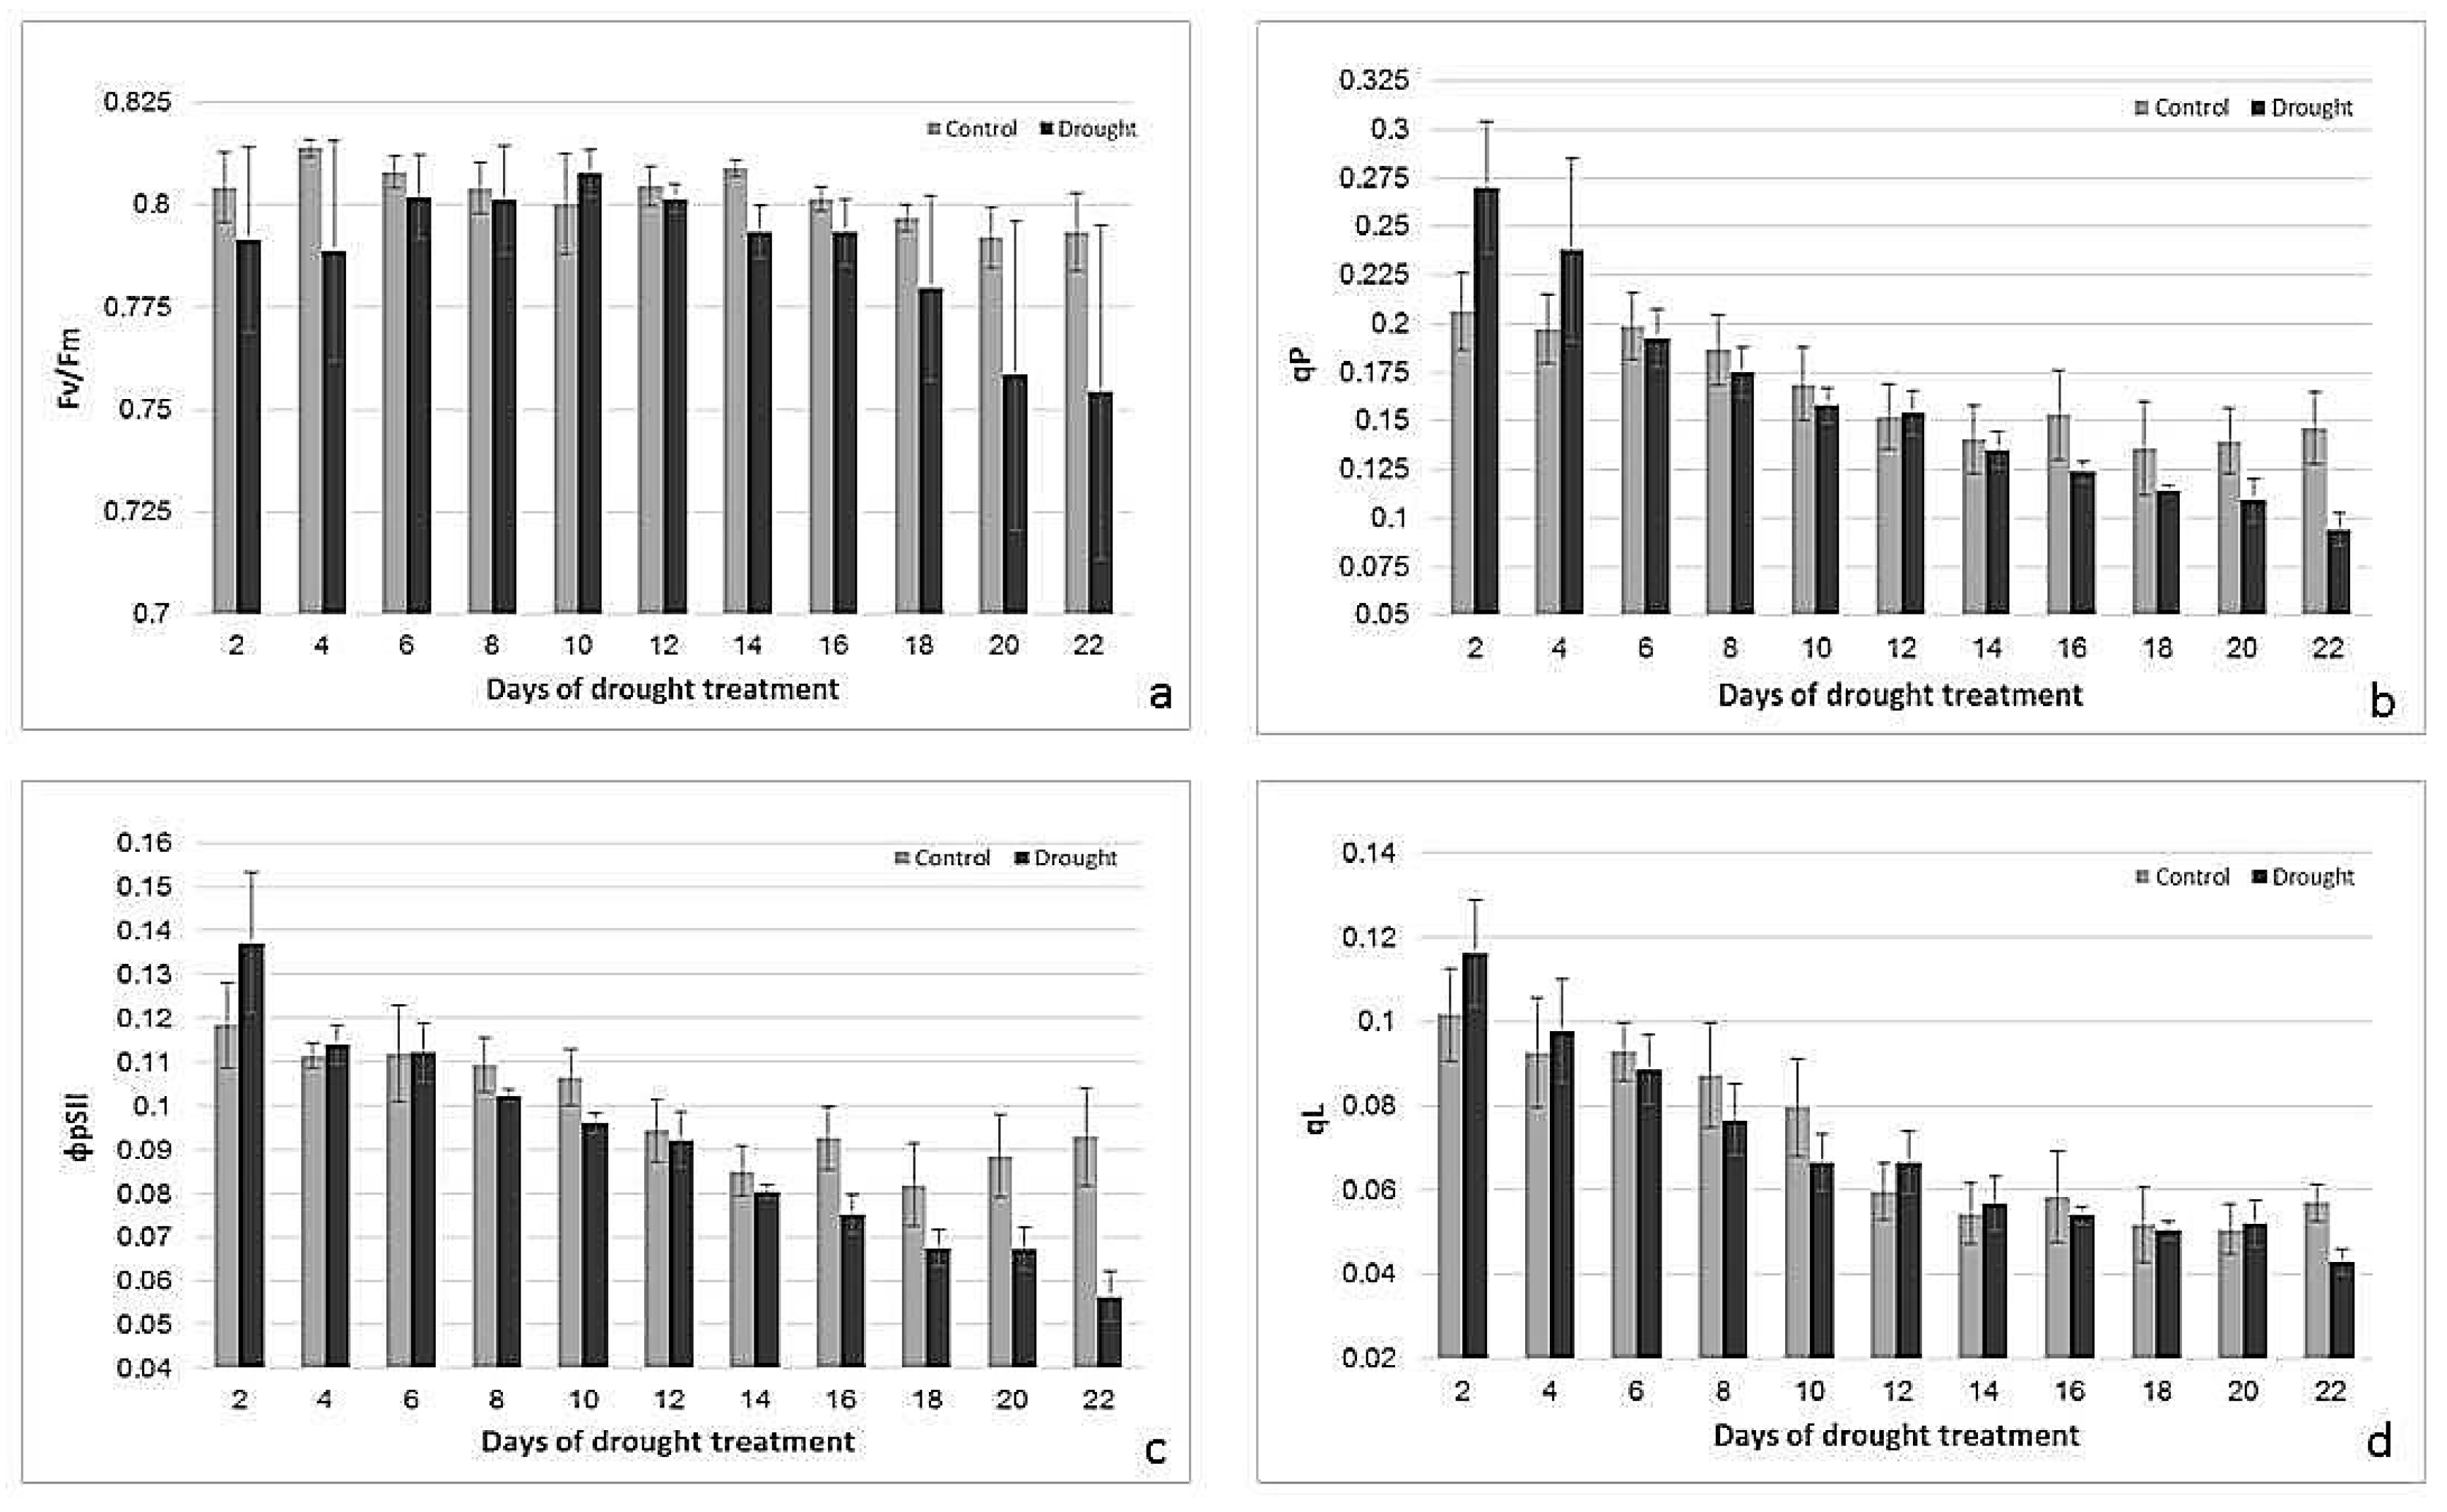
Figure 4.
Changes in ETR (a), NPQ (b), ΦNO (c), and ΦNPQ (d) of control and drought-stressed plants. n = 3, error bars represent standard error.
Figure 4.
Changes in ETR (a), NPQ (b), ΦNO (c), and ΦNPQ (d) of control and drought-stressed plants. n = 3, error bars represent standard error.
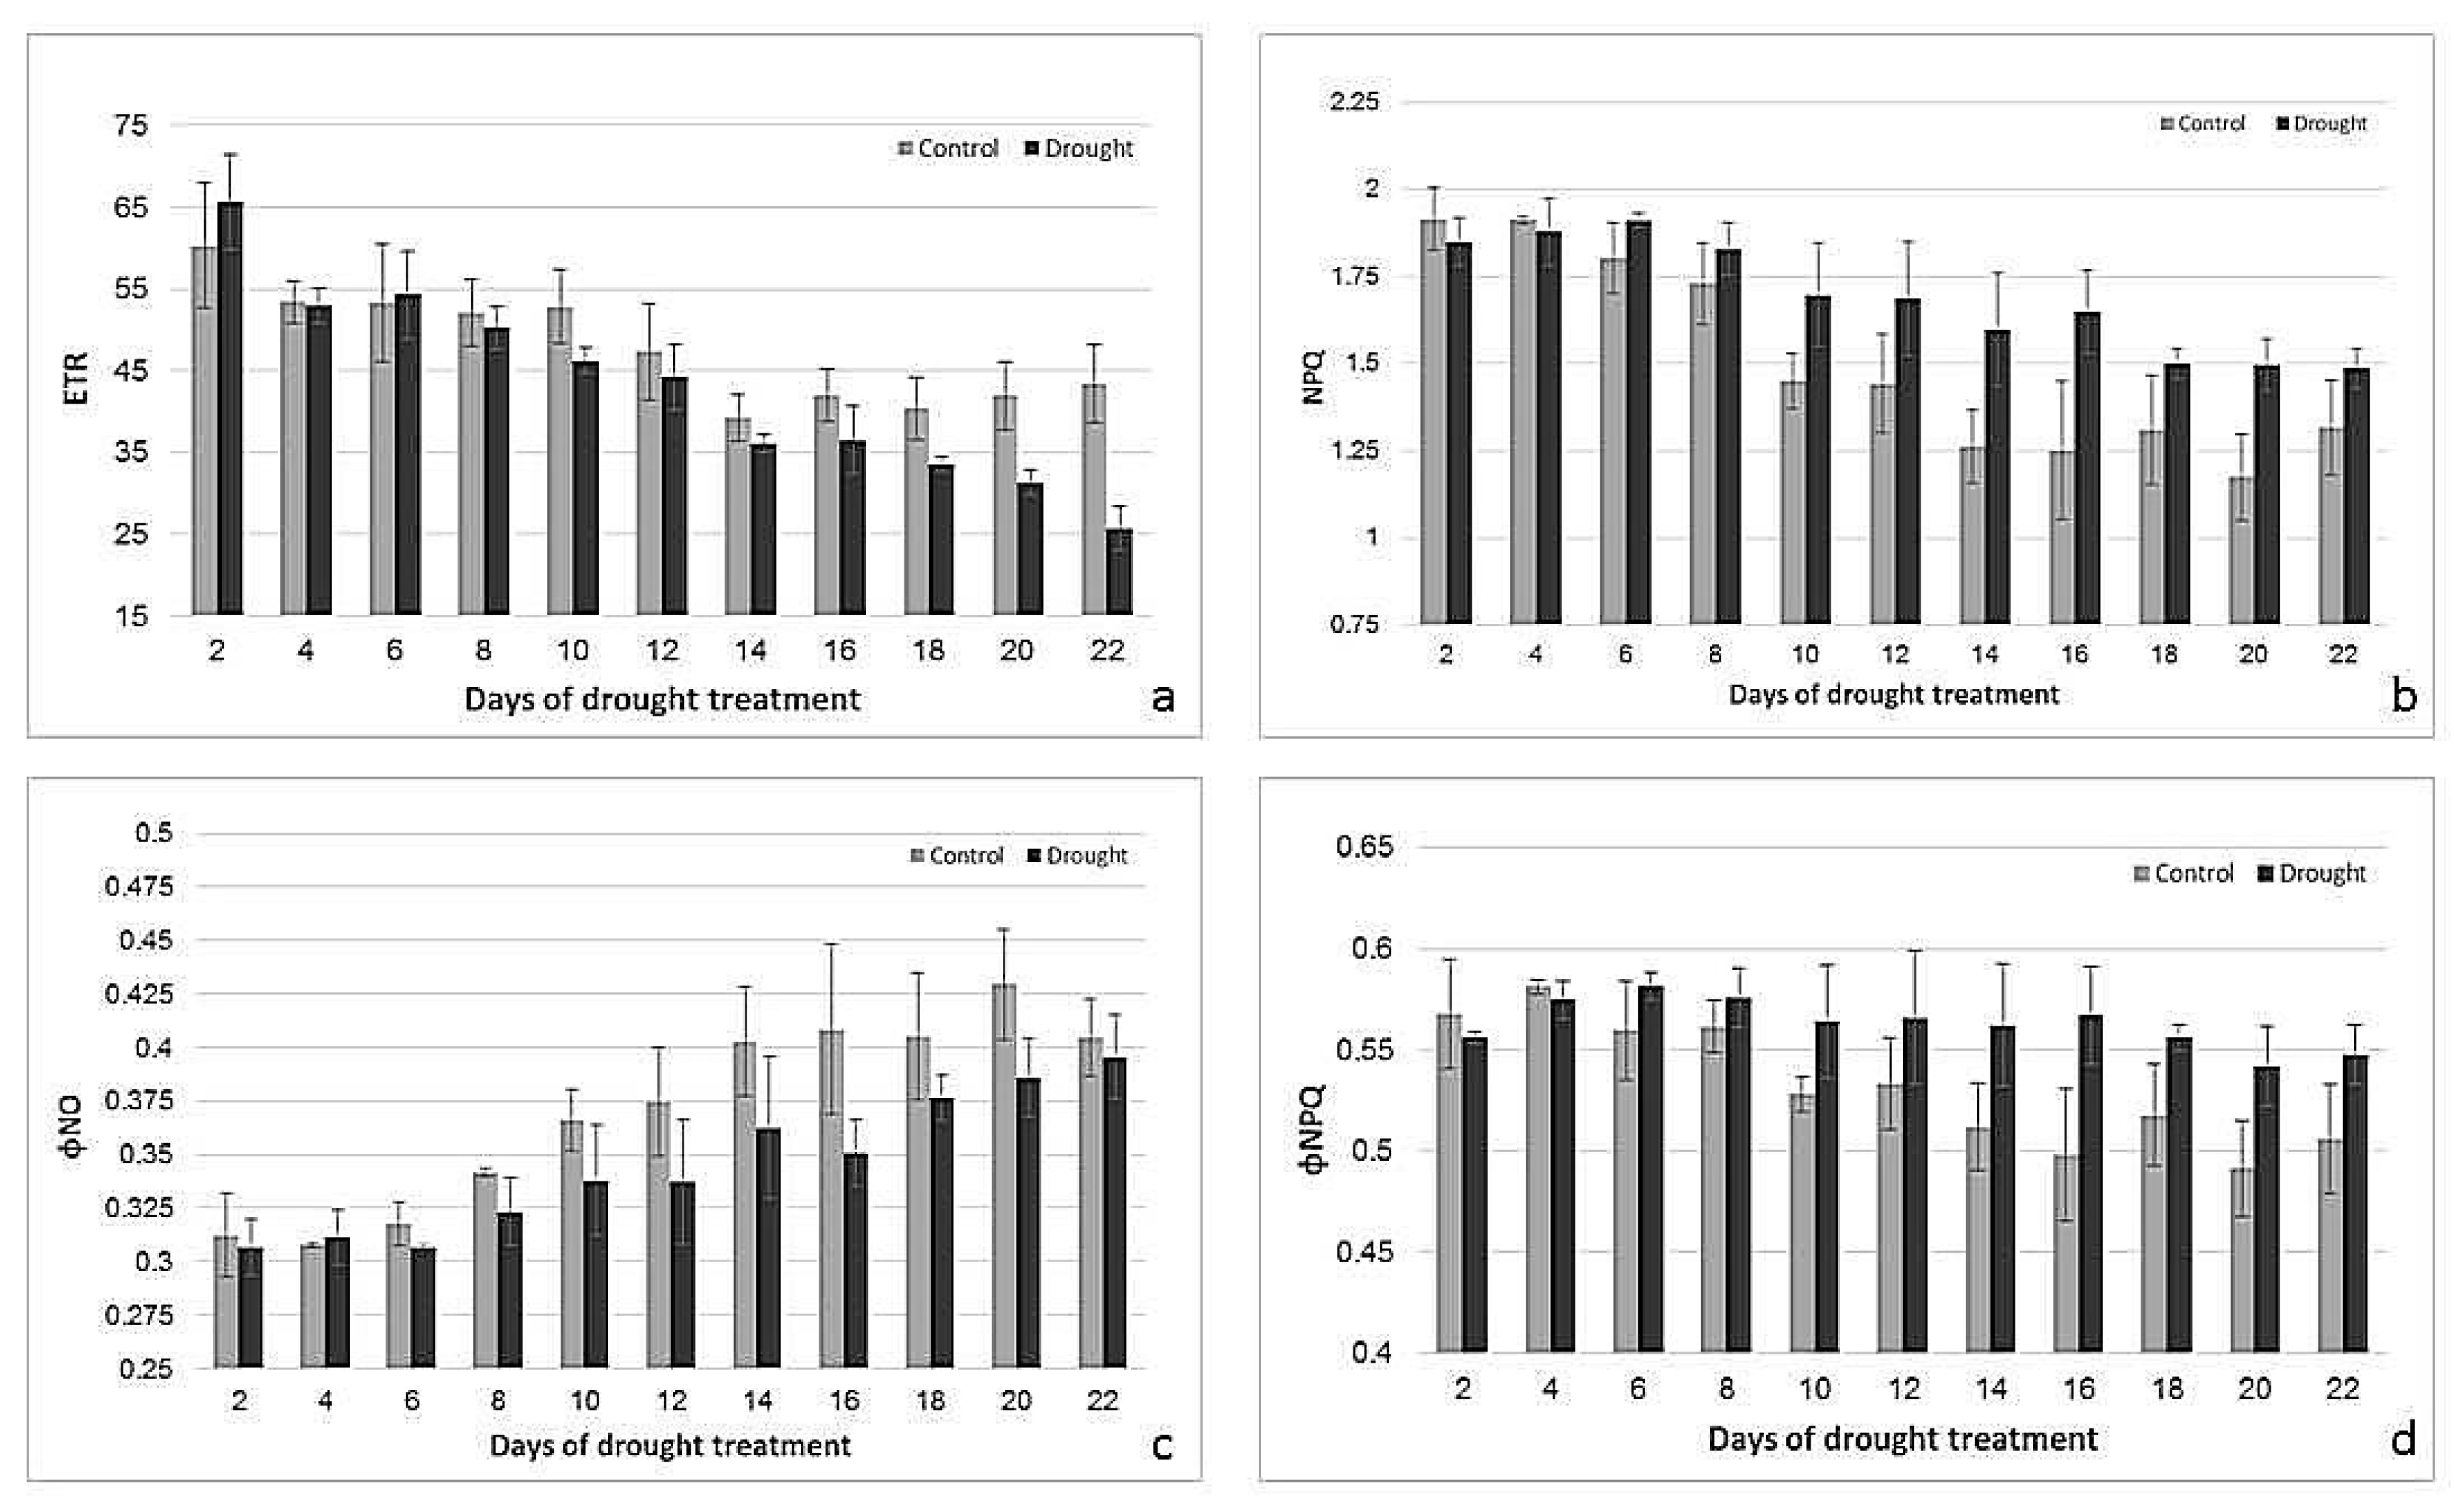
Figure 5.
Fold changes in the expression of HSP17 gene. n = 3, ± standard error.
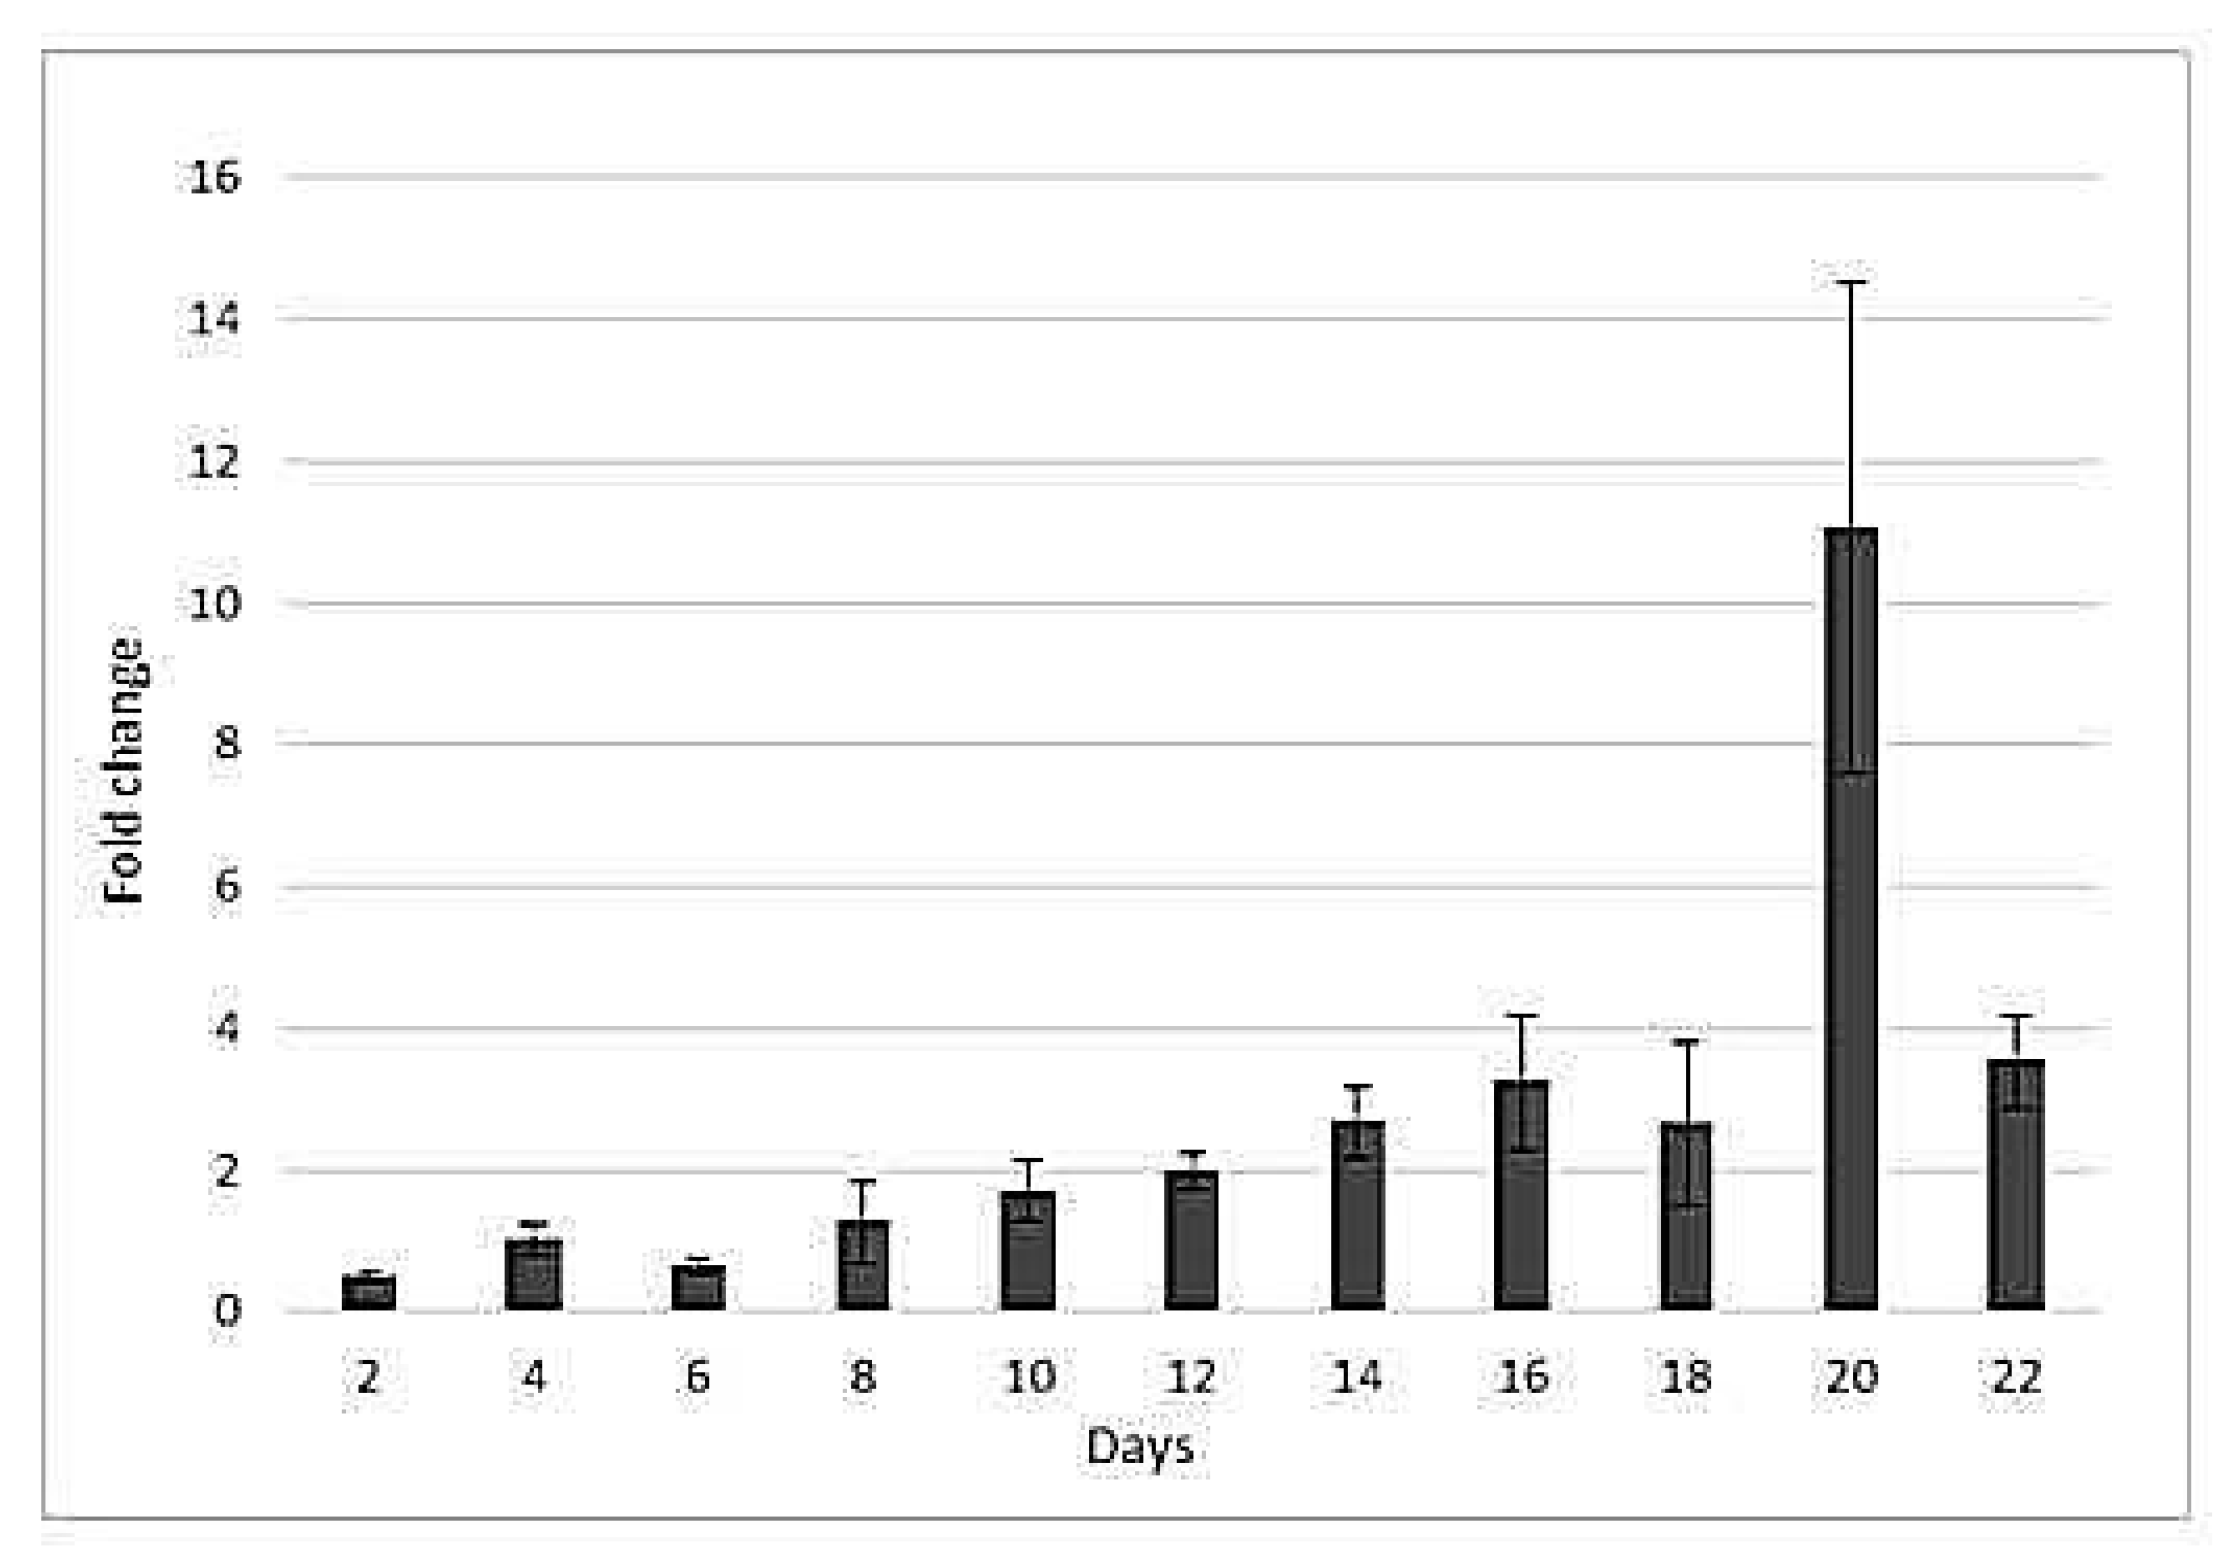
Figure 6.
H3 histone marks at reference genes ACTIN, PP2A, BM9, CEREBA as well as at the front, middle, and end of the coding region and 3′UTR of HSP17 gene. Values are expressed as %, and input is normalized to H3. n = 3, error bars represent standard error. ns: non-significant at p = 0.05 level, *: p ≤ 0.05, **: p ≤ 0.01, ***: p ≤ 0.005.
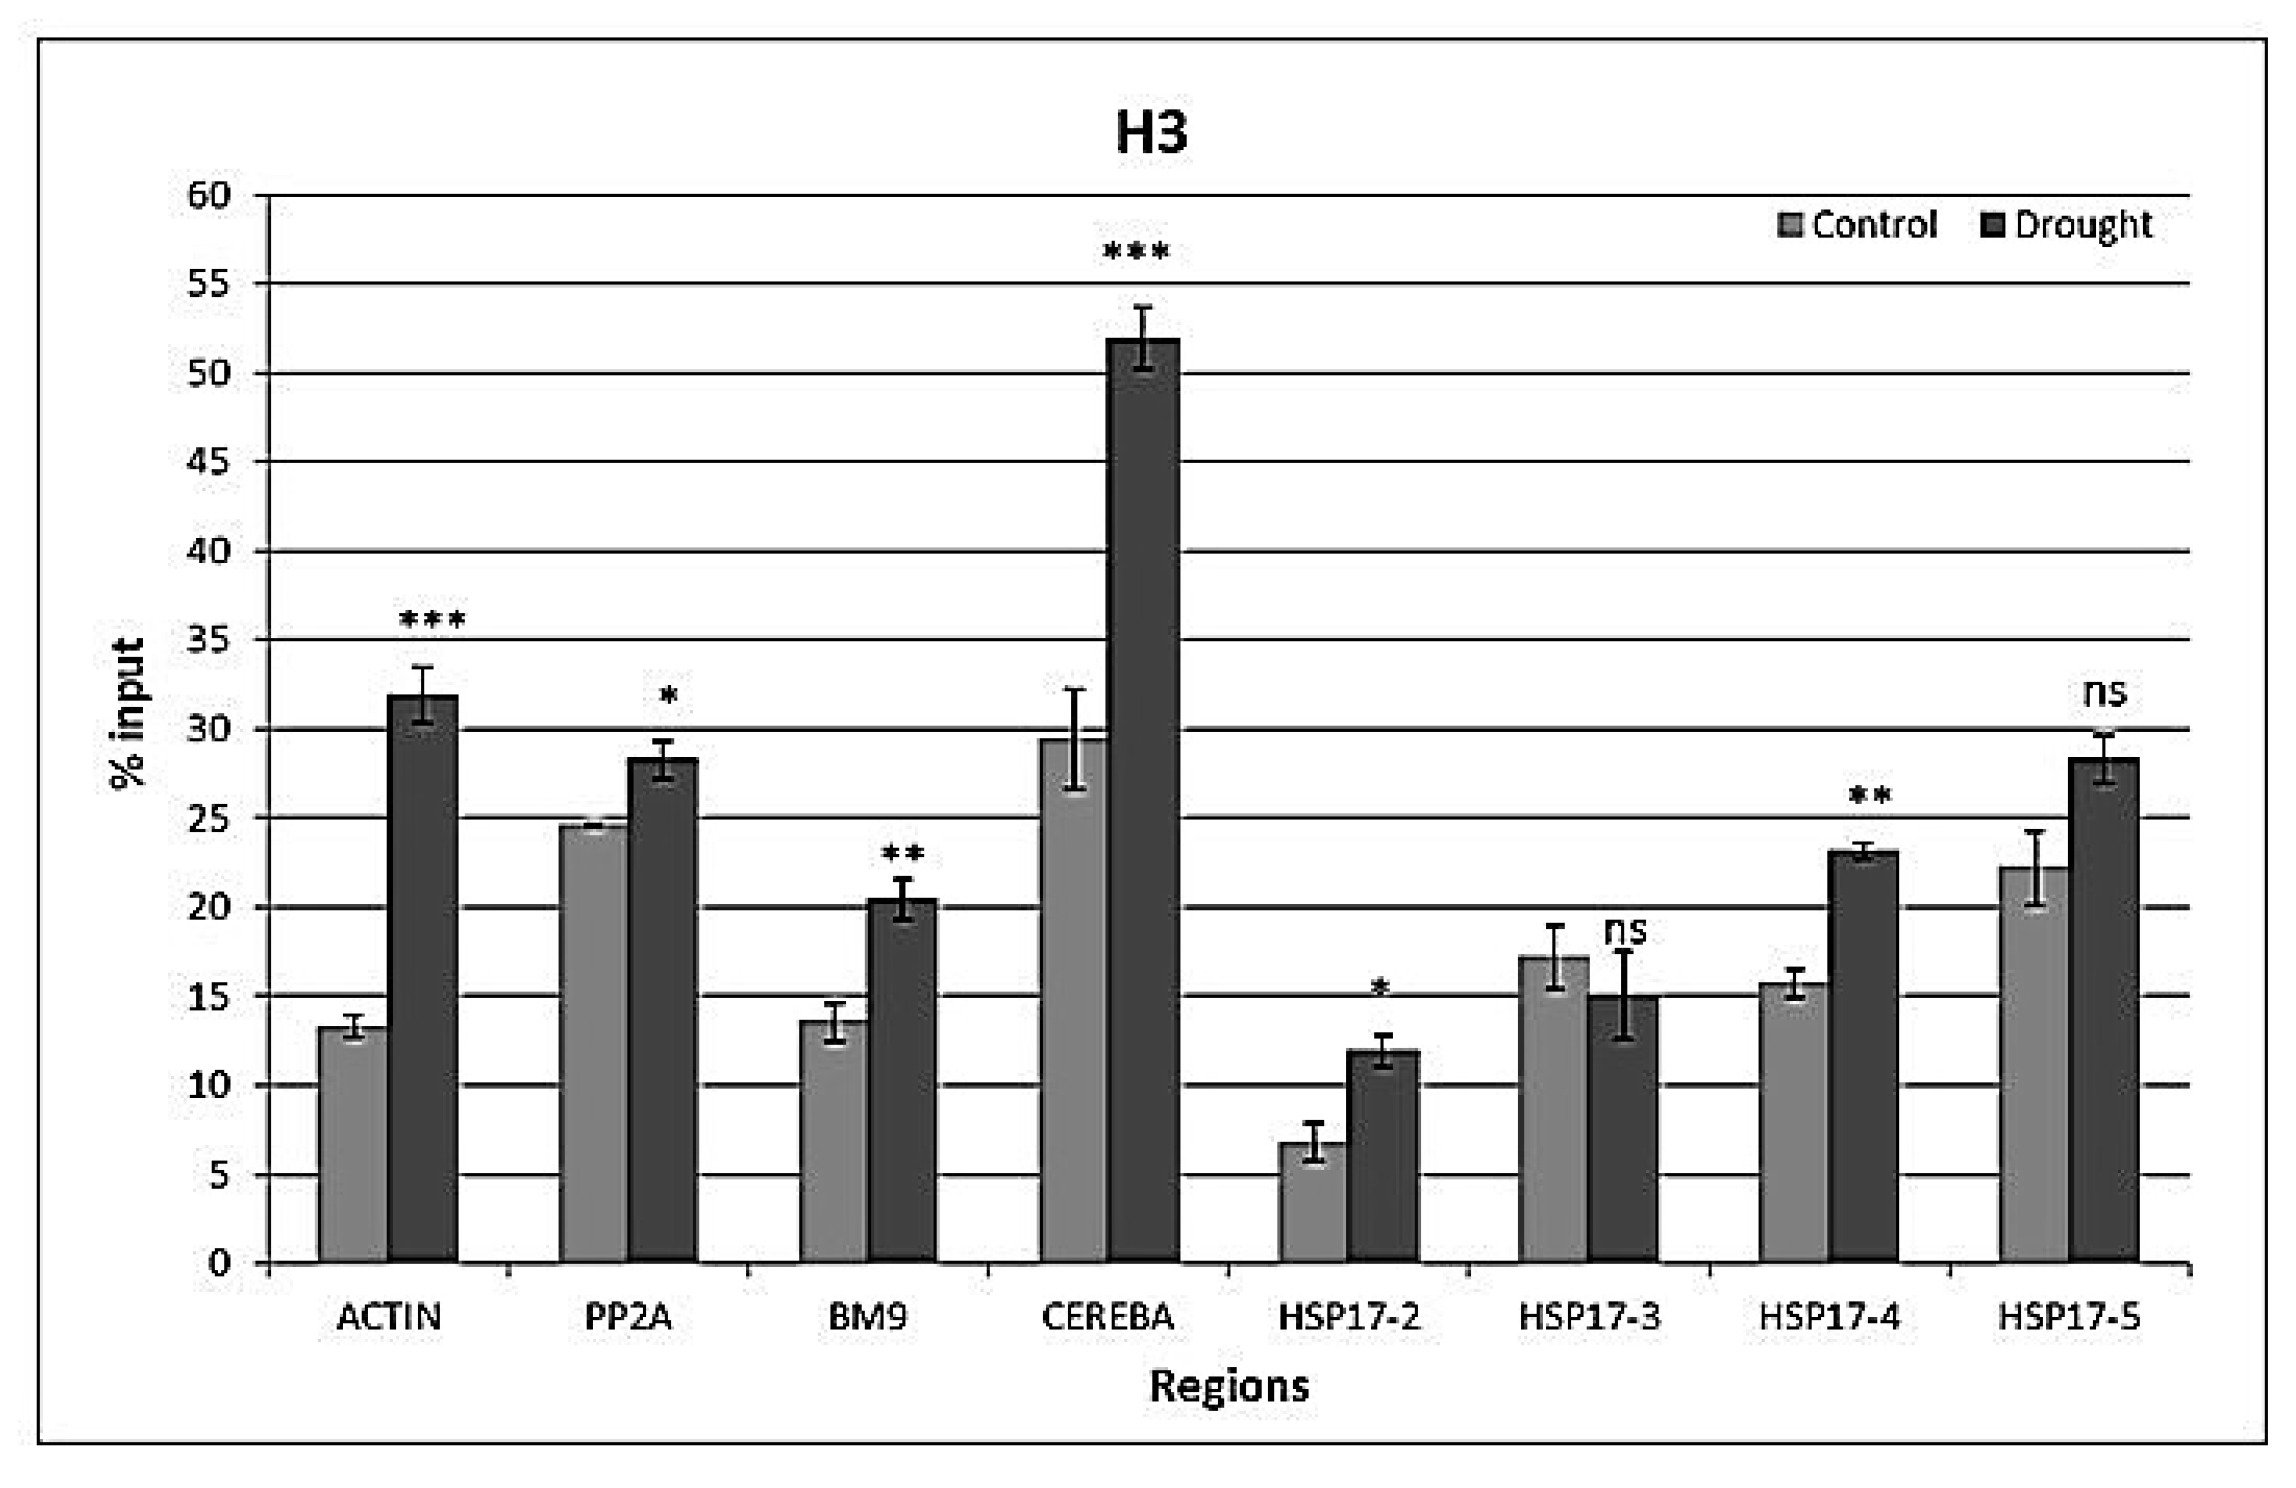
Figure 7.
H3K4me3 histone marks at reference genes ACTIN, PP2A, BM9, CEREBA as well as at the front, middle, and end of the coding region and 3′UTR of HSP17 gene. Values are expressed as %, and input is normalized to H3. n = 3, error bars represent standard error. ns: non-significant at p = 0.05 level, *: p ≤ 0.05, **: p ≤ 0.01, ***: p ≤ 0.005.

Figure 8.
H3K9ac histone marks at reference genes ACTIN, PP2A, BM9, CEREBA as well as at the front, middle, and end of the coding region and 3′UTR of HSP17 gene. Values are expressed as %, and input is normalized to H3. n = 3, error bars represent standard error. ns: non-significant at p = 0.05 level, *: p ≤ 0.05, **: p ≤ 0.01, ***: p ≤ 0.005.

Figure 9.
H3K9me2 histone marks at reference genes ACTIN, PP2A, BM9, CEREBA as well as at the front, middle, and end of the coding region and 3′UTR of HSP17 gene. Values are expressed as %, and input is normalized to H3. n = 3, error bars represent standard error. ns: non-significant at p = 0.05 level, *: p ≤ 0.05, **: p ≤ 0.01, ***: p ≤ 0.005.
© 2017 by the authors. Licensee MDPI, Basel, Switzerland. This article is an open access article distributed under the terms and conditions of the Creative Commons Attribution (CC BY) license (http://creativecommons.org/licenses/by/4.0/).
Share and Cite
MDPI and ACS Style
Temel, A.; Janack, B.; Humbeck, K. Drought Stress-Related Physiological Changes and Histone Modifications in Barley Primary Leaves at HSP17 Gene. Agronomy 2017, 7, 43. https://doi.org/10.3390/agronomy7020043
AMA Style
Temel A, Janack B, Humbeck K. Drought Stress-Related Physiological Changes and Histone Modifications in Barley Primary Leaves at HSP17 Gene. Agronomy. 2017; 7(2):43. https://doi.org/10.3390/agronomy7020043
Chicago/Turabian StyleTemel, Aslihan, Bianka Janack, and Klaus Humbeck. 2017. "Drought Stress-Related Physiological Changes and Histone Modifications in Barley Primary Leaves at HSP17 Gene" Agronomy 7, no. 2: 43. https://doi.org/10.3390/agronomy7020043
Note that from the first issue of 2016, this journal uses article numbers instead of page numbers. See further details here.