
Assessment of Conservation Agriculture Practices by Smallholder Farmers in the Eastern Cape Province of South Africa


Department of Agronomy, Faculty of Science and Agriculture, University of Fort Hare, P. Bag X1314, Alice 5700, South Africa
*
Author to whom correspondence should be addressed.
Agronomy 2017, 7(3), 46; https://doi.org/10.3390/agronomy7030046
Submission received: 20 April 2017
/
Revised: 16 May 2017
/
Accepted: 28 May 2017
/
Published: 2 July 2017
Abstract
:Conservation agriculture (CA) can sustainably address soil degradation and improve crop yields. However, the success of CA amongst South African smallholder farmers is not known. The aims of the study were to find out: (1) the extent of CA practice by the Eastern Cape smallholder farmers; (2) perceptions towards CA amongst smallholder farmers with some history of practising the technology; and (3) the impact of practised CA components on soil quality indicators. Diagnostic survey techniques and soil sampling in farmers’ fields were employed to gather data from five districts of the Eastern Cape, South Africa. The most common CA principle adopted by surveyed farmers was no-till (34.81%), whilst crop rotation and residue retention were practised by only 25.93% and 22.22% of the farmers, respectively. Education level and CA training influenced the likelihood of a farmer to practise no-till farming, whilst the likelihood of farmers to retain residues was influenced by education level and access to grazing lands. Lack of appropriate equipment and costly herbicides were the major constraining factors to practising CA. Crop residue retention conflicted with the common practice of free-range livestock grazing. Cabbage, maize and beans were the most common crops of choice for the few farmers that practised crop rotations. No significant (p > 0.05) improvement on soil quality indicators was observed with CA compared to the conventional farming method. The noted high dependency on government grants by the smallholder farmers could be a disincentive towards the adoption of agricultural innovations such as CA. Identification of practical key CA entry points is recommended, bearing in mind the noted impediments to CA adoption.
1. Introduction
Conservation agriculture (CA) has received increasing attention worldwide as a means to addressing the challenges associated with conventional tillage (CT), which include soil degradation and related crop yield reductions. Conservation agriculture comprises a set of three components which are applied simultaneously; namely (a) viable crop rotations; (b) minimal soil disturbances; and (c) crop residue soil cover [1,2]. The technology is consistent with climate smart agriculture principles due to its soil moisture conservation [3] and C-sequestration capabilities [4,5] as well as the ability to reduce emission of greenhouse gases by tillage machinery [6] and from cropped fields [7].
Based on experiences from North and South America several advantages of CA over conventional agriculture have been documented. Increased soil C sequestration is reported as the chief reason for improved soil productivity with time under CA compared to CT fields [4]. Improved soil moisture conservation [8], reduced erosion, and increased biological activity [9], are all associated with residue retention. Crop rotation increases crop diversity, reducing crop yield penalties associated with insect damage, diseases and weed infestations whilst improving nutrient cycling [10]. Minimum soil disturbance conserves soil organic matter, resulting in more efficient nutrient cycling [5]. Conservation agriculture also results in reduced labour and fuel requirements as well as machinery wear and tear, and a reduction in greenhouse gas emissions [6].
In an effort to replicate the reported CA beneficial effects and arrest high soil degradation rates, CA has been promoted in many sub-Saharan countries, including South Africa. For instance, the Eastern Cape provincial government came up with conditional input schemes such as the Massive Food Production (MFP) and Land Care (LC) programmes [11] as strategies to promote the CA technology within the smallholder farming sector in the province. The formation of the Conservation Agriculture Thrust (CAT) by the Eastern Cape Department of Rural Development and Agrarian Reform (ECDRDAR) with the University of Fort Hare was another initiative to spearhead the spread of CA technologies to extension staff and farmers in the province [12]. However, like in many African smallholder settings, adoption of CA in the Eastern Cape appears to be minimal, despite the fact that the province is one of the worst affected by soil erosion and degradation [12,13]. It is estimated that only 0.3% of the total area under CA globally is found in Africa, mostly in the commercial farming sector [12].
Socio-economic and bio-physical factors affect the adoption of CA by African smallholder farmers [14,15]. Farmers’ misconceptions about CA and poor transmission of information to the farmers are major limiting factors to its practise [10]. Limited financial means is also a major hindrance to the practise of CA as it dictates the ability to acquire no-till farm equipment and external inputs. Conservation agriculture relies heavily on herbicides for weed control. These are often costly and out of reach for the majority of the resource-constrained farmers. More often than not, smallholder farmers find themselves battling with weed control under CA [16].
Therefore, adoption of CA components is likely to be dependent on the prevailing conditions at each farm affecting production. Likewise, the benefits realised from the different farmers’ practices are bound to vary depending on the factors affecting production. However, no studies have been conducted in the Eastern Cape to determine the extent to which CA is practised, its benefits, and farmers’ perceptions of the technology. Such studies give an indication of farmers’ constraints and provide a guideline for research required in order to improve CA adoption. Therefore, this study was undertaken with the following objectives: (1) to document the extent to which CA is practised by smallholder farmers in the Eastern Cape, South Africa; (2) to get the perceptions on CA by farmers with a history of using the technology; and (3) to determine the impact, if any, of adopted CA components on selected soil quality indicators.
2. Materials and Methods
2.1. Study Sites
The following five Eastern Cape districts were purposively chosen based on having been previously exposed to CA promotional and implementation programmes [11,12]: Alfred Nzo, Amathole, Chris Hani, Joe Gqabi, and OR Tambo. The five districts have contrasting agro-ecologies and represent a wide range of biophysical and socio-economic conditions of the Eastern Cape (Table 1). Generally, the Eastern Cape receives 75% of its annual rainfall from October to April, with the exception of coastal areas in the OR Tambo district, which experience a bi-modal rainfall pattern with early (October/November) and late (February/March) summer rainfalls [17]. Two extension wards in each district were purposively chosen based on having hosted a CA demonstration plot. Farmers in these extension wards were deemed to have been exposed and supported to implement CA on their farms. The target areas were all dominated by smallholder farmers.
2.2. Farmer Interviews and Field Assessments
A semi-structured questionnaire was used as the primary data collection tool. The interview questions were steered towards selected topics, including demographic information, CA components adopted, agronomic practices, farm resources and farmers’ perceptions of CA. Enumerators were trained before they went to the field to ensure uniformity in interpretation of the questionnaire. Consent forms for the questionnaire were sent beforehand and completed in advance by all the participating farmers and local extension officers. Guided by the local extension officer, farmers in each extension ward were randomly identified for the interview to provide experiences and challenges from all angles of the farming community and to avoid skewed responses. The interviews were conducted face to face. In total, 135 farmers were interviewed from Amathole (24), Alfred Nzo (31), Chris Hani (29), OR Tambo (25) and Joe Qabi (26). The demographic, socio-economic and land tenure characteristics of the farmers interviewed are listed in Table 2.
Field assessments and soil sampling were restricted to fields under no-till farming for a minimum of two years (35 farmers). The study assumed that possible differences could be observed from practising no-till farming for at least two years. Presence of soil cover, abundance of weeds, insects and diseases were the focus of the field assessment. These were rated on a scale of 0 to 3, where 1 was considered to be good, 2 was fair, and 3 was poor. A line transect method was used to randomly measure residue cover [19]. Residue cover of <30%, 30–50% and > 50% soil cover was rated as 3, 2 and 1, respectively.
2.3. Soil Sampling and Analysis
To evaluate the impact of CA components practised by farmers on selected soil quality parameters, soil sampling was done on the same fields as indicated under field assessment. For each of the sampled CA fields, an adjacent conventionally tilled field was also sampled for comparison purposes. Five random soil samples were collected to make a composite sample from each field at three depths of 0–5, 5–10, and 10–20 cm. Soil sampling was done using a spade for the top layer and a graduated 7-cm diameter auger for the rest of the layers. All samples were collected after clearing the litter layer. The samples were transferred to the laboratory, where they were air dried, visible organic debris removed and then passed through a 2-mm sieve before being stored in a cold room (4 °C) until use.
2.3.1. Particulate Organic Matter
Particulate organic matter (POM) was determined using the weight loss on ignition procedure [20]. Fifty grams of each sample were dispersed in 100 mL of 5 g L−1 sodium hexametaphosphate for 18 h on a reciprocating shaker at 120 reciprocations per minute. The dispersed soil samples were passed through a 0.053-mm sieve, washed with deionised water until clean, backwashed into an evaporation dish and dried at 55 °C for 24 h. The oven-dried sand particles plus POM were placed in dry porcelain crucibles and heated in a muffle furnace at 450 °C for 4 h. After cooling, the amount of POM was determined as Equation (1).
2.3.2. Soil Organic Carbon
Soil organic carbon (SOC) was determined following the modified Walkley–Black method [21]. Organic material in soil was oxidised by treatment with a hot mixture of 0.167 M potassium dichromate (K2Cr2O7) and concentrated sulphuric acid (H2SO4). Excess dichromate was titrated with 0.5 M iron (II) ammonium sulphate hexahydrate (Fe(NH4)2(SO4)2)·6H2O). The reduced dichromate was assumed to be equivalent to the SOC present in the soil sample, assuming that soil organic matter has an average valence of zero. Organic carbon content (%) was calculated according to Equations (2) and (3) below with a recovery factor (f) of 1.3.
where M refers to the concentration of Fe (NH4)2·(SO4)2 in mol mL−1.
2.3.3. Fluorescein Diacetate Assay
Fluorescein diacetate (FDA) activity was determined by measuring the fluorescein released after hydrolysis of fluorescein diacetate following the method outlined by Prosser et al. [22]. A total of 1 g of air-dried soil sample was incubated with 50 mL of tris hydroxymethyl aminomethane (THAM) buffer (0.1 M, pH 7.6) and 0.5 mL of 47.6 μM FDA at 37 °C for 3 h. A control sample was included for each sample in which only acetone and not FDA was added. After incubation, 2 mL of acetone was added to all samples and the FDA was only added to the controls at this time. The samples were then filtered through Whatman No. 2 filter paper and the intensity of the yellow green colour measured using Helios Thermo Spectrophotometer (Thermo Fisher Scientific, Waltham, MA, USA) at 490 nm. The FDA hydrolytic activity was then expressed as mg of fluorescein released per kg-dry weight of soil per hour, based on a reference calibration curve. The FDA activity was calculated as shown in Equation (4):
where S is mean concentration of fluorescein (mg) in the sample, C is concentration of fluorescein (mg) in the control, and DM is dry mass of soil aliquot (determined based on moisture content).
2.3.4. Extractable Olsen P
In this extraction, 0.5 M sodium bicarbonate (NaHCO3) which had been adjusted to pH of 8.5 with 1 M sodium hydroxide (NaOH) was used [21]. A 2.5-g sample of soil was extracted with 50 mL of the 0.5 M NaHCO3 solution on a horizontal shaker for 30 min. After shaking, the suspensions were filtered through Whatman No. 42 filter paper and the filtrates were then adjusted to pH 5 with 2.5 M H2SO4 before analysis. The orthophosphate in the extracts was automatically determined using a continuous flow analyser (San 2++ Skalar CFA, Skalar Analytical B.V., Breda, The Netherlands) employing the ammonium molybdate-antimony potassium tartrate-ascorbic acid method.
2.3.5. Extractable Bases (K, Mg, Ca and Na)
Extractable K, Mg, Ca, Na were determined following procedures described in [20]. Five grams of soil sample was extracted with 50 mL of 1 M NH4NO3 solution on a horizontal shaker for 2 h. After shaking, the solution was then filtered through Whatman No. 42 paper and the bases were analysed using an Inductively Coupled Plasma–Optical Emission Spectrometer (ICP–OES, Varian Medical Systems, Inc., Palo Alto, CA, USA).
2.4. Data Analyses
Before analysis, livestock and farm area data was computed to calculate tropical livestock units (TLUs) ha–1. The TLUs were used as a basis of estimating the pressure on residue grazing. The following animal weightings were used to calculate the TLUs; horses and cattle = 0.7, sheep and goats = 0.1, pigs = 0.2 and chickens = 0.01 [22]. Data from completed questionnaires was assigned a numerical code before analysis with Statistical Package for the Social Sciences (SPSS, IBM Inc., Armonk, NY, USA). The study employed binary logistic regression analysis to predict how various socio-economic and biophysical factors affected farmers’ likelihood to practise each of the three CA components (crop rotation, no-tillage and residue cover). The socio-economic and biophysical factors were considered as the predictor variables influencing a farmer’s decision to practise a specific CA component. The dependent categorical variable coding was as follows; farmer practising the component (yes = 1) and farmer not practising the component (no = 0). A chi-square test was used to test the significance of the general regression model and to check if the group of factors significantly explained the practice of CA components. The list and description of the predictor variables used in the binary logistic regression and their respective coding are as shown in Appendix Table A1. Simple descriptive statistics such as means and percentages were calculated. Soil test data were subjected to independent sample t-tests to check the differences between CA and CT fields with respect to soil quality indicators. Significant differences were considered at a 5% probability level.
3. Results
3.1. Extent of Conservation Agriculture Practice by the Sampled Eastern Cape Smallholder Farmers
The overall binary logistic regression results showed that the tested predictor variables (socio-economic and biophysical factors) significantly explained the practice of no-till (p < 0.001), residue retention (p < 0.05) and crop rotation (p < 0.001) by the Eastern Cape smallholder farmers (Table 3). The majority of socio-economic and biophysical predictor variables increased the likelihood of a farmer to adopt all CA components as shown by the positive β values. However, of these factors, only farmers’ level of education and CA training had a significant (p < 0.05) influence on the practice of no-till farming; Residue retention was significantly and positively affected by the farmers’ level of education (p < 0.05) and access to grazing lands (p < 0.05). However, no predictor variable was observed to significantly affect the likelihood of the smallholder farmer to practise crop rotations (p > 0.05).
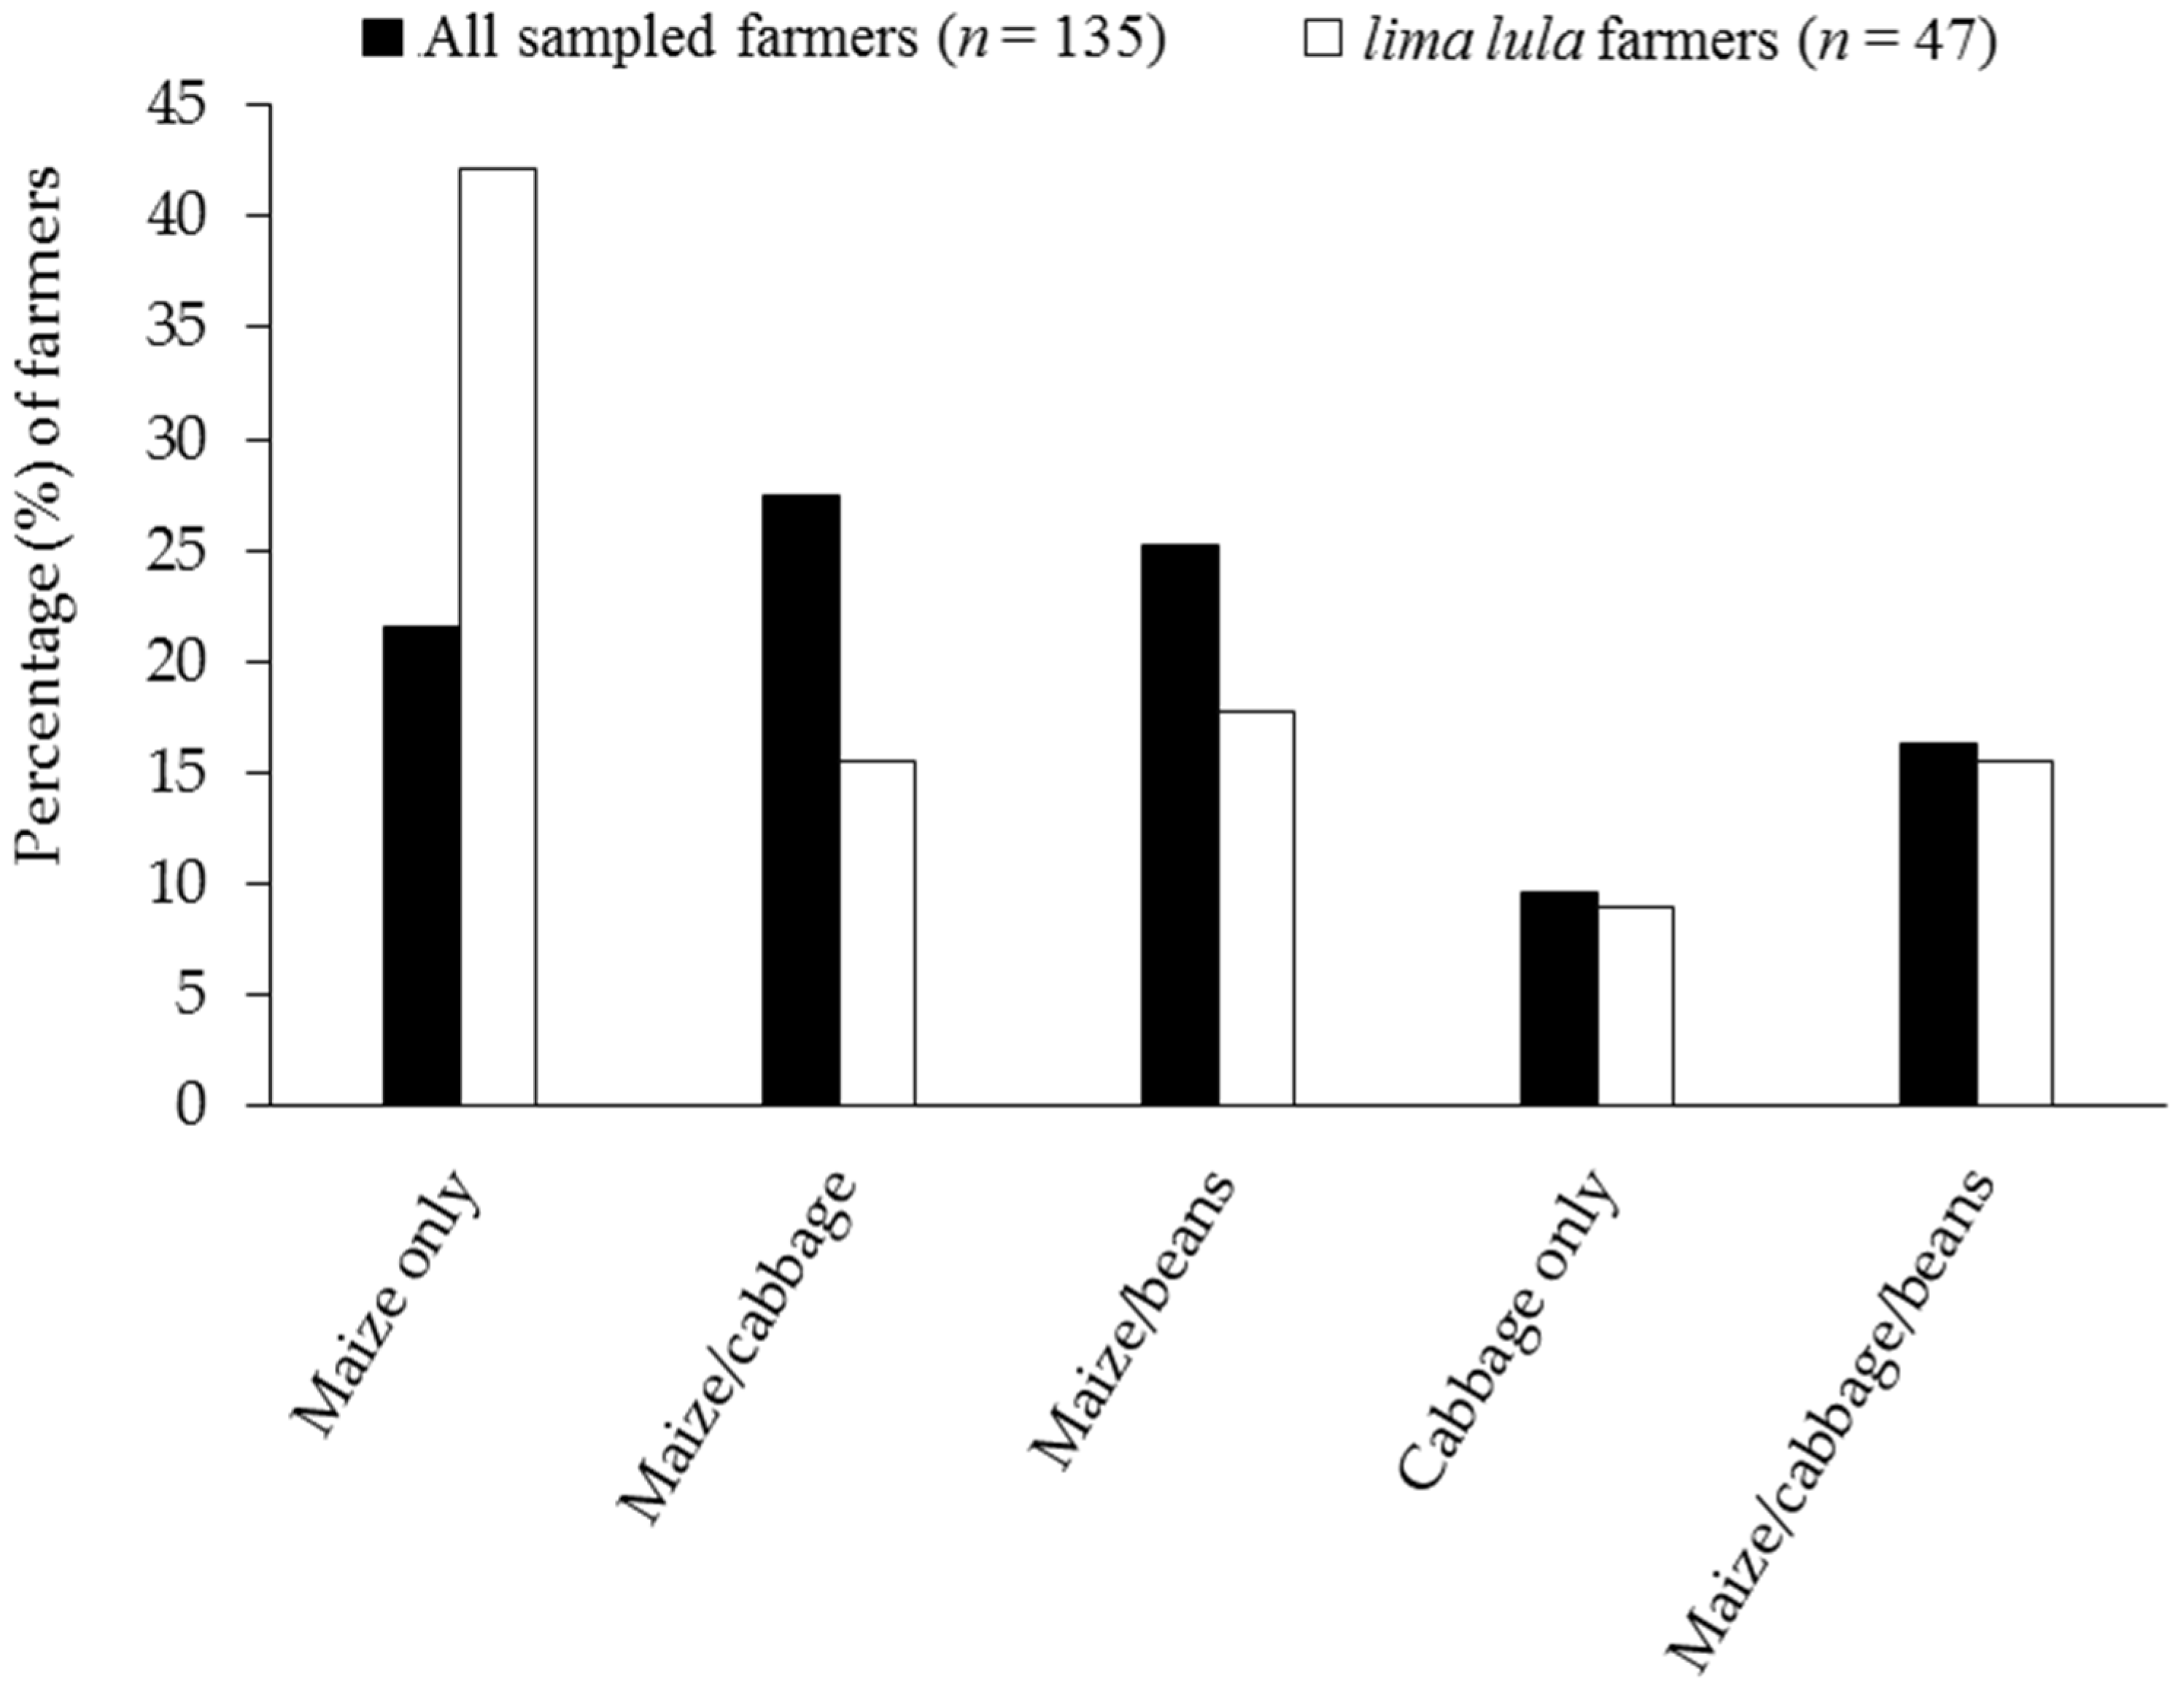
From the total number of farmers interviewed (n = 135), 34.81% of them produced under no-till, and 25.93% practised crop rotation, whilst 22.22% agreed to retaining crop residues in their fields. However, what was referred to as ‘CA’ was generally no-till, known as ‘lima lula’ in isiXhosa, the native language in the Eastern Cape Province. As such, all the identified CA farmers practised no-till farming. A small number of the farmers practised all three of the components of CA (Table 4). Maize monoculture was popular with lima lula farmers (42.22%) (Figure 1). However, the combination of maize/cabbage (27.41%) was popular for both lima lula and conventional famers combined (Figure 1). Maize/bean combination (17.78%) and maize only (21.48%) were the second most grown crops by the lima lula and the total sampled farmers, respectively. A small proportion of both lima lula (15.56%) and the total sampled farmers (16.30%) grew all three crops (Figure 1). However, the majority of the farmers agreed to practising crop rotation in home gardens, leaving outfields for maize monoculture.
Table 5 below shows the frequencies of the most common agronomic practices by the Eastern Cape smallholder farmers. The majority of the farmers relied on hoes (48.9%) followed by animal and tractor-drawn planters at 24.4% and 20.7%, respectively, for seeding. Jab planter use was minimal and only 5.9% of the farmers used it for planting crops. Dry land farming (79.3%) was more common amongst the smallholder farmers and only 21.7% had access to water for irrigation. Weed control was largely done mechanically (51.1%) through hand-hoe weeding, whilst a proportion of the farmers used herbicides (31.9%) or combined both methods (14.1%). Chemical control of pests and diseases (49.6%) was most preferred by the farmers, while 45.9% of the farmers did not practise pest and disease control. Inorganic fertilizer was the most preferred fertility management option for the farmers (43%), in spite of it being costly, followed by a combination of both manure and inorganic fertilizers (23.7%).
Frequencies of CA equipment used and owned by the smallholder farmers of the Eastern Cape are shown in Table 6. The majority of the farmers had access to knapsack sprayers however, few of them owned them. Animal-drawn planters were the second most popular type of equipment amongst the farmers. Jab planters, an important type of equipment for crop planting under CA, were only used by 5.9% and owned by 2.24% of the farmers.
3.2. Farmers’ Perceptions of CA
The reduced cost of tillage realised by practising no-till was a major motivating factor (65%) by the few farmers practising lima lula (Table 7). About 31% of them agreed that crop yield increases associated with improved soil fertility, moisture conservation, and weed control under lima lula were also a motivating factor. Whilst soil erosion control is one of the major goals of no-till and CA, very few farmers considered it a good enough motivating factor to practise the technology (9%).
A large proportion of the farmers stopped or did not practise CA because they could not get input support from programmes (33%) (Table 8). The MFP was the programme most mentioned by the farmers. Costly herbicides (30%) were the second most challenging factor for aspiring CA adopters. Also, lack of proper CA equipment (21%), increased labour (16%) as a result of associated weed pressure (15%) and poor crop yields (12%) were some of the mentioned major constraints to the full practise of CA. Few farmers (10%) acknowledged that they lacked the proper knowledge on how to implement the technology.
3.3. Best Management Practices by CA Farmers and Comparison of Selected Soil Quality Indicators between CA and CT Fields
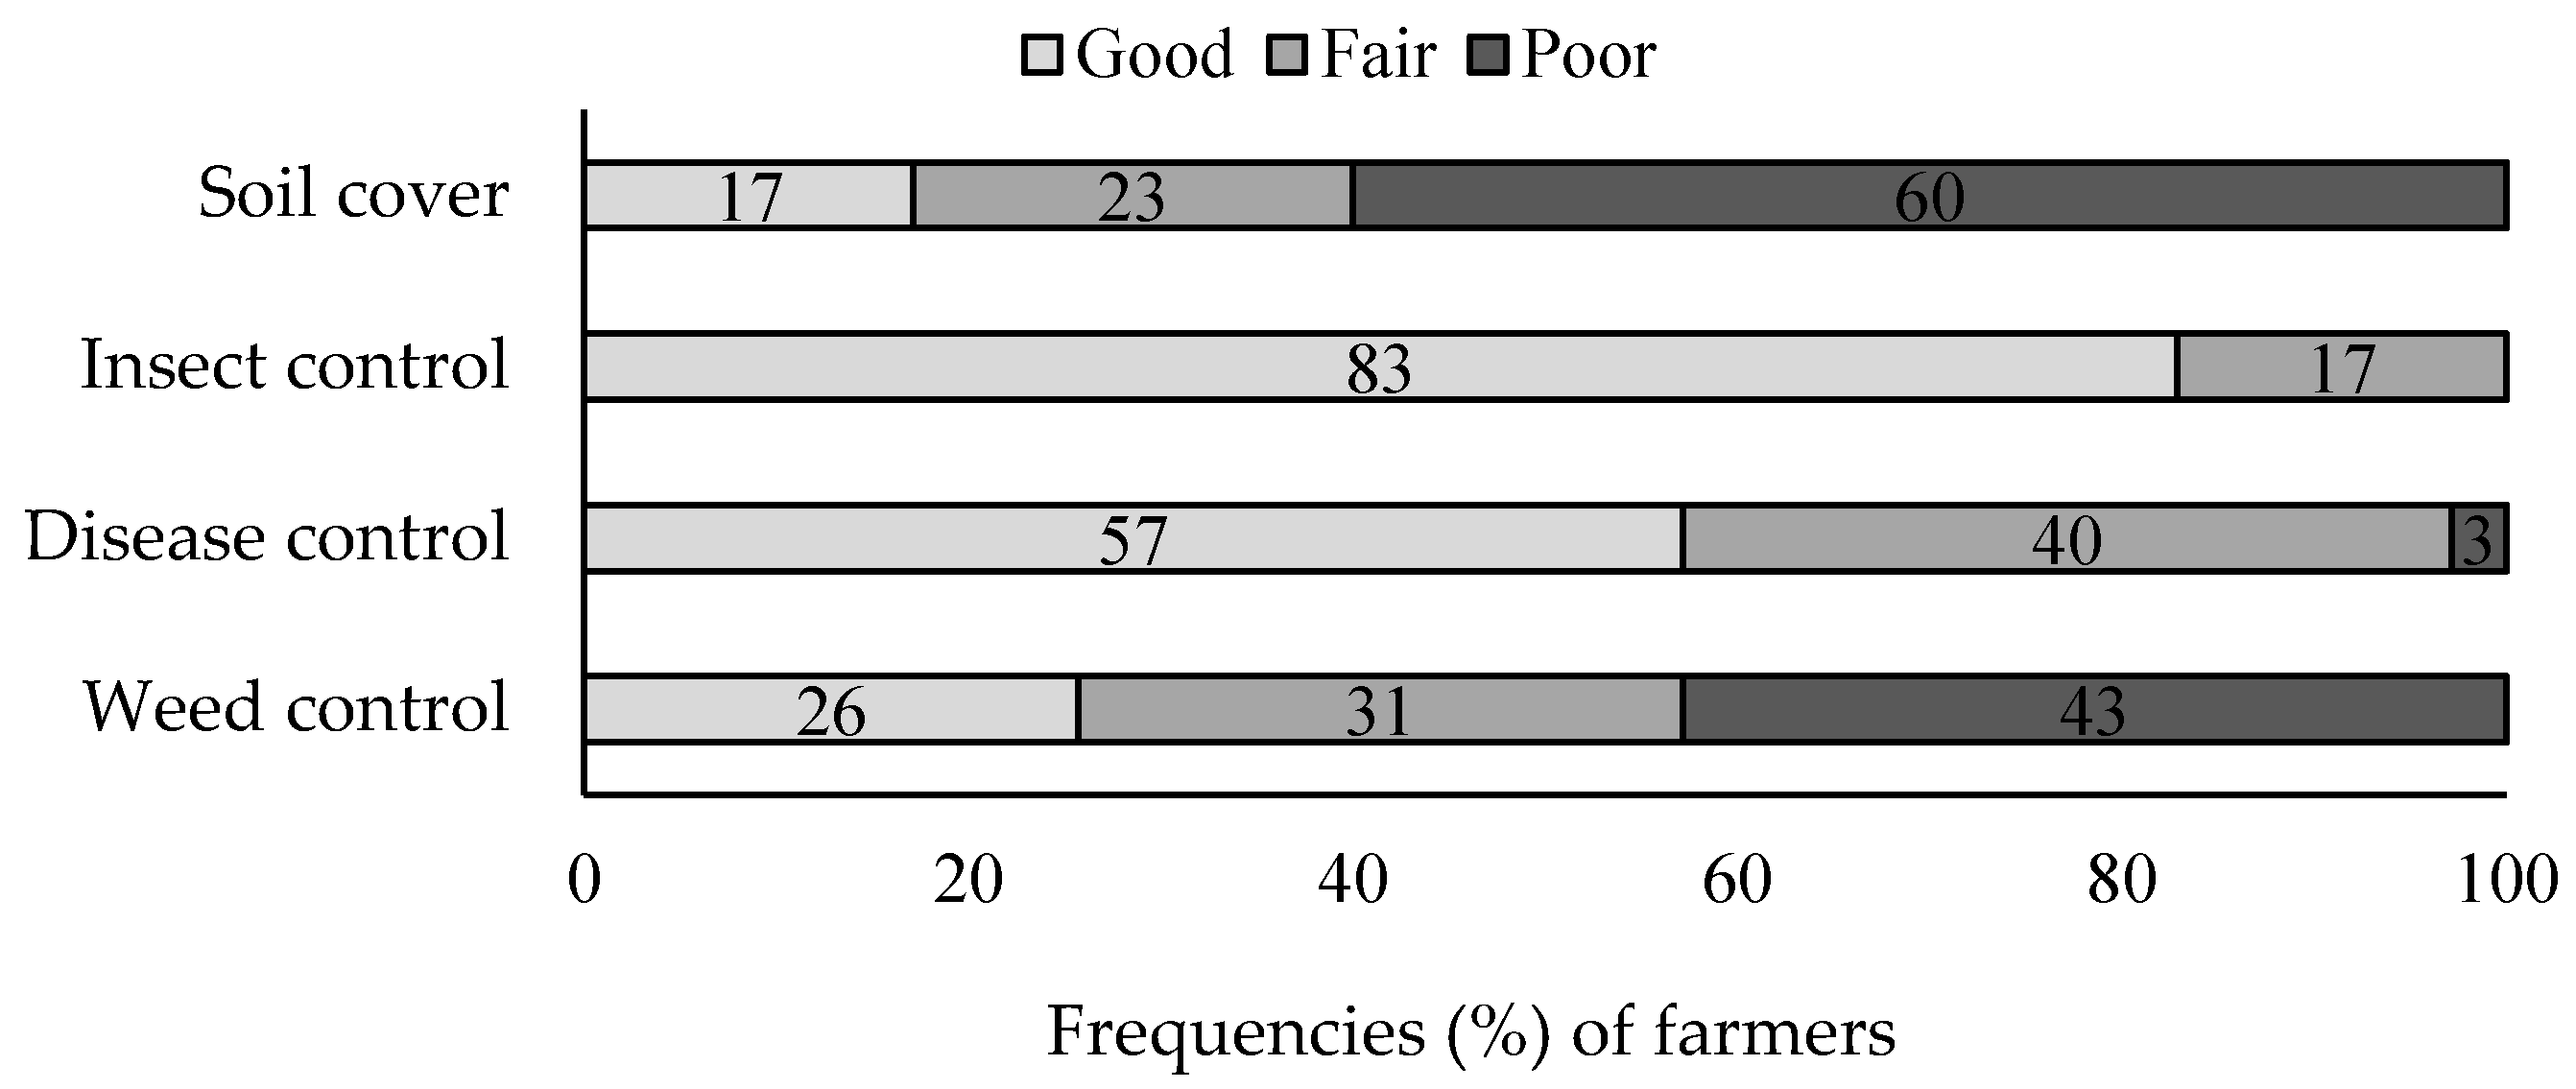
The majority of the fields lacked soil cover (Figure 2). Weed control was a challenge for the farmers, particularly in fields lacking organic mulch. However, disease and insect pest control was above average and most farmers agreed that these were not much of a problem in their fields.
A comparison of the soil quality indicators between CA fields and adjacent CT fields showed no significant differences (p > 0.05) between the two systems in all the parameters in the three depths of 0–5, 5–10 and 10–20 cm (Table 9). Though not statistically significant, several positive t-values were observed in the majority of the parameters in the 0–5 and 5–10 cm soil depths.
4. Discussion
Just as reported in the literature [23,24,25], socio-economic and biophysical factors played an important role in the farmer’s decision to adopt each of the three CA components. In particular, farmer’s level of education, training in CA and access to grazing lands were the most prominent predictor variables significantly influencing the adoption of no-till and residue retention practices under the Eastern Cape smallholder sector. The increased adoption of CA components with farmer’s level of education could be due to the increased ability of an educated farmer to access information compared to an illiterate farmer. The observed increased likelihood of a farmer to adopt CA after training further underscores the importance of information flow to smallholder farmers. In the Eastern Cape, CA farmer training by the agricultural extension officers and various input programmes formed the major source of CA information. The observed influence of education and training in CA adoption was consistent with earlier findings which showed that access to information was central to the process of innovation adoption [26]. The observed over-reliance on government grants as opposed to farming by the farmers could possibly reduce the willingness of farmers to be involved in agriculture activities at a commercial scale. Added incentives in the form of inputs and agriculture grants could be explored as a way of motivating smallholder farmers to adopt CA components [11,12].
Farmers’ access to grazing lands significantly increased the likelihood of a farmer to retain crop residues, indicating interference of livestock in CA activities. The majority of the Eastern Cape smallholder farmers have integrated crops and livestock farming systems, resulting in competition for crop residues, decreasing the likelihood of the farmers adopting CA in agreement with findings of an earlier study [23]. Lack of fencing combined with rampant thefts of the fencing materials, particularly in outfields, was a challenge in warding off grazing of residues from free-ranging livestock. However, the involvement of the whole community in raising awareness on the disadvantages of free ranging and benefits of residue retention has been suggested as a possible solution to the problem [27]. Furthermore, new grazing by-laws to minimise free-ranging livestock may be necessary in order to encourage CA farmers to retain crop residues on their farms [15].
The observed reduced use and ownership of CA equipment by the smallholder farmers is in sharp contrast to their commercial counterparts [12]. Most farmers reported use of knapsack sprayers and animal-drawn planters, whilst sophisticated CA implements such as knife rollers and rippers were virtually absent. The positive β values by knapsack sprayers (β = 1.59), animal-drawn sprayers (β = 0.30) and jab planters (β = 0.83) suggest that provision and increasing the access to these implements could help in increasing the acceptability of CA amongst the Eastern Cape smallholder communities. The initial investment required for such equipment may, however, be an impediment to the adoption of CA since most African smallholder farmers do not have the necessary capital [15].
The reduced production costs from forgoing tillage drew many farmers to adopt CA, indicating that smallholder farmers are more likely to adopt a low-cost technology than a costly one. The inability to apply all the CA components together or lack of knowledge could account for the limited perceived CA benefits such as improved crop yield, soil fertility, moisture conservation and reduced weed infestation. Input programmes by the government and private organisation is another potential way of boosting CA practice by the smallholder farmers. This can be observed from the large numbers of the same farmers mentioning free inputs as a motivating factor. While the provision of inputs may not necessarily lead to the adoption of CA, the farmers may eventually practise CA using their resources if they are able to see the benefit thereof.
The majority of the farmers indicated that weeding was the main contributor to increased labour requirements under CA; however, other studies suggest that the labour increase may be off-set by the reduced land preparation costs associated with no-till farming [24]. The farmers’ inability to control weeds suggests the need to increase access to herbicides by the farmers and promote other cultural means of weed control such as early planting and crop intensification, particularly during the early CA adoption stages where weeds may be a problem.
A comparison of soil parameters under both CA and CT fields revealed no clear difference between the two, indicating that CA as presently practised by Eastern Cape smallholder farmers was not resulting in any significant improvement in soil quality indicators compared to the conventional farming method. This could be explained by the variations in the implementation of the CA components and/or failure to adopt CA in its entirety, particularly crop residue retention and crop rotations [15,28]. Though not significantly different, the positive t-test values on some of the parameters in the 0–5 and 5–10 cm soil depths indicate some improvement in soil quality parameters after practising CA compared to CT. The study further showed very low Olsen P values consistent with the findings of an earlier study that suggested the need for an initial investment in P fertilizers [29].
The absence of crop residue left at harvest resulted in high weed infestation in the majority of CA fields. However, a study by [30] pointed out that this failure to control weeds may exacerbate the weed problem [30]. The uncontrolled weeds grow to maturity, shed seed and thereby replenish the weed seed bank, perpetuating weed production in fields under CA. The failure by the Eastern Cape farmers to synergistically apply all the components of CA calls for further research on the interaction effects of CA components on crop weed, crop yield and soil parameters to provide sustainable key entry points for the farmers. This can be achieved through component omission experiments [31].
5. Conclusions
Farmers’ level of education, access to CA training, and grazing land were the more important determining factors with respect to the adoption of CA components by the Eastern Cape smallholder farmers. Residue retention and crop rotations were the most limiting components to comprehensive CA adoption due to several factors, with chief components amongst them being livestock interference and lack of appropriate CA equipment and training. Conservation agriculture, as presently practised by the Eastern Cape farmers did not result in any significant benefit to soil quality compared to the conventional farming method. However, this is likely to change if there is improvement in the adoption of CA components. Weed infestation was a major problem amongst the CA farmers and as a result it was mentioned as one of the major impediment factors for would-be CA adopters. The high dependency on government grants as a source of livelihood by the smallholder farmers could be a disincentive to the adoption of agricultural innovations such as CA. However, there is need to confirm this with further research and necessary mitigation measures put in place. Improvement of the Eastern Cape smallholder CA systems will only be realized if the noted challenges to the adoption of CA are addressed. A search for practical key CA entry points for the Eastern Cape smallholder CA farmers, bearing in mind the noted impediments to the adoption of CA, is recommended.
Acknowledgments
Special gratitude to the Department of Agriculture Forestry and Fisheries (DAFF) through Zero Hunger Project, the National Research Foundation (NRF) and the Govan Mbeki Research and Development Centre (GMRDC), University of Fort Hare, for funding the study.
Author Contributions
L.M. conceived and designed the study, and performed data collection, data analysis, and manuscript writing. P.N.S.M. conceived and designed the study, and performed data collection and manuscript writing. C.C. conceived and designed the study, and performed data collection and manuscript writing.
Conflicts of Interest
The authors declare no conflict of interest. The study sponsors had no role in the design of the study; in the collection, analyses, or interpretation of data; in the writing of the manuscript, or in the decision to publish the results.
Appendix A

Table A1.
Predictor variables and coding used in the binary logistic regression.
| Variable | Category | Frequency | Coding |
|---|---|---|---|
| Fertilizer use | Manure | 13 | 1 |
| Fertilizers | 58 | 2 | |
| Compost | 10 | 3 | |
| None | 1 | 4 | |
| Manure and fertilizers | 32 | 5 | |
| Fertilizers and compost | 16 | 6 | |
| Manure and compost | 5 | 7 | |
| Geology | Sandstone of the Tarkastad Formation | 31 | 1 |
| Mainly grey and brownish-red mudstone and sandstone of the Adelaide Subgroup | 37 | 2 | |
| Grey mudstone, shale, sandstone of the Balfour Formation | 11 | 3 | |
| Sandstone, brownish-red and grey mudstone of the Katberg Formation | 28 | 4 | |
| Brownish-red and grey mudstone, sandstone of the Burgersdorp Formation | 28 | 5 | |
| Income | Grant | 85 | 1 |
| Selling farm produce | 29 | 2 | |
| Employed | 17 | 3 | |
| Family remittance | 1 | 4 | |
| Business | 3 | 5 | |
| Crops grown | Maize only | 29 | 1 |
| Maize and cabbage | 37 | 2 | |
| Maize and beans | 34 | 3 | |
| Cabbage only | 13 | 4 | |
| Maize, cabbage and beans | 22 | 5 | |
| Seeding method | Jab planter | 8 | 1 |
| Tractor drawn planter | 28 | 2 | |
| Animal drawn planter | 33 | 3 | |
| Hoes | 66 | 4 | |
| District | Amathole | 24 | 1 |
| Alfred Nzo | 31 | 2 | |
| Chris Hani | 29 | 3 | |
| OR Tambo | 25 | 4 | |
| Joe Qabi | 26 | 5 | |
| Pest control method | Cultural | 6 | 1 |
| Chemical | 67 | 2 | |
| None | 62 | 3 | |
| Education | Illiterate | 18 | 1 |
| Primary | 47 | 2 | |
| Secondary | 60 | 3 | |
| Tertiary | 10 | 4 | |
| Weed control method | Mechanical | 73 | 1 |
| Herbicide | 43 | 2 | |
| Both | 19 | 3 | |
| Gender | Female | 79 | 0 |
| Male | 56 | 1 | |
| Grazing lands | No | 119 | 0 |
| Yes | 16 | 1 | |
| Jab planter | No | 120 | 0 |
| Yes | 15 | 1 | |
| Animal-drawn sprayer | No | 133 | 0 |
| Yes | 2 | 1 | |
| Knap sack sprayer | No | 97 | 0 |
| Yes | 38 | 1 | |
| Irrigation | No | 107 | 0 |
| Yes | 28 | 1 | |
| Animal-drawn planter | No | 95 | 0 |
| Yes | 40 | 1 | |
| Training on CA | No | 56 | 0 |
| Yes | 79 | 1 |
References
- Hobbs, P.R. Conservation agriculture: What is it and why is it important for future sustainable food production? J. Agric. Sci. 2007, 145, 127–137. [Google Scholar] [CrossRef]
- Food and Agricultural Organization of the United Nations. What Is Conservation Agriculture? Available online: http://www.fao.org/ag/ca/1a.html (accessed on 4 April 2015).
- Thierfelder, C.; Wall, P.C. Investigating conservation agriculture (CA) systems in Zambia and Zimbabwe to mitigate future effects of climate change. J. Crop Improv. 2010, 24, 113–121. [Google Scholar] [CrossRef]
- Lal, R. Enhancing crop yields in the developing countries through restoration of the soil organic carbon pool in agricultural lands. Land Degrad. Dev. 2005, 17, 197–209. [Google Scholar] [CrossRef]
- Dube, E.; Chiduza, C.; Muchaonyerwa, P. Conservation agriculture effects on soil organic matter on a Haplic Cambisol after four years of maize–oat and maize–grazing vetch rotations in South Africa. Soil Tillage Res. 2012, 123, 21–28. [Google Scholar] [CrossRef]
- Dendooven, L.; Leonardo, P.; Verhulstb, P.; Marco, L.; Marscha, R.; Govaertsb, B. Global warming potential of agricultural systems with contrasting tillage and residue management in the central highlands of Mexico. Agric. Ecosyst. Environ. 2012, 152, 50–58. [Google Scholar] [CrossRef]
- Chivenge, P.P.; Murwira, H.K.; Giller, K.E.; Mapfumo, P.; Six, J. Long-term impact of reduced tillage and residue management on soil carbon stabilization: Implications for conservation agriculture on contrasting soils. Soil Tillage Res. 2007, 94, 328–337. [Google Scholar] [CrossRef]
- Thierfelder, C.; Wall, P.C. Effects of conservation agriculture techniques on infiltration and soil water content in Zambia and Zimbabwe. Soil Tillage Res. 2009, 105, 217–227. [Google Scholar] [CrossRef]
- Govaerts, B.; Mezzalama, M.; Unno, Y.; Sayre, S.D.; Luna-Guido, M.; Vanherck, K.; Deckers, J. Influence of tillage, residue management, and crop rotation on soil microbial biomass and catabolic diversity. Appl. Soil Ecol. 2007, 37, 18–30. [Google Scholar] [CrossRef]
- Derpsch, R.; Friedrich, T. Global Overview of Conservation Agriculture Adoption. In Proceedings of the 4th World Congress on Conservation Agriculture, New Delhi, India, 4–7 February 2009; pp. 429–438. [Google Scholar]
- Makara, M.M. An Investigation of the Role and Impact of the Extension Services in the Massive Food Programme Introduced at Zanyokwe Irrigation Scheme of the Amahlati Local Municipality in the Eastern Cape. Master’s Thesis, University of Fort Hare, Alice, South Africa, 2010. [Google Scholar]
- Food and Agricultural Organization of the United Nations. Socio-Economic Analysis of Conservation Agriculture in Southern Africa. Available online: http://www.fao.org/docrep/013/i2016e/i2016e00.pdf (accessed on 11 March 2014).
- Kakembo, V.; Xanga, W.W.; Rowntree, K. Topographic thresholds in gully development on the hill slopes of communal areas in the Ngqushwa local municipality, Eastern Cape, South Africa. Geomorphology 2009, 110, 188–194. [Google Scholar] [CrossRef]
- Knowler, D.; Bradshaw, B. Farmers’ adoption of conservation agriculture: A review and synthesis of recent research. Food Policy 2007, 32, 25–48. [Google Scholar] [CrossRef]
- Giller, K.; Corbeels, M.; Nyamangara, J.; Triomphe, B.; Assholder, F.; Scopel, E.; Tittonel, P. A research agenda to explore the role of conservation agriculture in African smallholder farming systems. Field Crop Res 2011, 124, 468–472. [Google Scholar] [CrossRef]
- Bollinger, A.; Hansen, K.D.; Fowler, R. Constraints Limiting Smallholder Adoption of Conservation Agriculture: Some Observations Based on Three South African Smallholder-Oriented Programmes. Available online: http://www.act.org.zw/postcongress/documents/Sess1(socioecon)/Bollinger%20et%20al.doc (accessed on 10 January 2014).
- Van Averbeke, W.; Harris, P.J.C.; Mnkeni, P.N.S.; van Ranst, E.; Verplancke, H. Smallholder Farming and Management of Soil Fertility in the Eastern Cape, South Africa; UNISA Press: Pretoria, South Africa, 2006. [Google Scholar]
- Geological Survey. Geological Map of the Republic of South Africa, Transkei, Bophuthastwana, Venda and Ciskei and the Kingdoms of Lesotho and Swaziland (1:1 Million Scale); Geological Survey: Pretoria, South Africa, 1984.
- Shelton, D.P.; Dickey, E.C.; Jasa, P.J.; Kanable, R.; Smydra, K.S. Using the Line-Transect Method to Estimate Percent Residue Cover. Available online: http://digitalcommons.unl.edu/cgi/viewcontent.cgi?article=1290&context=biosysengfacpub (accessed on 3 December 2014).
- Cambardella, A.A.; Elliott, E.T. Particulate soil organic matter changes across a grassland cultivation sequence. Soil Sci. Soc. Am. J. 1992, 56, 777–783. [Google Scholar] [CrossRef]
- Agri Laboratory Association of Southern Africa. Soil Handbook; Agri Laboratory Association of Southern Africa: Pretoria, South Africa, 2004. [Google Scholar]
- Prosser, J.A.; Speir, T.W.; Stott, D.E. Soil oxidoreductases and FDA hydrolysis. Methods Soil Enzymol. 2011, 9, 103–124. [Google Scholar]
- Ngwira, A.; Johnsen, F.H; Aune, J.B.; Mekuria, A.; Thierfelder, C. Adoption and extent of conservation practices amongst the smallholder farmers in Malawi. J. Soil Water Conserv. 2014, 69, 107–119. [Google Scholar] [CrossRef]
- Giller, K.E.; Witter, E.; Corbeels, M.; Tittonell, P. Conservation agriculture and smallholder farming in Africa: The heretics’ view. Field Crops Res. 2009, 114, 23–34. [Google Scholar] [CrossRef]
- Umar, B.B.; Aune, J.B.; Johnsen, F.H.; Lungu, I.D. Options for improving conservation agriculture in Zambia. J. Agric. Sci. 2011, 3, 1916–9760. [Google Scholar]
- Nyanga, P.H. Factors influencing adoption and area under conservation agriculture: A mixed methods approach. Sustain. Agric. Res. 2012, 1, 27–40. [Google Scholar] [CrossRef]
- Elleboudt, R. Are Conservation Agriculture Practices an Interesting Option for the Smallholder Farmer Communities of the Okhahlamba Local Municipality, KwaZulu-Natal, South Africa? Masters’ Thesis, University of Gent, Gent, Belgium, 2012. [Google Scholar]
- Murungu, F. Conservation agriculture for smallholder farmers in the Eastern Cape Province of South Africa: Recent developments and future prospects. Afr. J. Agric. Res. 2012, 7, 5278–5284. [Google Scholar]
- Mandiringana, O.T.; Mnkeni, P.N.S.; Mkile, Z.; van Averbeke, W.; van Ranst, E.; Verplancke, H. Mineralogy and fertility status of selected soils of the Eastern Cape Province, South Africa. Commun. Soil Sci. Plant Anal. 2005, 36, 2431–2446. [Google Scholar] [CrossRef]
- Dube, E.; Chiduza, C.; Muchaonyerwa, P.; Mthoko, T.S. Winter cover crops and fertiliser effects on the weed seed bank in a low-input maize-based conservation agriculture system. S. Afr. J. Plant Soil 2012, 29, 195–197. [Google Scholar] [CrossRef]
- Thierfelder, C.; Mombeyarara, T.; Mango, N.; Rusinamhodzi, L. Integration of conservation agriculture in smallholder farming systems of southern Africa: Identification of key entry points. Int. J. Agric. Sustain. 2013, 11, 1–13. [Google Scholar] [CrossRef]
Figure 1.
Frequencies (%) of crops and crop combinations grown by the entire sample of smallholder (n = 135) and lima lula (n = 47) farmers of the Eastern Cape Province.
Figure 1.
Frequencies (%) of crops and crop combinations grown by the entire sample of smallholder (n = 135) and lima lula (n = 47) farmers of the Eastern Cape Province.

Figure 2.
Assessment of CA fields based on the soil cover and pest control (weeds, insects and diseases) (n = 35).
Figure 2.
Assessment of CA fields based on the soil cover and pest control (weeds, insects and diseases) (n = 35).

Table 1.
Geographical location, altitude, annual rainfall and geology of the extension wards for the conservation agriculture study in the Eastern Cape Province.
Table 1.
Geographical location, altitude, annual rainfall and geology of the extension wards for the conservation agriculture study in the Eastern Cape Province.
| District | Extension Ward | GPS Coordinates ∞ | Altitude (m) | Mean Annual Rainfall (mm) | Geology α |
|---|---|---|---|---|---|
| Alfred Nzo | Malongwe | 30°47.094′ S 28°56.376′ E | 1055 | 862 | Sandstone of the Tarkastad Formation |
| Alfred Nzo | Mabobo | 30°51.401′ S 28°52.118′ E | 710 | 926 | Sandstone of the Tarkastad Formation |
| Amathole | Qhakazana | 32°11.440′ S 28°29.453′ E | 745 | 946 | Mainly grey and brownish-red mudstone and sandstone of the Adelaide Subgroup |
| Amathole | Lenye | 32°45.439′ S 27°04.673′ E | 519 | 614 | Grey mudstone, shale, sandstone of the Balfour Formation |
| Chris Hani | Cala | 31°30.582′ S 27°40.940′ E | 1187 | 751 | Sandstone, brownish-red and grey mudstone of the Katberg Formation |
| Chris Hani | All Saints | 31°40.695′ S 28°01.413′ E | 1300 | 882 | Brownish-red and grey mudstone, sandstone of the Burgersdorp Formation |
| Joe Qabi | Xaxana | 31°35.206′ S 28°31.977′ E | 858 | 751 | Sandstone, brownish-red and grey mudstone of the Katberg Formation |
| Joe Qabi | Enkalweni | 30°37.506′ S 28°32.980′ E | 799 | 734 | Grey and brownish-red mudstone and sandstone of the Adelaide Subgroup |
| OR Tambo | Thaweni | 31°08.629′ S 29°39.027′ E | 815 | 888 | Brownish-red and grey mudstone and sandstone of the Tarkastad Subgroup |
| OR Tambo | Mjikweni | 31°12.388′ S 28°48.219′ E | 948 | 759 | Brownish-red and grey mudstone, sandstone of the Burgersdorp Formation |
∞ A Global Positioning System (GPS) was used to take geographical positions of farmers’ fields and an average value in each extension ward is reported. α The geographical positions were used to identify the dominant geology in each community by interpolating the points on the geology map of South Africa [18].
Table 2.
Demographic and socio-economic characteristics of the sampled smallholder farmers in five purposely selected districts in the Eastern Cape Province.
Table 2.
Demographic and socio-economic characteristics of the sampled smallholder farmers in five purposely selected districts in the Eastern Cape Province.
| Variable | Farmers (n = 135) |
|---|---|
| Farmer’s gender (%) | |
| Females | 58.50 |
| Males | 41.50 |
| Average age of farmer (years) | 60 |
| Farmer’s education level (%) | |
| None | 13.33 |
| Primary education | 34.81 |
| Secondary education | 44.44 |
| Tertiary education | 0.07 |
| Average family size | 4.44 |
| Main source of income (%) | |
| Government grant | 62.96 |
| Selling farm produce | 21.48 |
| Employed | 12.59 |
| Family remittances | 0.01 |
| Business | 0.02 |
| Average farm size (ha) | |
| Outfield | 0.95 |
| Home garden | 0.35 |
Table 3.
Binary logistic regression of factors influencing farmers’ decision to practise conservation agriculture (CA) components.
Table 3.
Binary logistic regression of factors influencing farmers’ decision to practise conservation agriculture (CA) components.
| Variable | No Tillage | Residue Retention | Crop Rotation | |||||||||
|---|---|---|---|---|---|---|---|---|---|---|---|---|
| β | Wald | p Value | Exp β | β | Wald | p Value | Exp β | β | Wald | p Value | Exp β | |
| District | 0.15 | 0.42 | 0.52 | 1.17 | 0.16 | 0.40 | 0.53 | 1.17 | −0.02 | 0.01 | 0.93 | 0.98 |
| Age | 0.00 | 0.00 | 0.95 | 1.00 | 0.01 | 0.07 | 0.79 | 1.01 | −0.05 | 2.63 | 0.11 | 0.96 |
| Gender | 0.19 | 0.10 | 0.75 | 1.21 | 0.41 | 0.46 | 0.50 | 1.50 | 0.50 | 0.55 | 0.46 | 1.65 |
| Source of income | 0.45 | 1.50 | 0.21 | 1.57 | 0.10 | 0.06 | 0.80 | 1.10 | −0.62 | 1.97 | 0.16 | 0.54 |
| Education | 0.67 | 3.87 | 0.05 * | 1.99 | 0.77 | 4.29 | 0.04 * | 2.15 | −0.54 | 1.84 | 0.18 | 0.58 |
| Farm area | 0.80 | 1.95 | 0.16 | 1.32 | 0.08 | 0.14 | 0.71 | 1.08 | 0.03 | 0.01 | 0.91 | 1.03 |
| Household size | 0.09 | 0.85 | 0.36 | 1.10 | 0.17 | 2.74 | 0.10 | 1.18 | −0.16 | 1.60 | 0.21 | 0.86 |
| Geology | 0.03 | 0.02 | 0.90 | 1.03 | 0.15 | 0.40 | 0.53 | 1.17 | −0.61 | 3.81 | 0.06 | 0.54 |
| Rainfall | 0.00 | 0.61 | 0.44 | 1.00 | −0.01 | 2.21 | 0.14 | 0.99 | 0.00 | 0.41 | 0.52 | 1.00 |
| Crops grown | −0.02 | 0.01 | 0.94 | 0.98 | 0.11 | 0.15 | 0.70 | 1.12 | 0.42 | 2.13 | 0.14 | 1.52 |
| Seeding method | 0.21 | 0.42 | 0.52 | 0.81 | −0.03 | 0.01 | 0.92 | 0.97 | 0.17 | 0.26 | 0.61 | 1.18 |
| Irrigation | 0.93 | 1.46 | 0.23 | 2.53 | −0.82 | 0.98 | 0.32 | 0.44 | 1.26 | 3.02 | 0.08 | 3.54 |
| Weed control method | 0.56 | 1.48 | 0.22 | 1.75 | 0.15 | 0.10 | 0.76 | 1.16 | 4.00 | 0.98 | 0.32 | 1.71 |
| Pest control method | −0.15 | 0.16 | 0.69 | 0.86 | −0.15 | 0.11 | 0.74 | 0.86 | −0.24 | 0.36 | 0.55 | 0.79 |
| Fertilizer use | 0.04 | 0.07 | 0.80 | 1.04 | −0.05 | 0.10 | 0.76 | 0.95 | 0.38 | 5.56 | 0.07 | 1.47 |
| Jab planter | 0.83 | 0.76 | 0.38 | 0.44 | −1.05 | 1.21 | 0.27 | 0.35 | 1.20 | 1.21 | 0.27 | 3.32 |
| Knapsack sprayer | 1.59 | 3.69 | 0.06 | 4.90 | 0.67 | 0.58 | 0.45 | 1.96 | −0.32 | 0.10 | 0.75 | 0.73 |
| Animal-drawn planter | 0.57 | 0.58 | 0.45 | 0.56 | −1.46 | 2.57 | 0.11 | 0.23 | −1.11 | 1.71 | 0.19 | 0.33 |
| Animal-drawn sprayer | 0.30 | 0.00 | 0.98 | 0.49 | 3.64 | 3.58 | 0.06 | 3.18 | −1.56 | 0.00 | 1.00 | 0.00 |
| TLU | −0.03 | 0.32 | 0.57 | 0.98 | −0.09 | 2.68 | 0.10 | 0.92 | −0.03 | 1.20 | 0.27 | 1.03 |
| Grazing lands | −0.83 | 0.94 | 0.33 | 0.44 | 0.82 | 4.47 | 0.03 * | 0.06 | −2.82 | 4.47 | 0.08 | 0.06 |
| Training on CA | 1.63 | 4.24 | 0.04 * | 5.11 | 1.40 | 2.92 | 0.09 | 4.04 | 0.34 | 0.17 | 0.68 | 0.71 |
| Constant | −8.14 | 3.33 | 0.07 | 0.00 | −0.95 | 0.04 | 0.84 | 0.39 | 4.75 | 0.85 | 0.36 | 115.82 |
| Number of observations | 135 | 135 | 135 | |||||||||
| Chi-squared | 65.06 | 39.59 | 47.17 | |||||||||
| p value | 0.000 *** | 0.012 * | 0.001 *** | |||||||||
| % Correctly classified | 78.50 | 83.00 | 88.90 | |||||||||
β is the model intercept coefficient; Wald is the Wald statistics, Exp (β) is odds ratio; * and *** Significance at 0.05 and 0.001 probability level; TLU is tropical livestock unit ha–1.
Table 4.
Frequencies of the practise of CA components by the sampled Eastern Cape smallholder farmers.
Table 4.
Frequencies of the practise of CA components by the sampled Eastern Cape smallholder farmers.
| Variable | % Frequency (n = 135) |
|---|---|
| No-till | 34.81 |
| No-till + crop rotation | 10.37 |
| No-till + residue retention | 18.52 |
| No-till + crop rotation + residue retention | 3.70 |
Table 5.
Frequencies of common agronomic practices by the sampled smallholder farmers of the Eastern Cape Province.
Table 5.
Frequencies of common agronomic practices by the sampled smallholder farmers of the Eastern Cape Province.
| Variable | % Frequency (n = 135) |
|---|---|
| Seeding method | |
| Jab planter | 5.90 |
| Tractor-drawn planter | 20.70 |
| Animal-drawn planter | 24.40 |
| Hoes | 48.90 |
| Irrigation | |
| Yes | 20.70 |
| No | 79.30 |
| Weed control method | |
| Mechanical only | 54.10 |
| Herbicides only | 31.90 |
| Both | 14.10 |
| Insect pest and disease control method | |
| Cultural only | 4.50 |
| Chemical only | 49.60 |
| None | 45.90 |
| Fertilizers used | |
| Animal manure only | 9.00 |
| Inorganic fertilizers only | 43.00 |
| Compost only | 7.40 |
| Both animal manure and inorganic fertilizers | 23.70 |
| Both inorganic fertilizers and compost | 11.90 |
| Both animal manure and compost | 3.70 |
| None | 0.70 |
Table 6.
Frequencies of sampled smallholder farmers’ access to and ownership of CA implements in the Eastern Cape Province.
Table 6.
Frequencies of sampled smallholder farmers’ access to and ownership of CA implements in the Eastern Cape Province.
| Variable | % Frequency (n = 135) |
|---|---|
| Equipment used last season (%) | |
| Jab planter | 5.90 |
| Knapsack sprayer | 47.43 |
| Animal-drawn planter | 31.83 |
| Animal-drawn sprayer | 1.14 |
| Equipment owned by the farmers (%) | |
| Jab planter | 2.24 |
| Knapsack sprayer | 23.67 |
| Animal-drawn planter | 14.81 |
| Animal-drawn sprayer | 0.75 |
Table 7.
Motivating factors for practise of conservation agriculture given by the sampled CA smallholder farmers of the Eastern Cape Province.
Table 7.
Motivating factors for practise of conservation agriculture given by the sampled CA smallholder farmers of the Eastern Cape Province.
| Reason | % CA (lima lula) Farmers (n = 48) |
|---|---|
| Less expensive | 65 |
| Increased crop yields | 31 |
| Free inputs | 30 |
| Reduced machinery wear | 8 |
| Improved soil fertility | 25 |
| Labour saving | 15 |
| Soil moisture maintenance | 10 |
| Reduced soil erosion | 9 |
| Reduced weed infestation | 3 |
Values add up to more than 100% due to multiple responses.
Table 8.
Constraints to practise of CA by the sampled smallholder farmers of the Eastern Cape Province.
Table 8.
Constraints to practise of CA by the sampled smallholder farmers of the Eastern Cape Province.
| Reason | % Non-CA Farmers (n = 87) |
|---|---|
| Was not included in the input programme | 33 |
| Herbicides expensive | 30 |
| Lack of equipment | 21 |
| Labour intensive | 16 |
| High weed pressure | 15 |
| Poor crop yields | 12 |
| Lack of knowledge | 10 |
Values add up to more than 100% due to multiple responses.
Table 9.
A comparison of selected soil quality indicators between CA and conventional tillage (CT) fields on smallholder farms in the Eastern Cape Province (n = 35).
Table 9.
A comparison of selected soil quality indicators between CA and conventional tillage (CT) fields on smallholder farms in the Eastern Cape Province (n = 35).
| Variable | CA (lima lula) | CT | t-Test and Significance | ||
|---|---|---|---|---|---|
| 0–5 cm depth | Mean | S.D | Mean | S.D | |
| SOC % | 2.52 | 0.80 | 2.24 | 0.90 | 1.37 ns |
| POM (g kg−1) | 7.50 | 2.91 | 6.68 | 3.30 | 1.11 ns |
| Total N % | 0.38 | 0.11 | 0.34 | 0.07 | 1.34 ns |
| mg fluorescein kg−1 h−1 | 47.29 | 21.74 | 42.41 | 23.90 | 0.89 ns |
| Olsen P (mg kg−1) | 1.43 | 2.01 | 1.69 | 1.38 | 0.63 ns |
| K (mg kg−1) | 22.91 | 15.82 | 25.53 | 8.98 | 0.85 ns |
| Ca (mg kg−1) | 31.55 | 26.86 | 30.47 | 15.19 | 0.21 ns |
| Na (mg kg−1) | 5.23 | 4.52 | 5.33 | 4.51 | 0.09 ns |
| Mg (mg kg−1) | 4.32 | 3.81 | 5.04 | 3.62 | 0.82 ns |
| 5–10 cm depth | |||||
| SOC % | 2.16 | 0.76 | 1.94 | 0.84 | 1.11 ns |
| POM (g kg−1) | 6.64 | 3.20 | 6.78 | 2.71 | 1.20 ns |
| Total N % | 0.36 | 0.13 | 0.33 | 0.08 | 0.95 ns |
| mg fluorescein kg−1 h−1 | 52.10 | 28.43 | 44.62 | 17.25 | 0.47 ns |
| Olsen P (mg kg−1) | 1.68 | 1.81 | 1.47 | 1.82 | 1.33 ns |
| K (mg kg−1) | 21.69 | 9.75 | 21.71 | 8.37 | −0.01 ns |
| Ca (mg kg−1) | 25.85 | 19.51 | 26.62 | 12.46 | 0.07 ns |
| Na (mg kg−1) | 5.01 | 4.64 | 4.86 | 4.69 | 0.14 ns |
| Mg (mg kg−1) | 4.27 | 3.75 | 3.28 | 3.13 | 1.20 ns |
| 10–20 cm depth | |||||
| SOC % | 2.11 | 0.83 | 1.94 | 0.77 | 0.86 ns |
| POM (g kg−1) | 4.46 | 2.45 | 4.77 | 2.35 | 1.21 ns |
| Total N % | 0.31 | 0.11 | 0.31 | 0.10 | −0.12 ns |
| mg fluorescein kg−1 h−1 | 42.13 | 15.85 | 38.36 | 15.26 | 1.01 ns |
| Olsen P (mg kg−1) | 1.28 | 1.79 | 1.49 | 3.51 | −0.32 ns |
| K (mg kg−1) | 21.66 | 11.48 | 24.28 | 21.41 | −0.64 ns |
| Ca (mg kg−1) | 20.73 | 16.57 | 24.09 | 12.59 | −0.94 ns |
| Na (mg kg−1) | 5.15 | 4.77 | 5.18 | 4.76 | −0.03 ns |
| Mg (mg kg−1) | 3.97 | 3.65 | 2.91 | 3.16 | 1.29 ns |
SOC is soil organic carbon; POM is particulate organic matter; ns means not significant (p > 0.05). S.D means standard deviation.
© 2017 by the authors. Licensee MDPI, Basel, Switzerland. This article is an open access article distributed under the terms and conditions of the Creative Commons Attribution (CC BY) license (http://creativecommons.org/licenses/by/4.0/).
Share and Cite
MDPI and ACS Style
Muzangwa, L.; Mnkeni, P.N.S.; Chiduza, C. Assessment of Conservation Agriculture Practices by Smallholder Farmers in the Eastern Cape Province of South Africa. Agronomy 2017, 7, 46. https://doi.org/10.3390/agronomy7030046
AMA Style
Muzangwa L, Mnkeni PNS, Chiduza C. Assessment of Conservation Agriculture Practices by Smallholder Farmers in the Eastern Cape Province of South Africa. Agronomy. 2017; 7(3):46. https://doi.org/10.3390/agronomy7030046
Chicago/Turabian StyleMuzangwa, Lindah, Pearson Nyari Stephano Mnkeni, and Cornelius Chiduza. 2017. "Assessment of Conservation Agriculture Practices by Smallholder Farmers in the Eastern Cape Province of South Africa" Agronomy 7, no. 3: 46. https://doi.org/10.3390/agronomy7030046
Note that from the first issue of 2016, this journal uses article numbers instead of page numbers. See further details here.